the Creative Commons Attribution 4.0 License.
the Creative Commons Attribution 4.0 License.
 | 02 Nov 2021
Aerosol responses to precipitation along North American air trajectories arriving at Bermuda
Hossein Dadashazar
Majid Alipanah
Miguel Ricardo A. Hilario
Ewan Crosbie
Simon Kirschler
Hongyu Liu
Richard H. Moore
Andrew J. Peters
Amy Jo Scarino
Michael Shook
K. Lee Thornhill
Christiane Voigt
Hailong Wang
Edward Winstead
Luke Ziemba
Armin Sorooshian
North American pollution outflow is ubiquitous over the western North Atlantic Ocean, especially in winter, making this location a suitable natural laboratory for investigating the impact of precipitation on aerosol particles along air mass trajectories. We take advantage of observational data collected at Bermuda to seasonally assess the sensitivity of aerosol mass concentrations and volume size distributions to accumulated precipitation along trajectories (APT). The mass concentration of particulate matter with aerodynamic diameter less than 2.5 µm normalized by the enhancement of carbon monoxide above background (PMCO) at Bermuda was used to estimate the degree of aerosol loss during transport to Bermuda. Results for December–February (DJF) show that most trajectories come from North America and have the highest APTs, resulting in a significant reduction (by 53 %) in PMCO under high-APT conditions (> 13.5 mm) relative to low-APT conditions (< 0.9 mm). Moreover, PMCO was most sensitive to increases in APT up to 5 mm (−0.044 µg m−3 ppbv−1 mm−1) and less sensitive to increases in APT over 5 mm. While anthropogenic PM2.5 constituents (e.g., black carbon, sulfate, organic carbon) decrease with high APT, sea salt, in contrast, was comparable between high- and low-APT conditions owing to enhanced local wind and sea salt emissions in high-APT conditions. The greater sensitivity of the fine-mode volume concentrations (versus coarse mode) to wet scavenging is evident from AErosol RObotic NETwork (AERONET) volume size distribution data. A combination of GEOS-Chem model simulations of the 210Pb submicron aerosol tracer and its gaseous precursor 222Rn reveals that (i) surface aerosol particles at Bermuda are most impacted by wet scavenging in winter and spring (due to large-scale precipitation) with a maximum in March, whereas convective scavenging plays a substantial role in summer; and (ii) North American 222Rn tracer emissions contribute most to surface 210Pb concentrations at Bermuda in winter (∼ 75 %–80 %), indicating that air masses arriving at Bermuda experience large-scale precipitation scavenging while traveling from North America. A case study flight from the ACTIVATE field campaign on 22 February 2020 reveals a significant reduction in aerosol number and volume concentrations during air mass transport off the US East Coast associated with increased cloud fraction and precipitation. These results highlight the sensitivity of remote marine boundary layer aerosol characteristics to precipitation along trajectories, especially when the air mass source is continental outflow from polluted regions like the US East Coast.
- Article
(8586 KB) - Full-text XML
-
Supplement
(1524 KB) - BibTeX
- EndNote


Aerosol properties are difficult to characterize in remote marine regions owing to the scarcity of monitoring stations compared to over land. Island observatories are critical resources to investigate long-range transport of aerosol particles and their associated properties (e.g., Silva et al., 2020). The western North Atlantic Ocean (WNAO) includes the island of Bermuda, which has a rich history of monitoring data for both surface and columnar aerosol characteristics, thus affording the opportunity to study how aerosol properties are impacted by different sources and processes along the transport of air masses to the site. Consequently, Bermuda has been the subject of decades of intense atmospheric science research (Sorooshian et al., 2020), as it is a receptor site for both North African dust (Chen and Duce, 1983) and anthropogenic outflow from both North America (Arimoto et al., 1992; Galloway et al., 1989; Moody et al., 2014; Corral et al., 2021) and Europe (Anderson et al., 1996; Cutter, 1993). North American outflow reaching Bermuda has been linked to appreciable levels of anthropogenic species (e.g., sulfate, lead, elemental carbon, ozone) (Wolff et al., 1986), more acidic rainfall compared to other air mass sources (Jickells et al., 1982), and a significant reduction of sulfate levels in both aerosol and wet deposition samples in response to reduced SO2 emissions in recent decades (Keene et al., 2014).
There have been extensive studies reporting on some aspect of air mass history, normally by calculating air parcel trajectories using transport and dispersion models, prior to arrival at Bermuda (Sorooshian et al., 2020, and references therein), including predominant circulation patterns impacting Bermuda at different times of the year (e.g., Miller and Harris, 1985; Veron et al., 1992). What remains uncertain is how precipitation along those trajectories impacts surface aerosol characteristics at Bermuda. Wet scavenging rates are very difficult to constrain over open-ocean areas such as the WNAO (Kadko and Prospero, 2011) not only because of the complexity of physical mechanisms in play but also scarce necessary field measurements. Overall, more work is warranted to better constrain wet scavenging of aerosol particles along trajectories as such studies are sparse not only for the WNAO but also for other regions (Tunved et al., 2013; Hilario et al., 2021). Arimoto et al. (1999) used aerosol radionuclide data in relation to airflow pattern information to conclude that pollutant transport to Bermuda is common from the northwest and that precipitation scavenging can be influential; their analysis of rain effects on nuclide activities were based on rain data collected at Bermuda without knowledge of precipitation transport history prior to arrival. While many studies have investigated how composition at Bermuda varies based on air mass trajectories (Miller and Harris, 1985; Cutter, 1993; Huang et al., 1996), the subject of how precipitation along those trajectories impacts the resultant aerosol at Bermuda has not been adequately addressed but is motivated by past works (Moody and Galloway, 1988; Todd et al., 2003).
In their recent aerosol climatology study for Bermuda, Aldhaif et al. (2021) found the peculiar result that fine particulate pollution in the winter months (December–February) was reduced even though there was an enhanced number density of air mass back trajectories traced back to North America. They hypothesized that enhanced seasonal cloud fractions and precipitation in winter (Painemal et al., 2021) contribute to the removal of aerosol particles during transport via wet scavenging, which we aim to study more deeply here using a variety of datasets. Results of this study have broad relevance to all remote marine regions impacted by transported continental pollution, in addition to advancing knowledge of how precipitation can impact surface aerosol characteristics.
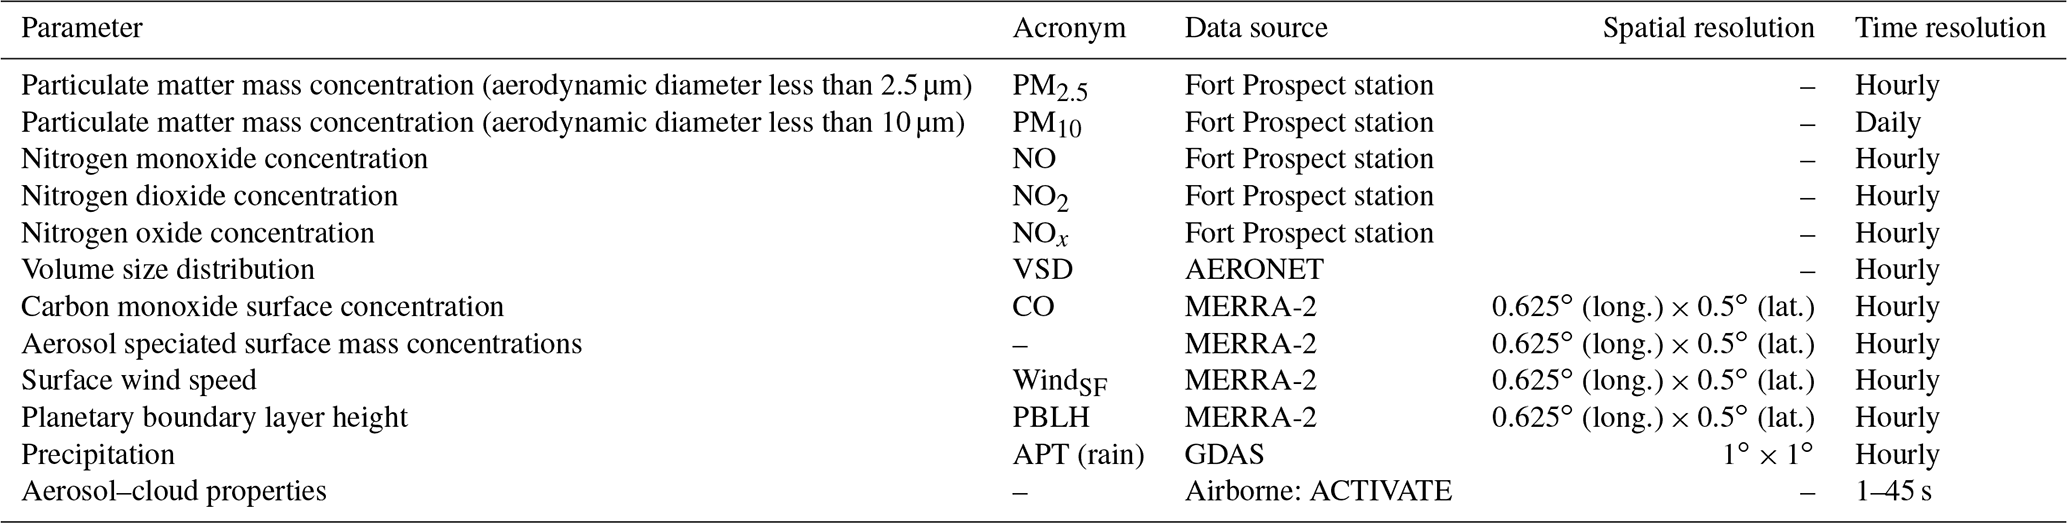
Datasets used in this work are summarized in Table 1 and briefly described below.
Table 1Summary of datasets used in this work. Data are between 1 January 2015 and 31 December 2019, with the exception of ACTIVATE aircraft data based on a single flight day on 22 February 2020. Section 2 provides more details about the datasets used in this study, including specific instruments from the ACTIVATE airborne dataset.
2.1 Bermuda surface measurements
Aerosol and gas measurements were conducted at Fort Prospect in Bermuda (32.30∘ N, 64.77∘ W, 63 m a.s.l.). Hourly PM2.5 data were collected with a Thermo Scientific TEOM 1400a ambient particulate monitor with 8500C FDMS (Federal Equivalent Method EQPM-0609-181 for PM2.5). Concentrations were determined by employing conditioned filter sample collection and direct mass measurements using an inertial micro-balance (TEOM 1400a). Hourly precision was ±1.5 µg m−3. Hourly data were averaged over 6 h intervals to match the time frequency of the trajectory data discussed subsequently. The conversion of hourly data to 6 h data also helps to mask, to some extent, the unwanted effects of local sources and processes that occur on a small timescale.
PM10 concentrations were determined based on US Environmental Protection Agency (EPA) method IO-2 (EPA, 1999) using a Tisch model TE6070 hi-volume air sampler, equipped with 8′′ × 10′′ (20.3 cm × 25.4 cm) TissuQuartz 2500 QAT-UP quartz-fiber filters. The PM10 sampler was operated at a flow rate of 2.1 m3 min−1, yielding a total volume of 3000 m3 over a 24 h sampling period. The sampler flow rate was calibrated every 3 months. Sampling was synchronized with the 1-in-6 d national ambient air quality schedule used by the EPA. Prior to deployment, the filters were equilibrated for 24 h in an environmental control chamber maintaining constant conditions of relative humidity (35 ± 2 %) and temperature (21 ± 2 ∘C). The filters were then weighed with a precision of ±0.1 mg using a Mettler Toledo AB104 balance, which was modified for weighing unfolded 8′′ × 10′′ (20.3 cm × 25.4 cm) filters, and then transferred to clean resealable plastic bags for transportation to the field site. After sampling, the exposed filters were returned immediately to the laboratory where they were re-equilibrated in the environmental control chamber for 24 h before being reweighed to determine the particle loading from which particle concentrations were calculated. PM10 determinations have an accuracy of within ±2.5 %, which is equivalent to ±0.2 µg m−3 based on the average of PM2.5 between 2015 and 2019 (i.e., 6.7 µg m−3).
Various gases were monitored with hourly time resolution using a model T200U trace-level NONONOx analyzer (Teledyne API), which is a US EPA compliance analyzer relying on a proven chemiluminescence principle. The gas analyzer was routinely calibrated using NIST-certified calibrant NO2 in ultrahigh-purity nitrogen (Airgas, Inc., Radnor Township, PA, USA). Acceptable criteria applied for single-point quality control (QC) allow for ±15.1 % or < ±1.5 ppb difference, whichever is greater (40 CFR Part 58 App A Sect. 3.1.1). Similar to PM2.5, these hourly gas data were averaged to 6 h resolution.
There were a few periods when data were missing, with the longest one being between 11 January and 8 April 2016 for the gases and also between 16 October 2017 and 20 January 2018 for PM2.5. There was no major discontinuity in PM10 sampling. Table S1 in the Supplement reports the number of data points available for various seasons from the surface measurements at Fort Prospect in Bermuda.
Columnar aerosol data were obtained from a NASA AErosol RObotic NETwork (AERONET) (Holben et al., 1998) surface station at Tudor Hill (32.264∘ N, 64.879∘ W). Level 2 daily data have been quality-assured and cloud-screened based on the version 3 algorithm (Giles et al., 2019). We focus on the volume size distribution (VSD) product that has 22 logarithmically equidistant discrete radii ranging from 0.05 to 15 µm. A radius of 0.6 µm typically discriminates between fine and coarse modes when using AERONET data (Dubovik et al., 2002; Schuster et al., 2006).
Modern-Era Retrospective analysis for Research and Applications-Version 2 (MERRA-2) (Gelaro et al., 2017) products were used as a data source for speciated aerosol and gas parameters including surface mass concentration of sea salt (collection tavg1_2d_aer_Nx) and surface concentration of carbon monoxide (CO; collection tavg1_2d_chm_Nx). Surface wind speed and planetary boundary layer height (PBLH) (collection tavg1_2d_flx_Nx) data were also obtained from MERRA-2. Hourly and 3-hourly data were downloaded and averaged for a 0.5∘ latitude by 0.625∘ longitude grid (i.e., 32–32.5∘ N and 64.375–65∘ W) surrounding Bermuda and subsequently averaged over 6 h intervals to match the time frequency of trajectory analysis results. It should be noted that MERRA-2 data were temporally and spatially coincident with the ending point of trajectories over Bermuda. The Global Data Assimilation System (GDAS) 1∘ archive data were used for trajectory calculations explained in the subsequent section. Precipitation data were also obtained along the trajectories based on GDAS 1∘ data.
3.1 Air mass trajectory analysis
To track air mass pathways arriving at Bermuda (32.30∘ N, 64.77∘ W), we obtained 10 d (240 h) back trajectories from the Hybrid Single-Particle Lagrangian Integrated Trajectory model (HYSPLIT) (Stein et al., 2015; Rolph et al., 2017). We used an ending altitude of 100 m (a.g.l.) to be within the surface layer and close to the measurement site. As discussed later, sensitivity analysis with higher ending altitudes (500 m and 1 km; Figs. S1–S2 in the Supplement) reveals results similar to using 100 m. Four trajectories were initialized (i.e., 6 h interval) each day between 1 January 2015 at 00:00:00 UTC and 31 December 2019 at 18:00:00 UTC, resulting in a total of 7304 individual trajectories. Trajectories were calculated using the GDAS 1∘ archive data and with the “model vertical velocity” method, which means vertical motions were handled directly using meteorological data files. Moreover, accumulated precipitation along trajectories (APT) was calculated by integrating surface precipitation data from GDAS throughout the transport to the receptor site. As GDAS precipitation data correspond to the surface level, it should be noted that APT values presented in this study are associated with the potential maximum level of precipitation experienced by the air parcel through its transport journey. Results presented in Figs. 1–3 are based on 10 d back trajectories, whereas analyses presented in the remaining sections of the paper are based on 4 d (96 h) back trajectories.
Trajectory analyses contain errors that originate from factors including, but not limited to, the choice of input meteorological data, resolution of input data, and the vertical transport method used in trajectory calculations (Stohl et al., 1995; Cabello et al., 2008; Engström and Magnusson, 2009). Although the choice of meteorological data is the most important contributor to the uncertainties associated with trajectories calculations (Gebhart et al., 2005), no particular dataset has been found to be superior in terms of yielding the lowest error. While in this study we used GDAS data, which have been widely used as an input dataset for trajectory calculations even in regions with complicated topography (e.g., Tunved et al., 2013; Su et al., 2015), the aforementioned inherent errors should not be overlooked when interpreting the results presented in this work. Another factor that can contribute to the uncertainties for the results presented in this work is the use of GDAS as the source of precipitation data, as previous works (Sun et al., 2018; Nogueira, 2020) have demonstrated that there is some level of disagreement between precipitation datasets.
3.1.1 Concentration-weighted trajectory analysis and seasonal rain maps
Concentration-weighted trajectories (CWTs) were calculated based on the 10 d back trajectories from HYSPLIT in conjunction with Bermuda surface PM2.5 data described in Sect. 2.1. The CWT method has been implemented widely to identify long-range pollutant transport pathways impacting a receptor site (Hsu et al., 2003; Wang et al., 2009; Hilario et al., 2020). Seasonal maps of average precipitation experienced by trajectories were also estimated based on 10 d back trajectories from HYSPLIT. The aforementioned analyses were performed for 0.5∘ × 0.5∘ grids covering the area encompassed by 10–80∘ N and 5–170∘ W. A weight function (Wij in Eq. 1) following the method of Dimitriou et al. (2015) was applied in the CWT analysis and precipitation maps to increase statistical stability. In Eq. (1), navg is the average number of trajectory endpoints per individual grid cell over the study region excluding cells with zero trajectory points, and nij is the number of trajectory endpoints that lie in the grid cell (i,j).
10 d back trajectories were implemented for generating CWT and rain maps to illustrate potential distant sources impacting Bermuda. But for more quantitative analyses presented in the subsequent sections focused on transport most relevant to the WNAO region, 4 d back trajectories were used by simply truncating 10 d trajectories. The use of 4 d trajectories reduces the uncertainties associated with trajectory calculations in comparison to using 10 d trajectories and also enables us to focus on sources closer to the receptor site.
3.1.2 Trajectory clustering
Hierarchical agglomerative clustering was used to identify characteristic trajectories reaching Bermuda at 100 m (a.g.l.). Hierarchical clustering was based on the “complete linkage” method (Govender and Sivakumar, 2020). 4 d HYSPLIT back trajectories were used to perform clustering analysis. Distances between trajectories were calculated using the Haversine formula, which calculates the distance between two points on Earth assuming they are on a great circle (Sinnott, 1984). The distance between any two trajectories was calculated as the sum of distances between trajectory endpoints. Subsequently, clustering was conducted based on the symmetric distance matrix, which includes the distances between all pairs of trajectories. Clustering was performed for varying numbers of clusters ranging between 2 and 32. The L-method (Kassomenos et al., 2010) was implemented to identify the optimum number of clusters. In this method, root mean square deviation (RMSD) was calculated for each clustering run and then plotted versus the number of clusters to determine the optimum solution. RMSDs were estimated based on the distances between trajectories and associated mean cluster trajectories.
3.2 Airborne measurements
Airborne data from the Aerosol Cloud meteorology Interactions oVer the western ATlantic Experiment (ACTIVATE) are used from Research Flight 6 (RF6) on 22 February 2020. ACTIVATE involves two NASA Langley aircraft (HU-25 Falcon and UC-12 King Air) flying in coordination at different altitudes to simultaneously characterize the same vertical column with a focus on aerosol–cloud–meteorology interactions (Sorooshian et al., 2019). RF6 was a rare case of the HU-25 Falcon flying alone, but this aircraft conveniently included measurements relevant to this study. The ACTIVATE strategy involves the HU-25 Falcon flying in the boundary layer to characterize gas, aerosol, cloud, and meteorological parameters along the following level legs: min. alt. indicates the lowest altitude flown (∼ 150 m), BCB is below cloud base, ACB is above cloud base, BCT is below cloud top, and ACT is above cloud top.
Data from the following instruments were used: condensation particle counter (CPC; TSI model 3772) for number concentration of particles with diameter > 10 nm; scanning mobility particle sizer (SMPS; TSI model 3081) for aerosol size distribution data between 3.2 and 89.1 nm; laser aerosol spectrometer (LAS; TSI model 3340) for aerosol size distribution data between diameters of 0.09 and 5 µm; two-dimensional optical array imaging probe (2DS; SPEC Inc.) (Lawson et al., 2006) for rain water content (RWC) quantified by integrating raindrop size distributions between diameters of 39.9 and 1464.9 µm; and fast cloud droplet probe (FCDP; SPEC Inc.) (Knop et al., 2021) for cloud liquid water content (LWC) calculated by integrating drop size distributions between diameters of 3 and 50 µm. With the exception of SMPS data (45 s resolution), all airborne data were at 1 s resolution.
3.3 Radionuclide tracers in the GEOS-Chem model
Lead-210 (210Pb, half-life 22.3 years) is the decay daughter of radon-222 (222Rn, half-life 3.8 d) emitted mainly from land surfaces. After production, it indiscriminately attaches to ambient submicron particles, which move with the air until being scavenged by precipitation or deposited to the surface. Because of its relatively well-known source and wet deposition as its principal sink, 210Pb has long been used to test wet deposition processes in global models (e.g., Liu et al., 2001). It is also a useful tracer to describe continental air influence over oceans. In this study, we use 210Pb as simulated by the GEOS-Chem model to investigate the role of precipitation scavenging in affecting seasonal surface aerosol concentrations at Bermuda.
GEOS-Chem (http://www.geos-chem.org, last access: 27 October 2021) is a global 3-D chemical transport model driven by meteorological fields from the Goddard Earth Observing System (GEOS) of the NASA Global Modeling and Assimilation Office (Bey et al., 2001; Eastham et al., 2014). It has been widely used to study trace gases and aerosols in the atmosphere. Here we use the model version 11-01 (http://wiki.seas.harvard.edu/geos-chem/index.php/GEOS-Chem_v11-01, last access: 27 October 2021) driven by the MERRA-2 reanalysis (at 2.5∘ longitude by 2∘ latitude resolution) to simulate 222Rn and 210Pb. The model simulates the emission, transport (advection, convection, boundary layer mixing), deposition, and decay of the radionuclide tracers (Liu et al., 2001; Brattich et al., 2017; Yu et al., 2018; Zhang et al., 2021). As a function of latitude, longitude, and month, 222Rn emission uses a customized emission scenario that was built upon previous estimates and evaluated against global 222Rn surface observations and vertical profile measurements (Zhang et al., 2021). GEOS-Chem uses the TPCORE advection algorithm of Lin and Rood (1996), calculates convective transport using archived convective mass fluxes (Wu et al., 2007), and uses the nonlocal boundary layer mixing scheme implemented by Lin and McElroy (2010). The wet deposition scheme follows that of Liu et al. (2001) and includes rainout (in-cloud scavenging) due to large-scale (stratiform and anvil) precipitation, scavenging in convective updrafts, and washout (below-cloud scavenging) by precipitation (Wang et al., 2011). A modification to the large-scale precipitation scavenging scheme is included to use spatiotemporally varying cloud water contents from MERRA-2 instead of a fixed constant value in the original model (Luo et al., 2019). Dry deposition is based on the resistance-in-series scheme of Wesely (1989).
4.1 Seasonal profiles
4.1.1 Back trajectories
Our results in Fig. 1 show that the summer months (June–August, JJA) are distinct due to the Bermuda High, promoting easterly winds at latitudes south of Bermuda that turn north and become southwesterly (approximately parallel to the US East Coast) towards Bermuda. The Bermuda high-pressure system and its associated anticyclonic circulation in the boundary layer have been reported to be strongest in April–September (Merrill, 1994; Moody et al., 1995). This high-pressure system breaks down in other months in favor of strengthened extratropical subpolar low pressure, thus yielding more air influence from the northwest and west (Arimoto et al., 1995; Davis et al., 1997), which is clearly evident in the other three seasonal panels in Fig. 1 and most pronounced in the winter months (December–February, DJF). In their analysis of air mass history leading to rain events over Bermuda, Altieri et al. (2013) observed more influence from air originating over water in warmer months (April–September) and faster-moving air masses originating over the continental US, primarily in the colder months of October–March. Moody and Galloway (1988) also showed that cool months (October–March) were marked by more transport from the US East Coast. It can be deduced from Fig. 1 that based on the farther-reaching source areas of the back trajectories in colder months, especially DJF, air moves faster in the boreal winter. Finally, we note that Figs. S1–S2 show the same results as Fig. 1 but with ending altitudes of 500 m and 1 km over Bermuda; the sensitivity tests indicate the same general results, and thus we continue the discussion using results based on 100 m.
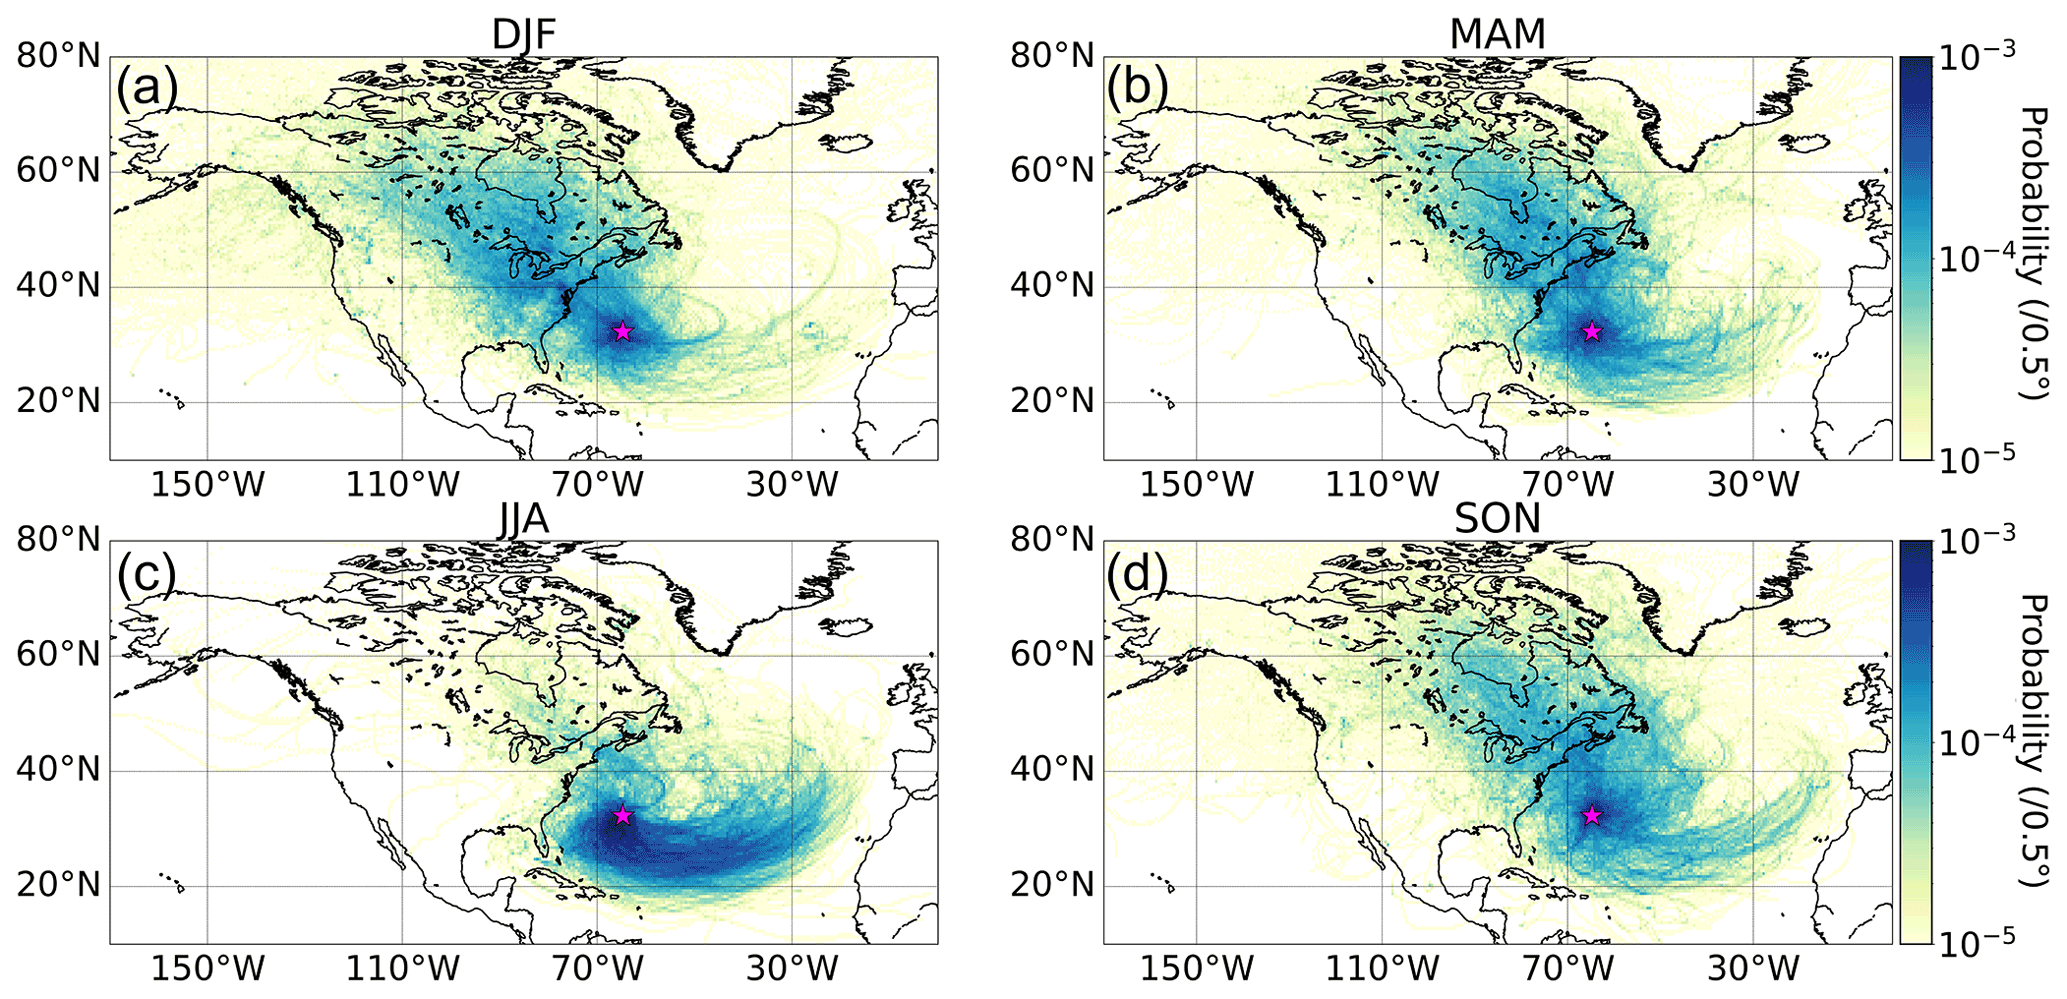
Figure 1Seasonal maps (a–d) showing the probability density of trajectories calculated based on 10 d HYSPLIT backward trajectories reaching Bermuda (32.30∘ N, 64.77∘ W), denoted by the pink star, at 100 m (a.g.l.). This analysis is based on trajectories between 1 January 2015 and 31 December 2019. Analogous results for ending altitudes of 500 m and 1 km are shown in Figs. S1 and S2, respectively.
4.1.2 Surface aerosol and NOx
Recent work has shown a seasonal cycle over Bermuda for column-integrated aerosol properties, with aerosol optical depth (AOD) being highest in March–May (MAM) and JJA and lowest in September–November (SON) and DJF (Aldhaif et al., 2021). It was further shown that sea salt contributed more to AOD in the colder months (SON, DJF), whereas sulfate, organic carbon, black carbon, and dust were more dominant in MAM and JJA. In their examination of aerosol type seasonality at Bermuda, Huang et al. (1999) observed that marine and crustal elements peaked in winter and summer, respectively, and that pollution-derived particles dominated in spring with a smaller peak in fall. We use data from Fort Prospect station to gain a revised perspective about seasonality and the weekly cycle of surface layer aerosol and additionally NOx (box notch plots in Fig. S3a–f).
Median seasonal concentrations of PM2.5 (µg m−3) were as follows at Bermuda, being largely consistent with the AOD seasonal cycle: DJF = 5.50, MAM = 6.36, JJA = 6.11, SON = 5.33 (Fig. S3). NOx exhibited a similar seasonal pattern (ppbv): DJF = 17.76, MAM = 21.62, JJA = 18.68, SON = 13.95 (Fig. S3). It is difficult to ascertain sources and impacts of precipitation on PM2.5 based on these values. As a next step we present the seasonal CWT maps showing the predominant pathways accounting for the majority of PM2.5 at Bermuda (Fig. 2). Expectedly, PM2.5 in JJA is largely accounted for by trajectories following the general anticyclonic circulation already shown in Fig. 1c associated with the Bermuda High. These air masses are enriched with African dust as has been documented in many past studies (e.g., Arimoto, 2001; Huang et al., 1999; Muhs et al., 2012). In contrast, the other seasons (especially DJF and MAM) showed greater relative influence from North American outflow versus other source regions.
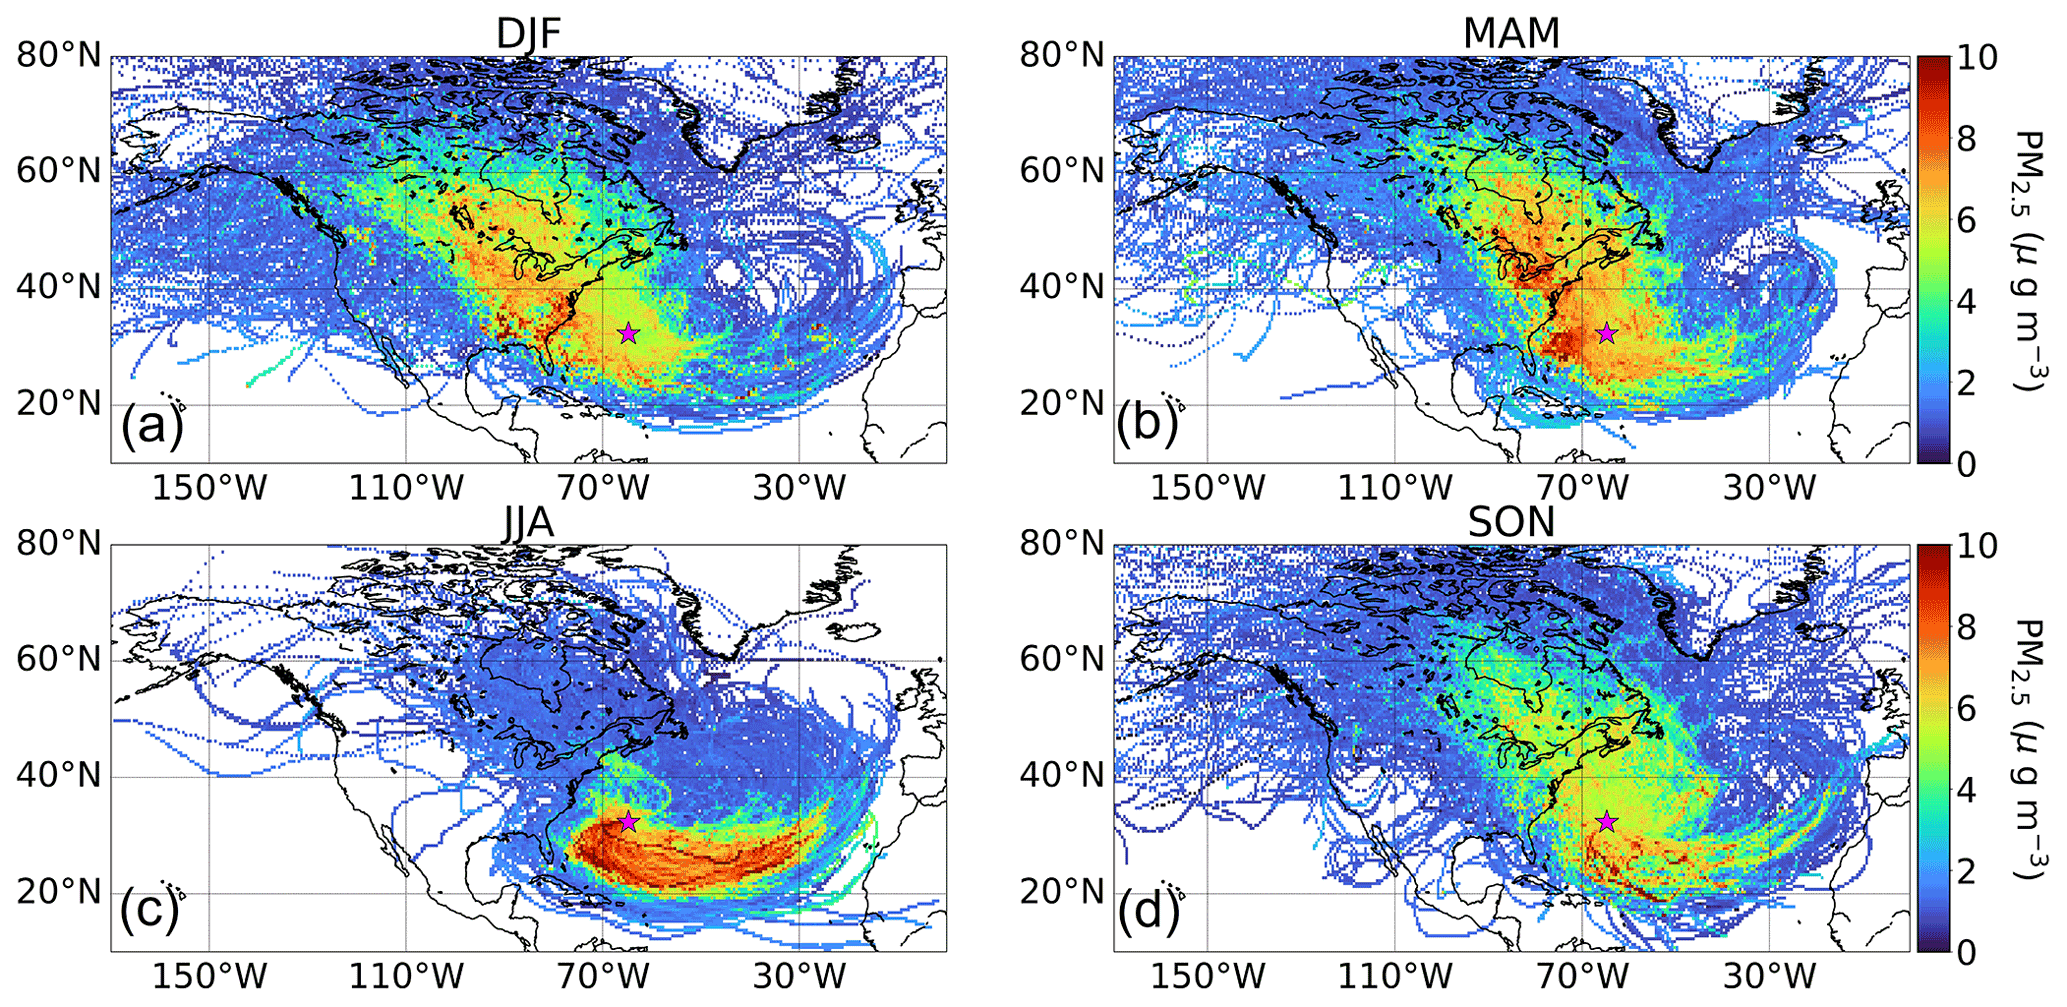
Figure 2Seasonal (a–d) concentration-weighted trajectory maps (CWTs) for PM2.5 measured at Fort Prospect in Bermuda, denoted by the pink star. This analysis is based on trajectories between 1 January 2015 and 31 December 2019.
While we focus on long-range transport of PM2.5 to Bermuda, local sources cannot be ignored, including both sea salt and non-sea-salt species (e.g., Galloway et al., 1988). The island had a population of approximately 64 000 as of 2016 (Government of Bermuda, 2019). Local influence from anthropogenic sources has been reported to be insignificant in contrast to transported pollution (Galloway et al., 1988; Keene et al., 2014). We assess how significant local anthropogenic sources are based on day-of-week aerosol concentrations and whether significantly higher levels exist on working days compared to weekend days as shown in other regions with strong anthropogenic influence (Hilario et al., 2020, and references therein). Our analysis found negligible difference between working days (Monday–Friday) and weekend days (Saturday–Sunday) for both PM2.5 and NOx when analysis was done based on annual (Fig. S3b, d) or seasonal data (Figs. S4–S5). Therefore, it is less likely that local anthropogenic emissions dominate the island's PM2.5 and NOx, providing support for transported sources being more influential; as will be shown, normalizing PM2.5 by CO helps control for local anthropogenic influence.
We also examined seasonal and day-of-week statistics for PM10 to assess the relative importance of coarse aerosol types including mainly sea salt and dust (Fig. S3e–f). Results reveal the highest median PM10 values (µg m−3) in DJF (19.24), followed by MAM (18.51), JJA (17.98), and SON (15.88). As will be shown later and already documented (Aldhaif et al., 2021), surface wind speeds around Bermuda are highest in DJF, contributing to higher sea salt emissions. Expectedly there was no observable PM10 weekly cycle as dust and sea salt are naturally emitted. Both PM2.5 and PM10 exhibited their highest seasonal standard deviations in JJA owing most likely to the episodic nature of some pollution events such as dust and biomass burning (e.g., Aldhaif et al., 2021).
4.1.3 Precipitation along trajectories
Figure 3 shows seasonal profiles of average precipitation rate obtained from GDAS (Table 1) in 0.5∘ × 0.5∘ grids based on 10 d back trajectories arriving at Bermuda (100 m a.g.l.). The spatiotemporal pattern of precipitation over the WNAO is of the most interest in terms of potential impacts on wet scavenging of aerosol during the transport of North American pollution to Bermuda. In that regard, DJF shows the most pronounced levels of precipitation to the north and northwest of Bermuda over the WNAO, coincident with strong and frequent convection linked to frontogenesis (Painemal et al., 2021). This is consistent with how Painemal et al. (2021) showed that precipitation exhibits maximum levels over the Gulf Stream path owing to relatively high sea surface temperature and strong surface turbulent fluxes.
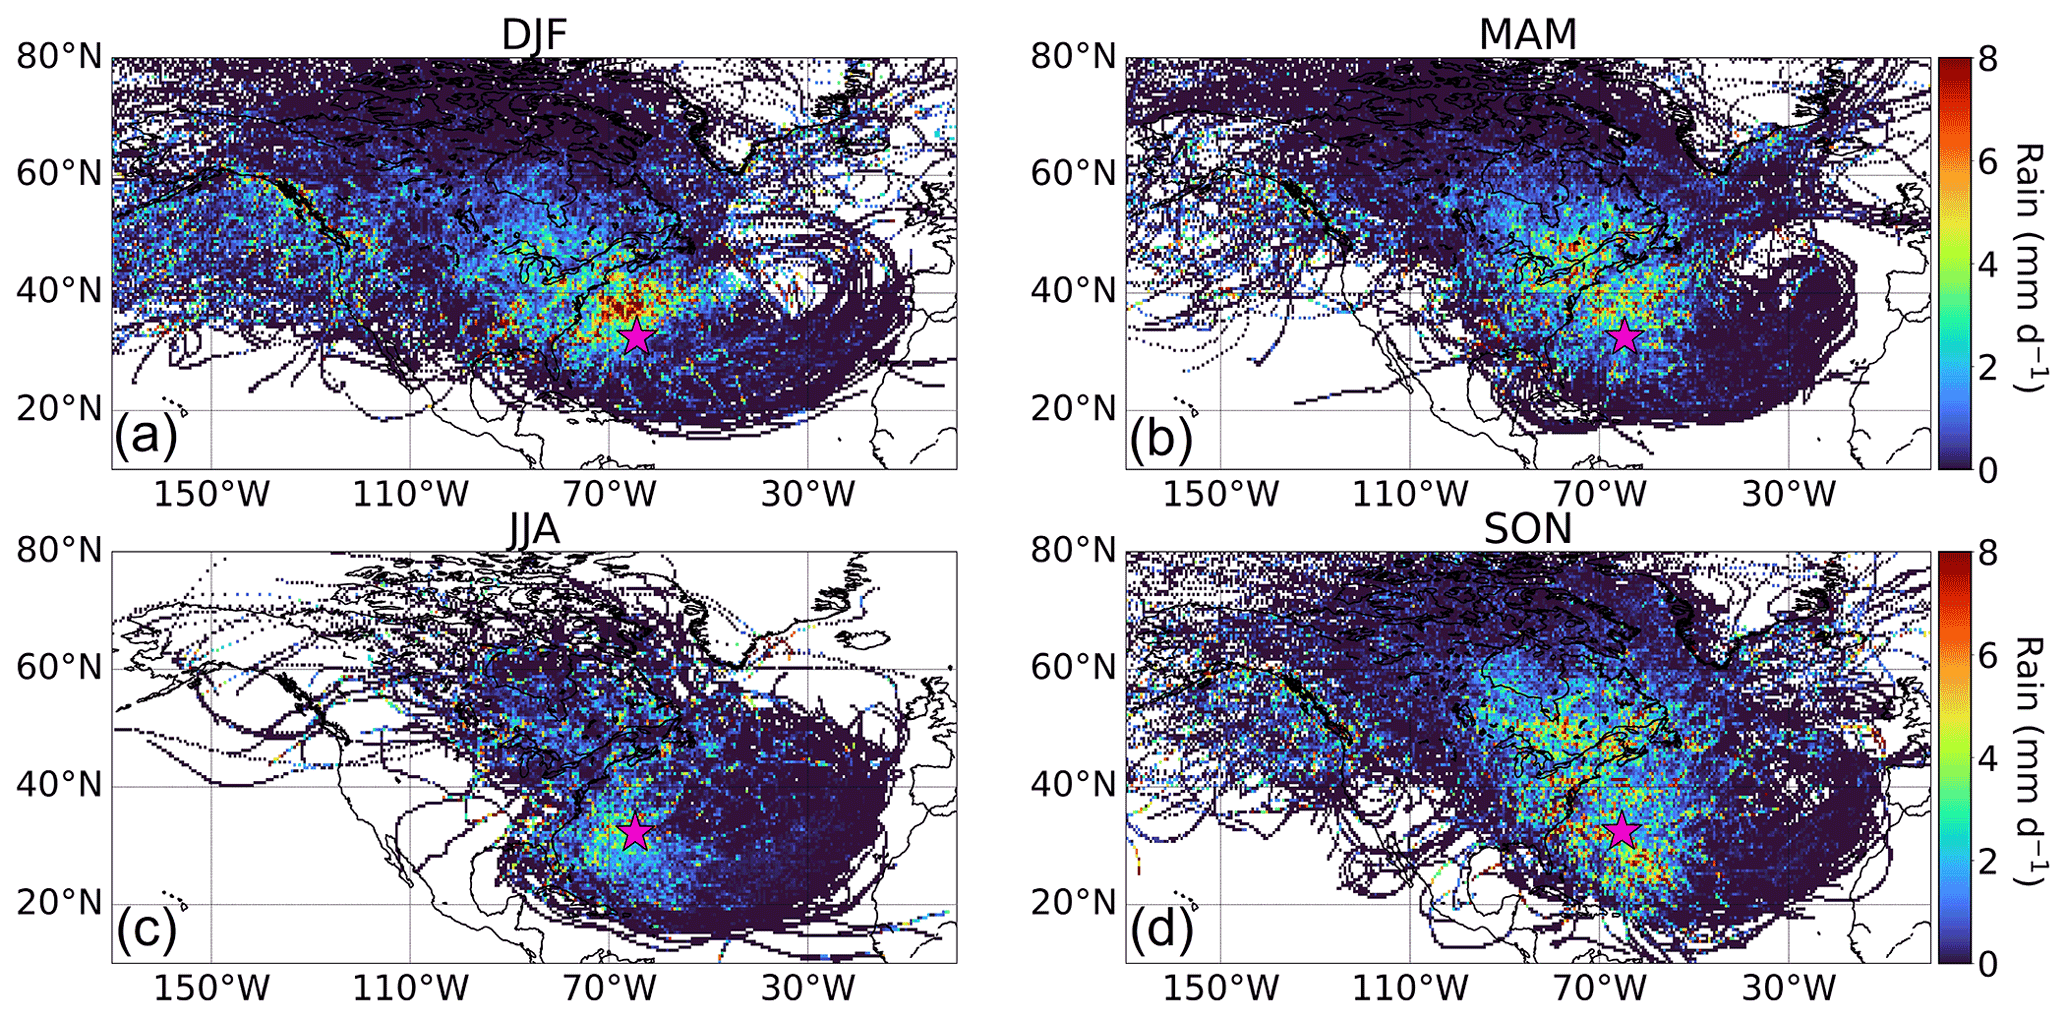
Figure 3Seasonal maps (a–d) of average precipitation occurring in 0.5∘ × 0.5∘ grids based on 10 d backward trajectories reaching Bermuda (32.30∘ N, 64.77∘ W; pink star) at 100 m (a.g.l.). This analysis is based on trajectories between 1 January 2015 and 31 December 2019.
4.2 Trajectory clustering
Prior to examining how precipitation directly impacts PM2.5 at Bermuda, we identify characteristic trajectory pathways using the hierarchical agglomerative clustering method described in Sect. 2.3.2. We reiterate that this analysis is based on 4 d of back trajectories, rather than 10 d from Figs. 1–3, to focus more on transport closer to Bermuda. The optimum solution based on the L-method (see Sect. 2.3.2) resulted in eight trajectory clusters (Fig. 4a), with five (numbered 1–5) coming from North America and the remaining three (numbered 6–8) more characteristic of the anticyclonic circulation already described for JJA. The five former clusters account for 49 % of the total trajectories, with the latter three responsible for the remaining 51 %. The majority of trajectories from North America come offshore north of North Carolina (i.e., coastal areas north of ∼ 35∘ N).
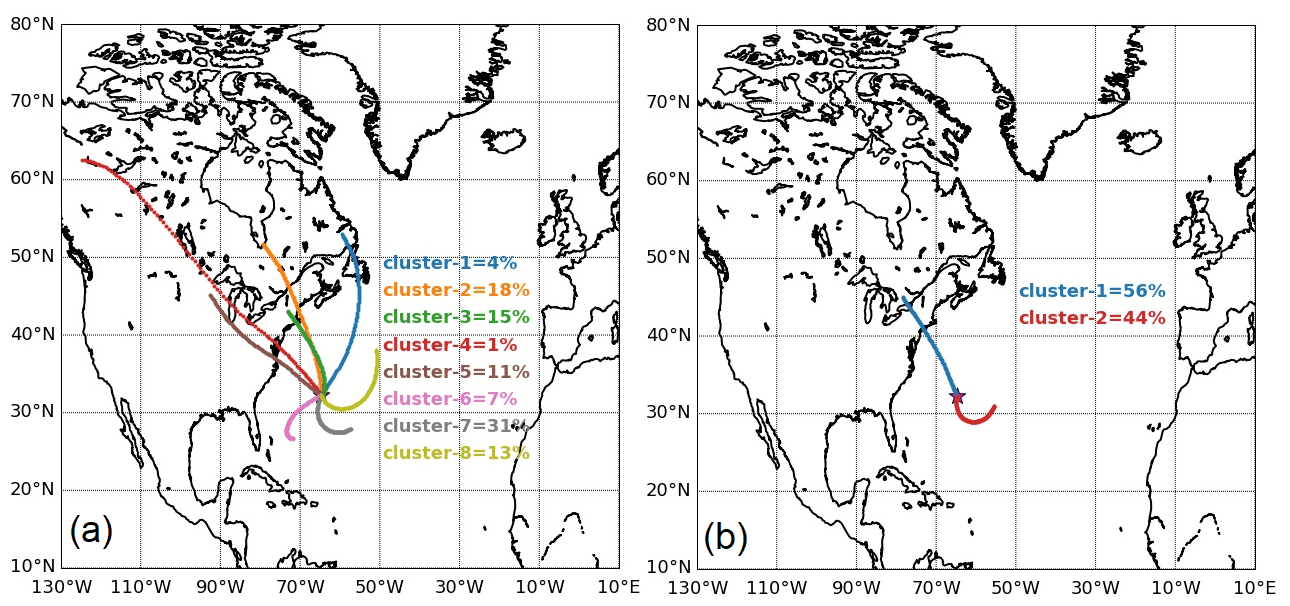
Figure 4Cluster mean trajectories based on the (a) optimum solution having eight clusters and (b) a simplified solution with two clusters to enhance statistics for North American trajectories. Clustering was performed on 4 d HYSPLIT backward trajectories between 1 January 2015 and 31 December 2019.
For the sake of simplicity of the remainder of the discussion, we reduced the number of characteristic trajectories to two (Fig. 4b) by conducting a new clustering analysis to have one from North America and the other from the southeast. Using only two clusters increases the number of data points in the North American cluster for more robust calculations of rain–aerosol relationships. Our choice to put together all North American air mass clusters in one group is aligned with a similar clustering choice by Chen and Duce (1983; see their Fig. 3) wherein trajectories were grouped together from Florida to the Canadian maritime provinces. Also, Mead et al. (2013) divided trajectory data ending at Bermuda into “Saharan” and “non-Saharan” seasons that generally coincide with our division of data into two clusters. Cluster 1 from North America accounts for 56 % of trajectories and Cluster 2 from the southeast is linked to 44 % of trajectories. It is clear from the two clusters that the North American air masses generally move faster as the characteristic 4 d back trajectories originate farther away from Bermuda than those of Cluster 2.
Regardless of season, Cluster 1 was associated with higher APT values, with the seasonal median values (millimeters) as follows (Cluster1Cluster 2): DJF = ; MAM = ; JJA = ; SON = . Figure 5 shows a box notch plot comparing APT between clusters for each season, demonstrating statistically significant differences in median values between clusters for a given season at 95 % confidence. Furthermore, Cluster 1 exhibited higher CO levels at Bermuda for each season, with median values (units of ppbv) as follows (Cluster 1Cluster 2): DJF = ; MAM = ; JJA = ; SON = . Therefore, the combination of pollution outflow from North America and higher APT values makes Cluster 1 more relevant in terms of identifying potential wet scavenging effects on transported aerosol over the WNAO. The remainder of the study thus focuses on Cluster 1.
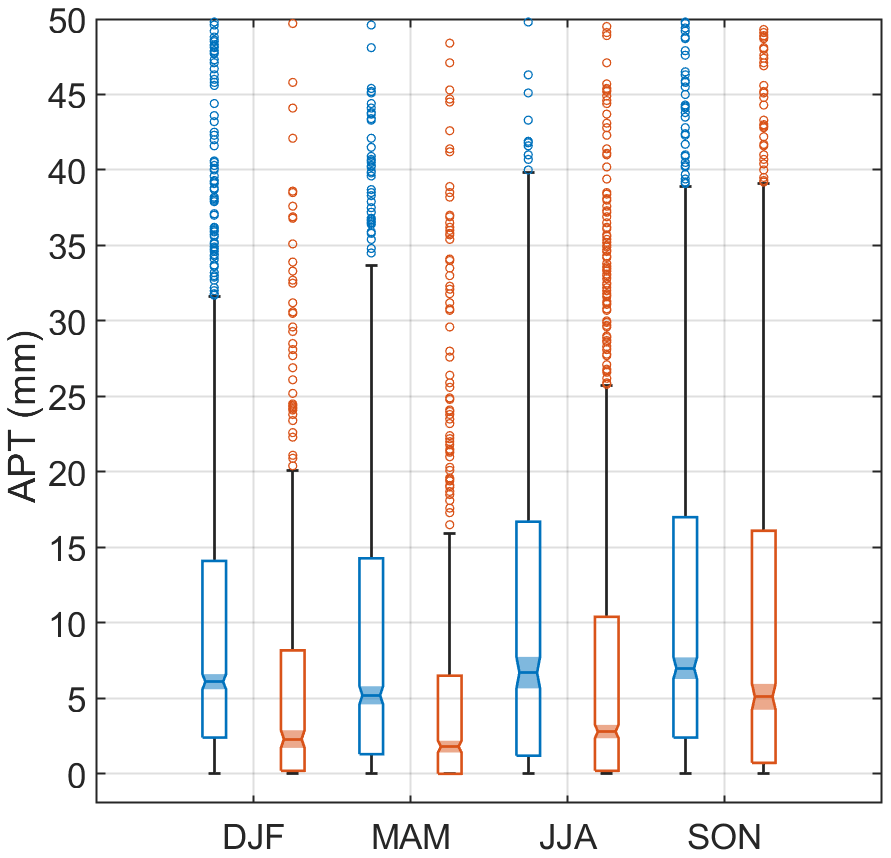
Figure 5Box notch plot for each season comparing accumulated precipitation along trajectories (APT) for Clusters 1 (blue) and 2 (orange) from Fig. 4b. APT values were estimated from 4 d HYSPLIT back trajectories reaching Bermuda (32.30∘ N, 64.77∘ W) at 100 m a.g.l. The middle, bottom, and top lines in each box represent the median, 25th percentile, and 75th percentile, respectively. Markers show extreme values identified based on 1.5× IQR (interquartile range) distance from the top of each box. Whiskers represent maximum and minimum values excluding extreme points. Boxes with notches and shaded regions that do not overlap have different medians at the 95 % confidence level.
4.3 North America trajectory results
We next examine the relationship between APT and aerosol transport to Bermuda based on Cluster 1 results (Table 2). We compare data for “low” and “high” APT values based on thresholds for the 25th percentile (< 0.9 mm) and 75th percentile (> 13.5 mm), respectively, based on cumulative data from all seasons and years. As wet scavenging is expected to reduce PM2.5 during its transport from North America to Bermuda, we anticipate lower PM2.5 values at high APT. However, the results indicate this is only the case for MAM and JJA, with similar median values in SON and a higher median value in DJF for high-APT conditions. Interestingly, NO, NO2, NOx, and CO were all significantly higher in DJF for high-APT conditions too. This raises the issue that absolute PM2.5 concentrations should be normalized to account for the differences in concentration that existed closer to North America prior to potential wet scavenging over the WNAO.
To study the effects of wet removal processes on aerosol particles during long-range transport to a receptor site, many studies have used aerosol concentrations normalized by the concentration of an inert gaseous species co-emitted with particles at distance sources. Such normalization is critical and superior to the use of only aerosol concentration as the latter can be influenced by local sources that can mask aerosol response to removal processes during long-range transport. CO exhibits three important traits qualifying it as a species to normalize PM2.5 by: (i) being a reliable marker of anthropogenic pollution stemming from North America (Corral et al., 2021), (ii) being relatively insensitive to wet scavenging processes, and (iii) having a long lifetime in the atmosphere (∼ 1 month; Weinstock, 1969) compared to aerosol particles. Consequently, we normalize PM2.5 by ΔCO to quantify transport efficiency and to reveal the potential effects of wet scavenging as has been done in past studies for other regions (Park et al., 2005; Garrett et al., 2010; Hilario et al., 2021; Matsui et al., 2011; Moteki et al., 2012; Oshima et al., 2012). We first determine the 5th percentile value of surface CO at Bermuda for each season for Cluster 1 trajectories and assume those are the seasonal background values as also done by Matsui et al. (2011). We then calculate ΔCO as the difference between each 6-hourly CO data point at Bermuda and the background value for a given season. We only use data when ΔCO > 3.2 ppbv to ensure a sufficiently high signal-to-noise ratio (Garrett et al., 2010).
Table 2Seasonal medians of aerosol, gas, and meteorological variables for Cluster 1 divided into high- and low-APT categories. Differences in median values that are statistically significant (p value < 0.05) based on a Wilcoxon rank-sum test are highlighted with italic font. Percentage differences∗ between high- and low-APT median values are provided in parentheses. NO, NO2, NOx, and PM2.5 are based on Fort Prospect measurements, whereas all other parameters are from MERRA-2 with the exception of the two APT rows (derived from HYSPLIT and GDAS) and the last eight rows corresponding to AERONET volume size distribution data. We combined all seasons for AERONET data to have sufficient statistics for comparisons (high APT 16 points, low APT 19 points). AERONET parameters include volume concentration (V), effective radii (Reff), volume median radii (R), and geometric standard deviation (σ) with subscripts f and c for fine and coarse modes, respectively. The number of data points for each table entry is summarized in Table S2.
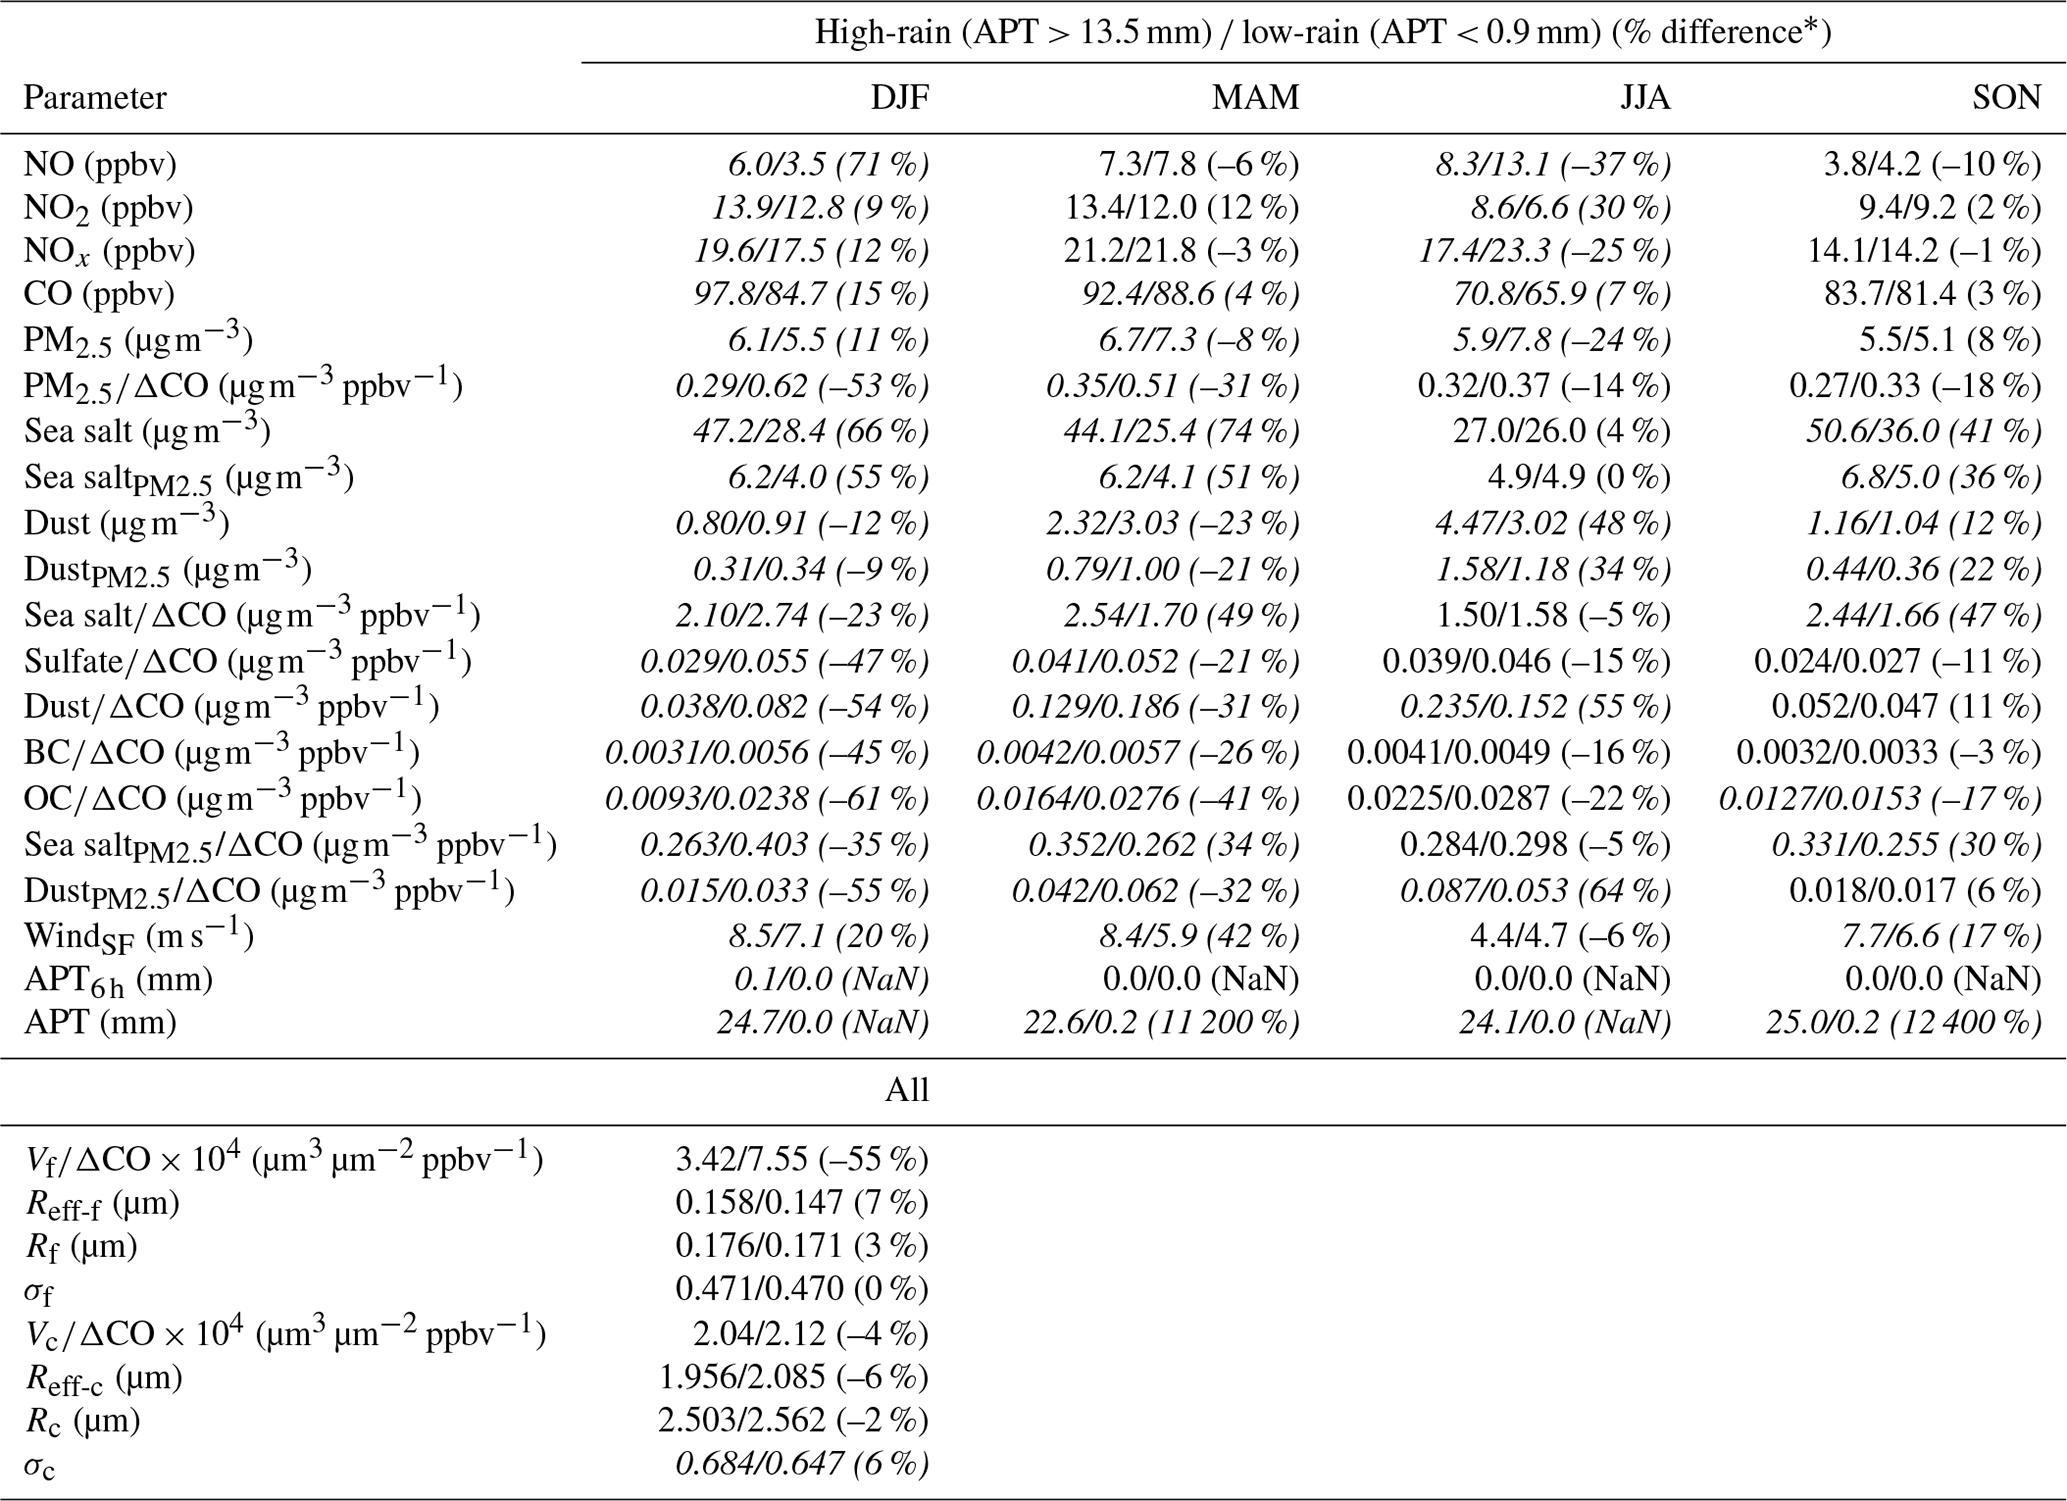
∗ % difference
With the normalization technique, PMCO exhibits lower values in the high-APT category for each season compared to low-APT conditions (Fig. 6), with differences between medians being statistically significant in DJF and MAM based on p value < 0.05 with a Wilcoxon rank-sum test (Table 2). The DJF season exhibits the greatest reduction of this ratio (by 53 %) in high-APT conditions (0.29 µg m−3 ppbv−1 versus 0.62 µg m−3 ppbv−1 based on median values; Table 2). Therefore, these results suggest that it is plausible that wet scavenging has a marked impact on surface PM2.5 at a remote ocean site in the WNAO. This also helps support the speculation proposed by Aldhaif et al. (2021) that wet scavenging can reconcile why, in particular for DJF, the high density of trajectories coming from North America correlates with a reduction in fine particulate pollution arriving at Bermuda compared to other seasons. It is noteworthy that the highest median value of PMCO was for the low-APT category of DJF, providing support for how that season has both a greater influence of aerosol transport from North America (when the precipitation scavenging potential is reduced during low-APT periods) and the greatest sensitivity to the effects of precipitation over the WNAO owing to the widest range in this ratio's value between high- and low-APT categories.
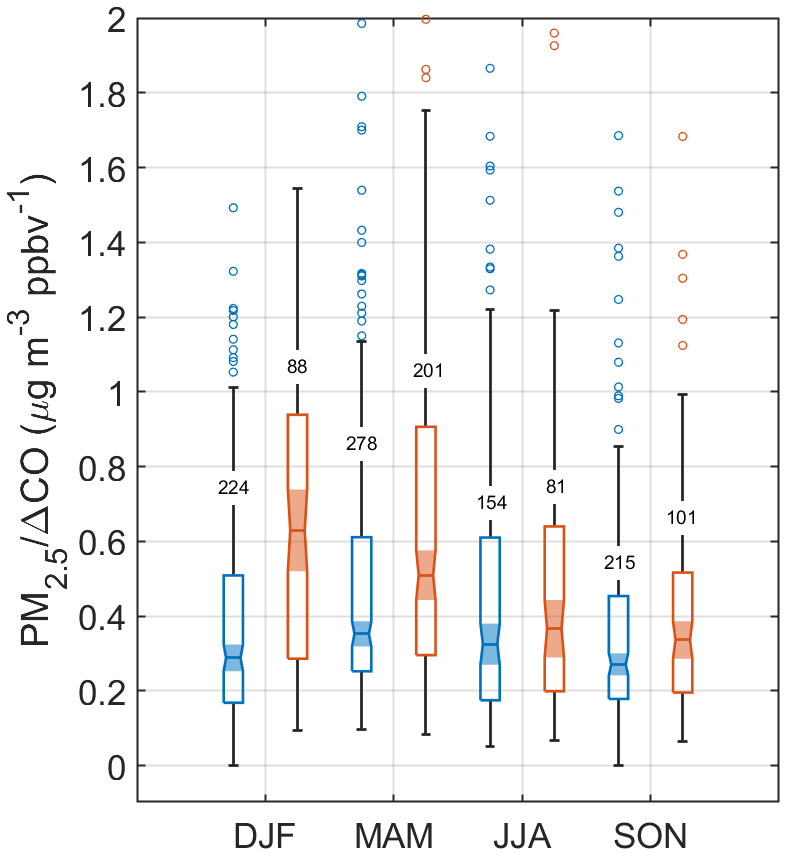
Figure 6Box notch plot for each season comparing the PMCO ratio for Cluster 1 trajectories for high-APT (blue) and low-APT (orange) conditions. APT thresholds are based on 25th (< 0.9 mm) and 75th (> 13.5 mm) percentiles of APT for all trajectories reaching Bermuda between 1 January 2015 and 31 December 2019. The number of samples in each group is placed on whiskers.
Figure 7 additionally shows the seasonal sensitivity of PMCO to APT based on four bins of APT (bin ranges shown in Table S3) chosen in such a way to provide similar numbers of data points per bin for each particular season. We note that the general trends are preserved using similar bin ranges in each of the seasons. DJF and MAM show the greatest reductions from the first to last bin as expected based on Table 2, but these were also the only two seasons showing reductions between each successive bin. In contrast, SON and JJA exhibited more variable behavior, with PMCO actually increasing between a pair of bins in each season. A number of reasons can potentially explain the less pronounced reduction in PMCO for SON and JJA: (i) lower values to begin with in the lowest APT bins (and thus lower potential for scavenging to occur), (ii) potential humidity effects associated with air masses at higher APT values promoting secondary aerosol formation (Huang et al., 2014; Quan et al., 2015; Ding et al., 2021), and (iii) more influence from natural emissions in the form of dust (especially JJA) and sea salt (especially SON) (Aldhaif et al., 2021). Another noteworthy result is that the season with the clearest scavenging signature (DJF) shows the most sensitivity (i.e., steepest downward slope) between the first two APT bins (0.9 mm versus 4.3 mm) as there was a 26 % reduction in PMCO (0.584 to 0.435 µg m−3 ppbv−1), resulting in a slope (units of µg m−3 ppbv−1 mm−1) of −0.044 in contrast to slopes of −0.007 and −0.006 for the two subsequent pairs of bins in DJF. Tunved et al. (2013) also reported a similar exponential trend between particle mass and accumulated precipitation, with an initial rapid decrease in particle mass followed by a decreased removal rate of aerosol due to precipitation.
We next address some additional details motivated by values shown in Table 2. We examine three aerosol constituents linked to anthropogenic outflow from North America, including sulfate, black carbon (BC), and organic carbon (OC), from MERRA-2 reanalysis. We recognize that sulfate and OC have non-anthropogenic precursor vapors such as ocean-emitted dimethyl sulfide and biogenic volatile organic compounds, respectively. Being the most abundant of the three, sulfate exhibits the same characteristics as PM2.5 when normalized by ΔCO, with the sharpest reduction at high-APT conditions in DJF, followed by MAM, and then finally by JJA and SON albeit with p values > 0.05 for the latter two seasons compared to low-APT conditions. BC ΔCO ratios show the same relative characteristics between APT categories as sulfate ΔCO for each season and mostly the same for OC ΔCO except that the reduction in the median value in high-APT conditions for SON was significant (p value < 0.05). Regardless of season, but most pronounced in DJF, was the consistent result that OC/ΔCO exhibited the highest relative reduction at high-APT conditions (versus low-APT conditions) compared to BC and sulfate. Further work with more expansive observational data is needed to better understand how different species respond to wet scavenging.
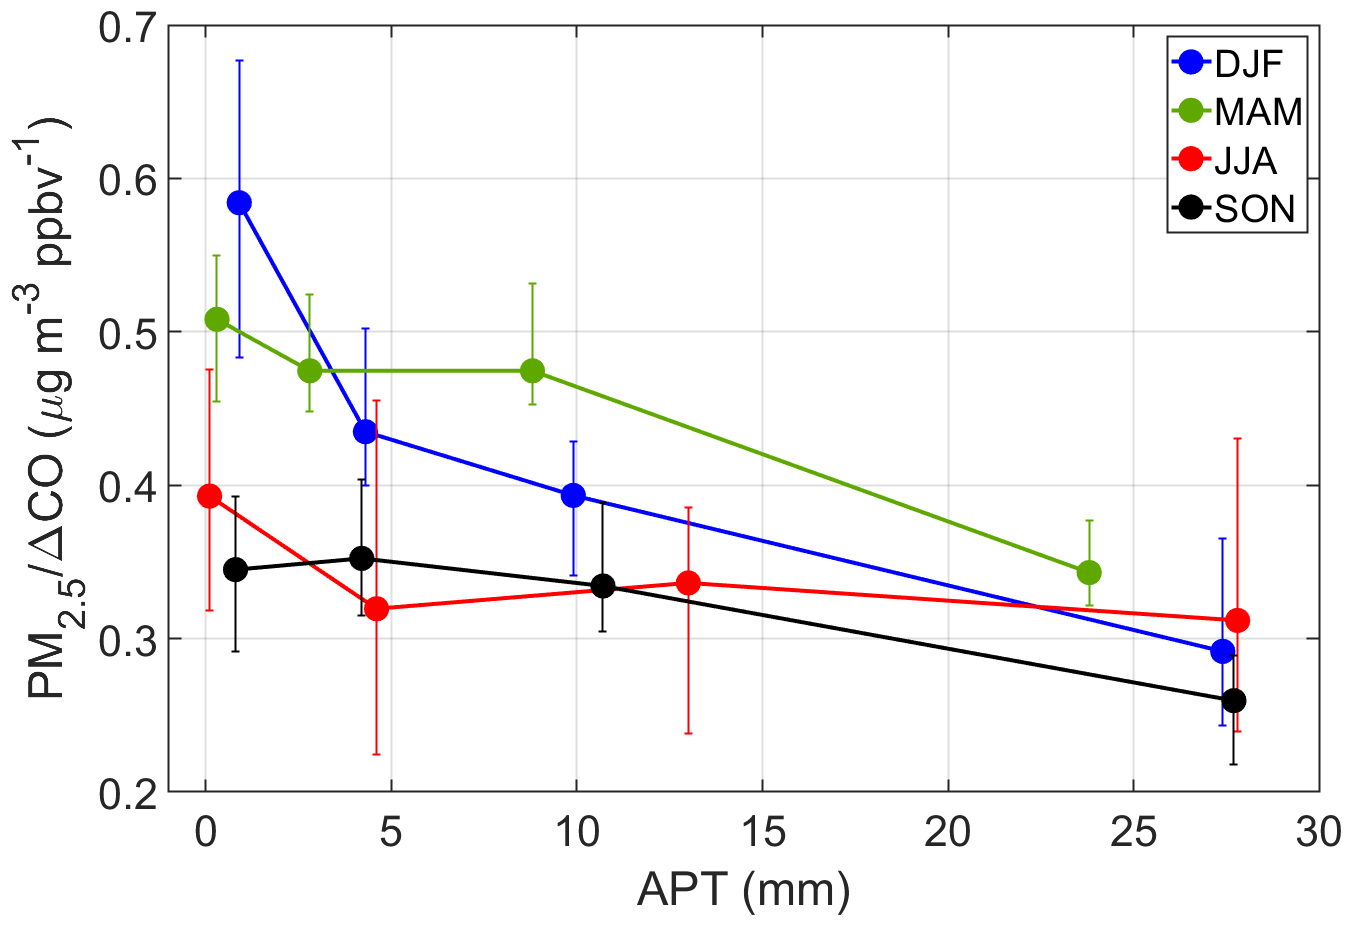
Figure 7Seasonal sensitivity of PMCO to APT for Cluster 1 trajectories, divided based on four APT bins that have a similar number of data points per season. Markers denote median values, and error bars represent the 95 % confidence interval for medians based on a bootstrapping method (n = 100 000). Number of points per marker: DJF = 192–194; MAM = 247–251; JJA = 107–110; SON = 183–191.
Normalization by ΔCO was important for assessing transport efficiency of anthropogenic pollution, but we also considered dust and sea salt without ΔCO normalization as they are predominantly emitted by natural sources. Although outside the scope of this study, we caution that MERRA-2 concentrations of sea salt in the PM2.5 fraction may exceed those of total PM2.5 as measured at Fort Prospect (Table 2) owing to the inherent differences in the two respective datasets including the larger spatial scale covered by MERRA-2 compared to the point measurements at Fort Prospect. Previous analysis of precipitation scavenging ratios over Bermuda showed that larger aerosol types (e.g., sea salt) are removed more efficiently than smaller aerosol types (e.g., sulfate, nitrate) (Galloway et al., 1993). Total sea salt and sea salt in the PM2.5 fraction exhibited higher median concentrations for the high-APT category (p value < 0.05) for all seasons except JJA, which had more comparable values. This can be explained by how days experiencing high APT exhibited significantly higher surface wind speeds around Bermuda for all seasons except JJA, for which wind speeds in general were depressed. Therefore, the reduction of the PMCO ratio in high-APT conditions may actually be an underestimate of wet scavenging of North American pollution outflow since local sea salt is higher on windier days marked by high APT.
To put this last assertion on firmer ground, we examined local rain values as they could be influential in terms of scavenging the locally generated sea salt. The median values of local rain on high-APT days for each season based on APT for the most recent 6 h of trajectories arriving at Bermuda (APT6 h) were 0.0–0.1 mm, while median values of APT6 h on low-APT days were 0 mm in each season. The only significant difference in median APT6 h values was in DJF when it was 0.1 mm on high-APT days in contrast to 0.0 mm on low-APT days. Therefore, for DJF the slightly enhanced APT6 h can possibly offset the greater sea salt emissions in terms of impacting PM2.5 levels over Bermuda. Results for the other major natural aerosol type (dust) reveal much lower overall concentrations compared to sea salt for both bulk sizes and the PM2.5 fraction. There was no consistent trend across the four seasons in terms of dust levels being higher for either the low- or high-APT category, which is not unexpected as dust is not a major aerosol type expected from North American outflow (Yu et al., 2020; Corral et al., 2021).
4.3.1 Volume size distributions
We next examine AERONET volume size distribution (VSD) relationships with APT. We normalize the volume concentration data by corresponding ΔCO in the same way as was done for PM2.5, with the same condition of using data only when ΔCO > 3.2 ppbv. A few cautionary details are first noted about these data in comparison to APT: (i) there are limited VSD data in the AERONET dataset, which is why we use all seasons of data together for Fig. 8 and Table 2; (ii) AERONET data are representative of ambient conditions, and changes in relative humidity can influence VSD profiles; and (iii) AERONET data are column-based and not necessarily representative of only the surface layer where the trajectories end in our analysis of HYSPLIT data. Related to the last point, past work noted that column optical properties over Bermuda can be weakly correlated with such measurements at the surface (Aryal et al., 2014) due largely to aerosol layers aloft (Ennis and Sievering, 1990). At the same time, studies have shown that there can be enhanced number and volume concentrations in the marine boundary layer versus the free troposphere over Bermuda (Horvath et al., 1990; Kim et al., 1990).
The median VSDs for both APT categories exhibit a bimodal profile with a more dominant coarse mode, consistent with what is already known for Bermuda based on AERONET data (Aldhaif et al., 2021). The unique aspect of this work is that in high-APT conditions, there is a reduction in median volume concentration in the smaller mode between radii of 0.05 and ∼ 1 µm, with a slight enhancement on the leading shoulder of the larger mode between radii of 1.71 and 2.94 µm (Fig. 8). The greatest relative reductions in the fine mode, which is more indicative of transported continental pollution, occurred between midpoint radii of 0.15 and 0.33 µm with relative reductions in those four bins (i.e., midpoint radii 0.15, 0.19, 0.26, and 0.33 µm) ranging from 38 % to 52 %. The coarse mode peaked at larger radii (3.86 µm) in low-APT conditions relative to high-APT conditions (2.94 µm).
Table 2 reports VSD parameter values for the APT categories separated by fine and coarse modes. Although only significantly different based on 90 % confidence (p value = 0.09), the fine-mode volume concentration normalized by ΔCO in the high-APT category was less than half (45 %) the value in the low-APT category. There were insignificant differences between effective radii and volume median radii, in addition to the geometric standard deviation for the fine mode between APT categories. For the coarse mode, only the geometric standard deviation exhibited a significant difference by being higher in the high-APT category (0.684 versus 0.647), although we presume that has less to do with actual scavenging effects and more to do with different times of the year when the relative abundance of different coarse particle type changes.
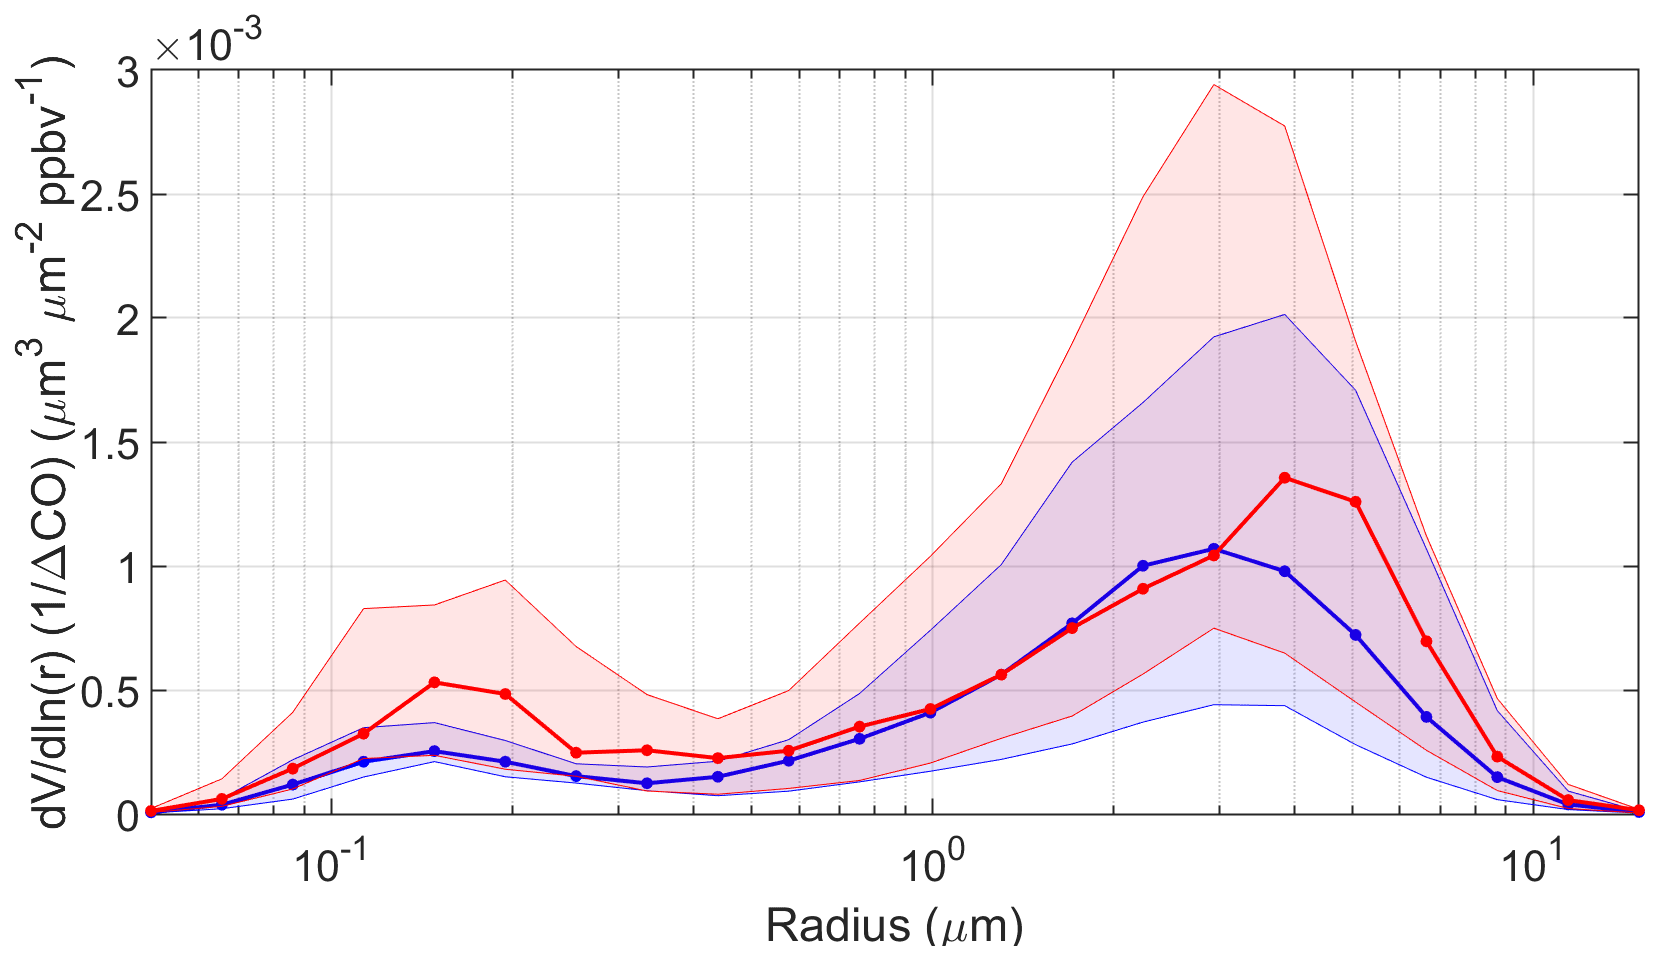
Figure 8Volume size distributions (VSDs) normalized by ΔCO for high-APT (> 13 mm; blue, n = 16) and low-APT (< 0.9 mm; red, n = 19) groups for Cluster 1 trajectories. Thick curves correspond to medians, and shaded areas extend to the 25th and 75th percentiles. VSDs are based on AERONET data between 1 January 2015 and 31 December 2019.
The AERONET results support the idea that scavenging on high-APT days efficiently removes fine particulate matter but that there can still be appreciable levels of locally generated sea salt due to higher local surface winds on high-APT days. Related to the columnar nature of AERONET data, it is important to note that others have reported large-scale subsidence of pollution from the middle and upper troposphere, especially in spring, based on enhanced ozone mixing ratios at the surface of Bermuda (Oltmans and Levy, 1992; Cooper et al., 1998; Milne et al., 2000; Li et al., 2002). Moreover, this phenomenon is synoptically favorable with the transport of North American polluted air behind cold fronts, especially in spring (Moody et al., 1995), and often linked to the lifting of polluted air out of the boundary layer by convection over the continental US (Prados et al., 1999). It is unclear based on the current dataset how effective these events were in impacting either the surface layer or columnar-based aerosol measurements at Bermuda.
4.4 GEOS-Chem model results
We conduct four GEOS-Chem simulations of the 210Pb submicron aerosol tracer including (a) one standard simulation, (b) the same as the standard simulation but with the 222Rn tracer emissions from the North American continent (25–60∘ N, 130–70∘ W) removed, (c) the same as the standard simulation but without 210Pb scavenging due to large-scale precipitation, and (d) the same as the standard simulation but without 210Pb scavenging by convective precipitation. The difference between (a) and (b) quantifies the North American contribution to atmospheric 210Pb concentrations. The difference between (a) and (c) reflects the role of large-scale precipitation scavenging, while the difference between (a) and (d) reflects that of convective precipitation scavenging in determining atmospheric 210Pb concentrations. All model simulations are conducted for the period from September 2016 to December 2017 with the first 4 months for spin-up. Monthly mean outputs for 2017 are used for analysis, which is a representative year within the time frame of the analysis presented in Sect. 3.1–3.3. This is confirmed by the seasonal APT box chart constructed in Fig. S6 using only 2017 data, which nearly follows the trend observed when the 5-year data are used (Fig. 5).
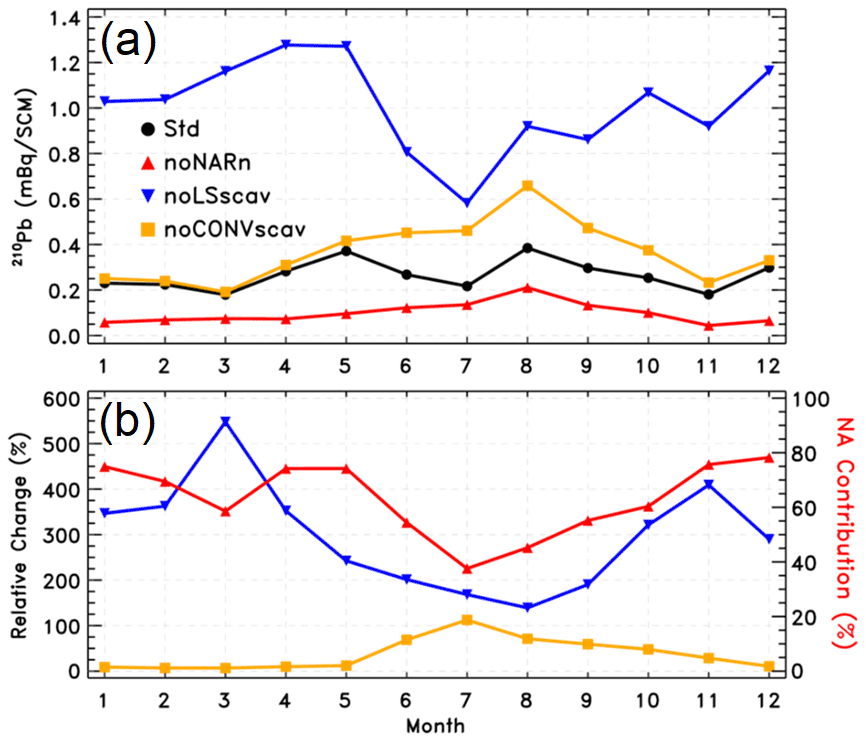
Figure 9Simulated monthly surface 210Pb tracer concentrations of submicron milliBecquerels (mBq) per standard cubic meter of (dry) air (mBq SCM−1) at Bermuda (32.31∘ N, 64.75∘ W) in 2017 as a way to assess effects of precipitation scavenging on North American outflow. Panel (a) shows monthly mean surface 210Pb concentrations in the standard simulation (Std) and three sensitivity simulations, i.e., without North American 222Rn emissions (noNARn), without large-scale precipitation scavenging (noLSscav), and without convective precipitation scavenging (noCONVscav). Panel (b) shows percentage changes, i.e., (noLSscav-Std)Std × 100 in blue and (noCONVscav-Std)Std × 100 in orange, and the North American contribution in red, i.e., (Std-noNARn)Std × 100.
Figure 9a shows monthly mean surface 210Pb concentrations at Bermuda for 2017 in the standard simulation and three sensitivity simulations. Figure 9b plots the relative changes in simulated 210Pb concentrations due to the effects of large-scale or convective precipitation scavenging. Also included in Fig. 9b is the North American contribution. The standard model simulates a seasonality in 210Pb concentrations with two distinct peaks in May and August (upper panel). The May peak is a result of increased transport from North America in combination with reduced scavenging. In contrast, the August peak results from long-range transport from other continents (e.g., North Africa, Europe) along the southern edge of the Bermuda High. The lows in March and November are attributed to strong large-scale precipitation scavenging, and the low in July is associated with enhanced convective precipitation scavenging. The sensitivity simulations clearly show that the role of large-scale precipitation scavenging in affecting surface 210Pb concentrations at Bermuda is much larger in winter and spring than in summer, with a maximum in March (lower panel), while convective scavenging also plays an important role in summer. The relative contribution of North American 222Rn emissions is largest in winter (∼ 75 %–80 %), suggesting air masses reaching Bermuda often experience large-scale precipitation scavenging while traveling from the North American continent during winter. While the model may have limitations and inherent uncertainties, its results are at least consistent with results already shown, putting our conclusions on firmer ground.
4.5 Airborne case study
The DJF season has been shown in this study to exhibit the greatest potential for wet scavenging and the highest density of trajectories from North America reaching Bermuda. To probe deeper now, we take advantage of data from ACTIVATE RF6 on 22 February 2020, which characterized the intermediate region between North America and Bermuda. Weather in the ACTIVATE domain on this day was characterized by a transition from post-cold-front conditions to high pressure. A cold front passed over Bermuda the previous day at approximately 18:00 UTC on 21 February and by the flight period of RF06 was approximately 600 km southeast of the island. Meanwhile, a broad but weakening area of surface high pressure continued eastward into the southeast US. Winds in the boundary layer were southwesterly at around 5 m s−1 near the base of operations (NASA Langley Research Center; Hampton, Virginia), which were associated with a weak trough on the northeast side of the high-pressure system. These winds shifted to north-northwest near the coast at 2.5 m s−1 and north-northeast at 7.4 m s−1 near the far end of the flight track; Bermuda reported north-northeast winds around 9 m s−1 during this period. Aloft, 500 hPa flow was from the west-northwest. NASA Langley reported few to no clouds during the flight period, while Bermuda reported broken clouds with multiple layers (with bases around 900 and 1800 m) and rain showers at or near the airport. This is consistent with satellite imagery (Fig. 10a), which shows an area of scattered to broken cumulus and stratocumulus extending from the cold front near Bermuda to the edge of the Gulf Stream off the US East Coast. Satellite-retrieved cloud bases were at 1–2 km, with cloud tops ranging from 1.5–3.5 km; from the HU-25 Falcon flight legs, cloud bases encountered along the flight track were 750–1100 m and cloud tops were 1200–1800 m.

Figure 10Summary of ACTIVATE's Research Flight 6 on 22 February 2020. (a) HU-25 Falcon flight track overlaid on GOES-16 imagery of the WNAO (Bermuda denoted by blue star) also showing 96 h back trajectories calculated for each respective min. alt. leg. The midpoints of the four min. alt. legs are marked, including values for the accumulated precipitation along the trajectory (APT) for the recent history of the sampled air masses when they were over the ocean (time over land excluded from APT calculation). (b) Zoomed-in version of panel (a) focused on the flight path. (c) Time series of Falcon altitude colored by flight UTC time (color bar in panel b) and rain water content (RWC) from the 2DS probe. Gray shaded bars signify when FCDP liquid water content exceeded 0.05 g m−3, indicative of cloud legs. The same four colored stars from (a) are shown on the x axis to indicate where they occurred. (d–e) Box notch plots of the leg-mean min. alt. values of CPC particle concentration (> 0.01 µm) and the number and volume concentrations of the LAS (> 0.09 µm).
Figure 10a shows the general flight path, which involved flying to a point southeast of the operations base (Hampton, Virginia) and then retracing the path back to land. Four HYSPLIT back trajectories are shown (Fig. 10a), corresponding to midpoints of each min. alt. leg when the aircraft was at its lowest altitude (∼ 150 m). APT calculations were conducted for segments of those four trajectories that were over the ocean to focus on wet removal clouds over the WNAO. Negligible rain accumulated up to the point of the min. alt. 1 leg, as there were cloud-free conditions between land and that offshore point. In contrast, the next three min. alt. legs show higher APT values ranging from 0.6 to 2.4 mm, consistent with the GOES-16 imagery showing cloud fraction increasing just to the southeast of the min. alt. 1 leg. Expectedly, APT values progressively increased with offshore distance as a result of air masses being exposed to clouds for longer periods. Figure S7 shows 27 trajectories obtained for each min. alt. leg based on ensemble trajectory analysis, which is a technique available in HYSPLIT to evaluate uncertainties in trajectory calculations by offsetting the meteorological data by a fixed grid factor. Average APT values based on ensemble analysis (Fig. S7) were 0.29, 1.18, 2.27, and 0.73 mm, corresponding to min. alt. 1, 2, 3, and 4 legs, respectively, which follow the trend observed in Fig. 10.

Figure 11Aerosol size distribution comparison (a SMPS and b LAS) between the four HU-25 Falcon min. alt. legs during ACTIVATE Research Flight 6, as shown in Fig. 10.
Shortly after the min. alt. 1 leg, the Falcon conducted two consecutive pairs of BCB and ACB legs (i.e., below cloud base followed by above cloud base), followed by a slant descent to the min. alt. 2 leg, where RWC values were enhanced (up to 0.02 g m−3 at 19:55:22 UTC) owing to precipitation from overlying clouds. Very shortly thereafter, RWC reached as high as 0.11 g m−3 (19:56:50 UTC) in the slant ascent profile passing through clouds. The APT value in the min. alt. 2 leg was 1.8 mm. A significant reduction was observed in the aerosol number and volume concentrations for the min. alt. 2 leg compared to the min. alt. 1 leg (Fig. 10d–e). Table S4 reports the statistics for aerosol parameters measured in min. alt. legs (Fig. 10). CPC (> 10 nm) concentrations dropped by 93 % from a leg median value of 4938 cm−3 during min. alt. 1 to 345 cm−3 during min. alt. 2, whereas the LAS number and volume (> 100 nm) concentrations dropped from 360 to 174 cm−3 and from 2.0 to 0.9 µm3 cm−3, respectively. Size distribution data in those two legs show a significant reduction in particle concentration across the full diameter range as measured by the SMPS and LAS (Fig. 11). A notable feature from the SMPS was a pronounced peak between 3.5 and 14.1 nm, suggestive of nucleation, that was absent in subsequent min. alt. legs, presumably owing to some combination of coagulation and scavenging.
The aircraft continued southeast after the min. alt. 2 leg and passed through more patches of precipitation, leading to the highest APT value of 2.4 mm in the min. alt. 3 leg, for which leg median values were as follows: CPC 165 cm−3, LAS number 66 cm−3, LAS volume 0.4 µm3 cm−3. While the SMPS distributions in the min. alt. 2 and 3 legs were very similar, the LAS size distribution in the min. alt. 3 leg is shifted towards lower concentrations, especially below 400 nm. On the path back towards Virginia, the Falcon conducted one final min. alt. 4 leg right before the boundary between cloudy and clear air, with the APT value being 0.6 mm. Between the min. alt. 3 and 4 legs, significant RWC values were again observed, reaching as high as 0.26 g m−3 at 20:54:20 UTC. Aerosol concentration measurements increased relative to the min. alt. 2 and 3 legs (leg median values): CPC = 1076 cm−3, LAS number = 545 cm−3, LAS volume = 1.8 µm3 cm−3. It is difficult to compare results from the min. alt. 1 and 4 legs as ∼ 2 h had passed and there were different conditions impacting the two respective sampled air masses. The size distributions varied considerably for the min. alt. 4 leg compared to the other three legs, with increased concentrations between 20 and 200 nm, presumably as a result of continued pollution outflow and more photochemistry and aerosol growth processing compared to earlier in the day.
To conclude, it is plausible based on the case flight data that the emerging presence of clouds and precipitation led to the substantial reduction of aerosol particles with distance offshore via wet scavenging processes. Further research is warranted with more extensive data to move closer to showing causal relationships between precipitation and aerosol particles. For instance, a few points of caution from RF6 are worth mentioning. First, the coastal trajectories in Fig. 10 corresponding to the different Min Alt. legs originated from varying places extending from the Virginia coast up north towards Cape Cod, Massachusetts. Secondly, cloud dynamics and boundary layer structure can vary offshore. Related to the latter, PBLH data obtained from MERRA-2 along the flight track revealed that there were deeper boundary layers farther offshore, but not sufficiently deeper to fully explain the reductions in aerosol concentration: PBLH corresponding to min. alt. legs 1, 2, 3, and 4 of 1156, 1728, 1740, and 1530 m, respectively. Lastly, aerosol concentrations linked to continental outflow naturally decrease offshore anyway, including in cloud-free conditions, owing to dilution during transport.
This study examines the sensitivity of surface aerosol characteristics over a remote area of the western North Atlantic Ocean (Bermuda) to precipitation along trajectories coming from North America. Based on trajectory clustering with HYSPLIT data, two characteristic transport corridors to Bermuda's surface layer (100 m a.g.l.) were identified, with the focus being the one coming from North America (Cluster 1). Seasonal analysis of HYSPLIT and Bermuda surface data showed that JJA is distinct in terms of having transport from the southeast with the other seasons, especially DJF, having more North American influence with higher concentrations of CO. Comparing Cluster 1 trajectory data between high (> 13.5 mm) and low (< 0.9 mm) accumulated precipitation along trajectories (APT), there was a clear signature of wet scavenging effects by precipitation with more than a 2-fold reduction in PMCO in DJF (0.29 µg m−3 ppbv−1 versus 0.62 µg m−3 ppbv−1), with the reduction being less severe for other seasons. The greatest sensitivity of PMCO to APT was at the lowest values (up to ∼ 5 mm; slope of −0.044 µg m−3 ppbv−1 mm−1), above which the descending slope of PMCO versus APT was less steep.
Speciated data indicate that anthropogenic species such as sulfate, black carbon, and organic carbon are reduced as a function of APT (much like PM2.5). However, sea salt was not necessarily reduced and at times could even be higher at Bermuda with high-APT conditions, which is attributed to higher local wind speeds. Analysis of AERONET volume size distribution data at Bermuda confirms the substantial reduction of fine-mode volume concentrations in contrast to a smaller change in the coarse mode on high-APT days. GEOS-Chem simulations of the radionuclide aerosol tracer 210Pb confirm that North American influence at the surface of Bermuda is highest in DJF, with those air masses significantly impacted by large-scale (i.e., stratiform and anvil) precipitation scavenging; furthermore, convective scavenging is shown to play an important role in summer months. A research flight from ACTIVATE on 22 February 2020 demonstrates a significant gradient in aerosol number and volume concentrations offshore of North America as soon as trajectories start passing across clouds, consistent with increasing APT away from the coast leading to increased aerosol particle removal.
Our results have implications for other remote marine regions impacted by transport of continental emissions. These results also highlight the important role of precipitation in modifying aerosol levels, potentially including their vertical distribution (e.g., Luan and Jaeglé, 2013), along continental outflow trajectories. We show that cloud and precipitation processes along trajectories have significant impacts on resultant aerosol characteristics. Therefore, it is important to strongly constrain wet scavenging processes in models to improve aerosol forecasting over the WNAO.
Fort Prospect station aerosol and gas measurements can be found at https://doi.org/10.6084/m9.figshare.13651454.v2 (Peters, 2021).
AERONET data can be found at https://aeronet.gsfc.nasa.gov/ (AERONET, 2020).
HYSPLIT data as described by Stein et al. (2015) can be found at https://www.ready.noaa.gov/HYSPLIT.php.
MERRA-2 data can be found at https://disc.gsfc.nasa.gov/ (Global Modeling and Assimilation Office (GMAO), 2021).
The GEOS-Chem model as described by Bey et al. (2001) can be found at http://wiki.seas.harvard.edu/geos-chem/index.php/GEOS-Chem_v11-01.
ACTIVATE Airborne Data can be found at https://doi.org/10.5067/ASDC/ACTIVATE_Aerosol_AircraftInSitu_Falcon_Data_1 (NASA/LARC/SD/ASDC, 2020a), https://doi.org/10.5067/ASDC/ACTIVATE_Cloud_AircraftInSitu_Falcon_Data_1 (NASA/LARC/SD/ASDC, 2020b), and https://doi.org/10.5067/ASDC/ACTIVATE_MetNav_AircraftInSitu_Falcon_Data_1 (NASA/LARC/SD/ASDC, 2020c).
Section 3.5 airport weather data can be found at http://mesonet.agron.iastate.edu/ASOS/ (Iowa State University of Science and Technology, 2021).
Section 3.5 ocean surface analysis charts and GFS 500 hPa analysis data can be found at https://www.ncei.noaa.gov/data/ncep-charts/access/ (National Centers for Environmental Information (NCEI), 2021a).
Section 3.5 North America analysis–satellite composite can be found at https://www.wpc.ncep.noaa.gov/archives/web_pages/sfc/sfc_archive_maps.php (National Centers for Environmental Information (NCEI), 2021b).
Section 3.5 satellite imagery and products can be found at https://satcorps.larc.nasa.gov/cgi-bin/site/showdoc?docid=4&cmd=field-experiment-homepage&exp=ACTIVATE. (NASA/Langley SatCORPS, 2021).
The supplement related to this article is available online at: https://doi.org/10.5194/acp-21-16121-2021-supplement.
HD and MA conducted the analysis. AS and HD prepared the paper. HL and BZ performed GEOS-Chem model radionuclide simulations and output analysis. All authors contributed by providing input and/or participating in airborne data collection.
Some authors are members of the editorial board of Atmospheric Chemistry and Physics. The peer-review process was guided by an independent editor, and the authors also have no other competing interests to declare.
Publisher's note: Copernicus Publications remains neutral with regard to jurisdictional claims in published maps and institutional affiliations.
This article is part of the special issue “Marine aerosols, trace gases, and clouds over the North Atlantic (ACP/AMT inter-journal SI)”. It is not associated with a conference.
The work was funded by NASA grant 80NSSC19K0442 in support of ACTIVATE, a NASA Earth Venture Suborbital-3 (EVS-3) investigation funded by NASA's Earth Science Division and managed through the Earth System Science Pathfinder Program Office. Hongyu Liu and Bo Zhang acknowledge support from NASA grant 80NSSC19K0389. The AERONET station in Bermuda is maintained on behalf of NASA by the Bermuda Institute of Ocean Sciences at the Tudor Hill Marine Atmospheric Observatory, which is currently supported by NSF award 1829686 and by previous such awards during the time period of this study. Gas chemistry and PM data at Fort Prospect are from the Bermuda Air Quality Program, operated by BIOS with funding from the Department of Environment and Natural Resources, Government of Bermuda. The authors acknowledge the NOAA Air Resources Laboratory (ARL) for the provision of the HYSPLIT transport and dispersion model and READY website (http://ready.arl.noaa.gov, last access: 27 October 2021) used in this work. The Pacific Northwest National Laboratory (PNNL) is operated for the DOE by the Battelle Memorial Institute under contract DE-AC05-76RLO1830. The NASA Center for Climate Simulation (NCCS) provided supercomputing resources. The GEOS-Chem model is managed by the Atmospheric Chemistry Modeling Group at Harvard University with support from the NASA ACMAP and MAP programs. GEOS-Chem input files were obtained from the GEOS-Chem Data Portal enabled by Compute Canada.
This research has been supported by the National Aeronautics and Space Administration (grant nos. 80NSSC19K0442 and 80NSSC19K0389) and the National Science Foundation (grant no. 1829686).
This paper was edited by Annele Virtanen and reviewed by two anonymous referees.
AERONET: Data Download Tool, available at: https://aeronet.gsfc.nasa.gov/, last access: 27 October 2020.
Aldhaif, A. M., Lopez, D. H., Dadashazar, H., Painemal, D., Peters, A. J., and Sorooshian, A.: An Aerosol Climatology and Implications for Clouds at a Remote Marine Site: Case Study Over Bermuda, J. Geophys. Res.-Atmos., 126, e2020JD034038, https://doi.org/10.1029/2020JD034038, 2021.
Altieri, K. E., Hastings, M. G., Gobel, A. R., Peters, A. J., and Sigman, D. M.: Isotopic composition of rainwater nitrate at Bermuda: The influence of air mass source and chemistry in the marine boundary layer, J. Geophys. Res.-Atmos., 118, 11304–11316, https://doi.org/10.1002/jgrd.50829, 2013.
Anderson, J. R., Buseck, P. R., Patterson, T. L., and Arimoto, R.: Characterization of the Bermuda tropospheric aerosol by combined individual-particle and bulk-aerosol analysis, Atmos. Environ., 30, 319–338, https://doi.org/10.1016/1352-2310(95)00170-4, 1996.
Arimoto, R.: Eolian Dust and Climate: Relationships to Sources, Tropospheric Chemistry, Transport and Deposition, Earth-Sci. Rev., 54, 29–42, https://doi.org/10.1016/S0012-8252(01)00040-X, 2001.
Arimoto, R., Duce, R. A., Savoie, D. L., and Prospero, J. M.: Trace-Elements in Aerosol-Particles from Bermuda and Barbados – Concentrations, Sources and Relationships to Aerosol Sulfate, J. Atmos. Chem., 14, 439–457, https://doi.org/10.1007/BF00115250, 1992.
Arimoto, R., Duce, R. A., Ray, B. J., Ellis, W. G., Cullen, J. D., and Merrill, J. T.: Trace-Elements in the Atmosphere over the North-Atlantic, J. Geophys. Res.-Atmos., 100, 1199–1213, https://doi.org/10.1029/94jd02618, 1995.
Arimoto, R., Snow, J. A., Graustein, W. C., Moody, J. L., Ray, B. J., Duce, R. A., Turekian, K. K., and Maring, H. B.: Influences of atmospheric transport pathways on radionuclide activities in aerosol particles from over the North Atlantic, J. Geophys. Res.-Atmos., 104, 21301–21316, https://doi.org/10.1029/1999JD900356, 1999.
Aryal, R. P., Voss, K. J., Terman, P. A., Keene, W. C., Moody, J. L., Welton, E. J., and Holben, B. N.: Comparison of surface and column measurements of aerosol scattering properties over the western North Atlantic Ocean at Bermuda, Atmos. Chem. Phys., 14, 7617–7629, https://doi.org/10.5194/acp-14-7617-2014, 2014.
Bey, I., Jacob, D. J., Yantosca, R. M., Logan, J. A., Field, B. D., Fiore, A. M., Li, Q. B., Liu, H., Mickley, L. J., and Schultz, M. G.: Global modeling of tropospheric chemistry with assimilated meteorology: Model description and evaluation, J. Geophys. Res.-Atmos., 106, 23073–23095, https://doi.org/10.1029/2001JD000807, 2001.
Brattich, E., Liu, H., Tositti, L., Considine, D. B., and Crawford, J. H.: Processes controlling the seasonal variations in 210Pb and 7Be at the Mt. Cimone WMO-GAW global station, Italy: a model analysis, Atmos. Chem. Phys., 17, 1061–1080, https://doi.org/10.5194/acp-17-1061-2017, 2017.
Cabello, M., Orza, J. A. G., Galiano, V., and Ruiz, G.: Influence of meteorological input data on backtrajectory cluster analysis – a seven-year study for southeastern Spain, Adv. Sci. Res., 2, 65–70, https://doi.org/10.5194/asr-2-65-2008, 2008.
Chen, L. Q. and Duce, R. A.: The Sources of Sulfate, Vanadium and Mineral Matter in Aerosol-Particles over Bermuda, Atmos. Environ., 17, 2055–2064, https://doi.org/10.1016/0004-6981(83)90362-1, 1983.
Cooper, O. R., Moody, J. L., Davenport, J. C., Oltmans, S. J., Johnson, B. J., Chen, X., Shepson, P. B., and Merrill, J. T.: Influence of springtime weather systems on vertical ozone distributions over three North American sites, J. Geophys. Res.-Atmos., 103, 22001–22013, https://doi.org/10.1029/98JD01801, 1998.
Corral, A. F., Braun, R. A., Cairns, B., Gorooh, V. A., Liu, H., Ma, L., Mardi, A. H., Painemal, D., Stamnes, S., van Diedenhoven, B., Wang, H., Yang, Y., Zhang, B., and Sorooshian, A.: An Overview of Atmospheric Features Over the Western North Atlantic Ocean and North American East Coast – Part 1: Analysis of Aerosols, Gases, and Wet Deposition Chemistry, J. Geophys. Res.-Atmos., 126, e2020JD032592, https://doi.org/10.1029/2020JD032592, 2021.
Cutter, G. A.: Metalloids in Wet Deposition on Bermuda – Concentrations, Sources, and Fluxes, J. Geophys. Res.-Atmos., 98, 16777–16786, https://doi.org/10.1029/93JD01689, 1993.
Davis, R. E., Hayden, B. P., Gay, D. A., Phillips, W. L., and Jones, G. V.: The North Atlantic Subtropical Anticyclone, J. Climate, 10, 728–744, https://doi.org/10.1175/1520-0442(1997)010<0728:tnasa>2.0.co;2, 1997.
Dimitriou, K., Remoundaki, E., Mantas, E., and Kassomenos, P.: Spatial distribution of source areas of PM2.5 by Concentration Weighted Trajectory (CWT) model applied in PM2.5 concentration and composition data, Atmos. Environ., 116, 138–145, https://doi.org/10.1016/j.atmosenv.2015.06.021, 2015.
Ding, J., Dai, Q., Zhang, Y., Xu, J., Huangfu, Y., and Feng, Y.: Air humidity affects secondary aerosol formation in different pathways, Sci. Total Environ., 759, 143540, https://doi.org/10.1016/j.scitotenv.2020.143540, 2021.
Dubovik, O., Holben, B., Eck, T. F., Smirnov, A., Kaufman, Y. J., King, M. D., Tanré, D., and Slutsker, I.: Variability of Absorption and Optical Properties of Key Aerosol Types Observed in Worldwide Locations, J. Atmos. Sci., 59, 590–608, https://doi.org/10.1175/1520-0469(2002)059<0590:VOAAOP>2.0.CO;2, 2002.
Eastham, S. D., Weisenstein, D. K., and Barrett, S. R. H.: Development and evaluation of the unified tropospheric-stratospheric chemistry extension (UCX) for the global chemistry-transport model GEOS-Chem, Atmos. Environ., 89, 52–63, https://doi.org/10.1016/j.atmosenv.2014.02.001, 2014.
Engström, A. and Magnusson, L.: Estimating trajectory uncertainties due to flow dependent errors in the atmospheric analysis, Atmos. Chem. Phys., 9, 8857–8867, https://doi.org/10.5194/acp-9-8857-2009, 2009.
Ennis, G. and Sievering, H.: Vertical Profile of Elemental Concentrations in Aerosol Particles in the Bermuda Area during Gce/Case/Watox, Global Biogeochem. Cy., 4, 179–188, https://doi.org/10.1029/GB004i002p00179, 1990.
Galloway, J. N., Tokos, J. J., Knap, A. H., and Keene, W. C.: Local influences on the composition of precipitation on Bermuda, Tellus B, 40, 178–188, https://doi.org/10.3402/tellusb.v40i3.15905, 1988.
Galloway, J. N., Keene, W. C., Artz, R. S., Miller, J. M., Church, T. M., and Knap, A. H.: Processes controlling the concentrations of SO(4)(=), NO(3)(-), NH(4)(+), H(+), HCOO(T) and CH(3)COO(T) in precipitation on Bermuda, Tellus B, 41, 427–443, 1989.
Galloway, J. N., Savoie, D. L., Keene, W. C., and Prospero, J. M.: The Temporal and Spatial Variability of Scavenging Ratios for Nss Sulfate, Nitrate, Methanesulfonate and Sodium in the Atmosphere over the North-Atlantic Ocean, Atmos. Environ., 27, 235–250, https://doi.org/10.1016/0960-1686(93)90354-2, 1993.
Garrett, T., Zhao, C., and Novelli, P.: Assessing the relative contributions of transport efficiency and scavenging to seasonal variability in Arctic aerosol, Tellus B, 62, 190–196, https://doi.org/10.1111/j.1600-0889.2010.00453.x, 2010.
Gebhart, K. A., Schichtel, B. A., and Barna, M. G.: Directional Biases in Back Trajectories Caused by Model and Input Data, J. Air Waste Manage., 55, 1649–1662, https://doi.org/10.1080/10473289.2005.10464758, 2005.
Gelaro, R., McCarty, W., Suarez, M. J., Todling, R., Molod, A., Takacs, L., Randles, C. A., Darmenov, A., Bosilovich, M. G., Reichle, R., Wargan, K., Coy, L., Cullather, R., Draper, C., Akella, S., Buchard, V., Conaty, A., da Silva, A. M., Gu, W., Kim, G. K., Koster, R., Lucchesi, R., Merkova, D., Nielsen, J. E., Partyka, G., Pawson, S., Putman, W., Rienecker, M., Schubert, S. D., Sienkiewicz, M., and Zhao, B.: The Modern-Era Retrospective Analysis for Research and Applications, Version 2 (MERRA-2), J. Climate, 30, 5419–5454, https://doi.org/10.1175/Jcli-D-16-0758.1, 2017.
Giles, D. M., Sinyuk, A., Sorokin, M. G., Schafer, J. S., Smirnov, A., Slutsker, I., Eck, T. F., Holben, B. N., Lewis, J. R., Campbell, J. R., Welton, E. J., Korkin, S. V., and Lyapustin, A. I.: Advancements in the Aerosol Robotic Network (AERONET) Version 3 database – automated near-real-time quality control algorithm with improved cloud screening for Sun photometer aerosol optical depth (AOD) measurements, Atmos. Meas. Tech., 12, 169–209, https://doi.org/10.5194/amt-12-169-2019, 2019.
Global Modeling and Assimilation Office (GMAO): MERRA-2, Greenbelt, MD, USA, Goddard Earth Sciences Data and Information Services Center (GES DISC), available at: https://disc.gsfc.nasa.gov/, last access: 27 October 2021.
Govender, P. and Sivakumar, V.: Application of k-means and hierarchical clustering techniques for analysis of air pollution: A review (1980–2019), Atmos. Pollut. Res., 11, 40–56, https://doi.org/10.1016/j.apr.2019.09.009, 2020.
Government of Bermuda: 2016 Population and Housing Census Report, available at: https://www.gov.bm/articles/2016-population-and-housing-census-report (last access: 27 October 2021), 2019.
Hilario, M. R. A., Cruz, M. T., Bañaga, P. A., Betito, G., Braun, R. A., Stahl, C., Cambaliza, M. O., Lorenzo, G. R., MacDonald, A. B., AzadiAghdam, M., Pabroa, P. C., Yee, J. R., Simpas, J. B., and Sorooshian, A.: Characterizing Weekly Cycles of Particulate Matter in a Coastal Megacity: The Importance of a Seasonal, Size-Resolved, and Chemically Speciated Analysis, J. Geophys. Res.-Atmos., 125, e2020JD032614, https://doi.org/10.1029/2020JD032614, 2020.
Hilario, M. R. A., Crosbie, E., Shook, M., Reid, J. S., Cambaliza, M. O. L., Simpas, J. B. B., Ziemba, L., DiGangi, J. P., Diskin, G. S., Nguyen, P., Turk, F. J., Winstead, E., Robinson, C. E., Wang, J., Zhang, J., Wang, Y., Yoon, S., Flynn, J., Alvarez, S. L., Behrangi, A., and Sorooshian, A.: Measurement report: Long-range transport patterns into the tropical northwest Pacific during the CAMP2Ex aircraft campaign: chemical composition, size distributions, and the impact of convection, Atmos. Chem. Phys., 21, 3777–3802, https://doi.org/10.5194/acp-21-3777-2021, 2021.
Holben, B. N., Eck, T. F., Slutsker, I., Tanré, D., Buis, J. P., Setzer, A., Vermote, E., Reagan, J. A., Kaufman, Y. J., Nakajima, T., Lavenu, F., Jankowiak, I., and Smirnov, A.: AERONET – A Federated Instrument Network and Data Archive for Aerosol Characterization, Remote Sens. Environ., 66, 1–16, https://doi.org/10.1016/S0034-4257(98)00031-5, 1998.
Horvath, H., Gunter, R. L., and Wilkison, S. W.: Determination of the Coarse Mode of the Atmospheric Aerosol Using Data from a Forward-Scattering Spectrometer Probe, Aerosol Sci. Tech., 12, 964–980, https://doi.org/10.1080/02786829008959407, 1990.
Hsu, Y.-K., Holsen, T. M., and Hopke, P. K.: Comparison of hybrid receptor models to locate PCB sources in Chicago, Atmos. Environ., 37, 545–562, https://doi.org/10.1016/s1352-2310(02)00886-5, 2003.
Huang, S., Arimoto, R., and Rahn, K. A.: Changes in atmospheric lead and other pollution elements at Bermuda, J. Geophys. Res., 101, 21033–21040, https://doi.org/10.1029/96jd02001, 1996.
Huang, R.-J., Zhang, Y., Bozzetti, C., Ho, K.-F., Cao, J.-J., Han, Y., Daellenbach, K. R., Slowik, J. G., Platt, S. M., Canonaco, F., Zotter, P., Wolf, R., Pieber, S. M., Bruns, E. A., Crippa, M., Ciarelli, G., Piazzalunga, A., Schwikowski, M., Abbaszade, G., Schnelle-Kreis, J., Zimmermann, R., An, Z., Szidat, S., Baltensperger, U., Haddad, I. E., and Prévôt, A. S. H.: High secondary aerosol contribution to particulate pollution during haze events in China, Nature, 514, 218–222, https://doi.org/10.1038/nature13774, 2014.
Huang, S. L., Rahn, K. A., Arimoto, R., Graustein, W. C., and Turekian, K. K.: Semiannual cycles of pollution at Bermuda, J. Geophys. Res.-Atmos., 104, 30309–30317, 1999.
Iowa State University of Science and Technology: Automated Surface Observing System (ASOS), available at: http://mesonet.agron.iastate.edu/ASOS/, last access: 27 October 2021.
Jickells, T. D., Knap, A., Church, T., Galloway, J., and Miller, J.: Acid-Rain on Bermuda, Nature, 297, 55–57, https://doi.org/10.1038/297055a0, 1982.
Kadko, D. and Prospero, J.: Deposition of Be-7 to Bermuda and the regional ocean: Environmental factors affecting estimates of atmospheric flux to the ocean, J. Geophys. Res.-Oceans, 116, C02013, https://doi.org/10.1029/2010JC006629, 2011.
Kassomenos, P., Vardoulakis, S., Borge, R., Lumbreras, J., Papaloukas, C., and Karakitsios, S.: Comparison of statistical clustering techniques for the classification of modelled atmospheric trajectories, Theor. Appl. Climatol., 102, 1–12, https://doi.org/10.1007/s00704-009-0233-7, 2010.
Keene, W. C., Moody, J. L., Galloway, J. N., Prospero, J. M., Cooper, O. R., Eckhardt, S., and Maben, J. R.: Long-term trends in aerosol and precipitation composition over the western North Atlantic Ocean at Bermuda, Atmos. Chem. Phys., 14, 8119–8135, https://doi.org/10.5194/acp-14-8119-2014, 2014.
Kim, Y., Sievering, H., and Boatman, J.: Volume and surface area size distribution, water mass and model fitting of GCE/CASE/WATOX marine aerosols, Global Biogeochem. Cy., 4, 165–177, https://doi.org/10.1029/GB004i002p00165, 1990.
Knop, I., Bansmer, S. E., Hahn, V., and Voigt, C.: Comparison of different droplet measurement techniques in the Braunschweig Icing Wind Tunnel, Atmos. Meas. Tech., 14, 1761–1781, https://doi.org/10.5194/amt-14-1761-2021, 2021.
Lawson, R. P., O'Connor, D., Zmarzly, P., Weaver, K., Baker, B., Mo, Q., and Jonsson, H.: The 2D-S (Stereo) Probe: Design and Preliminary Tests of a New Airborne, High-Speed, High-Resolution Particle Imaging Probe, J. Atmos. Ocean. Tech., 23, 1462–1477, https://doi.org/10.1175/jtech1927.1, 2006.
Li, Q., Jacob, D. J., Fairlie, T. D., Liu, H., Martin, R. V., and Yantosca, R. M.: Stratospheric versus pollution influences on ozone at Bermuda: Reconciling past analyses, J. Geophys. Res., 107, 4611, https://doi.org/10.1029/2002JD002138, 2002.
Lin, J. T. and McElroy, M. B.: Impacts of boundary layer mixing on pollutant vertical profiles in the lower troposphere: Implications to satellite remote sensing, Atmos. Environ., 44, 1726–1739, https://doi.org/10.1016/j.atmosenv.2010.02.009, 2010.
Lin, S.-J. and Rood, R. B.: Multidimensional Flux-Form Semi-Lagrangian Transport Schemes, Mon. Weather Rev., 124, 2046–2070, https://doi.org/10.1175/1520-0493(1996)124<2046:MFFSLT>2.0.CO;2, 1996.
Liu, H., Jacob, D. J., Bey, I., and Yantosca, R. M.: Constraints from 210Pb and 7Be on wet deposition and transport in a global three-dimensional chemical tracer model driven by assimilated meteorological fields, J. Geophys. Res.-Atmos., 106, 12109–12128, https://doi.org/10.1029/2000JD900839, 2001.
Luan, Y. and Jaeglé, L.: Composite study of aerosol export events from East Asia and North America, Atmos. Chem. Phys., 13, 1221–1242, https://doi.org/10.5194/acp-13-1221-2013, 2013.
Luo, G., Yu, F., and Schwab, J.: Revised treatment of wet scavenging processes dramatically improves GEOS-Chem 12.0.0 simulations of surface nitric acid, nitrate, and ammonium over the United States, Geosci. Model Dev., 12, 3439–3447, https://doi.org/10.5194/gmd-12-3439-2019, 2019.
Matsui, H., Kondo, Y., Moteki, N., Takegawa, N., Sahu, L. K., Zhao, Y., Fuelberg, H. E., Sessions, W. R., Diskin, G., Blake, D. R., Wisthaler, A., and Koike, M.: Seasonal variation of the transport of black carbon aerosol from the Asian continent to the Arctic during the ARCTAS aircraft campaign, J. Geophys. Res.-Atmos., 116, D05202, https://doi.org/10.1029/2010jd015067, 2011.
Mead, C., Herckes, P., Majestic, B. J., and Anbar, A. D.: Source apportionment of aerosol iron in the marine environment using iron isotope analysis, Geophys. Res. Lett., 40, 5722–5727, https://doi.org/10.1002/2013GL057713, 2013.
Merrill, J. T.: Isentropic Air-Flow Probability Analysis, J. Geophys. Res.-Atmos., 99, 25881–25889, https://doi.org/10.1029/94JD02211, 1994.
Miller, J. M. and Harris, J. M.: The Flow Climatology to Bermuda and Its Implications for Long-Range Transport, Atmos. Environ., 19, 409–414, https://doi.org/10.1016/0004-6981(85)90162-3, 1985.
Milne, P. J., Prados, A. I., Dickerson, R. R., Doddridge, B. G., Riemer, D. D., Zika, R. G., Merrill, J. T., and Moody, J. L.: Nonmethane hydrocarbon mixing ratios in continental outflow air from eastern North America: Export of ozone precursors to Bermuda, J. Geophys. Res.-Atmos., 105, 9981–9990, https://doi.org/10.1029/1999JD901117, 2000.
Moody, J. L. and Galloway, J. N.: Quantifying the relationship between atmospheric transport and the chemical composition of precipitation on Bermuda, Tellus B, 40, 463–479, https://doi.org/10.3402/tellusb.v40i5.16014, 1988.
Moody, J. L., Oltmans, S. J., Levy II, H., and Merrill, J. T.: A transport climatology of tropospheric ozone, Bermuda: 1988–1991, J. Geophys. Res., 100, 7179–7194, https://doi.org/10.1029/94JD02830, 1995.
Moody, J. L., Keene, W. C., Cooper, O. R., Voss, K. J., Aryal, R., Eckhardt, S., Holben, B., Maben, J. R., Izaguirre, M. A., and Galloway, J. N.: Flow climatology for physicochemical properties of dichotomous aerosol over the western North Atlantic Ocean at Bermuda, Atmos. Chem. Phys., 14, 691–717, https://doi.org/10.5194/acp-14-691-2014, 2014.
Moteki, N., Kondo, Y., Oshima, N., Takegawa, N., Koike, M., Kita, K., Matsui, H., and Kajino, M.: Size dependence of wet removal of black carbon aerosols during transport from the boundary layer to the free troposphere, Geophys. Res. Lett., 39, L13802, https://doi.org/10.1029/2012GL052034, 2012.
Muhs, D. R., Budahn, J. R., Prospero, J. M., Skipp, G., and Herwitz, S. R.: Soil Genesis on the Island of Bermuda in the Quaternary: The Importance of African Dust Transport and Deposition, J. Geophys. Res.-Earth, 117, F03025, https://doi.org/10.1029/2012JF002366, 2012.
NASA/Langley SatCORPS: Langley SATCORPS group support for Aerosol Cloud meTeorology Interactions oVer the western ATlantic Experiment (ACTIVATE), available at: https://satcorps.larc.nasa.gov/cgi-bin/site/showdoc?docid=4&cmd=field-experiment-homepage&exp=ACTIVATE, last access: 27 October 2021.
NASA/LARC/SD/ASDC: ACTIVATE Falcon In Situ Aerosol Data, NASA Langley Atmospheric Science Data Center DAAC [data set], https://doi.org/10.5067/ASDC/ACTIVATE_Aerosol_AircraftInSitu_Falcon_Data_1, 2020a.
NASA/LARC/SD/ASDC: ACTIVATE Falcon In Situ Cloud Data, NASA Langley Atmospheric Science Data Center DAAC [data set], https://doi.org/10.5067/ASDC/ACTIVATE_Cloud_AircraftInSitu_Falcon_Data_1, 2020b.
NASA/LARC/SD/ASDC: ACTIVATE Falcon In-Situ Meteorological and Navigational Data, NASA Langley Atmospheric Science Data Center DAAC [data set], https://doi.org/10.5067/ASDC/ACTIVATE_MetNav_AircraftInSitu_Falcon_Data_1, 2020c.
National Centers for Environmental Information (NCEI): National Centers for Environmental Prediction data, available at: https://www.ncei.noaa.gov/data/ncep-charts/access/, last access: 27 October 2021a.
National Centers for Environmental Information (NCEI): Weather Prediction Center (WPC) Surface Analysis data, available at: https://www.wpc.ncep.noaa.gov/archives/web_pages/sfc/sfc_archive_maps.php, last access: 27 October 2021b.
Nogueira, M.: Inter-comparison of ERA-5, ERA-interim and GPCP rainfall over the last 40 years: Process-based analysis of systematic and random differences, J. Hydrol., 583, 124632, https://doi.org/10.1016/j.jhydrol.2020.124632, 2020.
Oltmans, S. J. and Levy, H.: Seasonal Cycle of Surface Ozone over the Western North-Atlantic, Nature, 358, 392–394, https://doi.org/10.1038/358392a0, 1992.
Oshima, N., Kondo, Y., Moteki, N., Takegawa, N., Koike, M., Kita, K., Matsui, H., Kajino, M., Nakamura, H., Jung, J. S., and Kim, Y. J.: Wet removal of black carbon in Asian outflow: Aerosol Radiative Forcing in East Asia (A-FORCE) aircraft campaign, J. Geophys. Res.-Atmos., 117, D03204, https://doi.org/10.1029/2011JD016552, 2012.
Painemal, D., Corral, A. F., Sorooshian, A., Brunke, M. A., Chellappan, S., Afzali Gorooh, V., Ham, S.-H., O'Neill, L., Smith Jr., W. L., Tselioudis, G., Wang, H., Zeng, X., and Zuidema, P.: An Overview of Atmospheric Features Over the Western North Atlantic Ocean and North American East Coast—Part 2: Circulation, Boundary Layer, and Clouds, J. Geophys. Res.-Atmos., 126, e2020JD033423, https://doi.org/10.1029/2020JD033423, 2021.
Park, R. J., Jacob, D. J., Palmer, P. I., Clarke, A. D., Weber, R. J., Zondlo, M. A., Eisele, F. L., Bandy, A. R., Thornton, D. C., Sachse, G. W., and Bond, T. C.: Export efficiency of black carbon aerosol in continental outflow: Global implications, J. Geophys. Res.-Atmos., 110, D11205, https://doi.org/10.1029/2004jd005432, 2005.
Peters, A. J.: Bermuda aerosol, gas, and wet deposition composition dataset, figshare [data set], available at: https://doi.org/doi.org/10.6084/m9.figshare.13651454.v2, last access: 27 October 2021.
Prados, A. I., Dickerson, R. R., Doddridge, B. G., Milne, P. A., Moody, J. L., and Merrill, J. T.: Transport of ozone and pollutants from North America to the North Atlantic Ocean during the 1996 Atmosphere/Ocean Chemistry Experiment (AEROCE) intensive, J. Geophys. Res.-Atmos., 104, 26219–26233, https://doi.org/10.1029/1999JD900444, 1999.
Quan, J., Liu, Q., Li, X., Gao, Y., Jia, X., Sheng, J., and Liu, Y.: Effect of heterogeneous aqueous reactions on the secondary formation of inorganic aerosols during haze events, Atmos. Environ., 122, 306–312, https://doi.org/10.1016/j.atmosenv.2015.09.068, 2015.
Rolph, G., Stein, A., and Stunder, B.: Real-time Environmental Applications and Display sYstem: READY, Environ. Modell. Softw., 95, 210–228, https://doi.org/10.1016/j.envsoft.2017.06.025, 2017.
Schuster, G. L., Dubovik, O., and Holben, B. N.: Angstrom exponent and bimodal aerosol size distributions, J. Geophys. Res.-Atmos., 111, D07207, https://doi.org/10.1029/2005JD006328, 2006.
Silva, S. J., Ridley, D. A., and Heald, C. L.: Exploring the Constraints on Simulated Aerosol Sources and Transport Across the North Atlantic With Island-Based Sun Photometers, Earth Space Sci., 7, e2020EA001392, https://doi.org/10.1029/2020EA001392, 2020.
Sinnott, R. W.: Virtues of the haversine, Sky and Telescope, 68, p. 159, 1984.
Sorooshian, A., Anderson, B., Bauer, S. E., Braun, R. A., Cairns, B., Crosbie, E., and Zuidema, P.: Aerosol–Cloud–Meteorology Interaction Airborne Field Investigations: Using Lessons Learned from the U.S. West Coast in the Design of ACTIVATE Off the U.S. East Coast, B. Am. Meteorol. Soc., 100, 1511–1528, https://doi.org/10.1175/bams-d-18-0100.1, 2019.
Sorooshian, A., Corral, A. F., Braun, R. A., Cairns, B., Crosbie, E., Ferrare, R., and Zuidema, P.: Atmospheric Research over the Western North Atlantic Ocean Region and North American East Coast: A Review of Past Work and Challenges Ahead, J. Geophys. Res.-Atmos., 125, e2019JD031626, https://doi.org/10.1029/2019JD031626, 2020.
Stein, A. F., Draxler, R. R., Rolph, G. D., Stunder, B. J. B., Cohen, M. D., and Ngan, F.: NOAA's HYSPLIT Atmospheric Transport and Dispersion Modeling System, B. Am. Meteorol. Soc., 96, 2059–2077, https://doi.org/10.1175/bams-d-14-00110.1, 2015.
Stohl, A., Wotawa, G., Seibert, P., and Kromp-Kolb, H.: Interpolation Errors in Wind Fields as a Function of Spatial and Temporal Resolution and Their Impact on Different Types of Kinematic Trajectories, J. Appl. Meteorol., 34, 2149–2165, https://doi.org/10.1175/1520-0450(1995)034<2149:ieiwfa>2.0.co;2, 1995.
Su, L., Yuan, Z., Fung, J. C. H., and Lau, A. K. H.: A comparison of HYSPLIT backward trajectories generated from two GDAS datasets, Sci. Total Environ., 506–507, 527–537, https://doi.org/10.1016/j.scitotenv.2014.11.072, 2015.
Sun, Q., Miao, C., Duan, Q., Ashouri, H., Sorooshian, S., and Hsu, K.: A Review of Global Precipitation Data Sets: Data Sources, Estimation, and Intercomparisons, Rev. Geophys., 56, 79–107, https://doi.org/10.1002/2017rg000574, 2018.
Todd, D. L., Keene, W. C., Moody, J. L., Maring, H., and Galloway, J. N.: Effects of wet deposition on optical properties of the atmosphere over Bermuda and Barbados, J. Geophys. Res.-Atmos., 108, 4099, https://doi.org/10.1029/2001jd001084, 2003.
Tunved, P., Ström, J., and Krejci, R.: Arctic aerosol life cycle: linking aerosol size distributions observed between 2000 and 2010 with air mass transport and precipitation at Zeppelin station, Ny-Ålesund, Svalbard, Atmos. Chem. Phys., 13, 3643–3660, https://doi.org/10.5194/acp-13-3643-2013, 2013.
Veron, A. J., Church, T. M., Patterson, C. C., Erel, Y., and Merrill, J. T.: Continental Origin and Industrial Sources of Trace-Metals in the Northwest Atlantic Troposphere, J. Atmos. Chem., 14, 339–351, https://doi.org/10.1007/BF00115243, 1992.
Wang, Q., Jacob, D. J., Fisher, J. A., Mao, J., Leibensperger, E. M., Carouge, C. C., Le Sager, P., Kondo, Y., Jimenez, J. L., Cubison, M. J., and Doherty, S. J.: Sources of carbonaceous aerosols and deposited black carbon in the Arctic in winter-spring: implications for radiative forcing, Atmos. Chem. Phys., 11, 12453–12473, https://doi.org/10.5194/acp-11-12453-2011, 2011.
Wang, Y. Q., Zhang, X. Y., and Draxler, R. R.: TrajStat: GIS-based software that uses various trajectory statistical analysis methods to identify potential sources from long-term air pollution measurement data, Environ. Modell. Softw., 24, 938–939, https://doi.org/10.1016/j.envsoft.2009.01.004, 2009.
Weinstock, B.: Carbon Monoxide: Residence Time in the Atmosphere, Science, 166, 224–225, https://doi.org/10.1126/science.166.3902.224, 1969.
Wesely, M. L.: Parameterization of surface resistances to gaseous dry deposition in regional-scale numerical models, Atmos. Environ., 23, 1293–1304, https://doi.org/10.1016/0004-6981(89)90153-4, 1989.
Wolff, G. T., Ruthkosky, M. S., Stroup, D. P., Korsog, P. E., Ferman, M. A., Wendel, G. J., and Stedman, D. H.: Measurements of SOx, NOx and Aerosol Species on Bermuda, Atmos. Environ., 20, 1229–1239, https://doi.org/10.1016/0004-6981(86)90158-7, 1986.
Wu, S., Mickley, L. J., Jacob, D. J., Logan, J. A., Yantosca, R. M., and Rind, D. Why are there large differences between models in global budgets of tropospheric ozone?, J. Geophys. Res.-Atmos., 112, 1–18, https://doi.org/10.1029/2006JD007801, 2007.
Yu, H., Yang, Y., Wang, H., Tan, Q., Chin, M., Levy, R. C., Remer, L. A., Smith, S. J., Yuan, T., and Shi, Y.: Interannual variability and trends of combustion aerosol and dust in major continental outflows revealed by MODIS retrievals and CAM5 simulations during 2003–2017, Atmos. Chem. Phys., 20, 139–161, https://doi.org/10.5194/acp-20-139-2020, 2020.
Yu, K., Keller, C. A., Jacob, D. J., Molod, A. M., Eastham, S. D., and Long, M. S.: Errors and improvements in the use of archived meteorological data for chemical transport modeling: an analysis using GEOS-Chem v11-01 driven by GEOS-5 meteorology, Geosci. Model Dev., 11, 305–319, https://doi.org/10.5194/gmd-11-305-2018, 2018.
Zhang, B., Liu, H., Crawford, J. H., Chen, G., Fairlie, T. D., Chambers, S., Kang, C.-H., Williams, A. G., Zhang, K., Considine, D. B., Sulprizio, M. P., and Yantosca, R. M.: Simulation of radon-222 with the GEOS-Chem global model: emissions, seasonality, and convective transport, Atmos. Chem. Phys., 21, 1861–1887, https://doi.org/10.5194/acp-21-1861-2021, 2021.