the Creative Commons Attribution 4.0 License.
the Creative Commons Attribution 4.0 License.
 | 26 Oct 2021
Exploring the sensitivity of atmospheric nitrate concentrations to nitric acid uptake rate using the Met Office's Unified Model
Anthony C. Jones
Adrian Hill
Samuel Remy
N. Luke Abraham
Mohit Dalvi
Catherine Hardacre
Alan J. Hewitt
Ben Johnson
Jane P. Mulcahy
Steven T. Turnock
Ammonium nitrate is a major aerosol constituent over many land regions and contributes to air pollution episodes, ecosystem destruction, regional haze, and aerosol-induced climate forcing. Many climate models that represent ammonium nitrate assume that the ammonium–sulfate–nitrate chemistry reaches thermodynamic equilibrium instantaneously without considering kinetic limitations on condensation rates. The Met Office's Unified Model (UM) is employed to investigate the sensitivity of ammonium nitrate concentrations to the nitric acid uptake coefficient (γ) in a newly developed nitrate scheme in which first-order condensation theory is utilised to limit the rate at which thermodynamic equilibrium is attained. Two values of γ representing fast (γ=0.193) and slow (γ=0.001) uptake rates are tested in 20-year global UM integrations. The global burden of nitrate associated with ammonium in the “fast” simulation (0.11 Tg[N]) is twice as great as in the “slow” simulation (0.05 Tg[N]), while the top-of-the-atmosphere radiative impact of representing nitrate is −0.19 W m−2 in the fast simulation and −0.07 W m−2 in the slow simulation. In general, the fast simulation exhibits better spatial correlation with observed nitrate concentrations, while the slow simulation better resolves the magnitude of concentrations. Local near-surface nitrate concentrations are found to be highly correlated with seasonal ammonia emissions, suggesting that ammonia is the predominant limiting factor controlling nitrate prevalence. This study highlights the high sensitivity of ammonium nitrate concentrations to nitric acid uptake rates and provides a novel mechanism for reducing nitrate concentration biases in climate model simulations. The new UM nitrate scheme represents a step change in aerosol modelling capability in the UK across weather and climate timescales.
- Article
(6175 KB) - Full-text XML
-
Supplement
(4058 KB) - BibTeX
- EndNote


Air pollution poses a significant hazard to human health and to the environment worldwide. In 2016, 90 % of the global population was exposed to pollutant concentrations in excess of World Health Organisation (WHO)-defined safe levels, resulting in ∼7 million premature deaths (WHO, 2020). Specific human health conditions arising from air pollution exposure include lung cancer and cardiopulmonary disease, and deleterious impacts also extend to ecosystems (e.g. eutrophication, loss of biodiversity, acid deposition), building and infrastructure erosion, and impaired atmospheric visibility and regional haze (Kucera and Fitz, 1995; Monks et al., 2009; Lovett et al., 2009; Xu et al., 2019). Solid or liquid particulate matter (PM) is a significant component of air pollution, and particles with diameters less than 2.5 µm (i.e. PM2.5) are particularly harmful to human health. Lelieveld et al. (2015) estimate PM2.5-related global mortality to be 3.3 million deaths per year in 2010, far greater than the second deadliest air pollutant, ozone (O3, 142 thousand deaths per year). Sources of air pollution differ with region; in northern Africa and the Middle East, the predominant source is naturally emitted dust; in Europe, agricultural activity; and in Southeast Asia, residential energy production (Lelieveld et al., 2015).
Secondary inorganic ammonium (NH4), sulfate (SO4), and nitrate (NO3) aerosol form a major part of PM2.5 composition in the Northern Hemisphere (Jimenez et al., 2009). Ammonium is predominantly emitted as ammonia (NH3) gas by agricultural sources such as mineral fertiliser application and volatilisation of livestock manure, biomass burning, and from oceans (Bauer et al., 2016). NH3 emissions from agriculture have dramatically increased since the discovery of the Haber–Bosch process for extracting reactive nitrogen from its stable atmospheric form (N2) in the early 20th century. The corresponding NH3-based fertiliser revolution led to significantly enhanced global food production and a population explosion from 2 billion to 7 billion people (Smith et al., 2020). However, reactive nitrogen deposition from fertiliser usage is now 20-fold higher than it was before the industrial revolution, leading to environmental degradation (Xu et al., 2019). NO3 is formed from atmospheric nitric acid (HNO3), itself an oxidation product of nitrogen oxides (). NOx is primarily emitted from anthropogenic fossil fuel burning (21–28 Tg N yr−1) but has natural sources including soil emissions, biomass burning, and lightning (12–35 Tg N yr−1) (Seinfeld and Pandis, 1998; Vinken et al., 2014). NOx exacerbates air pollution via two pathways – by NO3 aerosol production and by net O3 production in the presence of sunlight and volatile organic compounds (VOCs) (Crutzen, 1970). SO4 is the oxidation product of sulfur dioxide (SO2), which is primarily emitted by anthropogenic processes such as fossil fuel combustion, petroleum refining, and metal smelting (Zhong et al., 2020). Natural SO2 sources include volcanic degassing and the oxidation of reduced natural sulfurous compounds such as dimethyl sulfide (DMS) (Carn et al., 2017). Global anthropogenic SO2 emissions have steadily declined from a peak of ∼70 Tg S yr−1 in the 1980s to ∼52 Tg S yr−1 in 2014, owing to clean air regulation instigated to mitigate adverse SO2 impacts such as acid rain and also for human health benefits (McDuffie et al., 2020; Zhong et al., 2020). Global NOx emissions peaked in 2010 at ∼40 Tg N yr−1, with emissions growth from 1990–2010 driven by rapid industrialisation in Asia and intensified international shipping, but have decreased by 7 % over the 2010s, owing primarily to traffic emission control measures in China (McDuffie et al., 2020).
In the troposphere, NOx is involved in a complex diurnal photochemical cycle involving VOCs and O3. The dominant NOx removal mechanism during daytime is via oxidation by hydroxyl (OH) radicals to form HNO3 (Seinfeld and Pandis, 1998). At night-time, NO2 is unable to photolyse and the dominant NOx removal mechanism is via reaction with O3 to produce the NO3 radical, which further reacts with NO2 to form dinitrogen pentoxide (N2O5), which heterogeneously reacts with water (H2O) to produce HNO3 (Atkinson, 2000). HNO3 is highly soluble and rapidly dissolves in water droplets or is neutralised by NH3 to form aerosol. SO2 is oxidised in the aqueous phase by dissolved oxidants such as O3 and hydrogen peroxide (H2O2) and in the gas phase by OH to form non-volatile H2SO4 (Seinfeld and Pandis, 1998). H2SO4 and HNO3 react with NH3 to produce ammonium sulfate ((NH4)2SO4) and semi-volatile ammonium nitrate (NH4NO3) aerosol respectively, with H2SO4 neutralisation taking precedence owing to the lower vapour pressure of H2SO4 over HNO3 (Hauglustaine et al., 2014). In a slower process, HNO3 also condenses irreversibly onto existing dust and sea-salt aerosols, forming calcium nitrate (Ca(NO3)2) and sodium nitrate (NaNO3) salts respectively (Li and Shao, 2009). Owing to the prevalence of anthropogenic NOx and NH3 sources, particulate NO3 is a major component of urban air pollution. For example, in Europe NO3 constitutes 17 % of urban PM2.5 aerosol by mass (Putaud et al., 2004), while NH4NO3 can comprise 75 % of PM2.5 in air pollution events in Salt Lake City (Womack et al., 2019).
Nitrate aerosol has an enigmatic history within the climate modelling community owing to the complexity of modelling HNO3 neutralisation by NH3 and the semi-volatility of NH4NO3 aerosol. In the inorganic aerosol system, gaseous and particulate equilibria are reached at different rates due to evolving temperature and acidity constraints and the variability in gaseous uptake with particle size (Myhre et al., 2006; Benduhn et al., 2016). Although complex dynamical and “hybrid dynamical” schemes that fully or partially resolve the chemistry of inorganic aerosol exist (e.g. Jacobson, 1997; Feng and Penner, 2007; Zaveri et al., 2007; Benduhn et al., 2016; Xu and Penner, 2012), they remain computationally expensive – owing to the numerical stiffness of the inorganic system – when compared to schemes that assume thermodynamic equilibrium is reached instantaneously (Nenes et al., 1998). Most of the current crop of nitrate-resolving global climate models (GCMs) and some regional climate models (RCMs) assume the instantaneous thermodynamic equilibrium approximation (Liao et al., 2003; Myhre et al., 2006; Bauer et al., 2007; Bellouin et al., 2011; Hauglustaine et al., 2014; Paulot et al., 2016; Bian et al., 2017; Rémy et al., 2019). Dynamical models have the advantage of capturing natural phenomena where the inorganic aqueous system is outside of (or slow to reach) equilibrium, e.g. in low gas concentrations, low temperatures, high relative humidities (RHs), and for condensation onto coarse particles (Wexler and Seinfeld, 1990; Benduhn et al., 2016). Thermodynamic equilibrium models typically overestimate the fraction of NO3 in the coarse mode; for example, in one study NO3 associated with fine-mode NH4NO3 was underestimated by 25 % compared to a hybrid-dynamical model (Feng and Penner, 2007). However, the additional computational expense of using dynamical approaches has motivated the climate modelling community to seek pragmatic solutions to represent NH4 and NO3 aerosol in GCMs and RCMs.
GCM simulations suggest that the present-day direct radiative forcing from NO3 (global mean W m−2) amounts to a quarter of the SO4 forcing on a global-mean basis (Myhre et al., 2006; Bauer et al., 2007; Bellouin et al., 2011; Hauglustaine et al., 2014). NO3 aerosol burdens are widely projected to increase over the 21st century as a result of stricter SO2 emissions regulations and continued elevated NH3 emissions, which would reduce the SO4 available for neutralisation and concomitantly liberate NH4 for NH4NO3 formation (Bauer et al., 2007; Bellouin et al., 2011). Consequently, NO3 may become the dominant aerosol species in terms of radiative and urban air pollution impact by the end of the century, depending on future emissions of SO2, NH3, and NOx (Hauglustaine et al., 2014). Such NO3 concentration enhancements may be effectively mitigated on a regional basis by judicious regulation targeting anthropogenic NH3 and/or NOx emissions (Bauer et al., 2016). However, climate models disagree as to whether near-surface NO3 concentrations will increase or decrease in future climate and on the correct partitioning between NO3 in the fine mode (associated with NH4) and coarse mode (associated with dust and sea salt) (Bian et al., 2017). Many of the uncertainties in NH4 and NO3 projections emanate from different treatments of the HNO3 and NH3 gases in models, with Bian et al. (2017) highlighting wet deposition as a particularly sensitive process. Additionally, the vertical distributions of HNO3 and NH3 are poorly constrained by observations, which adds to uncertainty in NH4 and NO3 projections (Paulot et al., 2016).
The emerging conclusion from observations and from the burgeoning literature on nitrate modelling is that ammonium nitrate poses an increasingly significant health hazard through urban air pollution (e.g. DEFRA, 2012) and via deposition to nitrogen-saturated ecosystems (Li et al., 2016); they potentially could become a major climate forcing agent as SO4 concentrations wane (Hauglustaine et al., 2014). The impetus for explicitly representing NH4 and NO3 in GCMs is clear, even by using simple thermodynamic equilibrium approaches which bypass temporal nuances in the gas–particulate partitioning. The Met Office Unified Model (UM) has previously incorporated a thermodynamic-equilibrium ammonium nitrate scheme in the CMIP5-generation climate model Hadley Centre Global Environment Model version 2 (HadGEM2-ES) (Bellouin et al., 2011). This nitrate scheme – developed within the single-moment Coupled Large-scale Aerosol Simulator for Studies in Climate (CLASSIC) aerosol framework (Bellouin et al., 2011) – continues to be utilised for online air quality forecasts across the UK in the operational Air Quality Unified Model (AQUM) (Savage et al., 2013). However, the CMIP6-generation state-of-the-art United Kingdom Earth System Model version 1 (UKESM1) which incorporates the Global Atmosphere model vn7.1 (GA7.1) (Walters et al., 2019) replaced the single-moment CLASSIC aerosol scheme with the double-moment Global Model of Aerosol Processes modal (GLOMAP-mode) scheme which currently omits ammonium nitrate (Mann et al., 2010; Mulcahy et al., 2020). Mulcahy et al. (2020) attributed a negative bias in aerosol optical depth and mass burden over Northern Hemisphere continents in UKESM1 to the missing NH4 and NO3. The hybrid-dynamical nitrate scheme developed by Benduhn et al. (2016) in the stand-alone GLOMAP-mode model is not currently implemented in the UM. This has provided the Met Office with fresh impetus to develop a simplified thermodynamic equilibrium nitrate scheme within the GLOMAP-mode framework for interim use in the UM and possible implementation in future generations of UKESM, in order to address the gaps in modelled NH4 and NO3 with their respective observations. The nitrate scheme may garner further utility if AQUM or its successor transitions to utilising the GLOMAP-mode aerosol scheme rather than CLASSIC (Hemmings and Savage, 2018).
In this paper we describe the development and testing of a simple thermodynamic equilibrium nitrate scheme in the UM and explore the sensitivity of the scheme to a key parameter that is poorly constrained by observations – the HNO3 uptake coefficient on aerosol surfaces (γ). Specifically, most models assume that NH4NO3 concentrations reach thermodynamic equilibrium instantaneously without considering kinetic limitations on the condensation of HNO3 or NH3 onto existing aerosol particles, as is considered here. This is the first study to investigate the sensitivity of NH4NO3 concentrations to the HNO3 uptake coefficient and provide an efficient method for reducing NO3 concentration biases in GCMs. The UM nitrate scheme reported here comprises fine NH4 and NO3 aerosol in the Aitken, accumulation, and coarse soluble modes and coarse NO3 representing NO3 aerosol associated with dust and sea salt in the accumulation and coarse soluble modes. NH4NO3 mostly remains in the Aitken and accumulation modes and thus the moniker “fine” is appropriate. The scheme was originally developed by Hauglustaine et al. (2014) for use in the LMDZ-INCA climate model and then adapted for ECMWF's version of GLOMAP-mode by Rémy et al. (2019), following which it was kindly provided to the Met Office for adaptation to the UM. In Sect. 2.1, we describe the configuration of the UM used to test the new nitrate scheme. In Sect. 2.2, we describe the thermodynamic equilibrium nitrate model in detail. In Sect. 2.3, we describe the simulations performed in this study. In Sect. 3, we evaluate the model using surface and satellite observations and investigate the sensitivity of the model to perturbations to a key parameter – the HNO3 uptake coefficient (γ) – in a manner analogous to Bauer et al. (2004). In Sect. 4, we discuss the utility of the nitrate scheme and provide a roadmap for future development and integration within UKESM.
2.1 The Met Office Unified Model (UM)
The nitrate scheme was originally developed using the UM with the science configurations Global Atmosphere vn7.1 (GA7.1) and Global Land vn7.0 (GL7.0) (Walters et al., 2019). Although the UM can be run at various resolutions, the resolution used here is the climate configuration N96L85, i.e. 1.875∘ longitude by 1.25∘ latitude with 85 vertical levels up to a model lid at 80 km, with 50 levels below 18 km altitude, and a model time step of 20 min (Walters et al., 2019). Further details of the UM configuration are provided in Sect. S1 in the Supplement.
In the model configuration used here, GA7.1 includes the United Kingdom Aerosol and Chemistry (UKCA) model which simulates atmospheric composition in the Earth System, with UKCA chemistry called once per model hour in N96L85, although emissions are evaluated every model time step (Archibald et al., 2020). UKCA is coupled to the GLOMAP-mode aerosol scheme, permitting a holistic and prognostic treatment of aerosol and chemical processes over the entire atmosphere (Mann et al., 2010; Mulcahy et al., 2020). The coupled UKCA and GLOMAP-mode model is widely referred to as UKCA-mode. The Met Office's Hadley Centre Global Climate version 3.1 (HadGEM3-GC3.1) model – the physical basis of UKESM1 – uses a simplified UKCA chemistry configuration with important oxidants (O3, OH, NO3, HO2) prescribed as monthly-mean climatologies (Walters et al., 2019; Mulcahy et al., 2020). This is of insufficient complexity for ammonium nitrate aerosol, given the importance of missing gases (i.e. HNO3, NH3 and precursors) and chemical reactions. Instead the combined Stratosphere–Troposphere version 1.0 (StratTrop1.0) chemistry scheme, which is included in UKESM1 (Sellar et al., 2019) and described in detail by Archibald et al. (2020), is utilised here. Although not mentioned in Archibald et al. (2020), gaseous ammonia (NH3) is a passive tracer in StratTrop1.0, while gaseous nitric acid (HNO3) is the product of various atmospheric chemical reactions (see Table S1 in the Supplement). Further details of the nitrogen chemistry in StratTrop1.0 is provided in Sect. 2.2. Gaseous dissolution in cloud droplets is modelled using the effective Henry's law framework, with UKCA uniformly assuming a fixed cloud water pH of 5.0. We address the assumption of a fixed pH in Sect. 4. Values required to calculate the effective Henry's law coefficients are specified as KH (298 K) , 1.23, and 1×10⁶ M atm−1 for HNO3, SO2, and NH3 respectively, and , 3020, and 0 K−1 for HNO3, SO2, and NH3 respectively (Archibald et al., 2020). The values for NH3 are comparable to AeroCom phase III values given in Table 5 in Bian et al. (2017).
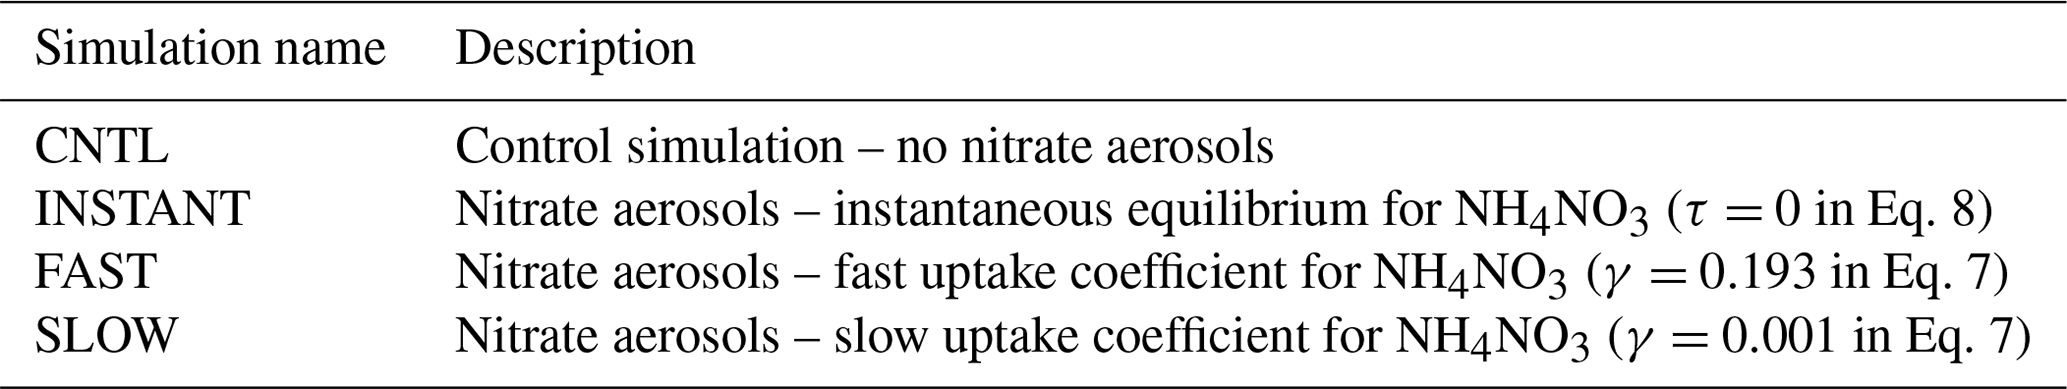
Table 1Properties of the aerosol size distribution in the nitrate UKCA-mode setup including the size range of the modes, the geometric standard deviation, and the permitted aerosol species in each mode. Species include sulfate (SO4), black carbon (BC), organic matter (OM), and sea salt (SS) as well as the newly added ammonium (NH4), nitrate (NO3), and coarse nitrate (coarseNO3). Adapted from Table 1 in Mulcahy et al. (2020).
GLOMAP-mode is a prognostic double-moment aerosol scheme that carries aerosol mass and number concentrations in four soluble lognormal modes spanning sub-micron to super-micron sizes (nucleation, Aitken, accumulation, and coarse), as well an insoluble Aitken mode (see Table 1) (Mann et al., 2010; Mulcahy et al., 2020). The variable size distribution allows the median dry radius to evolve within prescribed size brackets, while the lognormal standard deviation or “mode width” is held fixed. GA7.1's default GLOMAP-mode configuration includes the aerosols sulfate (SO4), black carbon (BC), organic matter (OM), and sea salt (SS), with species in each mode treated as an internal mixture. Mineral dust is represented in GA7.1 by the CLASSIC six-bin scheme described by Woodward et al. (2001). Aerosol water content is simulated prognostically using the Zdanovskii–Stokes–Robinson (ZSR) method, allowing for a more accurate representation of aerosol–cloud interactions and aerosol radiative impact than in CLASSIC. The direct aerosol radiative effect is modelled using UKCA-RADAER, which utilises pre-determined look-up tables of Mie extinction parameters based on aerosol size and composition (Bellouin et al., 2013).
2.2 Nitrate model
In addition to the standard aerosols in GA7.1 – SO4, BC, OM, and SS – ammonium (NH4), nitrate (NO3), and coarse nitrate (herein denoted coarseNO3 for convenience) are added to a new UKCA-mode setup which comprises 28 aerosol tracers in total (Table 1). Note that “NO3” refers solely to NO3 associated with NH4, while “coarseNO3” refers to NO3 associated with dust and sea salt. NH4 and NO3 mass is emitted into the Aitken and accumulation soluble modes and may be transferred to the coarse soluble mode via aerosol processing, while coarseNO3 is limited to the accumulation and coarse soluble modes. Nitrate chemistry is evaluated once per model time step within the UKCA emissions-control routine. The nitrate model closely follows Hauglustaine et al. (2014) and Rémy et al. (2019) with subtle yet important differences. An exhaustive step-by-step methodology is provided in the Supplement (Sects. S2 and S3) and outlined below.
2.2.1 Ammonium nitrate production
Fine-mode ammonium nitrate production is evaluated before the condensation of HNO3 onto coarse aerosols (e.g. sea salt and dust), because smaller particles generally reach thermodynamic equilibrium faster (Hauglustaine et al., 2014; Benduhn et al., 2016). Firstly, the sulfate neutralisation state () is determined from the total moles of ammonia () and total moles of sulfate (TS={SO4}) using Eq. (1) (Metzger et al., 2002).
The moles of ammonia available for neutralisation of HNO3 following the irreversible production of ammonium sulfate is then . If all free ammonia is consumed by the neutralisation of SO4 (), then no new nitrate is formed. However, if ammonia is available (), then the equilibrium constant (Kp) of the ammonia–nitrate system (Eq. 2) is determined using the parameterisation of Mozurkewich (1993) (see Sect. S2). In this formulation, Kp is solely a function of temperature and deliquescence relative humidity (DRH), with DRH following the parameterisation of Seinfeld and Pandis (1998).
The equilibrium concentration of ammonium nitrate is then calculated using the formulation from Seinfeld and Pandis (1998). Letting TN denote the total molar concentration of nitrate (), if the available nitrate and ammonia suggest that Eq. (2) is in the forward direction, thereby promoting the condensation of HNO3 and NH3 to form ), then the equilibrium concentration of NH4NO3 is solved using Eq. (3). Otherwise, if free ammonia or nitrate concentrations are limited such that or , then all existing ammonium nitrate aerosol evaporates, and the corresponding mass is transferred to the gas phase HNO3 and NH3.
The ammonia–nitrate system may not reach equilibrium within a standard GCM time step owing to transport limitations between the gas and aerosol phases (Wexler and Seinfeld, 1990). The time taken to reach equilibrium depends on ambient temperature and RH, as well as the aerosol size and uptake coefficient (γ), where the uptake coefficient is defined as the number of gas molecules condensing on a particle divided by the number impacting onto the particle surface. Ackermann et al. (1995) find that equilibration time (τ) may range from ∼2 min for particles with diameters of 0.1 µm to ∼1 h for diameters of 0.5 µm, depending on the uptake rate. Rémy et al. (2019) assumed a globally uniform equilibration time of τ=2 min in their nitrate model. Here the uptake rate is determined for each aerosol mode online (Aitken, accumulation, and coarse soluble) using the first-order uptake theory of Schwartz (1986) and by applying the Fuchs and Sutugin (1970) correction factors for molecular effects and for limitations in interfacial mass transport (Eqs. 4–7).
Equations (4)–(7) determine the molecular diffusivity coefficient (Dg, m2 s−1), the mean free path (λ, m), the Knudsen number (Kn)., and the modal condensation or uptake rate (, m3 s−1) respectively. Constants in the algorithm include the Avogadro constant mol−1, the gas constant of dry air Ra=8.314 J mol−1 K−1, the molar mass of dry air ma=0.029 kg mol−1, the molar mass of HNO3 kg mol−1, the molecular diameter of dry air molecules m, and the reactive uptake coefficient (γ) for HNO3. Variables in Eqs. (4)–(7) include the air temperature T (K) and air density ρa (kg m−3). In Eq. (5), υ is the mean molecular speed (m s−1). The total equilibration time τ (s) may then be related to the inverse of product of the uptake rate for one particle and the aerosol number concentration N using Eq. (8). Note that ammonium nitrate production is limited to the Aitken and accumulation modes in this study, which is reflected in the formulation of τ.
Rather than assume instantaneous thermodynamic equilibrium in the ammonia–nitrate system, the model assumes an exponential decay of the gas phase towards equilibrium using the equilibration time τ (see Sect. S2.4). This approach has also been used by Ackermann et al. (1995), Makar et al. (1998), and Rémy et al. (2019). Figure S2 shows the results of applying the above algorithm for τ (with γ set to 0.193 following Feng and Penner, 2007) to monthly-mean aerosol and meteorology output from example UM integrations. Over many land regions, τ is approximately 2 min near the surface and increases to ∼15 min at a model level height of 3000 m. Therefore, assuming a constant value of τ=2 min, as assumed by Rémy et al. (2019), may significantly overestimate the rate which the ammonia–nitrate system approaches equilibrium, particularly at higher altitudes and over maritime regions. For example, in a 20 min time step the ammonia–nitrate system would move 99.995 % of the way from initial conditions towards equilibrium with τ=2 min assuming exponential decay, but only 86 % of the way with τ=10 min and 33 % of the way with τ=50 min.
For standard atmospheric conditions ( m2 s−1 and υ=300 m s−1), scales approximately linearly with the reactive uptake coefficient γ, for γ from 0.001 to 0.2 and for particle diameters between D=0.1 µm and D=5 µm (Fig. S3). The uptake rate increases on a particle-by-particle basis with diameter, for example, ranging from 0.2 s−1 for D=0.1 µm to 5 s−1 for D=0.5 µm when γ=0.1 and when is normalised by N=1012 m−3. However, atmospheric Aitken mode number concentrations generally exceed accumulation mode concentrations, particularly over populous land regions and increasingly with altitude. Exceptions to this include near the surface over high-latitude maritime regions, Amazonia, and much of Australasia, where accumulation number concentration exceeds Aitken concentrations on an annual-mean basis in the UM. In example UM integrations, the ratio of accumulation to Aitken uptake ( decreases on a global-mean basis from 8 at the surface to 1.4 at a model level height of 3000 m, but it is effectively unity at the surface over key NH3- and NOx-emitting regions such as the USA, Europe, and South Asia (Fig. S4).
Uptake rates (, Eq. 7) are determined for the Aitken and accumulation modes by using the modal geometric-mean dry diameters for D in Eqs. (4)–(7), which are first corrected for hygroscopic growth using the RH-dependent parameterisation by Gerber et al. (1985). This simplified “modal” approach differs from Hauglustaine et al. (2014), who divide aerosol size modes into sub-bins. If the available nitrate and ammonia suggest that the equilibrium of Reaction (R2) is in the forward direction, thereby promoting the condensation of HNO3 and NH3 to form NH4NO3 ), then mass is transferred from the gaseous reactants NH3 and HNO3 to NH4 and NO3 in the Aitken and accumulation soluble modes using the above algorithm. Otherwise, if , then NH4 and NO3 dissociate, and all NH4 and NO3 mass in the Aitken to coarse soluble modes is instantaneously transferred to the gas phase. Ammonium nitrate chemistry primarily involves condensation and evaporation (Makar et al., 1998; Benduhn et al., 2016), although Wang et al. (2020) have shown that NH3 and HNO3 can condense onto nanoparticles and thus contribute to nucleation events, which may be of importance in urban settings and at high altitudes. In this model, aerosol number concentrations are not altered explicitly by nitrate chemistry (assuming condensation and evaporation are more important than nucleation) but may change indirectly due to altered coagulation and mode-merging rates arising from the additional aerosol mass. This approach differs from Hauglustaine et al. (2014) and Rémy et al. (2019), who assume that new particles are nucleated by the production of ammonium nitrate.
2.2.2 Coarse nitrate production
Following NH4NO3 production and the associated update to HNO3 concentrations, the first-order uptake parameterisation described by Eqs. (4)–(7) is further employed to model the irreversible uptake of HNO3 on sea salt and dust to produce NaNO3 (Eq. 9) and Ca(NO3)2 (Eq. 10) respectively (Liao et al., 2003; Hauglustaine et al., 2014).
The methodology is mostly unchanged from Hauglustaine et al. (2014) and Rémy et al. (2019), with only subtle adaptations needed to integrate the scheme within UKCA-mode. As in Hauglustaine et al. (2014), the HNO3 uptake coefficients (γ) for dust and sea salt are RH-dependent variables based on measurements from Fairlie et al. (2010) for dust and Sander et al. (2011) for sea salt. Additionally, dust is assumed to uniformly constitute 5 % Ca2+ by mass as in Hauglustaine et al. (2014), which differs from the approach in Rémy et al. (2019), who used a spatially heterogeneous Ca2+ fraction more akin to observations. Dust alkalinity is titrated by uptake of HNO3 until the dust pH is neutralised whereupon HNO3 stops condensing (Fairlie et al., 2010; Hauglustaine et al., 2014), while no such limitation is necessary for sea salt which generally constitutes a higher fraction of Na+ ions per mass than dust constitutes Ca2+ (e.g. Xiao et al., 2018).
As for the first-order uptake parameterisation for ammonium nitrate (Sect. 2.2.1) and in Rémy et al. (2019) rather than explicitly integrating the uptake rate over the aerosol size distribution, is calculated individually for sea salt in the accumulation and coarse modes using the modal geometric-mean diameters for D in Eqs. (4)–(7) and individually for each CLASSIC dust bin using fixed geometric-mean diameters (see Sect. S3). Sea-salt number concentrations for the two modes are inversely determined from the sea-salt mass concentrations and the modal geometric-mean dry diameters, which implicitly assumes that sea salt is externally mixed with other UKCA-mode aerosols. Dust particle number concentrations are determined from prognostic dust mass concentrations and fixed size distributions for each bin. Mapping between CLASSIC's six dust bins and UKCA-mode's two size modes follows the approach currently used to map dust emissions between CLASSIC and UKCA-mode, with bin 2 and half of bin 3 mapped to the accumulation mode and the other half of bin 3 and bins 4, 5, and 6 mapped to the coarse mode. The dust and sea-salt uptake rates (k) multiplied by the equivalent particle number concentrations (N) are then used to determine tendencies to mass concentrations of coarse NO3 aerosol (coarseNO3), sea salt (SS), and HNO3 gas (Eqs. 11–13). The constants in Eqs. (11)–(13) include the molar mass of Ca(NO3)2 kg mol−1, the molar mass of NaNO3 kg mol−1, the molar mass of HNO3 kg mol−1, and the molar mass of NaCl mNaCl=0.05844 kg mol−1.
2.2.3 Technical UM modifications
UKCA-RADAER calculates 3D aerosol extinction properties for each lognormal mode online as a function of aerosol composition and size, which are then utilised directly within the UM's radiative transfer code (Bellouin et al., 2013). Each aerosol species requires prescribed spectral refractive indices (RIs) spanning the electromagnetic spectrum from ultraviolet (0.2 µm) to radio waves (1 cm). Ammonium nitrate RIs have previously been compiled for an older generation of the UM (HadGEM2-ES) (Bellouin et al., 2011). For NH4NO3, real and imaginary RIs for the wavelength spectrum 2–20 µm are taken from Jarzembski et al. (2003), while RIs for >20 µm are assumed to be that at 20 µm. Real RIs for 0.59–1.61 µm are from the CRC Handbook of Chemistry and Physics (Weast, 1971) and are then extended to cover the 0.1–2 µm spectrum. Imaginary RIs for the ultraviolet and visible spectra (<0.7 µm) are arbitrarily set to a small number assuming little absorption ().
To optically represent the coarse NO3 aggregate coarseNO3, NaNO3 spectral RIs have been compiled from the literature for this study. RI values are mostly from the tabulated data by Palik and Khanna (1998) and references therein for solid birefringent NaNO3 crystals. From 0.23–0.42 µm, imaginary RIs are determined by applying the Beer–Lambert law to Cleaver et al. (1963) absorption coefficients and assuming a lattice thickness of 3 µm, as in Jacobson (1999). This approach is necessary to account for the second UV absorption peak missing in the data of Palik and Khanna (1998). Imaginary RIs for wavelength spectrum 0.42–5.88 µm appear not to have been measured and are pragmatically set to the observed values for NH4NO3, which are from Gosse et al. (1997) for 0.7–2 µm and from Jarzembski et al. (2003) for 2–5.88 µm. As is the case for NH4NO3, imaginary RIs are set to an arbitrary small number () from 0.42–0.7 µm to reflect the little or no absorption in that spectrum (Palik and Khanna, 1998). For the real RIs, in the 0.4–0.65 µm spectrum values are from Cotterell et al. (2017) for measurements at 0 % relative humidity. From 0.66–0.67 µm, the real RIs are provided by Ballard et al. (1972) and for 0.7 µm from Ivlev and Popova (1972). Above wavelengths of 1 mm – the scope of the Palik and Khanna (1998) database – the real and imaginary RIs are set to the value at 1 mm. The compiled spectral RIs for NH4NO3 and NaNO3 are shown in Fig. S5 and tabulated in Tables S2 and S3.
The default configuration of UKCA-mode and by extension UKCA-RADAER, as used in UKESM1 and HadGEM3-GC3.1, represents tropospheric SO4 with (NH4)2SO4 refractive indices and (optionally) stratospheric SO4 with sulfuric acid (H2SO4) refractive indices. This is internally inconsistent given that the tropospheric SO4 is missing the considerable mass associated with NH4. The new UKCA-mode nitrate configuration presented here that includes SO4, NO3, and NH4 as separate tracers firstly apportions NH4 mass to NO3 using a 1:1 molar ratio and the NH4 remainder to SO4 using a 2:1 molar ratio (represented by NH4NO3 and (NH4)2SO4 refractive indices respectively), and then it represents remaining SO4 mass with H2SO4 refractive indices. Another internal inconsistency in the default UKCA-mode configuration is that NH4 is not explicitly represented during hygroscopic growth (i.e. in the ZSR algorithm), owing to the lack of an NH4 tracer. In the new nitrate scheme, NH4, NO3, and coarseNO3 are explicitly added to the hygroscopic growth routine, with NH4 counteracting hygroscopic aerosol growth and NO3 and coarseNO3 promoting it.
Table 2A description of the UM simulations performed in this study.
2.3 Simulation design
The scientific purpose of this study is to investigate whether representing the kinetic limitation of HNO3 condensation onto pre-existing aerosols during the production of ammonium nitrate significantly alters the resulting atmospheric concentrations of ammonium nitrate and, indirectly, coarse nitrate aerosol. To this end, four sensitivity simulations are performed with the UM and the new nitrate scheme: (1) a control simulation with no nitrate aerosol and the default UKCA-mode setup 2 (i.e. standard GA7.1) (CNTL); (2) a simulation with NH4NO3 reaching equilibrium instantaneously (INSTANT); (3) a simulation with the HNO3 uptake rate set to γ=0.193 in Eq. (7) following Feng and Penner (2007) (FAST); and (4) a simulation with the HNO3 uptake rate set to γ=0.001 in Eq. (7) following Bauer et al. (2007) (SLOW). These simulations are further listed in Table 2 and were selected to span the range of HNO3 uptake rates on standard atmospheric particles from the literature (Bauer et al., 2007). All simulations are run for 25 model years with only the last 20 years used for analysis.
In these simulations, GA7.1 is forced by fixed sea-surface temperature and sea-ice fields prescribed as monthly climatologies for the year 2000, created by averaging over 1995–2004 the time series data generated for CMIP6 atmosphere-only simulations. Additionally, aerosol and gaseous emissions are primarily prescribed as monthly fields from the CMIP6 historical emissions inventory (DECK/Historical CMIP6 version 6.2.0), averaged over the 1995–2004 time-period. Table S4 gives global and annual total emissions for each of the UKCA chemical species. The CMIP6 emissions inventory was derived from the Community Emissions Data System (CEDS) project which is documented by van Marle et al. (2017), Hoesly et al. (2018), and Feng et al. (2020); while its integration within the UM is detailed by Sellar et al. (2020). The simulation design (i.e. perpetual year 2000 conditions) follows standard simulation protocol for UKCA model development in the Met Office.
Global anthropogenic NH3 emissions in the year 2000 from CEDS amount to 50 Tg yr−1, in vast excess of equivalent emissions from the CMIP5-derived MACCity inventory of 37.5 Tg yr−1 (Granier et al., 2011). Hoesly et al. (2018) attribute this disparity to differing assumptions in agricultural NH3 trends and to the lack of consideration for wastewater and human waste NH3 emissions in MACCity. Such large discrepancies in NH3 emissions inventories can impact direct model–measurement comparisons which make it important to consider the spatial and temporal trends in concentrations rather than just the overall magnitudes. For this work exploring the sensitivity of NH4NO3 to thermodynamic equilibrium assumptions, the direct comparison of model performance to observations is done with the goal of understanding the degree to which thermodynamic assumptions may push the model out of realistic behaviour rather than best recreating the observations. Oceanic NH3 emissions in these simulations – which account for 26 % of total NH3 emissions – follow Bouwman et al. (1997) and biomass-burning emissions are described by van Marle et al. (2017). NH3 exhibits a strong seasonal cycle with global emissions in June–August ∼50 % greater than in December–February (Fig. S6b). The global NH3 source of ∼65 Tg yr−1 in these simulations is close to the model-mean value of 63 Tg yr−1 for GCMs participating in the AeroCom phase III nitrate experiment (Bian et al., 2017). Nitrogen oxide (NOx) emissions from anthropogenic, biomass-burning, and aircraft sources are prescribed as monthly fields from the CEDS inventory (van Marle et al., 2017; Hoesly et al., 2018). NOx emissions from soils are taken from Yienger and Levy (1995), corrected to a total source of 12 Tg[NO] yr−1 (Sellar et al., 2020). The global and annual total NOx emissions amount to 106 Tg[NO] yr−1. Further details on gas and aerosol emissions in these simulations are provided in Sect. S4.
3.1 Global and annual mean metrics
Table 3 shows global tropospheric and annual mean budgets for HNO3, NH3, NO3, and NH4 from the FAST and SLOW simulations alongside equivalent metrics from the present-day simulations of Xu and Penner (2012) (hereafter XP12), Hauglustaine et al. (2014) (hereafter HA14), and from the AeroCom model intercomparison project detailed by Bian et al. (2017) (hereafter BI17). The INSTANT simulation is near-indistinguishable from FAST using these metrics (Table S5) – suggesting that NH4NO3 concentrations in FAST reach thermodynamic equilibrium near instantaneously – and INSTANT is thus omitted from further analysis. With respect to Table 3 and to the rest of the Results section, “fine NO3” refers to NO3 associated with NH4, while “coarse NO3” refers to NO3 associated with dust and sea salt (i.e. NO3 in coarseNO3).
Table 3Global and annual-mean metrics for nitric acid (HNO3), nitrate (NO3), ammonia (NH3) and ammonium (NH4) in the FAST and SLOW simulations compared to Xu and Penner (2012) (XP12), Hauglustaine et al. (2014) (HA14), and the AeroCom phase III model intercomparison project described in Bian et al. (2017) (BI17). Square brackets in the BI17 column denoted the AeroCom inter-model range.

The net HNO3 production rates in FAST (44.1 Tg[N] yr−1) and SLOW (44.2 Tg[N] yr−1) are comparable to equivalent rates in HA14 (45.1 Tg[N] yr−1) and XP12 (38 Tg[N] yr−1). Additionally, the NH3 emissions in FAST and SLOW (53.5 Tg[N] yr−1) are comparable to HA14, XP12, and BI14 (50.5, 53.6, and 51.8 Tg[N] yr−1 respectively), suggesting that to a first-order approximation the ammonium and nitrate precursor gas emissions are commensurate on a global basis with prior studies. Total NO3 (i.e. fine + coarse) production in the FAST (22.9 Tg[N] yr−1) and SLOW (19.9 Tg[N] yr−1) simulations is significantly greater than in HA14 (14.4 Tg[N] yr−1) and XP12 (16 Tg[N] yr−1) and at the upper range of the AeroCom models in BI17 (mean =13.7, range =1.5 to 28.2 Tg[N] yr−1). This is also the case for NH4 production rates where FAST (30.4 Tg[N] yr−1) and SLOW (25.6 Tg[N] yr−1) exceed equivalent values in HA14 (17.5 Tg[N] yr−1) and BI17 (mean =23.7, range =17.8 to 29.5 Tg[N] yr−1) and are comparable with XP12 (30.5 Tg[N] yr−1). This suggests that NH4 and NO3 aerosol production in the UM is at the upper end of efficiency when compared to other existing climate models.
Significant differences between the FAST and SLOW simulations are highlighted by the global NO3 metrics in Table 3. In particular, the fine NO3 source is 6.3 Tg[N] yr−1 in FAST but only 2.7 Tg[N] yr−1 in SLOW, marking a 57 % decrease. Conversely, SLOW exhibits 5 % more coarse NO3 production than in FAST, which is likely due to the surplus HNO3 in SLOW owing to there being less fine NO3 production. The difference is equally discernible in the burdens, with 47 % of the total NO3 burden as coarse NO3 in FAST compared to 67 % in SLOW. This can be compared to a 72 % coarse fraction in HA14 and 47 % in XP12, suggesting that the FAST and SLOW coarse fractions are between the instantaneous thermodynamic equilibrium model of HA14 and hybrid dynamical nitrate scheme of XP12. Note though that intuitively the coarse ratio in FAST would be expected to be close to HA14 (given that FAST is indistinguishable from the INSTANT simulation), whereas it is closer to XP12, which is probably due to differences in the precursor gas concentrations between FAST and HA14.
The total NO3 burdens of 0.2 Tg[N] in FAST and 0.15 Tg[N] in SLOW are commensurate with 0.18 Tg[N] in HA14, 0.17 Tg[N] in XP12, and the AeroCom median of 0.14 Tg[N] in BI17. The NH3 burden in FAST (0.04 Tg[N]) is at the lower end of the AeroCom range in BI17 (0.04 to 0.7 Tg[N]), while the NH4 burden in FAST (0.42 Tg[N]) is at the upper range of BI17 models (0.13 to 0.58 Tg[N]), suggesting that NH3 is more rapidly neutralised to aerosol in the UM than in other GCMs. This corroborates the assertion that NH4 and NO3 aerosol production in the UM is at the upper end of efficiency when compared to other existing GCMs and suggests that NH3 rather than HNO3 is the limiting factor controlling NH4NO3 production in these simulations, given that the NH3 burden in FAST is negligible. In summary, Table 3 illustrates the close parity with regards global- and annual-mean metrics between the UM simulations and previous nitrate simulations with various climate models from the literature and highlights the difference in fine NO3 burdens between FAST and SLOW.
3.2 Annual mean burdens and concentrations
Figure 1 shows the annual-mean mass burdens of NH4, fine NO3, and coarse NO3 in the FAST and SLOW simulations. While units of the format “mg[N] m−2” are used in Fig. 1 and throughout the rest of the Results section, units of the format “mg[NO3] m−2” are used in the following text for direct comparison with HA14. Fine NO3 associated with NH4 is concentrated over land regions, particularly in the Northern Hemisphere. The fine NO3 burden averaged over European land is 1 mg[NO3] m−2 in SLOW and 3 mg[NO3] m−2 in FAST. The total NO3 burden over Europe is 3 mg[NO3] m−2 in SLOW and 5 mg[NO3] m−3 in FAST, which is close to the simulated present-day values of 3–4 mg[NO3] m−2 in HA14. Fine NO3 peaks in Europe over the Mediterranean at 5 mg[NO3] m−2 in SLOW and 12 mg[NO3] m−2 in FAST. South Asia exhibits the greatest regional fine NO3 burdens with 8 mg[NO3] m−2 in SLOW and 14 mg[NO3] m−2 in FAST. The total NO3 burdens over South Asia of 11 mg[NO3] m−2 in SLOW and 15 mg[NO3] m−2 in FAST are somewhat greater than equivalent values in HA14 of 5–10 mg[NO3] m−2. Conversely, the total NO3 concentrations in East Asia (China) are smaller in these simulations (5 mg[NO3] m−2 in SLOW and 9 mg[NO3] m−2 in FAST) than in HA14 (10–20 mg[NO3] m−2). Over central North America (the USA), the total NO3 burden is 2 mg[NO3] m−2 in SLOW and 5 mg[NO3] m−2 in FAST, which compares to 3–4 mg[NO3] m−2 in HA14. In summary, the fine-NO3 concentrations are similar to the simulated present-day values in HA14 on a regional basis in FAST and SLOW. Of more importance to this study, FAST exhibits twice as much fine NO3 burden on average as does SLOW in key industrialised land regions.
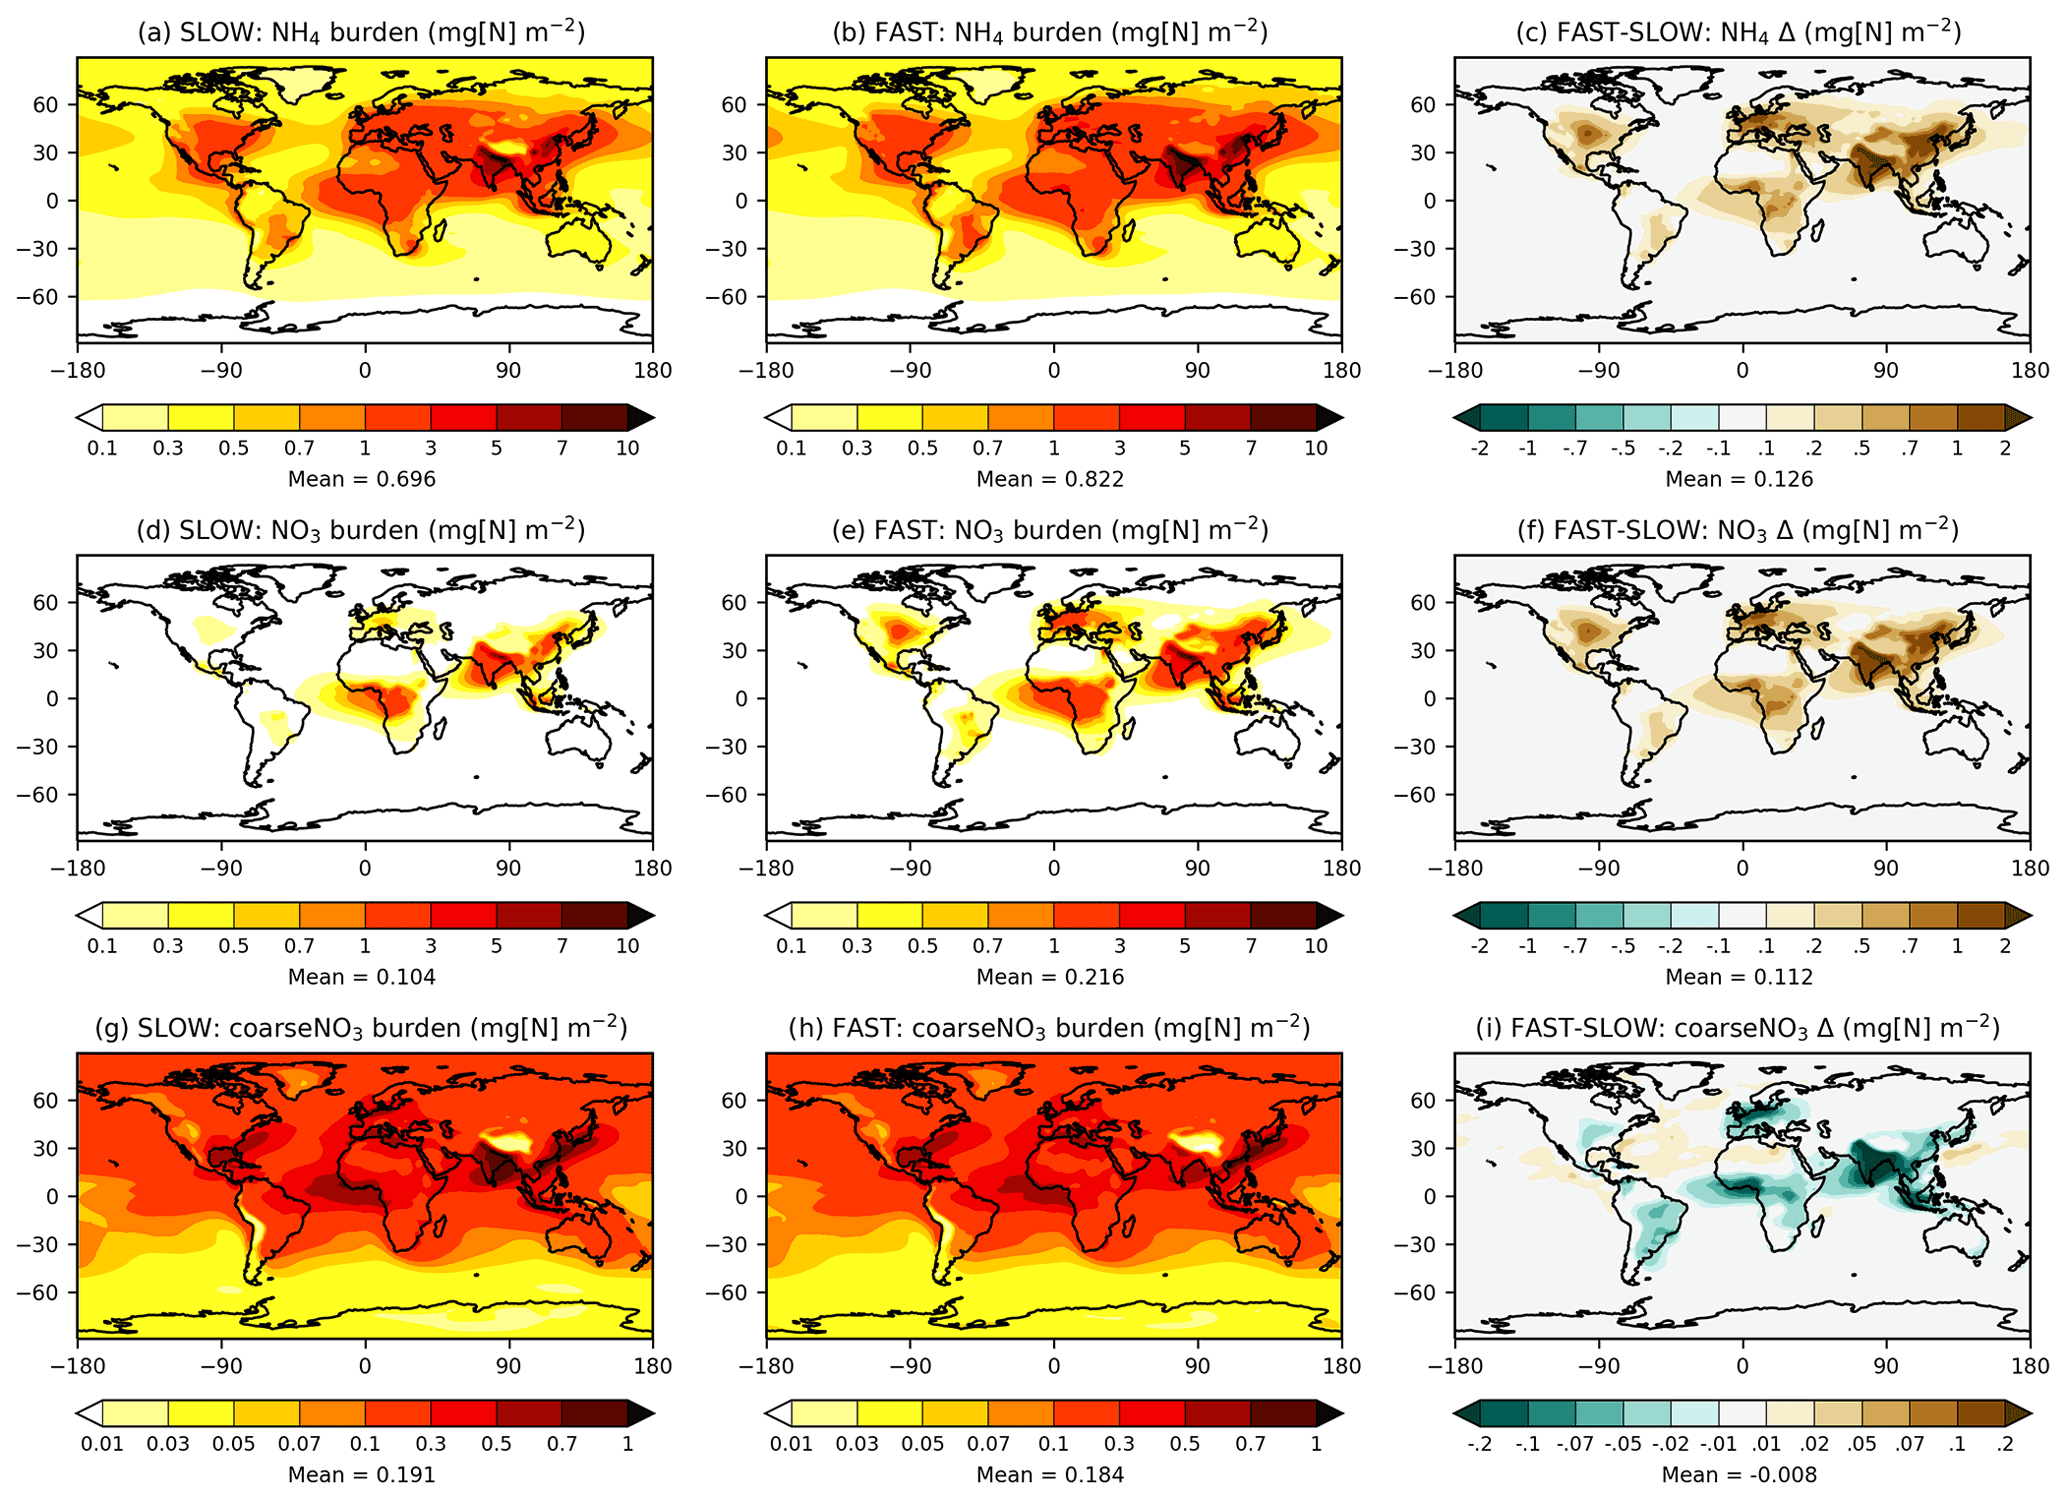
Figure 1Annual-mean NH4, NO3, and coarseNO3 burdens from the SLOW and FAST simulations.
Whereas fine NO3 burdens are concentrated over land, coarse NO3 (i.e. coarseNO3) is more evenly spread over the Earth and prevalent over maritime areas where it forms on sea salt and aged dust particles (Fig. 1g, h). Over European land, coarse NO3 constitutes 31 % of the total NO3 burden in FAST and 63 % in SLOW. Equivalent figures for East Asia are 15 % and 30 %, for South Asia are 10 % and 23 %, and for eastern North America are 45 % and 83 % respectively. Therefore, the partitioning of NO3 between the coarse and fine modes is highly sensitive to the uptake rate of HNO3 on ambient aerosol (γ in Eq. 7).
Figure 2 shows maps of annual-mean near-surface concentrations of NH4, fine NO3, and coarse NO3 in the SLOW and FAST simulations. The spatial distributions of fine NO3 are similar to those reported in BI17 and HA14 with peak concentrations over North America, Europe, South Asia, Southeast Asia, and East Asia land regions, coincident with the highest NH3 and NOx emitting regions (Fig. S6). The average total NO3 concentrations over Europe are 1.5 and 3.5 µg[NO3] m−3 in SLOW and FAST respectively, which can be compared to 4–5 µg[NO3] m−3 in HA14. Over central North America, total NO3 concentrations amount to 1 and 3 µg[NO3] m−3 on average in SLOW and FAST, with 50 % and 15 % contributions from coarse NO3. The regional-mean total NO3 concentrations in East Asia amount to 3.5 and 6.5 µg[NO3] m−3 and in South Asia amount to 5.5 and 7.5 µg[NO3] m−3, in SLOW and FAST respectively. Total NO3 differences between FAST and SLOW are driven by changes to the fine-NO3 concentrations (Fig. 2d–f), with comparatively minimal changes to coarse NO3 (Fig. 2g–i). In summary, Fig. 2 shows that the near-surface NH4NO3 concentration differences between FAST and SLOW are very similar to the overall burden differences (Fig. 1).
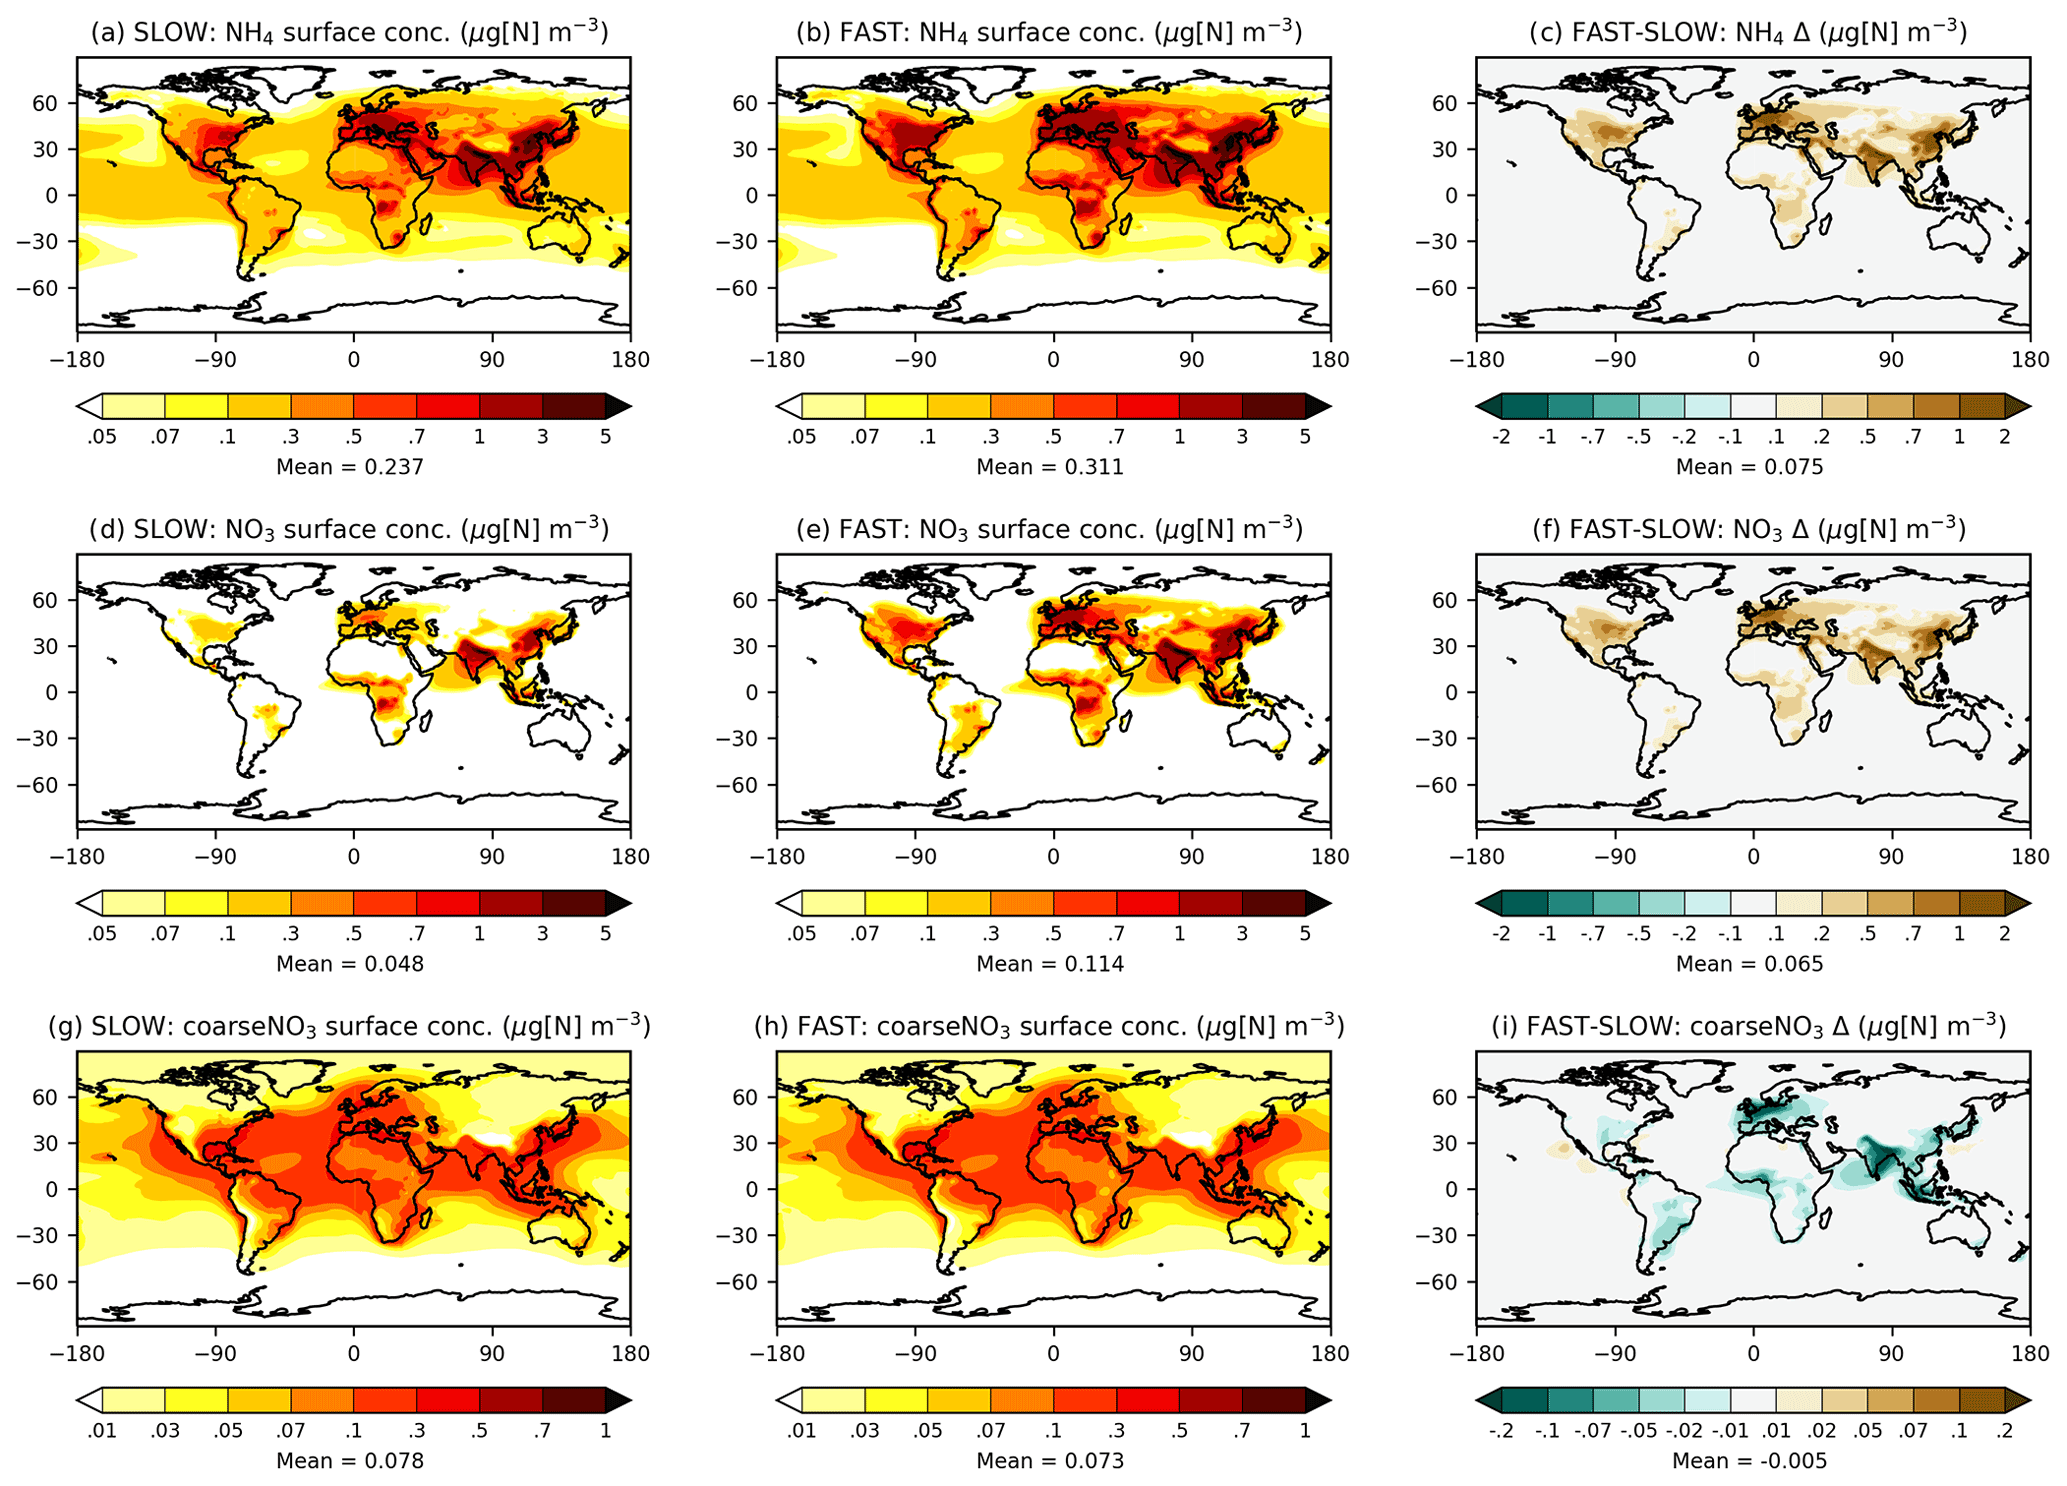
Figure 2Annual-mean NH4, NO3, and coarseNO3 near-surface concentrations from the SLOW and FAST simulations.
Figure 3 shows the zonal-mean vertical distribution of NO3, NH4, and coarseNO3 aerosol in the FAST and SLOW simulations. NH4 reaches a greater altitude than fine NO3, owing to its long-lived association with SO4 aerosol (Fig. 3a–b). Due to the high solubility of NH3 gas and thus swift wet removal from the atmosphere, free ammonia is mostly limited to the bottom 1 km of the atmosphere (Bellouin et al., 2011), which limits the vertical extent to which NH4NO3 may form by condensation (Fig. 3c–d). This is further corroborated by Fig. S7 which shows the “gas ratio”, defined as divided by ([HNO3]+[NO3]), with values greater than 1 indicating that conditions are HNO3 limited and less than 1 indicating conditions are NH3 limited (Ansari and Pandis, 1998). It is clear from Fig. S7 that NH4NO3 production is HNO3 limited at the surface over land regions but that conditions are ubiquitously NH3 limited above altitudes of 1000 m. While NaNO3 and Ca(NO3)2 are not volatile like NH4NO3, they are instead associated with coarse particles that are readily removed from the atmosphere by gravitational sedimentation and wet scavenging; thus, they remain confined to the lowest 1 km of the atmosphere (Fig. 3e–f). Figure 3 demonstrates that NH4NO3 and coarseNO3 are mostly confined to the lower troposphere in the UM in agreement with other GCMs.
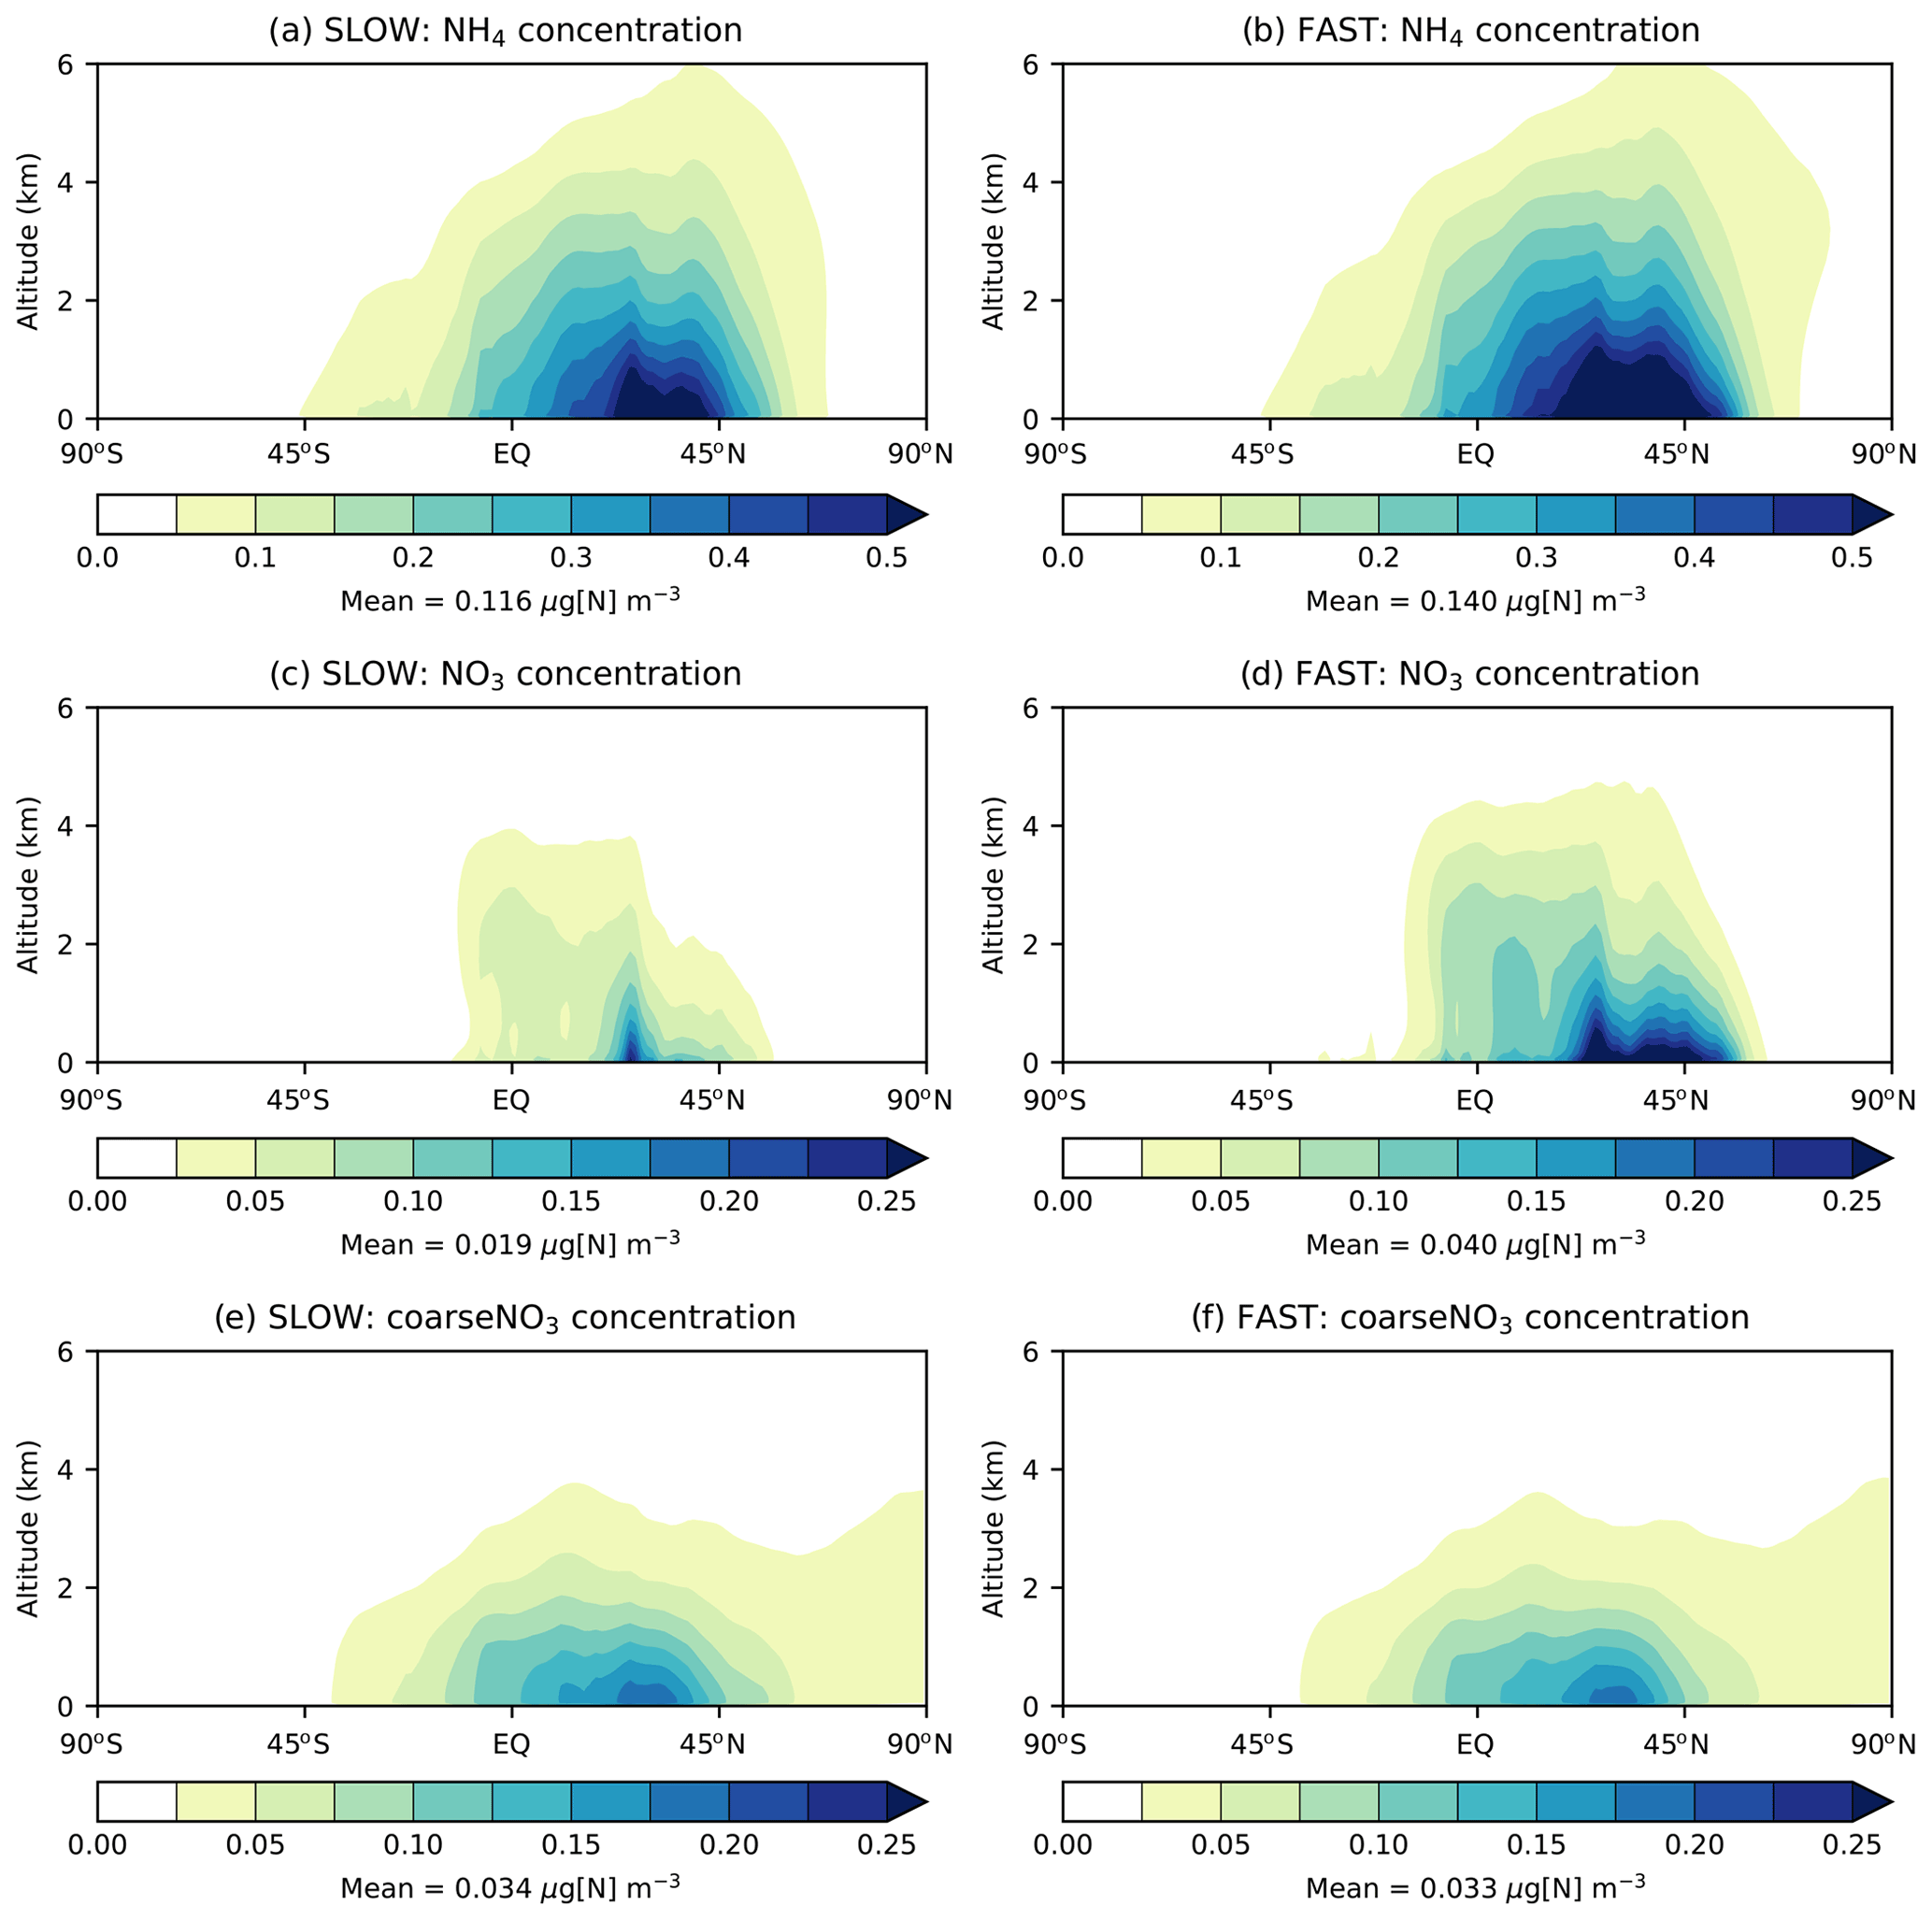
Figure 3Annual and zonal-mean NH4, NO3, and coarseNO3 concentrations vs. altitude from the SLOW and FAST simulations.
3.3 Regional surface concentrations
Given the strong dependency of the ammonia–nitrate equilibrium on temperature and the pronounced seasonal cycle in precursor gas emissions, it is important to consider the seasonal cycle of NO3 when assessing a nitrate scheme. Figure 4 shows the seasonal cycles in NO3 and coarseNO3 near-surface concentrations and associated regional NH3 emissions averaged over land in nine “Giorgi” regions (Giorgi, 2006), selected due to their high fine-NO3 concentrations (Fig. 2). Table S6 gives details of the Giorgi regions. For most of the regions (NEU, MED, CNA, EAS, WAF, SQF, and to a lesser extent SEA), fine NO3 cycles in both the FAST and SLOW simulations are tightly coupled to cycles in regional NH3 emissions, which further corroborates the notion that NH4NO3 formation may be limited in these regions by available NH3. The NH4NO3 concentrations in the CAS and SAS regions may be more dependent on seasonal meteorology than other regions; for instance, SAS (i.e. South Asia) experiences a strong summer monsoon which would enhance wet deposition of NH4NO3 during summer and thus reduce concentrations in contrast to the high NH3 emissions in this period. SAS also has consistently elevated NH3 emissions throughout the year and is thus less sensitive to seasonal cycles in NH3 emissions (Zhu et al., 2015). In all regions, NH4 and fine-NO3 concentrations exhibit a strong seasonal cycle in both SLOW and FAST, while the seasonal cycle in coarse NO3 is less apparent. In the SLOW simulation, coarse NO3 concentrations are of similar magnitude to fine-NO3 concentrations in NEU, MED, CAS, CNA, and WAF on a regional-mean basis (Fig. 4). In summary, Fig. 4 shows the tight coupling between regional NH3 emissions and adjacent NO3 surface concentrations in many regions and highlights the strong seasonality of NH4NO3 in the UM.
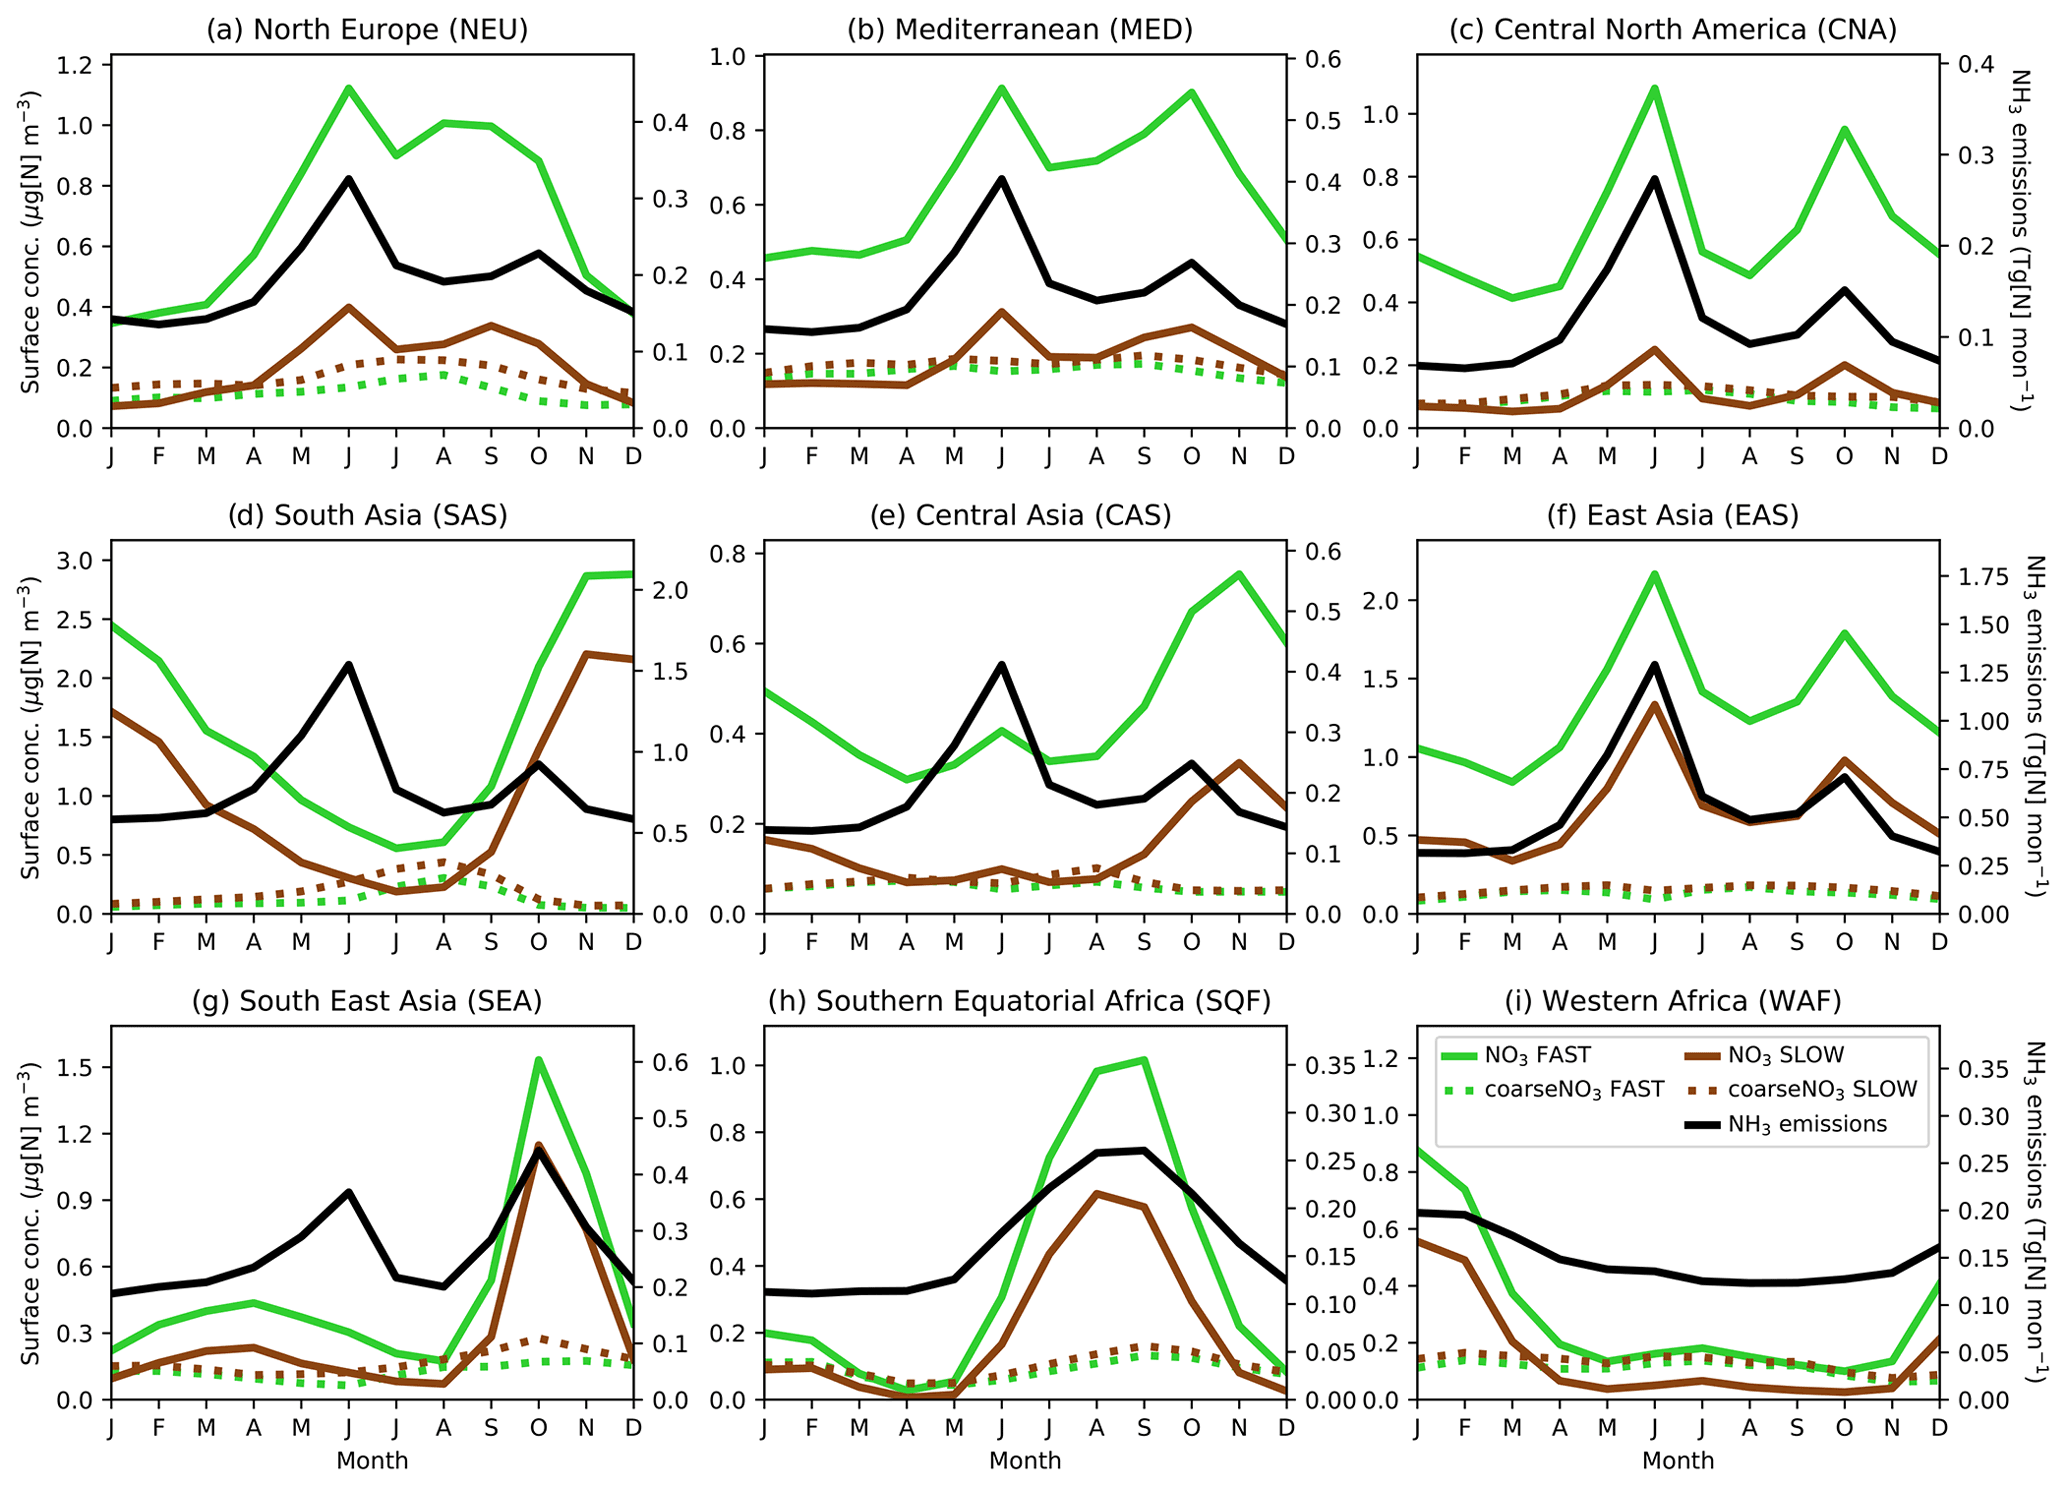
Figure 4Regional and monthly-mean NO3 (solid line) and coarseNO3 (dashed line) near-surface concentrations and NH3 emissions (solid black line) time series for the SLOW (brown) and FAST (green) simulations for nine Giorgi regions (Giorgi, 2006) (land-only), representing areas with high NO3 concentrations.
When introducing an aerosol such as NH4NO3 into a GCM, it is essential to validate the model by comparing the simulated concentrations to observations. Figures 5 and 6 show the near-surface concentrations of HNO3, NH4, and total NO3 over the USA (Fig. 5) and Europe (Fig. 6) in the FAST and SLOW simulations compared to observations from the Clean Air Status and Trends Network (CASTNet; https://www.epa.gov/castnet, last access: 22 October 2021; Finkelstein et al., 2000) for the USA and the European Monitoring and Evaluation Programme (EMEP; http://ebas.nilu.no/, last access: 22 October 2021; Tørseth et al., 2012) for Europe. In both networks the sites are located so as to represent the wider region. Data processing and site selection for the observations follow the methodology described in Hardacre et al. (2021), who have compared SO2 and SO4 concentrations from UKESM simulations with CASTNet and EMEP observations. CASTNet and EMEP data are averaged over the period 1994–2013 where available. For CASTNet, there are a total of 49 sites that meet data processing criteria in this study. For EMEP, there are 59 sites for HNO3, 59 sites for NH4, and 80 sites for NO3 meeting data processing criteria over the 1994–2013 time frame. For the scatterplots in Figs. 5 and 6, model output is interpolated to measurement sites using a nearest-neighbour approach assuming the Earth is a sphere. It is important to note that the absolute magnitudes of concentrations are not directly comparable between the simulations and observations given that the simulations assume constant NOx and NH3 emissions based on the year 2000, whereas NOx and NH3 emissions in reality are transient. This becomes apparent when comparing the network-mean concentrations in the simulations with the observations (Fig. S8) where there is a clear negative trend in HNO3, NH4 and NO3 concentrations in both CASTNet and EMEP observations from 1994 to 2013.
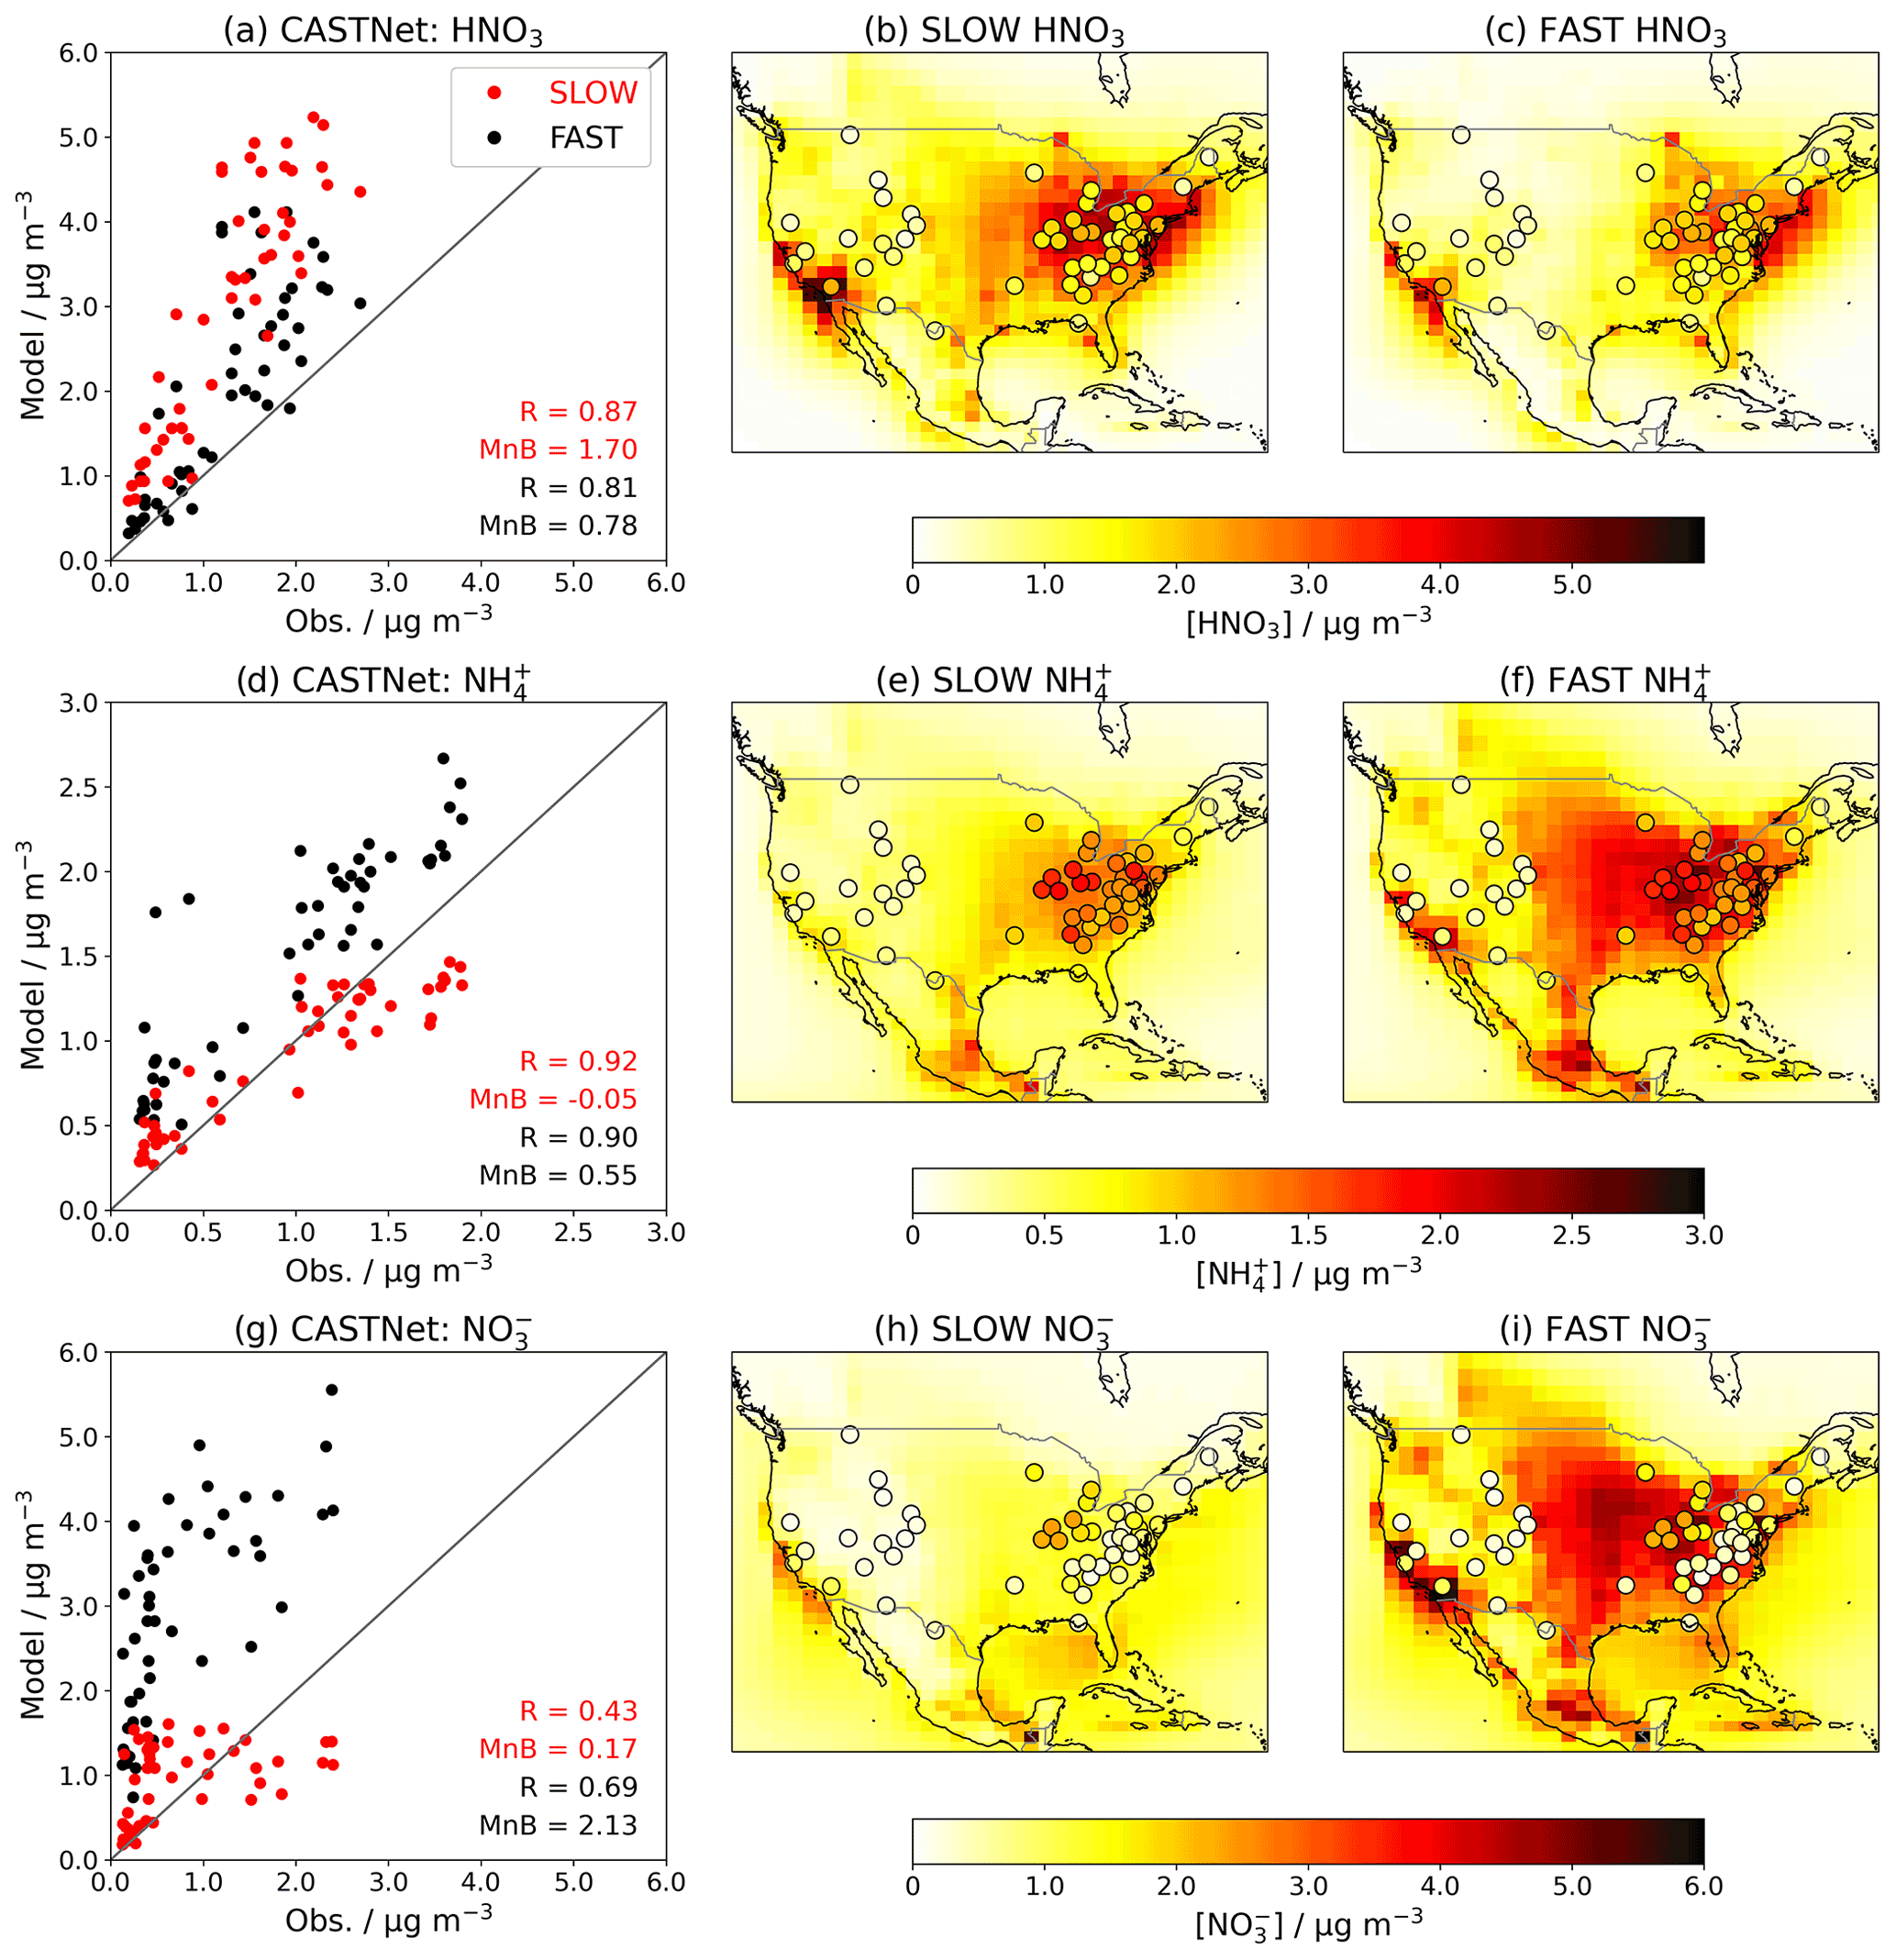
Figure 5Annual-mean HNO3, NH4, and total-NO3 near-surface concentrations in the FAST and SLOW simulations over North America compared to CASTNet observations averaged over 1994–2013. In panels (b, c, e, f, h, i), coloured contours show simulated concentrations while overlaid filled circles represent CASTNet observations. In panels (a, d, g), “R” is the Pearson's correlation coefficient, and “MnB” is the mean bias between simulated and observed concentrations.
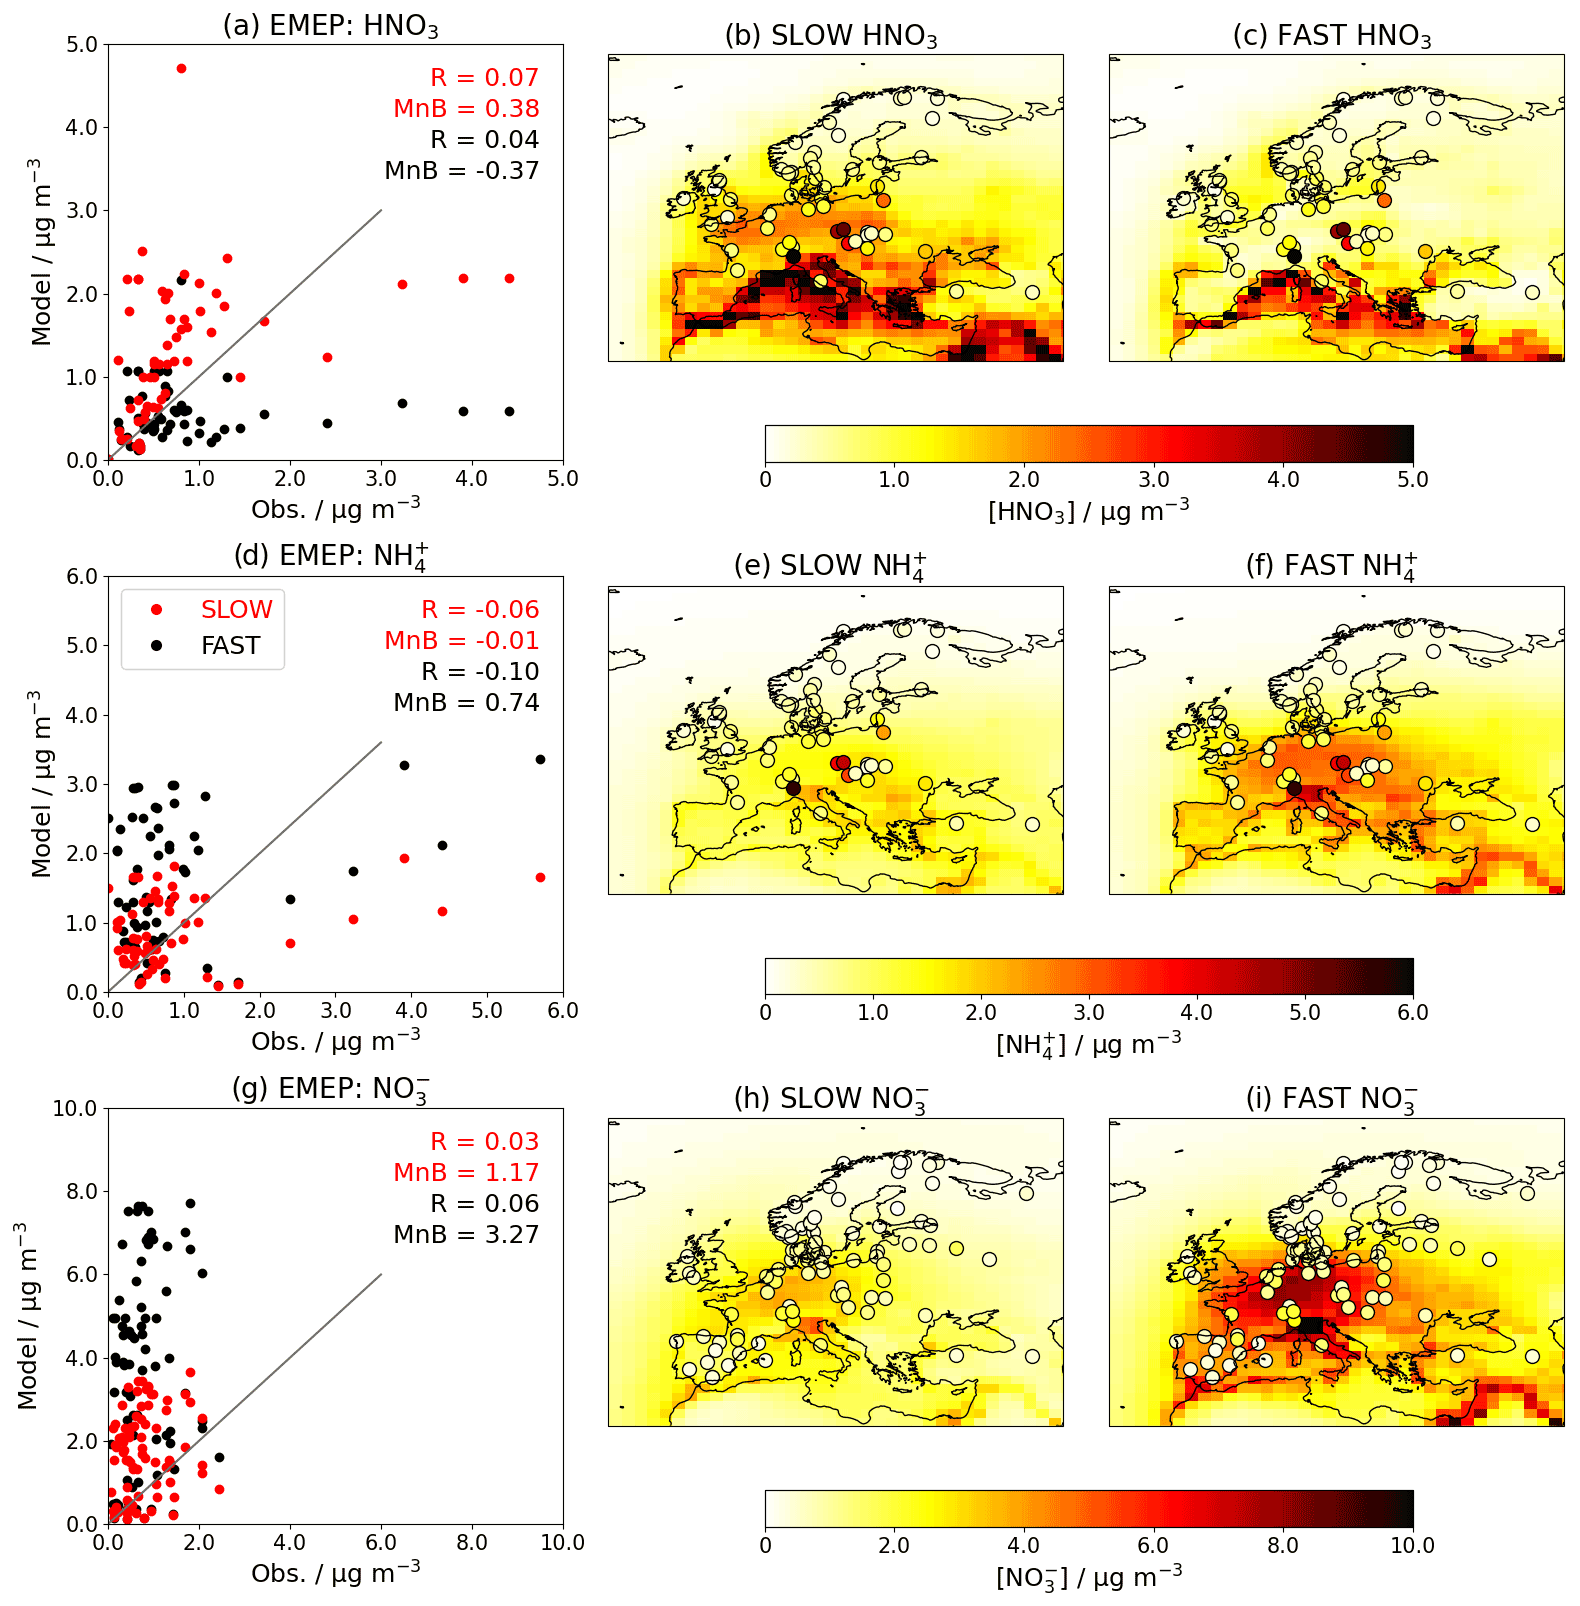
Figure 6Annual-mean HNO3, NH4, and total-NO3 near-surface concentrations for the FAST and SLOW simulations over Europe compared to EMEP observations averaged over 1994–2013 where available. In panels (b, c, e, f, h, i), coloured contours show simulated concentrations while overlaid filled circles represent EMEP observations. In panels (a, d, g), “R” is the Pearson's correlation coefficient, and “MnB” is the mean bias between simulated and observed concentrations.
Figure 5 shows that the spatial distributions of HNO3, NO3, and NH4 over the USA are similar in FAST and SLOW, with peak HNO3 concentrations in the east and mid-western states reflecting industrial NOx emissions, and peak NO3 and NH4 in the mid-western and central states reflecting agricultural NH3 emissions (Park et al., 2004). The absolute magnitudes of NH4 and NO3 concentrations are closer to CASTNet observations in SLOW (Fig. 5h) than in FAST (Fig. 5i), but the spatial correlation coefficient for NO3 is better in FAST (R=0.69) than in SLOW (R=0.43). This suggests that the positive NO3 (and correspondingly NH4) biases in FAST may partially emanate from a surplus of HNO3 in the model, given that HNO3 is positively biased in both FAST and, to an even greater extent, SLOW (Fig. 5d). Because of the underlying HNO3 bias, it is not possible to declare whether FAST or SLOW is the better model from comparison with the CASTNet observations (Fig. 5). It is only possible to deduce that reducing the HNO3 uptake coefficient (γ) in SLOW leads to a substantial reduction in total NO3 concentration, as already shown in Figs. 1, 2, and 4.
Over Europe, NO3 and NH4 concentrations are closer to EMEP observations in the SLOW simulation than in the FAST simulation (e.g. smaller mean biases in Fig. 6d, g). NO3 concentrations in both FAST and SLOW peak in the Po Valley (northern Italy) and Benelux region, in anecdotal concordance with Drugé et al. (2019) and references therein. The Po Valley peak in both the EMEP observations and simulations is due to the entrapment of industrial air pollution by regional geography. The observed NH4 and HNO3 peaks over the Czech Republic may be attributable to high agricultural NH3 emissions pre-2004, with concomitant concentration declines owing to the Gothenburg protocol (Fortems-Cheiney et al., 2016; Giannakis et al., 2019). Neither of the observed NH4 nor HNO3 concentration peaks in the Po Valley or the Czech Republic are well captured by FAST or SLOW simulations, which may be attributed to the coarse model resolution employed here (N96) and the close proximity of measurement sites to NH3 sources. In summary, Figs. 5 and 6 demonstrate the high skill of the UM nitrate scheme in capturing the magnitude of observed HNO3, NH4, and NO3 concentrations and highlight how the HNO3 uptake coefficient (γ) could be used to tune NH4 and NO3 concentrations in a GCM to observations.
Given that NH4NO3 has a strong diurnal tendency, it is important to compare the simulated diurnal concentrations from the UM with observations, particularly if the scheme is to garner further utility by contributing to air quality forecasts in the future. Figure 7 shows the statistical distribution of six hourly total NO3 and NH4 concentrations from the FAST and SLOW simulations (years 2004–2013) interpolated to two EMEP supersites in the UK – Auchencorth Moss and Chilbolton Observatory – and compared with observed diurnal concentrations from those sites (UK AIR, https://uk-air.defra.gov.uk/data/, last access: 29 January 2021). Both sites use MARGA instruments – a combination of wet rotating denuders for gas measurements and stream jet aerosol collectors for aerosol measurements – allowing for accurate partitioning between the aerosol and gas phases for volatile ammonium nitrate (Aas et al., 2012; Twigg et al., 2016). Only data recorded at the precise hours of 06:00, 12:00, 18:00, and 24:00 UTC that has passed the Department for Environment, Food and Rural Affairs' (DEFRA) quality control are utilised from the observations. Figure S9 shows the equivalent statistics for HNO3 and NH3 gases compared to observations. It is clear from Fig. 7 that NH4 and NO3 are significantly reduced in the SLOW simulation with respect to the FAST simulation in both seasons. It is also clear that the diurnal cycle, with NH4 and NO3 peaking at night (24:00 or 00:00 Z) and early morning (06:00 Z) is both observed and skilfully simulated in both FAST and SLOW. Interestingly, the model shows similar biases to the Met Office's AQUM: an over prediction of NO3 during night-time in the summer; a slight underprediction of NO3 in the winter, a large over prediction of HNO3 during the day in the summer, and a smaller overprediction of HNO3 at night in the winter. The curious overprediction of NH3 at night in winter (Fig. S9) was also observed in previous incarnations of the AQUM and will be addressed in the UM in future by imposing a diurnal cycle to NH3 emissions. In summary, the pronounced diurnal NH4NO3 cycle from UK AIR observations is generally well captured by the UM nitrate scheme (Fig. 7).
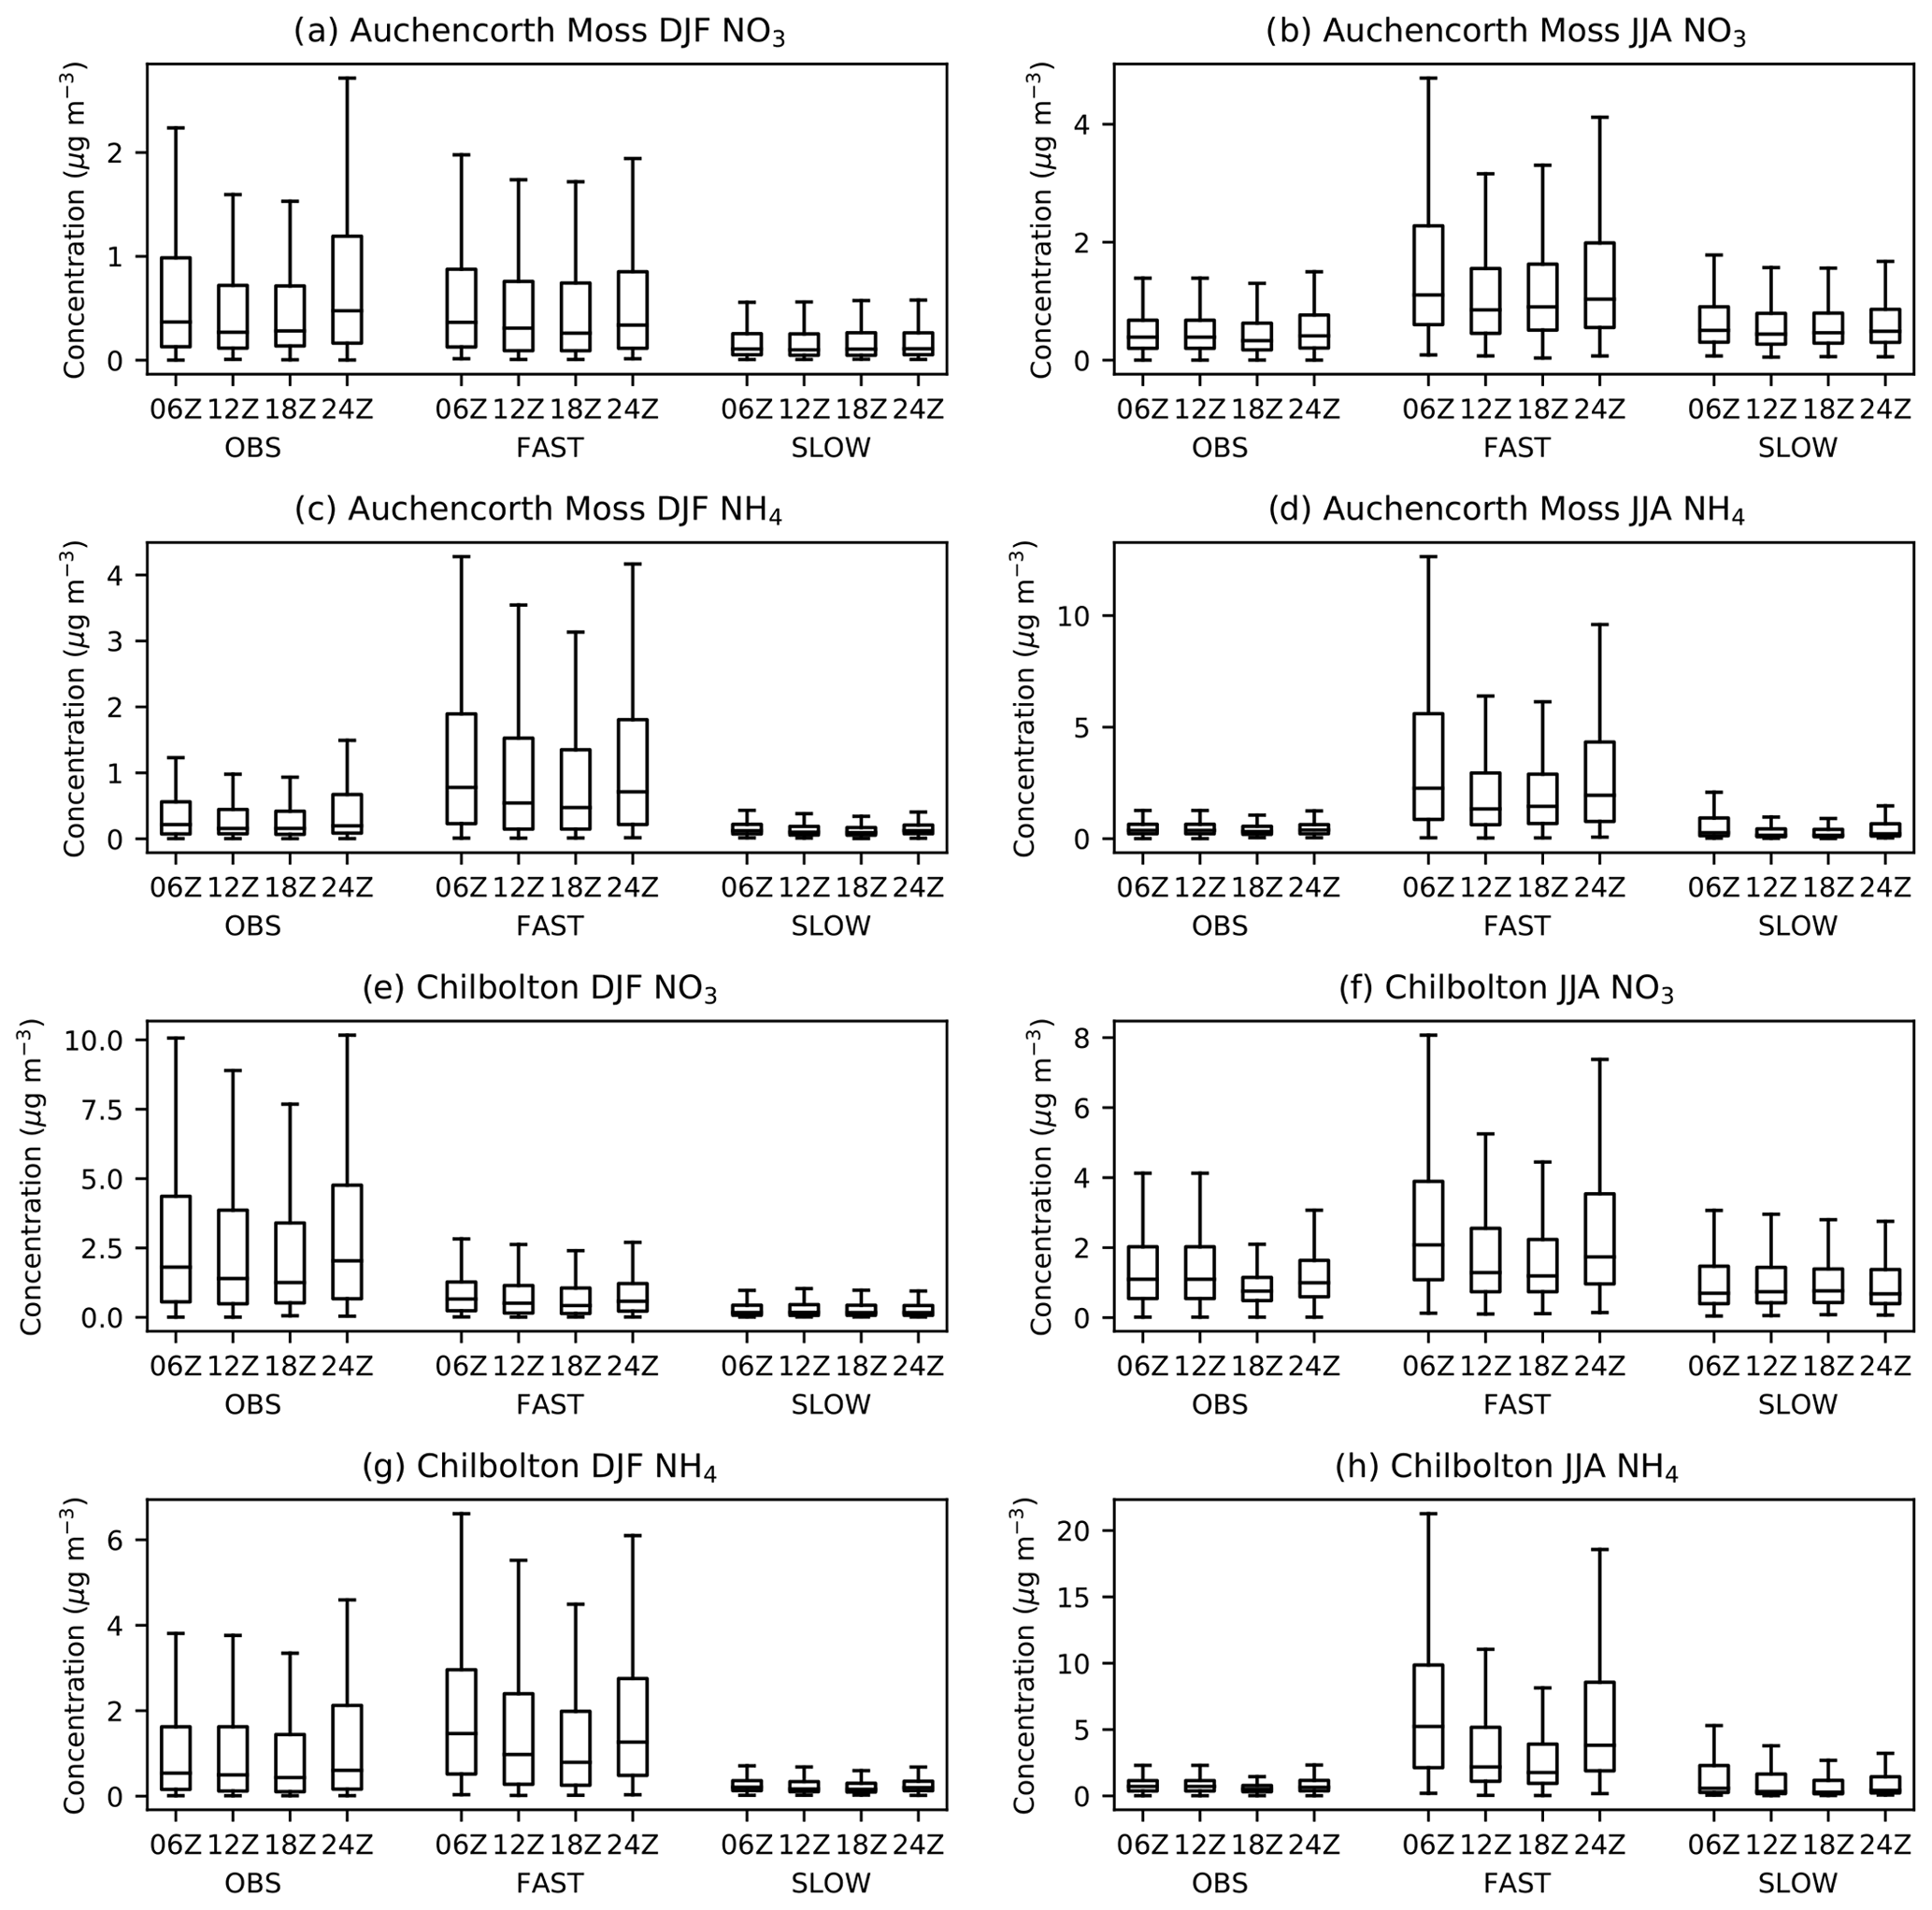
Figure 7December–February (DJF) and June–August (JJA) diurnal cycles of near-surface total-NO3 and NH4 aerosol concentrations in the FAST and SLOW simulations interpolated to two European Monitoring and Evaluation Programme (EMEP) supersites in the UK – Auchencorth Moss (55.79216∘ N, −3.2429∘ E) and Chilbolton (51.149617∘ N, −1.438228∘ E), alongside six hourly observations from 2014–2018 for Auchencorth Moss and 2016–2020 for Chilbolton.
As NH4NO3 is a significant contributor to urban air pollution episodes (Jimenez et al., 2009), it is important to assess the contribution of NH4NO3 to overall PM2.5 surface concentrations using observations for validation. Figure 8 shows the seasonal cycle in total PM2.5 concentrations in the CNTL, FAST, and SLOW simulations compared to co-located PM2.5 observations from the Global Aerosol Synthesis and Science Project (GASSP; http://gassp.org.uk/database/, last access: 2 July 2020; Reddington et al., 2017). GASSP amalgamates non-urban PM2.5 measurements from three major networks: the Interagency Monitoring of Protected Visual Environments (IMPROVE) project in North America, the European Monitoring and Evaluation Programme (EMEP), and Asia Pacific Aerosol Database (A-PAD). The PM2.5 analysis proceeds as in Turnock et al. (2020), with monthly-mean observations determined for each measurement site averaged over the years 2000–2010 and over each region. This is then compared with the simulated PM2.5 output that has been interpolated to individual site locations using a nearest-neighbour approach and averaged over the same time period and regions. Also shown in Fig. 8 are Modern-Era Retrospective Analysis for Research and Applications, version 2 (MERRA-2), reanalysis data (Buchard et al., 2017; Randles et al., 2017), which closely follow GASSP surface observations in Europe and North America but are less successful in other regions where a smaller number of ground-based observations are available, e.g. incorrectly modelling the seasonal PM2.5 cycles in South Asia and “Pacific AUS NZ”.
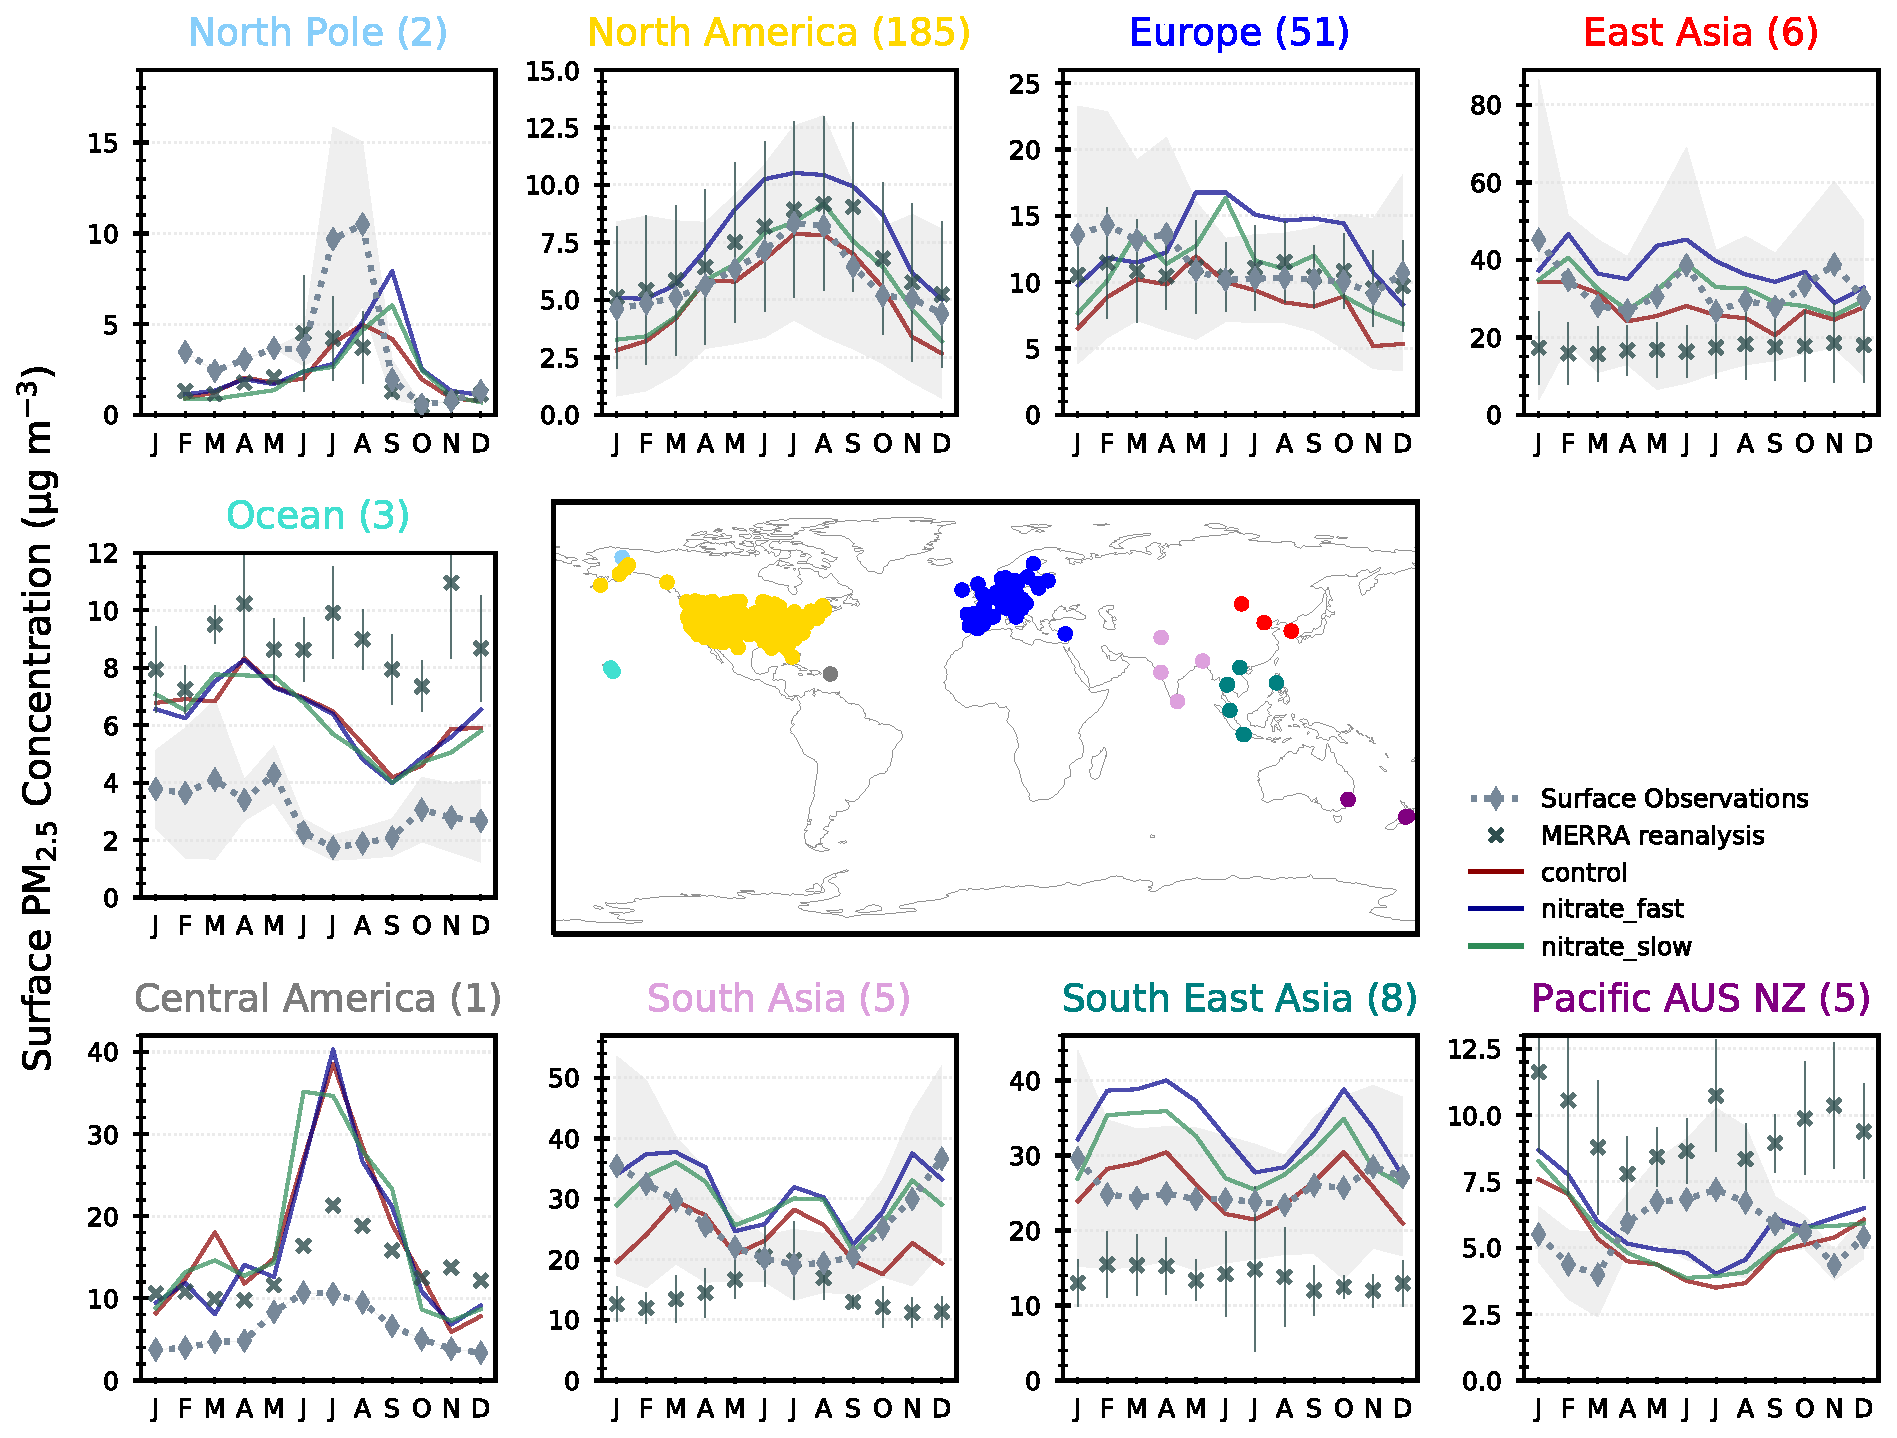
Figure 8Regional and monthly-mean surface PM2.5 concentrations in the UM simulations (CNTL = red, FAST = blue, and SLOW = green lines), and from MERRA reanalyses and GASSP surface observations.
Over North America, the slight negative PM2.5 bias in CNTL is brought closer to observations in SLOW and over-corrected in FAST which now exhibits a slight positive bias (Fig. 8). Over Europe observations suggest that PM2.5 slightly peaks in DJF, which is not the case in any of the UM simulations in which PM2.5 peaks in JJA. Drugé et al. (2019) observed the same seasonal bias over Europe in the ALADIN-Climate regional model, which they attributed to uncertainties in the annual cycle of NH3 and HNO3 precursor gases. In Fig. 7, the simulated NH4 concentrations in JJA vastly exceeded the observations at both UK-based supersites, indicating that summertime NH3 gas emissions may be biased high in the prescribed CEDS emissions dataset over Europe. Another source of uncertainty that may affect the seasonal NH4NO3 cycles is the dependence of heterogeneous N2O5 hydrolysis on relative humidity and aerosol liquid water content. In the UM, N2O5 hydrolysis on sulfate is modelled using a fixed uptake coefficient of 0.1, whereas Shah et al. (2018) have shown that a humidity- and acidity-dependent uptake coefficient improves PM2.5 forecasts in winter over the eastern USA. This suggests that differences in the seasonal cycles of NH4 and NO3 may emanate from imprecisions in the modelling of precursor gas emissions, chemistry, and deposition (Bian et al., 2017).
Returning to Fig. 8, over South Asia, East Asia, and Southeast Asia the CNTL simulation adeptly captures the seasonal PM2.5 cycle, and the addition of NH4NO3 in FAST and SLOW induces a slight positive bias. In summary, Fig. 8 demonstrates that both SLOW and FAST have a significant impact on overall PM2.5 concentrations – particularly over Europe, Asia, and North America – with FAST inducing approximately double the PM2.5 increase than in SLOW. The addition of NO3 to the UM may help to reduce the long-standing PM2.5 biases in North America and Europe. Additionally, Fig. 8 provides further evidence that NH3 emissions over Europe in the CEDS emissions dataset may be biased high during the summer.
3.4 Aerosol optical depth and radiation changes
Atmospheric NH4NO3 aerosol may have significant radiative implications on a regional basis leading to climate changes (Hauglustaine et al., 2014). It is thus useful to compare the aerosol optical depth and top-of-the-atmosphere (TOA) radiative flux changes in the FAST and SLOW simulations with CNTL to estimate the radiative impact of NH4NO3. Figure 9 shows the annual-mean total aerosol optical depth at 550 nm (AOD550) in the UM simulations (CNTL, FAST, and SLOW), with contributions from the Aitken, accumulation and coarse soluble modes, the Aitken insoluble mode, and mineral dust. Also plotted are the 2003–2012 mean MODIS Collection 6 AOD550 satellite data, which merge NASA's Dark Target and Deep Blue algorithms and are widely used for validating aerosol models (Levy et al., 2013; Hsu et al., 2013). The MODIS AOD550 data are included in Fig. 9 to assess the skill of the CNTL simulation at capturing the observed AOD550 distribution. It is clear that generally the CNTL simulation does a reasonable job of simulating the spatial distribution of AOD550 (Fig. 9a) when compared to MODIS (Fig. 9d).
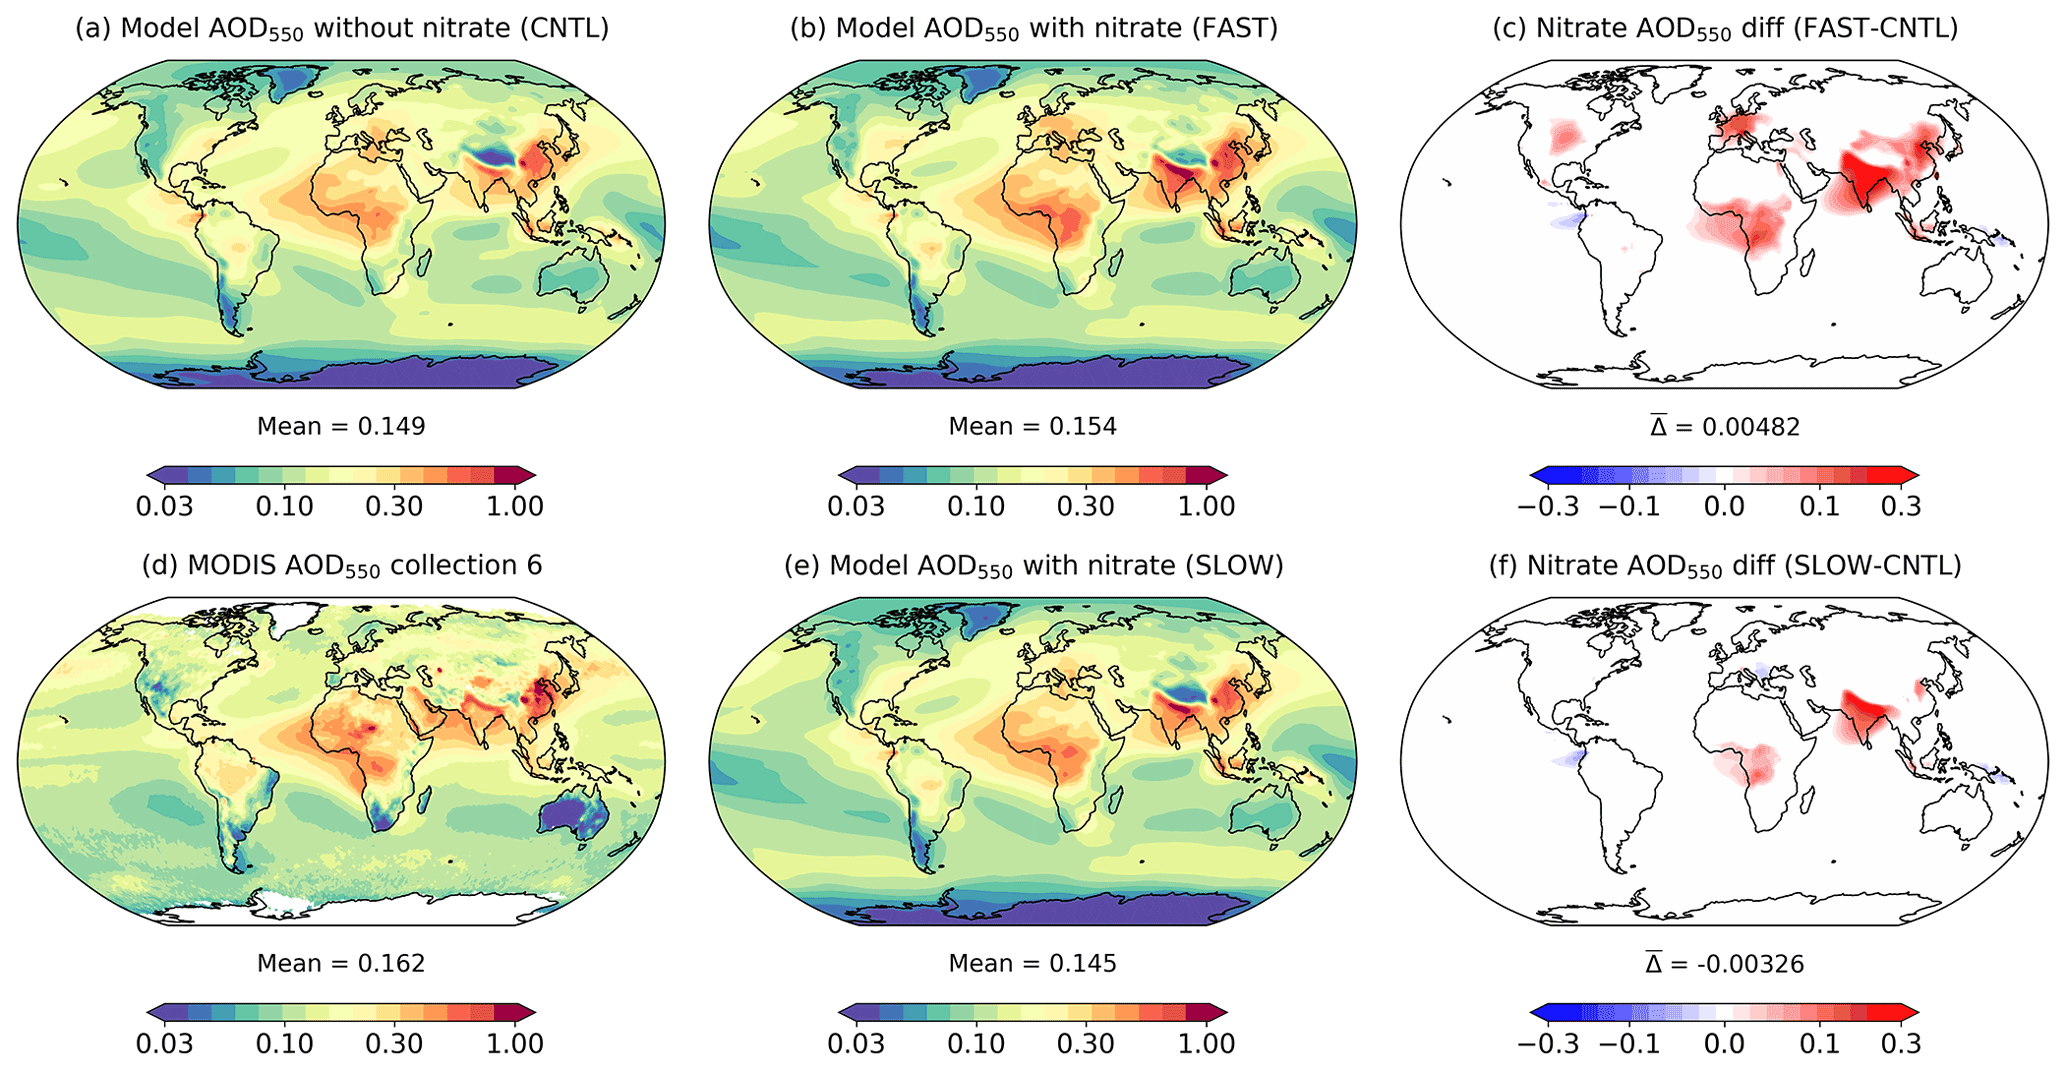
Figure 9Annual-mean and column-integrated 550 nm aerosol optical depth (AOD550) in the CNTL, FAST, and SLOW simulations and from MODIS Collection 6 satellite observations. Panels (c) and (f) show the difference between the FAST and CNTL and SLOW and CNTL simulations respectively.
The new nitrate scheme will impact the total AOD550 by various direct and indirect routes. Firstly, the addition of NO3, NH4, and coarseNO3 mass will increase the size and change the composition of the ambient aerosols, thus altering their optical properties. Secondly, coarseNO3 mass associated with sea salt will replace existing NaCl, thus changing the aerosol composition. Thirdly, the explicit addition of NH4 to the hygroscopic growth routine will reduce hygroscopic growth, whereas NO3 and coarseNO3 will promote hygroscopic growth. Finally, tropospheric SO4 was previously assumed to uniformly take the form of (NH4)2SO4 in terms of optical properties, but in the new nitrate scheme it is explicitly divided into H2SO4 and (NH4)2SO4 contributions based on NH4 abundance. Indirectly, NH4 and NO3 may alter the AOD550 by impacting online aerosol emissions (such as dust and sea salt) and atmospheric oxidant concentrations in the UM.
The AOD550 differences between the CNTL and nitrate simulations (FAST and SLOW) shown in Fig. 9 are a combination of the various direct and indirect changes to the UM listed above which do not necessarily result in an increase to AOD550. The global-mean AOD550 difference between FAST and CNTL of +0.0048 is serendipitously close to equivalent nitrate AODs in the literature such as +0.006 in Paulot et al. (2016), +0.005 in HA14, and +0.006 in Myhre et al. (2013), although it is important to note that the AOD550 changes in those studies were derived from difference between present-day (PD) and pre-industrial (PI) simulations rather than PD with and without nitrate. This is a subtle but important difference which reduces comparability given that the PI simulations included nitrate, albeit at much smaller concentrations than in PD (Hauglustaine et al., 2014). Despite the negligible global AOD550 difference between FAST and CNTL, there are significant regional perturbations such as +0.05 over northern Europe as a whole, +0.08 over East Asia, +0.19 over South Asia, and +0.04 over western Africa and southern equatorial Africa (Fig. 9c). The changes in the SLOW simulation are more subtle; for instance, AOD550 changes by −0.007 over northern Europe, +0.013 over East Asia, +0.1 over South Asia, and +0.018 over western Africa and southern equatorial Africa (Fig. 9f).
Figure S10 shows the annual-mean all-sky radiative flux perturbation at the TOA. As the UM simulations are atmosphere-only with fixed sea-surface temperatures and sea-ice fields, the TOA radiative flux perturbation can also be denoted the total effective radiative forcing (ERF) (Bellouin et al., 2020). The global-mean ERFs from FAST-CNTL and SLOW-CNTL are −0.19 and −0.07 W m−2 respectively, which is a similar magnitude to the PD–PI nitrate radiative forcings (RFs) of −0.056 W m−2 in HA14, −0.17 W m−2 in Bellouin et al. (2011), and −0.08 W m−2 in Myhre et al. (2013), although note again that the RFs in those studies were derived from difference between present-day (PD) and pre-industrial (PI) simulations rather than PD with and without nitrate, and those studies determined the direct radiative forcing rather than the total ERF which also includes indirect radiative impacts of cloud and atmospheric composition changes. An explicit assessment of nitrate-induced changes to cloud properties is outside the scope of this study. Although most regions exhibit insignificant radiative differences between FAST and CNTL in Fig. S10b (where stippling indicates significant changes at the ±2σ level), there are significant changes over Europe (min W m−2, mean W m−2), South Asia (min W m−2, mean W m−2), and southern equatorial Africa (min W m−2, mean W m−2). This mirrors nitrate's radiative signal in HA14. The SLOW simulation exhibits smaller radiative impacts than FAST, with significant changes limited to South Asia (min W m−2, mean W m−2) and southern equatorial Africa (min W m−2, mean W m−2). Figures 9 and S10 highlight the regionality of ammonium nitrate climate forcing and further demonstrate the significant differences between the FAST and SLOW simulations.
A thermodynamic equilibrium nitrate scheme has been added to UKCA-mode and tested in the Met Office's Unified Model. In contrast to widely utilised “instantaneous” thermodynamic equilibrium models, the UKCA nitrate scheme limits the rate at which ammonium nitrate (NH4NO3) concentrations reach equilibrium using first-order condensation theory. Sensitivity tests are performed to assess the sensitivity of NH4NO3 concentrations to the nitric acid (HNO3) uptake coefficient (γ in Eq. 7). Specifically, two values of γ are chosen to represent fast uptake rates (γ=0.193; FAST) and slow uptake rates (γ=0.001; SLOW) based on the range of γ measurements from the literature (e.g. Bauer et al., 2004). While it is known that γ varies with aerosol composition, temperature, and relativity humidity (e.g. Vlasenko et al., 2006), well-constrained values for HNO3 uptake on common aerosol species (e.g. sulfate, organic carbon, black carbon) are at present lacking. As a first-order sensitivity test, the HNO3 uptake coefficient used in NH4NO3 production is assumed to be globally invariant to aerosol composition (with the exception of mineral dust), temperature, and relative humidity in FAST and SLOW. A third nitrate simulation in which NH4NO3 reaches thermodynamic equilibrium instantaneously (INSTANT) is shown to produce near-identical results to FAST. This is the first study to investigate the sensitivity of NH4NO3 concentrations to the HNO3 uptake coefficient and provide an efficient method for reducing NO3 concentration biases in GCMs.
To help evaluate the sensitivity of NH4NO3 concentrations to HNO3 uptake coefficient, and the suitability of the FAST and SLOW uptake coefficients, a range of surface and satellite observations and comparable modelling studies have been compared to the UM simulations. Many robust results emerge from the simulations. Fine-NO3 concentrations are a factor of 2 greater in FAST than in SLOW on a global-mean basis, with associated increases to NH4 concentrations in FAST. The largest differences are over land regions in North America, Europe, South Asia and East Asia, and equatorial Africa. However, there are minimal differences between coarse NO3 (associated with dust and sea salt) concentrations in FAST and SLOW. Over many populous land regions (Europe, North America, East Asia and Southeast Asia, and western and equatorial Africa), seasonal near-surface NH4NO3 concentrations are closely correlated with seasonal NH3 emissions, suggesting that NH3 availability is the limiting factor controlling NH4NO3 prevalence (Giannakis et al., 2019). In the SLOW simulation, coarse NO3 concentrations are of a similar magnitude to fine-NO3 concentrations over many industrialised regions. Comparing the simulated concentrations to CASTNet observations (i.e. the USA network), FAST better captures the spatial distribution of near-surface NO3, NH4, and HNO3 concentrations but is positively biased, whereas SLOW better captures the magnitude of the concentrations. Total NO3 concentrations over Europe are comparable between SLOW and EMEP observations but are a factor of 3–4 too high in FAST. Many of the biases in simulated NH4 and NO3 concentrations appear to be artefacts of biases in precursor gas (HNO3 and NH3) concentrations. Significant AOD and TOA radiative flux impacts are mostly isolated to land regions with substantial NH4NO3 burdens. On a global mean basis, the nitrate ERF is −0.17 W m−2 in FAST and −0.07 W m−2 in SLOW which mirrors the ratio of NH4NO3 burdens in the two simulations.
Introducing a kinetic limitation on the rate at which NH4NO3 concentrations reach equilibrium has minimal effect for γ=0.193 (i.e. comparing FAST with INSTANT) but a significant effect equivalent to a halving for γ=0.001 (i.e. comparing SLOW with FAST). In general, FAST exhibits better spatial correlation with observed nitrate surface concentrations while SLOW better resolves the magnitude of surface concentrations. Note though that there are many caveats associated with this study. Using a globally uniform value for the HNO3 uptake coefficient (γ) obviates the dependence of γ on aerosol composition and relative humidity. A better parameterisation may instead utilise a volume-weighted γ depending on aerosol composition and ambient relative humidity. Additionally, assuming the same value of γ for both HNO3 and NH3 is a pragmatic simplification owing to the dearth of γ measurements. For example, Benduhn et al. (2016) assume uptake coefficients of 0.2 and 0.1 for HNO3 and NH3 respectively. On another note, if γ is used to tune the NH4NO3 concentrations to observations in future, then existing biases in precursor gases (HNO3 and NH3), in terms of emissions and atmospheric processes, should first be evaluated and addressed. For instance, the curious surplus of simulated NH3 at night at UK sites (Fig. S9) may be rectified by imposing a diurnal cycle on NH3 emissions based on number of daylight hours, as implemented by Park et al. (2004). Bian et al. (2017) also highlight the importance of accurately simulating NH3 dissolution in cloud droplets, which may be oversimplified in the UM owing to the ubiquitous assumption of a cloud droplet pH of 5 in UKCA.
This study has also highlighted a potential overestimate of NH3 emissions in Europe in the CMIP6 emissions inventory, as also posited by Drugé et al. (2019). An accurate NH3 and NOx emissions inventory is vital for a proficient simulation of NH4 and NO3 concentrations. HNO3 concentrations also appear to be overestimated over the western USA (Fig. 5) in these simulations, which may emanate from an oversimplification of heterogeneous N2O5 chemistry in UKCA Strattrop1.0, given that the uptake coefficient in that reaction is uniformly set to 0.1 (Archibald et al., 2020). Other simplifications such as uniformly assuming that mineral dust constitutes 5 % Ca2+ per mass and that the alkalinity of sea salt may be titrated indefinitely may result in errors in coarse-mode NO3 concentrations (Rémy et al., 2019). Lastly, the assumption that HNO3 and NH3 are only involved in condensation and evaporation and not in nucleation may need to be revisited given developments in the theory of new particle formation (NPF) (Lee et al., 2019; Wang et al., 2020). If NPF is found to dominate NH4NO3 production at higher tropospheric altitudes than condensation-related production, then the dynamics of convective transport of NH4NO3 precursors will become important.
The differences between the simulated and observed concentrations in this study (Figs. 5–7) may be attributed to the use of perpetual year-2000 conditions in these simulations; the coarse model resolution utilised here (N96); biases in HNO3 and NH3 emissions, chemistry, and deposition; deficiencies in the thermodynamic equilibrium approach; and due to the choice of a monotonic uptake coefficient. In particular, this study has shown that the HNO3 uptake coefficient is an important parameter in the production of ammonium nitrate, and assuming a monotonic value in climate models may be an oversimplified approach given the high sensitivity of HNO3 uptake to ambient aerosol composition. Future simulations would benefit from stronger observational constraints on the HNO3 and NH3 uptake rates as a function of aerosol composition, relative humidity, and temperature, perhaps from targeted laboratory studies.
In a follow-on study, we aim to evaluate the nitrate scheme in high-resolution UM simulations for specific meteorological case studies in a manner analogous to Gordon et al. (2018) but over a UK-based domain. Additionally, we will replace the constant HNO3 uptake coefficient in the new nitrate scheme with a volume-weighted value based on aerosol composition and relative humidity, and we rerun the simulations using transient CMIP6-like atmosphere-only UM integrations. The next issue to address will be coupling NO3 and NH4 aerosol within the UKESM framework. At present, fixed nitrogen (NOy+NHx) deposition to the land-surface model (JULES) in UKESM is applied using offline deposition fields from the input4MIPs database (see Sellar et al., 2020, for further details). Meanwhile, the ocean biogeochemistry module in UKESM (MEDUSA2; Yool et al., 2013) has a closed nitrogen budget thus obviating interactions with atmospheric nitrogen. With the addition of ammonium and nitrate aerosol to a future version of UKESM, we will aim to fully couple atmospheric fixed-nitrogen deposition with the land and ocean surfaces to permit a comprehensive closed-budget nitrogen cycle.
In conclusion, the addition of ammonium and nitrate aerosol to UKCA-mode in the UM is a step change in aerosol-modelling capability in the UK and will increase confidence in future simulations of aerosol forcing and regional air pollution episodes. Additionally, nitrate concentrations have been shown to be highly sensitive to the nitric acid uptake rate, paving a way for climate models to reduce outstanding biases in ammonium nitrate concentrations.
Due to intellectual property rights restrictions, we cannot provide either the source code or documentation papers for the UM. The Met Office Unified Model is available for use under licence. A number of research organisations and national meteorological services use the UM in collaboration with the Met Office to undertake basic atmospheric process research, produce forecasts, develop the UM code, and build and evaluate Earth system models. For further information on how to apply for a licence, see http://www.metoffice.gov.uk/research/modelling-systems/unified-model (last access: 16 April 2021). The nitrate scheme is now available on the “trunk” (the Met Office's data repository) and is available for all future UM versions since vn11.8 in UKCA-mode setup 10.
The UM data used to produce the figures are available from the Centre of Environmental Data Analysis (CEDA) (https://doi.org/10.5285/0613b74ecc574fa7b6ac8a22838c5f81, Jones et al., 2021).
The supplement related to this article is available online at: https://doi.org/10.5194/acp-21-15901-2021-supplement.
ACJ developed the nitrate scheme with assistance from AH, SR, NLA, MD, and AJH. ACJ performed the simulations with assistance from NLA and MD. ACJ, AJH, CH, BJ, JPM, and SR analysed the simulations and compared the results to observations. ACJ wrote the article with assistance from all co-authors.
The contact author has declared that neither they nor their co-authors have any competing interests.
Publisher’s note: Copernicus Publications remains neutral with regard to jurisdictional claims in published maps and institutional affiliations.
The authors would like to thank the Met Office and the UM team for providing the UM climate model; NASA for making the MODIS satellite data freely available; and EMEP, the United States Environment Protection Agency (EPA), and GASSP for making their concentration measurement data freely available. The authors thank the many scientists who have contributed data utilised in this evaluation. The authors would also like to thank Didier Hauglustaine, John Hemmings, Nicolas Bellouin, Alexander Archibald, Paul Griffiths, Steve Rumbold, Michael Cotterell, and Paul Agnew for their comments and assistance throughout this project. Figures were produced using Python 3.6.10 (https://www.python.org/, last access: 22 October 2021) and Iris 2.4.0 (https://scitools.org.uk/, last access: 22 October 2021).
Anthony C. Jones and Adrian Hill are supported by the Clean Air programme which is jointly delivered by the Natural Environment Research Council (NERC) and the Met Office, with the Economic and Social Research Council (ESRC), Engineering and Physical Sciences Research Council (EPSRC), Innovate UK, Medical Research Council (MRC), National Physical Laboratory (NPL), Science and Technology Facilities Research Council (STFC), Department for Environment, Food and Rural Affairs (Defra), Department for Health and Social Care (DHSC), Department for Transport (DfT), Scottish Government and Welsh Government. Alan J. Hewitt is supported by the Joint DECC/Defra Met Office Hadley Centre Climate Programme (GA01101). Ben Johnson is funded by the Met Office Hadley Centre Climate Programme funded by BEIS and Defra (GA01101). N. Luke Abraham is supported by NERC and NCAS through the ACSIS project. Steven T. Turnock would like to acknowledge that support for this work came from the UK-China Research and Innovation Partnership Fund through the Met Office Climate Science for Service Partnership (CSSP) China as part of the Newton Fund.
This research has been supported by the Clean Air programme, the Joint DECC/Defra Met Office Hadley Centre Climate Programme (GA01101), the Met Office Hadley Centre Climate Programme funded by BEIS and Defra (GA01101), NERC and NCAS through the ACSIS project, and the UK-China Research and Innovation Partnership Fund.
This paper was edited by Jennifer G. Murphy and reviewed by two anonymous referees.
Aas, W., Tsyro, S., Bieber, E., Bergström, R., Ceburnis, D., Ellermann, T., Fagerli, H., Frölich, M., Gehrig, R., Makkonen, U., Nemitz, E., Otjes, R., Perez, N., Perrino, C., Prévôt, A. S. H., Putaud, J.-P., Simpson, D., Spindler, G., Vana, M., and Yttri, K. E.: Lessons learnt from the first EMEP intensive measurement periods, Atmos. Chem. Phys., 12, 8073–8094, https://doi.org/10.5194/acp-12-8073-2012, 2012.
Ackermann, I. J., Hass, H., Memmesheimer, M., Ziegenbein, C., and Ebel, A.: The parameterization of the sulfate-nitrate ammonia aerosol system in the long-range transport model EURAD, Meteorol. Atmos. Phys., 57, 101–114, 1995.
Ansari, A. S. and Pandis, S. N.: Response of inorganic PM to precursor concentrations, Environ. Sci. Technol., 32, 2706–2714, 1998.
Archibald, A. T., O'Connor, F. M., Abraham, N. L., Archer-Nicholls, S., Chipperfield, M. P., Dalvi, M., Folberth, G. A., Dennison, F., Dhomse, S. S., Griffiths, P. T., Hardacre, C., Hewitt, A. J., Hill, R. S., Johnson, C. E., Keeble, J., Köhler, M. O., Morgenstern, O., Mulcahy, J. P., Ordóñez, C., Pope, R. J., Rumbold, S. T., Russo, M. R., Savage, N. H., Sellar, A., Stringer, M., Turnock, S. T., Wild, O., and Zeng, G.: Description and evaluation of the UKCA stratosphere–troposphere chemistry scheme (StratTrop vn 1.0) implemented in UKESM1, Geosci. Model Dev., 13, 1223–1266, https://doi.org/10.5194/gmd-13-1223-2020, 2020.
Atkinson, R.: Atmospheric Chemistry of VOCs and NOx, Atmos. Environ., 34, 2063–2101, https://doi.org/10.1016/S1352-2310(99)00460-4, 2000.
Ballard, S. S., Browder, J. S., and Ebersole, J. F.: Refractive index of special crystals and certain glasses, in American Institute of Physics Handbook, 3rd edn., McGraw-Hill, New York, 1972.
Bauer, S. E., Balkanski, Y., Schulz, M., Hauglustaine, D. A., and Dentener, F.: Global modeling of heterogeneous chemistry on mineral aerosol surfaces: influence on tropospheric ozone chemistry and comparison to observations, J. Geophys. Res., 109, D02304, https://doi.org/10.1029/2003JD003868, 2004.
Bauer, S. E., Koch, D., Unger, N., Metzger, S. M., Shindell, D. T., and Streets, D. G.: Nitrate aerosols today and in 2030: a global simulation including aerosols and tropospheric ozone, Atmos. Chem. Phys., 7, 5043–5059, https://doi.org/10.5194/acp-7-5043-2007, 2007.
Bauer, S. E., Tsigaridis, K., and Miller, R.: Significant atmospheric aerosol pollution caused by world food cultivation, Geophys. Res. Lett., 43, 5394–5400, https://doi.org/10.1002/2016GL068354, 2016.
Bellouin, N., Rae, J., Jones, A., Johnson, C., Haywood, J., and Boucher, O.: Aerosol forcing in the Climate Model Intercomparison Project (CMIP5) simulations by HadGEM2-ES and the role of ammonium nitrate, J. Geophys. Res.-Atmos., 116, D20206, https://doi.org/10.1029/2011jd016074, 2011.
Bellouin, N., Mann, G. W., Woodhouse, M. T., Johnson, C., Carslaw, K. S., and Dalvi, M.: Impact of the modal aerosol scheme GLOMAP-mode on aerosol forcing in the Hadley Centre Global Environmental Model, Atmos. Chem. Phys., 13, 3027–3044, https://doi.org/10.5194/acp-13-3027-2013, 2013.
Bellouin, N., Quaas, J., Gryspeerdt, E., Kinne, S., Stier, P., WatsonParris, D., Boucher, O., Carslaw, K., Christensen, M., Daniau, A.-L., Dufresne, J.-L., Feingold, G., Fiedler, S., Forster, P., Gettelman, A., Haywood, J., Lohmann, U., Malavelle, F., Mauritsen, T., McCoy, D., Myhre, G., Mülmenstädt, J., Neubauer, D., Possner, A., Rugenstein, M., Sato, Y., Schulz, M., Schwartz, S., Sourdeval, O., Storelvmo, T., Toll, V., Winker, D., and Stevens, B.: Bounding global aerosol radiative forcing of climate change, Rev. Geophys., 58, e2019RG000660, https://doi.org/10.1029/2019RG000660, 2020.
Benduhn, F., Mann, G. W., Pringle, K. J., Topping, D. O., McFiggans, G., and Carslaw, K. S.: Size-resolved simulations of the aerosol inorganic composition with the new hybrid dissolution solver HyDiS-1.0: description, evaluation and first global modelling results, Geosci. Model Dev., 9, 3875–3906, https://doi.org/10.5194/gmd-9-3875-2016, 2016.
Bian, H., Chin, M., Hauglustaine, D. A., Schulz, M., Myhre, G., Bauer, S. E., Lund, M. T., Karydis, V. A., Kucsera, T. L., Pan, X., Pozzer, A., Skeie, R. B., Steenrod, S. D., Sudo, K., Tsigaridis, K., Tsimpidi, A. P., and Tsyro, S. G.: Investigation of global particulate nitrate from the AeroCom phase III experiment, Atmos. Chem. Phys., 17, 12911–12940, https://doi.org/10.5194/acp-17-12911-2017, 2017.
Bouwman, A. F., Lee, D. S., Asman, W. A. H., Dentener, F. J., Van Der Hoek, K. W., and Olivier, J. G. J.: A Global High-Resolution Emission Inventory for Ammonia, Global Biogeochem. Cy., 11, 561–587, https://doi.org/10.1029/97GB02266, 1997.
Buchard, V., Randles, C. A., da Silva, A. M., Darmenov, A., Colarco, P. R., Govindaraju, R., Ferrare, R., Hair, J., Beyersdorf, A. J., Ziemba, L. D., Yu, H., Buchard, V., Randles, C. A., Silva, A. M. da, Darmenov, A., Colarco, P. R., Govindaraju, R., Ferrare, R., Hair, J., Beyersdorf, A. J., Ziemba, L. D., and Yu, H.: The MERRA-2 Aerosol Reanalysis, 1980 Onward. Part II: Evaluation and Case Studies, J. Climate, 30, 6851–6872, https://doi.org/10.1175/JCLI-D-16-0613.1, 2017.
Carn, S. A., Fioletov, V. E., McLinden, C. A., Li, C., and Krotkov, N. A.: A decade of global volcanic SO2 emissions measured from space, Sci. Rep., 7, 44095, https://doi.org/10.1038/srep44095, 2017.
Cleaver, B., Rhodes, E., and Ubbelohde, A. R.: Studies of phase transformations in nitrates and nitrites I. Changes in ultra-violet absorption spectra on melting, Proc. R. Soc. London, 276, 437–453, https://doi.org/10.1098/rspa.1963.0217, 1963.
Cotterell, M. I., Willoughby, R. E., Bzdek, B. R., Orr-Ewing, A. J., and Reid, J. P.: A complete parameterisation of the relative humidity and wavelength dependence of the refractive index of hygroscopic inorganic aerosol particles, Atmos. Chem. Phys., 17, 9837–9851, https://doi.org/10.5194/acp-17-9837-2017, 2017.
Crutzen, P. J.: The influence of nitrogen oxides on the atmospheric ozone content, Q. J. Roy. Meteor. Soc., 96, 320–325, https://doi.org/10.1002/qj.49709640815, 1970.
Department for Environment, Food and Rural Affairs (DEFRA): Report: Fine Particulate Matter (PM2.5) in the United Kingdom, DEFRA, London, UK, 203 pp., available at: https://uk-air.defra.gov.uk/library/reports?report_id=727 (last access: 22 October 2021), 2012.
Drugé, T., Nabat, P., Mallet, M., and Somot, S.: Model simulation of ammonium and nitrate aerosols distribution in the Euro-Mediterranean region and their radiative and climatic effects over 1979–2016, Atmos. Chem. Phys., 19, 3707–3731, https://doi.org/10.5194/acp-19-3707-2019, 2019.
Fairlie, T. D., Jacob, D. J., Dibb, J. E., Alexander, B., Avery, M. A., van Donkelaar, A., and Zhang, L.: Impact of mineral dust on nitrate, sulfate, and ozone in transpacific Asian pollution plumes, Atmos. Chem. Phys., 10, 3999–4012, https://doi.org/10.5194/acp-10-3999-2010, 2010.
Feng, Y. and Penner, J. E.: Global modeling of nitrate and ammonium: Interaction of aerosols and tropospheric chemistry, J. Geophys. Res., 112, D01304, https://doi.org/10.1029/2005jd006404, 2007.
Feng, L., Smith, S. J., Braun, C., Crippa, M., Gidden, M. J., Hoesly, R., Klimont, Z., van Marle, M., van den Berg, M., and van der Werf, G. R.: The generation of gridded emissions data for CMIP6, Geosci. Model Dev., 13, 461–482, https://doi.org/10.5194/gmd-13-461-2020, 2020
Finkelstein, P., Ellestad, T., Clarke, J., Meyers, T., Schwede, D., Hebert, E., and Neal, J.: Ozone and sulfur dioxide dry deposition to forests: Observations and model evaluation, J. Geophys. Res., 105, 15365–15377, https://doi.org/10.1029/2000JD900185, 2000.
Fortems-Cheiney, A., Dufour, G., Hamaoui-Laguel, L., Foret, G., Siour, G., Van Damme, M., Meleux, F., Coheur, P.-F., Clerbaux, C., Clarisse, L., Favez, O., Wallasch, M., and Beekmann, M.: Unaccounted variability in NH3 agricultural sources detected by IASI contributing to European spring haze episode, Geophys. Res. Lett., 43, 5475–5482, https://doi.org/10.1002/2016GL069361, 2016.
Fuchs, N. A. and Sutugin, A. G.: Highly Dispersed Aerosols, Butterworth-Heinemann, Newton, Mass., USA, 105 pp., 1970.
Gerber, H. E.: Relative-humidity parameterization of the Navy Aerosol Model (NAM), NRL Report 8956, Naval Research Laboratory, Washington, DC, 1985.
Giannakis, E., Kushta, J., Bruggeman, A., and Lelieveld, J.: Costs and benefits of agricultural ammonia emission abatement options for compliance with European air quality regulations, Environmental Sciences Europe, 31, 93, https://doi.org/10.1186/s12302-019-0275-0, 2019.
Giorgi, F.: Climate change hot-spots, Geophys. Res. Lett., 33, L08707, https://doi.org/10.1029/2006GL025734, 2006.
Gordon, H., Field, P. R., Abel, S. J., Dalvi, M., Grosvenor, D. P., Hill, A. A., Johnson, B. T., Miltenberger, A. K., Yoshioka, M., and Carslaw, K. S.: Large simulated radiative effects of smoke in the south-east Atlantic, Atmos. Chem. Phys., 18, 15261–15289, https://doi.org/10.5194/acp-18-15261-2018, 2018.
Gosse, S. F., Wang, M., Labrie, D., and Chylek, P.: Imaginary part of the refractive index of sulfates and nitrates in the 0.7–2.6 µm spectral region, Appl. Optics, 36, 3622–3634, 1997.
Granier, C., Bessagnet, B., Bond, T., D'Angiola, A., Denier van der Gon, H., Frost, G. J., Heil, A., Kaiser, J. W., Kinne, S., Klimont, Z., Kloster, S., Lamarque, J.-F., Liousse, C., Masui, T., Meleux, F., Mieville, A., Ohara, T., Raut, J.-C., Riahi, K., Schultz, M. G., Smith, S. J., Thompson, A., van Aardenne, J., van der Werf, G. R., and van Vuuren, D. P.: Evolution of anthropogenic and biomass burning emissions of air pollutants at global and regional scales during the 1980–2010 period, Clim. Change, 109, 163–190, https://doi.org/10.1007/s10584-011-0154-1, 2011.
Hardacre, C., Mulcahy, J. P., Pope, R., Jones, C. G., Rumbold, S. R., Li, C., and Turnock, S. T.: Evaluation of SO2, and an updated SO2 dry deposition parameterization in UKESM1, Atmos. Chem. Phys. Discuss. [preprint], https://doi.org/10.5194/acp-2021-238, in review, 2021.
Hauglustaine, D. A., Balkanski, Y., and Schulz, M.: A global model simulation of present and future nitrate aerosols and their direct radiative forcing of climate, Atmos. Chem. Phys., 14, 11031–11063, https://doi.org/10.5194/acp-14-11031-2014, 2014.
Hemmings, J. and Savage, N.: An Initial Evaluation of the GLOMAP-mode Aerosol Scheme for UK Air-Quality Forecasting with AQUM, Met Office, Exeter, UK, Met Office Weather Science Technical Report No. 632, 70 pp., available at: https://www.metoffice.gov.uk/research/library-and-archive/publications/science/weather-science-technical-reports (last access: 22 October 2021), 2018.
Hoesly, R. M., Smith, S. J., Feng, L., Klimont, Z., Janssens-Maenhout, G., Pitkanen, T., Seibert, J. J., Vu, L., Andres, R. J., Bolt, R. M., Bond, T. C., Dawidowski, L., Kholod, N., Kurokawa, J.-I., Li, M., Liu, L., Lu, Z., Moura, M. C. P., O'Rourke, P. R., and Zhang, Q.: Historical (1750–2014) anthropogenic emissions of reactive gases and aerosols from the Community Emissions Data System (CEDS), Geosci. Model Dev., 11, 369–408, https://doi.org/10.5194/gmd-11-369-2018, 2018.
Hsu, N. C., Jeong, M.-J., Bettenhausen, C., Sayer, A. M., Hansell, R., Seftor, C. S., Huang, J., and Tsay S.-C.: Enhanced Deep Blue aerosol retrieval algorithm: The second generation, J. Geophys. Res.-Atmos., 118, 9296–9315, https://doi.org/10.1002/jgrd.50712, 2013.
Ivlev, L. S. and Popova, S. I.: Optical constants of substances of atmospheric aerosol, Sov. Phys. J., 15, 703–707, https://doi.org/10.1007/BF00893039, 1972.
Jacobson, M.: Numerical techniques to solve condensational and dissolutional growth equations when growth is coupled to reversible aqueous reactions, Aerosol Sci. Tech., 27, 491–498, https://doi.org/10.1080/02786829708965489, 1997.
Jacobson, M. Z.: Isolating nitrated and aromatic aerosols and nitrated aromatic gases as sources of ultraviolet light absorption, J. Geophys. Res., 104, 3527–3542, https://doi.org/10.1029/1998JD100054, 1999.
Jarzembski, M. A., Norman, M. L., Fuller, K. A., Srivastava, V., and Cutten, D. R.: Complex refractive index of ammonium nitrate in the 2–20 µm spectral range, Appl. Optics, 42, 922–930, https://doi.org/10.1364/AO.42.000922, 2003.
Jimenez, J. L., Canagaratna, M. R., Donahue, N. M., Prevot, A. S. H., Zhang, Q., Kroll, J. H., DeCarlo, P. F., Allan, J. D., Coe, H., Ng, N. L., Aiken, A. C., Docherty, K. S., Ulbrich, I. M., Grieshop, A. P., Robinson, A. L., Duplissy, J., Smith, J. D., Wilson, K. R., Lanz, V. A., Hueglin, C., Sun, Y. L., Tian, J., Laaksonen, A., Raatikainen, T., Rautiainen, J., Vaattovaara, P., Ehn, M., Kulmala, M., Tomlinson, J. M., Collins, D. R., Cubison, M. J., Dunlea, E. J., Huffman, J. A., Onasch, T. B., Alfarra, M. R., Williams, P. I., Bower, K., Kondo, Y., Schneider, J., Drewnick, F., Borrmann, S., Weimer, S., Demerjian, K., Salcedo, D., Cottrell, L., Griffin, R., Takami, A., Miyoshi, T., Hatakeyama, S., Shimono, A., Sun, J. Y., Zhang, Y. M., Dzepina, K., Kimmel, J. R., Sueper, D., Jayne, J. T., Herndon, S. C., Trimborn, A. M., Williams, L. R., Wood, E. C., Middlebrook, A. M., Kolb, C. E., Baltensperger, U., and Worsnop, D. R.: Evolution of organic aerosols in the atmosphere, Science, 326, 1525–1529, https://doi.org/10.1126/science.1180353, 2009.
Jones, A.C., Hill, A., Remy, S., Abraham, N. L., Dalvi, M., Hardacre, C., Hewitt, A. J., Johnson, B., Mulcahy, J. P., and Turnock, S.: Exploring the sensitivity of atmospheric nitrate concentrations to nitric acid uptake rate using the Met Office's Unified Model: nitrate and nitric acid simulation data, NERC EDS Centre for Environmental Data Analysis [data set], https://doi.org/10.5285/0613b74ecc574fa7b6ac8a22838c5f81, 2021.
Kucera, V. and Fitz, S.: Direct and indirect air pollution effects on materials including cultural monuments, Water Air Soil Pollut., 85, 153–165, https://doi.org/10.1007/BF00483697 1995.
Lee, S.-H., Gordon, H., Yu, H., Lehtipalo, K., Haley, R., Li, Y., and Zhang, R.: New particle formation in the atmosphere: From molecular clusters to global climate. J. Geophys. Res.-Atmos., 124, 7098–7146, https://doi.org/10.1029/2018JD029356, 2019.
Lelieveld, J., Evans, J. S., Fnais, M., Giannadaki, D., and Pozzer, A.: The contribution of outdoor air pollution sources to premature mortality on a global scale, Nature, 525, 367–371, https://doi.org/10.1038/nature15371, 2015.
Levy, R. C., Mattoo, S., Munchak, L. A., Remer, L. A., Sayer, A. M., Patadia, F., and Hsu, N. C.: The Collection 6 MODIS aerosol products over land and ocean, Atmos. Meas. Tech., 6, 2989–3034, https://doi.org/10.5194/amt-6-2989-2013, 2013.
Li, W. J. and Shao, L. Y.: Observation of nitrate coatings on atmospheric mineral dust particles, Atmos. Chem. Phys., 9, 1863–1871, https://doi.org/10.5194/acp-9-1863-2009, 2009.
Li, Y., Schichtel, B. A., Walker, J. T., Schwede, D. B., Chen, X., Lehmann, C. M. B., Puchalski, M. A., Gay, D. A., and Collett, J. L.: Increasing importance of deposition of reduced nitrogen in the United States, P. Natl. Acad. Sci. USA, 113, 5874–5879, https://doi.org/10.1073/pnas.1525736113, 2016.
Liao, H., Adams, P. J., Chung, S. H., Seinfeld, J. H., Mickley, L. J., and Jacob, D. J.: Interactions between tropospheric chemistry and aerosols in a unified general circulation model, J. Geophys. Res., 108, 4001, https://doi.org/10.1029/2001JD001260, 2003.
Lovett, G. M., Tear, T. H., Evers, D. C., Findlay, S. E. G., Cosby, B. J., Dunscomb, J. K., Driscoll, C. T., and Weathers, K. C.: Effects of air pollution on ecosystems and biological diversity in the eastern United States, Ann. NY Acad. Sci., 1162, 99–135, https://doi.org/10.1111/j.1749-6632.2009.04153.x, 2009.
Makar, P. A., Wiebe, H. A., Staebler, R. M., Li, S.-M., and Anlauf, K.: Measurement and modelling of particle nitrate formation, J. Geophys. Res.-Atmos., 103, 13095–13110, https://doi.org/10.1029/98JD00978, 1998.
Mann, G. W., Carslaw, K. S., Spracklen, D. V., Ridley, D. A., Manktelow, P. T., Chipperfield, M. P., Pickering, S. J., and Johnson, C. E.: Description and evaluation of GLOMAP-mode: a modal global aerosol microphysics model for the UKCA composition-climate model, Geosci. Model Dev., 3, 519–551, https://doi.org/10.5194/gmd-3-519-2010, 2010.
McDuffie, E. E., Smith, S. J., O'Rourke, P., Tibrewal, K., Venkataraman, C., Marais, E. A., Zheng, B., Crippa, M., Brauer, M., and Martin, R. V.: A global anthropogenic emission inventory of atmospheric pollutants from sector- and fuel-specific sources (1970–2017): an application of the Community Emissions Data System (CEDS), Earth Syst. Sci. Data, 12, 3413–3442, https://doi.org/10.5194/essd-12-3413-2020, 2020.
Metzger, S., Dentener, F., Pandis, S., and Lelieveld, J.: Gas/aerosol partitioning: 1. A computationally efficient model, J. Geophys. Res., 107, D164312, https://doi.org/10.1029/2001JD001102, 2002.
Monks, P. S., Granier, C., Fuzzi, S., Stohl, A., Williams, M. L., Akimoto, H., Amann, M., Baklanov, A., Baltensperger, U., Bey, I., Blake, N., Blake, R. S., Carslaw, K., Cooper, O. R., Dentener, F., Fowler, D., Fragkou, E., Frost, G. J., Generoso, S., Ginoux, P., Grewe, V., Guenther, A., Hansson, H. C., Henne, S., Hjorth, J., Hofzumahaus, A., Huntrieser, H., Isaksen, I. S. A., Jenkin, M. E., Kaiser, J., Kanakidou, M., Klimont, Z., Kulmala, M., Laj, P., Lawrence, M. G., Lee, J. D., Liousse, C., Maione, M., McFiggans, G., Metzger, A., Mieville, A., Moussiopoulos, N., Orlando, J. J., O'Dowd, C. D., Palmer, P. I., Parrish, D. D., Petzold, A., Platt, U., Poeschl, U., Prevot, A. S. H., Reeves, C. E., Reimann, S., Rudich, Y., Sellegri, K., Steinbrecher, R., Simpson, D., ten Brink, H., Theloke, J., van der Werf, G. R., Vautard, R., Vestreng, V., Vlachokostas, C., and von Glasow, R.: Atmospheric composition change – global and regional air quality, Atmos. Environ., 43, 5268–5350, https://doi.org/10.1016/j.atmosenv.2009.08.021, 2009.
Mozurkewich, M.: The dissociation constant of ammonium nitrate and its dependence on temperature, relative humidity and particle size, Atmos. Environ. A-Gen., 27, 261–270, 1993.
Mulcahy, J. P., Johnson, C., Jones, C. G., Povey, A. C., Scott, C. E., Sellar, A., Turnock, S. T., Woodhouse, M. T., Abraham, N. L., Andrews, M. B., Bellouin, N., Browse, J., Carslaw, K. S., Dalvi, M., Folberth, G. A., Glover, M., Grosvenor, D. P., Hardacre, C., Hill, R., Johnson, B., Jones, A., Kipling, Z., Mann, G., Mollard, J., O'Connor, F. M., Palmiéri, J., Reddington, C., Rumbold, S. T., Richardson, M., Schutgens, N. A. J., Stier, P., Stringer, M., Tang, Y., Walton, J., Woodward, S., and Yool, A.: Description and evaluation of aerosol in UKESM1 and HadGEM3-GC3.1 CMIP6 historical simulations, Geosci. Model Dev., 13, 6383–6423, https://doi.org/10.5194/gmd-13-6383-2020, 2020.
Myhre, G., Grini, A., and Metzger, S.: Modelling of nitrate and ammonium-containing aerosols in presence of sea salt, Atmos. Chem. Phys., 6, 4809–4821, https://doi.org/10.5194/acp-6-4809-2006, 2006.
Myhre, G., Samset, B. H., Schulz, M., Balkanski, Y., Bauer, S., Berntsen, T. K., Bian, H., Bellouin, N., Chin, M., Diehl, T., Easter, R. C., Feichter, J., Ghan, S. J., Hauglustaine, D., Iversen, T., Kinne, S., Kirkevåg, A., Lamarque, J.-F., Lin, G., Liu, X., Lund, M. T., Luo, G., Ma, X., van Noije, T., Penner, J. E., Rasch, P. J., Ruiz, A., Seland, Ø., Skeie, R. B., Stier, P., Takemura, T., Tsigaridis, K., Wang, P., Wang, Z., Xu, L., Yu, H., Yu, F., Yoon, J.-H., Zhang, K., Zhang, H., and Zhou, C.: Radiative forcing of the direct aerosol effect from AeroCom Phase II simulations, Atmos. Chem. Phys., 13, 1853–1877, https://doi.org/10.5194/acp-13-1853-2013, 2013.
Nenes, A., Pandis, S. N., and Pilinis, C.: ISORROPIA: A new thermodynamic equilibrium model for multiphase multicomponent inorganic aerosols, Aquat. Geochem., 4, 123–152, https://doi.org/10.1023/A:1009604003981, 1998.
Palik, E. D. (Ed.) and Khanna, R.: Sodium Nitrate (NaNO3), in: Handbook of Optical Constants, Academic Press, New York, 3, p. 871, 1998.
Park, R. J., Jacob, D. J., Field, B. D., Yantosca, R. M., and Chin, M.: Natural and transboundary pollution influences on sulfate-nitrate-ammonium aerosols in the United States: Implications for policy, J. Geophys. Res., 109, D15204, https://doi.org/10.1029/2003JD004473, 2004.
Paulot, F., Ginoux, P., Cooke, W. F., Donner, L. J., Fan, S., Lin, M.-Y., Mao, J., Naik, V., and Horowitz, L. W.: Sensitivity of nitrate aerosols to ammonia emissions and to nitrate chemistry: implications for present and future nitrate optical depth, Atmos. Chem. Phys., 16, 1459–1477, https://doi.org/10.5194/acp-16-1459-2016, 2016.
Putaud, J. P., Raes, F., Van Dingenen, R., Bruggemann, E., Faccini, M. C., Decesari, S., Fuzzi, S., Gehrig, R., Huglin, C., Laj, P., Lorbeer, G., Maenhaut, W., Mihalopoulos, N., Muller, K., Querol, X., Rodriguez, S., Schneider, J., Spindler, G., ten Brink, H., Tørseth, K., and Wiedensohler, A.: A European aerosol phenomenology 2: chemical characteristics of particulate matter at kerbside, urban, rural and background sites in Europe, Atmos. Environ., 38, 2579–2595, 2004
Randles, C. A., da Silva, A. M., Buchard, V., Colarco, P. R., Darmenov, A., Govindaraju, R., Smirnov, A., Holben, B., Ferrare, R., Hair, J., Shinozuka, Y., Flynn, C. J., Randles, C. A., Silva, A. M. da, Buchard, V., Colarco, P. R., Darmenov, A., Govindaraju, R., Smirnov, A., Holben, B., Ferrare, R., Hair, J., Shinozuka, Y., and Flynn, C. J.: The MERRA-2 Aerosol Reanalysis, 1980 Onward. Part I: System Description and Data Assimilation Evaluation, J. Climate, 30, 6823–6850, https://doi.org/10.1175/JCLI-D-16-0609.1, 2017.
Reddington, C. L., Carslaw, K. S., Stier, P., Schutgens, N., Coe, H., Liu, D., Allan, J., Browse, J., Pringle, K. J., Lee, L. A., Yoshioka, M., Johnson, J. S., Regayre, L. A., Spracklen, D. V., Mann, G. W., Clarke, A., Hermann, M., Henning, S., Wex, H., Kristensen, T. B., Leaitch, W. R., Pöschl, U., Rose, D., Andreae, M. O., Schmale, J., Kondo, Y., Oshima, N., Schwarz, J. P., Nenes, A., Anderson, B., Roberts, G. C., Snider, J. R., Leck, C., Quinn, P. K., Chi, X., Ding, A., Jimenez, J. L., and Zhang, Q.: The global aerosol synthesis and science project (GASSP): Measurements and modeling to reduce uncertainty, B. Am. Meteorol. Soc., 98, 1857–1877, https://doi.org/10.1175/BAMS-D-15-00317.1, 2017.
Rémy, S., Kipling, Z., Flemming, J., Boucher, O., Nabat, P., Michou, M., Bozzo, A., Ades, M., Huijnen, V., Benedetti, A., Engelen, R., Peuch, V.-H., and Morcrette, J.-J.: Description and evaluation of the tropospheric aerosol scheme in the European Centre for Medium-Range Weather Forecasts (ECMWF) Integrated Forecasting System (IFS-AER, cycle 45R1), Geosci. Model Dev., 12, 4627–4659, https://doi.org/10.5194/gmd-12-4627-2019, 2019.
Sander, S. P., Abbatt, J., Barker, J. R., Burkholder, J. B., Friedl, R. R., Golden, D. M., Huie, R. E., Kolb, C. E., Kurylo, M. J., Moortgat, G. K., Orkin, V. L., and Wine, P. H.: Chemical Kinetics and Photochemical Data for Use in Atmospheric Studies, Evaluation No. 17, JPL Publication 10-6, Jet Propulsion Laboratory, Pasadena, 2011.
Savage, N. H., Agnew, P., Davis, L. S., Ordóñez, C., Thorpe, R., Johnson, C. E., O'Connor, F. M., and Dalvi, M.: Air quality modelling using the Met Office Unified Model (AQUM OS24-26): model description and initial evaluation, Geosci. Model Dev., 6, 353–372, https://doi.org/10.5194/gmd-6-353-2013, 2013.
Schwartz, S. E.: Mass transport considerations pertinent to aqueous phase reactions of gases in liquid-water clouds, in: Chemistry of Multiphase Atmospheric Systems, edited by: Jaeschke, W., Springer, New York, 415–471, 1986.
Seinfeld, J. H. and Pandis, S. N.: Atmospheric Chemistry and Physics: From Air Pollution to Climate Change, John, Wiley & Sons, Inc., New York, USA, 1998.
Sellar, A., Jones, C. G., Mulcahy, J. P., Tang, Y., Yool, A., Wiltshire, A., O'Connor, F. M., Stringer, M., Hill, R., Palmieri, J., Woodward, S., de Mora, L., Kuhlbrodt, T., Rumbold, S., Kelley, D. I., Ellis, R., Johnson, C. E., Walton, J., Abraham, N. L., Andrews, M. B., Andrews, T., Archibald, A. T., Berthou, S., Burke, E., Blockley, E., Carslaw, K., Dalvi, M., Edwards, J., Folberth, G. A., Gedney, N., Griffiths, P. T., Harper, A. B., Hendry, M. A., Hewitt, A. J., Johnson, B., Jones, A., Jones, C. D., Keeble, J., Liddicoat, S., Morgenstern, O., Parker, R. J., Predoi, V., Robertson, E., Siahaan, A., Smith, R. S., Swaminathan, R., Woodhouse, M., Zeng, G., and Zerroukat, M.: UKESM1: Description and evaluation of the UK Earth System Model, J. Adv. Model. Earth Sy., 11, 4513–4558, https://doi.org/10.1029/2019MS001739, 2019.
Sellar, A., Walton, J., Jones, C. G., Wood, R., Abraham, N. L., Andrejczuk, M., Andrews, M. B., Andrews, T., Archibald, A. T., Dyson, H., Elkington, M., Ellis, R., Florek, P., Good, P., Gohar, L., Haddad, S., Hardiman, S. C., Hogan, E., Iwi, A., Jones, C. D., Johnson, B., Kelley, D. I., Kettleborough, J., Knight, J. R., Köhler, M. O., Kuhlbrodt, T., Liddicoat, S., Linova-Pavlova, I., Mizielinski, M. S., Morgenstern, O., Mulcahy, J., Neininger, E., O'Connor, F. M., Petrie, R., Ridley, J., Rioual, J.-C., Roberts, M., Robertson, E., Rumbold, S., Seddon, J., Shepherd, H., Shim, S., Stephens, A., Teixeira, J. C., Tang, Y., Williams, J., and Wiltshire, A.: Implementation of UK Earth system models for CMIP6, J. Adv. Model. Earth Sy., 12, e2019MS001946, https://doi.org/10.1029/2019MS001946, 2020.
Shah, V., Jaeglé, L., Thornton, J. A., Lopez-Hilfiker, F. D., Lee, B. H., Schroder, J. C., Campuzano-Jost, P., Jimenez, J. L., Guo, H., Sullivan, A. P., Weber, R. J., Green, J. R., Fiddler, M. N., Bililign, S., Campos, T. L., Stell, M., Weinheimer, A. J., Montzka, D. D., and Brown, S. S.: Chemical feedbacks weaken the wintertime response of particulate sulfate and nitrate to emissions reductions over the eastern United States, P. Natl. Acad. Sci. USA, 115, 8110–8115, https://doi.org/10.1073/pnas.1803295115, 2018.
Smith, C., Hill, A. K., and Torrente-Murciano, L.: Current and future role of Haber–Bosch ammonia in a carbon-free energy landscape, Energy Environ. Sci., 13, 331–344, https://doi.org/10.1039/c9ee02873k, 2020.
Tørseth, K., Aas, W., Breivik, K., Fjæraa, A. M., Fiebig, M., Hjellbrekke, A. G., Lund Myhre, C., Solberg, S., and Yttri, K. E.: Introduction to the European Monitoring and Evaluation Programme (EMEP) and observed atmospheric composition change during 1972–2009, Atmos. Chem. Phys., 12, 5447–5481, https://doi.org/10.5194/acp-12-5447-2012, 2012.
Turnock, S. T., Allen, R. J., Andrews, M., Bauer, S. E., Deushi, M., Emmons, L., Good, P., Horowitz, L., John, J. G., Michou, M., Nabat, P., Naik, V., Neubauer, D., O'Connor, F. M., Olivié, D., Oshima, N., Schulz, M., Sellar, A., Shim, S., Takemura, T., Tilmes, S., Tsigaridis, K., Wu, T., and Zhang, J.: Historical and future changes in air pollutants from CMIP6 models, Atmos. Chem. Phys., 20, 14547–14579, https://doi.org/10.5194/acp-20-14547-2020, 2020.
Twigg, M. M., Ilyinskaya, E., Beccaceci, S., Green, D. C., Jones, M. R., Langford, B., Leeson, S. R., Lingard, J. J. N., Pereira, G. M., Carter, H., Poskitt, J., Richter, A., Ritchie, S., Simmons, I., Smith, R. I., Tang, Y. S., Van Dijk, N., Vincent, K., Nemitz, E., Vieno, M., and Braban, C. F.: Impacts of the 2014–2015 Holuhraun eruption on the UK atmosphere, Atmos. Chem. Phys., 16, 11415–11431, https://doi.org/10.5194/acp-16-11415-2016, 2016.
van Marle, M. J. E., Kloster, S., Magi, B. I., Marlon, J. R., Daniau, A.-L., Field, R. D., Arneth, A., Forrest, M., Hantson, S., Kehrwald, N. M., Knorr, W., Lasslop, G., Li, F., Mangeon, S., Yue, C., Kaiser, J. W., and van der Werf, G. R.: Historic global biomass burning emissions for CMIP6 (BB4CMIP) based on merging satellite observations with proxies and fire models (1750–2015), Geosci. Model Dev., 10, 3329–3357, https://doi.org/10.5194/gmd-10-3329-2017, 2017.
Vlasenko, A., Sjogren, S., Weingartner, E., Stemmler, K., Gäggeler, H. W., and Ammann, M.: Effect of humidity on nitric acid uptake to mineral dust aerosol particles, Atmos. Chem. Phys., 6, 2147–2160, https://doi.org/10.5194/acp-6-2147-2006, 2006.
Vinken, G. C. M., Boersma, K. F., Maasakkers, J. D., Adon, M., and Martin, R. V.: Worldwide biogenic soil NOx emissions inferred from OMI NO2 observations, Atmos. Chem. Phys., 14, 10363–10381, https://doi.org/10.5194/acp-14-10363-2014, 2014.
Walters, D., Baran, A. J., Boutle, I., Brooks, M., Earnshaw, P., Edwards, J., Furtado, K., Hill, P., Lock, A., Manners, J., Morcrette, C., Mulcahy, J., Sanchez, C., Smith, C., Stratton, R., Tennant, W., Tomassini, L., Van Weverberg, K., Vosper, S., Willett, M., Browse, J., Bushell, A., Carslaw, K., Dalvi, M., Essery, R., Gedney, N., Hardiman, S., Johnson, B., Johnson, C., Jones, A., Jones, C., Mann, G., Milton, S., Rumbold, H., Sellar, A., Ujiie, M., Whitall, M., Williams, K., and Zerroukat, M.: The Met Office Unified Model Global Atmosphere 7.0/7.1 and JULES Global Land 7.0 configurations, Geosci. Model Dev., 12, 1909–1963, https://doi.org/10.5194/gmd-12-1909-2019, 2019.
Wang, M., Kong, W., Marten, R., He, X.-C., Chen, D., Pfeifer, J., Heitto, A., Kontkanen, J., Dada, L., Kürten, A., Yli-Juuti, T., Manninen, H. E., Amanatidis, S., Amorim, A., Baalbaki, R., Baccarini, A., Bell, D. M., Bertozzi, B., Bräkling, S., Brilke, S., Murillo, L. C., Chiu, R., Chu, B., De Menezes, L.-P., Duplissy, J., Finkenzeller, H., Carracedo, L. G., Granzin, M., Guida, R., Hansel, A., Hofbauer, V., Krechmer, J., Lehtipalo, K., Lamkaddam, H., Lampimäki, M., Lee, C. P., Makhmutov, V., Marie, G., Mathot, S., Mauldin, R. L., Mentler, B., Müller, T., Onnela, A., Partoll, E., Petäjä, T., Philippov, M., Pospisilova, V., Ranjithkumar, A., Rissanen, M., Rörup, B., Scholz, W., Shen, J., Simon, M., Sipilä, M., Steiner, G., Stolzenburg, D., Tham, Y. J., Tomé, A., Wagner, A. C., Wang, D. S., Wang, Y., Weber, S. K., Winkler, P. M., Wlasits, P. J., Wu, Y., Xiao, M., Ye, Q., Zauner-Wieczorek, M., Zhou, X., Volkamer, R., Riipinen, I., Dommen, J., Curtius, J., Baltensperger, U., Kulmala, M., Worsnop, D. R., Kirkby, J., Seinfeld, J. H., El-Haddad, I., Flagan, R. C., and Donahue, N. M.: Rapid growth of new atmospheric particles by nitric acid and ammonia condensation, Nature, 581, 184–189, https://doi.org/10.1038/s41586-020-2270-4, 2020
Weast, R. C.: CRC Handbook of Chemistry and Physics, 1971–1972: A Ready Reference Book of Chemical and Physical Data, 52nd edn., CRC Press, Cleveland, Ohio, USA, 1971.
Wexler, A. S. and Seinfeld, J. H.: The distribution of ammonium salts among a size and composition dispersed aerosol, Atmos. Environ., 24A, 1231–1246, 1990.
Womack, C. C., McDuffie, E. E., Edwards, P. M., Bares, R., Gouw, J. A. A., Docherty, K. S., Dubé, W. P., Fibiger, D. L., Franchin, A., Gilman, J. B., Goldberger, L., Lee, B. H., Lin, J. C., Long, R., Middlebrook, A. M., Millet, D. B., Moravek, A., Murphy, J. G., Quinn, P. K., Riedel, T. P., Roberts, J. M., Thornton, J. A., Valin, L. C., Veres, P. R., Whitehill, A. R., Wild, R. J., Warneke, C., Yuan, B., Baasandorj, M., and Brown, S. S.: An Odd Oxygen Framework for Wintertime Ammonium Nitrate Aerosol Pollution in Urban Areas: NOx and VOC Control as Mitigation Strategies, Geophys. Res. Lett., 46, 4971–4979, https://doi.org/10.1029/2019GL082028, 2019.
Woodward, S.: Modelling the atmospheric life cycle and radiative impact of mineral dust in the Hadley Centre climate model, J. Geophys. Res., 106, 18155–18166, 2001.
World Health Organisation (WHO): World health statistics 2020: monitoring health for the SDGs, sustainable development goals, World Health Organization, Geneva, Licence: CC BY-NC-SA 3.0 IGO, 2020.
Xiao, H.-W., Xiao, H.-Y., Shen, C.-Y., Zhang, Z.-Y., and Long, A.-M.: Chemical Composition and Sources of Marine Aerosol over the Western North Pacific Ocean in Winter, Atmosphere, 9, 298, https://doi.org/10.3390/atmos9080298, 2018.
Xu, L. and Penner, J. E.: Global simulations of nitrate and ammonium aerosols and their radiative effects, Atmos. Chem. Phys., 12, 9479–9504, https://doi.org/10.5194/acp-12-9479-2012, 2012.
Xu, R., Tian, H., Pan, S., Prior, S. A., Feng, Y., Batchelor, W. D., Chen, J., and Yang, J.: Global ammonia emissions from synthetic nitrogen fertilizer applications in agricultural systems: Empirical and process-based estimates and uncertainty, Glob. Change Biol., 25, 314–326, https://doi.org/10.1111/gcb.14499, 2019.
Yienger, J. J., and Levy, H.: Empirical model of global soil-biogenic NOx emissions, J. Geophys. Res., 100, 11447–11464, https://doi.org/10.1029/95JD00370, 1995.
Yool, A., Popova, E. E., and Anderson, T. R.: MEDUSA-2.0: an intermediate complexity biogeochemical model of the marine carbon cycle for climate change and ocean acidification studies, Geosci. Model Dev., 6, 1767–1811, https://doi.org/10.5194/gmd-6-1767-2013, 2013.
Zaveri, R. A., Easter, R. C., Fast, J. D., and Peters, L. K.: Model for Simulating Aerosol Interactions and Chemistry (MOSAIC), J. Geophys. Res., 113, D13204, https://doi.org/10.1029/2007JD008782, 2007.
Zhong, Q., Shen, H., Yun, X., Chen, Y., Ren, Y., Xu, H., Shen, G., Du, W., Meng, J., Li, W., Ma, J., and Tao, S.: Global Sulfur Dioxide Emissions and the Driving Forces, Environ. Sci. Technol., 54, 6508–6517, https://doi.org/10.1021/acs.est.9b07696, 2020.
Zhu, L., Henze, D. K., Bash, J. O., Cady-Pereira, K. E., Shephard, M. W., Luo, M., and Capps, S. L.: Sources and Impacts of Atmospheric NH3: Current Understanding and Frontiers for Modeling, Measurements, and Remote Sensing in North America, Curr. Pollution Rep., 1, 95–116, https://doi.org/10.1007/s40726-015-0010-4, 2015.