the Creative Commons Attribution 4.0 License.
the Creative Commons Attribution 4.0 License.
 | 04 Nov 2021
Arctic black carbon during PAMARCMiP 2018 and previous aircraft experiments in spring
Makoto Koike
Atsushi Yoshida
Nobuhiro Moteki
Kouji Adachi
Naga Oshima
Hitoshi Matsui
Oliver Eppers
Heiko Bozem
Marco Zanatta
Andreas B. Herber
Vertical profiles of the mass concentration of black carbon (BC) were measured at altitudes up to 5 km during the PAMARCMiP (Polar Airborne Measurements and Arctic Regional Climate Model simulation Project) aircraft-based field experiment conducted around the northern Greenland Sea (Fram Strait) during March and April 2018 from operation base Station Nord (81.6∘ N, 16.7∘ W). Median BC mass concentrations in individual altitude ranges were 7–18 ng m−3 at standard temperature and pressure at altitudes below 4.5 km. These concentrations were systematically lower than previous observations in the Arctic in spring, conducted by ARCTAS-A in 2008 and NETCARE in 2015, and similar to those observed during HIPPO3 in 2010. Column amounts of BC for altitudes below 5 km in the Arctic (>66.5∘ N; COLBC), observed during the ARCTAS-A and NETCARE experiments, were higher by factors of 4.2 and 2.7, respectively, than those of the PAMARCMiP experiment. These differences could not be explained solely by the different locations of the experiments. The year-to-year variation of COLBC values generally corresponded to that of biomass burning activities in northern midlatitudes over western and eastern Eurasia. Furthermore, numerical model simulations estimated the year-to-year variation of contributions from anthropogenic sources to be smaller than 30 %–40 %. These results suggest that the year-to-year variation of biomass burning activities likely affected BC amounts in the Arctic troposphere in spring, at least in the years examined in this study. The year-to-year variations in BC mass concentrations were also observed at the surface at high Arctic sites Ny-Ålesund and Utqiaġvik (formerly known as Barrow, the location of Barrow Atmospheric Baseline Observatory), although their magnitudes were slightly lower than those in COLBC.
Numerical model simulations in general successfully reproduced the observed COLBC values for PAMARCMiP and HIPPO3 (within a factor of 2), whereas they markedly underestimated the values for ARCTAS-A and NETCARE by factors of 3.7–5.8 and 3.3–5.0, respectively. Because anthropogenic contributions account for nearly all of the COLBC (82 %–98 %) in PAMARCMiP and HIPPO3, the good agreement between the observations and calculations for these two experiments suggests that anthropogenic contributions were generally well reproduced. However, the significant underestimations of COLBC for ARCTAS-A and NETCARE suggest that biomass burning contributions were underestimated. In this study, we also investigated plumes with enhanced BC mass concentrations, which were affected by biomass burning emissions, observed at 5 km altitude. Interestingly, the mass-averaged diameter of BC (core) and the shell-to-core diameter ratio of BC-containing particles in the plumes were generally not very different from those in other air samples, which were considered to be mostly aged anthropogenic BC. These observations provide a useful basis to evaluate numerical model simulations of the BC radiative effect in the Arctic region in spring.
- Article
(17609 KB) - Full-text XML
-
Supplement
(412 KB) - BibTeX
- EndNote


Over the past few decades, the annual average temperature in the Arctic has increased almost twice as fast as it has elsewhere in the world (IPCC, 2021). The main driver of this warming is the global increase in the concentration of carbon dioxide (CO2). However, various other climate forcers and feedback processes amplify warming in the Arctic (e.g., Serreze and Barry, 2011). Black carbon (BC) particles in the Arctic have been intensively studied as one of the short-lived climate forcers (SLCFs), because reductions in their emissions could reduce positive radiative forcing with much shorter timescales as compared with reductions of CO2 (Arctic Monitoring and Assessment Programme (AMAP), 2015).
Most of the Arctic BC is considered to be transported from regions outside the Arctic, although gas flaring and some other small emission sources within the Arctic also make some contributions (Stohl et al., 2013). Previous studies using numerical model simulations indicate that contributions of BC emission sources change with season, year, and locations within the Arctic. Xu et al. (2017) reported that fossil fuel and biofuel anthropogenic (AN) emissions dominated at all levels (>90 %) for the high Arctic region during spring in 2009, 2011, and 2015 when aircraft experiments were conducted. Wang et al. (2011) reported that open biomass burning (BB) accounted for 50 % of the total BC in the Arctic (>60∘ N) tropospheric column in April 2008, a year in which BB activity was quite intense (Warneke et al., 2009; Evangeliou et al., 2016). Considering the year-to-year variation of BB activities and uncertainties in AN and BB BC emissions, estimates of the relative contributions of various sources to Arctic BC still have considerable uncertainties. Furthermore, possible inter-annual increases in BB activities in the warming boreal forest in the near future may further increase the BB BC emissions.
Measurements of vertical profiles of Arctic BC are important for the following two reasons. First, vertical profiles of BC generally reflect BC sources and transport or wet removal processes; thus, they provide useful information for investigating these sources and atmospheric processes. Air parcels originating at lower latitudes are uplifted along isentropic surfaces when they are transported to the Arctic, and some BC is removed by precipitation in association with uplifting (Shindell et al., 2008; Matsui et al., 2011; Schulz et al., 2019).
Second and more importantly, the magnitude of the response to the surface temperature depends on the altitude range in which the light-absorbing aerosols are located (Flanner, 2013; Samset et al., 2013). Strong absorption of solar radiation by BC near the ground heats the air near the ground surface. This heating can reduce the cloud fraction, leading to an increase in the downward shortwave radiation flux at the ground surface. BC at higher altitudes could cause weak surface warming or cooling through decreased surface insolation, because the high stability of the Arctic atmosphere inhibits thermal mixing with surface air. In addition, because BC deposition on snow and ice surfaces lowers their albedo and potentially accelerates ice–albedo feedback (Flanner et al., 2007; Tuzet et al., 2017), it is important to evaluate the altitude dependence of the wet removal processes of BC (Mori et al., 2020).
Aircraft measurements of Arctic BC were made by the following previous experiments in the spring season when direct radiative forcing of BC in the Arctic is considered to be largest: ARCPAC, ARCTAS-A, and POLARCAT in 2008 (Spackman et al., 2010; Matsui et al., 2011; Wang et al., 2011), PAMARCMiP in 2009 and in 2011 (Stone et al., 2010; Herber et al., 2012), HIPPO3 in 2010 (Schwarz et al., 2013), and NETCARE in 2015 (Schulz et al., 2019; Kodros et al., 2018). From these measurements, vertical profiles of BC mass concentrations, size distributions, and mixing states, as well as source contributions, transport pathways, and loss mechanisms were studied. However, measurements of BC vertical profiles are still limited in the Arctic, and case studies were made for individual experiments.
The Polar Airborne Measurements and Arctic Regional Climate Model simulation Project (PAMARCMiP) 2018 aircraft-based field experiment was carried out around the northern Greenland Sea (Fram Strait) from 23 March to 4 April 2018 using Station Nord (81.6∘ N, 16.7∘ W) as the operation base (Herber et al., 2012, 2019; Donth et al., 2020; Koike et al., 2021), as part of the ArctiC Amplification: Climate Relevant Atmospheric and SurfaCe Processes, and Feedback Mechanisms or (AC)3 project (Wendisch et al., 2017). In this paper, we report vertical profiles of BC mass concentrations, size distributions, and mixing states measured using a single-particle soot photometer from The University of Tokyo (Yoshida et al., 2020). The measurements (hereafter denoted as PAMARCMiP data) were compared with those made during these previous spring season experiments: ARCTAS-A in 2008, HIPPO3 in 2010, and NETCARE in 2015 (hereafter denoted as ARCTAS, HIPPO, and NETCARE). The year-to-year variation was examined from the viewpoint of BB activities.
2.1 Instruments and aircraft experiment
In this study, BC was measured aboard a research aircraft by using a single-particle soot photometer (SP2; Droplet Measurement Technologies (DMT), Longmont, CO, USA) calibrated and operated by The University of Tokyo (Yoshida et al., 2020). Detailed descriptions of the SP2, including calibration methods, are given elsewhere (e.g., Moteki and Kondo, 2010). Briefly, the SP2 uses the laser-induced incandescence technique and detects BC on a single-particle basis. It measures BC size distributions in the mass-equivalent diameter (Dm) range of approximately 70–850 nm. The void-free density of BC of 1.8 g cm−3 was assumed to convert a particle mass to a mass equivalent diameter. The SP2 was calibrated using fullerene soot particles (Alfa Aeser, stock no. 40971, lot no. FS12S011; Moteki and Kondo, 2010; Kondo et al., 2011b). BC mass concentration (MBC) values reported in this paper were obtained by integrating the mass of BC particles within the detectable diameter range and are expressed in units of ng m−3 under standard temperature and pressure (STP, 0 ∘C and 1013.25 hPa) conditions. The accuracy of the MBC measurements estimated from the uncertainty of the calibration and operational conditions of SP2 was about 10 %.
As described in Appendix A, MBC measurements made with The University of Tokyo SP2 during ARCTAS (Sahu et al., 2012) were compared with NOAA SP2 measurements (NOAA-ARCPAC experiment; Spackman et al., 2010), and they agreed within 20 %. The systematically higher values from The University of Tokyo (herein sometimes shortened to U. Tokyo) might partly be attributed to a wider size range of U. Tokyo BC measurements and a difference in corrections for undetected BC between the measurements. Because MBC measurements were consistently and traceably made by the individual groups, the systematic differences in absolute MBC values are expected to be smaller than 20 % at least for the PAMARCMiP and ARCTAS datasets (U. Tokyo) and the HIPPO dataset (NOAA).
Aerosols were also sampled on filters aboard the aircraft during PAMARCMiP and analyzed using transmission electron microscopy (TEM; Adachi et al., 2021). In this study, we used potassium-containing particles as an indicator of influences from biomass burning.
Gaseous carbon monoxide (CO) concentration was measured using an Aerolaser AL5002 CO monitor (Gerbig et al., 1999; Scharff et al., 2012), which detects fluorescence in vacuum ultraviolet radiation. CO2 concentration was measured using an LI-7200 gas analyzer (LI-COR Ltd., USA; Burba et al., 2010; Lampert et al., 2018), which employs the non-dispersive infrared spectroscopy method.
For the aerosol measurements, ambient air was drawn into the aircraft cabin using a forward-facing iso-kinetic inlet with a tip hole diameter of 4.6 mm designed and made by DMT. The sample air speed at the inlet tip and true air speed of the aircraft at various altitudes agreed within 10 %, indicating that iso-kinetic sampling was achieved during the experiment. For the gas measurements, two backward-facing sampling inlets (Ehrlich et al., 2019) were used.
The PAMARCMiP aircraft experiment was carried out with the Alfred Wegener Institute (AWI) research aircraft POLAR 5 (Wesche et al., 2016). The flight tracks are shown in Fig. 1, and the flights are listed in Table 1. The data obtained during 5 min after taking off and 5 min before landing were not used to avoid possible influences of local pollutants emitted from the base Station Nord. Vertical profiles of BC and other atmospheric species were measured up to 5 km during most of the research flights. Appendix B presents 6 d kinematic back trajectories of air parcels measured aboard the aircraft.
Table 1Summary of research flights made during the PAMARCMiP experiment. The time is UTC.
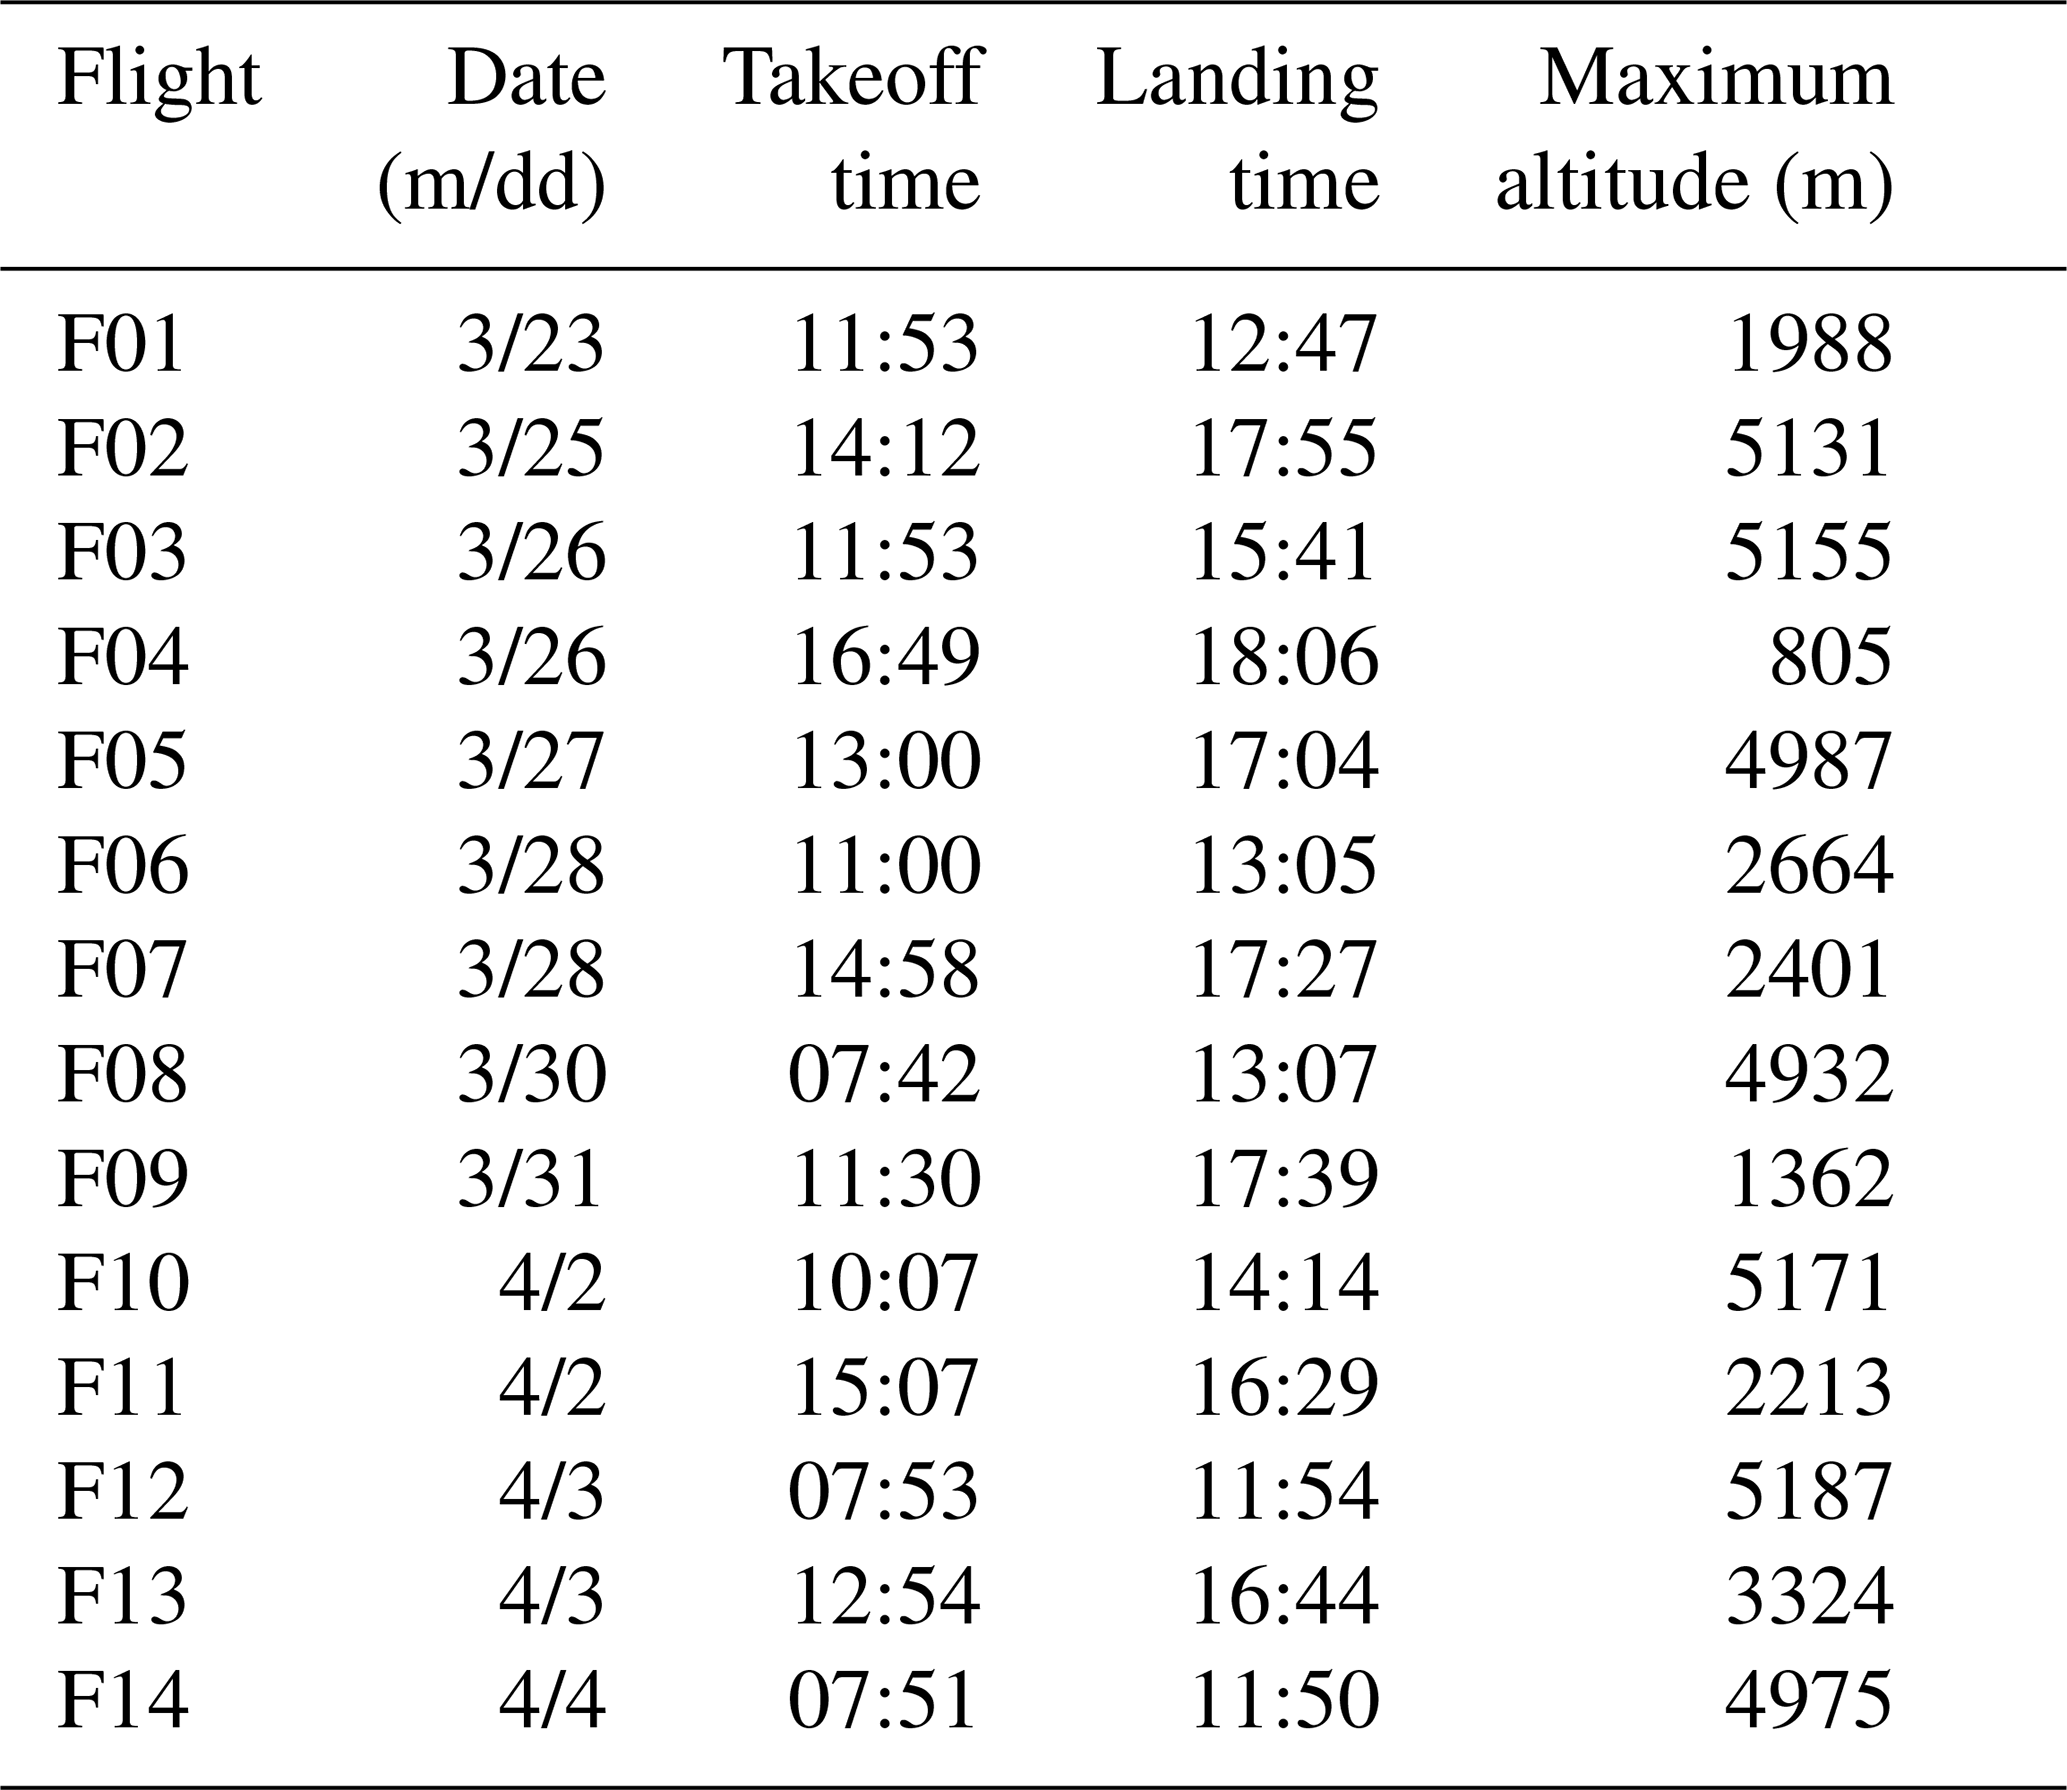
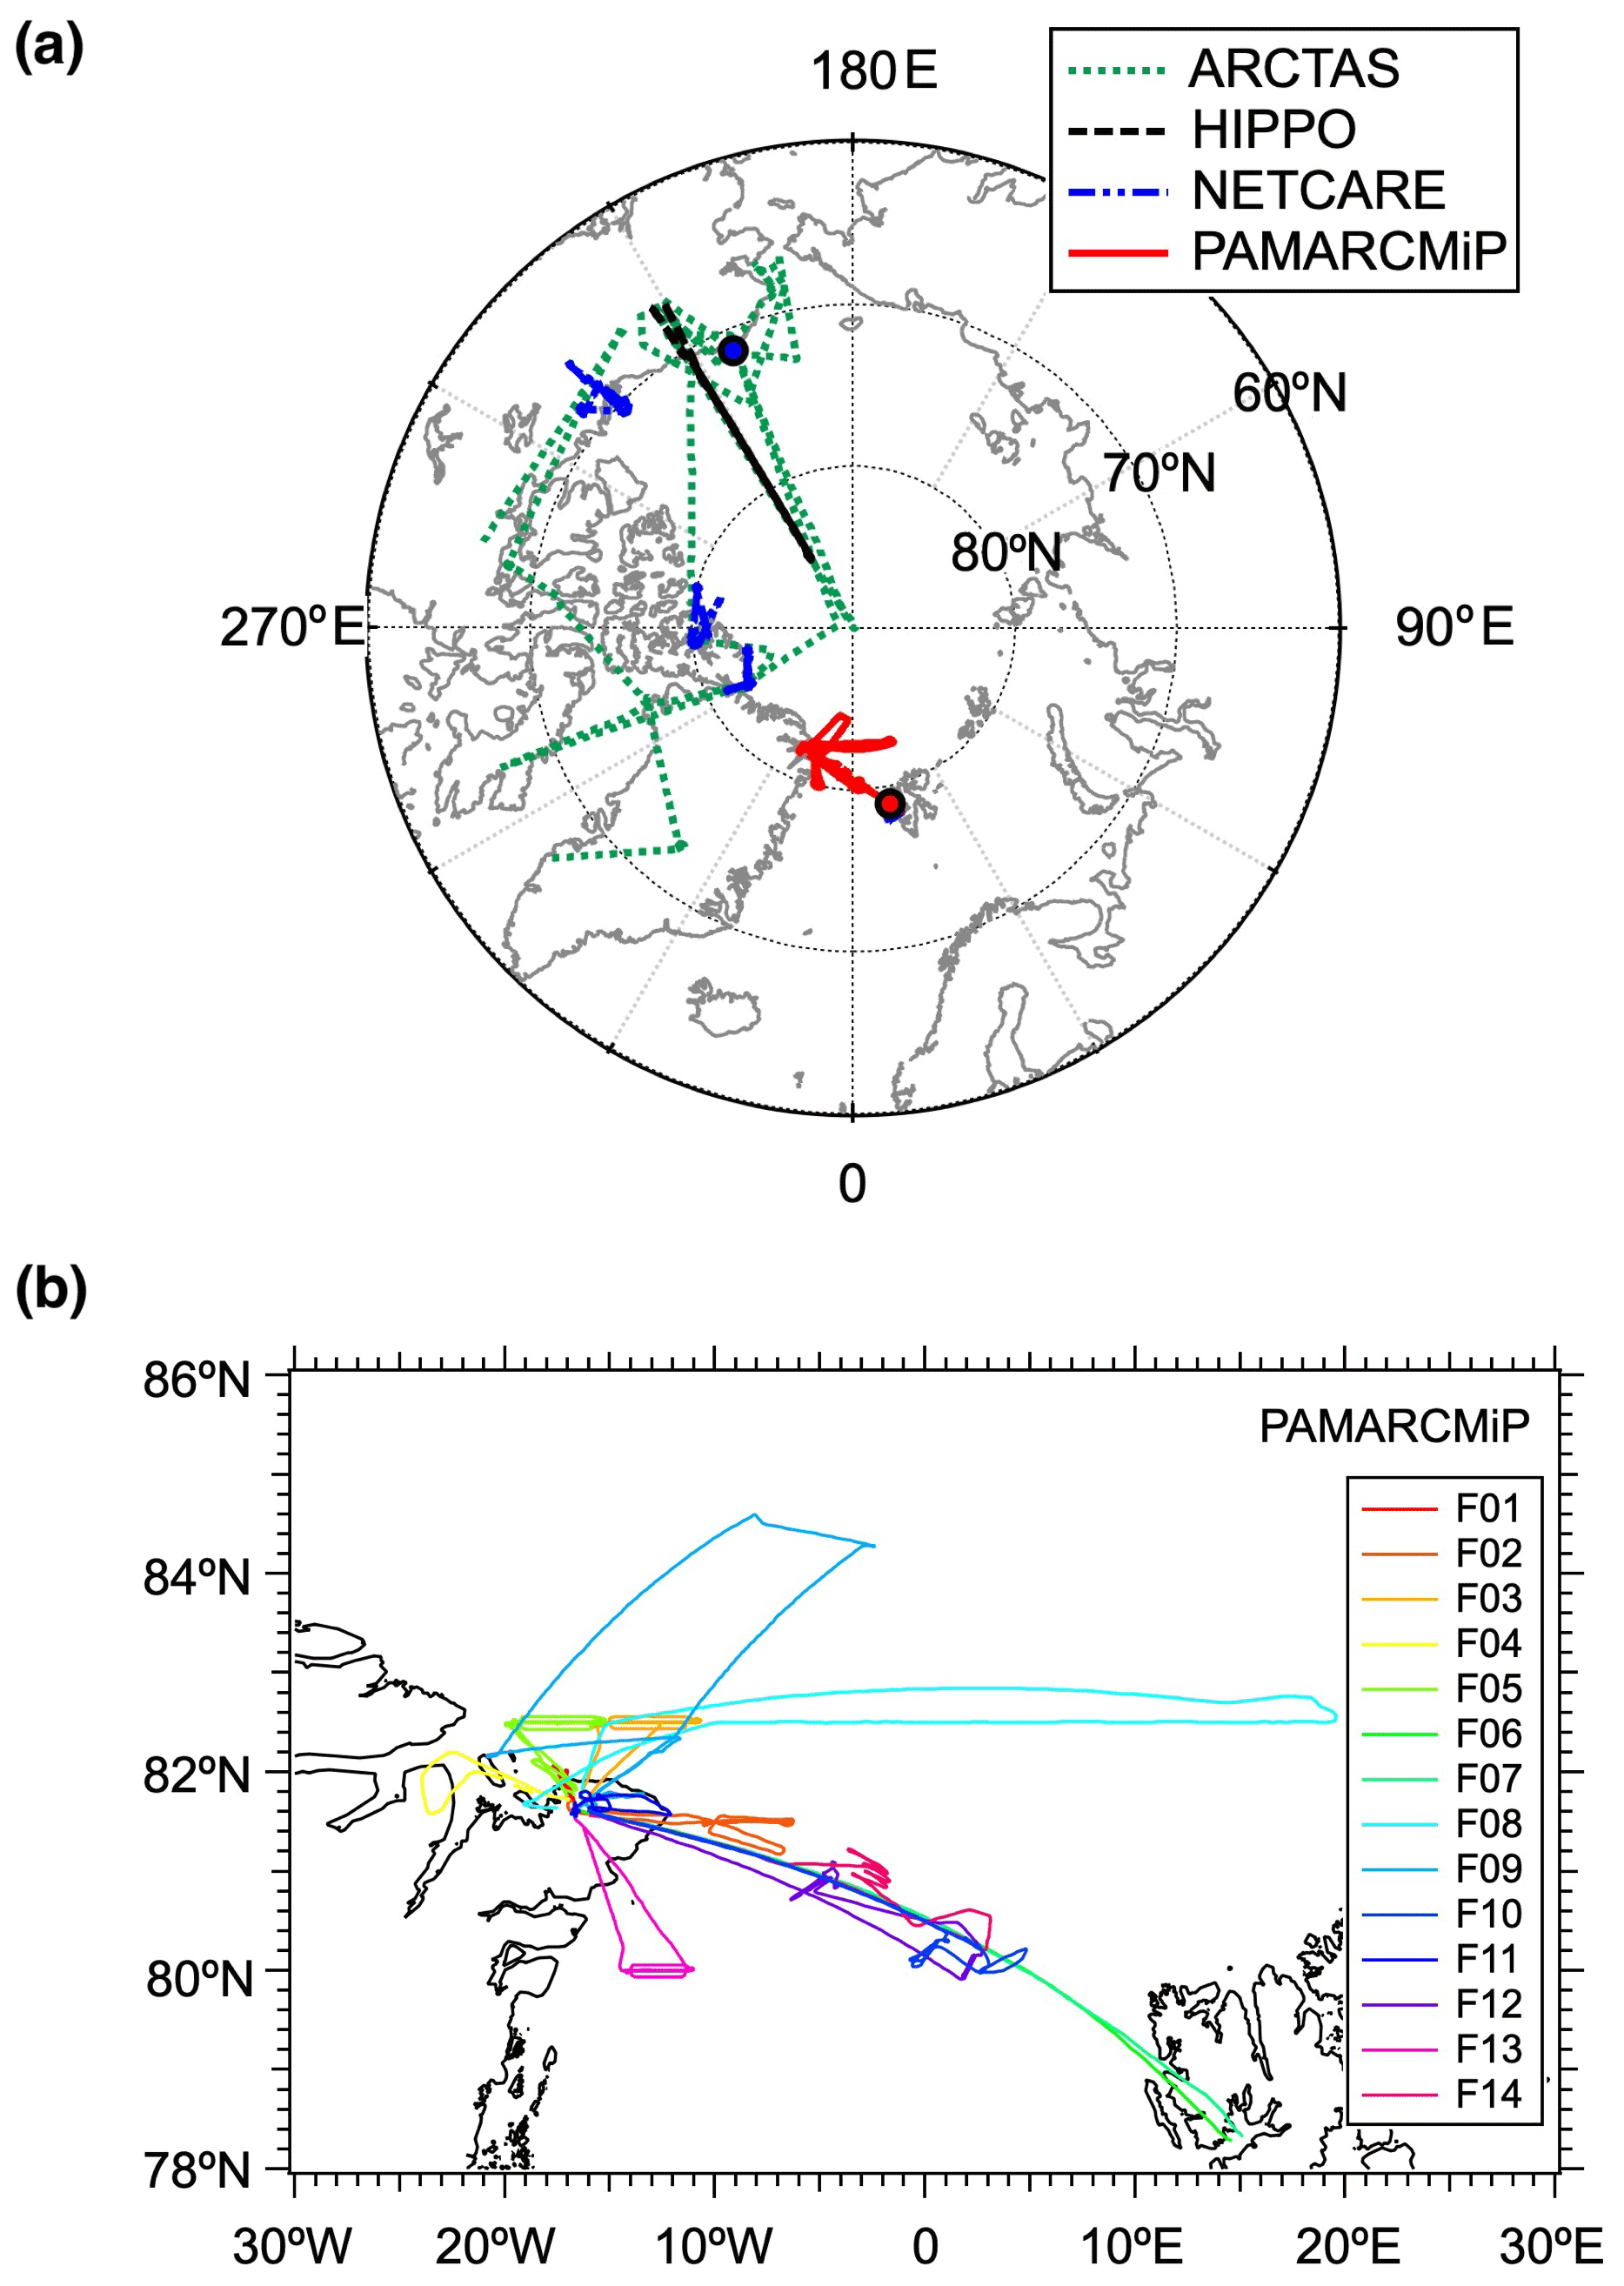
Figure 1(a) Map of the flight tracks of the PAMARCMiP aircraft-based field experiment and the other three experiments made over the Arctic in spring. In this study, only data obtained at latitudes north of 66.5∘ N were used and only the flight tracks for them are shown. The locations of the high Arctic sites Ny-Ålesund in Svalbard (78.9∘ N, 11.9∘ E) and Barrow in Alaska (71.3∘ N, 156.6∘ W) are indicated by the red and blue circles, respectively. (b) Map of the details of the flight tracks of the PAMARCMiP experiment.
2.2 Ground-based MBC measurements at Ny-Ålesund and Barrow Atmospheric Baseline Observatory
Along with year-to-year variations observed during aircraft experiments, those observed from ground-based MBC measurements at the high Arctic sites Ny-Ålesund in Svalbard (78.9∘ N, 11.9∘ E) and Utqiaġvik (location of Barrow Atmospheric Baseline Observatory) in Alaska (71.3∘ N, 156.6∘ W) are also presented for comparison in this paper. At both sites, MBC data obtained by a continuous soot monitoring system called COSMOS (Kanomax, Osaka, Japan; Miyazaki et al., 2008; Kondo et al., 2009, 2011b) were used for the years 2015 and 2018. This filter-based absorption photometer was equipped with an inlet that was heated to 300 ∘C to remove non-refractory components from the aerosol phase. The MBC values measured by COSMOS and those measured by The University of Tokyo SP2 agreed to within about 10 % at Ny-Ålesund (Ohata et al., 2019). Because COSMOS data were not obtained at these two sites in 2008 and 2010, data obtained by particle absorption soot photometers (PSAP; Radiance Research, Seattle, WA, USA; Ogren et al., 2017) were used after scaling their MBC values to agree with COSMOS values by using a scaling factor derived from side-by-side measurements (Sinha et al., 2017; Ohata et al., 2021a). Daily averaged data were used in this study. Note that measurements at Barrow Atmospheric Baseline Observatory near Utqiaġvik are referred to as measurements at Barrow hereafter.
The two climate–aerosol models, the Community Atmosphere Model version 5 with the Aerosol Two-dimensional bin module for foRmation and Aging Simulation (CAM5-ATRAS) and the Meteorological Research Institute Earth System Model version 2.0 (MRI-ESM2), were used in this study.
The CAM5-ATRAS model calculates major chemical and aerosol processes in the atmosphere (Matsui, 2017; Matsui and Mahowald, 2017; Matsui et al., 2018). The model considers seven aerosol species (sulfate, nitrate, ammonium, dust, sea salt, organic aerosol, and BC) with a two-dimensional sectional representation consisting of 12 bins of particle sizes from 1 to 10 000 nm dry diameter and 8 bins of BC mixing states for fine particles (40 to 1250 nm). Simulations were performed with a horizontal resolution of 1.9∘ × 2.5∘ latitude and longitude and 30 vertical layers. Meteorological nudging used data for temperature and horizontal wind in the free troposphere (<800 hPa) from the Modern-Era Retrospective analysis for Research and Applications version 2 (MERRA2) dataset (Gelaro et al., 2017). We used monthly AN emissions from the Coupled Model Intercomparison Project Phase 6 (CMIP6) dataset (Hoesly et al., 2018) and daily BB emissions from the Global Fire Emissions Database version 4.1 (GFED; van der Werf et al., 2017). Because CMIP6 emissions are available only for years 1750–2014, AN emissions in 2014 were used for simulations for the year 2018. BC from AN (fossil fuel + biofuel) and BB sources were tracked separately to calculate their individual contributions to total BC.
MRI-ESM2 is an atmosphere–ocean coupled model that integrates interactive models for aerosol and atmospheric chemistry (Yukimoto et al., 2019; Kawai et al., 2019; Oshima et al., 2020) that participated in the CMIP6 (Eyring et al., 2016). The model configurations (i.e., use of the atmospheric general circulation model and aerosol model) and calculation methods are the same as those in Adachi et al. (2021). The model employs TL159 horizontal resolution (approximately 120 km) and 80 vertical layers from the surface to 0.01 hPa (the model top) in a hybrid sigma–pressure coordinate system. The model simulation was performed from January 2008 to December 2018 after a 1-year spin-up run with the prescribed sea surface temperature and sea ice data (Ishii et al., 2005). In the simulations, horizontal wind fields were nudged toward 6-hourly Japanese 55-year Reanalysis data (Kobayashi et al., 2015). Simulations used monthly AN emissions from the MACCity emissions dataset (Lamarque et al., 2010) and daily BB emissions from the Global Fire Assimilation System dataset (GFAS; Kaiser et al., 2012). We also performed a model simulation that omitted the BB emissions of BC to estimate the separate contributions of AN and BB sources to total BC concentrations.
4.1 Vertical profile and column amounts of BC mass concentration
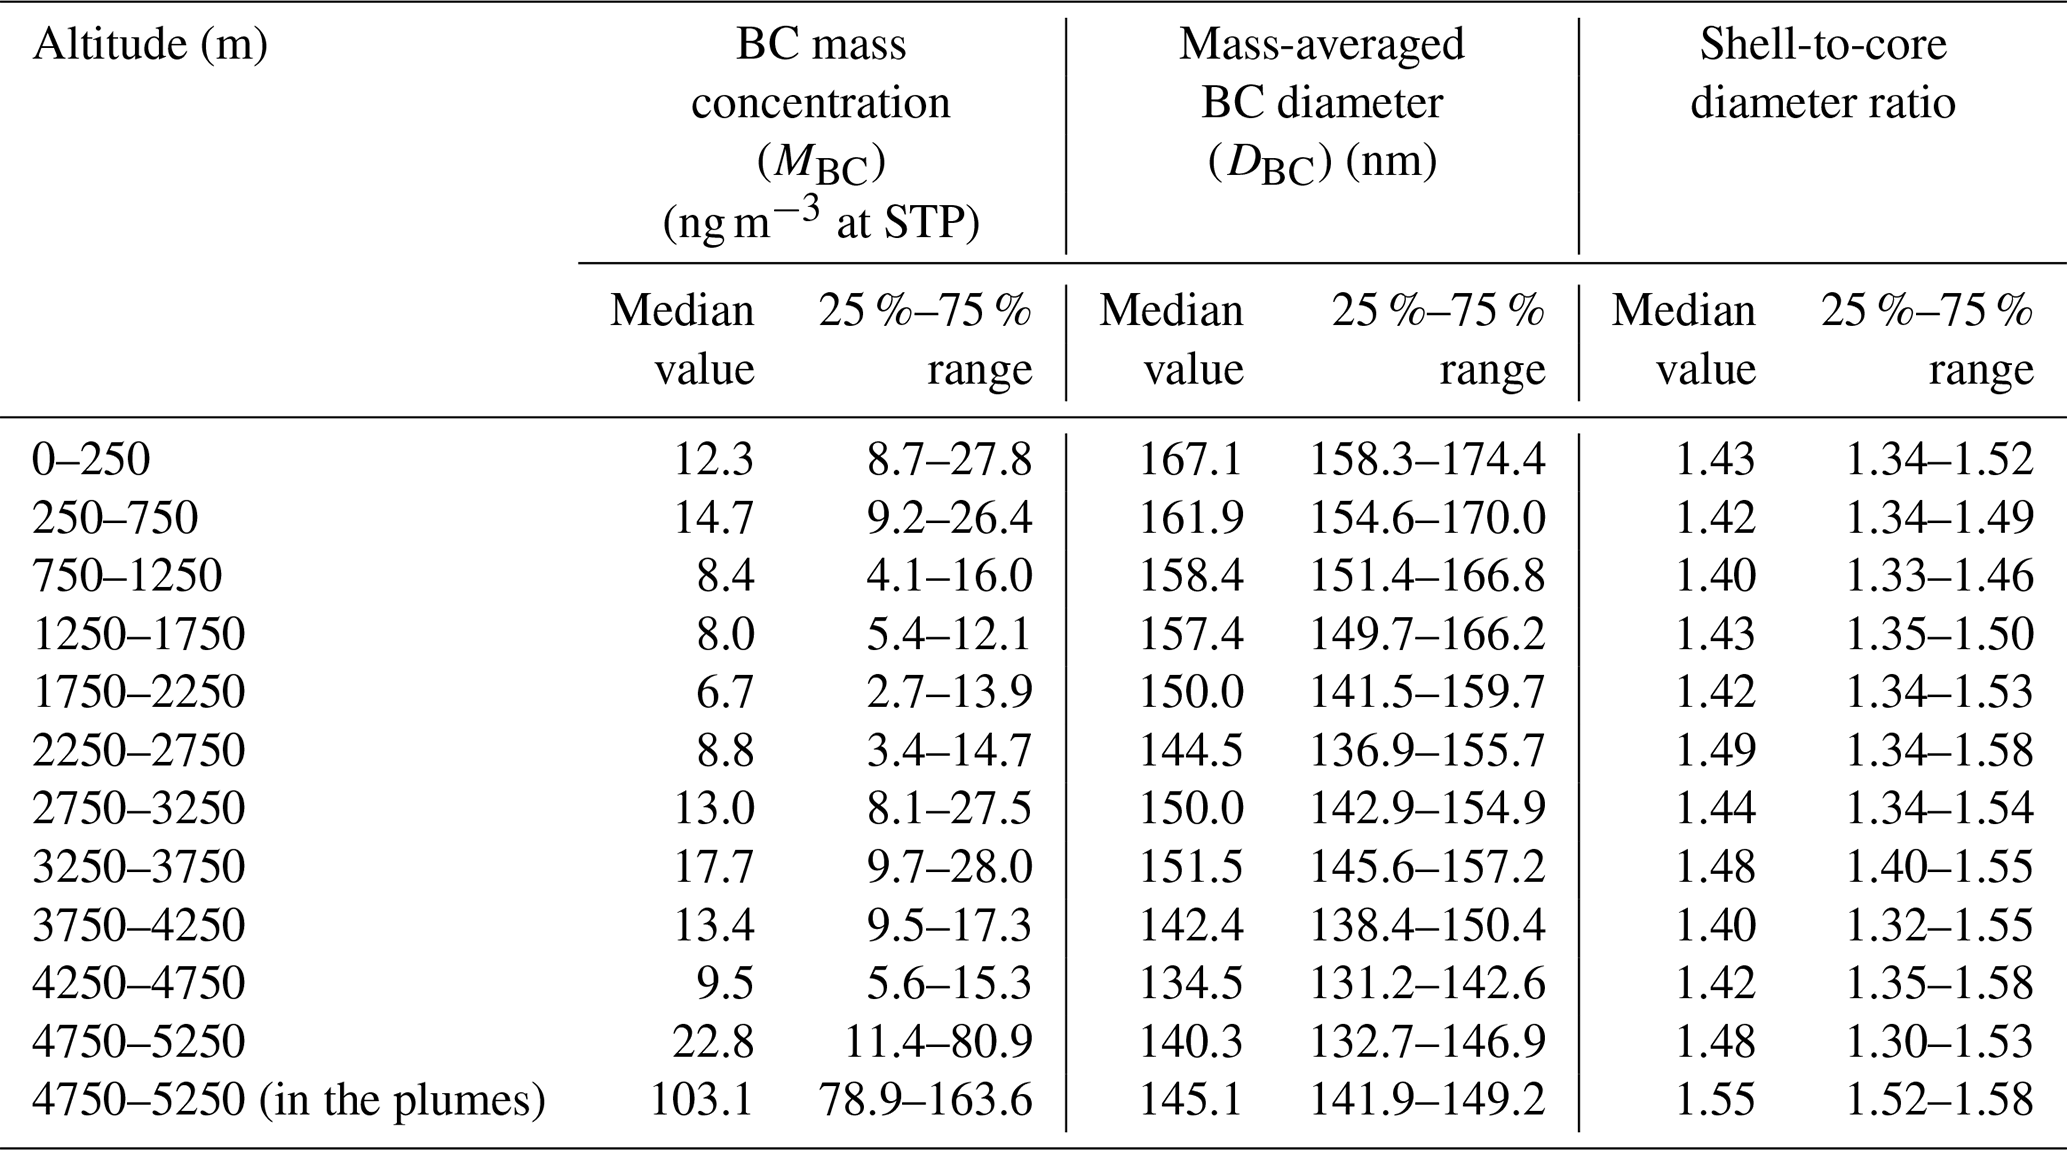
Figure 2a shows a vertical profile of MBC using all of the 1 min data obtained during the PAMARCMiP aircraft experiment. Median values in individual altitude ranges are also shown and listed in Table 2. Median MBC values were between 7 and 18 ng m−3 at altitudes below 4.5 km. At altitudes around 5 km, enhancements of MBC up to 250 ng m−3 (1 min data) were observed. As described in Sect. 5, these high MBC values were likely due to influences from BB BC emissions.
Table 2Vertical profiles of BC observed during the PAMARCMiP experiment. The 1 min data were used for these statistics. The plume data were defined as those with MBC>50 ng m−3 at STP.
In Fig. 2b, the vertical profile of median MBC values obtained during the PAMARCMiP experiment is compared with those obtained during the ARCTAS, HIPPO, and NETCARE aircraft experiments made over the Arctic in spring (Table 3). Median values were calculated only from data obtained at latitudes north of 66.5∘ N, the latitude of the Arctic Circle. This latitude generally corresponded to locations of a boundary of the polar dome, in which Arctic air mass tends to be confined, as estimated for the NETCARE 2014 and 2015 experiments (Bozem et al., 2019). The PAMARCMiP MBC values were generally similar to those obtained during the HIPPO experiment, whereas systematically higher values were observed during the ARCTAS and NETCARE experiments. Although each aircraft measurement was made over a limited area and time duration, they document significant year-to-year variations in MBC values in the Arctic spring. In the following sections, BC mass concentrations obtained during these four aircraft experiments are examined.
Table 3Aircraft experiments made during the Arctic spring.
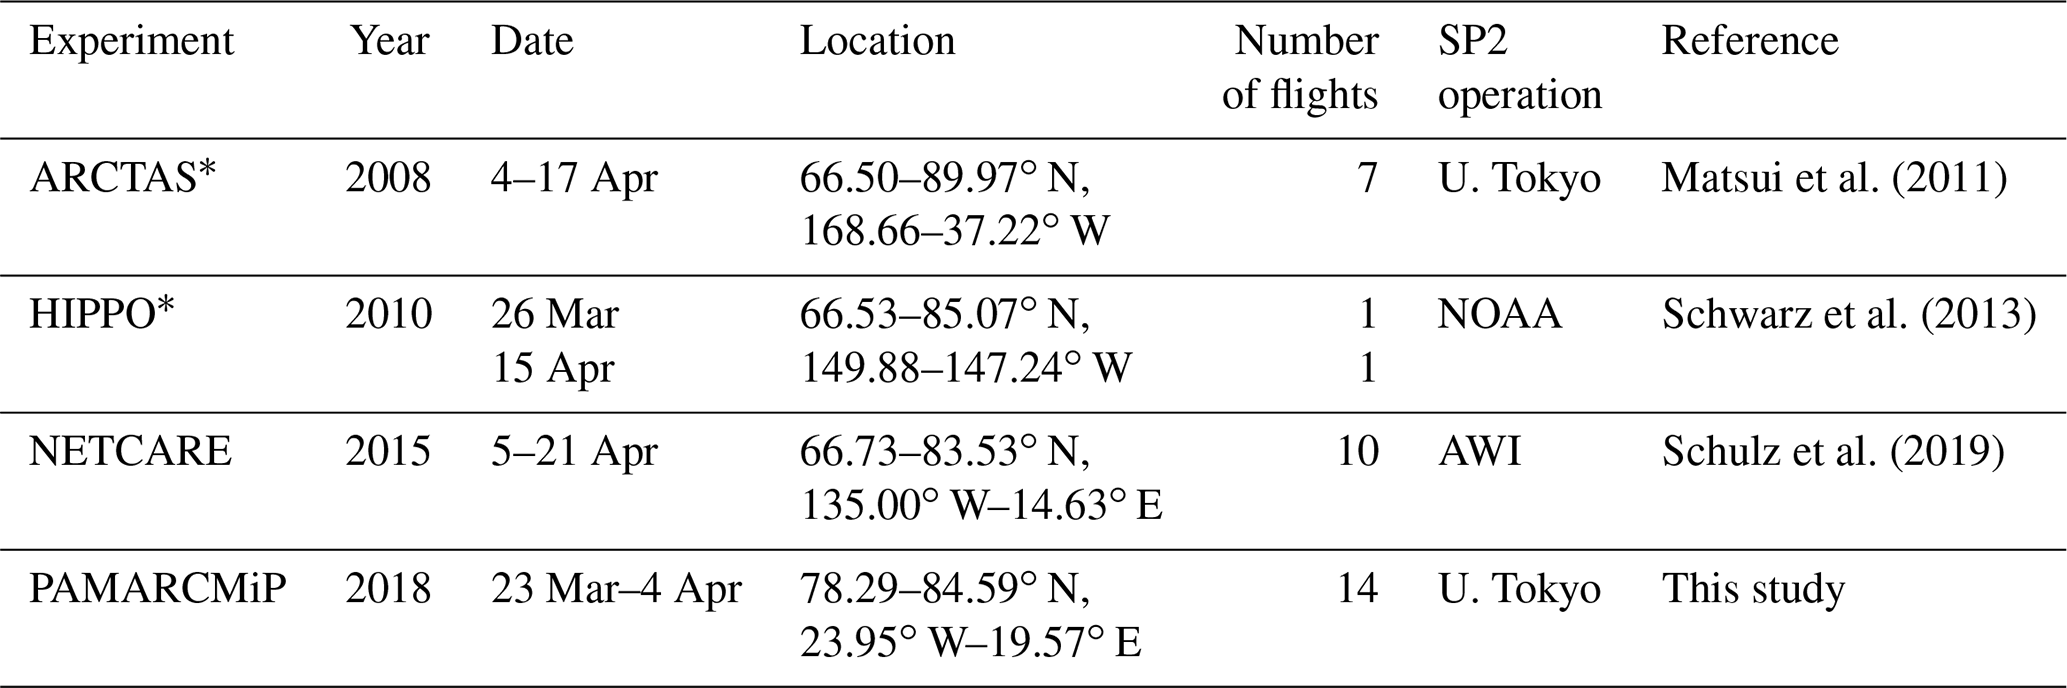
* Although measurements were made at latitudes south of 60∘ N, only data obtained at latitudes north of 66.5∘ N were used in this study. Dates and numbers of flights correspond to these Arctic measurements.
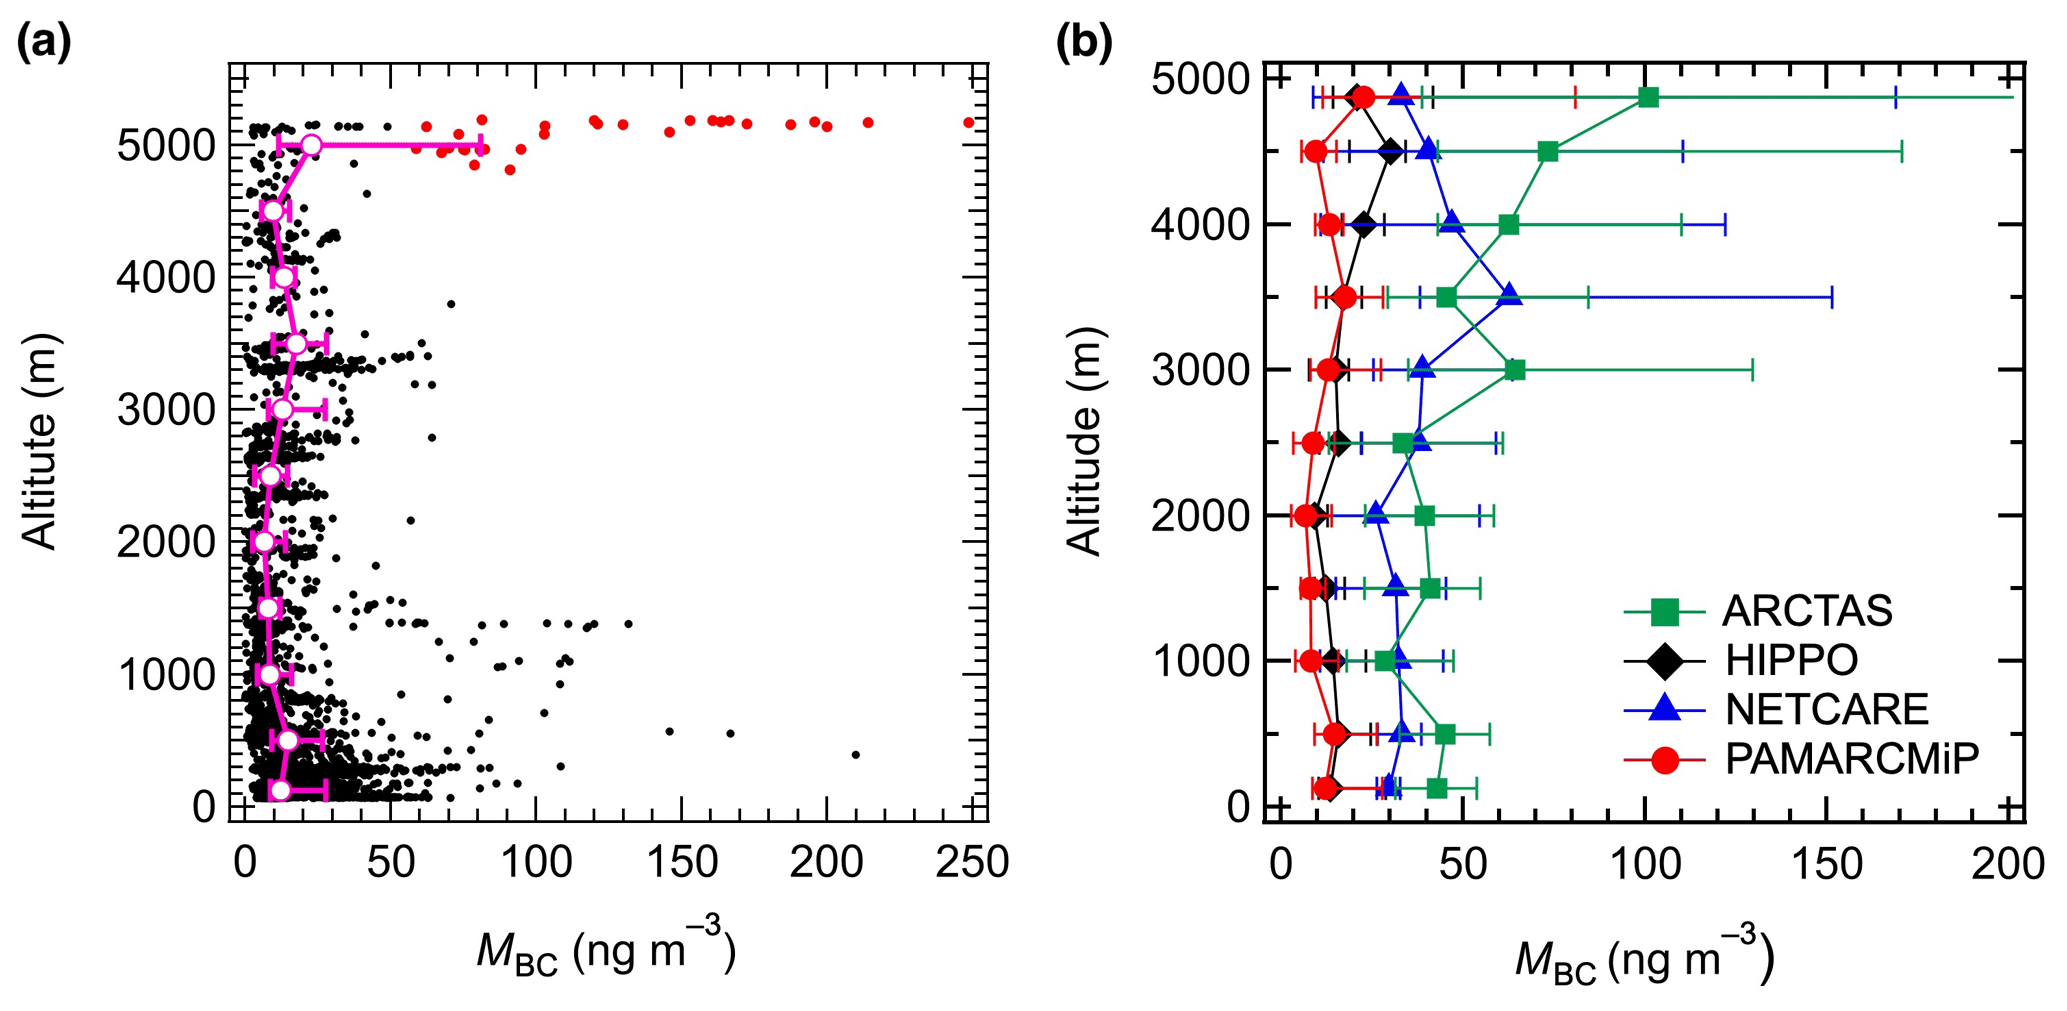
Figure 2(a) Vertical profile of the BC mass concentration (MBC) observed during the PAMARCMiP aircraft-based field experiment. Closed circles denote 1 min data. Median values and 25 %–75 % ranges are also shown. Data points shown in red (enhanced MBC data points) were likely influenced by biomass burning emissions and are discussed in Sect. 5. (b) Vertical profiles of median MBC values observed during the aircraft-based experiments made over the Arctic (>66.5∘ N) in spring (Table 3).
Using the four aircraft datasets, BC column amounts at altitudes between 0 and 5 km (COLBC, in units of µg m−2) were calculated by vertically integrating the median MBC values at each altitude obtained at latitudes north of 66.5∘ N (Table 4). Although data were obtained at altitudes higher than 5 km during the ARCTAS and HIPPO experiments, they were not used here and are further discussed in Sect. 4.3 and Appendix D. Figure 3 compares COLBC values among the four experiments. In accordance with the vertical MBC profiles (Fig. 2b), COLBC values are similar between the PAMARCMiP and HIPPO experiments (within a factor of 1.4). The COLBC values for the NETCARE and ARCTAS experiments are about a factor of 2.7 and 4.2, respectively, higher than the PAMARCMiP value (Table 4).
Table 4Column BC amounts and biomass burning activities.
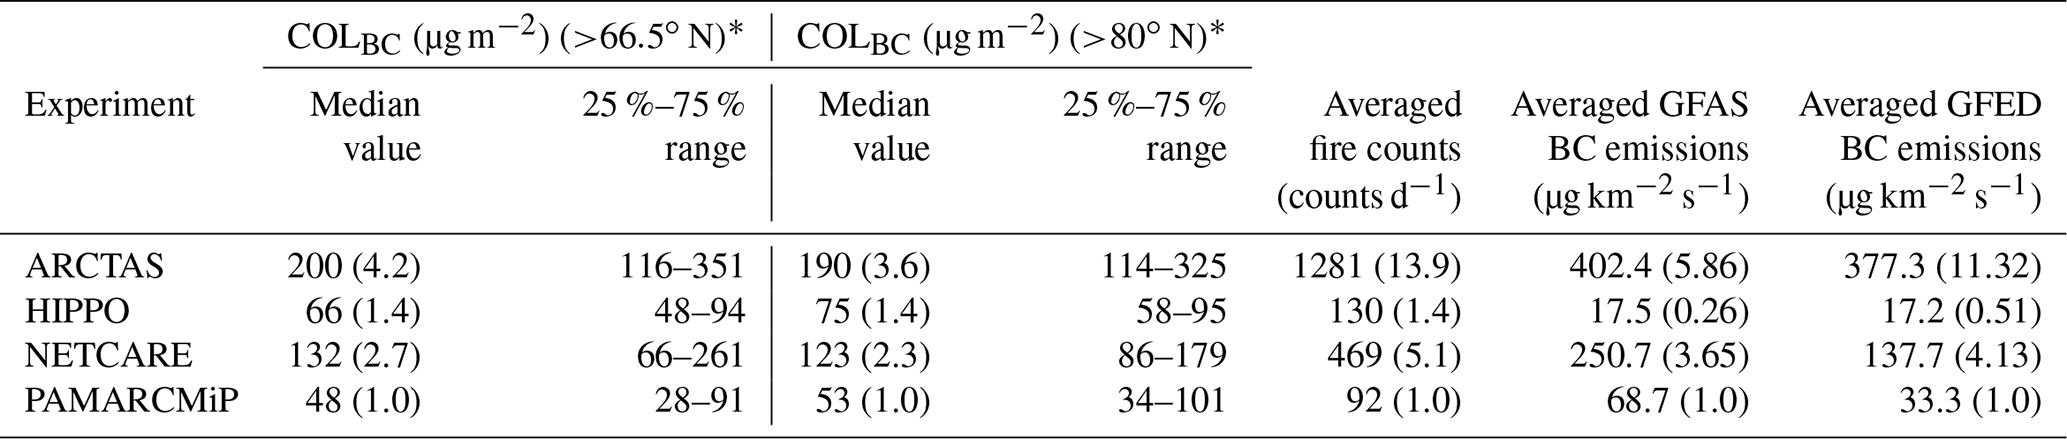
* COLBC is the column BC amount between 0 and 5 km. Values in parentheses are relative to PAMARCMiP.
A part of the differences in the observed BC levels could be due to the different locations where the measurements were made. As shown in Fig. 1a, the PAMARCMiP and NETCARE aircraft experiments were conducted mainly at latitudes around 80∘ N, while ARCTAS and HIPPO data obtained at latitudes between 66.5 and 90∘ N were used in this study. In Fig. 3 and Table 4, COLBC values calculated using only data obtained at latitudes north of 80∘ N are also shown, although the amount of data for HIPPO is limited. The ARCTAS COLBC value for >80∘ N is only 5 % lower than the value for >66.5∘ N, and the HIPPO COLBC value for >80∘ N is even higher than the value for >66.5∘ N. Consequently, systematic differences in MBC and COLBC values were likely not due to the different observation locations. This conclusion is also supported by the numerical model simulations described in Sect. 4.3, where COLBC values from the same area (entire Arctic region) are compared for the four time periods.
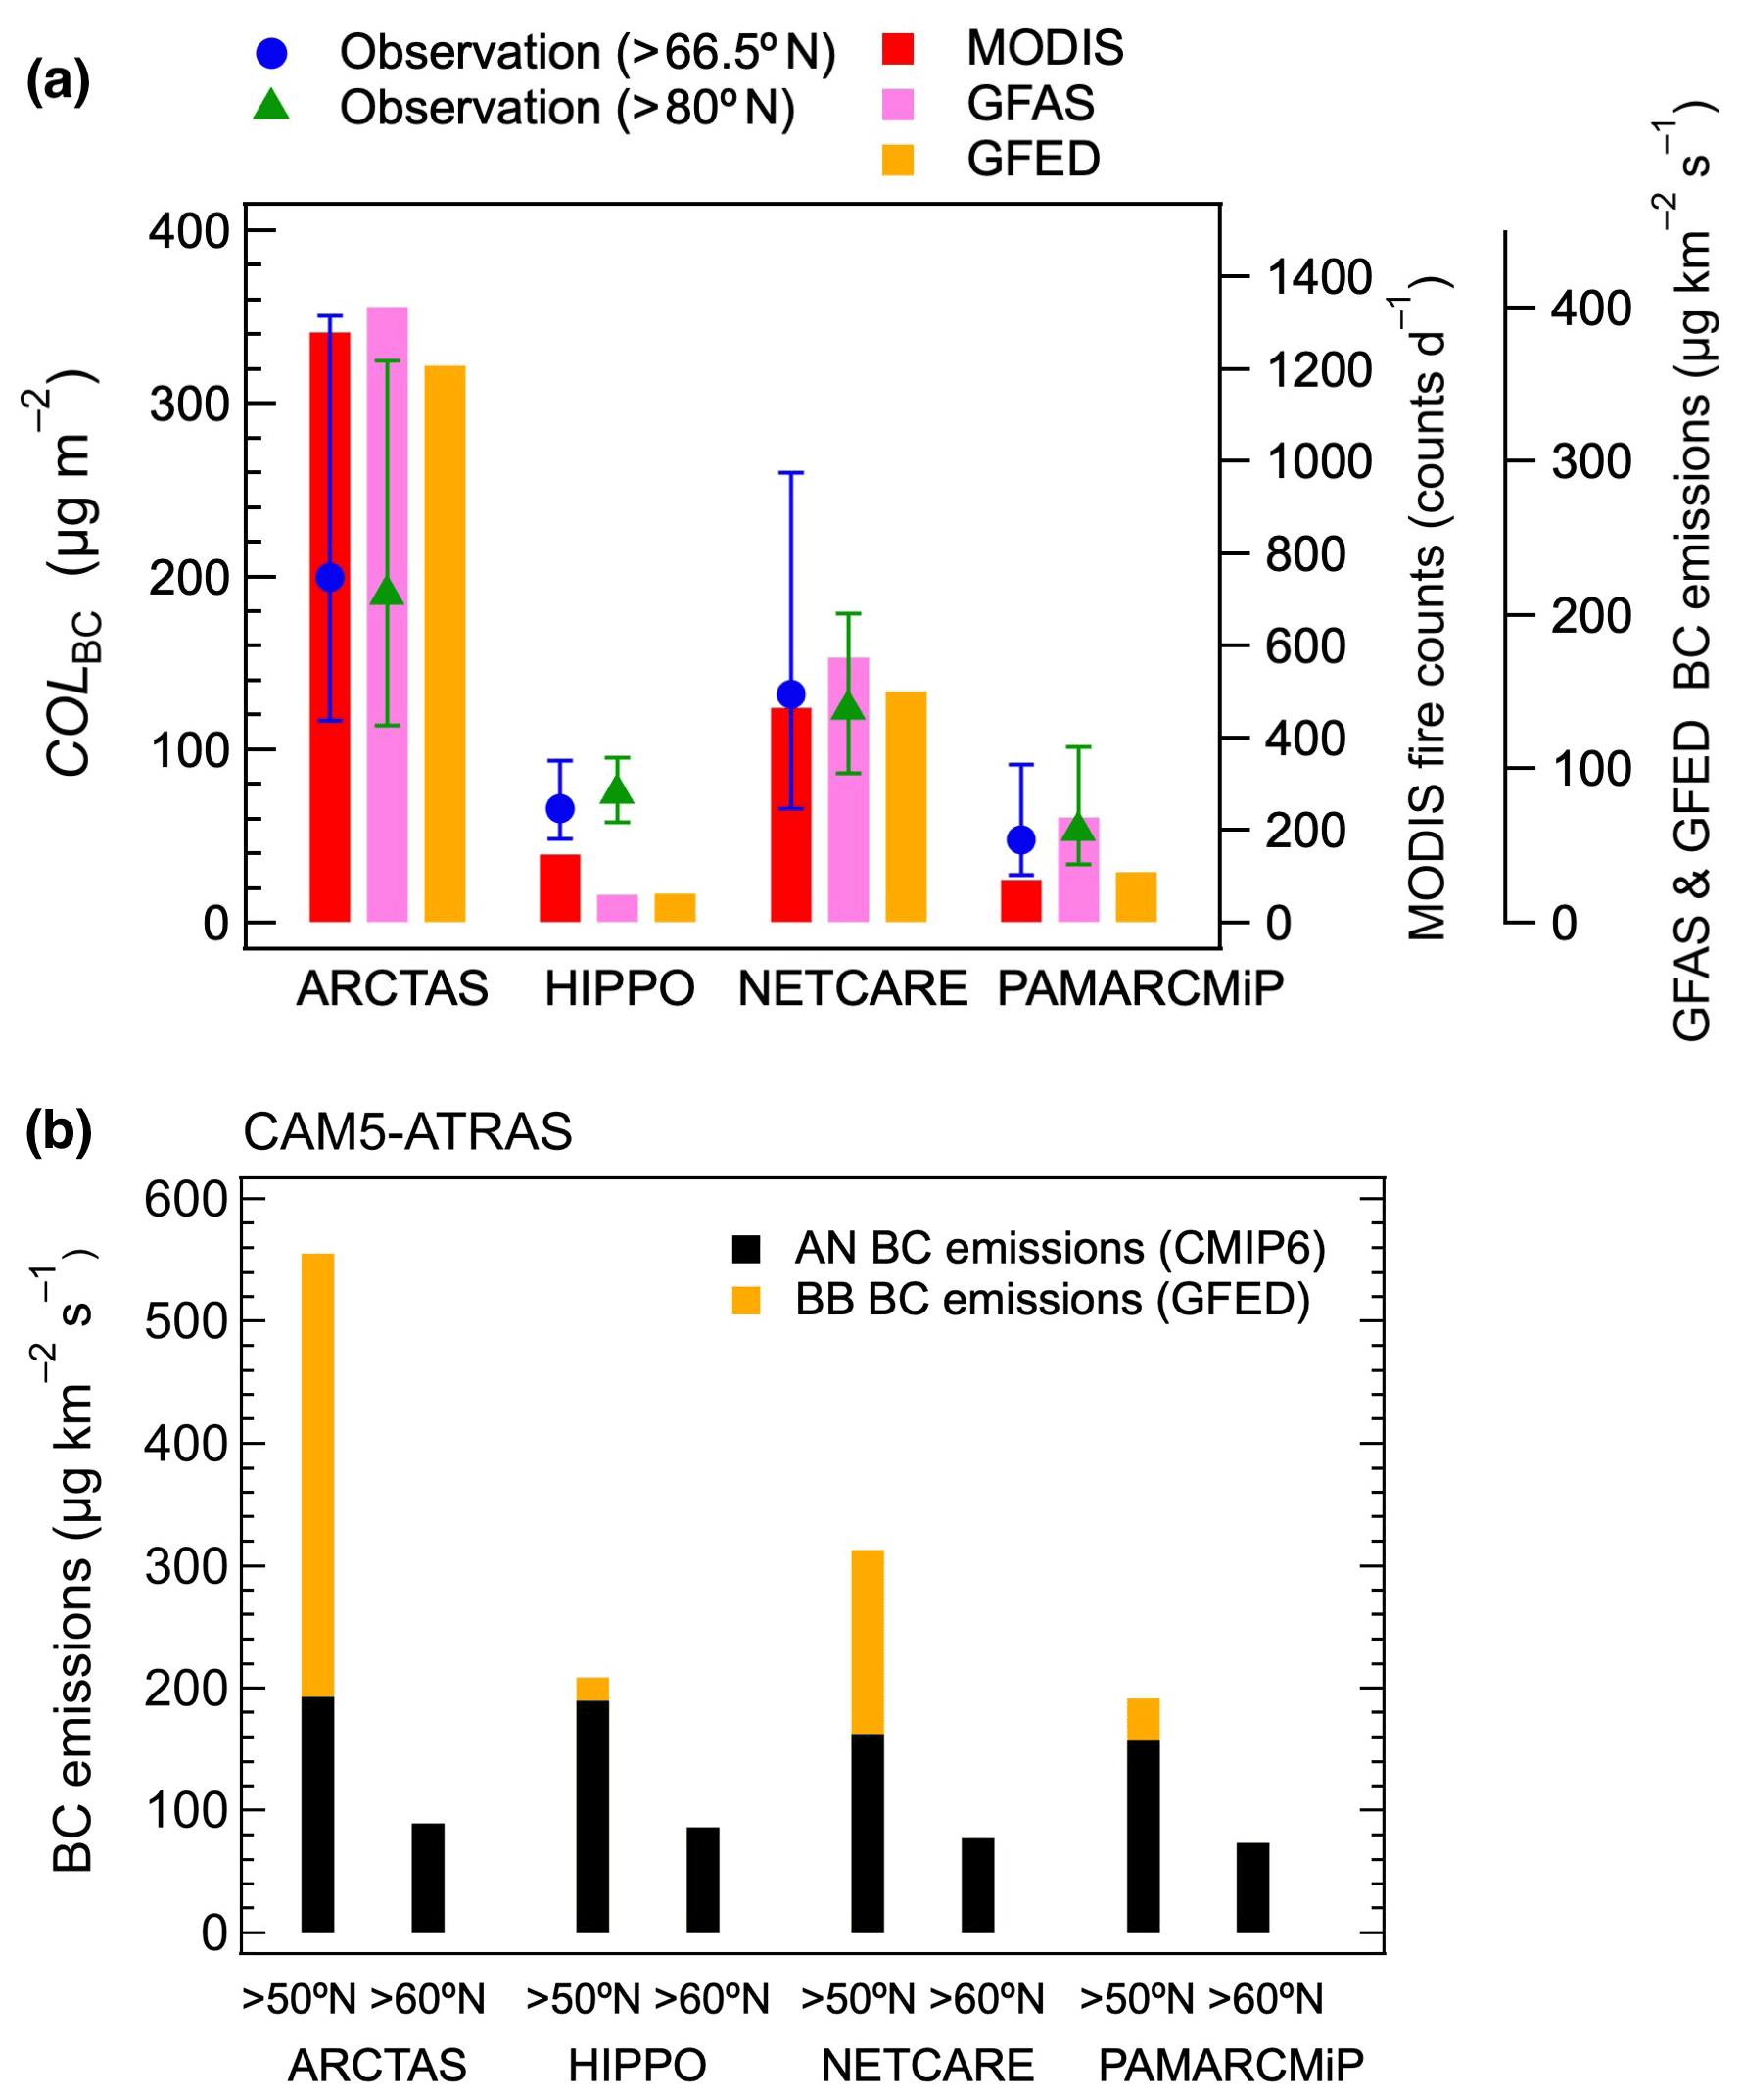
Figure 3(a) Column amounts of BC mass concentration at altitudes between 0 and 5 km (COLBC) at latitudes north of 66.5∘ N (blue circles) and 80∘ N (green triangles). MODIS-derived fire counts and biomass burning BC emissions compiled in GFAS and GFED datasets are also shown (vertical bars). The fire counts and BC emissions are those at latitudes north of 50∘ N for the time period between 14 d before the first day of an aircraft experiment and the last day of the experiment. (b) BC emissions used for the CAM5-ATRAS model simulations. Anthropogenic (AN, CMIP6) and biomass burning (BB, GFED) emissions are shown by black and orange colors, respectively. Values at latitudes north of 50 and 60∘ N are shown for the time period between 14 d before the first day of an aircraft experiment and the last day of the experiment. The BB emissions for >50∘ N are the same as those shown in Fig. 3a. BC emissions used for the MRI-ESM2 model simulations (MACCity and GFAS) are generally similar to those shown in this figure, although AN emissions for >60∘ N are generally smaller.
4.2 Biomass burning fire counts
In Fig. 3a, the daily averaged fire counts (counts d−1, indicator of BB activities) detected by the MODIS satellite (MCD14DL products, https://earthdata.nasa.gov/active-fire-data, last access: 19 October 2021) are shown for the four aircraft experiments. In this figure, we show fire counts at latitudes north of 50∘ N for the time period between 14 d before the first day of the aircraft experiment and the last day of the experiment. The averaged fire counts for HIPPO and PAMARCMiP are similar, whereas those for NETCARE and ARCTAS are, respectively, factors of around 5 and 14 higher than that for PAMARCMiP (Fig. 3a and Table 4). Similar tendencies can be also seen in averaged GFAS and GFED BB BC emissions (Fig. 3a) that were created using the fire counts. Consequently, the relative changes in COLBC were generally consistent with those in BB activities.
Figure 3b compares AN and BB BC emissions for >50 and >60∘ N used for the CAM5-ATRAS numerical simulations in this study (Sect. 3). The values of BB BC emissions for >50∘ N are the same as those shown in Fig. 3a. As is shown by this figure, the AN BC emissions slightly decrease over time, and no clear correspondence is found in year-to-year variations between AN BC emissions and COLBC. These results suggest that BC emissions from BB likely contributed to the increased COLBC during the NETCARE and ARCTAS experiments, at least to some extent. In other words, year-to-year variations of tropospheric BC amounts in the Arctic in spring were primarily affected by transport of BB BC, at least during these four periods. As described in Sect. 4.3, results from numerical model simulations indicate that the year-to-year variation of AN COLBC (>66.5∘ N) was smaller than 30 %–40 %, thus supporting the result that the observed year-to-year variation in COLBC was mostly due to BB BC.
Figure 4Map of MODIS-derived fire counts. Averaged values are shown for the time period between 14 d before the first day of an aircraft-based experiment and the last day of the experiment.
Figure 4 shows maps of the averaged fire counts for the four experimental time periods. Fire counts were generally high at latitudes 45–60∘ N and longitudes around 30–50 and 100–130∘ E (western and eastern Eurasia, respectively). Year-to-year variations in BB activities in these areas contributed to cause the variations in the average fire counts shown in Fig. 3.
As described above, we chose a time period of 14 d before the start date of an aircraft experiment for the calculation of the averaged fire counts in consideration of the possible lifetime of BC in the Arctic and the transport time of BC from its sources. The BC lifetime estimated using MRI-ESM2 at latitudes north of 66.5∘ N in April is 11.9 ± 2.8 d. The annual averages for Arctic BC are 12.1 and 11.5 d for the MRI-ESM2 and CAM5-ATRAS simulations, respectively (Matsui and Liu, 2021). Because Arctic BC could be transported from lower latitudes, the time period of 14 d is somewhat longer than the estimated globally and annually averaged BB-originated BC lifetime of 6–7 d (Koch and Hansen, 2005; Park et al., 2005; Evangeliou et al., 2016). However, even when this criterion was changed to 0, 7, and 21 d before the first day of the experiment, the relative changes in the averaged fire counts shown in Fig. 3 were not strongly affected. Time series of fire counts in individual latitude ranges are presented in Fig. C1 in Appendix C. As seen in this figure, fire counts at latitudes >40 and >50∘ N started to increase in mid-to-late March during each of the 4 years examined in this study. Because time periods of 7 or 14 d generally captured this onset of fire activities, the year-to-year variations of fire counts were generally similar irrespective of the chosen time period. Notably, time series of the fire counts at latitudes >40 and >50∘ N were generally similar (Fig. C1), and year-to-year variations were also similar when either of these criteria was adopted. Furthermore, the fire counts at latitudes >60∘ N were negligible in all the cases, and the correspondence to their year-to-year variation was less significant. Consequently, transport of air influenced by BB at latitudes between 45 and 60∘ N is likely responsible for the increased BC level in the Arctic spring.
As described in Sect. 2, during the PAMARCMiP experiment, air parcels sampled at altitudes below 1, 3, and 5 km had generally originated from north of 70, 60, and 50∘ N, respectively (Fig. B1). Most of the air parcels sampled at altitudes above 3 km had not passed over high BB areas and had maintained their altitudes; thus, they were likely not significantly influenced by BB BC emissions. Consequently, air parcels sampled during the PAMARCMiP experiment were likely not influenced by recent BC emissions, except for the plumes observed at altitudes around 5 km (Sect. 5).
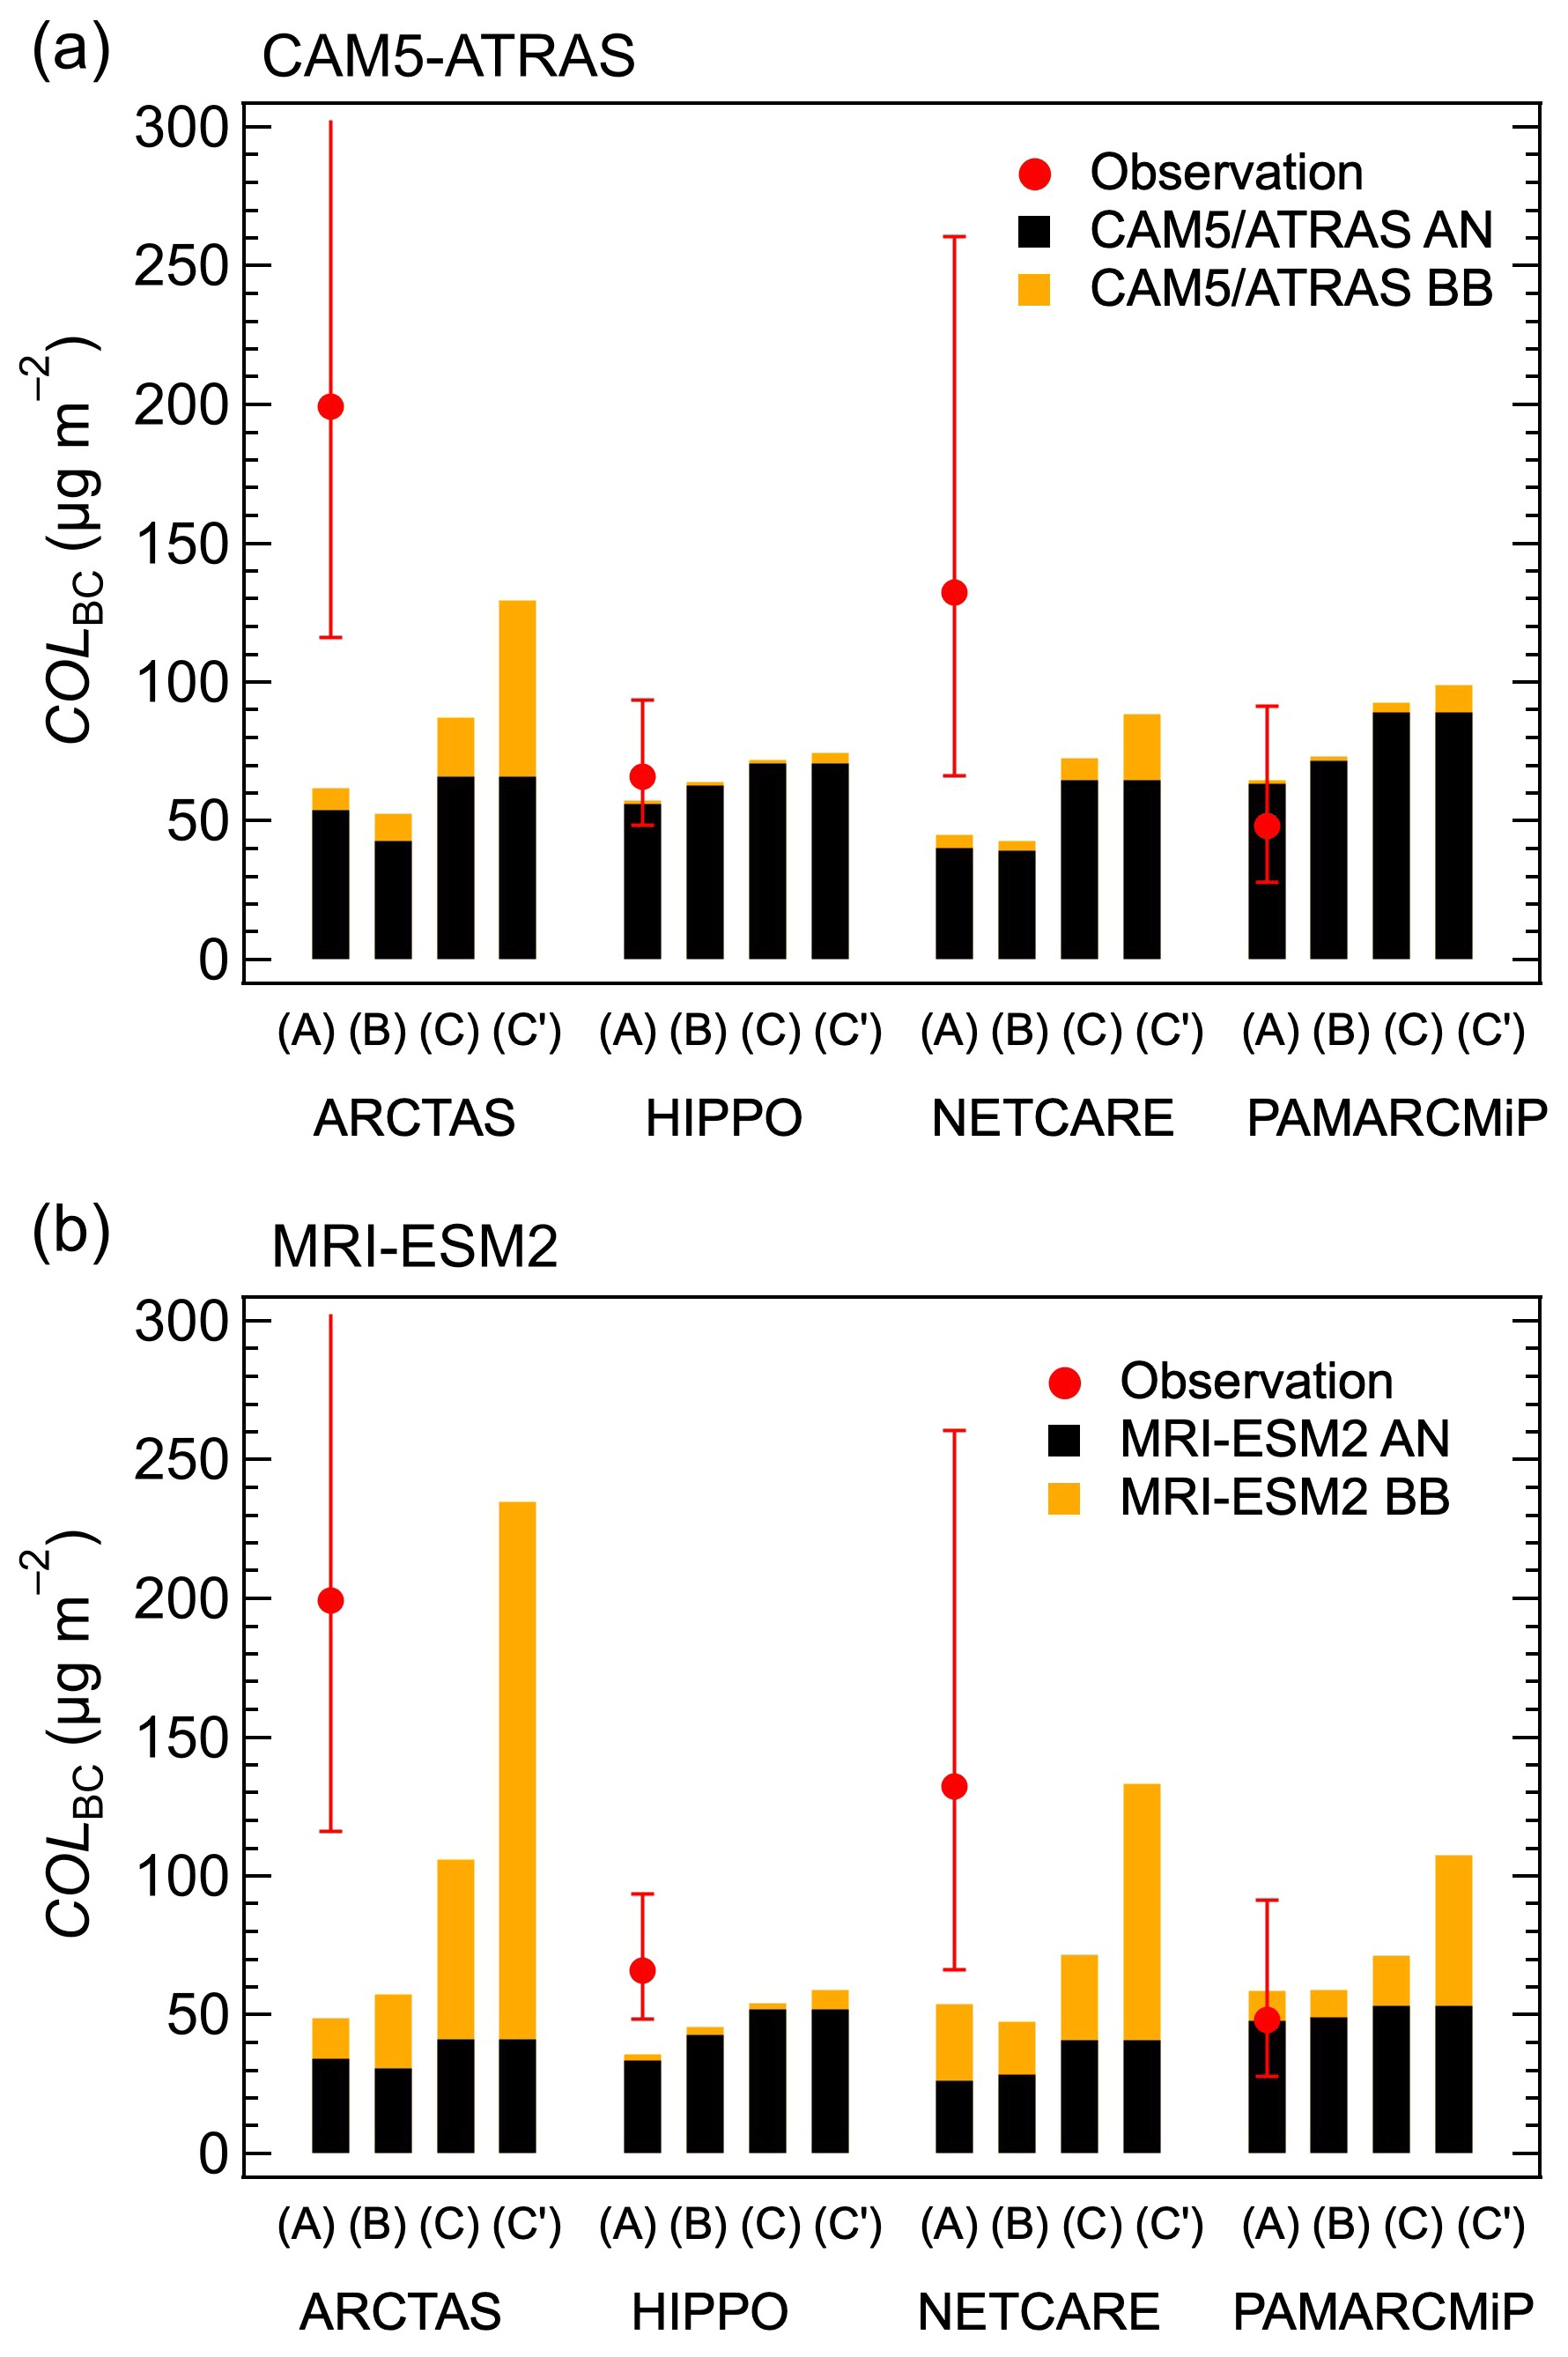
Figure 5Observed column amounts of BC mass concentration at altitudes between 0 and 5 km and latitudes >66.5∘ N (COLBC, red circles) and model-calculated COLBC values (vertical bars). For calculated values, contributions from anthropogenic (AN) and biomass burning (BB) emissions are shown by red and green colors, respectively. The model-calculated COLBC values were derived in three different ways by calculating median or average values for individual altitude ranges: (A) median values along the flight tracks, (B) area-weighted averages within the areas and time periods of the individual aircraft-based experiments shown in Table 3, and (C) area-weighted averages within the entire region at latitudes north of 66.5∘ N for the time periods of the individual aircraft experiments. (C′) is the same as (C) but with the calculated BB contributions multiplied by a factor of 3. (a) CAM5-ATRAS model simulations. (b) MRI-ESM2 model simulations.
4.3 Evaluation of BB BC using numerical model simulations
In Fig. 5, the observed COLBC (>66.5∘ N) values are compared with numerical model simulations from CAM5-ATRAS and MRI-ESM2, described in Sect. 3. The model-calculated COLBC values were derived in three different ways by calculating median or average values for individual altitude ranges: (A) median values along the flight tracks, (B) area-weighted averages within the latitudes and longitudes and the time periods of the aircraft experiments shown in Table 3, and (C) area-weighted averages within the entire region at latitudes north of 66.5∘ N for the time period of an aircraft experiment (Table 5). Because medians were calculated to derive observed COLBC values (Fig. 3 and Table 4), COLBC(A) values can be directly compared with observations. Area-weighted averages were calculated to derive COLBC(B) and COLBC(C) values, because medians cannot be calculated for gridded model values that have different areal weights depending on the latitudes. The reason for calculating the statistics in three ways is that temporal and spatial variations of BC may not be accurately reproduced in the numerical model simulations, and it may make more sense to compare statistics over a wider spatial area. Furthermore, differences between COLBC(B) and COLBC(C) values show possible differences in MBC values among the different observational areas of the four experiments. Figure 5 and Table 5 show that COLBC(B) values are generally lower than COLBC(C). The COLBC(B) COLBC(C) ratios were found to be higher for HIPPO and PAMARCMiP (0.79–0.89) than those of ARCTAS and NETCARE (0.54–0.66), although the observed COLBC values were higher for the latter two experiments as compared with the former ones. These results suggest that the observed higher COLBC values during the ARCTAS and NETCARE experiments are likely not due to the different observational areas but are mostly due to year-to-year variations in MBC over the entire Arctic.
Table 5(a) Model-calculated column BC amounts with the CAM5-ATRAS model. (b) Model-calculated column BC amounts with the MRI-ESM2 model.
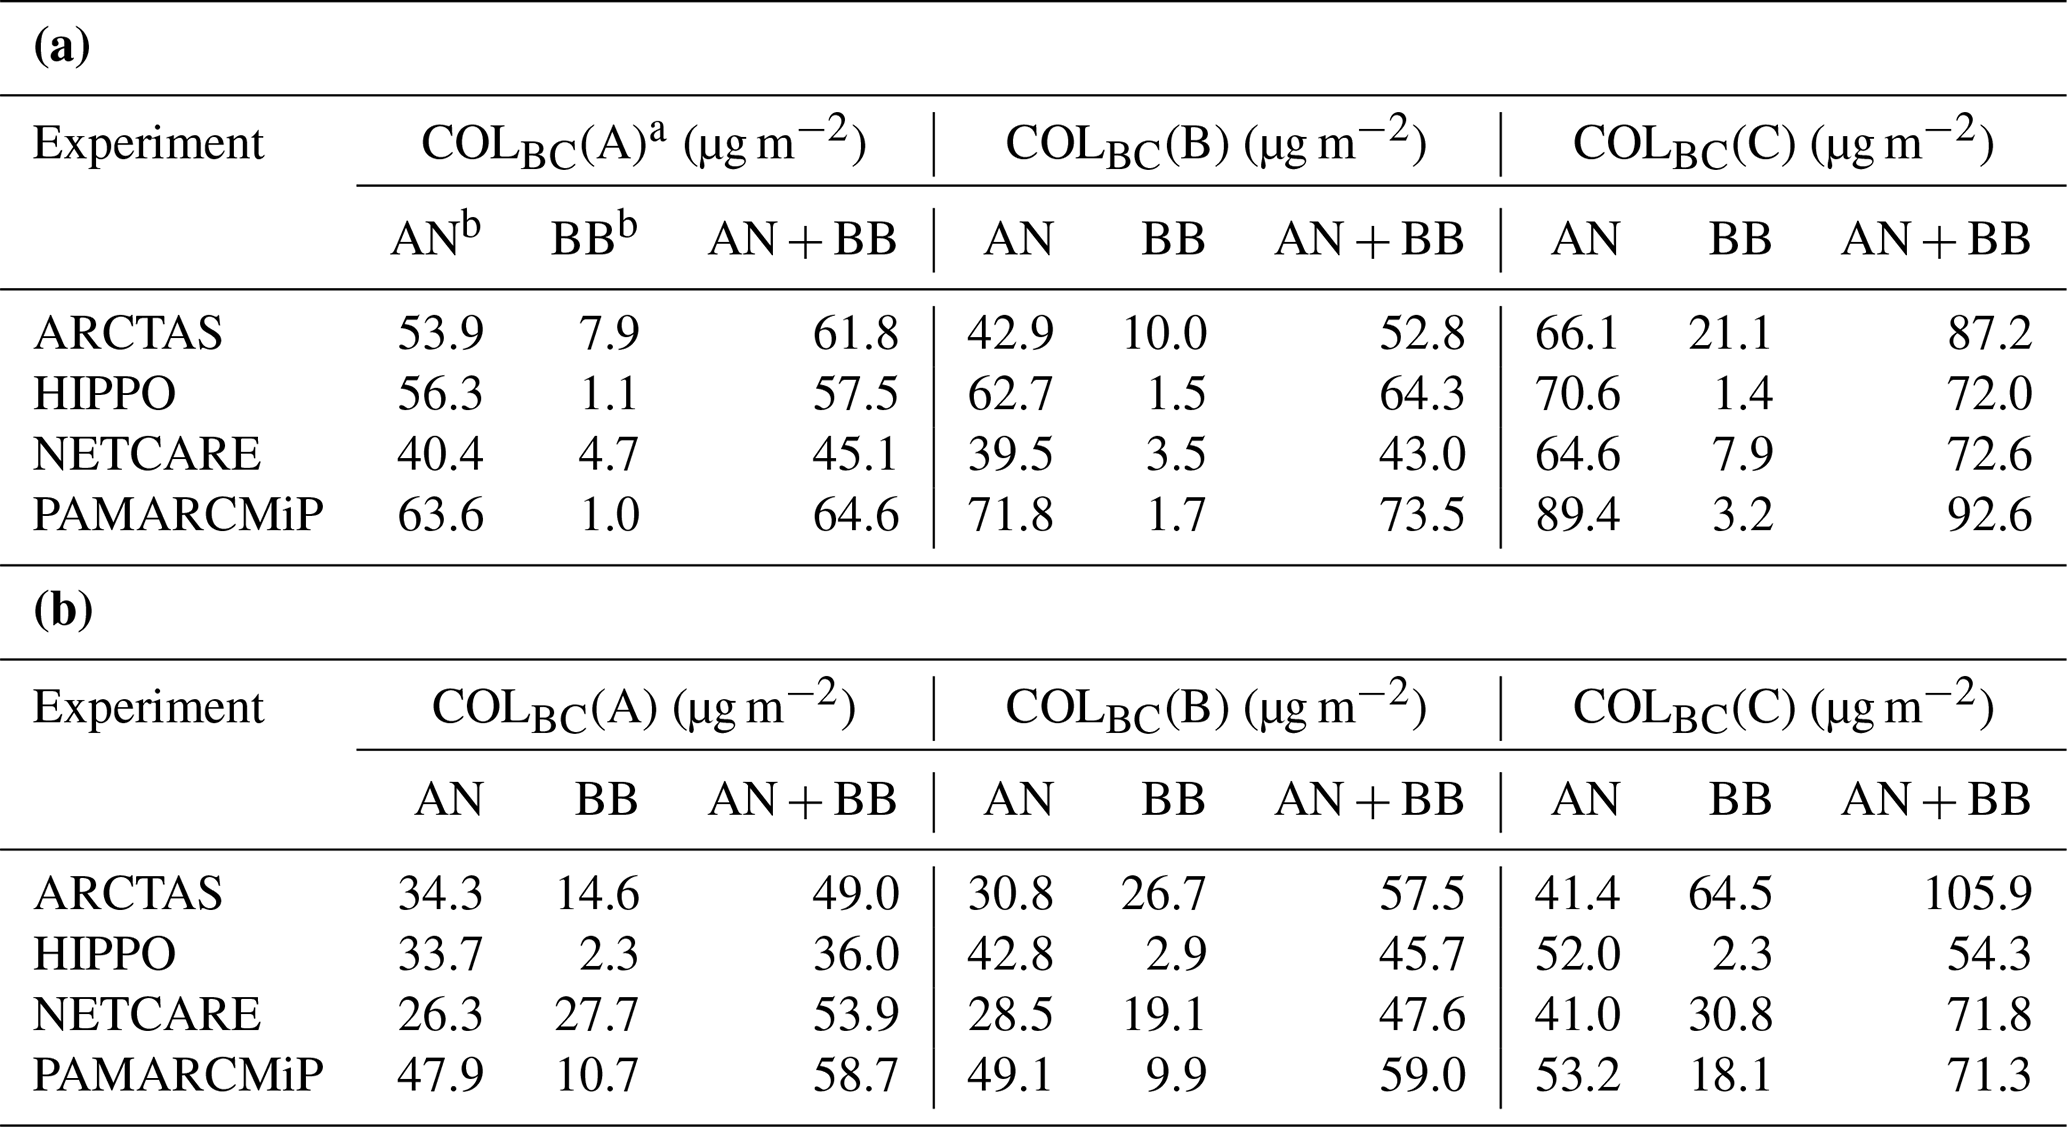
a COLBC is the column BC amount between 0 and 5 km. b AN and BB stand for anthropogenic and biomass burning origins, respectively. (A): median values along the flight tracks. (B): area-weighted averaged values within the latitudes and longitudes and the time period of the aircraft experiment shown in Table 3. (C): area-weighted averaged values within the entire region at latitudes north of 66.5∘ N for the time period of the aircraft experiment.
Figure 5 shows that both models reproduced the observed COLBC values well for PAMARCMiP and HIPPO, whereas they significantly underestimated the observed COLBC values for ARCTAS (by factors of 3.7–5.8) and NETCARE (by factors of 3.3–5.0), when influences from BB BC emissions are considered to have been high. Consequently, the significant underestimations in COLBC could be mostly due to those in BB BC.
In Fig. 5, model-calculated contributions from BB and AN emissions are shown separately. In general, the year-to-year variation of the model-calculated AN values was small (at most 30 % or 38 % for the two model results for >66.5∘ N, COLBC(C)), while that of BB values was much higher (by at most a factor of 15 or 28). When model simulations reproduced the observations well, namely, those from the HIPPO and PAMARCMiP experiments, most of the values of the COLBC(A) originated from AN (98 % and 82 %–94 % for CAM5-ATRAS and MRI-ESM2, respectively). Consequently, the AN contributions are considered to be generally well reproduced. However, although the BB BC values were higher in the ARCTAS and NETCARE cases, the total (AN + BB) COLBC(A) values were still significantly lower than the observations. Reasonable agreement was found only when the calculated BB BC contributions were multiplied by a factor of 3 or more (C′ in Fig. 5). As described in Sect. 3, CAM5-ATRAS and MRI-ESM2 utilized GFED and GFAS BB BC emissions, respectively. Consequently, these results suggest that BB BC emissions could be largely underestimated, or the removal of BC from BB emissions was overestimated, although the level of these uncertainties cannot be evaluated in this study.
In Appendix D, model-calculated vertical MBC profiles are compared with observations for entire altitude ranges in which observed data are available, namely, up to 10.5, 11.0, 5.5, and 5.0 km for ARCTAS, HIPPO, NETCARE, and PAMARCMiP, respectively (Fig. D1). When model-calculated COLBC values generally agree well with the observations (HIPPO and PAMARCMiP), reasonable agreement is found for MBC values throughout the altitudes; however, when model calculations underestimate COLBC values, they underestimate MBC values at all altitudes. These results indicate that the model underestimations in BC values for high BB activity years (ARCTAS and NETCARE) are not due to vertical mismatches of enhanced MBC layers. This conclusion is also consistent with the analyses of BC values for 0–10 km described in Appendix D, namely, the features found for BC values are similar between 0–5 and 0–10 km (Fig. D2).
4.4 Correspondence to surface BC measurements
Figure 2b shows that MBC values near the surface were higher for ARCTAS and NETCARE as compared with those of PAMARCMiP and HIPPO, although larger values were observed in the free troposphere, namely, above 1 km altitude. How much of the year-to-year variation in MBC observed in the free troposphere was observed at the ground surface? To evaluate the level of the variation, we examined surface BC data obtained at Ny-Ålesund and Barrow (Sect. 2.3). Figure 6 shows the medians of daily averaged MBC values during the individual aircraft experiments observed at the surface in Ny-Ålesund and Barrow. Because the number of days for an experiment was relatively small (2 and 7 d for HIPPO and NETCARE, respectively), medians were also calculated for the 31 d period for which the median date was chosen to be the median date of the experiment (Fig. 6 and Table 6). The corresponding average fire counts (31+14 d) are also shown in Fig. 6 and Table 6.
Table 6BC mass concentrations observed at the ground surface.

Medians and 25 %–75 % ranges were calculated for 31 d periods with the median date chosen to be the median date of the experiment given in Table 3. Fire counts were averaged for latitudes north of 50∘ N. Values in parentheses are relative to PAMARCMiP.
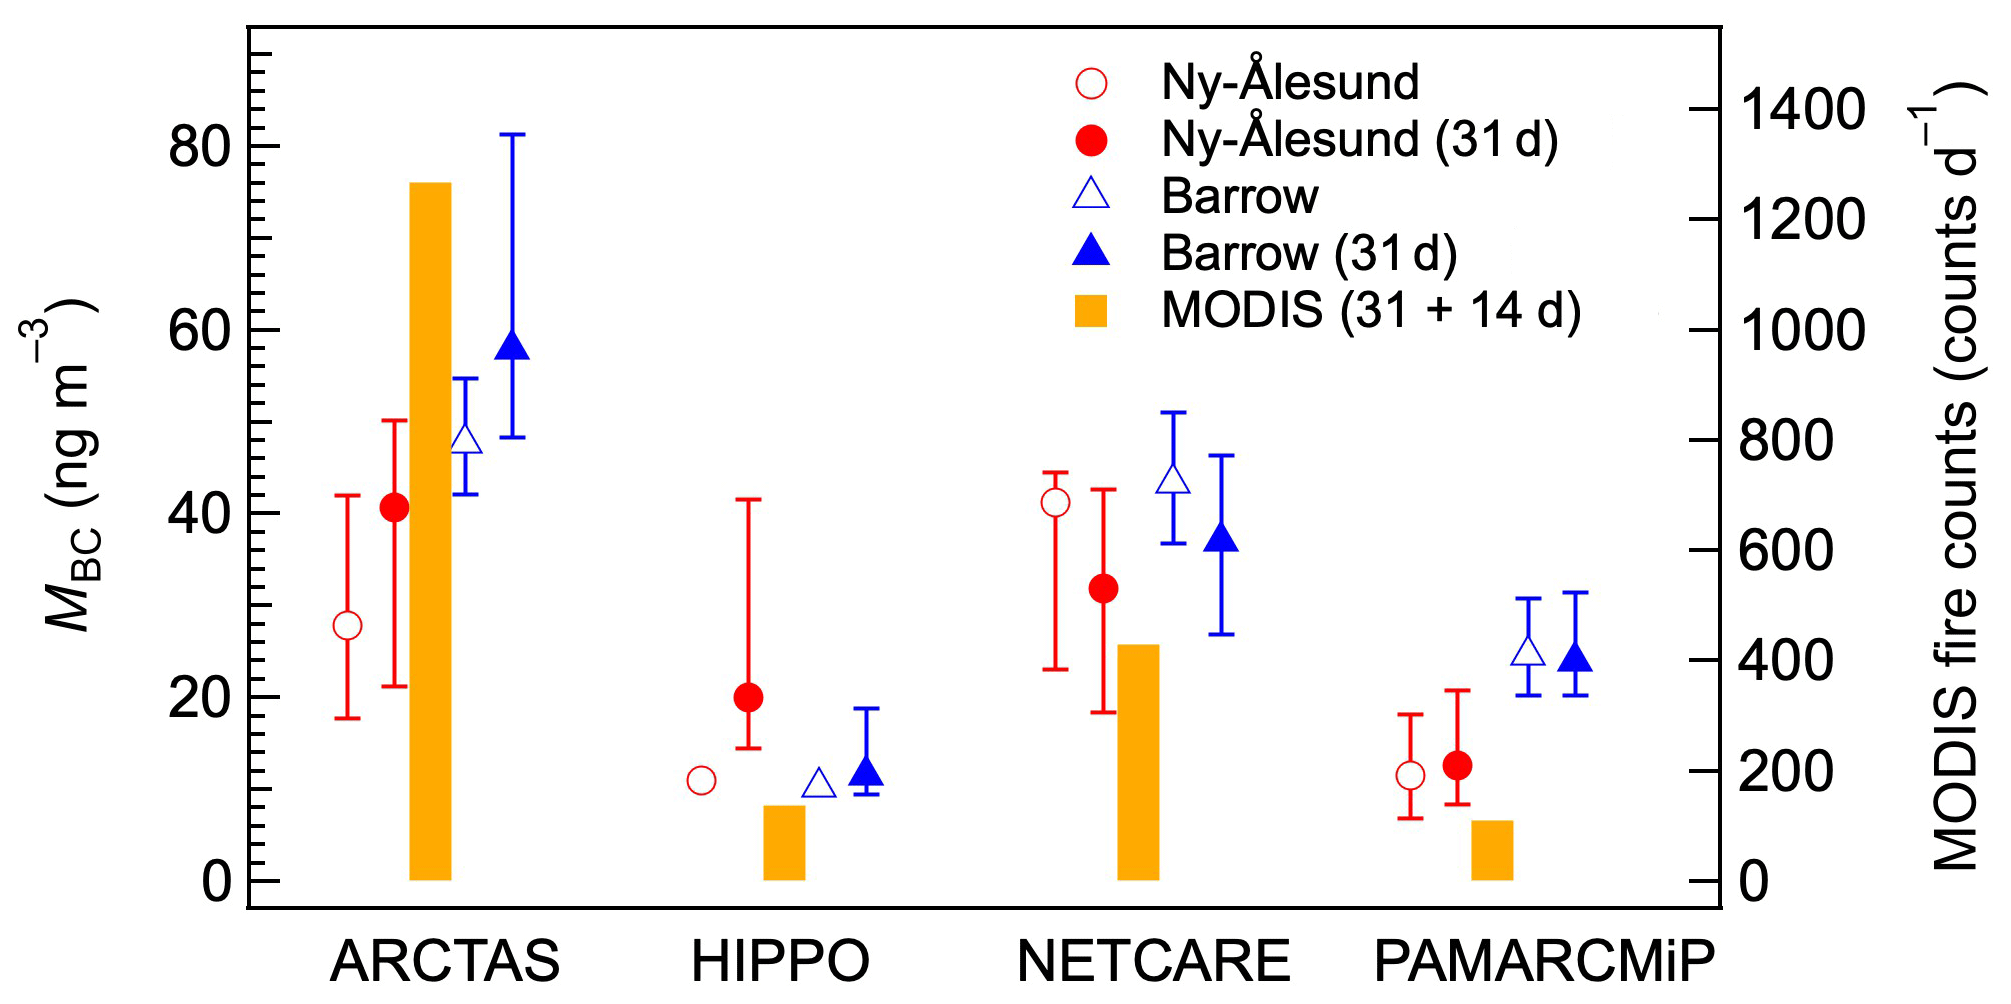
Figure 6BC mass concentrations (MBC) obtained by ground-based measurements at Ny-Ålesund, Svalbard (red), and Barrow, Alaska (blue). Median values of daily averages and 25 %–75 % ranges are shown for the time periods of the individual aircraft experiments (open circles and triangles) and the 31 d period for which the median date was chosen to be the median date of the experiment (closed circles and triangles). Corresponding averaged fire counts (31+14 d) at latitudes north of 50∘ N are also shown (vertical bars). Because the daily averaged MBC was obtained only on 1 d at Barrow for the HIPPO experiment period (2 d), the 25 %–75 % range is not shown.
Previous long-term studies showed that MBC values at Barrow were about a factor of 1.4 higher than at Ny-Ålesund in March–April (Sinha et al., 2017). This tendency is also recognized in the ARCTAS and PAMARCMiP periods shown in Fig. 6, although it is not clearly seen in the other two periods. When the 31 d median values at these two sites were examined, MBC values for the ARCTAS year were higher by factors of 2.5–3.2 in comparison to the PAMARCMiP period. This relative change was somewhat smaller than for COLBC values (by factors of 4.2 and 3.6 for >66.5 and 80∘ N, respectively); however, we can still conclude that surface BC measurements can capture the year-to-year variations of atmospheric COLBC caused by varying BB activities. The smaller year-to-year variation observed at the surface was likely due to a strong temperature inversion that inhibited vertical mixing (Brock et al., 2011).
5.1 Origin of air parcels with enhanced MBC
As described in Sect. 4, the atmospheric BC level during the PAMARCMiP experiment was least affected by recent biomass burning at altitudes below 4.5 km. Considering the negligible levels of BB activities before the experiment (Fig. C1) and the very small BB contributions predicted by numerical models (Fig. 5), most BC particles observed during PAMARCMiP should be of anthropogenic origin. This is also supported by the observational results of Yoshida et al. (2020) and Adachi et al. (2021), who found tight correlations between BC and anthropogenic iron oxide particles during PAMARCMiP. Moreover, plumes with enhanced MBC values up to 250 ng m−3 were observed at altitudes around 5 km, as shown by the red data points in Fig. 2a. In this section, we propose that these enhanced MBC values were likely due to influences from BB emissions. We then examine possible differences in microphysical properties between these BC particles and other BC particles that were least affected by BB.
The plumes with enhanced MBC values were observed at similar locations and altitudes on 2, 3, and 4 April. In total, twenty-nine 1 min datasets with MBC>50 ng m−3 were obtained. Time series of 1 min MBC data on 2 April are shown in Fig. S1 in the Supplement. Although the horizontal wind direction was different on these 3 d, wind speeds of 2.5 to 6.5 m s−1 suggest that the plumes could extend over 1000 km. Because the research aircraft could not fly at altitudes above 5.2 km, we could not observe the vertical extent of these enhancements. However, the elastic Airborne Mobile Aerosol Lidar (AMALi) installed aboard the research aircraft observed a well-defined aerosol layer at altitudes between 5.15 and 6.8 km on 2 April (Nakoudi et al., 2020), suggesting that the plumes with enhanced MBC values could extend over this vertical range. A photo taken from the research aircraft POLAR 5 on 3 April is also shown in Appendix D (Fig. D1), where a haze layer with reddish color, which may correspond to the plumes, was captured.
When MBC enhancements were observed, increased aerosol potassium concentration was also observed, suggesting that these plumes had likely been affected by BB emissions (Adachi et al., 2021). Enhancements in CO and CO2 concentrations were also observed in these plumes. The ratio of their increases (ΔCO ΔCO2), derived from a slope of a least squares fit to the scatter plots of CO and CO2 concentration data during the plume periods, was 12.3 ppbv ppmv−1, suggesting that these plumes were likely due to incomplete combustion. This result is also in accordance with influences from BB. In fact, this ratio is similar to the ΔCO ΔCO2 ratio of 15 ± 5 ppbv ppmv−1 observed in air affected by Asian BB observed during the ARCTAS experiment (Kondo et al., 2011a).
Figure 7a shows Fig. 8 d backward trajectories of air with enhanced MBC values. These air parcels originated from eastern Eurasia where active BB took place when air parcels were located. They were likely uplifted upon the passage of a cold frontal system over the BB area. MRI-ESM2 model simulations generally reproduced these transport processes. Figure 7b shows that air with enhanced MBC values (BB origin) was transported on isentropic surfaces up to 450 hPa level along 135∘ E. AN BC was also transported upward upon the passage of a cold frontal system; however, contributions for MBC values were small (not shown). Air with enhanced MBC values then spread in a horizontal direction at the 500 hPa level. Enhanced MBC values were likely observed within this air (Fig. 7c). The transport pathway of this BB plume is also discussed by Adachi et al. (2021).
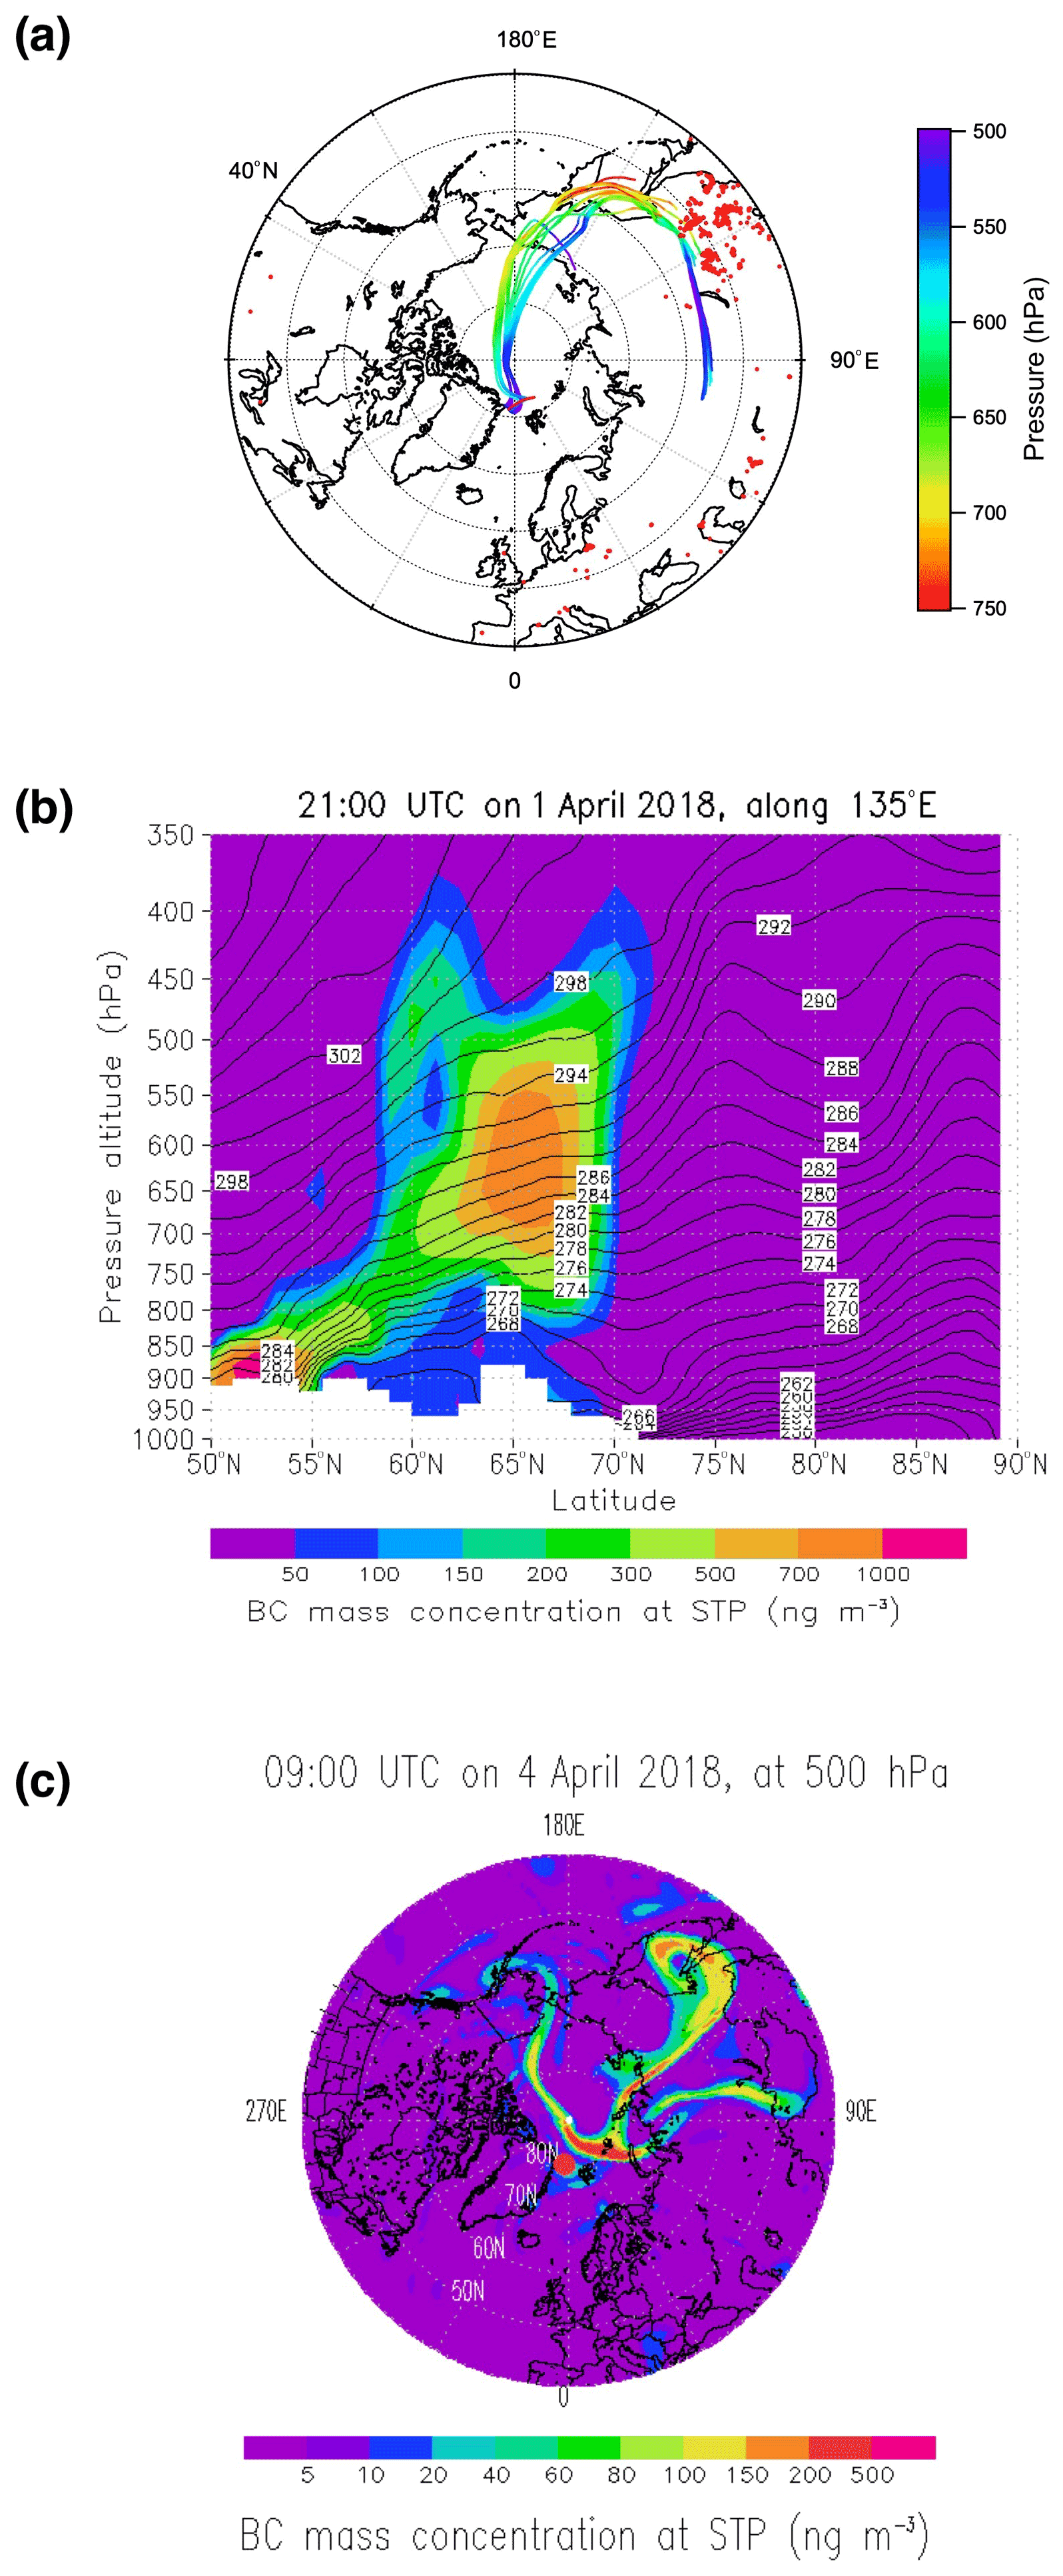
Figure 7(a) Eight-day backward trajectories of air with enhanced BC mass concentrations (MBC) observed on 2, 3, and 4 April 2018 (the data points shown in red in Fig. 2a). Red points are MODIS-derived hot spots observed during 25–27 March, 8 d before the aircraft observations of the enhanced MBC. (b) Model-calculated latitude–pressure-altitude cross-section of MBC along the 135∘ E line (color) and potential temperature (contours) at 21:00 UTC on 1 April 2018 (MRI-ESM2 model). MBC values originating from BB are shown. (c) Horizontal distribution of MBC (BB origin) at 500 hPa level at 09:00 UTC on 4 April 2018 when the enhanced MBC data were observed (MRI-ESM2 model). The red circle denotes the aircraft location when the enhanced MBC data were observed.
The GFED mass emission ratio of BC to CO from BB sources in eastern Eurasia shown in Fig. 7a (40.7–52.1∘ N and 110–125∘ E during 25–27 March, 8 d before the observations) was 5.54 × 10⁻³ ng m−2 s−1 (ng m−2 s, which corresponds to [ΔBC ΔCO]source = 6.92 ng m−3 ppbv−1 at STP. Within the plumes, the slope of [ΔBC ΔCO]air=4.00 ng m−3 ppbv−1 at STP was observed. Because CO molecules are not removed by precipitation while BC particles are, the transport efficiency of BC can be estimated to be TEBC= [ΔBC ΔCO]air [ΔBC ΔCO]source=0.58, indicating that 42 % of the BC emitted from BB had been removed during the transport. When TEBC along air parcel trajectories was estimated using MRI-ESM2 model calculations, values of about 0.4–0.5 were obtained, which is consistent with the TEBC value estimated from the ΔBC ΔCO analysis (0.58). Model calculations show that most of the wet removal of BC took place upon lifting in association with the passage of the cold frontal system described above, and that TEBC changed little after air parcels reached the free troposphere. During the ARCTAS experiment, [ΔBC ΔCO]source was estimated to be 7.6 ng m−3 ppbv−1 at STP within Russian BB plumes, which were likely the least affected by wet deposition (Matsui et al., 2011); this estimate is in accordance with the estimate in this study (6.92 ng m−3 ppbv−1) using GFED data. The observed [ΔBC ΔCO]air of about 6.3 ng m−3 ppbv−1 at STP and the resulting TEBC of 0.83 obtained during the ARCTAS experiment for the Russian BB air were slightly higher than the values obtained in this study (4.0 ng m−3 ppbv−1 at STP and 0.58). The lower PAMARCMiP TEBC values are in accordance with the fact that the accumulated precipitation along the backward trajectories (e.g., Oshima et al., 2012, 2013; Raut et al., 2017) was about 2 times higher than that of the ARCTAS experiments (i.e., 19.7 mm for PAMARCMiP and 8.5 mm for ARCTAS), suggesting that BC had been more efficiently removed by precipitation during PAMARCMiP.
5.2 Microphysical features of BB BC
Figure 8a shows the vertical profile of the mass-averaged diameter of BC particles (DBC), which is defined as
where ρBC is the void-free density of BC (1.8 g cm−3), and NBC is the number concentrations of BC for the Dm range of 70–850 nm. The median DBC values in individual altitude ranges are also shown. Enhanced MBC value data are shown in red color. The median DBC values decreased with increasing altitude; they were about 167 nm near the ground surface and 134 nm at 4.5 km (Table 2). The normalized mass size distribution of BC shows a gradual shift of the mode diameter to a smaller size at higher altitudes (Fig. 9), which is consistent with that observed during the NETCARE experiment (Schulz et al., 2019). The values of the mass median diameter (MMD) and geometric standard deviation (σg) for the lognormal-fitted size distributions are also shown in Fig. 9. A previous study made over East Asia showed that the DBC values observed in the free troposphere were generally smaller than those in the planetary boundary layer influenced by anthropogenic emissions, likely due to wet removal during upward transport (Moteki et al., 2012). In fact, when the wet removal fraction was higher (TEBC was lower), the DBC was smaller in the free troposphere. Because larger diameter BC particles generally have greater amounts of coating material and, hence, have higher cloud condensation nuclei (CCN) activities, they are selectively removed by precipitation (Moteki et al., 2012; Ohata et al., 2016; Moteki et al., 2019). When air parcels are uplifted to higher altitudes, they potentially experience higher supersaturation in clouds, and aerosols with lower CCN activities (smaller diameter of BC core) can remain. These mechanisms likely resulted in the observed smaller DBC values at higher altitudes during the PAMARCMiP experiment.
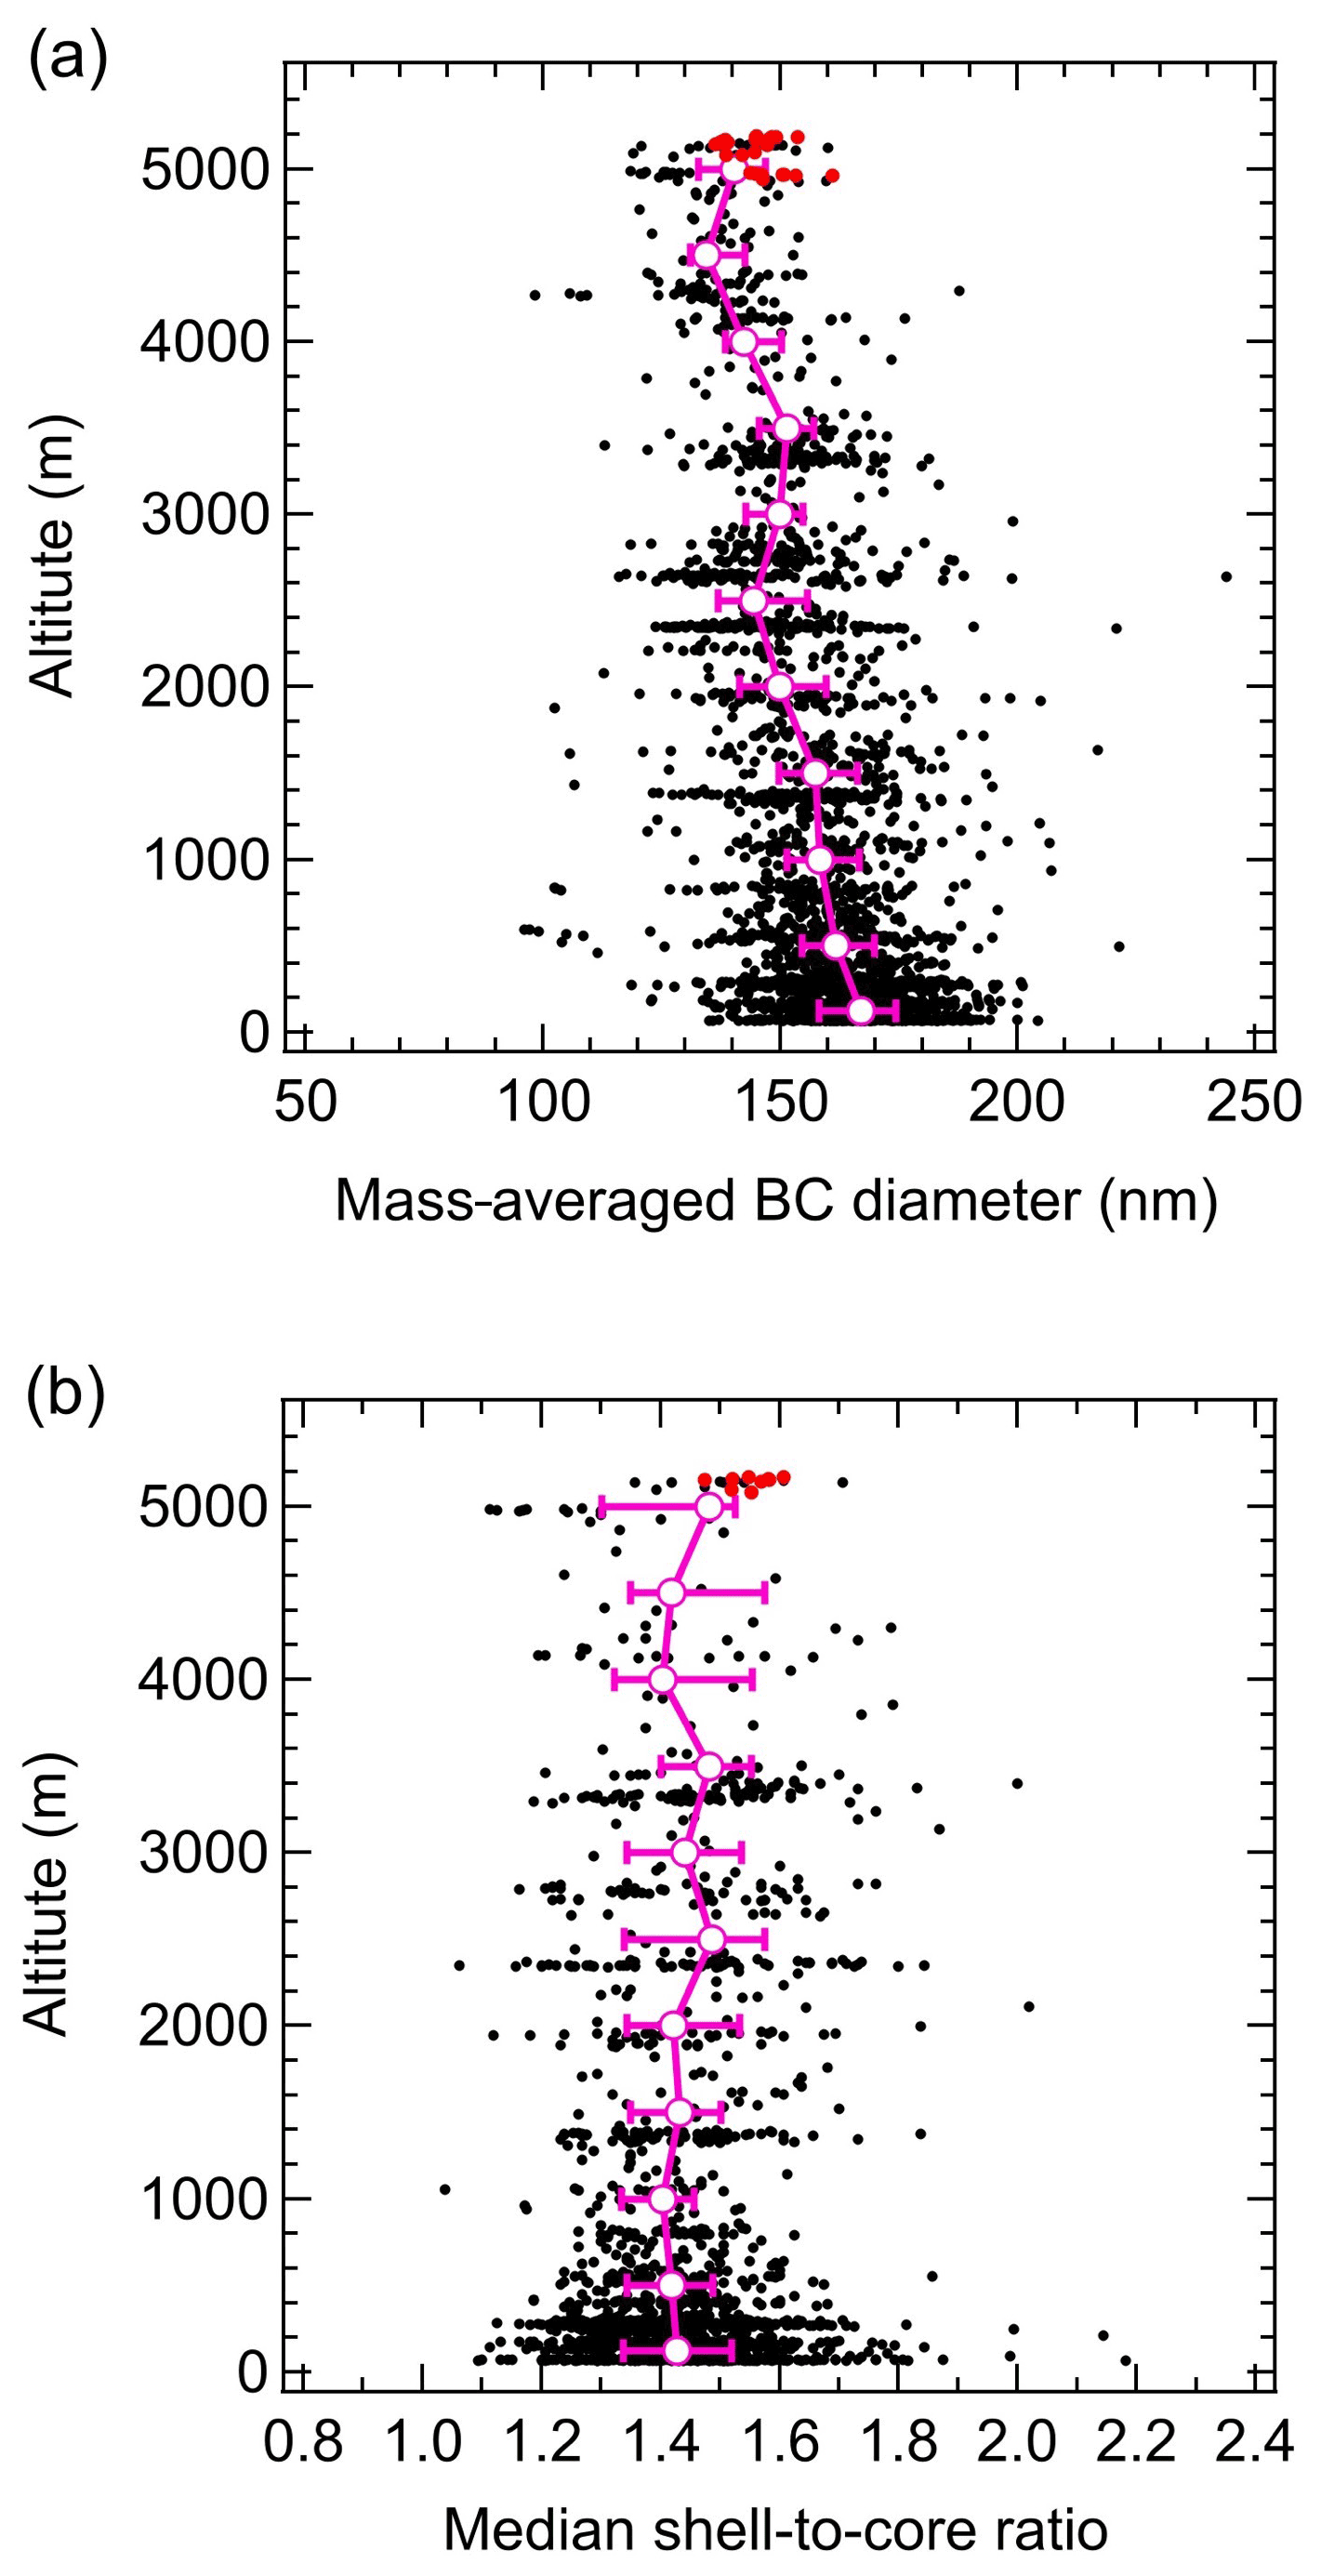
Figure 8(a) Vertical profile of mass-averaged diameters of BC (DBC). Closed circles denote 1 min data that were calculated from 1 min BC mass concentrations (MBC) and BC number concentrations using Eq. (1). Median values and 25 %–75 % ranges are also shown. Data points shown in red (the enhanced MBC data points shown in red in Fig. 2a) were likely influences by biomass burning emissions. Panel (b) is the same as (a) but for the median shell-to-core diameter ratios for particles with a mass equivalent BC diameter (core diameter) of 180–192 nm.
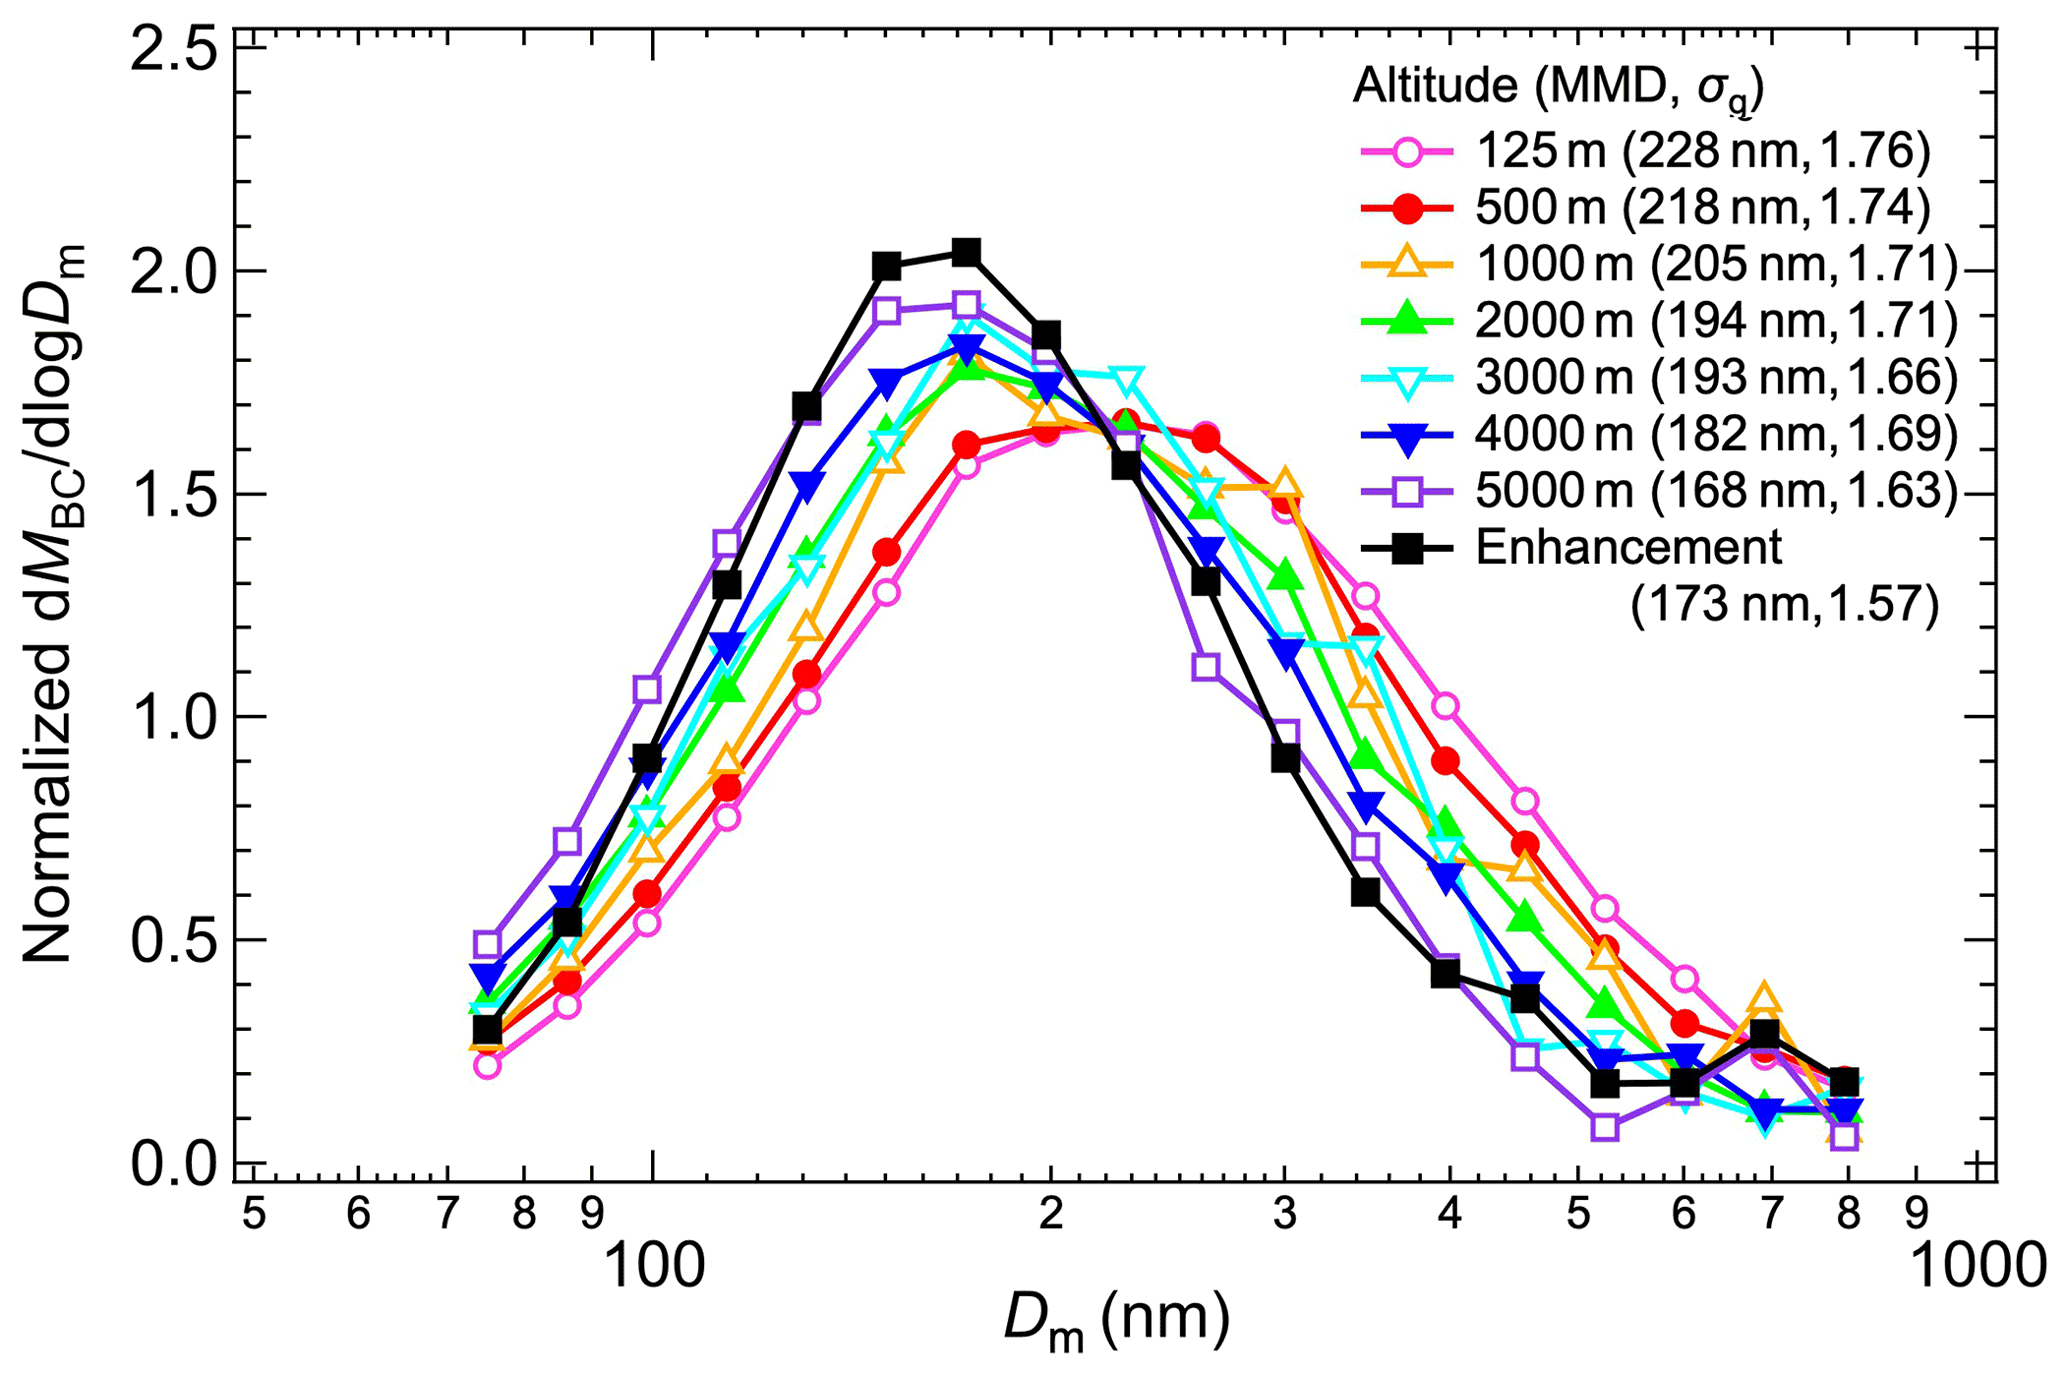
Figure 9Averaged mass size distribution of BC in each altitude range. Values normalized by the total mass concentrations of BC ((dMBC dlogDm) MBC) are shown. The average size distribution for the enhanced MBC data is shown with black squares. The numbers shown in parentheses are the mass median diameter (MMD) and the geometric standard deviation (σg) for the lognormal-fitted size distributions.
The median value of the DBC in the enhanced MBC air was 145 nm (Table 2), which is only slightly higher than that of other BC particles sampled at this altitude range. Various factors could cause the observed differences. The BC particles could have already been larger upon BB emission than those from anthropogenic sources, or they could have been removed less efficiently. However, considering the relatively large change in DBC with altitude (Figs. 8a and 9), the similarity in DBC between recent BB plumes and aged AN air is remarkable.
Figure 8b shows the vertical profile of the median shell-to-core diameter ratios for Dm=180–192 nm. It is remarkable that the shell-to-core ratios change so little with altitude. The median values are between 1.40 and 1.48 over the entire altitude range (Table 2). This tendency and similar values were also observed during the NETCARE experiment (Kodros et al., 2018), suggesting that the observed features are common in the Arctic spring. Considering the possible greater influences of wet removal at higher altitudes, the small change in the shell-to-core ratios with altitude was not easily interpreted.
The shell-to-core diameter ratios of the enhanced MBC data were only slightly higher than for other data (Table 2). These air parcels were likely affected by recent (within a week) wet removal; therefore, one may expect a smaller coating thickness, because BC particles with thicker coating were likely removed due to higher CCN activities. Weaker updraft speed (lower supersaturation) or less hydrophilic coating compositions could be possible explanations. Cloud-precipitation processes during transport such as the aqueous-phase reactions or evaporation of precipitating particles after accretion might also increase the coating thickness of BC. The similarity in the shell-to-core diameter ratios between recent BB plumes and aged AN air provide useful constraints to validate numerical model simulations.
The PAMARCMiP aircraft-based experiment measured vertical profiles of MBC at altitudes up to 5 km in spring 2018. Median MBC values in individual altitude ranges were 7–18 ng m−3 at altitudes below 4.5 km. These concentrations were systematically lower than those observed during ARCTAS in 2008 and NETCARE in 2015, whereas they were similar to those observed during HIPPO in 2010. Vertically integrated BC mass concentrations for altitudes below 5 km in the Arctic (>66.5∘ N, COLBC) observed during the ARCTAS and NETCARE experiments were higher than the PAMARCMiP value by factors of 4.2 and 2.7, respectively. When data obtained only at >80∘ N were compared, the same tendency was observed: the ARCTAS and NETCARE COLBC values were higher by factors of 3.6 and 2.3, respectively. The year-to-year variation of COLBC values generally corresponded to that of MODIS-derived BB fire counts in northern high latitudes (45–60∘ N) in western and eastern Eurasia (around 30–50 and 100–130∘ E, respectively). Furthermore, two numerical model simulations estimated that the year-to-year variation of contributions from AN emissions was lower than 30 %–40 %. These results suggest that the year-to-year variation of BB activities likely affected the BC amounts in the Arctic troposphere in spring, at least in the years examined in this study.
Numerical model simulations generally well reproduced the observed COLBC values for PAMARCMiP and HIPPO (within factors of 2) when BB activities were low but underestimated the values for ARCTAS and NETCARE (by factors of 3.3 to 5.8) when BB activities were high. Because AN contribution mostly accounts for PAMARCMiP and HIPPO COLBC (82 %–98 %), the good agreements between the observations and model simulations for these two experiments suggest that AN contribution was generally well reproduced. However, the significant underestimations for ARCTAS and NETCARE suggest that the BB contributions were underestimated. For these two cases, reasonable agreement was found only when the calculated BB BC contributions were multiplied by a factor of 3 or more. Consequently, these results suggest that BB BC emissions could be greatly underestimated or the removal of BC from BB emissions was overestimated, although the level of these uncertainties cannot be evaluated in this study.
The year-to-year variation of MBC values obtained at the surface at the high Arctic sites Ny-Ålesund and Barrow during the periods corresponding to the four aircraft experiments was also examined. The 31 d median MBC values for the ARCTAS year were higher by factors of 2.4–3.2 than for the PAMARCMiP period. Although this relative change in MBC values was somewhat smaller than that in the COLBC values (by factors of 4.2 and 3.6 for >66.5 and 80∘ N, respectively), likely due to the limited vertical mixing, we can still conclude that ground surface BC measurements can capture the year-to-year variations caused by BB activities.
Because BC particles observed at altitudes below 4.5 km during the PAMARCMiP experiment were least affected by recent BB and mostly originated from AN sources, the microphysical properties of BC particles were studied. The mass-averaged diameter of BC particles (DBC) decreased with increasing altitude, from 167 nm near the ground surface to 134 nm at 4.5 km. This tendency is in accordance with the selective removal of BC-containing particles with higher CCN activities. The median shell-to-core diameter ratios for Dm=180–192 nm changed little with altitude and were between 1.40 and 1.48 throughout the entire altitude range. Interestingly, DBC and the shell-to-core diameter ratio of BC in the BB plumes observed during the PAMARCMiP experiment were generally not very different from those in other air samples, which were considered to be mostly aged AN BC.
Direct radiative forcing of BC in the Arctic is considered to be highest in spring when MBC is the largest and incoming solar radiation is increasing. BC in spring is also important because slight changes in the time of snow/ice melt can influence the radiation budget in the Arctic. The observations presented in this study provide a useful basis to improve and evaluate numerical model simulations that assess the BC radiative effect in the Arctic spring.
Global warming has the potential to increase BB activity in various regions, although future projections strongly depend on the assumed socioeconomic scenarios (IPCC, 2021). Our study also suggests that future changes in mid- and high-latitude BB BC emissions will strongly influence the amount of Arctic BC and its radiative impact.
MBC measurements made with The University of Tokyo SP2 during ARCTAS (Sahu et al., 2012) were compared with NOAA SP2 measurements (NOAA-ARCPAC experiment, Spackman et al., 2010). Two measurements were made aboard the NASA DC-8 and NOAA WP-3D, respectively. Figure A1a shows that the two aircraft flew in very close tracks at altitudes between 0.3 and 5.6 km for about 70 min on 12 April 2008. This figure also shows that time series of 1 min MBC data agreed well between the two measurements. Figure A1b shows a scatter plot between these two sets of 1 min data. They were strongly correlated (R2=0.92) with a slope of 0.80. The systematically higher U. Tokyo values might partly be attributed to a wider size range of U. Tokyo BC measurements and a difference in corrections for undetected BC between the measurements as described below.
During the ARCTAS campaign, the U. Tokyo SP2-measured BC particles in the Dm range of 80–860 nm. Although the estimated mass fraction of the undetected BC was small (4 % for 50–80 nm), the MBC for the Dm range of 50–900 nm was obtained by integrating the single-mode lognormal fit function of the measured size distribution (Sahu et al., 2012). In contrast, the measured Dm range of the NOAA SP2 during the NOAA-ARCPAC experiment was 90–600 nm. The MBC was estimated by multiplying the integrated mass of BC particles by 1.1, considering the undetected mass fractions of BC outside the detection range (Spackman et al., 2010; Schwarz et al., 2010). These differences in measurements and data reductions could have resulted in some systematic differences between the two MBC datasets.
Because MBC measurements were consistently and traceably made by the individual groups, the systematic differences in absolute MBC values obtained by them are expected to be smaller than 20 %.
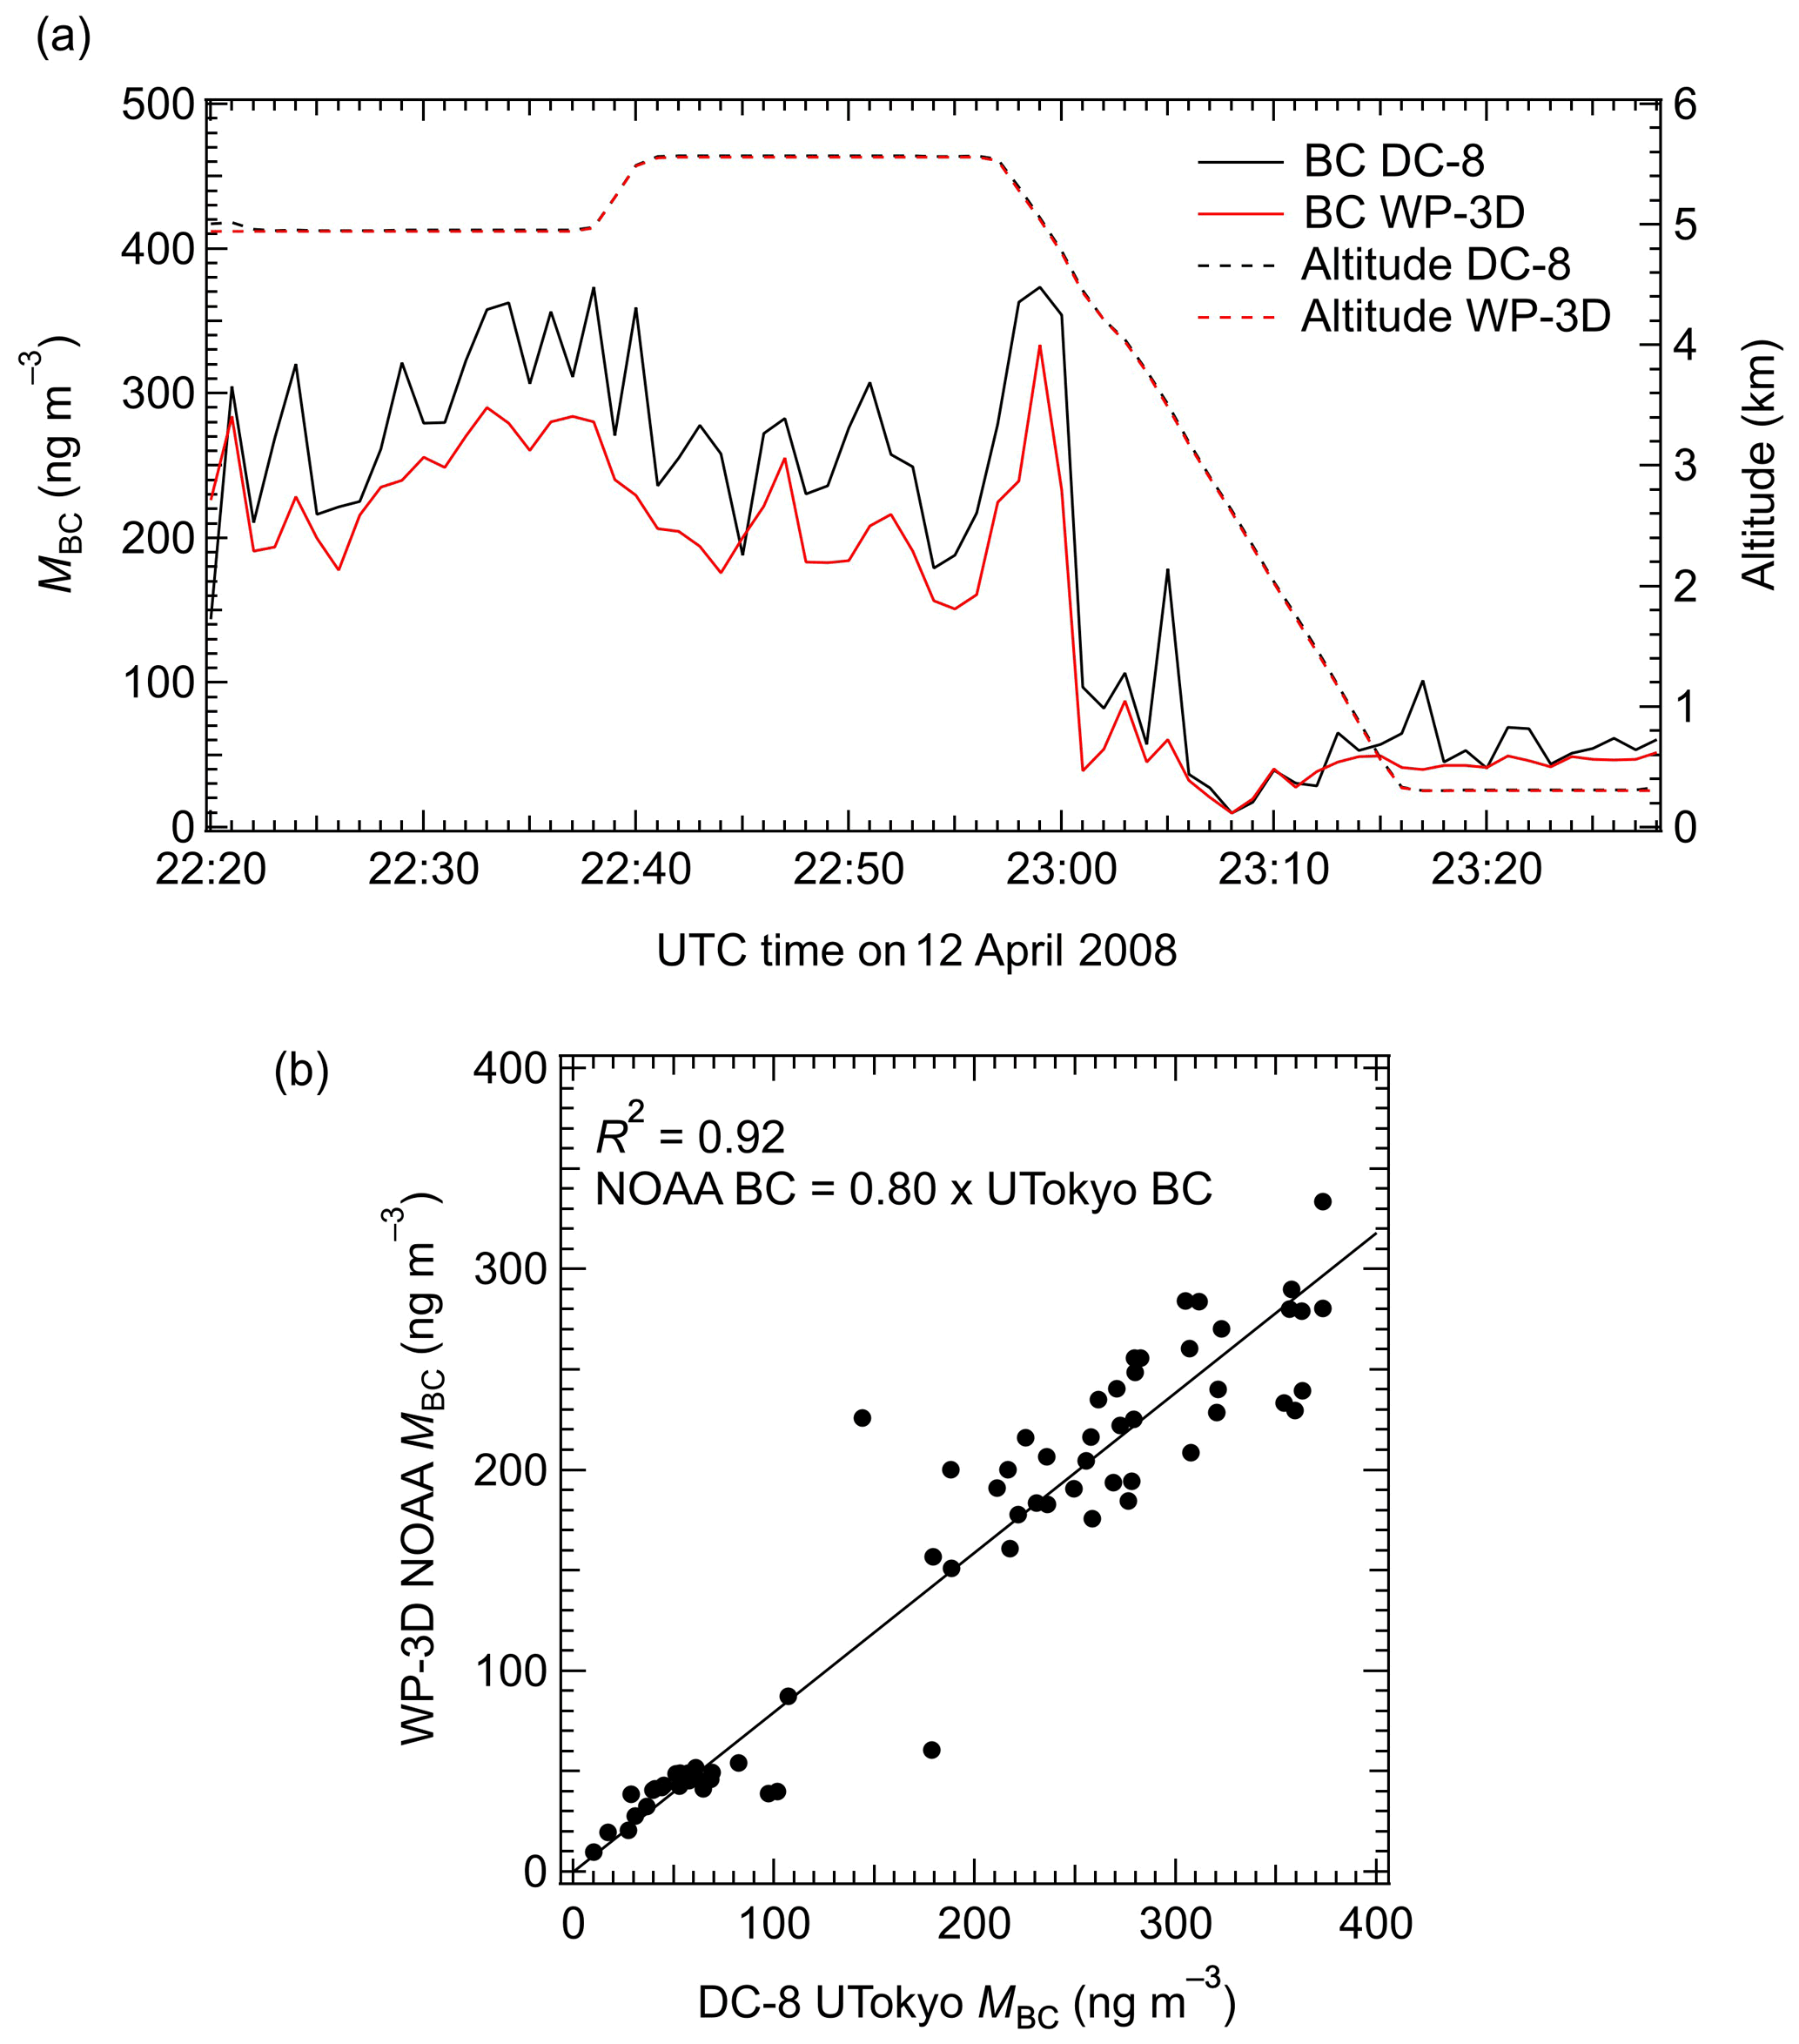
Figure A1Comparison between MBC measurements made with The University of Tokyo SP2 during ARCTAS aboard the NASA DC-8 (black lines; Sahu et al., 2012) and NOAA SP2 measurements aboard the NOAA WP-3D (red lines, NOAA-ARCPAC experiment; Spackman et al., 2010). (a) Time series of 1 min data of MBC values (solid lines) and aircraft altitudes (dashed lines). (b) Scatterplot between these MBC values. The solid line is the least-squares fitted line forced through (0, 0).
Six-day kinematic back trajectories of air parcels measured aboard the aircraft were calculated every minute based on the method described by Tomikawa and Sato (2005). For calculating the trajectories, 6-hourly meteorological data from the National Centers for Environmental Prediction (NCEP) Final (FNL) operational global analysis were used. As shown in Fig. B1, air parcels sampled at altitudes below 1 km and between 1 and 3 km had originated mostly from north of 70 and 60∘ N, respectively. Air parcels sampled at altitudes between 3 and 5 km had occasionally originated at latitudes as low as 50∘ N, in central and eastern Eurasia and northwestern Canada.

Figure B1Six-day kinematic back trajectories of air parcels measured aboard the aircraft. Color scales denote the pressure altitude of air. (a) Trajectories starting from altitudes z<1 km. (b) Same as (a) but for 1<z<3 km. (c) Same as (a) but for 3<z<5 km.
Time series of the daily averaged number of fire counts (counts d−1) detected by the MODIS satellite (MCD14DL products, https://earthdata.nasa.gov/active-fire-data, last access: 19 October 2021) are shown in Fig. C1 for the four aircraft experiments at latitudes north of 40, 50, and 60∘ N. The first day of each individual aircraft experiments (>66.5∘ N) is also indicated. Fire counts at latitudes >40 and >50∘ N started to increase in mid-to-late March in all 4 of the years examined in this study.
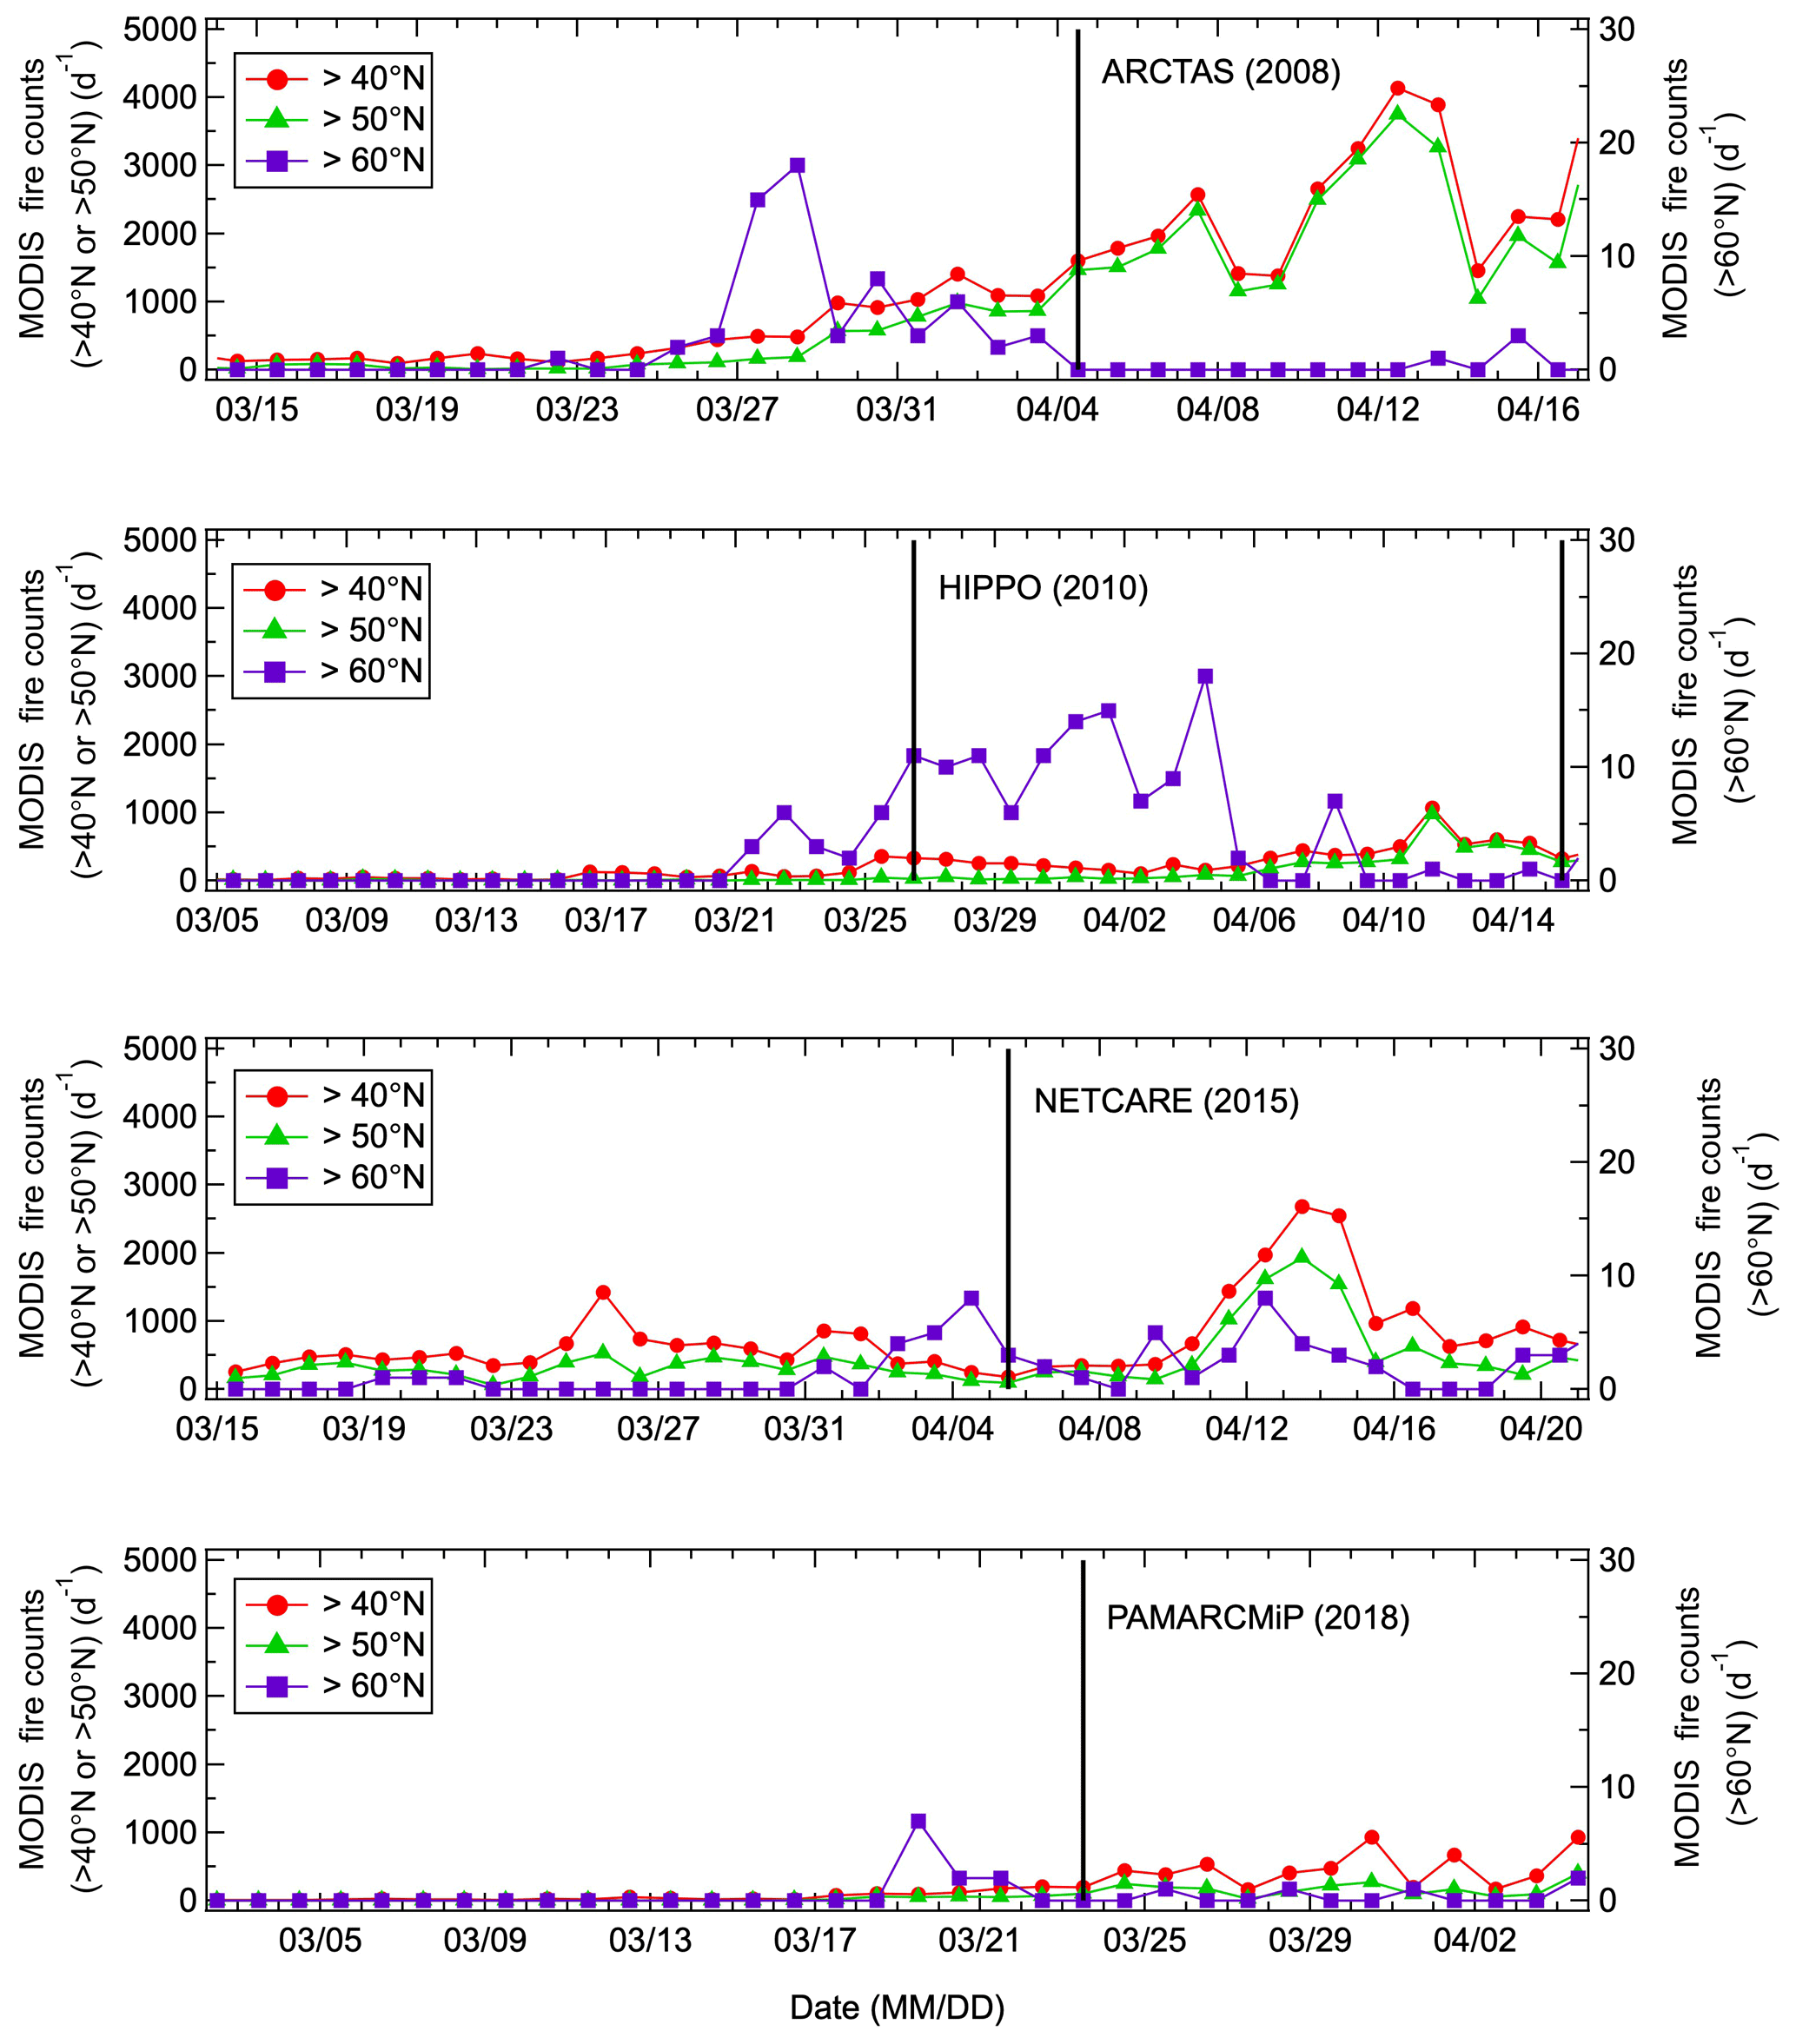
Figure C1Time series of the daily averaged number of fire counts (counts d−1) detected by the MODIS satellite. Vertical bars indicate the start dates of the individual aircraft-based experiments.
Figure D1 shows comparisons of vertical MBC profiles between observations and numerical model calculations. Vertical profiles are shown for entire altitude ranges in which observed data are available, namely, up to 10.5, 11.0, 5.5, and 5.0 km for ARCTAS, HIPPO, NETCARE, and PAMARCMiP, respectively. For calculated values, we use (B) area-weighted averages within the latitudes and longitudes and the time periods of the aircraft-based experiments (described in Sect. 4.3) for both CAM5-ATRAS and MRI-ESM2 (described in Sect. 3). When we use (A) median values along the flight tracks, similar results are obtained. As shown in these figures, both models generally well reproduced the observed low MBC values for the HIPPO and PAMARCMiP experiments, when BB activities were low. On the contrary, both model calculations significantly underestimated the observed high MBC values at all altitudes for ARCTAS and NETCARE. In fact, the year-to-year variations in the model-calculated MBC values are much smaller than those of observations throughout the altitudes. These results are consistent with those of COLBC analyses (MBC column amounts at altitudes between 0 and 5 km as shown in Fig. 5) described in Sect. 4.3. In other words, the model underestimations in COLBC values for high BB activity years (ARCTAS and NETCARE) are not due to vertical mismatches of enhanced MBC layers but are likely caused by underestimating BB BC emissions.
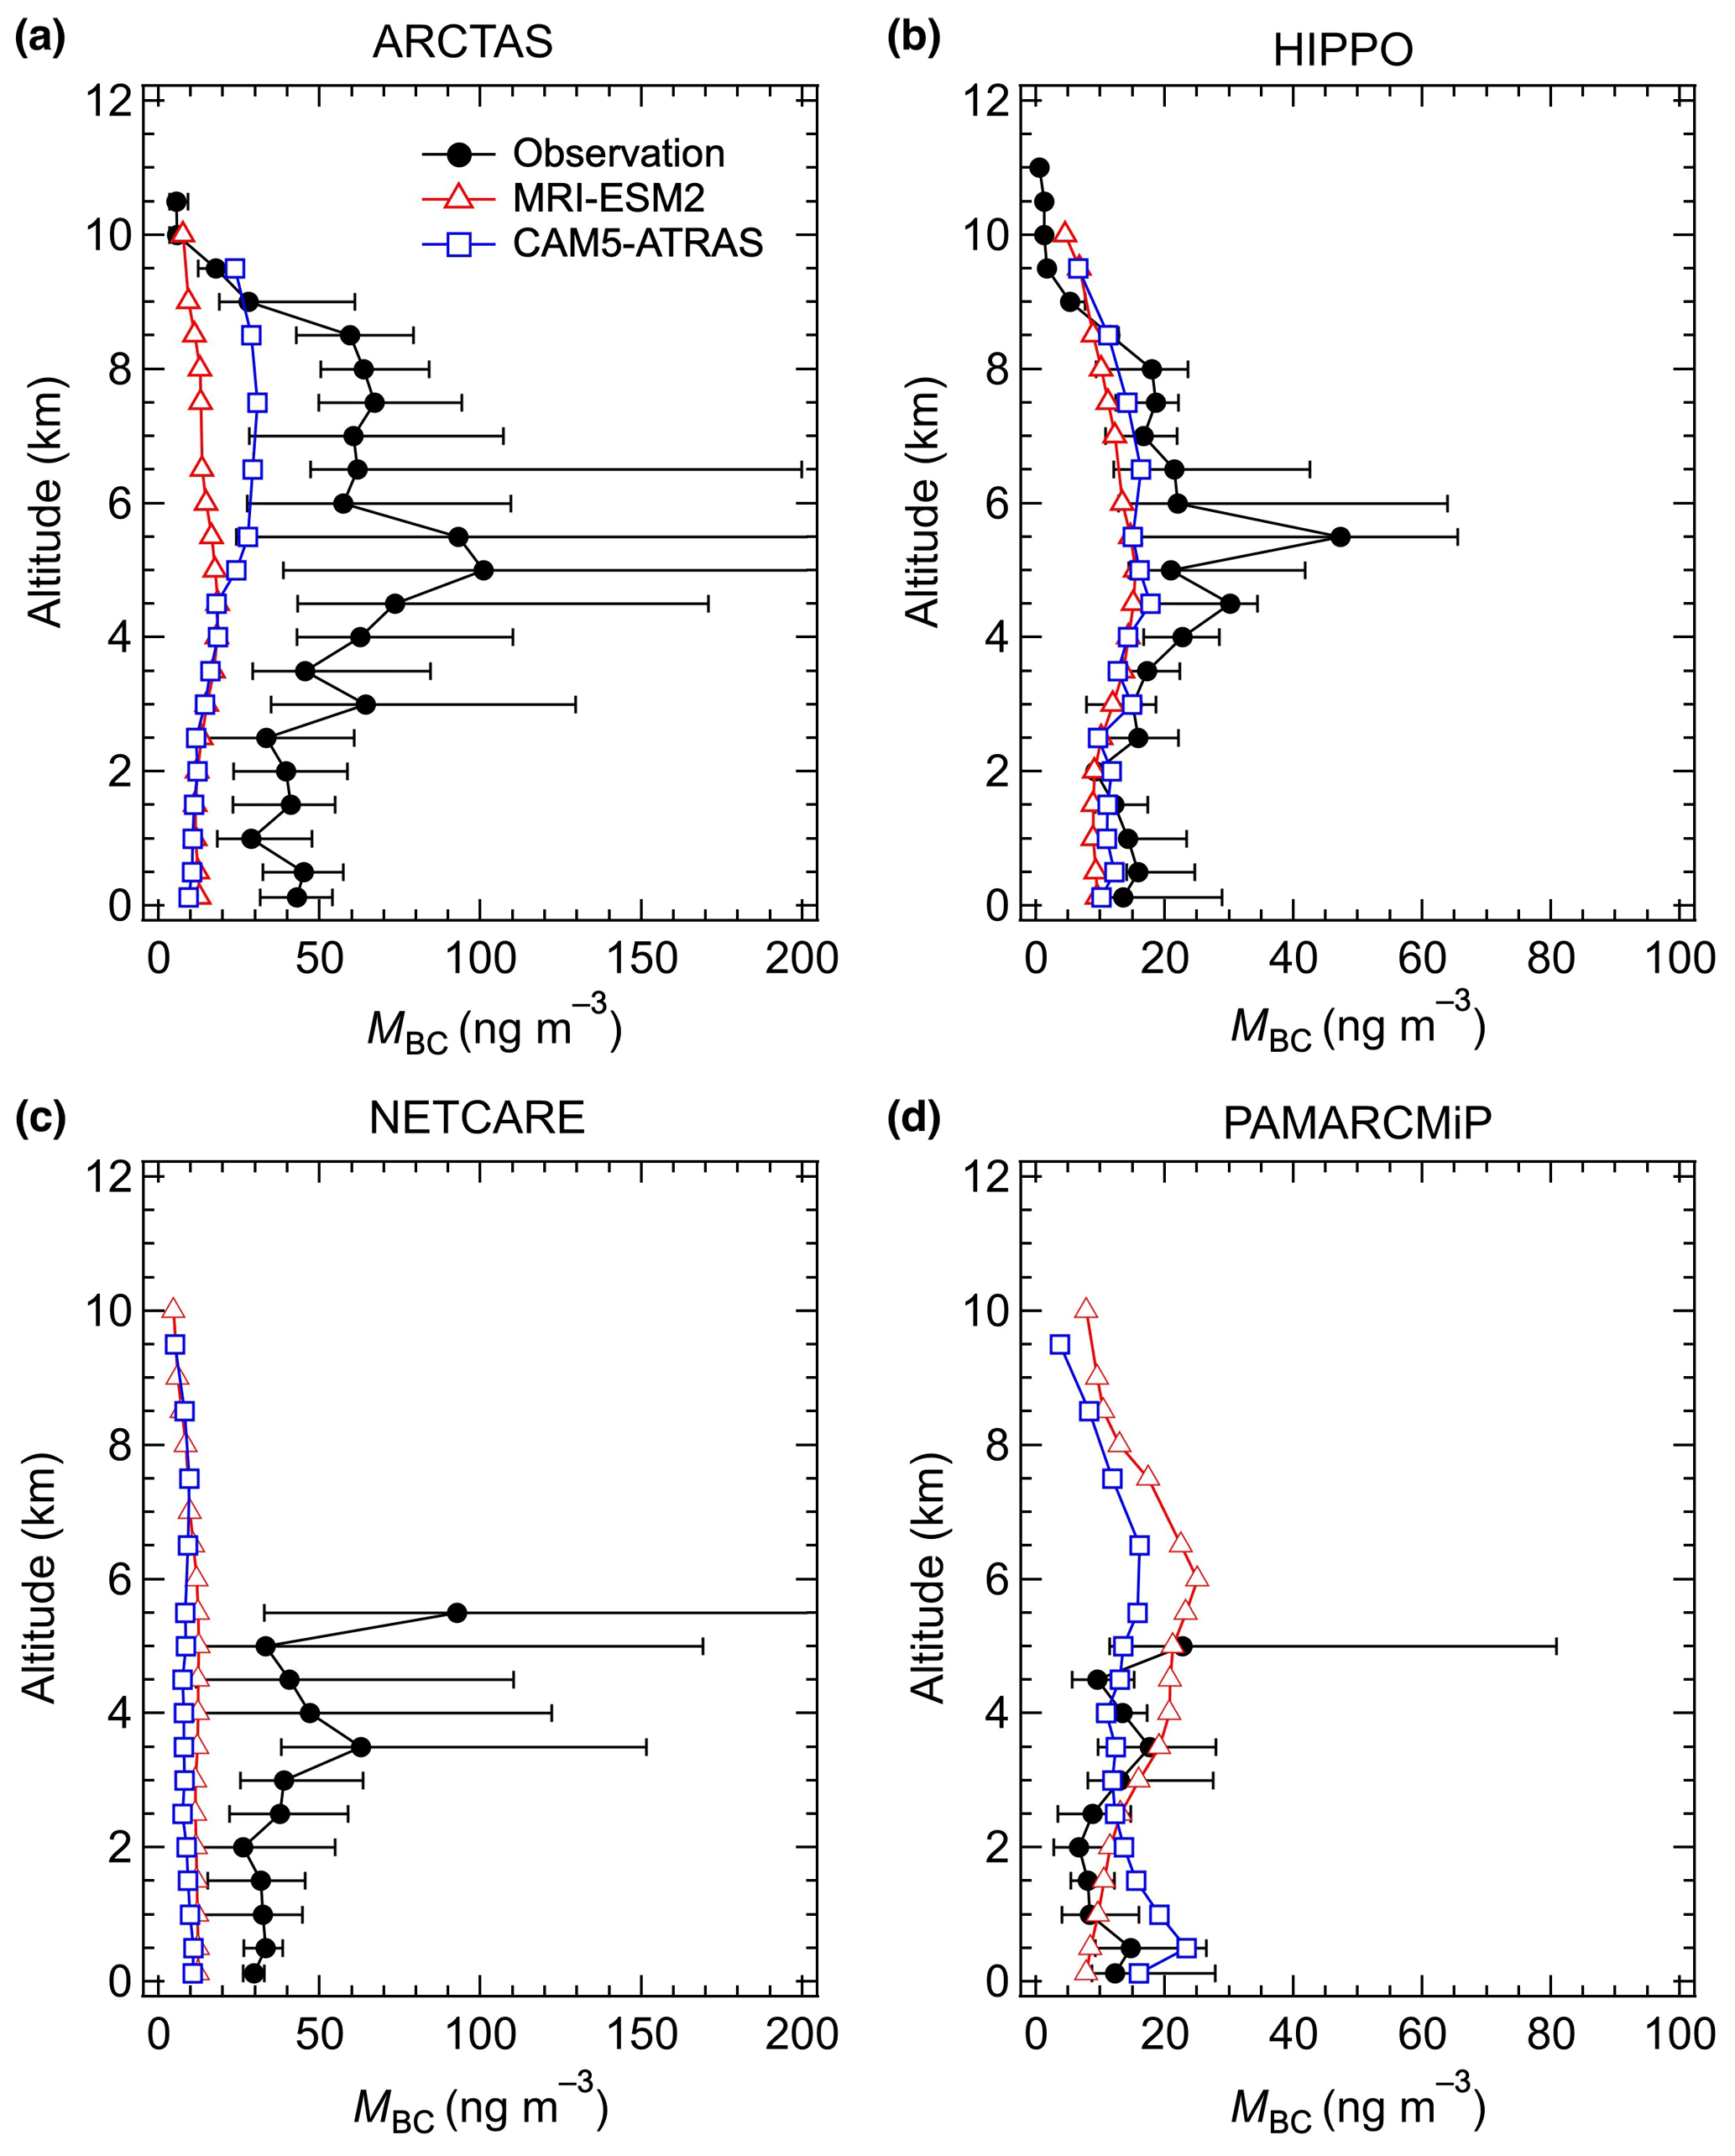
Figure D1Vertical profiles of median BC mass concentration (MBC) values observed during the aircraft-based experiments made over the Arctic (>66.5∘ N) in spring. Bars indicate 25 %–75 % ranges. Model-calculated vertical MBC profiles are derived by calculating area-weighted averages within the latitudes and longitudes and the time periods of the individual aircraft-based experiments.
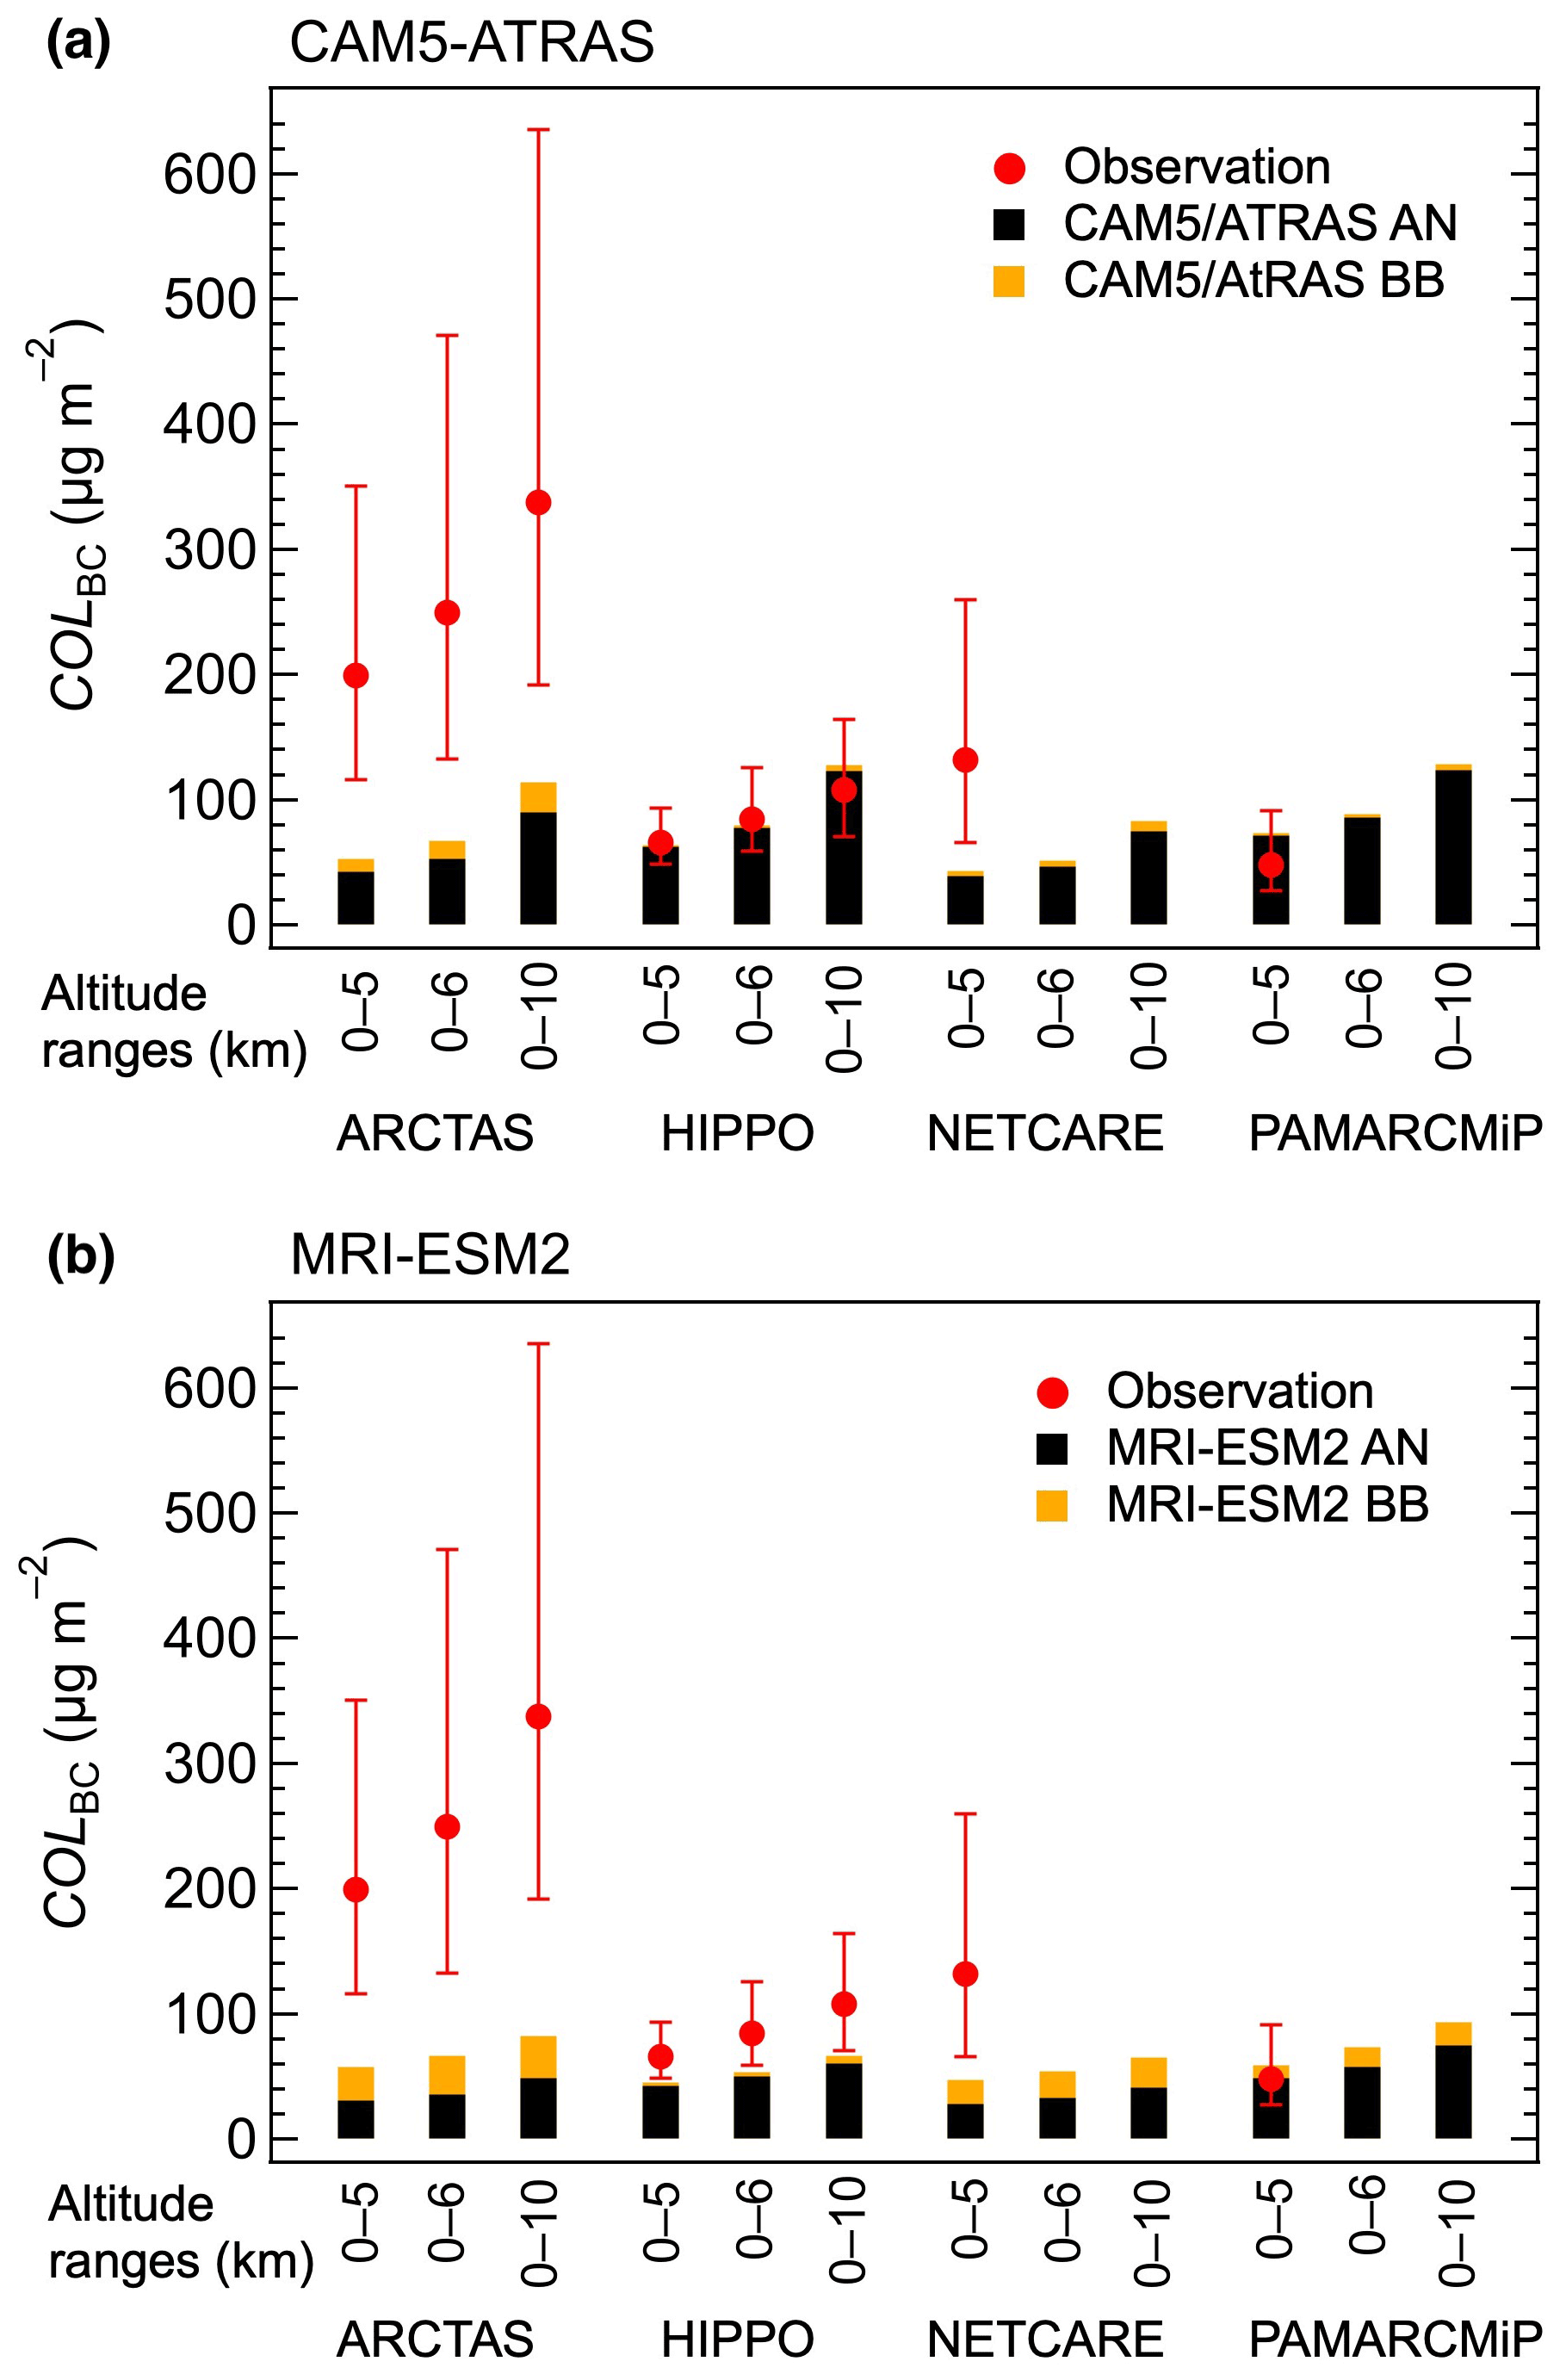
Figure D2Observed column amounts of BC mass concentration for 0–5, 0–6, and 0–10 km altitude ranges at latitudes >66.5∘ N (COLBC, red circles) and model-calculated COLBC values (vertical bars). For calculated values, contributions from anthropogenic (AN) and biomass burning (BB) emissions are shown by black and orange colors, respectively. The model-calculated COLBC values were derived by calculating area-weighted averages within the areas and time periods of the individual aircraft-based experiments. (a) CAM5-ATRAS model simulations. (b) MRI-ESM2 model simulations.
Figure D2 shows comparisons of COLBC values for 0–5, 0–6, and 0–10 km altitude ranges between observations and model calculations ((B) area-weighted averages). Obviously, COLBC values increase with increasing altitude ranges. Relative COLBC values between AN and BB contributions, as well as among the four experiments, are similar when values for different altitude ranges are examined. For example, the observed COLBC values for 0–10 km are higher for ARCTAS than HIPPO by a factor of 3.1, which is similar to the 0–5 km values (a factor of 3.0). The year-to-year variation in model-calculated COLBC values for 0–10 km is much smaller than the observations, and contributions from BB are generally lower than those from AN; these features are also similar to those for COLBC values for 0–5 km described in Sect. 4. These results again indicate that the model underestimations in COLBC values for high BB activity years (ARCTAS and NETCARE) are not due to vertical mismatches of enhanced MBC layers.
A photo taken from the research aircraft POLAR 5 on 3 April 2018 is shown in Fig. E1. A haze layer with reddish color, which may correspond to the plumes, was captured. Although not so apparent as in this photo, dark-colored haze layers were also sighted on 2 and 4 April, when the plumes with enhanced MBC values were observed.
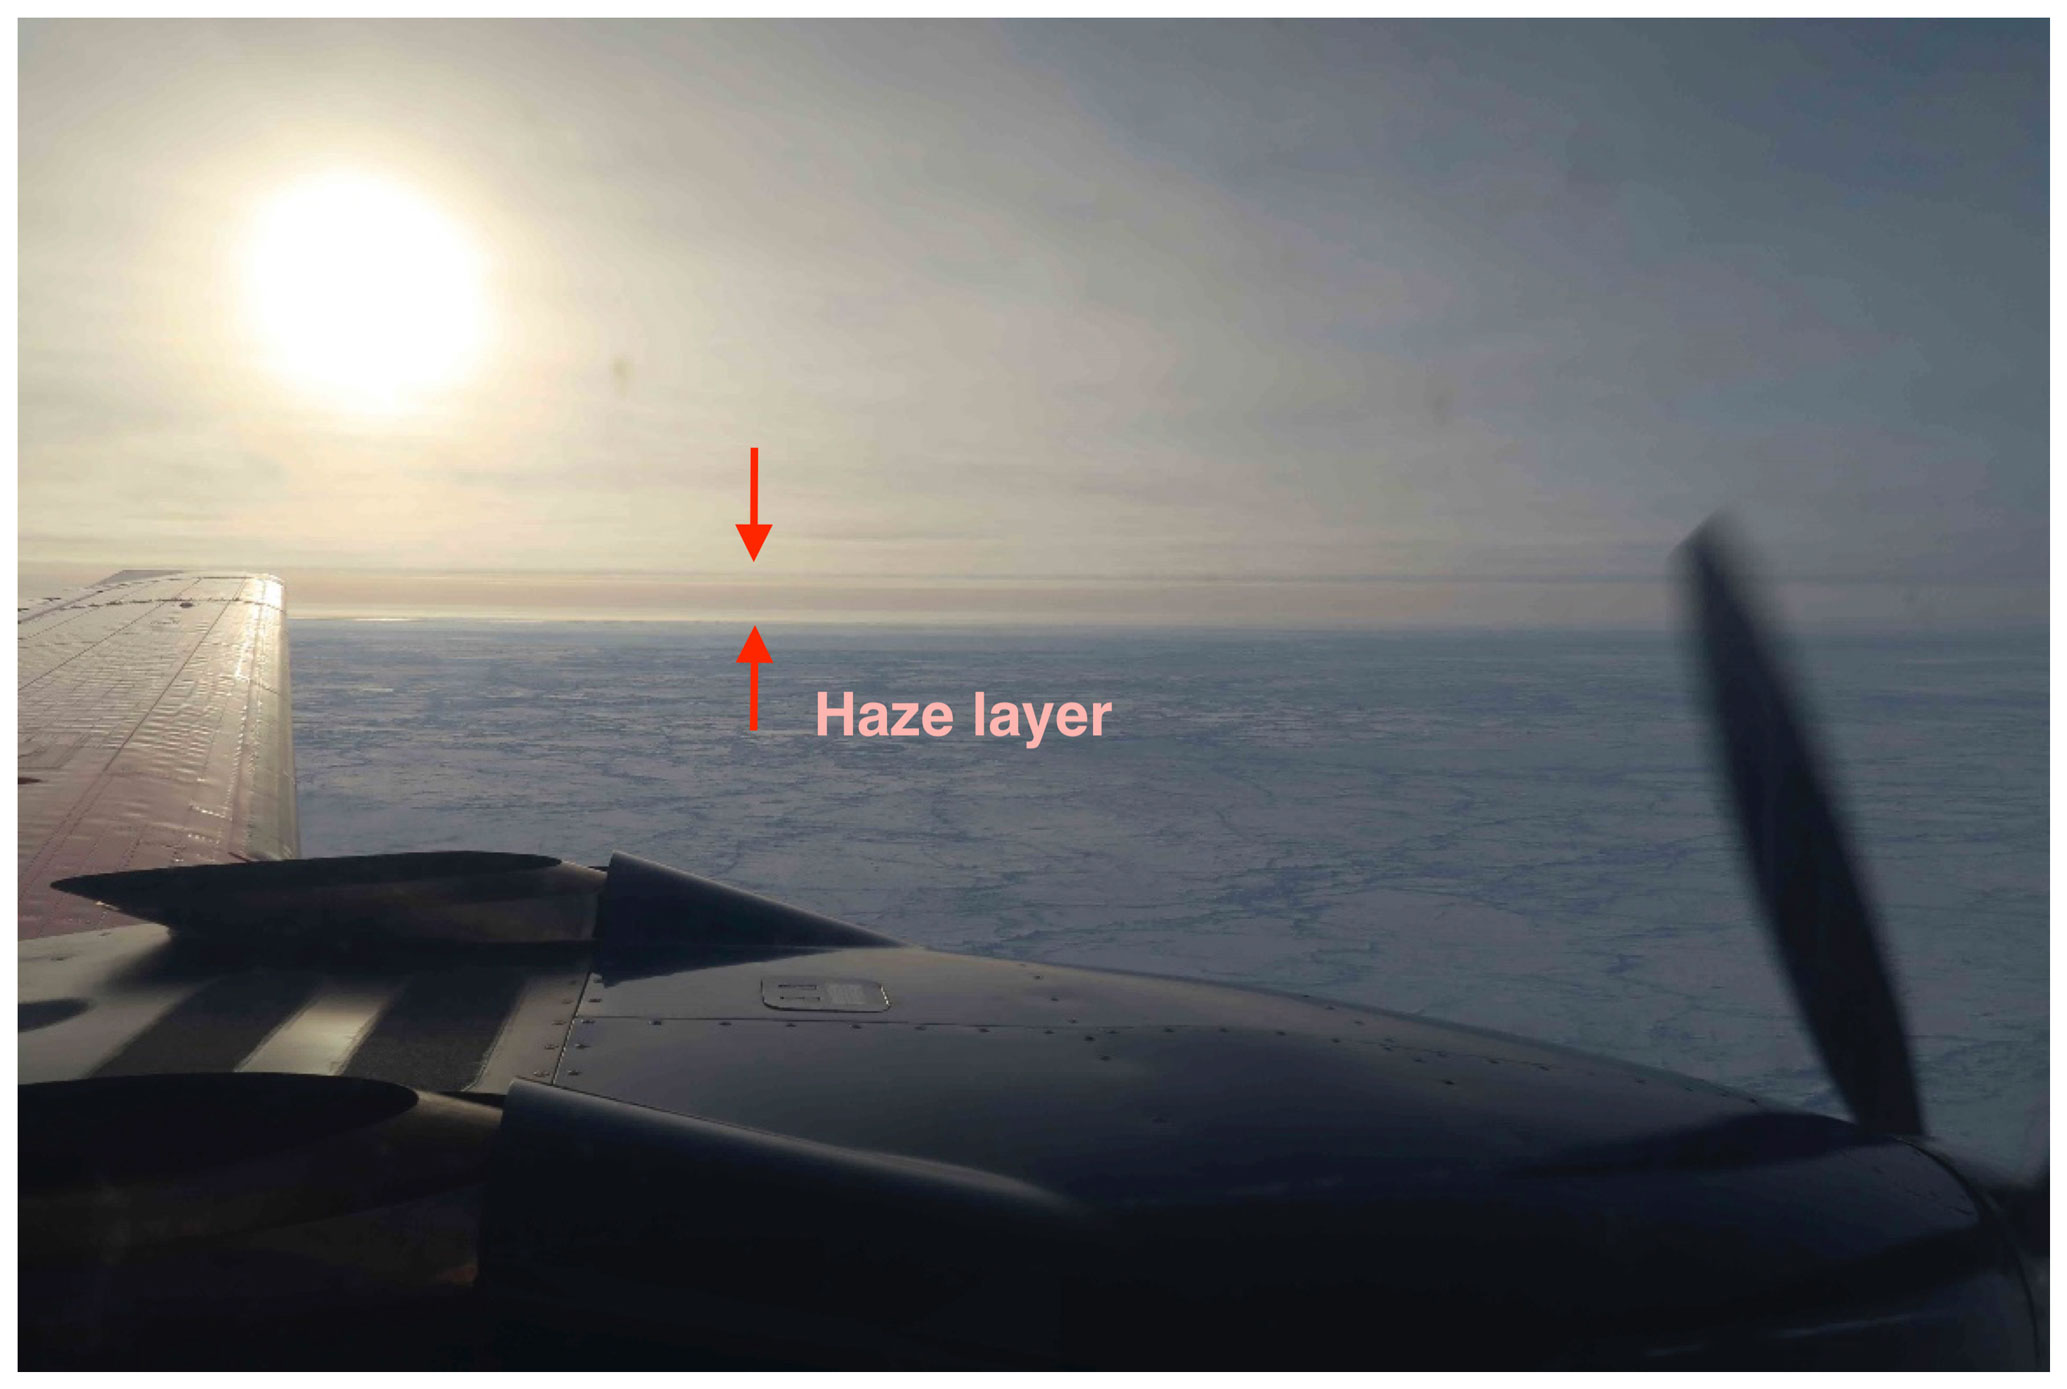
Figure E1Photo taken from the research aircraft POLAR 5 on 3 April 2018. A haze layer with reddish color, which may correspond to the plumes, was captured.
The observational dataset including number and mass concentrations, mass-averaged diameters, and median shell-to-core ratios of black carbon aerosols obtained during the PAMARCMiP 2018 campaign (Ohata et al., 2021b).
The supplement related to this article is available online at: https://doi.org/10.5194/acp-21-15861-2021-supplement.
SO and MK designed the study and wrote the paper. SO, MK, AY, NM, KA, OE, HB, MZ, and ABH contributed to the PAMARCMiP experiments and data analysis of SP2, TEM, and CO and CO2 gas analyzers. NO and HM conducted numerical model simulations using MRI-ESM2 and CAM5-ATRAS, respectively.
The contact author has declared that neither they nor their co-authors have any competing interests.
Publisher’s note: Copernicus Publications remains neutral with regard to jurisdictional claims in published maps and institutional affiliations.
We are indebted to all the PAMARCMiP 2018 participants for their cooperation and support. The authors also acknowledge the Alfred Wegener Institute (AWI) for the support to conduct the PAMARCMiP 2018 campaign, the use of the POLAR 5 research aircraft, and the skill and safety exemplified by the pilots and flight staff. We thank the Atmospheric Chemistry department of the Max Planck Institute for Chemistry for providing the CO instrument and Dieter Scharffe for his support during the preparation phase of the campaign. We thank Yutaka Kondo, Bryan Thomas, Peter Detwiler, Ross Peterson, and the Norwegian Polar Institute for supporting the ground-based COSMOS measurements at Barrow and Ny-Ålesund. We also thank J. Ryan Spackman and Joshua P. Schwarz for making comparison measurements of BC during the ARCTAS and ARCPAC experiments. This research was supported by the Environment Research and Technology Development Fund (JPMEERF20205001, JPMEERF20202003, JPMEERF20172003, and JPMEERF20165005) of the Environmental Restoration and Conservation Agency of Japan, the Global Environmental Research Coordination System of the Ministry of the Environment of Japan (MLIT1753). This study was also supported by the Ministry of Education, Culture, Sports, Science, and Technology and the Japan Society for the Promotion of Science (MEXT/JSPS) KAKENHI grant numbers JP17H04709, JP18H03363, JP18H05292, JP20H00638, and JP21H03582 and the Arctic Challenge for Sustainability (ArCS) project (JPMXD1300000000) and ArCS II (JPMXD1420318865) project of the MEXT of Japan. MK thanks Ikuyo Oshima and Takumi Iwata for their contributions to the data analyses. The trajectory calculation program used in this paper was developed by Yoshihiro Tomikawa of the National Institute of Polar Research and Kaoru Sato of The University of Tokyo, Japan. We acknowledge the use of the MODIS/Aqua+Terra Thermal Anomalies/Fire locations 1km V006 NRT (vector data) distributed by LANCE FIRMS NASA Near Real-Time and MCD14DL MODIS Active Fire Detections (TXT format), which are available online (https://earthdata.nasa.gov/active-fire-data, last access: 19 October 2021). We also gratefully acknowledge the funding by the Deutsche Forschungsgemeinschaft (DFG, German Research Foundation) – project ID 268020496 – TRR 172, within the Transregional Collaborative Research Center “ArctiC Amplification: Climate Relevant Atmospheric and SurfaCe Processes, and Feedback Mechanisms (AC)3”.
This research has been supported by the Environmental Restoration and Conservation Agency (grant nos. JPMEERF20205001, JPMEERF20202003, JPMEERF20172003, and JPMEERF20165005), the Ministry of the Environment, Government of Japan (grant no. MLIT1753), the Ministry of Education, Culture, Sports, Science and Technology (grant nos. JP17H04709, JP18H03363, JP18H05292, JP20H00638, JP21H03582, JPMXD1300000000, and JPMXD1420318865), and the Deutsche Forschungsgemeinschaft (grant no. project number 268020496 TRR 172).
This paper was edited by Radovan Krejci and reviewed by two anonymous referees.
Adachi, K., Oshima, N., Ohata, S., Yoshida, A., Moteki, N., and Koike, M.: Compositions and mixing states of aerosol particles by aircraft observations in the Arctic springtime, 2018, Atmos. Chem. Phys., 21, 3607–3626, https://doi.org/10.5194/acp-21-3607-2021, 2021.
Arctic Monitoring and Assessment Programme (AMAP): AMAP Assessment 2015: Black carbon and ozone as Arctic climate forcers, Oslo, Norway, 1–116, 2015.
Bozem, H., Hoor, P., Kunkel, D., Köllner, F., Schneider, J., Herber, A., Schulz, H., Leaitch, W. R., Aliabadi, A. A., Willis, M. D., Burkart, J., and Abbatt, J. P. D.: Characterization of transport regimes and the polar dome during Arctic spring and summer using in situ aircraft measurements, Atmos. Chem. Phys., 19, 15049–15071, https://doi.org/10.5194/acp-19-15049-2019, 2019.
Brock, C. A., Cozic, J., Bahreini, R., Froyd, K. D., Middlebrook, A. M., McComiskey, A., Brioude, J., Cooper, O. R., Stohl, A., Aikin, K. C., de Gouw, J. A., Fahey, D. W., Ferrare, R. A., Gao, R.-S., Gore, W., Holloway, J. S., Hübler, G., Jefferson, A., Lack, D. A., Lance, S., Moore, R. H., Murphy, D. M., Nenes, A., Novelli, P. C., Nowak, J. B., Ogren, J. A., Peischl, J., Pierce, R. B., Pilewskie, P., Quinn, P. K., Ryerson, T. B., Schmidt, K. S., Schwarz, J. P., Sodemann, H., Spackman, J. R., Stark, H., Thomson, D. S., Thornberry, T., Veres, P., Watts, L. A., Warneke, C., and Wollny, A. G.: Characteristics, sources, and transport of aerosols measured in spring 2008 during the aerosol, radiation, and cloud processes affecting Arctic Climate (ARCPAC) Project, Atmos. Chem. Phys., 11, 2423–2453, https://doi.org/10.5194/acp-11-2423-2011, 2011.
Burba, G. G., McDermitt, D. K., Anderson, D. J., Furtaw, M. D., and Eckles, R.: Novel design of an enclosed CO2/H2O gas analyser for eddy covariance flux measurements, Tellus B, 62, 743–748, https://doi.org/10.1111/j.1600-0889.2010.00468.x, 2010.
Donth, T., Jäkel, E., Ehrlich, A., Heinold, B., Schacht, J., Herber, A., Zanatta, M., and Wendisch, M.: Combining atmospheric and snow radiative transfer models to assess the solar radiative effects of black carbon in the Arctic, Atmos. Chem. Phys., 20, 8139–8156, https://doi.org/10.5194/acp-20-8139-2020, 2020.
Ehrlich, A., Wendisch, M., Lüpkes, C., Buschmann, M., Bozem, H., Chechin, D., Clemen, H. C., Dupuy, R., Eppers, O., Hartmann, J., Herber, A., Jäkel, E., Järvinen, E., Jourdan, O., Kästner, U., Kliesch, L. L., Köllner, F., Mech, M., Mertes, S., Neuber, R., Ruiz-Donoso, E., Schnaiter, M., Schneider, J., Stapf, J., and Zanatta, M.: A comprehensive in situ and remote sensing data set from the Arctic CLoud Observations Using airborne measurements during polar Day (ACLOUD) campaign, Earth Syst. Sci. Data, 11, 1853–1881, https://doi.org/10.5194/essd-11-1853-2019, 2019.
Evangeliou, N., Balkanski, Y., Hao, W. M., Petkov, A., Silverstein, R. P., Corley, R., Nordgren, B. L., Urbanski, S. P., Eckhardt, S., Stohl, A., Tunved, P., Crepinsek, S., Jefferson, A., Sharma, S., Nøjgaard, J. K., and Skov, H.: Wildfires in northern Eurasia affect the budget of black carbon in the Arctic – a 12 year retrospective synopsis (2002–2013), Atmos. Chem. Phys., 16, 7587–7604, https://doi.org/10.5194/acp-16-7587-2016, 2016.
Eyring, V., Bony, S., Meehl, G. A., Senior, C. A., Stevens, B., Stouffer, R. J., and Taylor, K. E.: Overview of the Coupled Model Intercomparison Project Phase 6 (CMIP6) experimental design and organization, Geosci. Model Dev., 9, 1937–1958, https://doi.org/10.5194/gmd-9-1937-2016, 2016.
Flanner, M. G.: Arctic climate sensitivity to local black carbon, J. Geophys. Res.-Atmos., 118, 1840–1851, https://doi.org/10.1002/jgrd.50176, 2013.
Flanner, M. G., Zender, C. S., Randerson, J. T., and Rasch, P. J.: Present-day climate forcing and response from black carbon in snow, J. Geophys. Res.-Atmos., 112, 1–17, https://doi.org/10.1029/2006JD008003, 2007.
Gelaro, R., McCarty, W., Suárez, M. J., Todling, R., Molod, A., Takacs, L., Randles, C. A., Darmenov, A., Bosilovich, M. G., Reichle, R., Wargan, K., Coy, L., Cullather, R., Draper, C., Akella, S., Buchard, V., Conaty, A., da Silva, A. M., Gu, W., Kim, G. K., Koster, R., Lucchesi, R., Merkova, D., Nielsen, J. E., Partyka, G., Pawson, S., Putman, W., Rienecker, M., Schubert, S. D., Sienkiewicz, M., and Zhao, B.: The Modern-Era Retrospective Analysis for Research and Applications, version 2 (MERRA-2), J. Clim., 30, 5419–5454, https://doi.org/10.1175/JCLI-D-16-0758.1, 2017.
Gerbig, C., Schmitgen, S., Kley, D., Volz-Thomas, A., Dewey, K., and Haaks, D.: An improved fast response vacuum–UV resonance fluorescence CO instrument, J. Geophys. Res., 104, 1699–1704, https://doi.org/10.1029/1998JD100031, 1999.
Herber, A., Bozem, H., Hendricks, S., Holzinger, R., Jäkel, E., Koike, M., Neuber, R., Petzold, A., and Stratmann, F.: Raw data of POLAR 5 campaign PAMARCMIP 2018, PANGAEA, https://doi.pangaea.de/10.1594/PANGAEA.899508, 2019.
Herber, A. B., Haas, C., Stone, R. S., Bottenheim, J. W., Liu, P., Li, S.-M., Staebler, R. M., Strapp, J. W., and Dethloff, K.: Regular airborne surveys of Arctic sea ice and atmosphere, Eos, 93, 41–42, https://doi.org/10.1029/2012EO040001, 2012.
Hoesly, R. M., Smith, S. J., Feng, L., Klimont, Z., Janssens-Maenhout, G., Pitkanen, T., Seibert, J. J., Vu, L., Andres, R. J., Bolt, R. M., Bond, T. C., Dawidowski, L., Kholod, N., Kurokawa, J. I., Li, M., Liu, L., Lu, Z., Moura, M. C. P., O'Rourke, P. R., and Zhang, Q.: Historical (1750–2014) anthropogenic emissions of reactive gases and aerosols from the Community Emission Data System (CEDS), Geosci. Model Dev., 11, 369–408, https://doi.org/10.5194/gmd-11-369-2018, 2018.
IPCC: Climate Change 2021: The Physical Science Basis, Contribution of Working Group I to the Sixth Assessment Report of the Intergovernmental Panel on Climate Change, Cambridge Univ. Press, Cambridge, UK, in press, 2021.
Ishii, M., Shouji, A., Sugimoto, S., and Matsumoto, T.: Objective analyses of sea-surface temperature and marine meteorological variables for the 20th century using ICOADS and the Kobe Collection, Int. J. Climatol., 25, 865–879, https://doi.org/10.1002/joc.1169, 2005.
Kaiser, J. W., Heil, A., Andreae, M. O., Benedetti, A., Chubarova, N., Jones, L., Morcrette, J. J., Razinger, M., Schultz, M. G., Suttie, M., and Van Der Werf, G. R.: Biomass burning emissions estimated with a Global Fire Assimilation System based on observed fire radiative power, Biogeosciences, 9, 527–554, https://doi.org/10.5194/bg-9-527-2012, 2012.
Kawai, H., Yukimoto, S., Koshiro, T., Oshima, N., Tanaka, T., Yoshimura, H., and Nagasawa, R.: Significant improvement of cloud representation in the global climate model MRI-ESM 2, Geosci. Model Dev., 12, 2875–2897. https://doi.org/10.5194/gmd-12-2875-2019, 2019.
Kobayashi, S., Ota, Y., Harada, Y., Ebita, A., Moriya, M., Onoda, H., Onogi, K., Kamahori, H., Kobayashi, C., Endo, H., Miyaoka, K., and Kiyotoshi, T.: The JRA-55 reanalysis: General specifications and basic characteristics, J. Meteorol. Soc. Jpn., 93, 5–48, https://doi.org/10.2151/jmsj.2015-001, 2015.
Koch, D. and Hansen, J.: Distant origins of Arctic black carbon: A Goddard Institute for Space Studies Model E experiment, J. Geophys. Res., 110, D04204, https://doi.org/10.1029/2004JD005296, 2005.
Kodros, J. K., Hanna, S. J., Bertram, A. K., Leaitch, W. R., Schulz, H., Herber, A. B., Zanatta, M., Burkart, J., Willis, M. D., Abbatt, J. P. D., and Pierce, J. R.: Size-resolved mixing state of black carbon in the Canadian high Arctic and implications for simulated direct radiative effect, Atmos. Chem. Phys., 18, 11345–11361, https://doi.org/10.5194/acp-18-11345-2018, 2018.
Koike, M., Goto-Azuma, K., Kondo, Y., Matsui, H., Mori, T., Moteki, N., Ohata, S., Okamoto, H., Oshima, N., Sato, K., Takano, T., Tobo, Y., Ukita, J., and Yoshida, A.: Studies on Arctic aerosols and clouds during the ArCS project, Polar Sci., 27, 100621, https://doi.org/10.1016/j.polar.2020.100621, 2021.
Kondo, Y., Sahu, L., Kuwata, M., Miyazaki, Y., Takegawa, N., Moteki, N., Imaru, J., Han, S., Nakayama, T., Oanh, N. T. K., Hu, M., Kim, Y. J., and Kita, K.: Stabilization of the mass absorption cross section of black carbon for filter-based absorption photometry by the use of a heated inlet, Aerosol Sci. Tech., 43, 741–756, https://doi.org/10.1080/02786820902889879, 2009.
Kondo, Y., Matsui, H., Moteki, N., Sahu, L., Takegawa, N., Kajino, M., Zhao, Y., Cubison, M. J., Jimenez, J. L., Vay, S., Diskin, G. S., Anderson, B., Wisthaler, A., Mikoviny, T., Fuelberg, H. E., Blake, D. R., Huey, G., Weinheimer, A. J., Knapp, D. J., and Brune, W. H.: Emissions of black carbon, organic, and inorganic aerosols from biomass burning in North America and Asia in 2008, J. Geophys. Res., 116, D08204, https://doi.org/10.1029/2010JD015152, 2011a.
Kondo, Y., Sahu, L., Moteki, N., Khan, F., Takegawa, N., Liu, X., Koike, M., and Miyakawa, T.: Consistency and traceability of black carbon measurements made by laser-induced incandescence, thermal-optical transmittance, and filter-based photo-absorption techniques, Aerosol Sci. Tech., 45, 295–312, https://doi.org/10.1080/02786826.2010.533215, 2011b.
Lamarque, J.-F., Bond, T. C., Eyring, V., Granier, C., Heil, A., Klimont, Z., Lee, D., Liousse, C., Mieville, A., Owen, B., Schultz, M. G., Shindell, D., Smith, S. J., Stehfest, E., Van Aardenne, J., Cooper, O. R., Kainuma, M., Mahowald, N., McConnell, J. R., Naik, V., Riahi, K., and Van Vuuren, D. P.: Historical (1850–2000) gridded anthropogenic and biomass burning emissions of reactive gases and aerosols: Methodology and application, Atmos. Chem. Phys., 10, 7017–7039, https://doi.org/10.5194/acp-10-7017-2010, 2010.
Lampert, A., Hartmann, J., Pätzold, F., Lobitz, L., Hecker, P., Kohnert, K., Larmanou, E., Serafimovich, A., and Sachs, T.: Comparison of Lyman-alpha and LI-COR infrared hygrometers for airborne measurement of turbulent fluctuations of water vapour, Atmos. Meas. Tech., 11, 2523–2536, https://doi.org/10.5194/amt-11-2523-2018, 2018.
Matsui, H.: Development of a global aerosol model using a two-dimensional sectional method: 1. Model design, J. Adv. Model. Earth Sy., 9, 1921–1947, https://doi.org/10.1002/2017MS000936, 2017.
Matsui, H. and Liu, M.: Importance of supersaturation in Arctic black carbon simulations, J. Clim., 34, 7843–7856, https://doi.org/10.1175/JCLI-D-20-0994.1, 2021.
Matsui, H. and Mahowald, N.: Development of a global aerosol model using a two-dimensional sectional method: 2, Evaluation and sensitivity simulations, J. Adv. Model. Earth Sy., 9, 1887–1920, https://doi.org/10.1002/2017MS000937, 2017.
Matsui, H., Kondo, Y., Moteki, N., Takegawa, N., Sahu, L. K., Zhao, Y., Fuelberg, H. E., Sessions, W. R., Diskin, G., Blake, D. R., Wisthaler, A., and Koike, M.: Seasonal variation of the transport of black carbon aerosol from the Asian continent to the Arctic during the ARCTAS aircraft campaign, J. Geophys. Res., 116, D05202 https://doi.org/10.1029/2010JD015067, 2011.
Matsui, H., Hamilton, D. S., and Mahowald, N. M.: Black carbon radiative effects highly sensitive to emitted particle size when resolving mixing-state diversity, Nat. Commun., 9, 3446, https://doi.org/10.1038/s41467-018-05635-1, 2018.
Miyazaki, Y., Kondo, Y., Sahu, L. K., Imaru, J., Fukushima, N., and Kanno, A.: Performance of a Newly Designed Continuous Soot Monitoring System (COSMOS), J. Environ. Monitor., 10, 1195–1201, 2008.
Mori, T., Kondo, Y., Ohata, S., Zhao, Y., Sinha, P. R., and Oshima, N., Matsui, H., Moteki, N., and Koike, M.: Seasonal variation of wet deposition of black carbon in Arctic Alaska, J. Geophys. Res.-Atmos., 125, e2019JD032240, https://doi.org/10.1029/2019JD032240, 2020.
Moteki, N. and Kondo, Y.: Dependence of laser-induced incandescence on physical properties of black carbon aerosols: Measurements and theoretical interpretation, Aerosol Sci. Tech., 44, 663–675, https://doi.org/10.1080/02786826.2010.484450, 2010.
Moteki, N., Kondo, Y., Oshima, N., Takegawa, N., Koike, M., Kita, K., Matsui, H., and Kajino, M.: Size dependence of wet removal of black carbon aerosols during transport from the boundary layer to the free troposphere, Geophys. Res. Lett., 39, L13802, https://doi.org/10.1029/2012GL052034, 2012.
Moteki, N., Mori, T., Matsui, H., and Ohata, S.: Observational constraint of in-cloud supersaturation for simulations of aerosol rainout in atmospheric models, npj Clim. Atmos. Sci., 2, 6, https://doi.org/10.1038/s41612-019-0063-y, 2019.
Nakoudi, K., Ritter, C., Böckmann, C., Kunkel, D., Eppers, O., Rozanov, V., Mei, L., Pefanis, V., Jäkel, E., Herber, A., Maturilli, M., and Neuber, R.: Does the intra-arctic modification of long-range transported aerosol affect the local radiative budget? (A case study), Remote Sens., 12, 2112, https://doi.org/10.3390/rs12132112, 2020.
Ogren, J. A., Wendell, J., Andrews, E., and Sheridan, P. J.: Continuous light absorption photometer for long-term studies, Atmos. Meas. Tech., 10, 4805–4818, https://doi.org/10.5194/amt-10-4805-2017, 2017.
Ohata, S., Moteki, N. Mori, T., Koike, M., and Kondo, Y.: A key process controlling the wet removal of aerosols: new observational evidence, Sci. Rep., 6, 34113, https://doi.org/10.1038/srep34113, 2016.
Ohata, S., Kondo, Y., Moteki, N., Mori, T., Yoshida, A., Sinha, P. R., and Koike, M.: Accuracy of black carbon measurements by a filter-based absorption photometer with a heated inlet, Aerosol Sci. Tech., 53, 1079–1091, https://doi.org/10.1080/02786826.2019.1627283, 2019.
Ohata, S., Mori, T., Kondo, Y., Sharma, S., Hyvärinen, A., Andrews, E., Tunved, P., Asmi, E., Backman, J., Servomaa, H., Veber, D., Eleftheriadis, K., Vratolis, S., Krejci, R., Ziieegeer, P., Koike, M., Kanaya, Y., Yoshida, A., Moteki, N., Zhao, Y., Tobo, Y., Matsushita, J., and Oshima, N.: Estimates of mass absorption cross sections of black carbon for filter-based absorption photometers in the Arctic, Atmos. Meas. Tech., in press, 2021a.
Ohata, S., Yoshida, A., Moteki, N., and Koike, M.: Number concentrations, mass concentrations, mass-averaged diameters, and median shell-to-core ratios of black carbon aerosols obtained by aircraft measurements during the PAMARCMiP 2018, 1.01, Arctic Data archive System (ADS), Japan [data set], https://doi.org/10.17592/001.2019121712, 2021b.
Oshima, N., Kondo, Y., Moteki, N., Takegawa, N., Koike, M., Kita, K., Matsui, H., Kajino, M., Nakamura, H., Jung, J. S., and Kim, Y. J.: Wet removal of black carbon in Asian outflow: Aerosol Radiative Forcing in East Asia (A-FORCE) aircraft campaign, J. Geophys. Res., 117, D03204, https://doi.org/10.1029/2011JD016552, 2012.
Oshima, N., Koike, M., Kondo, Y., Nakamura, H., Moteki, N., Matsui, H., Takegawa, N., and Kita, K.: Vertical transport mechanisms of black carbon over East Asia in spring during the A-FORCE aircraft campaign, J. Geophys. Res.-Atmos., 118, 13175–13198, https://doi.org/10.1002/2013JD020262, 2013.
Oshima, N., Yukimoto, S., Deushi, M., Koshiro, T., Kawai, H., Tanaka, T. Y., and Yoshida, K.: Global and Arctic effective radiative forcing of anthropogenic gases and aerosols in MRI-ESM 2.0, Prog. Earth Planet. Sci., 7, 38, https://doi.org/10.1186/s40645-020-00348-w, 2020.
Park, R. J., Jacob, D. J., Palmer, P. I., Clarke, A. D., Weber, R. J., Zondlo, M. A., Eisele, F. L., Bandy, A. R., Thornton, D. C., Sachse, G. W., and Bond, T. C.: Export efficiency of black carbon aerosol in continental outflow: Global implications, J. Geophys. Res., 110, D11205, https://doi.org/10.1029/2004JD005432, 2005.
Raut, J. C., Marelle, L., Fast, J. D., Thomas, J. L., Weinzierl, B., Law, K. S., Berg, L. K., Roiger, A., Easter, R. C., Heimerl, K., Onishi, T., Delanoë, J., and Schlager, H.: Cross-polar transport and scavenging of Siberian aerosols containing black carbon during the 2012 ACCESS summer campaign, Atmos. Chem. Phys., 17, 10969–10995, https://doi.org/10.5194/acp-17-10969-2017, 2017.
Sahu, L. K., Kondo, Y., Moteki, N., Takegawa, N., Zhao, Y., Cubison, M. J., Jimenez, J. L., Vay, S., Diskin, G. S., Wisthaler, A., Mikoviny, T., Huey, L. G., Weinheimer, A. J., and Knapp, D. J.: Emission characteristics of black carbon in anthropogenic and biomass burning plumes over California during ARCTAS-CARB 2008, J. Geophys. Res.-Atmos., 117, 1–20, https://https://doi.org/10.1029/2011JD017401, 2012.
Samset, B. H., Myhre, G., Schulz, M., Balkanski, Y., Bauer, S., Berntsen, T. K., Bian, H., Bellouin, N., Diehl, T., Easter, R. C., Ghan, S. J., Iversen, T., Kinne, S., Kirkevåg, A., Lamarque, J.-F., Lin, G., Liu, X., Penner, J. E., Seland, Ø., Skeie, R. B., Stier, P., Takemura, T., Tsigaridis, K., and Zhang, K.: Black carbon vertical profiles strongly affect its radiative forcing uncertainty, Atmos. Chem. Phys., 13, 2423–2434, https://doi.org/10.5194/acp-13-2423-2013, 2013.
Scharffe, D., Slemr, F., Brenninkmeijer, C. A. M., and Zahn, A.: Carbon monoxide measurements onboard the CARIBIC passenger aircraft using UV resonance fluorescence, Atmos. Meas. Tech., 5, 1753–1760, https://doi.org/10.5194/amt-5-1753-2012, 2012.
Schulz, H., Zanatta, M., Bozem, H., Leaitch, W. R., Herber, A. B., Burkart, J., Willis, M. D., Kunkel, D., Hoor, P. M., Abbatt, J. P. D., and Gerdes, R.: High Arctic aircraft measurements characterising black carbon vertical variability in spring and summer, Atmos. Chem. Phys., 19, 2361–2384, https://doi.org/10.5194/acp-19-2361-2019, 2019.
Schwarz, J. P., Spackman, J. R., Gao, R. S., Watts, L. A., Stier, P., Schulz, M., Davis, S. M., Wofsy, S. C., and Fahey, D. W.: Global-scale black carbon profiles observed in the remote atmosphere and compared to models, Geophys. Res. Lett., 37, L18812, https://doi.org/10.1029/2010GL044372, 2010.
Schwarz, J. P., Samset, B. H., Perring, A. E., Spackman, J. R., Gao, R. S., Stier, P., Schulz, M., Moore, F. L., Ray, E. A., and Fahey, D. W.: Global-scale seasonally resolved black carbon vertical profiles over the Pacific, Geophys. Res. Lett., 40, 5542–5547, https://doi.org/10.1002/2013GL057775, 2013.
Serreze, M. C. and Barry, R. G.: Processes and impacts of Arctic amplification: A research synthesis, Glob. Planet. Change, 77, 85–96, https://doi.org/10.1016/j.gloplacha.2011.03.004, 2011.
Shindell, D. T., Chin, M., Dentener, F., Doherty, R. M., Faluvegi, G., Fiore, A. M., Hess, P., Koch, D. M., MacKenzie, I. A., Sanderson, M. G., Schultz, M. G., Schulz, M., Stevenson, D. S., Teich, H., Textor, C., Wild, O., Bergmann, D. J., Bey, I., Bian, H., Cuvelier, C., Duncan, B. N., Folberth, G., Horowitz, L.W., Jonson, J., Kaminski, J. W., Marmer, E., Park, R., Pringle, K. J., Schroeder, S., Szopa, S., Takemura, T., Zeng, G., Keating, T. J., and Zuber, A.: A multi-model assessment of pollution transport to the Arctic, Atmos. Chem. Phys., 8, 5353–5372, https://doi.org/10.5194/acp-8-5353-2008, 2008.
Sinha, P. R., Kondo, Y., Koike, M., Ogren, J. A., Jefferson, A., Barrett, T. E., Sheesley, R. J., Ohata, S., Moteki, N., Coe, H., Liu, D., Irwin, M., Tunved, P., Quinn, P. K., and Zhao, Y.: Evaluation of ground-based black carbon measurements by filter-based photometers at two Arctic sites, J. Geophys. Res.-Atmos., 122, 3544–3572, https://doi.org/10.1002/2016JD025843, 2017.
Spackman, J. R., Gao, R. S., Neff, W. D., Schwarz, J. P., Watts, L. A., Fahey, D. W., Holloway, J. S., Ryerson, T. B., Peischl, J., and Brock, C. A.: Aircraft observations of enhancement and depletion of black carbon mass in the springtime Arctic, Atmos. Chem. Phys., 10, 9667–9680, https://doi.org/10.5194/acp-10-9667-2010, 2010.
Stohl, A., Klimont, Z., Eckhardt, S., Kupiainen, K., Shevchenko, V. P., Kopeikin, V. M., and Novigatsky, A. N.: Black carbon in the Arctic: the underestimated role of gas flaring and residential combustion emissions, Atmos. Chem. Phys., 13, 8833–8855, https://doi.org/10.5194/acp-13-8833-2013, 2013.
Stone, R. S., Herber, A., Vitale, V., Mazzola, M., Lupi, A., Schnell, R. C., Dutton, E. G., Liu, P. S. K., Li, S. M., Dethloff, K., Lampert, A., Ritter, C., Stock, M., Neuber, R., and Maturilli, M.: A three-dimensional characterization of Arctic aerosols from airborne Sun photometer observations: PAM-ARCMIP, April 2009, J. Geophys. Res., 115, D13203, https://doi.org/10.1029/2009JD013605, 2010.
Tomikawa, Y. and Sato, K.: Design of the NIPR trajectory model, Polar Meteorol. Glaciol., 19, 120–137, 2005.
Tuzet, F., Dumont, M., Lafaysse, M., Picard, G., Arnaud, L., Voisin, D., Lejeune, Y., Charrois, L., Nabat, P., and Morin, S.: A multilayer physically based snowpack model simulating direct and indirect radiative impacts of light-absorbing impurities in snow, The Cryosphere, 11, 2633–2653, https://doi.org/10.5194/tc-11-2633-2017, 2017.
van der Werf, G. R., Randerson, J. T., Giglio, L., van Leeuwen, T. T., Chan, Y., Rogers, B. M., Mu, M., Van Marle, M. J. E., Morton, D. C., Collatz, G. J., Yokelson, R. J., and Kasibhatla, P. S.: Global fire emissions estimates during 1997–2016, Earth Syst. Sci. Data, 9, 697–720, https://doi.org/10.5194/essd-9-697-2017, 2017.
Wang, Q., Jacob, D. J., Fisher, J. A., Mao, J., Leibensperger, E. M., Carouge, C. C., Le Sager, P., Kondo, Y., Jimenez, J. L., Cubison, M. J., and Doherty, S. J.: Sources of carbonaceous aerosols and deposited black carbon in the Arctic in winter-spring: implications for radiative forcing, Atmos. Chem. Phys., 11, 12453–12473, https://doi.org/10.5194/acp-11-12453-2011, 2011.
Warneke, C., Bahreini, R., Brioude, J., Brock, C. A., de Gouw, J. A., Fahey, D. W., Froyd, K. D., Holloway, J. S., Middlebrook, A., Miller, L., Montzka, S., Murphy, D. M., Peischl, J., Ryerson, T. B., Schwarz, J. P., Spackman, J. R., and Veres, P.: Biomass burning in Siberia and Kazakhstan as an important source for haze over the Alaskan Arctic in April 2008, Geophys. Res. Lett., 36, L02813, https://doi.org/10.1029/2008GL036194, 2009.
Wendisch, M., Brückner, M., Burrows, J. P., Crewell, S., Dethloff, K., Ebell, K., Lüpkes, C., Macke, A., Notholt, J., Quass, J., Rinke, A., and Tegen, I.: Understanding causes and effects of rapid warming in the Arctic, EOS, 98, 22–26, https://doi.org/10.1029/2017EO064803, 2017.
Wesche, C., Steinhage, D., and Nixdorf, U.: Polar aircraft Polar 5 and Polar 6 operated by the Alfred Wegener Institute, J. Large-Scale Res. Facil., 2, A87, https://doi.org/10.17815/jlsrf-2-153, 2016.
Xu, J.-W., Martin, R. V., Morrow, A., Sharma, S., Huang, L., Leaitch, W. R., Burkart, J., Schulz, H., Zanatta, M., Willis, M. D., Henze, D. K., Lee, C. J., Herber, A. B., and Abbatt, J. P. D.: Source attribution of Arctic black carbon constrained by aircraft and surface measurements, Atmos. Chem. Phys., 17, 11971–11989, https://doi.org/10.5194/acp-17-11971-2017, 2017.
Yoshida, A., Moteki, N., Ohata, S., Mori, T., Koike, M., Kondo, Y., Matsui, H., Oshima, N., Takami, A., and Kita, K.: Abundances and microphysical properties of light-absorbing iron oxide and black carbon aerosols over East Asia and the Arctic, J. Geophys. Res.-Atmos., 125, e2019JD032301, https://doi.org/10.1029/2019JD032301, 2020.
Yukimoto, S., Kawai, H., Koshiro, T., Oshima, N., Yoshida, K., Urakawa, S., Tsujino, H., Deushi, M., Tanaka, T., Hosaka, M., Yabu, S., Yoshimura, H., Shindo, E., Mizuta, R., Obata, A., Adachi, Y., and Ishii, M.: The Meteorological Research Institute Earth System Model version 2.0, MRI–ESM 2.0: Description and basic evaluation of the physical component, J. Meteorol. Soc. Jpn., 97, 931–965, https://doi.org/10.2151/jmsj.2019-051, 2019.
- Abstract
- Introduction
- Measurement
- Numerical model simulations
- Year-to-year variation in BC and influences from BB
- Case study of BB BC transport
- Summary
- Appendix A: Comparison between The University of Tokyo and NOAA SP2 measurements
- Appendix B: Back trajectories of sampled air
- Appendix C: Time series of fire counts
- Appendix D: Evaluation of model-calculated vertical MBC profiles
- Appendix E: Photo taken from POLAR 5
- Data availability
- Author contributions
- Competing interests
- Disclaimer
- Acknowledgements
- Financial support
- Review statement
- References
- Supplement