the Creative Commons Attribution 4.0 License.
the Creative Commons Attribution 4.0 License.
 | 25 Oct 2021
Speciated atmospheric mercury at the Waliguan Global Atmosphere Watch station in the northeastern Tibetan Plateau: implication of dust-related sources for particulate bound mercury
Hui Zhang
Baoxin Li
Peng Liu
Guoqing Zhang
Leiming Zhang
To understand the ambient levels and sources of atmospheric mercury (Hg) in the Tibetan Plateau, a full-year continuous measurement of speciated atmospheric mercury was conducted at the Waliguan (WLG) Baseline Observatory (3816 m a.s.l.) from May 2012 to April 2013. Mean concentrations (± 1 SD) of gaseous elemental mercury (GEM), gaseous oxidized mercury (GOM) and particulate bound mercury (PBM) during the whole study period were 1.90±0.80 ng m−3, 12.0±10.6 and 65.4±63.2 pg m−3, respectively. Seasonal variations of GEM were very small, while those of PBM were quite large with mean values being 4 times higher in the cold (102.3±66.7 pg m−3) than warm (22.8±14.6 pg m−3) season. Anthropogenic emissions to the east of the Tibetan Plateau contributed significantly to GEM pollution at WLG, while dust particles originating from desert and Gobi regions in Xinjiang province and the Tibetan Plateau to the west of WLG were responsible for PBM pollution at WLG. This finding is also supported by the significant positive correlation between daily PBM concentration and daily cumulative absorbing aerosol index (AAI) in air masses transported during the preceding 2 d.
- Article
(6789 KB) - Full-text XML
-
Supplement
(1069 KB) - BibTeX
- EndNote


Mercury (Hg) is a toxic pollutant of global concern due to its long lifetime in air, bioaccumulation in aquatic systems, and detrimental impacts on human and animal health. Atmospheric Hg is operationally defined in three forms, i.e., gaseous elemental mercury (GEM), gaseous oxidized mercury (GOM) and particulate bound mercury (PBM). These Hg species can be transformed among each other through complex physical and chemical processes (Selin, 2009; Lyman et al., 2020). For example, GEM can be oxidized to form GOM, and GEM and/or GOM can adsorb on atmospheric aerosols to form PBM (Ariya et al., 2015). GEM has a lifetime in air of 0.5–2 years, while GOM and PBM only have a lifetime of hours to weeks (Ariya et al., 2015; Murphy et al., 2006). Because of their different lifetimes, GEM can be transported globally via atmospheric circulation, whereas PBM is limited to regional transport (Pirrone et al., 2010). These Hg species can be removed from the atmosphere through dry and wet deposition processes. Once deposited to earth's surface, Hg can be converted to methylmercury by biological processes, which can cause potential risks to ecological and human health (Jonsson et al., 2014; Wright et al., 2018). On the other hand, Hg accumulated in soil and water bodies can be emitted into the atmosphere, which plays an important role in the global atmospheric Hg cycle (Obrist et al., 2018; Wang et al., 2016).
Spatiotemporal variations of atmospheric Hg and Hg speciation fractions within the total Hg are controlled by many factors, among which anthropogenic emissions are important ones (X. Fu et al., 2012; Driscoll et al., 2013). Global anthropogenic Hg emissions to the atmosphere were estimated to be 2224 Mg yr−1, of which 82 %–87 %, 10 %–18 % and 3 %–4 % were in the form of GEM, GOM and PBM, respectively (AMAP/UNEP, 2018). In China, concentrations of GEM and PBM were generally elevated compared to the observations in Europe and America. The fractions of PBM in total atmospheric Hg in urban areas of China were in the range of 5.2 %–17.2 %, higher than those from total anthropogenic Hg emissions (L. Zhang et al., 2015; Fu et al., 2015). In addition, observations of speciated atmospheric Hg in both urban and rural areas of China showed generally higher PBM than GOM levels (Fu et al., 2015), which is in contrast with the higher GOM than PBM fractions in the total anthropogenic Hg emissions in China (L. Zhang et al., 2015). These findings indicate that additional emission sources and other physical and chemical processes contributed to the elevated PBM concentrations in China. For example, natural sources, such as biomass burning and dust-related sources, and gas–particle partitioning can also produce PBM (Obrist et al., 2008; Amos et al., 2012). The impact of these sources and processes on atmospheric PBM, although potentially important, has not been well investigated by previous studies.
Speciated atmospheric Hg has been monitored in China in recent years, but observations in the Tibetan Plateau region are very limited. The Tibetan Plateau, also known as the third pole of the world with an average altitude of over 4000 m a.s.l., is an ideal place for assessing transport and transformation of atmospheric pollutants in China and other Asian regions (Loewen et al., 2007; Chen et al., 2019). The Tibetan Plateau is surrounded by East Asia and South Asia, which are the two most important source regions of atmospheric Hg in the world (Zhao et al., 2013). The Taklimakan and Gobi deserts are located to the west and north, respectively, of the Tibetan Plateau. Since the Tibetan Plateau region is strongly impacted by westerlies, Indian summer monsoon and East Asian summer monsoon (Fig. 1), it is affected by air pollutants from anthropogenic and natural source regions adjacent to the Tibetan Plateau (Che et al., 2011). Previous studies postulated that air masses passing over the urban and industrial areas in western China and South Asia were important sources of atmospheric GEM at Waliguan and Nam Co (4730 m a.s.l.) on the northeastern edge and Midlands of the Tibetan Plateau, respectively (X. W. Fu et al., 2012; Yin et al., 2018). At Shangri-La, located on the southeastern edge of the Tibetan Plateau, the identified atmospheric GEM source regions were also located in Southeast Asia and mainland China (H. Zhang et al., 2015). Speciated atmospheric Hg measurement was only carried out during a warm season in the Qomolangma National Nature Preserve (4276 m a.s.l.) of the Tibetan Plateau (Lin et al., 2019). Low GEM concentrations (range: 1.33 to 1.42 ng m−3) but elevated PBM concentrations (range: 25.6 to 49.0 pg m−3) were observed in middle and southern Tibetan Plateau as compared to those in rural central and eastern China (Yin et al., 2018; Lin et al., 2019). To date, long-term observations of speciated atmospheric Hg in the Tibetan Plateau region are still lacking, limiting our capacity to fully understand the spatiotemporal patterns of Hg in this region and associated source regions and controlling factors.

Figure 1Map showing the location of WLG and distribution of the deserts and cities around WLG.
In this study, 1-year continuous monitoring of speciated atmospheric Hg was carried out at WLG in the Tibetan Plateau region. Data were analyzed carefully for exploring the ambient levels, seasonal and diurnal patterns, and source regions of speciated atmospheric Hg in this region. Knowledge generated from this study is needed for establishing future emission control policies in order to preserve many sensitive ecosystems in this region.
2.1 Measurement site
The measurement site is situated at the summit of Mt. Waliguan located at northeastern edge of the Tibetan Plateau in northwest China. It is a station known as the Waliguan (WLG) Baseline Observatory (36∘17′ N, 100∘54′ E; 3816 m a.s.l.) (Fig. 1), which is the only station in inner Asia in the Global Atmosphere Watch (GAW) program of the World Meteorological Organization (WMO). This area has a typical high-plateau continental climate and western winds dominant at the site (X. W. Fu et al., 2012; Okamoto and Tanimoto, 2016; Xu et al., 2018). WLG is mainly surrounded by the arid and semi-arid grassland and desert lands. The population density is very low, and industrial activities are sparsely distributed within 80 km of WLG. Anthropogenic Hg emissions in Qinghai province are relatively low and are mostly located to the east of WLG (Wu et al., 2006; Sun et al., 2021; Fu et al., 2015). The Taklimakan Desert and Gobi Desert of Xinjiang province are located to the west of WLG, and the Gobi Desert of the Hexi Corridor and southern Inner Mongolia are located to the north of WLG (Fig. 1).
2.2 Sampling method
2.2.1 Measurements of speciated atmospheric mercury
High-temporal-resolution measurements of GEM, GOM and PBM were carried out using the 2537B-1130-1135 atmosphere speciation mercury analysis system (Fig. 1, Tekran Instruments Corporation, Toronto, Canada) from May 2012 to April 2013. The Tekran model 2537B mercury vapor analyzer provides continuous analysis of GEM in air at a 0.1 ng m−3 detection limit. The instrument samples air and captures vapor phase Hg on the cartridges containing ultra-pure gold adsorbent media. The amalgamated Hg is thermally desorbed and detected using cold vapor atomic fluorescence spectrometry (CVAFS). The model 1135 particulate mercury unit, together with the model 1130 mercury speciation unit, allows the model 2537B mercury vapor analyzer to simultaneously monitor and differentiate between GEM, GOM and PBM (fine fraction, <2.5 µm) in ambient air. KCl-coated annular denuders were installed in the specially designated location of the model 1130 mercury speciation unit before the instrument starts running. The typical detection limits for the GOM and PBM measurements during a 2 h sampling duration are both at 2 pg m−3 (http://www.tekran.com/?les/Tekran-2537B-Unique-Features.r103.pdf, last access: October 2011). The instrument's workflow is controlled by the controller, which is capable of executing an automatic sampling and analysis program (Lindberg et al., 2002; Fu et al., 2016). Due to the low air pressure at WLG, the total sampling flow rate of the GOM and PBM was programmed to be 6.6 L min−1 (referenced to standard temperature and pressure conditions). The Tekran 2537 sampled GEM at a flow rate of 0.6 L min−1, while the Tekran 1130 pump module pulled additional air at 6 L min−1. A 2 h duration was selected for GOM and PBM sampling, during which GEM is continuously measured at a 5 min interval.
This system has been used to monitor atmospheric Hg species worldwide, including the North America Atmospheric Mercury Network (AMNet) and the Global Mercury Observation System (GMOS) (Lan et al., 2012; Sprovieri et al., 2016). In this study, the data QA/QC procedure followed the GMOS Standard Operating Procedure and Data Quality Management (D'amore et al., 2015). Although KCl-coated annular denuders have been the most popular and widely applied method for measuring ambient GOM, large analytical uncertainties in GOM may exist due to the trace level and complicated chemical compounds of GOM, which may not be fully collected by denuders (Gustin et al., 2015; Cheng and Zhang, 2017; Gustin et al., 2019; Ariya et al., 2015). Analysis and discussions presented in this study are mostly focused on GEM and PBM, considering the larger uncertainties in GOM than in GEM and PBM.
2.2.2 Meteorological data and backward-trajectory calculation
Meteorological parameters, including air temperature (AT), relative humidity (RH), rainfall (RF), wind direction (WD) and wind speed (WS), were obtained from the local weather station at WLG. In order to identify the effects of long-range transport of Hg emissions on the distributions of atmospheric Hg at WLG, backward trajectories arriving the site at 100 m above the ground were calculated every 4 h using the TrajStat software and gridded meteorological data from the Air Resource Laboratory, National Oceanic and Atmospheric Administration (NOAA) (Wang et al., 2009). To investigate the source regions potentially influencing GEM and PBM concentrations at WLG, a weighing algorithm based on measured concentrations, known as the concentration-weighted trajectory (CWT) approach, was applied in this study. In this procedure, the CWT value indicates the source strength of a 0.5∘ × 0.5∘ grid cell (CWTij) to the WLG and is defined as
where Cij is the average CWT value of speciated atmospheric Hg in the grid cell (i,j), Cl is the 4 h means of measured Hg concentration at WLG, τijl is the number of trajectory endpoints in the grid cell (i,j) associated with the Cl sample, and M is the number of samples that have trajectory endpoints in the grid cell (i,j). A point filter is applied as the final step of CWT to eliminate grid cells with few endpoints. Weighted concentration fields show concentration gradients across potential sources. This method helps determine the relative significance of potential source regions (Cheng et al., 2013; Zhang et al., 2016).
2.2.3 Ancillary parameters and analysis
Anthropogenic emissions of GEM and PBM in 0.5∘ × 0.5∘ grid cells in the studied domain were obtained from the 2010 global emission dataset developed by the Arctic Monitoring and Assessment Program (AMAP) (AMAP/UNEP, 2013). Gridded monthly biomass burned areas at 0.25∘ spatial resolution were obtained from the fourth version of the Global Fire Emissions Database (GFED4) (Giglio et al., 2013). The absorbing aerosol index (AAI) constitutes one of the most useful spaceborne datasets, offering temporal and spatial information on UV-absorbing-aerosol (black carbon, desert dust) distributions. Desert-dust- and biomass-burning-related aerosols are the dominant aerosol types detected by the AAI, and AAI is therefore a useful parameter for qualitatively identifying the dust- and biomass-burning-related sources. The AAI data are available on a daily and monthly basis at a spatial resolution of 1×1∘. Generally, non-absorbing aerosols (e.g., sulfate and sea salt) yield negative AAI values, UV-absorbing aerosols (e.g., dust and smoke) yield positive AAI values and clouds yield near-zero values (Prospero et al., 2002). Such information can be used for identifying distinct desert dust aerosol sources and analyzing dust and smoke transport patterns (Kubilay et al., 2005; Moulin and Chiapello, 2004; Chiapello et al., 1999). A detailed description of the AAI product is given in Herman et al. (1997) and Torres et al. (1998). In this study, global monthly gridded (1×1∘) AAI products during our study period were obtained from the Tropospheric Emission Monitoring Internet Service (TEMIS) (http://www.temis.nl/airpollution/absaai/, last access: December 2020).
To study the effect of dust-related sources on the variations in PBM concentration at WLG, we calculated the daily cumulative AAI (ΣAAI) based on the 2 d backward trajectory and gridded AAI data. Further analyses between the daily ΣAAI and mean PBM concentration were conducted to assess the effect of dust-related sources on the variations of PBM at WLG.
3.1 Concentrations of GEM, GOM and PBM
The time series of speciated atmospheric Hg concentrations is shown in Fig. 2. Mean ±1 SD (median) concentrations of GEM, GOM and PBM at WLG during the whole sampling campaign were 1.90±0.80 (1.67) ng m−3, 12.0±10.6 (8.3) and 65.4±63.2 (39.9) pg m−3, respectively. The mean GEM level at WLG was relatively higher than the background levels in the Northern Hemisphere (1.5–1.7 ng m−3) (Sprovieri et al., 2016). The mean GEM concentration at WLG was relatively lower than that early observed in Mt. Gongga (mean ng m−3, 1 SD) and Shangri-La (mean ng m−3, 1 SD), located on the eastern edge of the Tibetan Plateau in 2005 and 2009 respectively, but much higher than that later observed in the Qomolangma National Nature Preserve (mean ng m−3, 1 SD) and Nam Co (mean ng m−3, 1 SD) in the inland Tibetan Plateau in 2016 and 2014 respectively (Fu et al., 2009; H. Zhang et al., 2015; X. Fu et al., 2012; Yin et al., 2018; Lin et al., 2019). In general, atmospheric GEM levels in remote areas are closely related to the regional atmospheric Hg budget. The inland Tibetan Plateau is sparsely populated and has no large-scale industrial activities. However, some monitoring sites on the northeastern and eastern edges of the Tibetan Plateau, such as WLG, Mt. Gongga and Shangri-La, are not too far away from the anthropogenic Hg source regions in middle and eastern China and thus were impacted by anthropogenic Hg emissions through long-range transport, which explained the relatively higher GEM concentrations at these stations than at inland Tibetan Plateau stations (Fu et al., 2008; H. Zhang et al., 2015). The impact of regional and long-range transport of Hg originating from anthropogenic emissions on the elevated GEM level at WLG is discussed in detail in Sect. 3.2 and 3.3.

Currently, there is a great debate on the measurement accuracy of GOM using a KCl-coated denuder, and a small load of Hg could also cause analytical uncertainties in Tekran-based GOM and PBM measurements (Ambrose, 2017). Therefore, GOM data in this study were only compared with previously reported data collected using the same method. The mean GOM concentration at WLG (12.0 pg m−3) was slightly higher than those in rural areas of North America and China but lower than those in urban areas in China (X. Fu et al., 2012; Zhang et al., 2016). GOM is mainly affected by local to regional emission sources and atmospheric processes (Sheu and Mason, 2001). Since WLG is isolated from primary anthropogenic sources, the relatively high level of GOM at WLG was probably mainly caused by atmospheric processes. Intrusion of GOM-enriched air from free troposphere could be one reason, a phenomenon that has been reported in Qomolangma National Nature Preserve in the southern Tibetan Plateau (Lin et al., 2019). Additionally, GOM at WLG generally showed relatively high concentrations during daytime (Fig. S4), indicating in situ photochemical production of GOM as another important mechanism causing high GOM levels at WLG.
PBM concentrations at WLG showed large variations with the maximum hourly value reaching 655 pg m−3. The overall mean PBM concentration at WLG (65.4 pg m−3) was significantly higher (by up to ∼5–40 times) than those reported for remote areas in the Northern Hemisphere (Lan et al., 2012; Kim et al., 2012), but it was similar to observations in the urban areas in China (X. Fu et al., 2012; Fu et al., 2015). Elevated PBM concentrations in Chinese urban areas were most likely caused by strong local anthropogenic emissions. However, in the remote areas with very limited primary anthropogenic emissions, long-range transport should be the major cause for highly elevated PBM concentrations. PBM has an atmospheric residence time ranging from a few days to weeks and can undergo regional transport (Seigneur et al., 2004; Zhang et al., 2019). Therefore, high PBM levels at WLG were probably mainly caused by long-range transport of anthropogenic and natural emissions, which are discussed in detail in the following sections.
3.1.1 Seasonal and diurnal distributions of GEM, GOM and PBM
Daily values of GEM, GOM, PBM, AT, RH, WS, RF and air water content were aggregated into monthly average values to reveal seasonal variations during the study period (Table S1 and Fig. 3). In the discussion below, warm (May to October) and cold (November to April) seasons were compared. The mean GEM level in the cold season (1.95 ng m−3) was relatively higher than that in the warm season (1.84 ng m−3) (Table S1), which was likely due to the strengthening westerlies originating from or passing over regions with some anthropogenic emissions during the cold season (L. Zhang et al., 2015). Elevated monthly mean GEM levels were observed from February to April (Table S1, Figs. S1, S2), and many high-GEM events were frequently observed in the cold season (Fig. S3), likely due to the long-range transport from northern South Asia, which has been experiencing industrialization and urbanization and thus strong anthropogenic Hg emissions (Chakraborty et al., 2013; AMAP/UNEP, 2018). Airflows originating from these areas had high GEM concentrations and could be transported to WLG in the cold season (Lin et al., 2019; Yin et al., 2018). In addition, higher-than-seasonal-average GEM concentrations were also observed during July to September (Table S1, Fig. 3), which could be attributed to the strengthening East Asian summer monsoon during the warm season. The prevailing wind from the east direction (Fig. 4, Table S1) could transport GEM from the eastern Qinghai and southern Gansu province of China to WLG during the East Asian summer monsoon season.
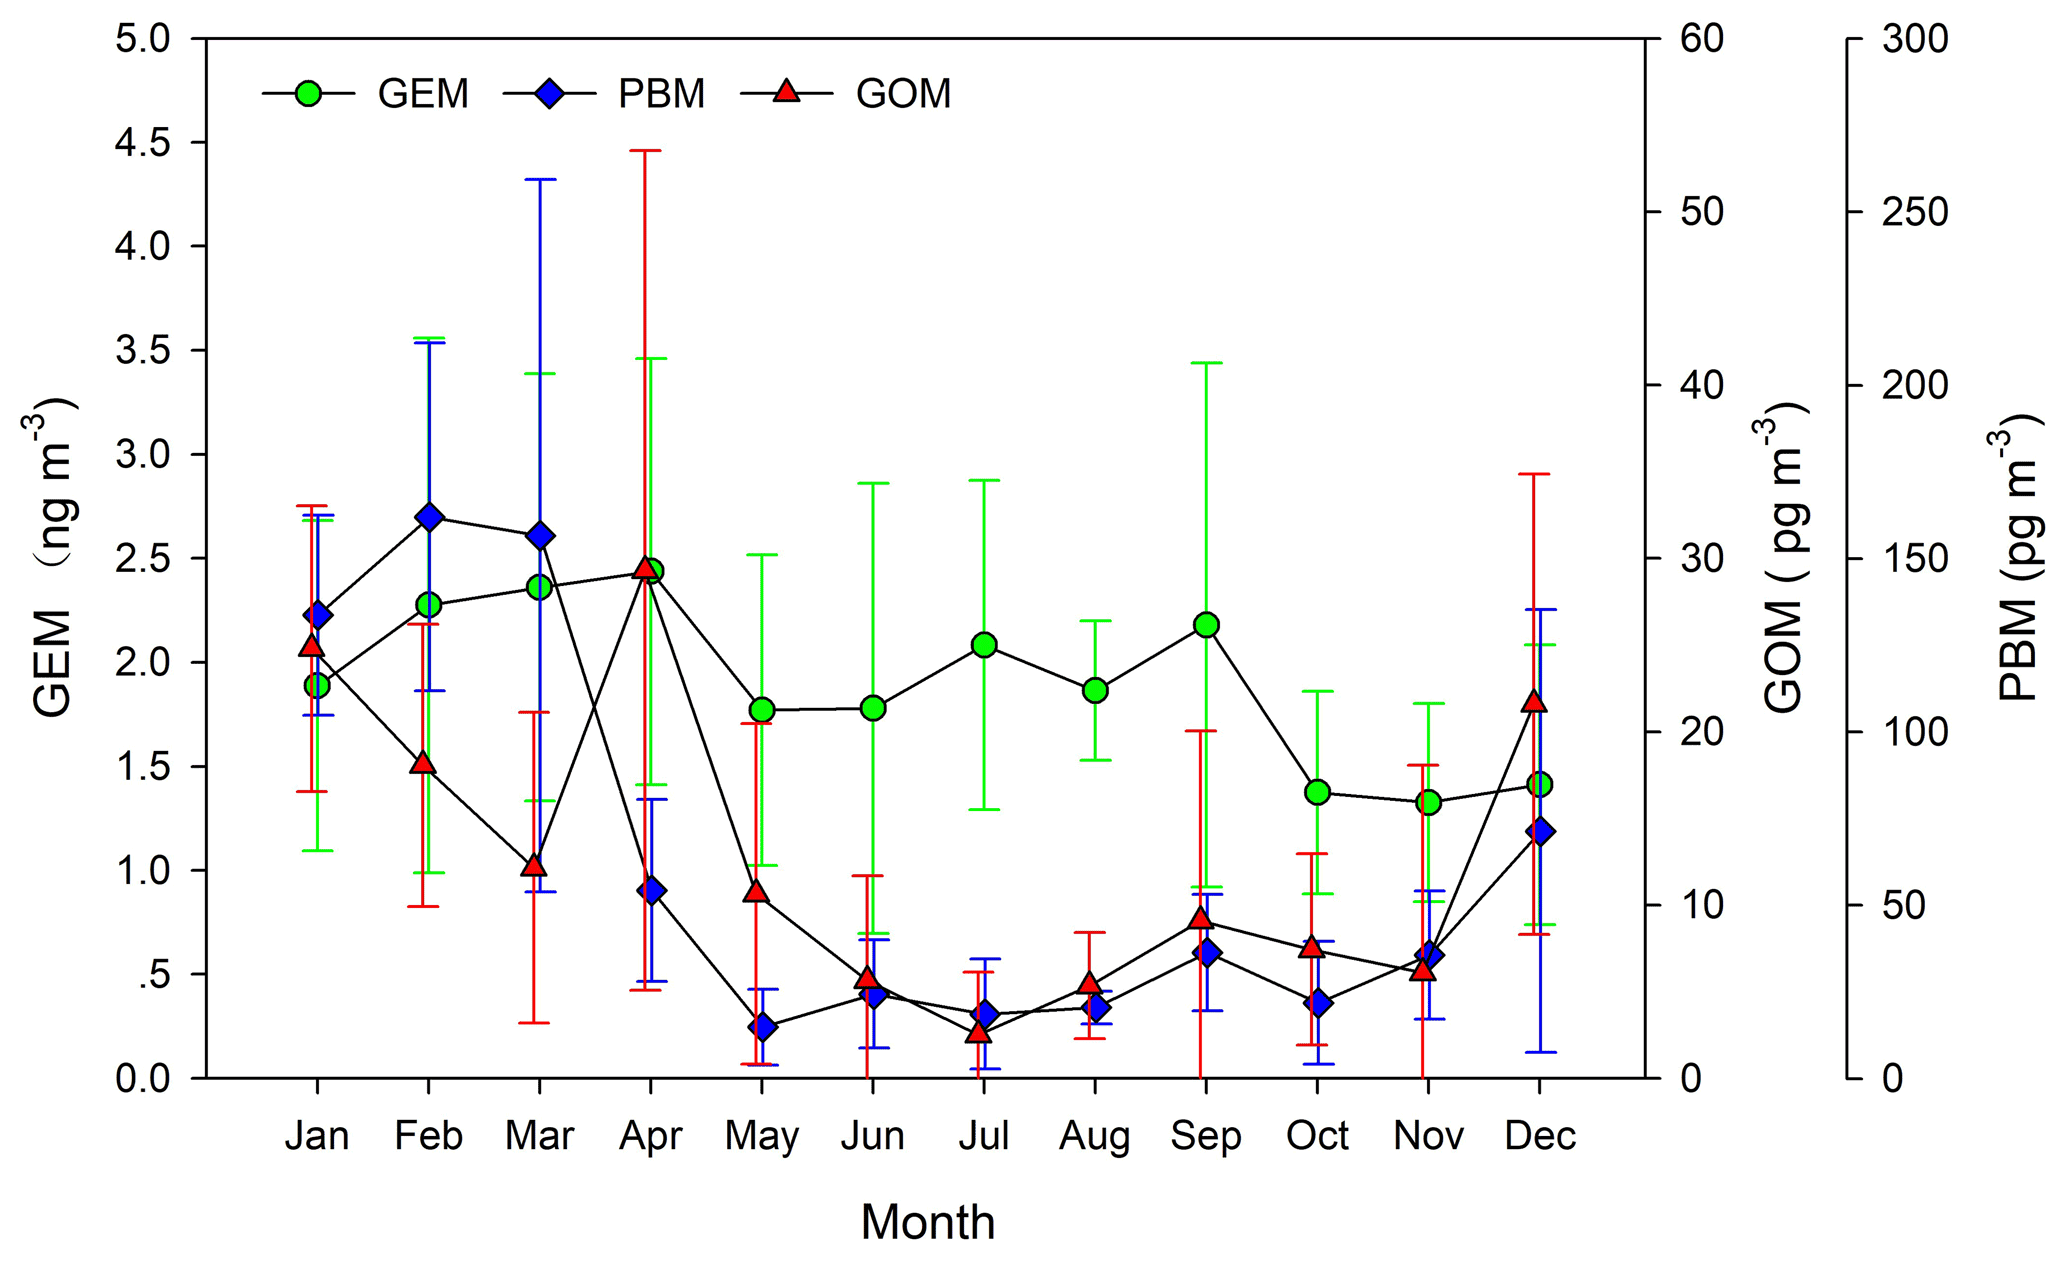
Figure 3Monthly means of GEM, GOM and PBM at WLG during a full-year sampling period. Error bars indicate the 1 SD of monthly mean values.
Similar to the case of GEM, mean and median GOM and PBM values were both higher in the cold than in the warm season (Table S1, Figs. 3, S1, S2). Also, the high GOM and PBM events occurred mainly in the cold months (Fig. S3). Lower GOM and PBM concentrations in the warm season were probably attributed to the increasing removal processes of these water-soluble Hg species, and this is in consistent with previous observations which showed wet Hg deposition fluxes peaked in the warm rainy season (Cole et al., 2014). In addition, low RH in the cold season would be conducive to the formation of GOM and PBM through atmospheric chemical and physical transformations (Fain et al., 2009; Lin et al., 2019). Higher PBM concentrations at WLG were frequently detected with westerly and northerly winds (Fig. 4), which were mainly from the desert and Gobi areas of the western Tibetan Plateau, Xinjiang, southern Gansu and southwestern Inner magnolia, suggesting that desert-dust-related sources in these regions could be potential sources of PBM at WLG in the cold season.
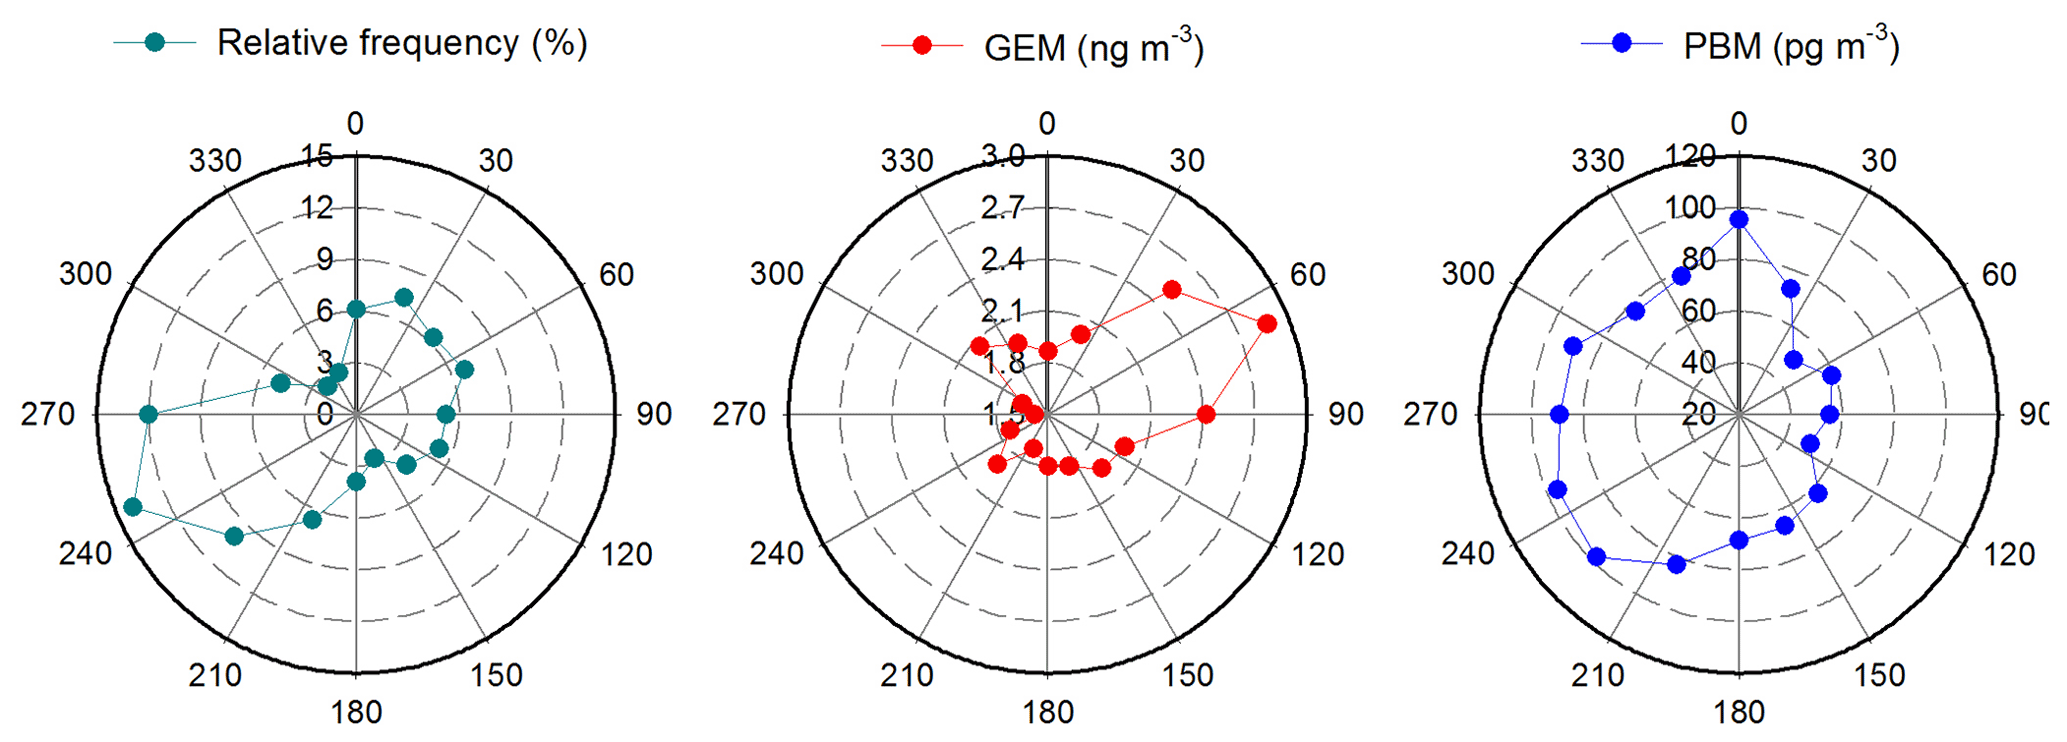
Figure 4Frequency distribution of wind direction and wind-sector-based mean GEM and PBM concentrations during the study period.
No notable differences in GEM concentration were observed between daytime (07:00–19:00, 1.89±1.01 ng m−3) and nighttime (20:00–06:00, 1.86±0.91 ng m−3) at WLG (Fig. S4). This was also the case for PBM (80.0±81.5 pg m−3 versus 75.0±72.5 pg m−3). The diurnal pattern of PBM at WLG was different from those observed in Nam Co, the Qomolangma National Nature Preserve and Mt. Gongga in the Tibetan Plateau, where PBM concentrations generally peaked during daytime under valley breeze condition (Fu et al., 2009; Yin et al., 2018; Lin et al., 2019). The above findings at WLG suggested that local sources and in situ atmospheric transformations may only have minor impacts on PBM concentration. Instead, atmospheric circulation over the Tibetan Plateau and long-range transport from the other source regions should be the main factors controlling the diurnal and seasonal variations of GEM and PBM concentrations at WLG. In contrast, the mean concentration of GOM during daytime (17.2±16.5 pg m−3) was 31.3 % higher than that during nighttime (13.1±10.3 pg m−3) at WLG (p<0.01, two independent samples t test). Given that there was a lack of strong anthropogenic emissions around the station or in the surrounding areas, such a phenomenon of elevated daytime GOM should be attributed to the in situ production of GOM via GEM oxidation (Fain et al., 2009; Ariya et al., 2015). Therefore, local meteorology and photochemical production could be important controlling factors for the observed diurnal patterns of GOM at WLG.
3.2 Source identification of GEM and PBM
During the whole study period, the prevailing winds at WLG were from the southwestern quadrant (46.5 %), mainly originating from and passing over the Tibetan Plateau and southern Xinjiang under the control of the westerlies. Average GEM concentrations (1.58 to 1.91 ng m−3) associated with this wind sector were overall lower than those associated with other wind sectors (Fig. 4), suggesting the areas southwest of WLG were not important source regions of GEM at WLG. In contrast, GEM concentrations (range: 2.42 to 2.87 ng m−3) associated with the northeast wind sector were highly elevated. The northeast wind mainly came from the low-altitude regions in northwestern China with many anthropogenic Hg sources, which could have contributed to GEM at WLG. In contrast to GEM, the maximum PBM concentrations (range: 68.6 to 97.8 pg m−3) were associated with wind sectors of southwestern and northwestern quadrants, and the lowest PBM concentrations (range: 49.6 to 63.3 pg m−3) were associated with the wind sector of the eastern quadrants (Fig. 4). The southwest and northwest winds mainly originated from and passed over the deserts and Gobi regions, including the largest Taklimakan Desert in Asia. These areas are the main dust source regions in middle and eastern China (Chen et al., 2017; Che et al., 2011) and therefore would be an important source of PBM at WLG.
To better understand the sources and long-range transport of atmospheric Hg at WLG, CWT values for GEM and PBM were calculated and are shown in Fig. 5. Higher GEM CWT values were mainly located in eastern Qinghai, southern Gansu, western Shanxi and southwestern Inner Mongolia of China, and northern South Asia, whereas lower values were mainly located in the western Qinghai, Xinjiang and Xizang provinces (Fig. 5a). By matching the gridded GEM CWT values with the gridded anthropogenic GEM emissions in the study domain, we found GEM CWT values were significantly positively correlated with anthropogenic GEM emissions (R2= 0.55, p<0.01, Fig. 6a). This indicates GEM at WLG was mainly caused by long-range transport of anthropogenic GEM emissions from industrial areas in western China, and this is overall inconsistent with the findings discussed above that were based on wind dependence of GEM at WLG.

Figure 5Identified source regions of atmospheric GEM and PBM at WLG during the study period. (a) Gridded (0.5∘ × 0.5∘) values for GEM, and (b) gridded (0.5∘ × 0.5∘) values for PBM. Gray-line-enclosed regions indicate desert locations in China.
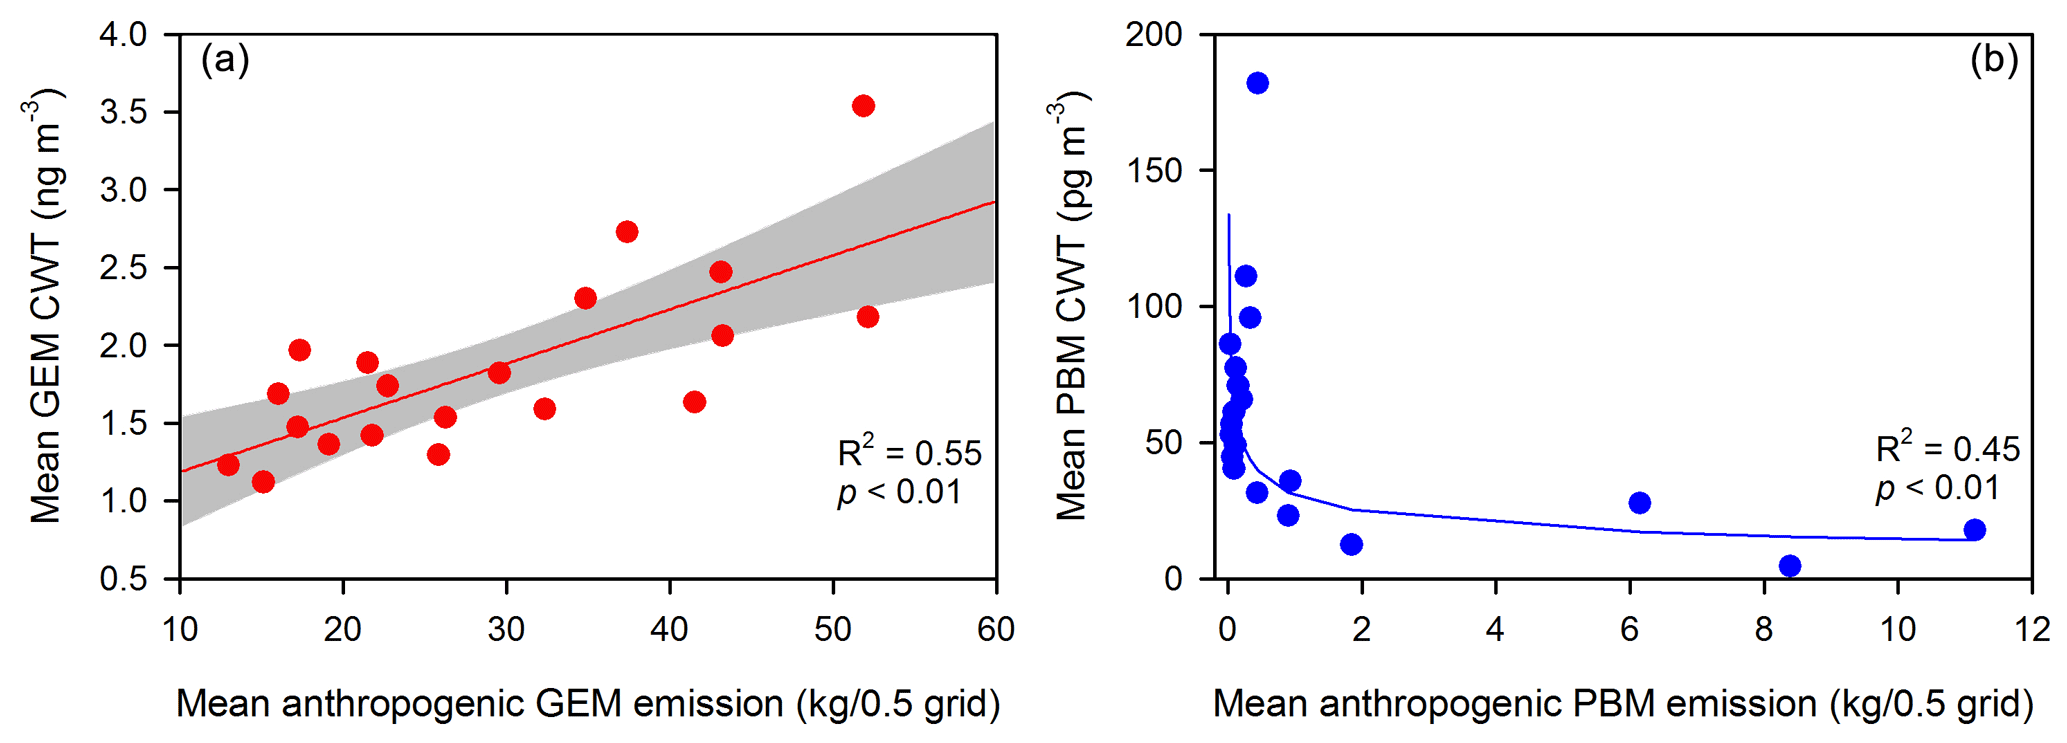
Figure 6Correlation between the simulated GEM or PBM CWT value and their respective anthropogenic emissions (AMAP/UNEP, 2018). The location of each gridded CWT value is matched with that of anthropogenic emission. Gridded anthropogenic emissions are divided into 20 groups with an equal number of grids, starting from the lowest to highest emission values.
Differing from the case of GEM, higher PBM CWT values were mainly located in the southern Xinjiang, western Qinghai and south-central Xizang provinces, whereas the regions to the east of WLG, where many industrial sources were located, showed relatively lower PBM CWT values (Fig. 5b). In addition, gridded PBM CWT values showed a negative correlation with gridded anthropogenic PBM emissions (Fig. 6b). These findings indicate that long-range transport of anthropogenic PBM emission was unlikely to be the major source of PBM at WLG. Instead, long-range transport of PBM-enriched air masses originating from the deserts and Gobi regions in western China, such as the Taklimakan Desert, Qaidam desert and Badain Jaran desert (Fig. S5), is responsible for elevated PBM levels at WLG. These regions contain the major deserts and Gobi areas in East Asia and can release up to 25 million metric tons of dust particles annually. Dusts from these regions could be transported to the northwestern, middle and even eastern China through the westerlies over the Tibetan Plateau (Xuan et al., 2000; Che et al., 2011; Chen et al., 2017). Previous studies showed that atmospheric PBM concentrations (86.1–517 pg m−3) over the Taklimakan Desert are remarkably higher than those observed from background sites in China and even comparable to those measured in most of the Chinese metropolitan cities (Huang et al., 2020). We thus concluded that the dry airflows transported the PBM-enriched dust aerosols from the desert and Gobi regions to WLG and contributed significantly to the elevated PBM concentrations at WLG.
3.3 Impact of desert-dust-related sources on PBM
To evaluate the impact of dust-related sources on the temporal variations of PBM concentration, daily cumulative AAI (∑AAI) values for air masses transported during the preceding 2 d were calculated, as shown in Fig. 7, together with daily PBM concentrations. PBM concentrations maintained at relatively low levels in warm months (May to September) started increasing in October and reached the highest levels in winter and early spring (December to March) (Table S1). Daily ∑AAI showed negative values from June to October but large positive values in winter and early spring (Table S1 and Fig. 7). A significant positive correlation (r2=0.31, p<0.01) was observed between daily ∑AAI and daily PBM concentration (Fig. 7), indicating that the long-range transport of dust- and/or biomass-burning-related sources played an important role in the temporal variations of PBM concentration at WLG. Biomass-burning-related sources were not likely to be the major cause because the air masses that ended up at WLG mainly originated from and passed over regions with low biomass burning area (Fig. S5). PBM concentrations showed a negative correlation with CO and BC concentrations, which are mainly emitted from the industrial and biomass burning activities (Table S2). Hence, we concluded that the dust-related sources were the dominant source of PBM at WLG. Previous studies analyzing spatiotemporal patterns of atmospheric dust based on a satellite-remote-sensing-generated dust aerosol index have shown the Taklimakan area to be the dominant source of dust episodes in Asia, especially every spring season. Desert dust is a significant carrier of atmospheric aerosol and PBM to the cryosphere of western China and can also have a global impact through long-range transport (Zhang et al., 2008; Huang et al., 2020).
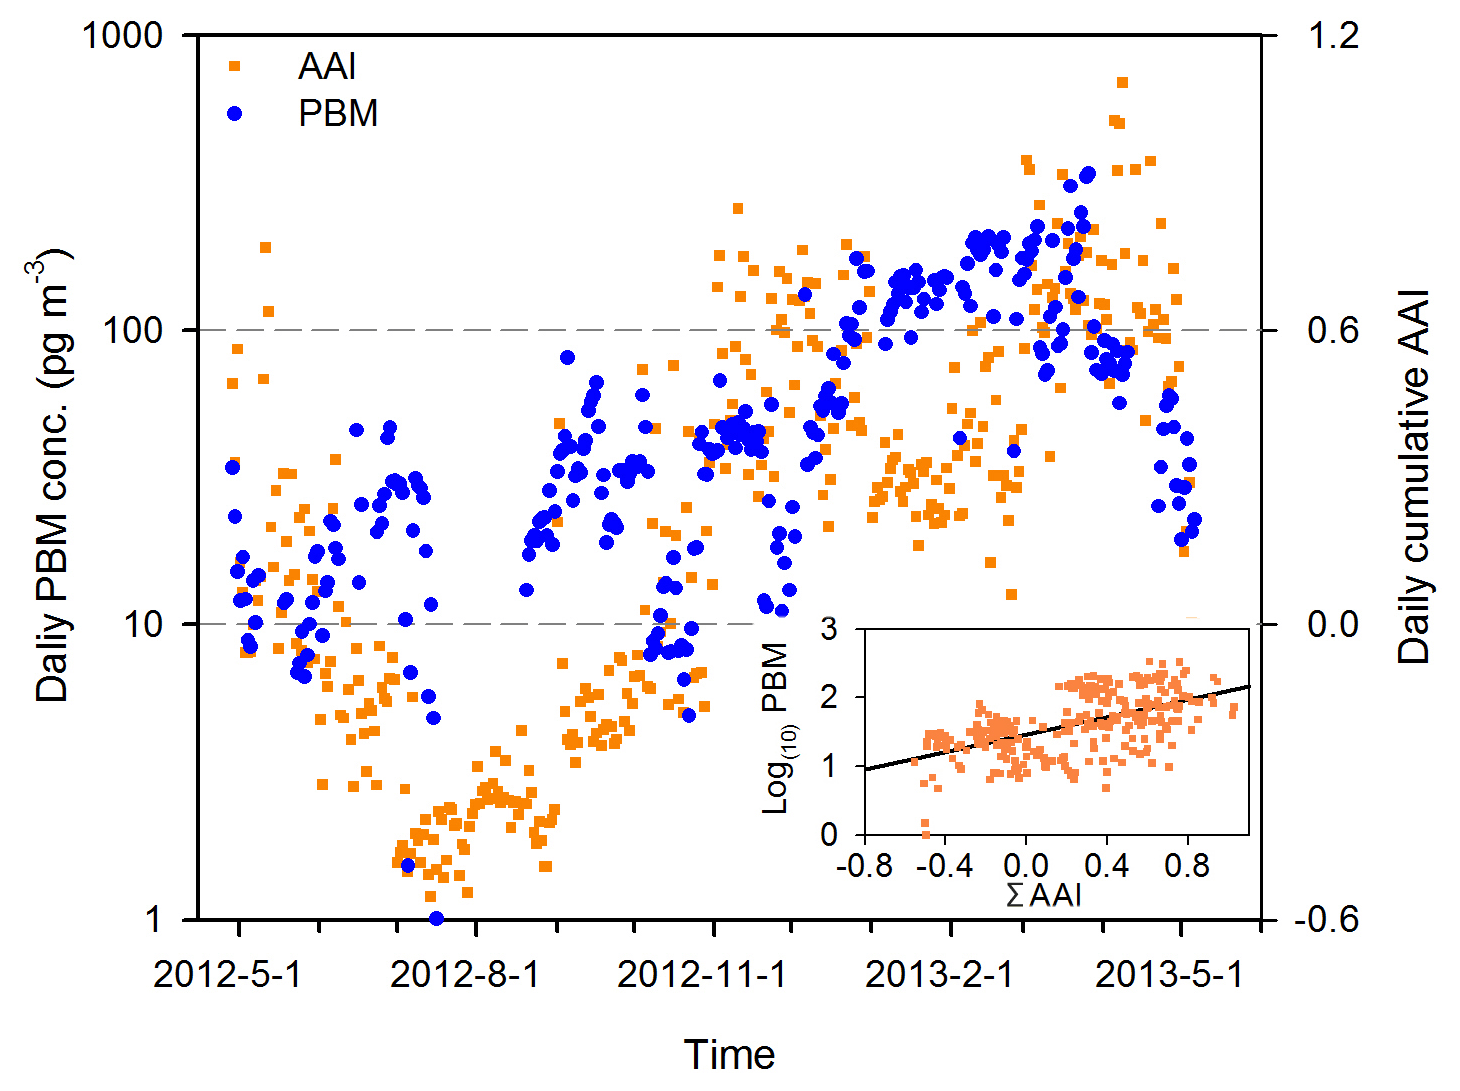
Figure 7Variations in daily mean PBM concentration and daily cumulative absorbing aerosol index (AAI) during the proceeding 2 d at WLG.
Desert and Gobi areas are important sources of atmospheric particles. Global dust particle emissions were estimated to range from 500 to 5000 Tg yr−1, with an average value of 1836±903 Tg yr−1. In China, the desert and Gobi dust particle emissions were estimated to range from 100 to 459 Tg yr−1, with an average value of 242±120 Tg yr−1 (Table S3). Hg content in total suspended particles (TSPs) from desert dust was averaged at 0.33 µg g−1 from existing studies (Table S3). Based on the above numbers, total particulate bound mercury (Hg-TSP) emissions from desert-dust-related sources were roughly estimated to be 606±298 Mg yr−1 (range from 165 to 1650 Mg yr−1) globally and 80±40 Mg yr−1 (range from 33 to 151 Mg yr−1 ) in China (Table S3). Given that PM2.5 generally accounts for 40 % of TSPs in dust aerosols (Yu et al., 2019), PBM (referred as to mercury bound to fine particles, e.g., of diameter <2.5 µm) emissions from desert-dust-related sources were 242.4 Mg yr−1 globally and 32 Mg yr−1 in China. These values exceed the anthropogenic PBM emissions in the world (75 Mg yr−1) and China (16 Mg yr−1), respectively, suggesting desert and Gobi areas as important sources of atmospheric PBM emissions at regional to global scales.
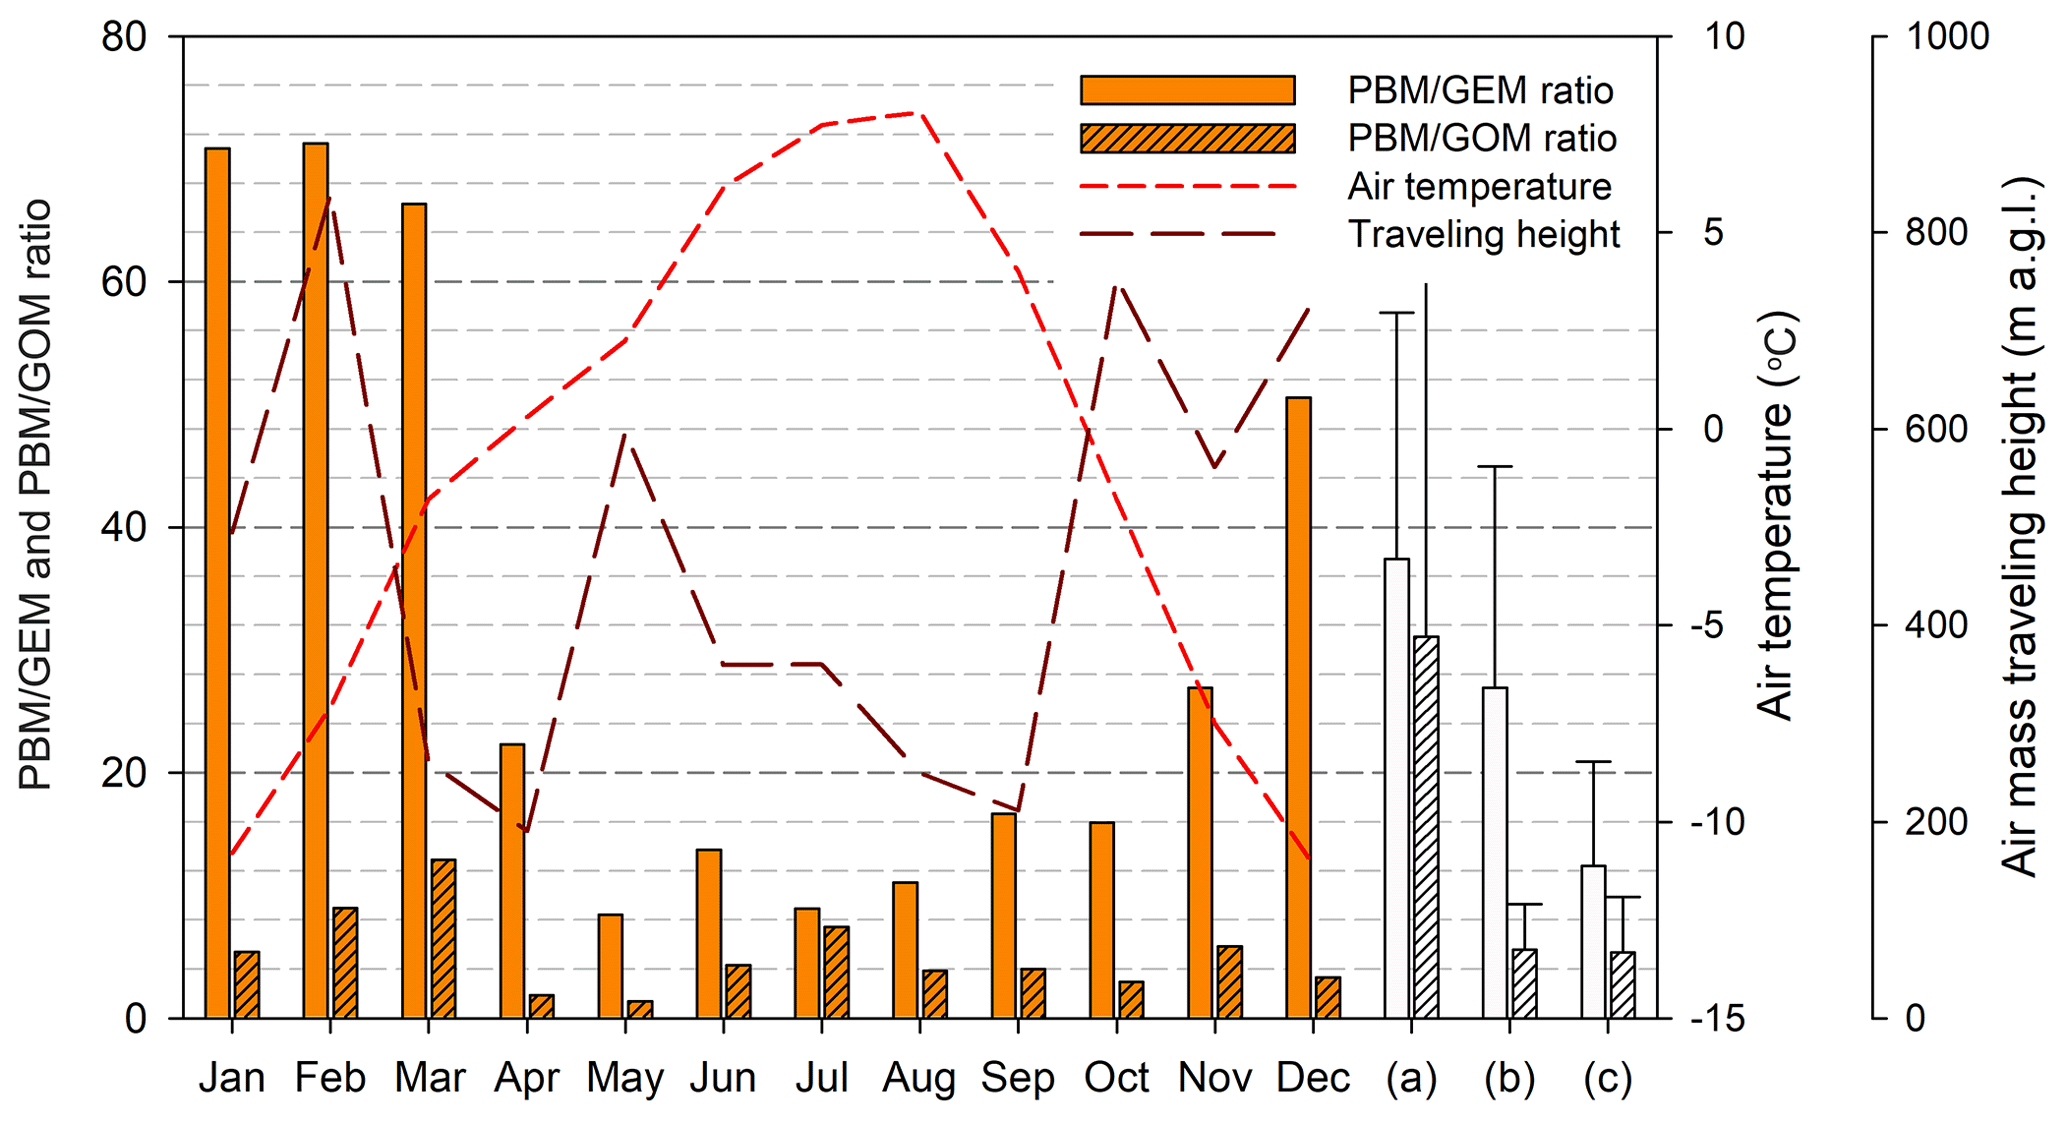
Figure 8The monthly PBM GEM and PBM GOM ratio with air temperature and air mass traveling height during a full-year sampling period. Column (a) shows the mean PBM GEM and PBM GOM ratios at Qomolangma National Nature Preserve and Nam Co in the inland Tibetan Plateau, column (b) shows the mean PBM GEM and PBM GOM ratios of Chinese cities, and column (c) shows the mean PBM GEM and PBM GOM ratios of Chinese remote areas.
Besides emissions from anthropogenic and dust-related sources, gas–particle partitioning between GOM and PBM also affects the PBM level in the atmosphere. Thus, the intrusion of GOM-rich air from the free troposphere would also have an impact on PBM (Tsamalis et al., 2014; Ariya et al., 2015; Lin et al., 2019). The PBM GEM ratios at WLG were similar to those observed at the Qomolangma National Nature Preserve and Nam Co in the Tibetan Plateau but much higher than those in Chinese urban and remote areas (Lin et al., 2019; Yin et al., 2018). On the other hand, the PBM GOM ratios at WLG were relatively lower than the values observed from the other two Tibetan sites (Fig. 8). Generally, gas–particle partitioning of GOM and PBM is mainly controlled by air temperature (Amos et al., 2012); however, no clear dependence of the monthly PBM GOM ratio on monthly mean air temperature was observed, e.g., similar PBM GOM ratios were observed between the coldest months (December to February) and other seasons (Fig. 8). This indicates the elevated PBM concentrations in winter and early spring at WLG were not likely caused by the enhanced gas–particle partitioning of GOM under low air temperature. Besides, air mass traveling heights at WLG did not show clear seasonal variations throughout the study period, indicating elevated PBM concentrations at WLG in winter and the early spring were not likely associated with intrusion of free-troposphere air masses.
This study presented the first full-year continuous speciated Hg dataset and identified potential sources causing high GEM and PBM at WLG in the Tibetan Plateau. The mean GEM level at WLG was slightly higher than the background level of GEM in the Northern Hemisphere. The mean PBM level at WLG was much higher compared with the reported values in remote areas in the Northern Hemisphere. Seasonal variations in GEM concentration indicated that Hg emissions from anthropogenic source regions and long-range transport played important roles on the high GEM levels at WLG. High PBM concentrations at WLG were observed in the cold season and were mainly caused by dust aerosol sources from the desert and Gobi areas. Analysis from CWT and ∑AAI indicated that northern Xinjiang, eastern Qinghai, southern Gansu, southwestern Shaanxi, western Inner Mongolia of China and northern South Asia could be the main source areas of GEM, while southern Xinjiang, southwestern Inner Mongolia, northern Gansu, western Qinghai and Tibet were likely the source regions of PBM at WLG. Long-range transport of dust particles from desert and Gobi areas contributes to the elevated PBM at WLG. The estimated PBM emissions from dust particles suggested that dust from desert and Gobi areas is a critical source of PBM on regional to global scales, which should be paid more attention in future studies.
All the datasets used in this study can be found in the Supplement.
The supplement related to this article is available online at: https://doi.org/10.5194/acp-21-15847-2021-supplement.
HZ, XuF, and XiF initiated the project and designated the field experiments. HZ, XuF, BY, BL, PL, and GZ carried out the field observations. HZ and XuF prepared the manuscript with contributions from all co-authors.
The contact author has declared that neither they nor their co-authors have any competing interests.
Publisher’s note: Copernicus Publications remains neutral with regard to jurisdictional claims in published maps and institutional affiliations.
This work is supported by the Strategic Priority Research Program of CAS (XDB40000000), the National Science Foundation of China (41921004 and 41703134), Key Research Program of Frontier Sciences (ZDBS-LY-DQC029) of CAS, and the Kuancheng Wang Education Foundation of CAS. We also thank staffs in Waliguan GAW Baseline Observatory for field sampling assistance.
This research has been supported by the Strategic Priority Research Program of CAS (grant no. XDB40000000), the National Science Foundation of China (grant nos. 41921004 and 41703134), Key Research Program of Frontier Sciences of CAS (grant no. ZDBS-LY-DQC029), and the Kuancheng Wang Education Foundation of CAS.
This paper was edited by Ashu Dastoor and reviewed by Yanxu Zhang and one anonymous referee.
AMAP/UNEP: Geospatially Distributed Mercury Emissions Dataset 2010v1, available at: https://www.amap.no/mercury-emissions/datasets (last access: 25 April 2021), 2013.
AMAP/UNEP: Technical Background Assessment for the 2018 Global Mercury Assessment, available at: https://www.unep.org/resources/publication/global-mercury-assessment-2018 (last access: 4 March 2019), 2018.
Ambrose, J. L.: Improved methods for signal processing in measurements of mercury by Tekran® 2537A and 2537B instruments, Atmos. Meas. Tech., 10, 5063–5073, https://doi.org/10.5194/amt-10-5063-2017, 2017.
Amos, H. M., Jacob, D. J., Holmes, C. D., Fisher, J. A., Wang, Q., Yantosca, R. M., Corbitt, E. S., Galarneau, E., Rutter, A. P., Gustin, M. S., Steffen, A., Schauer, J. J., Graydon, J. A., Louis, V. L. St., Talbot, R. W., Edgerton, E. S., Zhang, Y., and Sunderland, E. M.: Gas-particle partitioning of atmospheric Hg(II) and its effect on global mercury deposition, Atmos. Chem. Phys., 12, 591–603, https://doi.org/10.5194/acp-12-591-2012, 2012.
Ariya, P. A., Amyot, M., Dastoor, A., Deeds, D., Feinberg, A., Kos, G., Poulain, A., Ryjkov, A., Semeniuk, K., Subir, M., and Toyota, K.: Mercury Physicochemical and Biogeochemical Transformation in the Atmosphere and at Atmospheric Interfaces: A Review and Future Directions, Chem. Rev., 115, 3760–3802, https://doi.org/10.1021/cr500667e, 2015.
Chakraborty, L. B., Qureshi, A., Vadenbo, C., and Hellweg, S.: Anthropogenic Mercury Flows in India and Impacts of Emission Controls, Environ. Sci. Technol., 47, 8105–8113, https://doi.org/10.1021/es401006k, 2013.
Che, H. Z., Wang, Y. Q., and Sun, J. Y.: Aerosol optical properties at Mt. Waliguan Observatory, China, Atmos. Environ., 45, 6004–6009, https://doi.org/10.1016/j.atmosenv.2011.07.050, 2011.
Chen, P., Kang, S., Li, C., Zhang, Q., Guo, J., Tripathee, L., Zhang, Y., Li, G., Gul, C., Cong, Z., Wan, X., Niu, H., Panday, A. K., Rupakheti, M., and Ji, Z.: Carbonaceous aerosol characteristics on the Third Pole: A primary study based on the Atmospheric Pollution and Cryospheric Change (APCC) network, Environ. Pollut., 253, 49–60, https://doi.org/10.1016/j.envpol.2019.06.112, 2019.
Chen, S., Huang, J., Kang, L., Wang, H., Ma, X., He, Y., Yuan, T., Yang, B., Huang, Z., and Zhang, G.: Emission, transport, and radiative effects of mineral dust from the Taklimakan and Gobi deserts: comparison of measurements and model results, Atmos. Chem. Phys., 17, 2401–2421, https://doi.org/10.5194/acp-17-2401-2017, 2017.
Cheng, I. and Zhang, L.: Uncertainty Assessment of Gaseous Oxidized Mercury Measurements Collected by Atmospheric Mercury Network, Environ. Sci. Technol., 51, 855–862, https://doi.org/10.1021/acs.est.6b04926, 2017.
Cheng, I., Zhang, L., Blanchard, P., Dalziel, J., and Tordon, R.: Concentration-weighted trajectory approach to identifying potential sources of speciated atmospheric mercury at an urban coastal site in Nova Scotia, Canada, Atmos. Chem. Phys., 13, 6031–6048, https://doi.org/10.5194/acp-13-6031-2013, 2013.
Chiapello, I., Prospero, J. M., Herman, J. R., and Hsu, N. C.: Detection of mineral dust over the North Atlantic Ocean and Africa with the Nimbus 7 TOMS, J. Geophys. Res.-Atmos., 104, 9277–9291, https://doi.org/10.1029/1998jd200083, 1999.
Cole, A. S., Steffen, A., Eckley, C. S., Narayan, J., Pilote, M., Tordon, R., Graydon, J. A., St Louis, V. L., Xu, X. H., and Branfireun, B. A.: A Survey of Mercury in Air and Precipitation across Canada: Patterns and Trends, Atmosphere, 5, 635–668, https://doi.org/10.3390/atmos5030635, 2014.
D'Amore, F., Bencardino, M., Cinnirella, S., Sprovieri, F., and Pirrone, N.: Data quality through a web-based QA/QC system: implementation for atmospheric mercury data from the global mercury observation system, Environ. Sci.-Proc. Imp., 17, 1482–1491, https://doi.org/10.1039/c5em00205b, 2015.
Driscoll, C. T., Mason, R. P., Chan, H. M., Jacob, D. J., and Pirrone, N.: Mercury as a Global Pollutant: Sources, Pathways, and Effects, Environ. Sci. Technol., 47, 4967–4983, https://doi.org/10.1021/es305071v, 2013.
Faïn, X., Obrist, D., Hallar, A. G., Mccubbin, I., and Rahn, T.: High levels of reactive gaseous mercury observed at a high elevation research laboratory in the Rocky Mountains, Atmos. Chem. Phys., 9, 8049–8060, https://doi.org/10.5194/acp-9-8049-2009, 2009.
Fu, X., Feng, X., Wang, S., Rothenberg, S., Shang, L., Li, Z., and Qiu, G.: Temporal and spatial distributions of total gaseous mercury concentrations in ambient air in a mountainous area in southwestern China: implications for industrial and domestic mercury emissions in remote areas in China, Sci. Total Environ., 407, 2306–2314, https://doi.org/10.1016/j.scitotenv.2008.11.053, 2009.
Fu, X., Feng, X., Sommar, J., and Wang, S.: A review of studies on atmospheric mercury in China, Sci. Total Environ., 421–422, 73–81, https://doi.org/10.1016/j.scitotenv.2011.09.089, 2012.
Fu, X., Marusczak, N., Heimbürger, L.-E., Sauvage, B., Gheusi, F., Prestbo, E. M., and Sonke, J. E.: Atmospheric mercury speciation dynamics at the high-altitude Pic du Midi Observatory, southern France, Atmos. Chem. Phys., 16, 5623–5639, https://doi.org/10.5194/acp-16-5623-2016, 2016.
Fu, X. W., Feng, X. B., Zhu, W. Z., Wang, S. F., and Lu, J. L.: Total gaseous mercury concentrations in ambient air in the eastern slope of Mt. Gongga, South-Eastern fringe of the Tibetan plateau, China, Atmos. Environ., 42, 970–979, https://doi.org/10.1016/j.atmosenv.2007.10.018, 2008.
Fu, X. W., Feng, X., Liang, P., Deliger, Zhang, H., Ji, J., and Liu, P.: Temporal trend and sources of speciated atmospheric mercury at Waliguan GAW station, Northwestern China, Atmos. Chem. Phys., 12, 1951–1964, https://doi.org/10.5194/acp-12-1951-2012, 2012.
Fu, X. W., Zhang, H., Yu, B., Wang, X., Lin, C.-J., and Feng, X. B.: Observations of atmospheric mercury in China: a critical review, Atmos. Chem. Phys., 15, 9455–9476, https://doi.org/10.5194/acp-15-9455-2015, 2015.
Giglio, L., Randerson, J. T., and van der Werf, G. R.: Analysis of daily, monthly, and annual burned area using the fourth-generation global fire emissions database (GFED4), J. Geophys. Res.-Biogeo., 118, 317–328, https://doi.org/10.1002/jgrg.20042, 2013.
Gustin, M. S., Amos, H. M., Huang, J., Miller, M. B., and Heidecorn, K.: Measuring and modeling mercury in the atmosphere: a critical review, Atmos. Chem. Phys., 15, 5697–5713, https://doi.org/10.5194/acp-15-5697-2015, 2015.
Gustin, M. S., Dunham-Cheatham, S. M., and Zhang, L.: Comparison of 4 Methods for Measurement of Reactive, Gaseous Oxidized, and Particulate Bound Mercury, Environ. Sci. Technol., 53, 14489–14495, https://doi.org/10.1021/acs.est.9b04648, 2019.
Herman, J. R., Bhartia, P. K., Torres, O., Hsu, C., Seftor, C., and Celarier, E.: Global distribution of UV-absorbing aerosols from Nimbus 7/TOMS data, J. Geophys. Res.-Atmos., 102, 16911–16922, https://doi.org/10.1029/96jd03680, 1997.
Huang, J., Kang, S., Yin, R., Ram, K., Liu, X., Lu, H., Guo, J., Chen, S., and Tripathee, L.: Desert dust as a significant carrier of atmospheric mercury, Environ. Pollut., 267, 115442, https://doi.org/10.1016/j.envpol.2020.115442, 2020.
Jonsson, S., Skyllberg, U., Nilsson, M. B., Lundberg, E., Andersson, A., and Bjorn, E.: Differentiated availability of geochemical mercury pools controls methylmercury levels in estuarine sediment and biota, Nat. Commun., 5, 4624, https://doi.org/10.1038/ncomms5624, 2014.
Kim, P. R., Han, Y. J., Holsen, T. M., and Yi, S. M.: Atmospheric particulate mercury: Concentrations and size distributions, Atmos. Environ., 61, 94–102, https://doi.org/10.1016/j.atmosenv.2012.07.014, 2012.
Kubilay, N., Oguz, T., Kocak, M., and Torres, O.: Ground-based assessment of Total Ozone Mapping Spectrometer (TOMS) data for dust transport over the northeastern Mediterranean, Global Biogeochem. Cy., 19, Gb1022, https://doi.org/10.1029/2004gb002370, 2005.
Lan, X., Talbot, R., Castro, M., Perry, K., and Luke, W.: Seasonal and diurnal variations of atmospheric mercury across the US determined from AMNet monitoring data, Atmos. Chem. Phys., 12, 10569–10582, https://doi.org/10.5194/acp-12-10569-2012, 2012.
Lin, H., Tong, Y., Yin, X., Zhang, Q., Zhang, H., Zhang, H., Chen, L., Kang, S., Zhang, W., Schauer, J., de Foy, B., Bu, X., and Wang, X.: First measurement of atmospheric mercury species in Qomolangma Natural Nature Preserve, Tibetan Plateau, and evidence oftransboundary pollutant invasion, Atmos. Chem. Phys., 19, 1373–1391, https://doi.org/10.5194/acp-19-1373-2019, 2019.
Lindberg, S. E., Brooks, S., Lin, C. J., Scott, K. J., Landis, M. S., Stevens, R. K., Goodsite, M., and Richter, A.: Dynamic oxidation of gaseous mercury in the Arctic troposphere at polar sunrise, Environ. Sci. Technol., 36, 1245–1256, https://doi.org/10.1021/es0111941, 2002.
Loewen, M., Kang, S., Armstrong, D., Zhang, Q., Tomy, G., and Wang, F.: Atmospheric transport of mercury to the Tibetan Plateau, Environ. Sci. Technol., 41, 7632–7638, https://doi.org/10.1021/es0710398, 2007.
Lyman, S. N., Cheng, I., Gratz, L. E., Weiss-Penzias, P., and Zhang, L.: An updated review of atmospheric mercury, Sci. Total. Environ., 707, 135575, https://doi.org/10.1016/j.scitotenv.2019.135575, 2020.
Moulin, C. and Chiapello, I.: Evidence of the control of summer atmospheric transport of African dust over the Atlantic by Sahel sources from TOMS satellites (1979–2000), Geophys. Res. Lett., 31, L02107, https://doi.org/10.1029/2003gl018931, 2004.
Murphy, D. M., Hudson, P. K., Thomson l, D., Sheridan, P. J., and Wilson, J. C.: Observations of mercury-containing aerosols, Environ. Sci. Technol., 40, 3163–3167, https://doi.org/10.1021/es052385x, 2006.
Obrist, D., Moosmuller, H., Schurmann, R., Chen, L. W., and Kreidenweis, S. M.: Particulate-phase and gaseous elemental mercury emissions during biomass combustion: controlling factors and correlation with particulate matter emissions, Environ. Sci. Technol., 42, 721–727, https://doi.org/10.1021/es071279n, 2008.
Obrist, D., Kirk, J. L., Zhang, L., Sunderland, E. M., Jiskra, M., and Selin, N. E.: A review of global environmental mercury processes in response to human and natural perturbations: Changes of emissions, climate, and land use, Ambio, 47, 116–140, https://doi.org/10.1007/s13280-017-1004-9, 2018.
Okamoto, S. and Tanimoto, H.: A review of atmospheric chemistry observations at mountain sites, Prog. Earth Planet Sc., 3, 34, https://doi.org/10.1186/s40645-016-0109-2, 2016.
Pirrone, N., Cinnirella, S., Feng, X., Finkelman, R. B., Friedli, H. R., Leaner, J., Mason, R., Mukherjee, A. B., Stracher, G. B., Streets, D. G., and Telmer, K.: Global mercury emissions to the atmosphere from anthropogenic and natural sources, Atmos. Chem. Phys., 10, 5951–5964, https://doi.org/10.5194/acp-10-5951-2010, 2010.
Prospero, J. M., Ginoux, P., Torres, O., Nicholson, S. E., and Gill, T. E.: Environmental characterization of global sources of atmospheric soil dust identified with the Nimbus 7 Total Ozone Mapping Spectrometer (TOMS) absorbing aerosol product, Rev. Geophys., 40, 1002, https://doi.org/10.1029/2000rg000095, 2002.
Seigneur, C., Vijayaraghavan, K., Lohman, K., Karamchandani, P., and Scott, C.: Global source attribution for mercury deposition in the United States, Environ. Sci. Technol., 38, 555–569, https://doi.org/10.1021/es034109t, 2004.
Selin, N. E.: Global Biogeochemical Cycling of Mercury: A Review, Annu. Rev. Env. Resour., 34, 43–63, https://doi.org/10.1146/annurev.environ.051308.084314, 2009.
Sheu, G. R. and Mason, R. P.: An examination of methods for the measurements of reactive gaseous mercury in the atmosphere, Environ. Sci. Technol., 35, 1209–1216, https://doi.org/10.1021/es001183s, 2001.
Sprovieri, F., Pirrone, N., Bencardino, M., D'Amore, F., Carbone, F., Cinnirella, S., Mannarino, V., Landis, M., Ebinghaus, R., Weigelt, A., Brunke, E.-G., Labuschagne, C., Martin, L., Munthe, J., Wängberg, I., Artaxo, P., Morais, F., Barbosa, H. D. M. J., Brito, J., Cairns, W., Barbante, C., Diéguez, M. D. C., Garcia, P. E., Dommergue, A., Angot, H., Magand, O., Skov, H., Horvat, M., Kotnik, J., Read, K. A., Neves, L. M., Gawlik, B. M., Sena, F., Mashyanov, N., Obolkin, V., Wip, D., Feng, X. B., Zhang, H., Fu, X., Ramachandran, R., Cossa, D., Knoery, J., Marusczak, N., Nerentorp, M., and Norstrom, C.: Atmospheric mercury concentrations observed at ground-based monitoring sites globally distributed in the framework of the GMOS network, Atmos. Chem. Phys., 16, 11915–11935, https://doi.org/10.5194/acp-16-11915-2016, 2016.
Sun, R. Y., Sun, G. Y., Kwon, S. Y., Feng, X. B., Kang, S. C., Zhang, Q. G., Huang, J., and Yin, R. S.: Mercury biogeochemistry over the Tibetan Plateau: An overview, Crit. Rev. Env. Sci. Tec., 51, 577–602, https://doi.org/10.1080/10643389.2020.1733894, 2021.
Torres, O., Bhartia, P. K., Herman, J. R., Ahmad, Z., and Gleason, J.: Derivation of aerosol properties from satellite measurements of backscattered ultraviolet radiation: Theoretical basis, J. Geophys. Res.-Atmos., 103, 17099–17110, 1998.
Tsamalis, C., Ravetta, F., Gheusi, F., Delbarre, H., and Augustin, P.: Mixing of free-tropospheric air with the lowland boundary layer during anabatic transport to a high altitude station, Atmos. Res., 143, 425–437, https://doi.org/10.1016/j.atmosres.2014.03.011, 2014.
Wang, X., Lin, C.-J., Yuan, W., Sommar, J., Zhu, W., and Feng, X.: Emission-dominated gas exchange of elemental mercury vapor over natural surfaces in China, Atmos. Chem. Phys., 16, 11125–11143, https://doi.org/10.5194/acp-16-11125-2016, 2016.
Wang, Y. Q., Zhang, X. Y., and Draxler, R. R.: TrajStat: GIS-based software that uses various trajectory statistical analysis methods to identify potential sources from long-term air pollution measurement data, Environ. Modell. Softw., 24, 938–939, https://doi.org/10.1016/j.envsoft.2009.01.004, 2009.
Wright, L. P., Zhang, L. M., Cheng, I., Aherne, J., and Wentworth, G. R.: Impacts and Effects Indicators of Atmospheric Deposition of Major Pollutants to Various Ecosystems – A Review, Aerosol Air Qual. Res., 18, 1953–1992, https://doi.org/10.4209/aaqr.2018.03.0107, 2018.
Wu, Y., Wang, S. X., Streets, D. G., Hao, J. M., Chan, M., and Jiang, J. K.: Trends in anthropogenic mercury emissions in China from 1995 to 2003, Environ. Sci. Technol., 40, 5312–5318, 2006.
Xu, W., Xu, X., Lin, M., Lin, W., Tarasick, D., Tang, J., Ma, J., and Zheng, X.: Long-term trends of surface ozone and its influencing factors at the Mt Waliguan GAW station, China – Part 2: The roles of anthropogenic emissions and climate variability, Atmos. Chem. Phys., 18, 773–798, https://doi.org/10.5194/acp-18-773-2018, 2018.
Xuan, J., Liu, G. L., and Du, K.: Dust emission inventory in Northern China, Atmos. Environ., 34, 4565-4570, https://doi.org/10.1016/S1352-2310(00)00203-X, 2000.
Yin, X., Kang, S., de Foy, B., Ma, Y., Tong, Y., Zhang, W., Wang, X., Zhang, G., and Zhang, Q.: Multi-year monitoring of atmospheric total gaseous mercury at a remote high-altitude site (Nam Co, 4730 m a.s.l.) in the inland Tibetan Plateau region, Atmos. Chem. Phys., 18, 10557–10574, https://doi.org/10.5194/acp-18-10557-2018, 2018.
Yu, G. Y., Qin, X. F., Xu, J., Zhou, Q., Wang, B., Huang, K., and Deng, C. R.: Characteristics of particulate-bound mercury at typical sites situated on dust transport paths in China, 648, 1151–1160, Sci. Total Environ., https://doi.org/10.1016/j.scitotenv.2018.08.137, 2019.
Zhang, B., Tsunekawa, A., and Tsubo, M.: Contributions of sandy lands and stony deserts to long-distance dust emission in China and Mongolia during 2000–2006, 60, 487–504, Global Planet. Change, https://doi.org/10.1016/j.gloplacha.2007.06.001, 2008.
Zhang, H., Fu, X. W., Lin, C.-J., Wang, X., and Feng, X. B.: Observation and analysis of speciated atmospheric mercury in Shangri-La, Tibetan Plateau, China, Atmos. Chem. Phys., 15, 653–665, https://doi.org/10.5194/acp-15-653-2015, 2015.
Zhang, H., Fu, X., Lin, C.-J., Shang, L., Zhang, Y., Feng, X., and Lin, C.: Monsoon-facilitated characteristics and transport of atmospheric mercury at a high-altitude background site in southwestern China, Atmos. Chem. Phys., 16, 13131–13148, https://doi.org/10.5194/acp-16-13131-2016, 2016.
Zhang, H., Fu, X., Wang, X., and Feng, X.: Measurements and Distribution of Atmospheric Particulate-Bound Mercury: A Review, B. Environ. Contam. Tox., 103, 48–54, https://doi.org/10.1007/s00128-019-02663-5, 2019.
Zhang, L., Wang, S., Wang, L., Wu, Y., Duan, L., Wu, Q., Wang, F., Yang, M., Yang, H., Hao, J., and Liu, X.: Updated emission inventories for speciated atmospheric mercury from anthropogenic sources in China, 49, 3185–3194, Environ. Sci. Technol., https://doi.org/10.1021/es504840m, 2015.
Zhao, Z. Z., Cao, J. J., Shen, Z. X., Xu, B. Q., Zhu, C. S., Chen, L. W. A., Su, X. L., Liu, S. X., Han, Y. M., Wang, G. H., and Ho, K. F.: Aerosol particles at a high-altitude site on the Southeast Tibetan Plateau, China: Implications for pollution transport from South Asia, J. Geophys. Res.-Atmos., 118, 11360–11375, https://doi.org/10.1002/jgrd.50599, 2013.