the Creative Commons Attribution 4.0 License.
the Creative Commons Attribution 4.0 License.
 | 15 Oct 2021
Organic and inorganic bromine measurements around the extratropical tropopause and lowermost stratosphere: insights into the transport pathways and total bromine
Meike K. Rotermund
Vera Bense
Martyn P. Chipperfield
Andreas Engel
Jens-Uwe Grooß
Peter Hoor
Tilman Hüneke
Timo Keber
Flora Kluge
Benjamin Schreiner
Tanja Schuck
Bärbel Vogel
Andreas Zahn
Klaus Pfeilsticker
We report on measurements of total bromine (Brtot) in the upper troposphere and lower stratosphere taken during 15 flights with the German High Altitude and LOng range research aircraft (HALO). The research campaign WISE (Wave-driven ISentropic Exchange) included regions over the North Atlantic, Norwegian Sea, and northwestern Europe in fall 2017. Brtot is calculated from measured total organic bromine (Brorg) added to inorganic bromine (), evaluated from measured BrO and photochemical modeling. Combining these data, the weighted mean [Brtot] is 19.2±1.2 ppt in the northern hemispheric lower stratosphere (LS), in agreement with expectations for Brtot in the middle stratosphere (Engel and Rigby et al., 2018). The data reflect the expected variability in Brtot in the LS due to variable influx of shorter lived brominated source and product gases from different regions of entry. A closer look into Brorg and , as well as simultaneously measured transport tracers (CO and N2O) and an air mass lag time tracer (SF6), suggests that bromine-rich air masses persistently protruded into the lowermost stratosphere (LMS) in boreal summer, creating a high bromine region (HBrR). A subsection, HBrR∗, has a weighted average of [Brtot] = 20.9±0.8 ppt. The most probable source region is air recently transported from the tropical upper troposphere and tropopause layer (UT/TTL) with a weighted mean of [Brtot] = 21.6±0.7 ppt. CLaMS Lagrangian transport modeling shows that the HBrR air mass consists of 51.2 % from the tropical troposphere, 27.1 % from the stratospheric background, and 6.4 % from the midlatitude troposphere (as well as contributions from other domains). The majority of the surface air reaching the HBrR is from the Asian monsoon and its adjacent tropical regions, which greatly influences trace gas transport into the LMS in boreal summer and fall. Tropical cyclones from Central America in addition to air associated with the Asian monsoon region contribute to the elevated Brtot observed in the UT/TTL. TOMCAT global 3-D model simulations of a concurrent increase of Brtot show an associated O3 change of % in the LS and % near the tropopause. Our study of varying Brtot in the LS also emphasizes the need for more extensive monitoring of stratospheric Brtot globally and seasonally to fully understand its impact on LMS O3 and its radiative forcing of climate, as well as in aged air in the middle stratosphere to elucidate the stratospheric trend in bromine.
- Article
(10607 KB) - Full-text XML
- BibTeX
- EndNote


Bromine is thought to account for approximately one-third of the global stratospheric O3 depletion, and it is particularly effective at destroying O3 in the lowermost stratosphere (LMS) (e.g., Salawitch et al., 2005; Hossaini et al., 2015; WMO, 2018; Chipperfield et al., 2020). The LMS is defined as the atmospheric layer extending from the local tropopause (TP) to the potential temperature Θ=380 K isentrope, thereby excluding the tropics (Holton et al., 1995), and we define the lower stratosphere (LS) from the local TP up to the highest measurements of this study at Θ∼410 K. In the definition of the tropical tropopause layer (TTL), we follow Fueglistaler et al. (2009), i.e., for latitudes 27∘ N and S and potential temperatures Θ=355–425 K.
There are four major contributions to total bromine (hereafter called Brtot) in the troposphere, as suggested by previous research (e.g., Engel and Rigby et al., 2018): (1) CH3Br that has both natural and anthropogenic sources, with a contribution of 6.8 ppt to Brtot in 2016; (2) the four major halons consisting of H-1211 (CClBrF2), H-1301 (CBrF3), H-1202 (CBr2F2), and H-2402 (CBrF2CBrF2), all from anthropogenic activities and contributing 7.8 ppt to Brtot in 2016; (3) bromine compounds inferred from naturally emitted so-called very short-lived substances (BrVSLS); and (4) inorganic bromine previously released from brominated VSLS or sea salt, of which a fraction of both is eventually also transported into the stratosphere. Total organic bromine (Brorg) is the sum of contributions (1)–(3), while inorganic bromine defined here as (often referred to as Bry) consists of contribution (4).
The monitoring of CH3Br (e.g., Montzka et al., 2003) and the longer lived halons (e.g., Vollmer et al., 2016) is regularly performed by different observational networks, notably at NOAA (National Oceanic and Atmospheric Administration), UEA (University of East Anglia), and AGAGE (Advanced Global Atmospheric Gases Experiment; Prinn et al. (2018)), amongst others. Numerous observational and theoretical studies have addressed the variable contributions (3)–(4), which together are assessed to contribute 5±2 ppt to stratospheric bromine (e.g., Engel and Rigby et al., 2018, and references therein). These include studies performed from the ground, ships, manned and unmanned aircraft, and high-flying balloons at different locations/seasons and globally from satellites. In order to answer the question of how much bromine is in the stratosphere, detailed studies performed at the stratospheric entry in different regions and seasons are most suitable. However, additional studies addressing Brtot measurements in aged air of the middle and upper stratosphere at a given location and season are also crucial.
Many studies have occurred primarily in the tropics and the Asian monsoon during the convective season, where most of the stratospheric air is believed to enter (e.g., Holton et al., 1995; Fueglistaler et al., 2004 and Ploeger et al., 2015). Observational and theoretical studies addressing bromine at the stratospheric entry level in the tropics started well over 2 decades ago. Numerous dedicated research activities have taken place to investigate the fate of atmospheric bromine (e.g., Jensen et al., 2013; Harris et al., 2017 and Pan et al., 2017).
It is well known that contribution (3) to Brtot, the brominated VSLS summed up according to their Br atomicity (BrVSLS), is predominantly from marine emissions of CH2Br2 and CHBr3, with small contributions from other brominated hydrochlorobromocarbons (CH2ClBr, CHCl2Br, CHClBr2) (Engel and Rigby et al., 2018). Early measurements of CH2Br2 and CHBr3 at the tropical TP by Schauffler et al. (1993, 1998, 1999) indicated that both species may contribute substantially to Brtot (e.g., a few parts per trillion). More recent studies reported varying contributions of brominated VSLS in the tropical upper troposphere (UT) and TTL. The BrVSLS observations range from ppt in the tropical upper troposphere and tropopause layer (UT/TTL; e.g., Laube et al., 2008; Brinckmann et al., 2012; Sala et al., 2014; Wisher et al., 2014; Navarro et al., 2015; Wales et al., 2018; Engel and Rigby et al., 2018 and Adcock et al., 2021). A recent study by Keber et al. (2020) reported on aircraft measurements at the TP and in the LMS at middle and high northern latitudes during different seasons. They observed [BrVSLS] = 3.99±1.15 ppt in the 10 K below the TP in boreal late summer and fall 2012/2017 and [BrVSLS] = 5.20±1.25 ppt in December 2015–March 2016. Keber et al. (2020) ascribed the varying mixing ratios found for the major brominated VSLS at the local TP to the location and seasonality of their source strengths, transport pathways, and atmospheric lifetimes.
Some observations could also separately establish the magnitude of injection (contribution (4) to Brtot) into the stratosphere; namely Dorf et al. (2008) inferred = 2.1±2.6 ppt (over Kiruna in 1999) and 4.0±2.5 ppt (over northeastern Brazil in June 2005) from simultaneous stratospheric balloon soundings of Brorg and . Werner et al. (2017) found = 2.63±1.04 ppt in the TTL over the tropical eastern Pacific during the convective season in 2013. Koenig et al. (2017) inferred = 2.3−3.1 ppt in aged air masses in the TTL, and Wales et al. (2018) determined contribution (4) entering the stratosphere to be 2.1±2.1 ppt for the western Pacific during the convective season in 2014.
Probing the middle and upper stratosphere for relies on measurements of the major inorganic bromine species BrO and/or BrONO2 and suitable photochemical corrections for their ratio to . These measurements can occur from the ground (e.g., Hendrick et al., 2007, 2008, and others), from balloons (e.g., Harder et al., 1998, 2000; Pfeilsticker et al., 2000; Dorf et al., 2006b, 2008; Höpfner et al., 2009; Stachnik et al., 2013; Kreycy et al., 2013 and Wetzel et al., 2017), and/or from satellite platforms (e.g., Sinnhuber et al., 2005; Sioris et al., 2006; Hendrick et al., 2009; Rozanov et al., 2011 and Parrella et al., 2013). All these studies, though their accuracy varies, point to the following: the contribution from (3) and (4) in the upper stratosphere ranges from 3−7 ppt. Further, a decreasing trend of Brtot, reconcilable with decreasing contributions from (1) and (2), is discernible in aged stratospheric air until 2013 when the last balloon-borne Brtot measurements in the middle stratosphere were reported (Fig. 1-16 of Engel and Rigby et al., 2018).
Brtot and reactive bromine are even less explored in the LMS in midlatitudes for all seasons and the high-latitude LS in boreal summer. This region is particularly interesting since it comprises about 40 % of the stratospheric background air, though dynamically somewhat different from the tropical LS and “overworld” circulation of the global middle stratosphere (e.g., Holton et al., 1995; Bönisch et al., 2009; Birner and Bönisch, 2011; Gettelman et al., 2011; Ploeger et al., 2015 and Konopka et al., 2015). It has recently attracted renewed interest since an apparent ongoing O3 decrease is observed there, particularly in the Northern Hemisphere (NH) (e.g., Ball et al., 2018, 2019, 2020; Chipperfield et al., 2018, 2020). The continuing negative LS O3 trends may partly be related to increases of anthropogenic and natural VSLS and their inorganic products (e.g., Ball et al., 2018; Barrera et al., 2020). Simulations by Barrera et al. (2020) show that brominated VSLS have the largest impact on O3 destruction in spring, but the overall O3 loss in the LMS is largest in winter. On the other hand, others suggested that the changing transport is the main driver for the variability and trends in LS O3 (e.g., Chipperfield et al., 2018).
Further, it is well known that the following factors relevant for stratospheric Brtot may vary strongly with location and season: (a) the source strengths of VSLS and sea salt at the surface (e.g., Quack et al., 2004; Yokouchi et al., 2005; Warwick et al., 2006; Liang et al., 2010; Ordóñez et al., 2012; Ziska et al., 2013; Hossaini et al., 2012b, 2013, 2016; Wang et al., 2019, and many others); (b) the delivery of VSLS, their product gases, and eventually of halogens sourced from sea salt to the stratospheric entry level (e.g., Aschmann et al., 2009, 2011; Aschmann and Sinnhuber, 2013; Liang et al., 2014; Navarro et al., 2015; Hossaini et al., 2016; Schmidt et al., 2016; Fiehn et al., 2018; Filus et al., 2020; Adcock et al., 2021, and others); (c) the efficacy of removal of the halogenated product gases from the upper troposphere and lower stratosphere (UTLS) (e.g., Sinnhuber and Folkins, 2006; Aschmann et al., 2011; Aschmann and Sinnhuber, 2013); and (d) the transport of air into LMS via the two major pathways, i.e., by stratosphere–troposphere exchange (STE) at midlatitudes and the isentropic transport of air from the lower TTL into the LMS (e.g., Holton et al., 1995; Hoor et al., 2005; Bönisch et al., 2009; Ploeger et al., 2015; Konopka et al., 2015; Inai et al., 2019, and others). Therefore, it cannot be assumed ad hoc that the sum nor the speciation of the source and product gases for each halogen type (here of bromine) is spatially and temporally constant in the air masses of each transport pathway and hence the whole LMS.
The transport of air masses associated with the Asian monsoon anticyclone has recently attracted interest since it delivers pollutants and eventually VSLS to the LMS (e.g., Levine et al., 2007; Gettelman et al., 2011; Vogel et al., 2014, 2016; Orbe et al., 2015; Müller et al., 2016; Rolf et al., 2018 and Wetzel et al., 2021) but has not been studied extensively for bromine (Adcock et al., 2021). Studies such as those by Vogel et al. (2014) discuss the rapid (∼5-week) transport pathway of air masses from the southeastern Asia boundary layer to the LMS over northern Europe in September 2012 (spatially and seasonally similar to the current study). While bromine transport to the TTL has been observed in various studies, the continued transport to the LMS in boreal summer is still insufficiently investigated. In addition, it has been speculated that the varying source strengths, transport pathways, removal processes, and in particular the contributions from (3) and (4) to the LMS Brtot, may change with future climate change (e.g., Hossaini et al., 2012a; Falk et al., 2017 and Ziska et al., 2017). However, direct observations of this varying composition, amount of bromine, and its consequence for LMS O3 are still lacking.
The present study addresses the spatial variability of Brorg and in the NH UTLS during fall 2017 as part of the WISE (Wave-driven and ISentropic Exchange) campaign. Together with measurements of transport tracers (CO and N2O) and air mass age tracer (SF6), corroborated by Lagrangian chemistry transport model simulations, the major transport pathways of brominated VSLS and their product gases into the extratropical LS (Ex-LS), i.e., by STE at midlatitudes and isentropic transport from the tropical UT/TTL by planetary waves, are discussed. Our study of Brtot thus partly complements the recent study of Keber et al. (2020) on the contribution and origins of the different organic source gases to Brtot in the NH Ex-LS.
However, observational studies addressing Brtot around the UTLS may not directly relate to Brtot available in the middle stratosphere because of the variability and heterogeneity in the source strengths, the variable transformation and atmospheric transport of the brominated VSLS, and the amount of bromine inferred by the product gases and sea salt. In addition to this variability, the accuracies of the individual techniques (though they have been greatly improved over time) and the suspected small trend in stratospheric bromine from controlled substances ( ppt yr−1; Engel and Rigby et al., 2018) make it difficult to infer a trend in Brtot from measurements in the UT/TTL and LMS. Therefore, a continuation of high-precision Brtot measurements in aged and well-mixed air of the middle stratosphere is necessary in the coming decades, both for monitoring the contribution of the controlled bromine substances as well as the expected climate-change-induced changing contributions of VSLS and inferred to stratospheric Brtot.
The paper is organized as follows. The key instruments and methods along with some (necessary) data reductions are reported in Sect. 2. The WISE campaign measurements are described in Sect. 3. Inferred Brtot measurements are presented in Sect. 4.1, followed by their geographical distribution in the UTLS indicating their source regions in Sect. 4.2. Model results of transport pathways contributing to elevated Brtot air masses in the LMS are discussed in Sect. 4.3, and the consequences of this additional Brtot in the LMS on O3 are discussed in Sect. 4.4. Finally, our conclusions are summarized in Sect. 5.
The present study uses four instruments assembled on the German High Altitude and LOng range research aircraft (HALO). They are the mini-DOAS instrument for remote sensing measurements of O3, NO2, and BrO (Hüneke et al., 2017), FAIRO (Fast Airborne Ozone monitor) for the measurements of in situ O3 (Zahn et al., 2012), GhOST (Gas chromatograph for the Observational Studies using Tracers) for the in situ measurements of the organic brominated source gases (Sala et al., 2014) and SF6 mean air mass lag times (Bönisch et al., 2009), and UMAQS (University of Mainz Airborne QCL (quantum cascade laser) Spectrometer) for in situ measurements of air mass transport tracers N2O and CO (Müller et al., 2015; Kunkel et al., 2019). For the interpretation of our measurements regarding the chemistry and the transport of air masses, we use simulations by the Lagrangian chemistry transport model (CTM) CLaMS (Chemical Lagrangian Model of the Stratosphere) (e.g., McKenna et al., 2002b; Pommrich et al., 2014). In addition, the O3 loss caused by the transport of bromine-containing substances into the NH UTLS is simulated by the TOMCAT/SLIMCAT model (Chipperfield, 1999, 2006). Since all methods and tools have previously been described in detail in dedicated studies, only their major features are briefly summarized here.
2.1 Mini-DOAS measurements of O3, NO2, and BrO
The mini-DOAS instrument, operated by the University of Heidelberg on the HALO aircraft, is a remote sensing instrument consisting of UV–Vis–NIR six-channel optical spectrometers. The scattered skylight received from scanning limb and nadir directions can be analyzed for O3, NO2, and BrO (as well as a variety of other trace gases). In this study only the UV and visible channels (FOV (field of view) is 0.5∘ vertical, 3.15∘ horizontal) in the limb orientation are used. Therefore, the probed air masses are located perpendicular to the aircraft main axis on the starboard side, and the telescopes are continuously adjusted in flight to compensate for changes in the roll angle of the HALO aircraft for constant alignment with the flight altitude. Data collected from misaligned telescopes are excluded in the analysis. For extensive details of the HALO mini-DOAS instrument, see Hüneke (2016) and Hüneke et al. (2017), and references therein. For additional mini-DOAS measurements, see Werner et al. (2017) and Stutz et al. (2017), and for more details of the mini-DOAS measurements from HALO, see Kluge et al. (2020).
Puķīte and Wagner (2016)Aliwell et al. (2002)Hüneke et al. (2017)Hüneke et al. (2017)Table 1DOAS spectral analysis details for the various trace gases and their spectral fitting intervals. Refer to Table 2 for the corresponding fitted absorbers. The σdSCD values are typical errors in units of molecules per square centimeter.
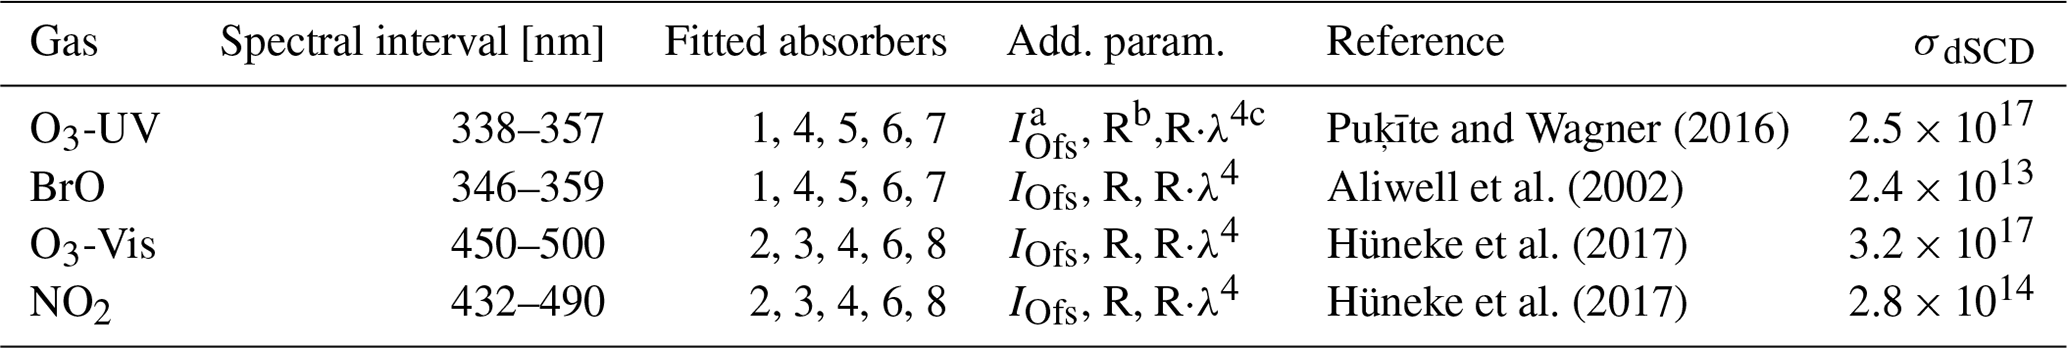
a IOfs: offset spectrum. b R: ring spectrum. c R⋅λ4: ring spectrum multiplied with λ4.
Table 2Spectral retrieval absorption cross sections used for the DOAS method analysis (Hüneke et al., 2017; Stutz et al., 2017). The solar I0 correction used is suggested in Aliwell et al. (2002).

The post-flight spectral analysis of the collected data for the detection of O3, NO2, and BrO is based on the DOAS method (differential optical absorption spectroscopy; Platt and Stutz, 2008). For the UV spectrometer retrieval of BrO differential slant column densities (dSCD), given in molecules per square centimeter, a fit window of 346−359 nm is used as suggested by Aliwell et al. (2002), i.e., a two-band fit of the vibrational transitions 4.0 and 5.0 of the ← electronic transition (Wilmouth et al., 1999). For O3-UV dSCDs, used as the corresponding scaling gas, a fit window of 338−357 nm is applied (Puķīte and Wagner, 2016). NO2 dSCDs from the visible channel spectrometer are evaluated between 432−490 nm (adjusted lower limit compared to Hüneke et al., 2017 because the wavelength range of the updated spectrometer changed, and therefore the lower wavelengths are removed to avoid instabilities). And O3-Vis dSCDs are evaluated between 450−500 nm (Hüneke et al., 2017). A summary of the trace gases and details of their absorption cross sections used for the DOAS analysis can be found in Tables 1 and 2. The dSCDs of each gas are calculated using an in-flight Fraunhofer reference spectrum, which is the same for the scaling and target gas (e.g., O3-UV and BrO, respectively). A running mean of five spectra (on average 158 s per running mean spectrum and corresponds to ∼31.6 km with a 1σ variability of 55 s) is used for BrO (and O3-UV) dSCD analysis to improve the signal to noise due to its low volume mixing ratios (VMRs), while for NO2 (and O3-Vis) each spectrum is evaluated individually (on average 12 s per spectrum corresponding to ∼2.4 km with a 1σ variability of 5 s). Outliers of selected individual dSCD data points that deviate by more than 5×10¹³, 1×10¹⁵, or 2×10¹⁸ molecules cm−2 (∼ 10 %–25 % jump) from the nine-point running mean for BrO, NO2, or O3, respectively, are averaged to remove unstable spectra. Typical dSCD errors of BrO, NO2, O3-UV, and O3-Vis can be found in the final column of Table 1. Additional settings for the DOAS analysis are described in detail in Hüneke et al. (2017).
The summation of the dSCD and a reference slant column density (SCDref), which accounts for the absorption in the Fraunhofer reference chosen from the flight, results in the total SCD (see Eq. (1) in Hüneke et al., 2017). The O3-UV SCDref is found by evaluating the Fraunhofer reference using an ozone-free external high-resolution absorption-free Sun spectrum from Chance and Kurucz (2010). The BrO SCDref is calculated using the quasi-linear relationship between BrO dSCDs and the absorption-free spectra (Chance and Kurucz, 2010) SCDs of O3-UV; any data points from the initial aircraft ascent and final descent as well as when the solar zenith angle (SZA) is >89∘ are removed. When inspecting the O3 vs. BrO relationship, an offset of BrO when there is no O3 present is identified and represents the unaccounted BrO absorption in the chosen Fraunhofer reference and hence is the BrO SCDref. In the visible channel, the NO2 and O3-Vis SCDrefs are both simulated using the Monte Carlo radiative transfer (RT) model (McArtim; Deutschmann et al. (2011)) because the inferred O3-Vis SCDs in the chosen visible wavelength range by the absorption-free spectrum from Chance and Kurucz (2010) are frequently unreliable. The initialization of the McArtim model is the same as for the scaling α factor simulations, i.e., from simulated CLaMS curtains of the respective gases.
For the retrieval of VMRs at flight altitude, the recently developed O3 scaling method is used, the details of which are discussed in Stutz et al. (2017), Hüneke et al. (2017), and Werner et al. (2017). For this method, the radiative transfer of each limb measurement is modeled using McArtim (Deutschmann et al., 2011) and considers the atmospheric, instrumental, and celestial (e.g., Sun position) parameters and geolocation as described in Hüneke et al. (2017). In the RT model, a combination of climatological profiles of the aerosol concentration are used, including EARLINET data (European Aerosol Research Lidar Network; Pappalardo et al., 2014) and SAGE III-ISS data (Stratospheric Aerosol and Gas Experiment III on the International Space Station; NASA/LARC/SD/ASDC, 2017). The a priori profile shapes of the scaling and target gases are taken from simulated trace gas VMR curtains along the flight track modeled by CLaMS (see Sect. 2.5 below). To remove any discrepancies between the CLaMS model and the real conditions, particularly when crossing a strong O3 gradient, the CLaMS results for all gases are vertically adjusted (up or down) to match the CLaMS O3 at flight altitude with the in situ O3 observed by FAIRO (see Sect. 2.2 below). This was done previously in Werner et al. (2017) and Stutz et al. (2017), who shifted the TOMCAT/SLIMCAT (see Sect. 2.6 below) model results to match the measured O3. The vertical shifting of CLaMS is on average ∼1 km, which corresponds to approximately one pressure–altitude grid box of the original CLaMS resolution and has a maximum shift of 2.5 km. These adjusted profiles are used by the RT model to calculate the trace gas absorption in the line-of-sight to the total absorption, i.e., the so-called α factors (see Stutz et al., 2017, or Hüneke et al., 2017, for a derivation).
Lastly, to retrieve the trace gas VMRs ([X]j) in an atmospheric layer j (i.e., at flight altitude for limb measurements), the scaling method equation is applied (see Stutz et al., 2017, or Hüneke et al., 2017):
where X represents the target gas (BrO or NO2 in this study), and P is the scaling gas (O3 in this study). The scaling method virtually compensates for any effects of the light path length modifications (e.g., scattering by aerosol and clouds) observed in the SCDs and includes instrumental, celestial, and climatological data mentioned above in the α factor. The of the target gas and of the scaling gas are wavelength-dependent, and therefore the target and scaling gas should have similar or largely overlapping wavelength fit windows (Table 1). However, for a given wavelength the α factor ratio is insensitive to scattering by aerosols and clouds due to the equivalence theorem (Irvine, 1964) as shown in simulations performed by Knecht (2015) or in the Supplement of Hüneke et al. (2017). The SCDX and SCDP are the total slant column densities of the target gas (BrO or NO2) and scaling gas (O3), respectively, evaluated from the mini-DOAS data. [P]j is the scaling gas VMR, which in this study is the in situ O3 as measured by the FAIRO instrument aboard HALO (see Sect. 2.2). The VMR of the target gas, [X]j, for these limb UV–Vis measurements is an average over a given atmospheric volume based on the distance the aircraft has traveled during a single measurement, over the FOV of the telescope to the right of the aircraft, and the light path length in the current conditions (for examples, see Figs. 2 and 6 of Kluge et al., 2020). Typical precision errors for the VMRs calculated by the O3 scaling method are ±0.6 ppt for BrO and ±8 ppt for NO2. For a detailed description and a breakdown of the error budget, refer to Hüneke et al. (2017).
2.2 FAIRO O3 measurements
The Fast AIRborne Ozone monitor (FAIRO) is a fully custom-built, lightweight, and compact O3 sensor (14 kg, 19 in. (∼48.3 cm) rack width, 13.5 cm high) operated by the Karlsruhe Institute of Technology. FAIRO combines (a) the absolute measurement by a two-channel UV photometer detecting the absorption of O3 in the Hartley band around 255 nm and (b) the detection with a fast chemiluminescence sensor (CL; >10 Hz) (Zahn et al., 2012). The CL sensor detects light emission from the reaction of O3 with an organic dye, coumarin (e.g., Ermel et al., 2013). The CL response is calibrated by the UV photometer, thus combining the accuracy of a UV photometer with the high measurement frequency of a CL detector. Typical 1σ measurement precision is 0.08 ppb for the UV spectrometer measuring at 0.25 Hz and 0.5 % for the CL detector measuring at 10 Hz. Accuracy for the UV spectrometer measurements is ∼1.5 % (mostly determined by the uncertainty of the O3 cross section). Throughout this study, the O3 from the CL method is used with the exception of one flight (on 9 October 2017 – RF11; refer to Sect. 3) for which the UV photometer method O3 is used as only partial CL O3 data were available.
2.3 GhOST measurements of brominated source gases, transport tracer SF6, and air mass lag time
The Gas chromatograph for the Observational Studies using Tracers (GhOST) instrument, operated by the University of Frankfurt, detects stable atmospheric trace gases. It has two gas chromatographic channels, one which is coupled to a mass spectrometer (MS; Agilent MSD 5975) and the other one to an electron capture detector (ECD) (e.g., Sala et al., 2014; Obersteiner et al., 2016; Keber et al., 2020). SF6 and CFC-12 (chlorofluorocarbon) are measured on the ECD channel with a time resolution of 60 s and a high precision of typically about 0.6 % for SF6 and 0.2 % for CFC-12, in a similar setup as used in Bönisch et al. (2009). The mean age of air can be inferred from SF6 measurements only if a single entry point can be assumed. As air masses observed during this study, i.e., the WISE campaign, are strongly influenced by transport of air from the NH midlatitudes and tropics, a direct derivation of mean age is not possible. Instead we use so-called lag time here, i.e., the time lag between the occurrence of a certain SF6 VMR in the UTLS with respect to the time when this mixing ratio was observed in the global mean. In addition, SF6 data are smoothed using a local correlation with the CFC-12 data (an atmospheric transport tracer) which has a higher precision. A total of 10 data points surrounding the measurement on both sides are used to determine the local correlation for each data point. This procedure retains the local information without introducing an offset to SF6 mixing ratios and removes some instrumental scatter. The lag time derived in this way has an overall precision better than 0.3 years and an estimated accuracy of 0.6 years. The global mean SF6 VMR used as a reference is lower than the NH VMRs. In particular, close to the TP, observed mixing ratios are often higher than those in the reference time series, resulting in negative lag times.
Table 3Bromine boundary conditions near the TP from various research studies for the Ex-TP and the tropical UT (Trop-UT) used to initialize the TOMCAT/SLIMCAT model. The base run uses the Ex-TP bromine boundary conditions along the entire TP for all latitudes. There are two further runs with elevated TP bromine initializations in the tropics (30∘ S–30∘ N, run 1 and run 2), while the extratropics are still set to the Ex-TP bromine boundary conditions as in the base run.
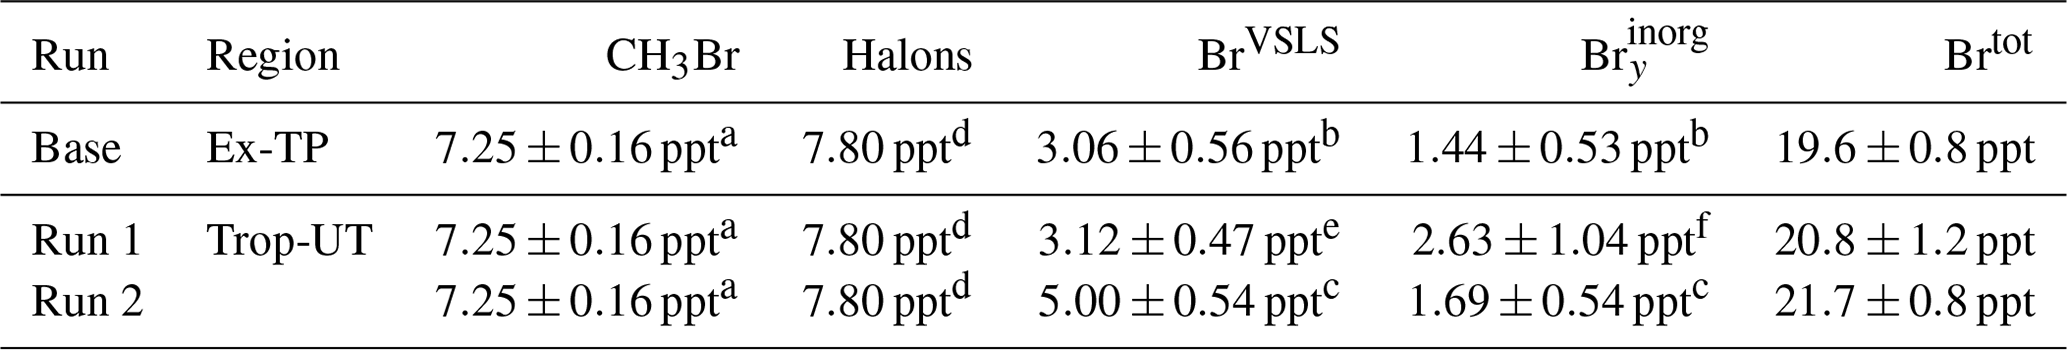
a Current study all data at the TP: K to WMO TP. b Current study Ex-TP: eq. latitude from N, K to WMO TP. c Current study Trop-UT (i.e., Θhigh–PVlow): Θ>355 K, PV < 2 PVU. d From WMO (2018) and cited by Keber et al. (2020). e Navarro et al. (2015), average from eastern and western Pacific. f Werner et al. (2017) and Koenig et al. (2017).
The second channel measures bromocarbons and other halogenated species with cryogenic enrichment (Obersteiner et al., 2016), gas chromatographic separation, and mass spectrometric detection with a time resolution of 4 min (Sala et al., 2014). Atmospheric mixing ratios of CH3Br and the halons H-1301, H-1211, and H-2402, as well as the short-lived bromocarbons (CH2Br2 and CHBr3), are reported on the scales used in the AGAGE network (Prinn et al., 2018). Mixed bromochlorocarbons (CH2BrCl, CHBr2Cl, and CHBrCl2) and H-1202 are calibrated based on intercalibration experiments with the UEA. Due to a decrease of CH3Br in the calibration gas and poor signal-to-noise ratios for this compound, a correlation between H-1211 and CH3Br measured during the PGS (three-part mission: POLSTRACC (Polar Stratosphere in a Changing Climate), GW-LCYCLE (Investigation of the Life cycle of gravity waves), and SALSA (Seasonality of Air mass transport and origin in the Lowermost Stratosphere)) campaign has been used. This correlation leads to a scaling of 12.5 % so as to arrive at typical tropospheric mixing ratios of CH3Br observed in the NH in 2017, and then these are applied to the data of the current study. Typical detection limits for the different substances during WISE are given in Keber et al. (2020). The 1σ scatter (the standard deviation) of Brorg measurements in a 10 K potential temperature interval directly below the TP is ±0.81 ppt (4 %), which includes the precision of the measurement, as well as the atmospheric variability (Sala et al., 2014).
2.4 UMAQS measurements of N2O and CO transport tracers
The University of Mainz Airborne QCL (quantum cascade laser) Spectrometer (UMAQS) is operated by the University of Mainz. It simultaneously measures nitrous oxide (N2O) and carbon monoxide (CO) from the HALO aircraft. The instrument is in situ-calibrated against secondary standards, which are compared to NOAA primary standards before and after the campaign. It uses direct absorption of infrared radiation at 2200 cm−1 using a Herriott cell with a 76 m light path at 50 hPa. Measurements are recorded with a frequency of 1 Hz, and the total uncertainty during this study was determined to be 0.18 ppb for N2O and 0.9 ppb for CO. These tracers are used for the interpretation of air mass transport around the UTLS during this study. For more details, refer to Müller et al. (2015) and Kunkel et al. (2019).
2.5 Lagrangian modeling by CLaMS
The Chemical Lagrangian Model of the Stratosphere (CLaMS) is developed at Forschungszentrum Jülich in Germany. It is a Lagrangian CTM (McKenna et al., 2002a, b; Pommrich et al., 2014, and references therein), which utilizes wind and temperature data of the ECMWF (European Centre for Medium-Range Weather Forecasts) from ERA-Interim reanalysis data (Dee et al., 2011). CLaMS is particularly good at portraying the gradients of trace gases and the transport of air parcels, especially in the region of transport barriers, for example near the extratropical tropopause (Ex-TP) due to its Lagrangian nature (e.g., Vogel et al., 2011, 2016). The simulations are initialized with Aura-MLS (Microwave Limb Sounder) measurements of O3, CO, HCl, and N2O, along with ACE-FTS (Atmospheric Chemistry Experiment – Fourier Transform Spectrometer) satellite data tracer–tracer correlations of N2O and CH4, CFC-11, CFC-12, and NOy. NOy is the sum of the gas-phase NO, NO2, 2×N2O5, HNO3, ClONO2, and HNO4. Further details of the initialization procedure are described in Grooß et al. (2014). The simulation used here starts on 1 May 2017 and has a horizontal resolution of 100 km.
The bromine chemistry in the simulations is set up to optimally reproduce reactions in the stratosphere but lacks accuracy for photochemical processes in the troposphere as the heterogeneous reactions of brominated species on ice and liquid water are not yet implemented (Grooß et al., 2014). Also, only long-lived is part of the simulation, and bromine compounds from VSLS are considered to already be converted to . This may cause offsets in , but nevertheless, ratios like BrO/ are reasonably determined by this method.
Trace gas curtains along the flight tracks have been derived for each flight of the WISE campaign. These curtains are defined by the latitude, longitude, and time of the flight track for many altitudes. CLaMS model information for these points was achieved using back-trajectories to the model output time of the previous day at 12:00 UTC. The chemical composition from the 3-D CLaMS simulation is then interpolated to the trajectory endpoints; subsequently the CLaMS chemistry is calculated forward in time along these trajectories to determine the chemical composition along the given curtain. The CLaMS curtains has a 1 min temporal resolution (corresponding to ∼13 km) and 41 pressure levels between 10−1000 hPa. For the present study, CLaMS curtains are used as input for the RT simulations for the mini-DOAS data analysis (see Sect. 2.1). These simulated trace gas mixing ratios along the flight track are used for direct comparisons with the measured data of O3, NO2, and BrO, and the simulated BrO/ partitioning coefficient is used to infer measured from mini-DOAS BrO data.
In previous studies, different kinds of artificial tracers have been implemented in CLaMS to identify the transport pathways and to quantify the transport of air masses from defined domains/regions to other locations of the atmosphere considering advection and mixing (e.g., Vogel et al., 2011, 2019). To compare the WISE measurements with the CLaMS artificial tracers, the simulations are interpolated in space and time to the position of the HALO flight track using CLaMS trajectories (started every second along the flight track). In this study we use two different kinds of artificial tracers. The first kind is an artificial air mass origin tracer initialized on 1 May 2017 approximately 5 months prior to the WISE campaign. The air mass origin tracers mark nine distinct 3-D domains in the entire model atmosphere: the tropical troposphere, upper and lower TTL, tropical pipe, midlatitudinal troposphere and LMS, polar troposphere and LMS, and lastly the stratospheric background. These are used to study vertical and horizontal transport of these air masses to the LMS in the NH within 5 months. Divisions of the air mass origin domains are described in further detail in Table 1 and Fig. 4 of Vogel et al. (2011).
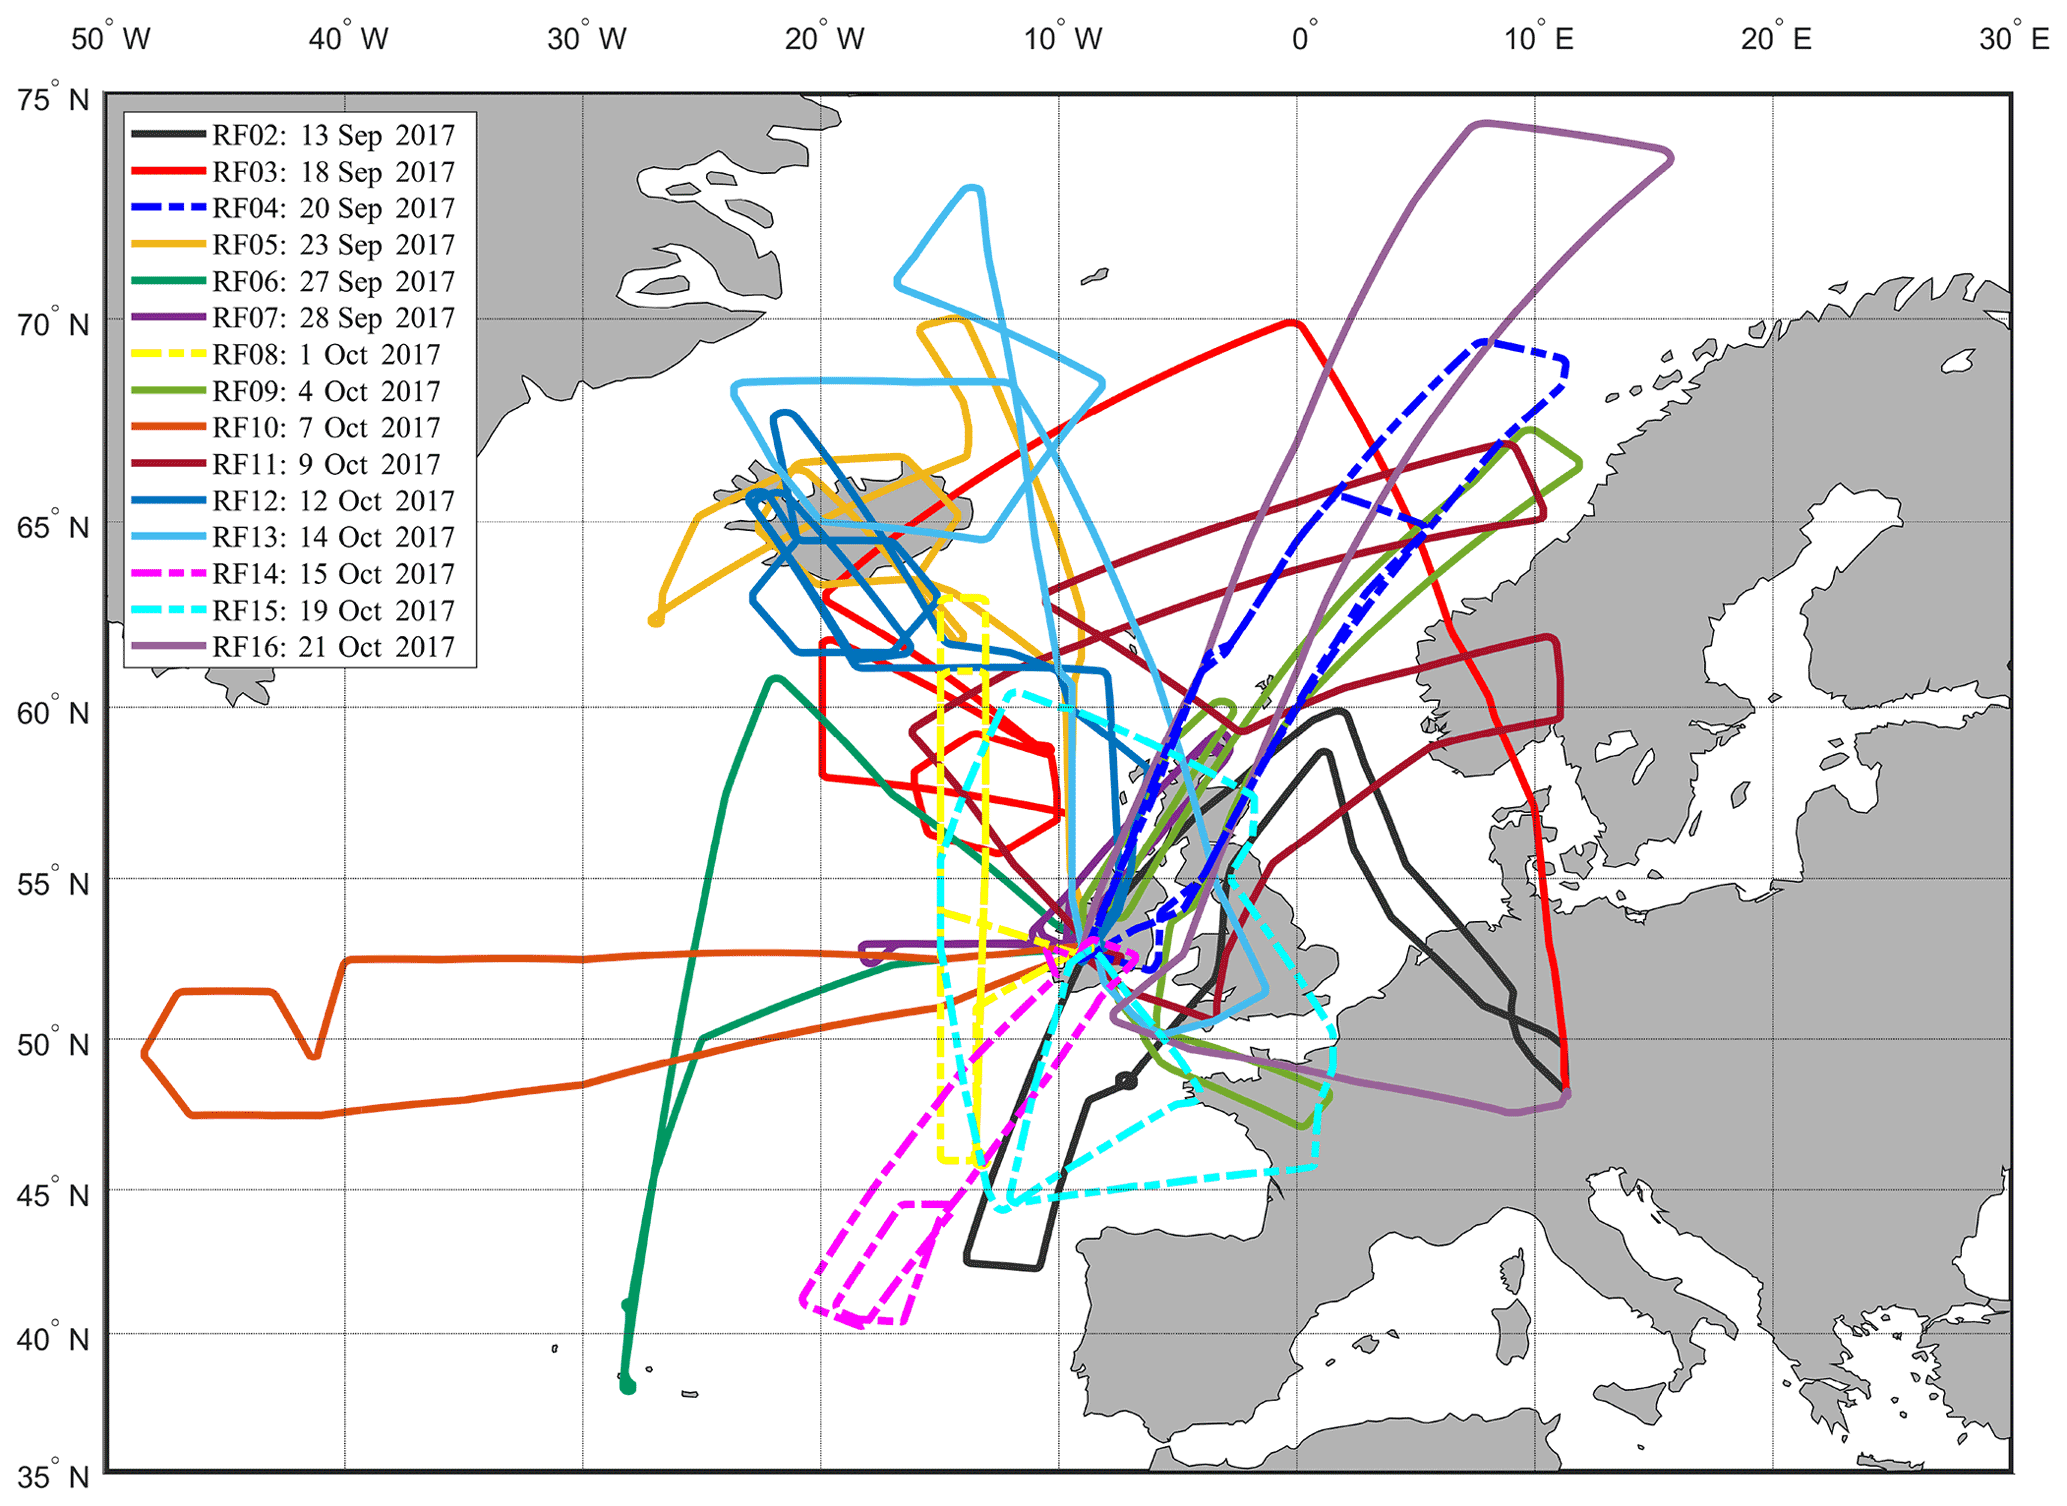
Figure 1Trajectories of the 15 HALO flights during the WISE campaign in the midlatitudes to high latitudes over the North Atlantic Ocean, Norwegian Sea, and northwestern Europe in the UTLS from 13 September until 21 October 2017. A prior test flight (RF01) is not included in this study. The first research flight, RF02, was conducted locally from the home base in Oberpfaffenhofen, Germany, and all subsequent flights were based from Shannon, Ireland, aside from the transfer flights. The flights illustrated by the dashed lines, i.e., RF04 (blue), RF08 (yellow), RF14 (magenta), and RF15 (cyan), are discussed in the text.
The second kind is an artificial tracer that marks specific regions in the CLaMS model boundary layer referred to as surface emission tracers, and these are used here to study the transport of young air masses into the LMS in the NH. In contrast to the air mass origin tracers discussed above which are initialized once on 1 May 2017, the different surface emission tracers are continuously released (every 24 h) in the model boundary layer (2−3 km above the surface following orography) from the start of the simulation on 1 May 2017 (for more details, see Vogel et al., 2015, 2019). The surface emission tracers are divided into 24 surface regions (see Fig. 9 below) defining relatively small regions in southeastern Asia to study in particular the influence of air masses from the Asian monsoon and its adjacent tropical regions on transport into the LMS. Moreover, in this study, the entire Earth's surface is covered by surface emission tracers. For some regions, coastlines or orography (both provided by ECMWF) are used as criteria to define the boundaries between different regions. The same setup for the surface emission tracers was already used for WISE measurements in Wetzel et al. (2021).
2.6 Chemical transport modeling by TOMCAT/SLIMCAT
The TOMCAT/SLIMCAT (hereafter TOMCAT) 3-D offline global CTM (Chipperfield, 1999, 2006) is used here for the interpretation of the transport of trace gases from the tropical UT/TTL and Ex-TP regions into the LMS and to assess the corresponding O3 loss. Similarly to CLaMS, the TOMCAT model is driven by meteorology (e.g., horizontal winds, temperature, surface pressure, and convective mass fluxes) from ECMWF ERA-Interim reanalysis (Dee et al., 2011), with no feedback of the chemistry on the dynamics. In the setup used here, the model employs a hybrid vertical coordinate with terrain-following sigma levels near the surface and pressure levels at higher altitudes. Large-scale vertical motion is calculated from the divergence of the horizontal winds. In our simulations, the model uses a detailed stratospheric chemistry scheme TOMCAT (e.g., see Chipperfield et al., 2018) with photochemical information from JPL-2015 (Sander et al., 2011). The O3 loss reactions are described in Werner et al. (2017) Appendix A.
The simulations used here were initialized from a multidecadal control simulation which started in 1977 (Dhomse et al., 2019). Output from this run on 1 January 2016 was used to initialize a series of sensitivity runs. These simulations calculated the chemistry and dynamics in 15 min time increments over a high horizontal resolution of with 36 unevenly spaced vertical levels with an altitude range from the surface to around 63 km. The simulations continued until the end of the WISE campaign in late October 2017, i.e., 22 months' integration time.
Initial constraints for the brominated species in the UT are given in Table 3. We have performed three different TOMCAT sensitivity runs from January 2016: a base run followed by two runs with elevated bromine constraints. The base run initializes the model with constant bromine contributions along the entire TP with the Ex-TP boundary conditions of [Brtot] = 19.6 ppt. The additional two runs continue to use the Ex-TP conditions in the extratropics, while elevated bromine in the form of BrVSLS and is initialized in the tropical UT for two differing scenarios. Run 1 uses BrVSLS constraints from Navarro et al. (2015) and from Werner et al. (2017), resulting in [Brtot] = 20.8 ppt for the tropical UT. Run 2 uses BrVSLS and VMRs from the current study in the tropical UT/TTL, resulting in [Brtot] = 21.7 ppt. These runs, with differing bromine VMRs in the tropical UT but with constant Ex-TP constraints, simulate different air masses being transported into the LMS. Comparison of the model runs allows for the diagnosis of the impact of the differing bromine levels on the O3 levels in this region.
For the present study, we analyze simultaneous measurements of bromine collected during 15 flights on the German HALO research aircraft during the WISE campaign based from Shannon, Ireland. Specific topics of interest during WISE include the transport pathways, timescales, and mixing processes affecting the late summer and fall in the UTLS. A particular focus was the role of the transport of air from the TTL and Asian monsoon region in H2O and trace gas budgets, including VSLS and their product gases in the LMS, as well as small-scale processes leading to irreversible exchange across the Ex-TP by Rossby wave-breaking events (Homeyer and Bowman, 2013).
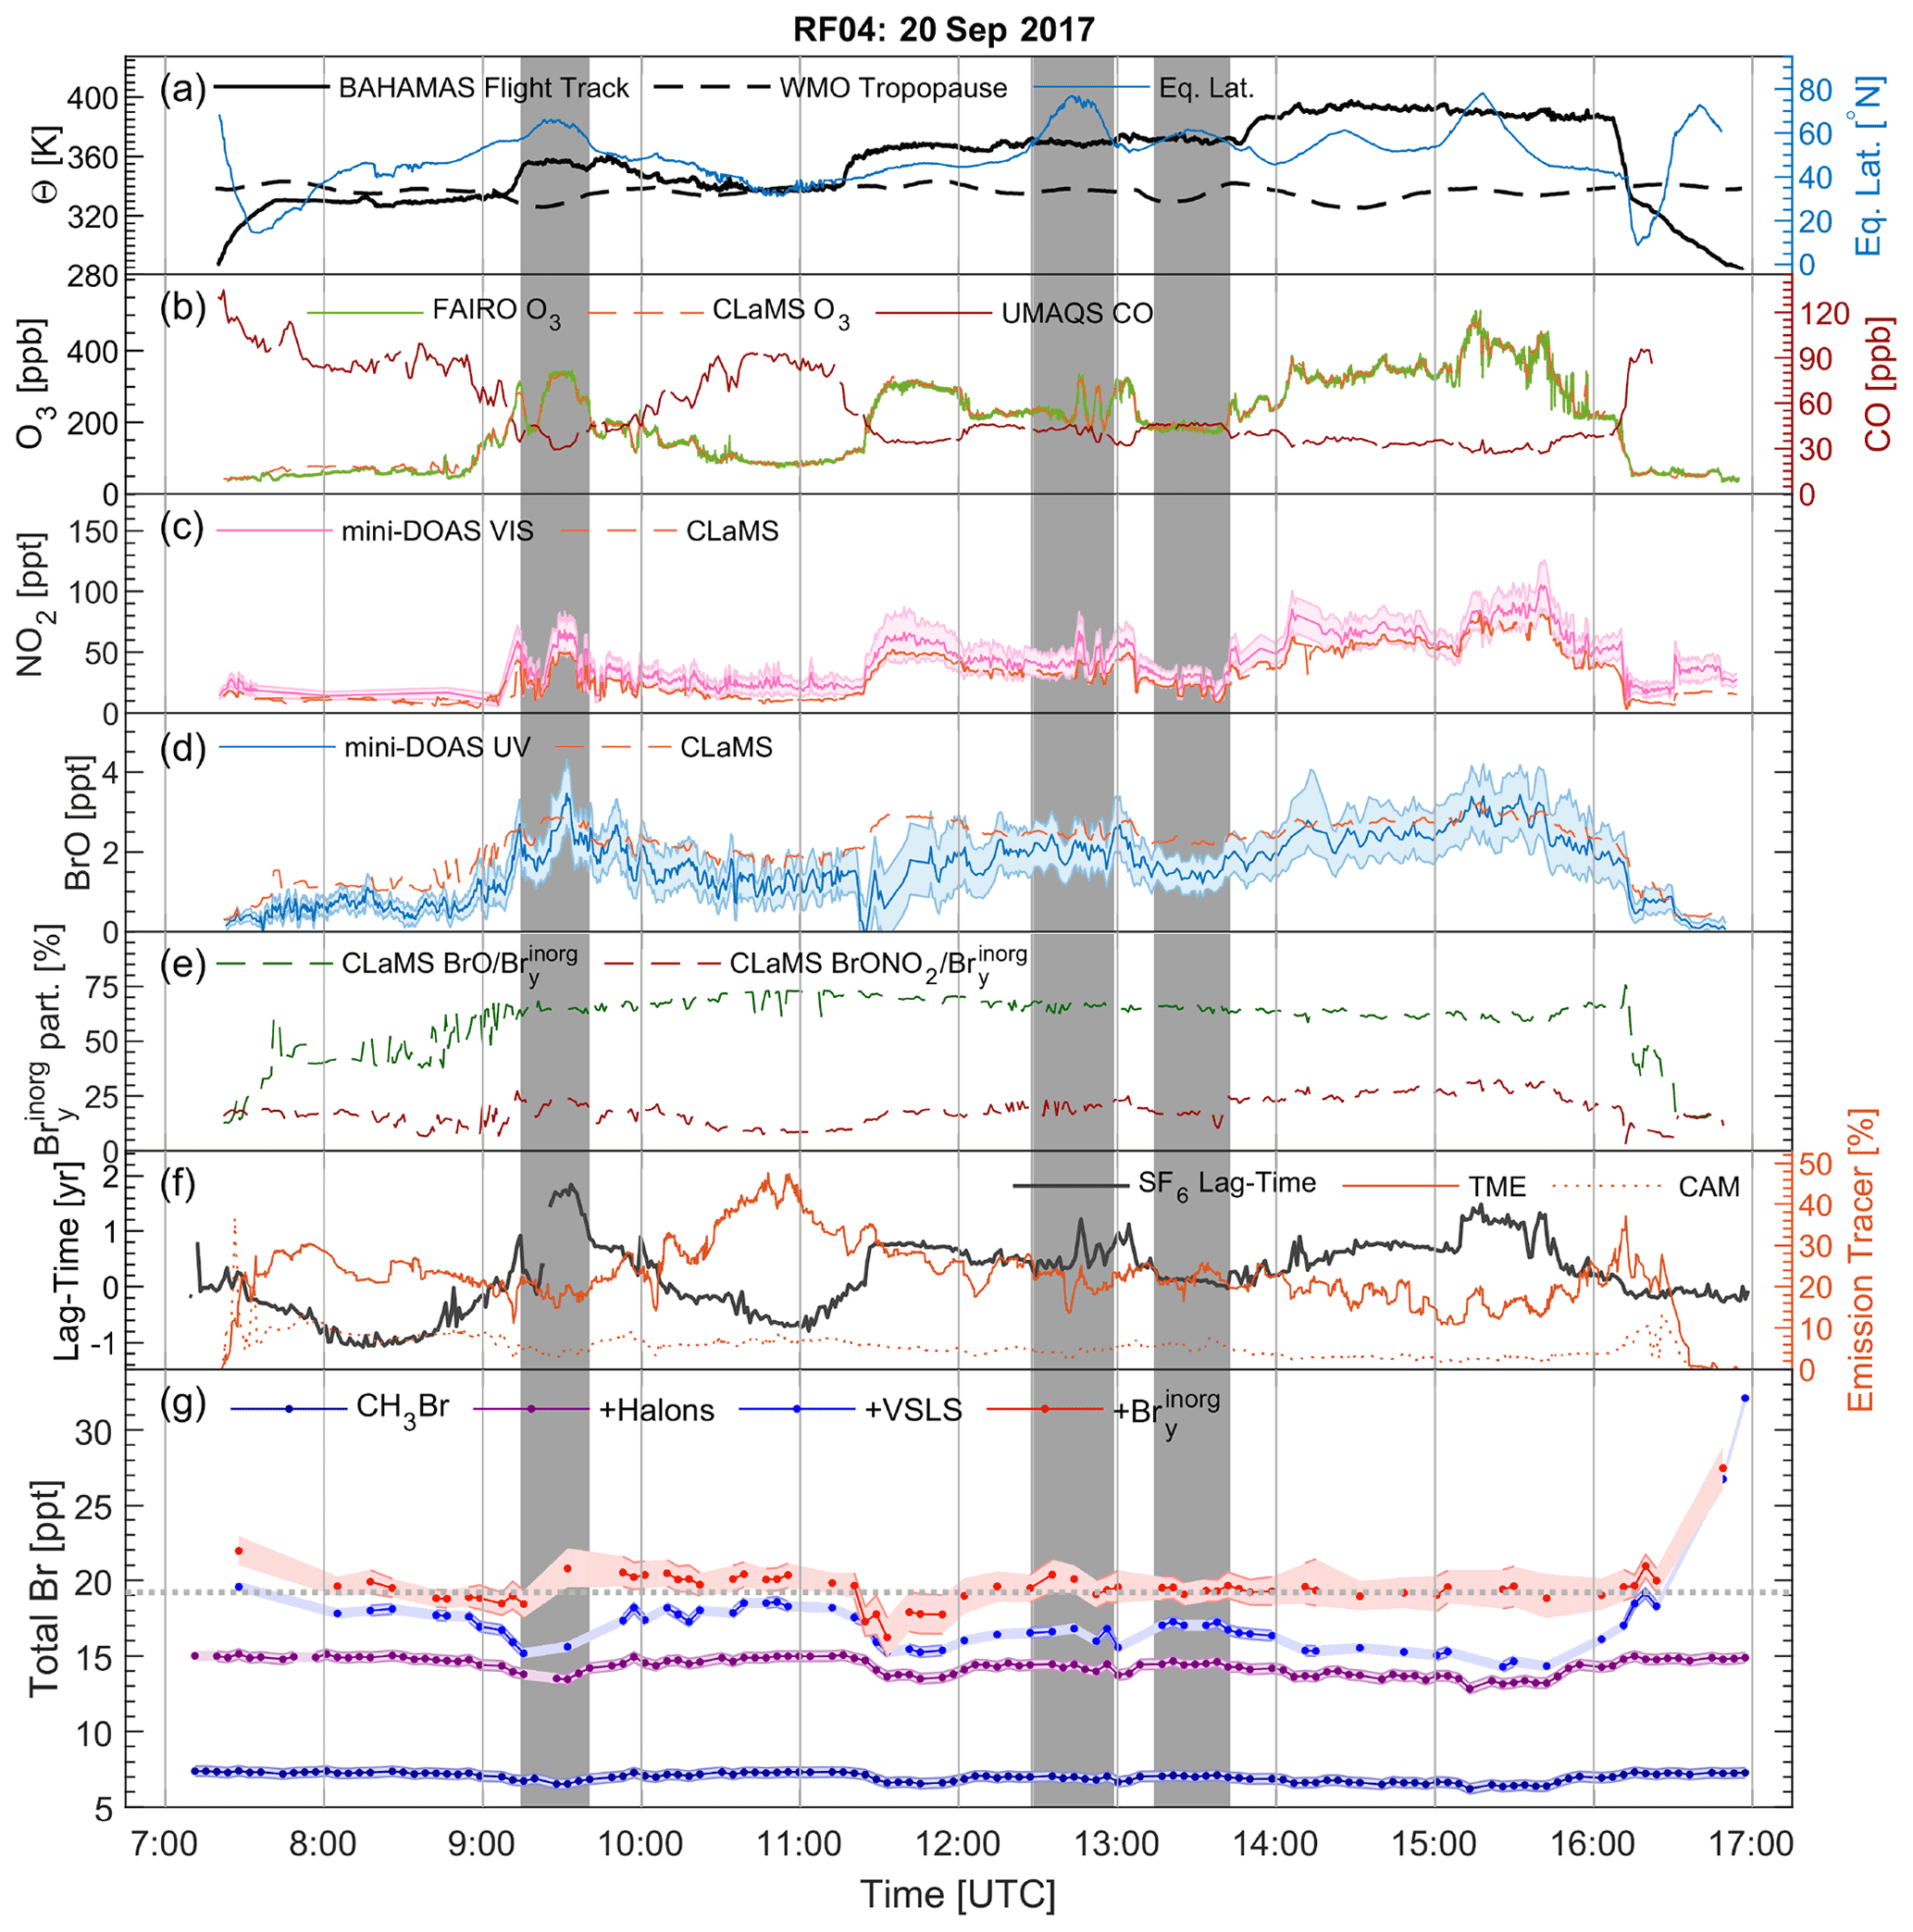
Figure 2Overview of HALO RF04 on 20 September 2017 (dashed blue flight track in Fig. 1). The potential temperature of the flight trajectory and WMO TP (solid and dashed black lines, respectively) and equivalent latitude (solid blue line, right axis) are shown in (a). The following panels show (b) FAIRO-measured (solid green) and vertically adjusted CLaMS-modeled (dashed orange) O3 VMR as well as the UMAQS-measured CO (dark red line, right axis); (c) mini-DOAS-measured (solid pink) and vertically adjusted CLaMS-modeled (dashed orange) NO2 VMR; (d) mini-DOAS-measured (solid blue) and vertically adjusted CLaMS-modeled (dashed orange) BrO VMR; (e) vertically adjusted CLaMS-simulated ratios of (dashed green) and (dashed dark red); (f) the mean lag time of air inferred from GhOST's SF6 measurements (solid black line) as well as the CLaMS emission tracers from the TME (tropical marine environment) in southeastern Asia and the CAM (Central America) region (solid and dotted orange line, respectively on the right axis); and (g) GhOST-measured CH3Br (blue), to which the VMRs of the halons (purple), brominated VSLS (light blue), and inferred (red) are subsequently added. The gray dotted line in (g) represents the campaign LS weighted average of [Brtot] = 19.2±1.2 ppt. Dark gray shading indicates flight sections in the high bromine region (HBrR) between eq. latitudes N and Θ=350–385 K, as discussed in the text.
The research flights in this study, RF02–RF16, were conducted from 13 September until 21 October 2017 with the majority of the ∼140 flight hours probing the extratropical UTLS in midlatitudes to high latitudes over the North Atlantic, Norwegian Sea, and northwestern Europe. The flight tracks are shown in Fig. 1, with a few research flights emphasized by dashed lines, to be discussed in more detail below. The flights were mainly during daytime, but three take-offs and six landings were near sunrise/sunset or in the dark. The trace gas measurements of O3, N2O, CO, and SF6 are available for all research flights. NO2, BrO, and VMRs are also available for all flights, however only at SZA < 89∘. Brorg VMRs are not available during four flights (RF07, RF09, RF14, and RF15), and during three other research flights (RF02, RF06, and RF11) Brorg VMRs are only available for a portion of the flight time. As such, inferred Brtot measurements are available for 11 of the 15 WISE research flights.
The measurement region ranged from longitudes of 48.4∘ W–15.7∘ E and latitudes of 37.9–74.4∘ N. In equivalent latitudes (Butchart and Remsberg, 1986), the investigated air masses ranged from those being recently transported from the tropics ( S) up to 86∘ N. The equivalent latitude describes an enclosed area relative to the area of the globe of specific potential vorticity on a given potential temperature contour and is a useful quasi-Lagrangian coordinate for the interpretation of tracers in the stratosphere (Pan et al., 2012). The majority of the flight time was spent at altitudes between 8.5−14.5 km, allowing for measurements in the UTLS and crossing the TP frequently. The maximum potential temperature reached was Θ=410 K, allowing for observations throughout the LS.

Figure 3Overview of HALO RF08 on 1 October 2017 (dashed yellow flight track in Fig. 1). Panels (a–g) are as given in Fig. 2. Light gray shading indicates flight sections in the tropical Θhigh–PVlow region (Θ>355 K and PV < 2 PVU, i.e., former tropical UT/TTL air), and the dark gray shading indicates flight sections in the HBrR as discussed in the text. At SZA > 89∘, mini-DOAS measurements (NO2, BrO, and ) are unavailable due to the lack of skylight.
Two flights are chosen as examples. One has typical Brtot mixing ratios near the campaign LS average, along with a few segments observing elevated Brtot in the LMS (RF04; Fig. 1, dashed blue line). The other has elevated Brtot from former tropical UT air masses (RF08; Fig. 1 dashed yellow line).
The first sample flight, RF04, on 20 September 2017, consisted of two different length, but overlapping, rectangular shuttles northeast of Ireland up the Scandinavian coast, over the Norwegian Sea, and only briefly crossing land masses over the United Kingdom and Ireland (see Figs. 1 and 2). The flight track reached a maximum latitude of 69.4∘ N and longitude of 11.2∘ E. The final stretch back to Shannon was flown at the highest altitude during this flight of 14.35 km and reaching a maximum potential temperature of Θ=399 K, corresponding to ΔΘ=71 K above the WMO (World Meteorological Organization) TP. The BAHAMAS (BAsic HALO Measurement And Sensor system) flight level (solid black line) and WMO TP (dashed black line) are shown in potential temperature in kelvin along with the equivalent latitude (blue, right axis) in Fig. 2a. The TP was crossed a few times, but the majority of the flight time was spent in the LMS. The mean lag time of the air masses ranged from −1.08 to 1.85 years (Fig. 2f). The negative mean air mass lag times are due to higher SF6 VMRs near the NH source regions (compared to the global mean) and in particular in the upper levels of the tropical TP region. This flight is chosen as a sample flight of Brtot mixing ratios near the LS campaign average, as well as flight segments within the LMS region with elevated bromine, indicated by the dark gray shading discussed in Sect. 4.2.
The second sample flight, RF08, on 1 October 2017, probed the remnants of Hurricane Maria. This flight consisted of two overlapping rectangular shuttles southwest of Ireland over the Celtic Sea and North Atlantic Ocean (see Figs. 1 and 3). The latitudes ranged from N, while the longitudes of the rectangular patterns ranged between W. The highest altitude during this flight was 14.36 km. The maximum potential temperature reached was Θ=398 K, which also corresponds to the furthest distance above the WMO TP with ΔΘ=84 K. As during all WISE flights, the TP was crossed several times shown in Fig. 3a, with the mean lag time ranging from −1.10 to 1.96 years (Fig. 3f). Large sections of this flight observed subtropical as well as former tropical UT/TTL air masses. These air masses transported from the tropics with high potential temperature (Θ>355 K) and low potential vorticity units (< 2 PVU) are from here on called tropical Θhigh–PVlow air, indicated by the light gray shading. The different mixing regimes observed between air masses during this flight are discussed in detail by Schäfler et al. (2021). This flight is chosen representing the variety of air masses observed during WISE, resulting in elevated Brtot mixing ratios, largely due to the more abundant VSLS in the tropical Θhigh–PVlow air.
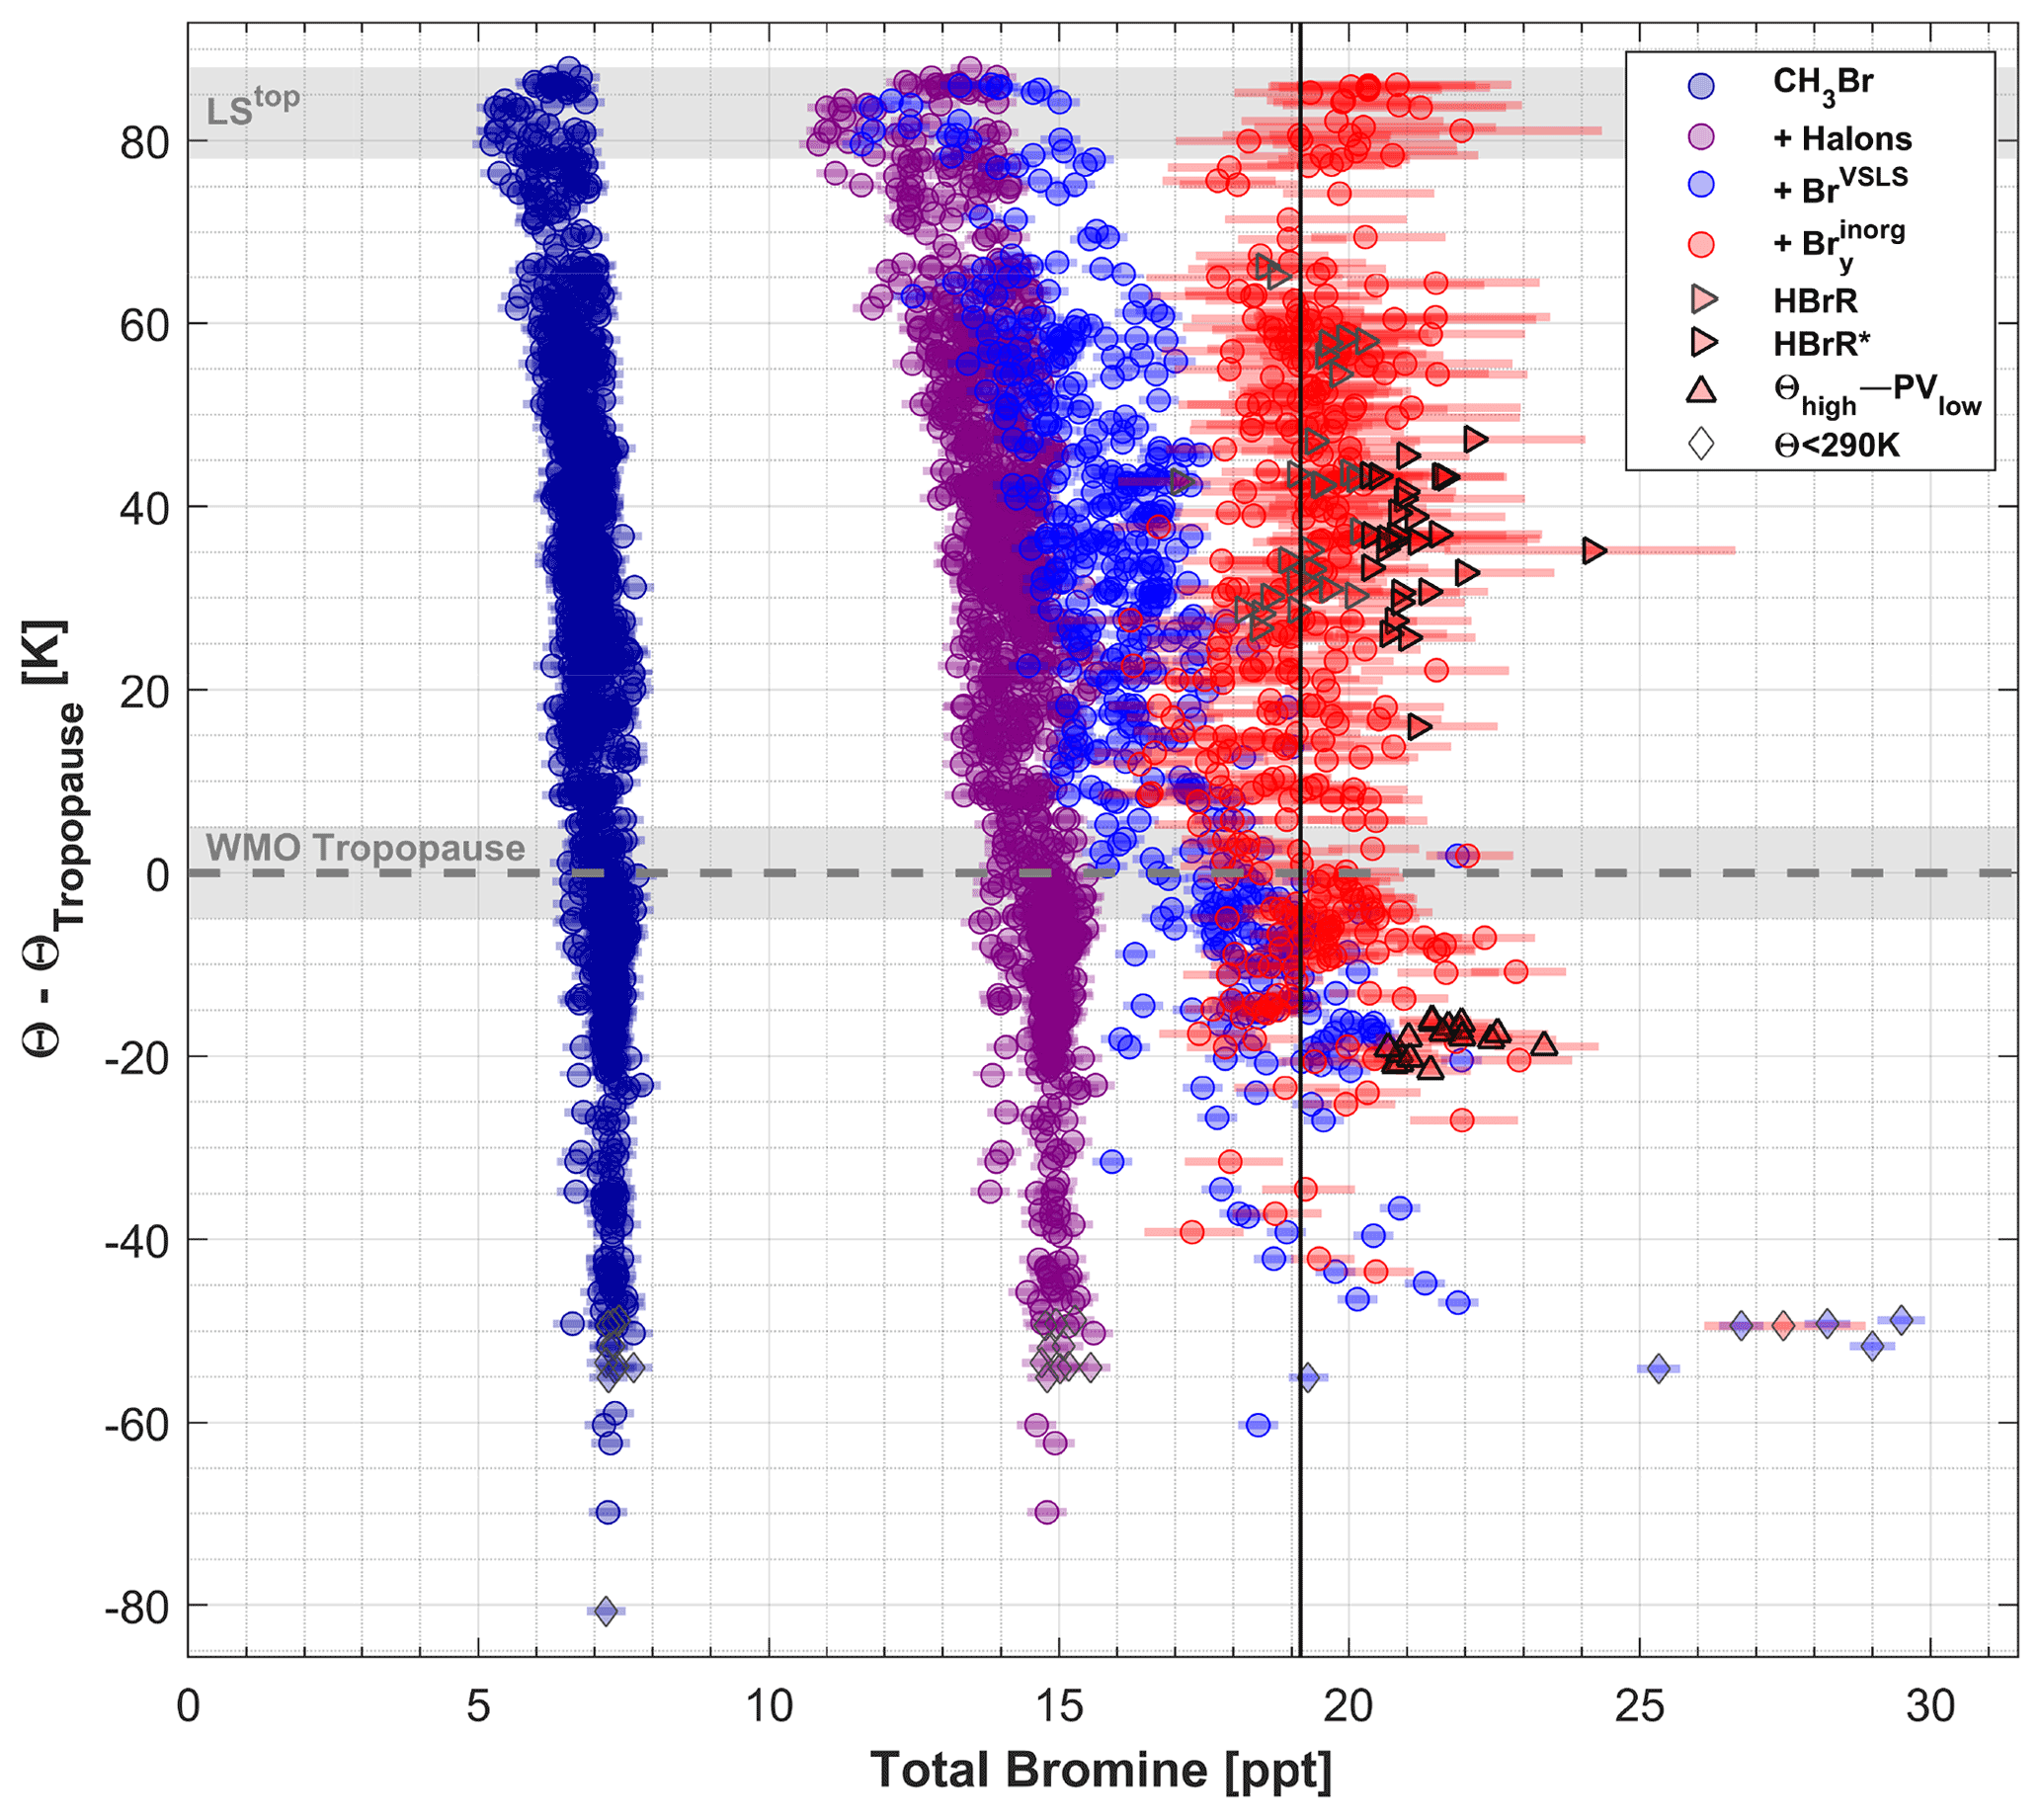
Figure 4Inferred total bromine, Brtot, as a function of potential temperature distance from the WMO TP [K] during the WISE campaign in fall 2017. The Brorg species are summed up according to their Br atomicity: CH3Br (dark blue), four halons (purple), and brominated VSLS (light blue). The inferred is subsequently added (red), resulting in the UTLS Brtot. The solid black line represents the LS weighted mean of [Brtot] = 19.2±1.2 ppt (1σ variability). The Brtot measurements from the high bromine region (HBrR) are indicated by right-pointing (gray- and black-edged) triangles (weighted mean [Brtot] = 19.9±1.2 ppt). The measurements within the HBrR that are larger than the LS mean by at least 1σ labeled HBrR∗ are indicated by the black-edged right-pointing triangles alone (mean [Brtot] = 20.9±0.8 ppt). Measurements in tropical Θhigh–PVlow air are depicted by the upward-pointing black-edged triangles (mean [Brtot] = 21.6±0.7 ppt). Measurements from near the surface during takeoff or landing, i.e., Θ<290 K, are depicted by the gray-edged diamond symbols, which include the VSLS mixing ratios >25 ppt in the lower right corner. The bottom and top gray shaded layers indicate the TP region ( K) and the LStop region (upper LS measurements: ΔΘ=78–88 K), respectively.
Figures 2 and 3 provide overviews of the O3 measured by FAIRO, CO measured by UMAQS, the organic bromine measured by GhOST-MS, and NO2 and BrO measured by mini-DOAS. The modeled O3, NO2, and BrO from the CLaMS collectively vertically shifted and thereby adjusted to match in situ-measured O3 (refer to Sect. 2.1) curtains show excellent agreement to measurements, particularly for the first two gases. Additionally, the CLaMS-calculated ratios of and are displayed, as well as CLaMS artificial surface emission tracers from the tropical marine environment (TME) in southeastern Asia and Central America (CAM) (discussed in Sect. 4.3). The variety of air masses observed during this campaign is not only reflected in Brtot fluctuations, but also in the range of air mass lag times, which vary between −1.05 and 2.33 years.
Complementary measurements and insight for a suite of sources gases and studies of the dynamics, potential vorticity, baroclinic waves, and isentropic mixing of the region have been reported elsewhere for flights during the WISE campaign (e.g., Fix et al., 2019; Kaluza et al., 2019; Kunkel et al., 2019; Hauck et al., 2020; Keber et al., 2020; Wetzel et al., 2021; and Schäfler et al., 2021). More studies from the WISE campaign addressing wave-driven isentropic exchange in the NH UTLS are published in the ACP/AMT/WCD inter-journal special issue (see https://acp.copernicus.org/articles/special_issue1061.html, last access: 1 October 2021).
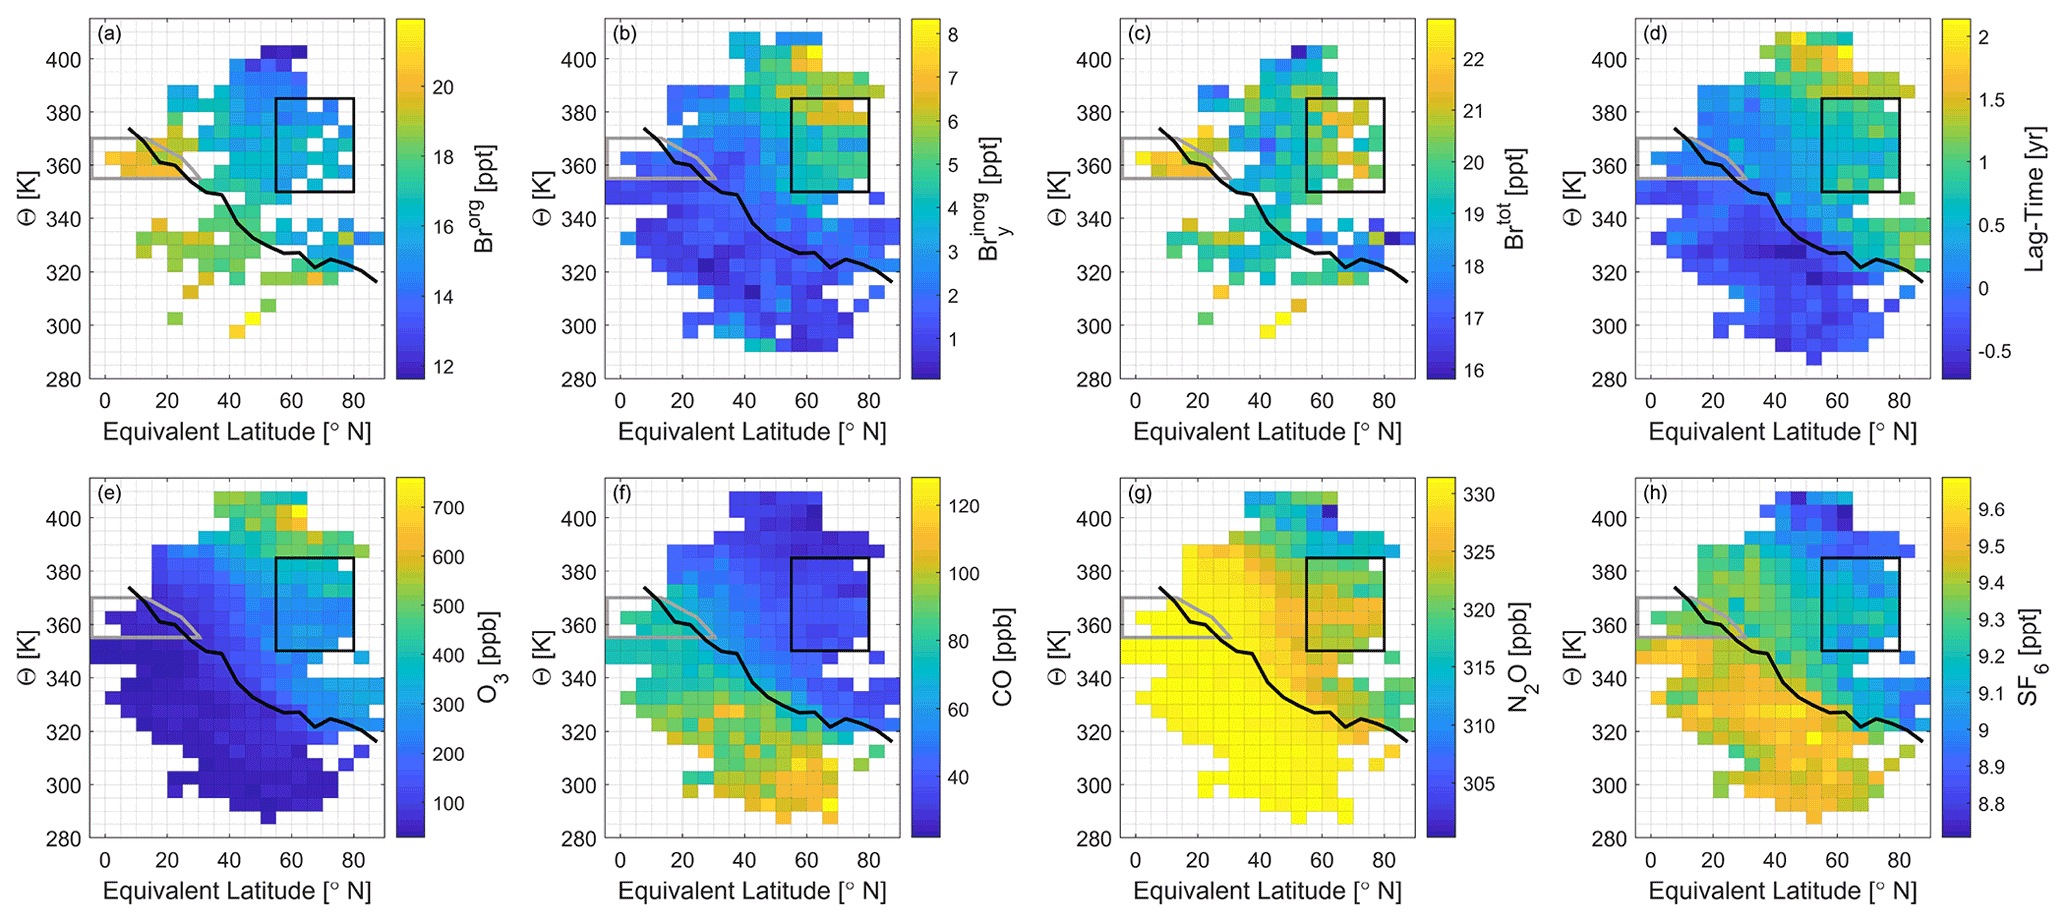
Figure 5The WISE campaign in fall 2017 as a function of equivalent latitude and potential temperature for (a) Brorg mixing ratios (CH3Br + halons + VSLS) from GhOST-MS, (b) VMR from mini-DOAS BrO scaled by the CLaMS ratio, (c) Brtot VMR, (d) mean air mass lag time (based on SF6 data from GhOST-ECD), (e) O3 VMR from FAIRO, (f) CO VMR from UMAQS, (g) N2O VMR from UMAQS, and (h) SF6 VMR from GhOST-ECD. The data are binned in 5∘ grids of equivalent latitude and 5 K grid potential temperatures. The solid thick black line is the mean WMO TP over the campaign duration. The black box in the LMS from N and 350−385 K is the high bromine region (HBrR), and the gray outline at Θ>355 K and PV < 2 PVU marks the tropical Θhigh–PVlow region (discussed in the text).
4.1 Total bromine as a function of Θ distance from the tropopause
Here we report on inferred total bromine, Brtot, in the UTLS for all available data during the WISE campaign in the fall of 2017. Figure 4 shows the additive breakdown of the organic (CH3Br – dark blue, halons – purple, and BrVSLS – light blue) and inorganic (BrO measurements scaled by the modeled partitioning coefficient – red points) bromine components with the potential temperature distance from the WMO TP in kelvin, defined as . Data points where the SZA >89∘ may introduce additional photochemistry-related uncertainties in the measurements (e.g., Kreycy et al., 2013) and therefore are excluded from the following discussion. The weighted mean Brtot in the UTLS (all measurements, i.e., between and 88 K) is 19.4±1.3 ppt (the uncertainty being the 1σ variability of the measurements). Excluding the tropospheric measurements, the LS (ΔΘ=0–88 K) has a weighted average of [Brtot] = 19.2±1.2 ppt, designated by the solid black line in Fig. 4. A more rigorous criterion with which to exclude data such as SZA > 85∘, as well as excluding data based on the modeled partitioning coefficient < 55 %, only impacts the Brtot weighted mean by an ∼0.1 ppt decrease. Brtot ranges from 16.2−23.4 ppt (with the exception of two larger outliers: one from large VSLS VMRs near the surface and another at approximately 35 K above the TP because of an instability of the retrieval). The variability is partly due to the different origins of the air masses and various inferred mean air mass lag times which have a spread of more than 3 years. Inferred Brtot measurements are up to ΔΘ=88 K above the WMO TP, with the measurements mostly in the LMS during the WISE campaign.
The LS mean of [Brtot] = 19.2±1.2 ppt within the given uncertainties is in good agreement with previous data (Engel and Rigby et al., 2018). The expected [Brtot] = 19.6 ppt for 2016 is primarily based on balloon soundings in the middle stratosphere and the expected trend in stratospheric bromine since the last balloon soundings in 2011. The trend is suspected to now be decreasing by ppt Br yr−1 between 2012 and 2016 (see Fig. 1-15 in Engel and Rigby et al., 2018). Furthermore, our results fit well into the expectation based on the total amount of stratospheric Brtot, published earlier by our group from different measurements (e.g., Dorf et al., 2006a and Werner et al., 2017, and others, e.g., Hendrick et al., 2008).
Table 4The average bromine mixing ratios of CH3Br, halons, BrVSLS, Brorg (CH3Br + halons + BrVSLS), and near the TP ( K) and in the upper layer of the lower stratospheric WISE measurements, labeled LStop (ΔΘ=78–88 K).

Within K of the TP, the weighted average Brorg (light blue points in Fig. 4) is 17.8±1.2 ppt, with bromine mixing ratios several parts per trillion larger below the TP. Within the upper LS region (ΔΘ=78–88 K), referred to as LStop, Brorg quickly decreases to 13.5±1.2 ppt as Brorg is being converted to species. The breakdown of the following bromine mixing ratios for Brorg, CH3Br, halons, BrVSLS, and at the TP and higher up in the LStop layer is indicated in Table 4. CH3Br (contribution (1) to Brtot) is destroyed with increasing distance into the stratosphere at a slow rate from 7.1±0.2 ppt at the TP to 6.1±0.5 ppt in the LStop layer (refer to Table 4). The tropospheric CH3Br (7.3±0.2 ppt) is slightly larger than the 2016 global annually averaged 6.8 ppt as reported in Engel and Rigby et al., 2018) but agrees well with the NH measurements of ppt from NOAA measurements, which show that NH CH3Br is always larger than in the Southern Hemisphere (SH) (Fig. 1-7 of Engel and Rigby et al., 2018). Contribution (2) to Brtot, the four different halons (H-1301, H-1211, H-2402, and H-1202), has a mean VMR of 7.5±0.2 ppt at the TP (in good agreement with the annually averaged tropospheric 7.8 ppt as from 2016 reported by WMO (2018)) and also decreases slowly to 6.5±0.5 ppt by the LStop layer. The larger part of the Brorg decrease in the LS is by contribution (3), the VSLS (CH2Br2, CHBr3, CH2BrCl, CHBrCl2, and CHBr2Cl), due to their short global lifetime of less than 6 months. At the TP, the BrVSLS VMR is 3.1±0.9 ppt (up to 7.2 ppt) while in the LStop layer the BrVSLS VMR decreases to 1.0±0.3 ppt. As such, the accumulated decrease of Brorg (contributions (1)–(3) to Brtot) throughout the LS between the TP and ΔΘ=88 K above the TP is ∼4.3 ppt.
Although further into the stratosphere the Brorg is destroyed, bromine is converted to and is compensated for in the Brtot budget. Contribution (4) to Brtot, the , near the TP is around 1.5±0.6 ppt (with a range of 0.2−3.3 ppt) and increases to 5.8±1.8 ppt (2.9−10.1 ppt) within the LStop layer (refer to Table 4). The gradual conversion of ∼4.3 ppt Brorg to by the LStop layer consequently results in minimal (or essentially no) changes of the Brtot budget, which is therefore approximately constant for the entirety of the air masses probed during the WISE campaign. In the LS the weighted mean Brtot ranges from 18.7±1.2 ppt (in the ΔΘ=5–15 K layer) to 19.9±1.2 ppt (in the ΔΘ=35–45 K layer). These small changes from the LS Brtot weighted mean of 19.2±1.2 ppt do not result in an obvious trend between the WMO TP and ΔΘ=88 K above it but rather hint at air masses of differing Brtot, which is discussed in the next sections.
4.2 Total bromine as a function of equivalent latitude distribution in the NH
To identify potential source regions and transport pathways of Brtot into the LS, the various gases measured during WISE are displayed in Fig. 5 with respect to potential temperature and equivalent latitude (Butchart and Remsberg, 1986). The VMRs of each trace gas are averaged horizontally in 5∘ equivalent latitude and vertically in 5 K grids to remove short-term atmospheric variability. The campaign-mean WMO TP varies from K at high to low equivalent latitudes, respectively.
The NH distributions of Brorg, , and Brtot are shown in Fig. 5a–c, respectively. Only 11 flights have Brorg measurements available, resulting in a sparser distribution. Near the Ex-TP Brorg, mixing ratios are ∼18 ppt, while in tropical Θhigh–PVlow air, Brorg has higher mean VMRs of up to 20.5 ppt, in agreement with previous studies (e.g., Navarro et al., 2015; Werner et al., 2017; Wales et al., 2018). The maximum mean VMR is 8.3 ppt at Θ∼400 K and N equivalent latitude, in contrast to the Brorg behavior. In the troposphere, ranges from ppt. These results agree well with previous studies, such as Werner et al. (2017) who reported = 7.66±2.95 ppt between 390−400 K in the subtropical LS and reaching down to 0.5 ppt in the tropical troposphere, as well as others (e.g., Wang et al., 2015; Koenig et al., 2017). A modeling study by Schmidt et al. (2016) reports mixing ratios at the lower boundary of the TTL and Ex-TP of 3−4 ppt and daytime BrO mixing ratios of 1−2 ppt, respectively.
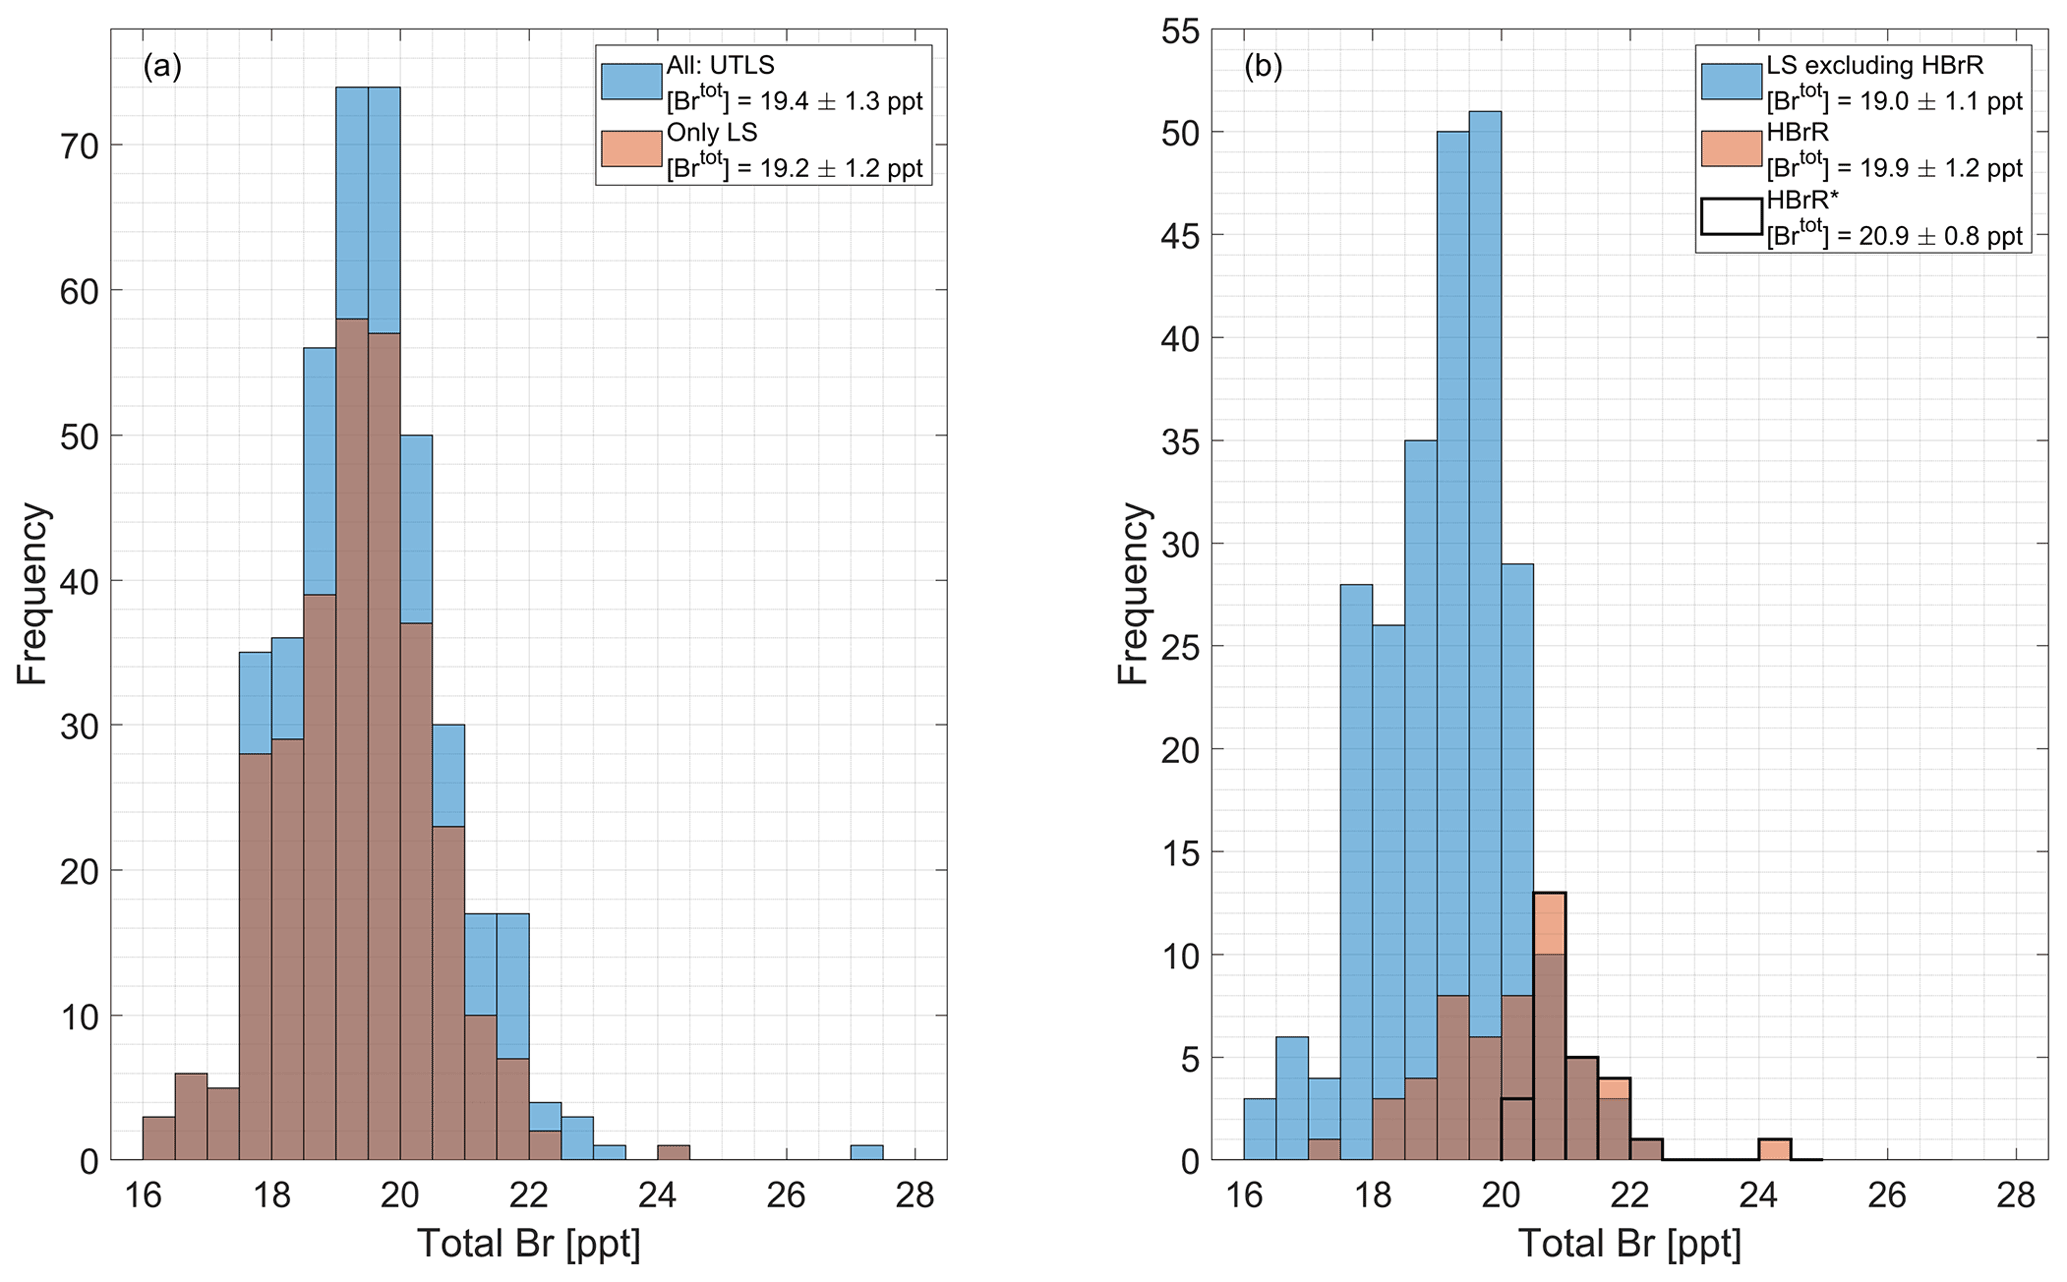
Figure 6Frequency distribution of inferred total Brtot. (a) All data (UTLS) have a weighted mean of [Brtot] = 19.4±1.3 ppt (blue) and Brtot measurements from the LS have a weighted mean of [Brtot] = 19.2±1.2 ppt (brown). (b) Measurements from the LS excluding the HBrR have a weighted mean of [Brtot] = 19.0±1.1 ppt (blue) while the HBrR (shown in Fig. 5c by the black box) has [Brtot] = 19.9±1.2 ppt (brown). HBrR∗ (thick black outlined bars) is the distribution of the measurements in the HBrR that are larger than the LS weighted mean by at least 1σ. HBrR∗ has a weighted mean of [Brtot] = 20.9±0.8 ppt.
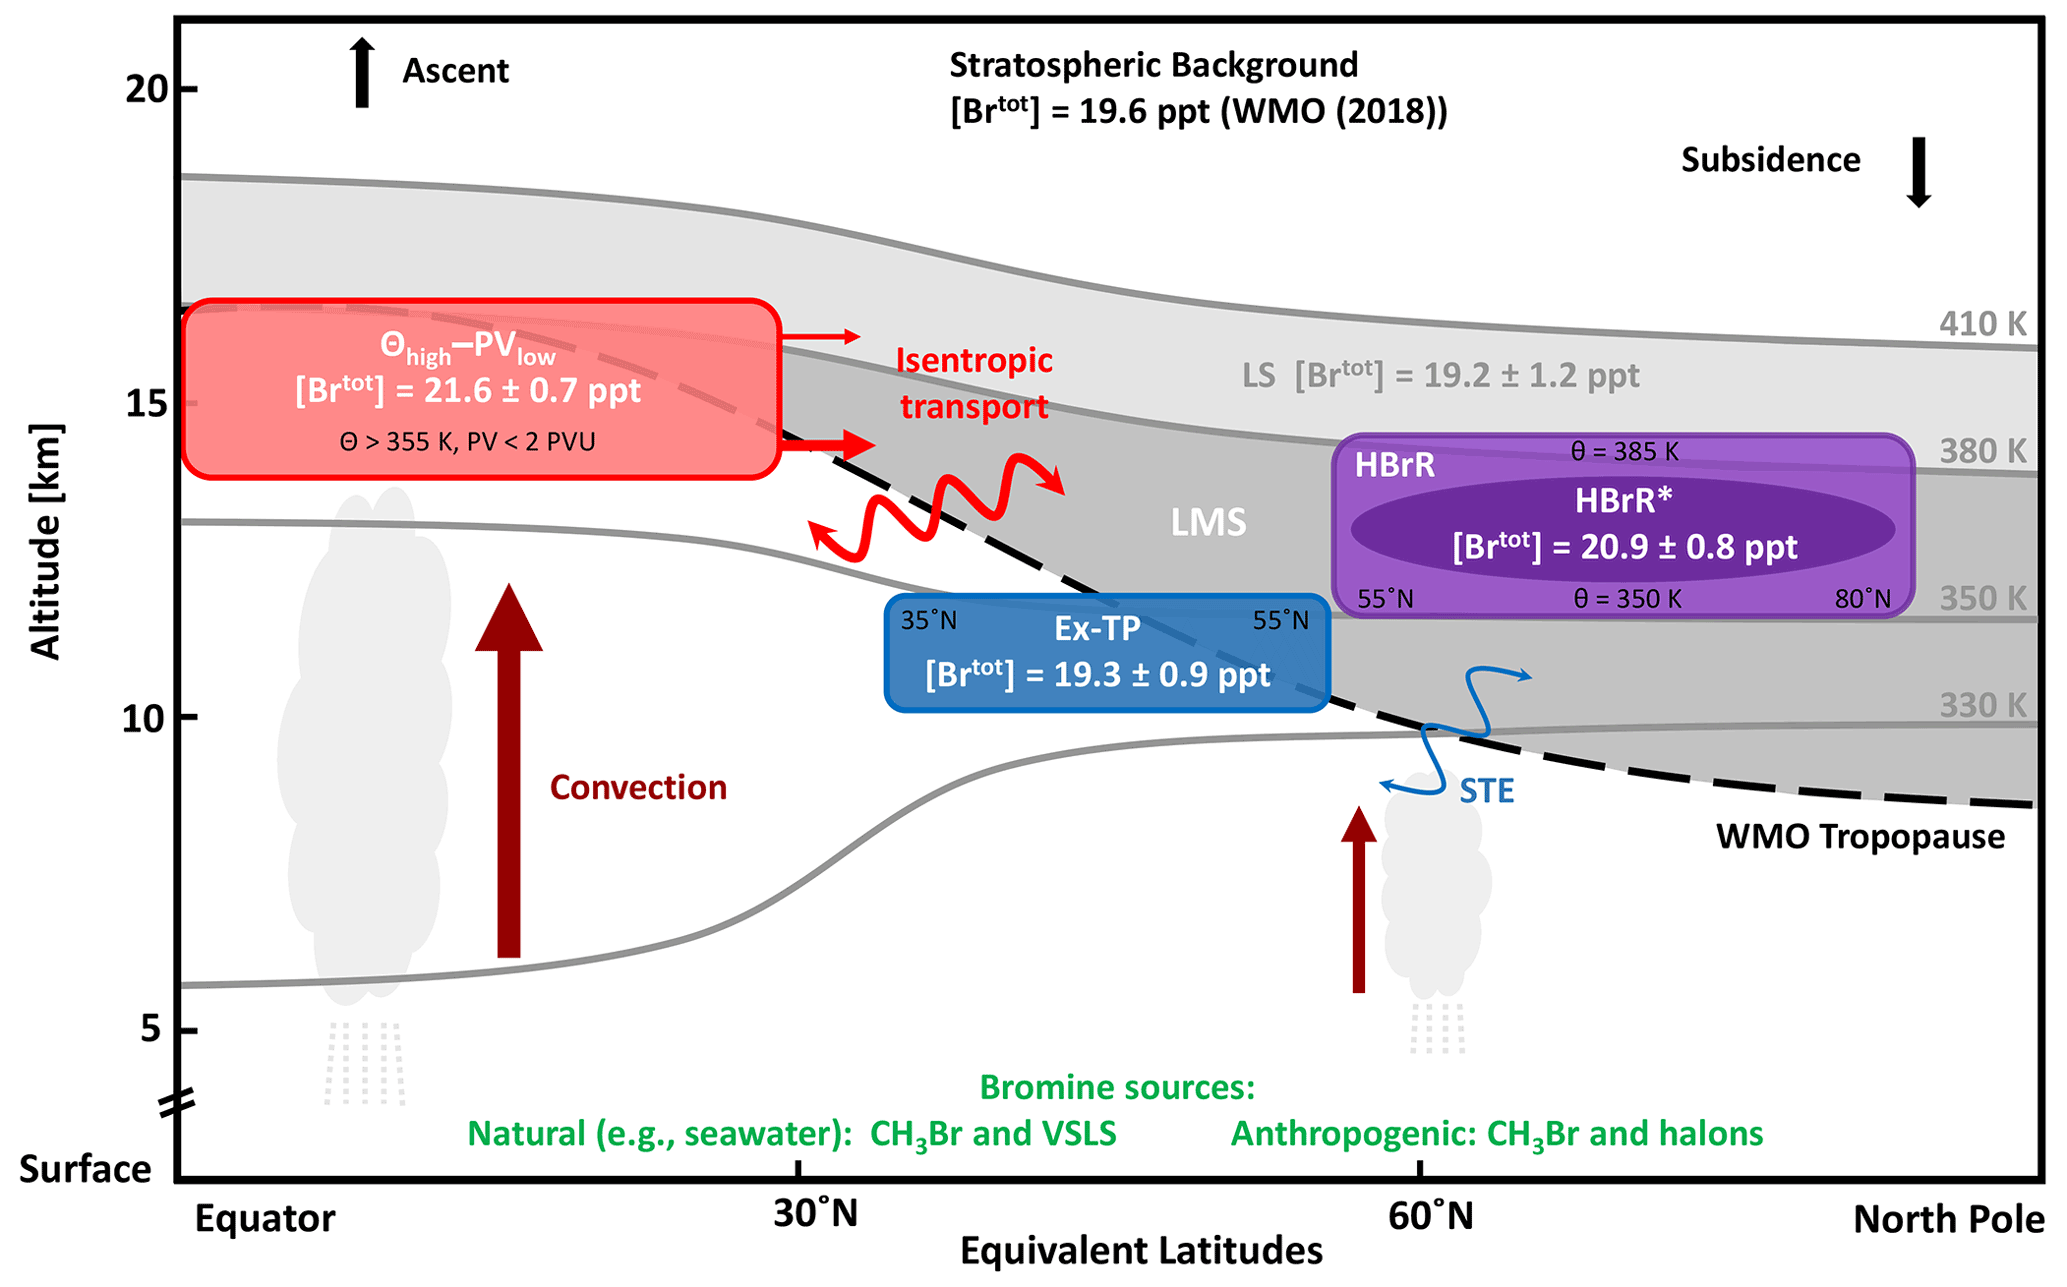
Figure 7Schematic of bromine transport pathways in the UTLS during the WISE campaign in fall 2017. The dashed black line is the WMO TP. The gray lines are constant potential temperature isentropes. The 380 K isentrope marks the upper boundary of the LMS (shaded dark gray region), and the 410 K (our measurement upper limit) isentrope marks the upper boundary of the LS (shaded dark + light gray regions). Bromine-rich former tropical UT/TTL air masses at Θ>355 K and PV < 2 PVU are labeled Θhigh–PVlow (shaded red box). The Ex-TP (shaded blue box) is defined here as ±5 K from the local TP between N. The transport of bromine from these two regions contributes to the high bromine region (HBrR; shaded light purple box) in the LMS, located between N and Θ=350–385 K. The Brtot-inferred measurements larger than the LS mean by more than 1σ within the HBrR are indicated by HBrR∗ (shaded dark purple oval). The dark red arrows show regions of strong convection transporting surface air masses (from bromine source regions) to the UT. The two main transport pathways of bromine are from the tropical UT/TTL by isentropic transport (light red arrows) and less by STE across the TP in the extratropics (blue arrow). Brtot VMRs are from the WISE campaign as discussed in the text.
Older air (see Fig. 5d) has generally more and less Brorg present, in large part due to the short lifetime of the VSLS. Averaged mean air mass lag times reach above 2 years around ∼400 K between N equivalent latitudes and largely coincide with high VMRs, with the exception of directly above the TP at N equivalent latitudes. There, a small pocket of older air (with lag times larger than 1 year) has low Brorg and . Within ±5 K of the TP, the mean lag time is yrs, with negative averaged lag times down to −0.5 years in the troposphere. Here, the relative change of the mean air mass lag times greater than 3 years is more relevant in the context of our study.
The average Brtot mainly varies between 18−20.5 ppt both in the troposphere and stratosphere (see Fig. 5c); however there are noticeable regions with higher bromine. Of particular interest is the region in the LMS at middle to high equivalent latitudes where Brtot local grid means of up to 21.5 ppt are observed. For the following discussion, this high bromine region (HBrR) is defined between potential temperatures of Θ=350–385 K and equivalent latitudes of N (designated by the black boxes in Fig. 5). A total of 12 out of the 15 research flights include flight segments within the HBrR, varying from minutes to several hours, with Brtot measurements available during eight flights (RF03–05, RF08, RF11–13, and RF16) over 8 h. A frequency distribution of inferred Brtot is displayed in Fig. 6a showing Brtot in the UTLS (blue) or only in the LS (brown). The distribution of the Brtot in the HBrR (brown) as compared to the rest of the LS excluding the HBrR (blue) shows the characteristically significant increase of bromine in this region (Fig. 6b). The HBrR has a weighted mean of [Brtot] = 19.9±1.2 ppt. The HBrR measurements result in the bromine bulge noticeable in Fig. 4 around K and are depicted by the right-pointing (gray- and black-edged) triangles. Inferred Brtot measurements within the HBrR that are larger than the LS weighted mean by at least 1σ are designated by HBrR∗ (i.e., only the black-edged right-pointing triangles in Fig. 4 and thicker black outlined bars in Fig. 6b). The HBrR∗ has a Brtot weighted mean of 20.9±0.8 ppt. Here we note that for individual measurements the estimated Brtot in the HBrR air is compatible with the LS average when considering the 1σ variability of the measurements. However, the clustering of the independently measured data, in particular of the HBrR∗ sample, suggests that the co-added error from the organic and inorganic measurements is actually lower than the stated 1σ variability of ±1.2 ppt, and thus the HBrR is a real and persistent feature over the course of the WISE campaign. HBrR∗ then represents the elevated bromine transported to the LMS, which is mixed with air of lower bromine content from the rest of the LMS and stratospheric background. The question is therefore as follows: what are the causes of this HBrR∗ air?
Potential sources include other regions of elevated bromine larger than the LS average, such as from the tropical and extratropical troposphere. These regions have younger (tropospheric) air masses which correspond well with the relatively younger air masses observed within the HBrR (local grid mean lag times ranging from 0.4−1.2 years) compared to the surrounding air (see Fig. 5d). Elevated bromine in tropical Θhigh–PVlow air is observed with a weighted mean of [Brtot] = 21.6±0.7 ppt, largely in agreement with previous experimental and modeling studies (Wang et al., 2015; Schmidt et al., 2016; Koenig et al., 2017; Werner et al., 2017). The bromine measurements in tropical Θhigh–PVlow air are from one flight, RF08 (see Fig. 3), over the course of almost 4 h. One other flight (RF14) observed tropical Θhigh–PVlow air, although Brtot data are missing. Along with the elevated bromine in the tropical Θhigh–PVlow air mass, measurements of the transport tracers (Fig. 5e–h) suggest that these air masses were eventually entrained by isentropic transport from the tropical Θhigh–PVlow region via the shallow branch of the Brewer–Dobson circulation (Levine et al., 2007; Birner and Bönisch, 2011). Near the Ex-TP ( N and ±5 K from the TP), Brtot has a weighted mean of 19.3±0.9 ppt, indicating a possible second pathway of the air masses entraining bromine into the LMS by STE across the Ex-TP (e.g., Holton et al., 1995; Homeyer and Bowman, 2013 and Kunkel et al., 2019). A schematic summarizing these regions of elevated bromine and the transport pathways from the UT into the LMS is shown in Fig. 7. Both possible transport pathways are investigated in the following with observational data from other measured gases (Fig. 5) and in Sect. 4.3 by transport modeling. The observational findings are as follows:
- a.
Elevated Brtot in tropical Θhigh–PVlow air masses has also been previously observed over the Pacific in 2013/2014, where inferred Brtot was measured to be up to 2 ppt larger in the TTL than expected for the middle stratosphere (Navarro et al., 2015; Werner et al., 2017; Wales et al., 2018). Studies such as those by Fueglistaler et al. (2004), Levine et al. (2007), Gettelman et al. (2011), and Ploeger et al. (2013) discuss the transport of air masses into the LMS that primarily stem from the tropics, in our study initiated by transport of the Asian monsoon (see Sect. 4.3). By the time tropical Θhigh–PVlow air reaches the LMS in the midlatitudes to high latitudes with transport times of years, significant portions of Brorg have converted to .
- b.
Mean O3 mixing ratios from FAIRO range from ppb in the UTLS (see Fig. 5e). In the LMS, the O3 and VMRs often have a positive correlation; however it does not include the HBrR. In this region, higher (and Brorg) contributes to elevated Brtot, while O3 has a local grid mean minimum of ∼229 ppb. Moreover, below this region around Θ=330–350 K and towards higher equivalent latitudes up to 90∘ N, there is an increase again of [O3] = 250–340 ppb, while the Brtot decreases (the same trends are seen above the HBrR).
- c.
N2O is a good transport tracer due to its long lifetime of 114 years (e.g., Ko et al., 2013). The well-mixed tropospheric air with high N2O VMRs (measured by UMAQS) from the tropical Θhigh–PVlow region penetrates into the LMS above the TP extending to 350−380 K and N (Fig. 5g), which coincides with the HBrR. Lower N2O VMRs are seen above and below this region. In the extratropics just above the TP, N2O shows an increasing tropospheric contribution from high to low equivalent latitudes. At equivalent latitudes < 40∘ N, N2O shows almost tropospheric mixing ratios of [N2O] > 328 ppb up to Θ=390 K. von Hobe et al. (2021) also observed elevated N2O mixing ratios in the tropics associated with the Asian summer monsoon in 2016/2017, extending up to ∼400 K without sharp discontinuities at the lapse rate TP (∼380 K) or cold point TP (∼390 K). This indicates that the tropospheric air masses transported there are not yet mixed with stratospheric air masses. von Hobe et al. (2021) further concluded that the main outflow of the “fast convective chimney” from the Asian monsoon anticyclonic region in the tropics was below 370 K with slower ascent rates above this as well as a smaller outflow from the chimney above 380 K, i.e., in direct agreement with our results of Fig. 5g.
- d.
The SF6 measurements are also used for analysis of the transport as it constantly increases, and its atmospheric lifetime is in excess of 850 years (e.g., Kovács et al., 2017 and Ray et al., 2017). The dominant transport from the tropical UT/TTL into the LMS has been previously investigated with SF6 and CO2 measurements (Bönisch et al., 2009). As seen in Fig. 5h, SF6 VMRs range from ∼9.6 ppt below the TP to ∼8.8 ppt in the LMS. Similarly to N2O, higher SF6 VMRs (local grid means up to 9.3 ppt) protrude into the LMS at the tropical TP extending to 355−385 K and N, which overlaps with the HBrR.
- e.
At the same time, CO (from UMAQS shown in Fig. 5f) with a shorter lifetime of 2−3 months (Novelli et al., 1998) has an average of [CO] = 37±5 ppb in the HBrR. The surrounding LS below and above the HBrR (i.e., from the TP to Θ=350 K as well as Θ>385 K and between equivalent latitudes N) has an average of 36±12 ppb (influenced by higher CO near the TP) and VMRs reaching down to 22 ppb. The CO mixing ratios seen in the HBrR are considerably lower than in the tropical Θhigh–PVlow air (average of [CO] = 76±5 ppb) and Ex-TP (average of 66±19 ppb). This indicates that some of the HBrR air might not have recently entered the stratosphere (within the past few weeks) but some months (2−3) prior to the measurements. However, the dominant transport of tropical Θhigh–PVlow air to the LMS using CO as a tracer was demonstrated by Hoor et al. (2005), the first of its kind. They concluded that transport of air masses to the LMS over Europe in summer and fall is dominated by transport from the tropical UT/TTL up to 55 % above ΔΘ>25 K and a slightly smaller contribution from the stratospheric background aged air of up to 45 %. The influence from the extratropical troposphere is dominant at the TP up to ΔΘ<25 K. The study by Bönisch et al. (2009) had similar conclusions.
The persistence of the HBrR observed in many flights during WISE and the already months-long presence and respective mixing generally rules out an origin of this air by some event-like (short duration) recent transport such as by high-reaching mesoscale convective systems or another form of STE process. The wide range of lifetimes of these tracers, the distinct change in VMRs across the Ex-TP, and the high VMRs of mainly the two longer lived transport tracers extending from the tropical Θhigh–PVlow region to the HBrR, as well as the low O3 observed within the HBrR, suggest that the dominant contribution of Brtot to the LMS is via the isentropic transport from the tropical UT/TTL rather than by extratropical STE (e.g., Holton et al., 1995; Levine et al., 2007; Fueglistaler et al., 2009; Bönisch et al., 2009; Ploeger et al., 2015). Studies such as by Pan et al. (2016) and Garny and Randel (2016) discuss the transport of Asian monsoon air that is isentropically entrained into the LMS by the shedding of small-scale eddies. Vogel et al. (2016) provides more evidence that portions of the Asian monsoon anticyclone air mass are transported horizontally to the southwest (via eddy shedding) entering the TTL and further into the LMS in late boreal summer. A second horizontal transport pathway can occur through filamentation by Rossby wave breaking, east of the anticyclonic event in the extratropics (Vogel et al., 2016). Specific Rossby wave-breaking events producing filaments irreversibly mix young tropospheric air into older air of the LMS (e.g., Homeyer and Bowman, 2013; Müller et al., 2016 and Kunkel et al., 2019). The relative contributions of these transport pathways are investigated in the next section.
Table 5The air mass contributions of the CLaMS surface emission tracers (defined in Fig. 9) in the HBrR and the LS below and above the HBrR (shown in Fig. 11c–d respectively). The HBrR is between equivalent latitudes N and Θ=350–385 K, while the LS below and above is between equivalent latitudes N from the TP to Θ=350 K and Θ>385 K.

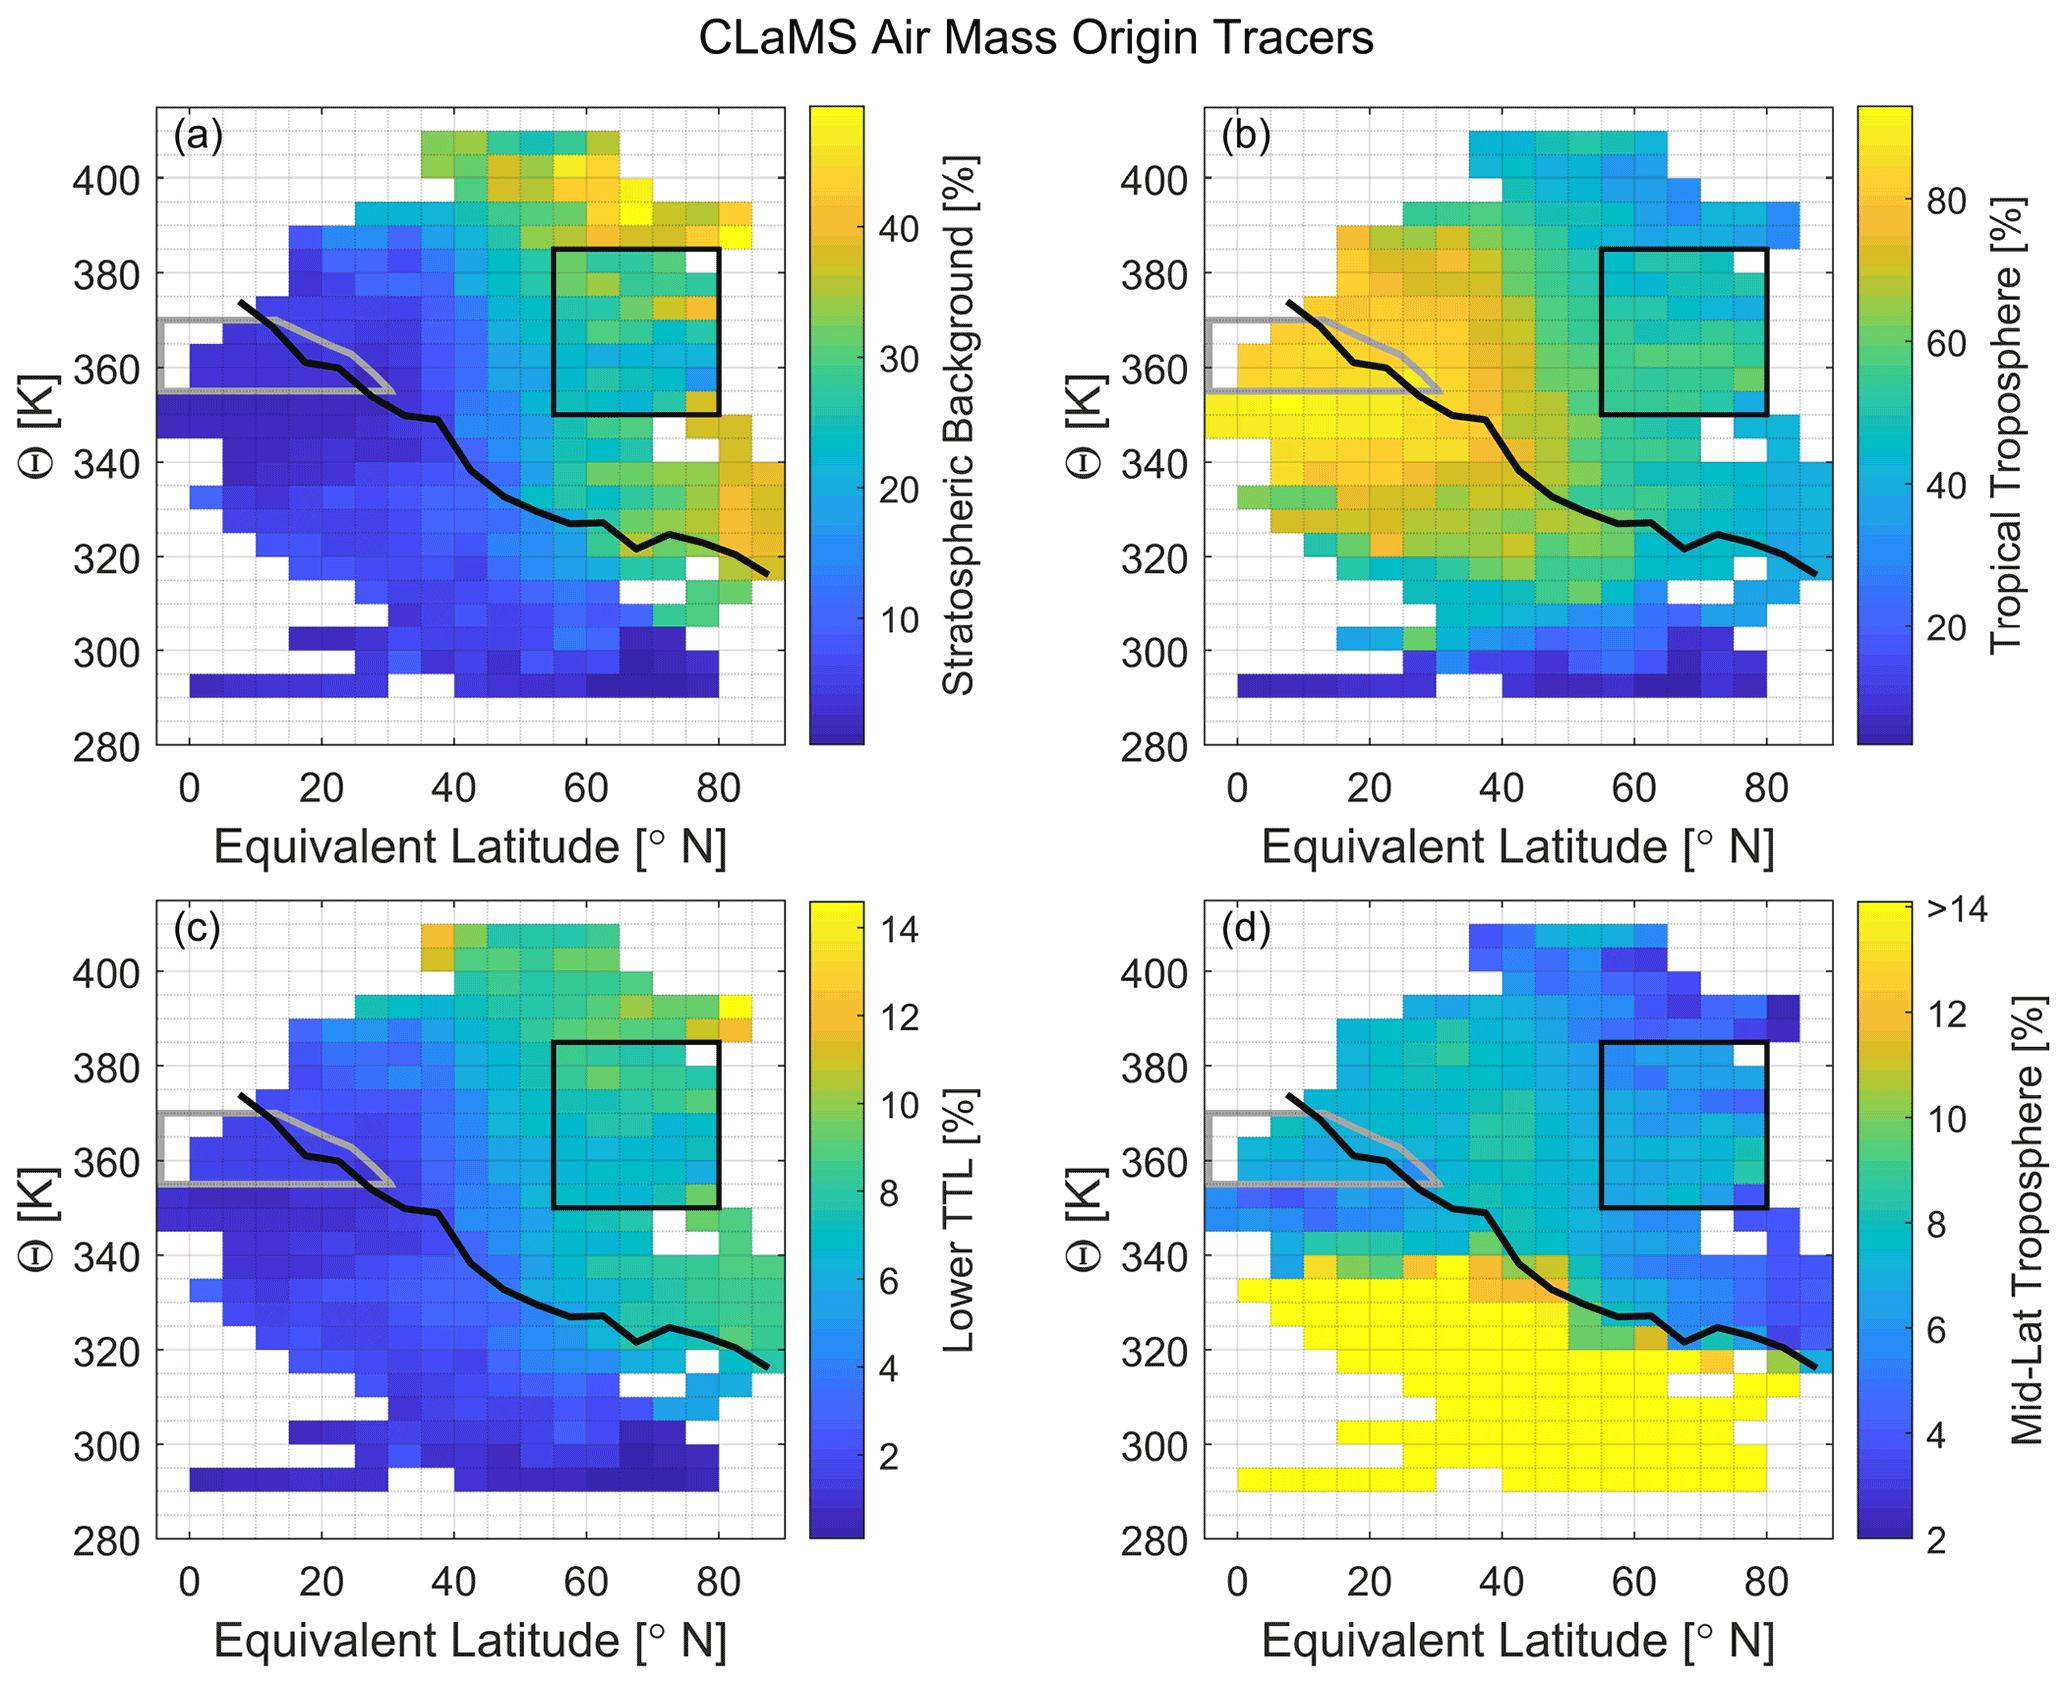
Figure 8CLaMS air mass origin tracers from WISE flights are initialized 5 months prior to the campaign. The atmospheric model is divided into nine domains. Shown are (a) the stratospheric background, (b) the tropical troposphere, (c) the lower TTL (Θ=355–380 K), and (d) the midlatitudinal troposphere. The remaining domains include the upper TTL (Θ=380–425 K), the tropical pipe, the midlatitudinal LMS, the polar troposphere, and the polar LMS (not shown). The solid black line is the campaign-average WMO TP, the black box indicates the area of the HBrR, and the gray outline marks the tropical Θhigh–PVlow region (discussed in the text).
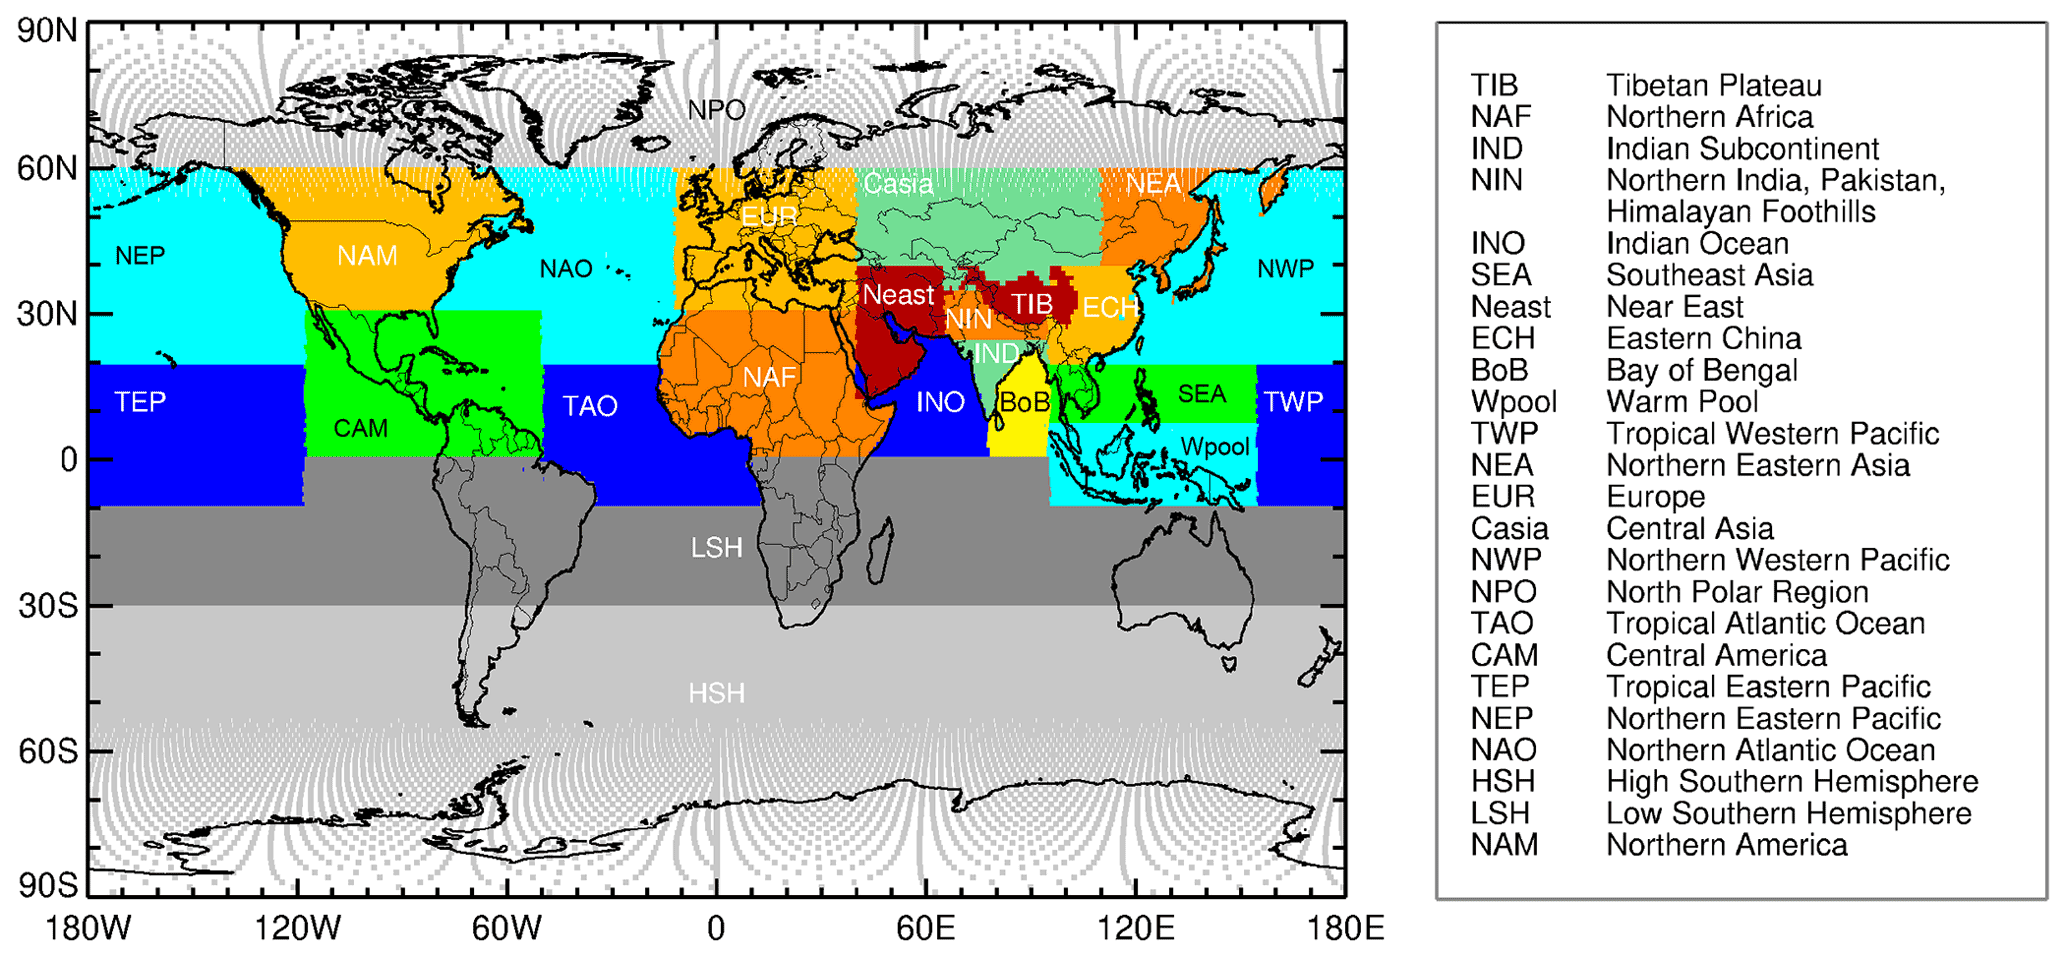
Figure 9CLaMS artificial surface emission tracers by region based on previous simulations described in Vogel et al. (2015, 2019), with higher resolution regions at coastal boundaries mainly in southeastern Asia (INO, IND, NIN, BoB, Neast, and ECH), as well as in other regions (TIB, NEA, NAF, TAO, NAM, NEP, and NAO). Adapted from Wetzel et al. (2021), where these defined regions were also used for the analysis during the WISE campaign.
4.3 Modeling of the transport into the LMS
4.3.1 Major air mass origins and transport pathways
The transport of air masses from different atmospheric domains into the NH LMS during summer and fall 2017 is simulated by CLaMS using artificial air mass origin tracers released on 1 May 2017, approximately 5 months prior to the WISE campaign (for details, see Sect. 2.5). The advection and mixing processes of the air parcels over the integration time result in the diverse compositions of the LMS air from the various domains of the atmosphere. The fractions of air originating in four of the atmospheric domains most relevant to our discussion are shown in Fig. 8. In the HBrR (marked by the black box), the fraction of air from the tropical troposphere is 51.2±8.3 %, while only 27.1±8.1 % is from the stratospheric background, and smaller contributions are from the lower TTL (7.5±1.4 %), midlatitudinal LMS (7.0±0.6 %), the midlatitudinal troposphere (6.4±1.4 %) and <1 % from the other domains (see also Fig. 11a). In contrast, the air masses in the LS below and above the HBrR (ranging from equivalent latitudes N between the TP and Θ=350 and Θ>385 K) consist of 42.6±9.7 % air from the tropical troposphere, 36.1±10.3 % from the stratospheric background, 8.3±1.4 % from the lower TTL, 7.0±0.6 % from the midlatitudinal LMS, 5.2±2.4 % from the midlatitudinal troposphere, and <1 % from the other domains (see Fig. 11b). The uncertainties stated (1σ standard deviation) indicate the variety of air masses mixed together in each domain.
Over the 5 months of CLaMS simulation prior to the HALO measurements, the influx of tropospheric air to the HBrR is almost 10 % more than the surrounding LS below and above the HBrR. Although this difference is near the 1σ variability, the distributions of air mass origins from the HBrR compared to the LS below and above have distinct shifts, especially for the tropical and midlatitudinal troposphere and stratospheric background domains (not shown). In particular, this increase of tropical tropospheric air (+8.6 %) and to a lesser degree extratropical tropospheric air (+1.2 %) in the HBrR results in additional transport of air masses from these source domains with elevated bromine compared to the surrounding LS (as shown in Fig. 7). Figure 7 provides a schematic of the relative contributions of tropical Θhigh–PVlow air vs. the Ex-TP bromine transported to the LMS. The elevated bromine observed in tropical Θhigh–PVlow air has air fractions of up to 92 % (with a mean of 84±2 %) originating from the tropical troposphere (Fig. 8b). As expected, air from the tropical troposphere is transported into the tropical Θhigh–PVlow region during the last 5 months caused by the large-scale circulation. Therefore, the elevated bromine measured in tropical Θhigh–PVlow air during WISE can be categorized as air masses largely originating in the tropical troposphere as defined by the CLaMS origin tracer. Yan et al. (2019) also showed that similar contributions of air from the 350−360 and 370−380 K layers of 18 % and 22 %, respectively, are transported into the NH LS, with only small air mass fractions continuing vertically into the tropical pipe. Their findings are in agreement with those of von Hobe et al. (2021).
Large bromine sources, particularly the VSLS, are from tropical marine regions, mainly in coastal areas (Engel and Rigby et al., 2018). Therefore, surface emission tracers (for details see Sect. 2.5) from CLaMS simulations are also used to infer the contribution of young air masses (<5 months) from different surface regions to the UTLS (see Fig. 9). The surface emission regions with the largest contributions to the HBrR during the WISE campaign flights are shown in Fig. 10. The sum of the surface emission tracers (i.e., air masses younger than ∼5 months) contributing to the HBrR accounts for 37.7 % of the air, while the LS regions below and above the HBrR both receive less surface air, with an average of 30.3 % (see Fig. 11c–d, respectively, as well as Table 5). Therefore, the larger tropical tropospheric air contribution to the HBrR compared to the surrounding LS as seen in the air mass origin tracers is largely from recent surface emissions rather than from the free troposphere.
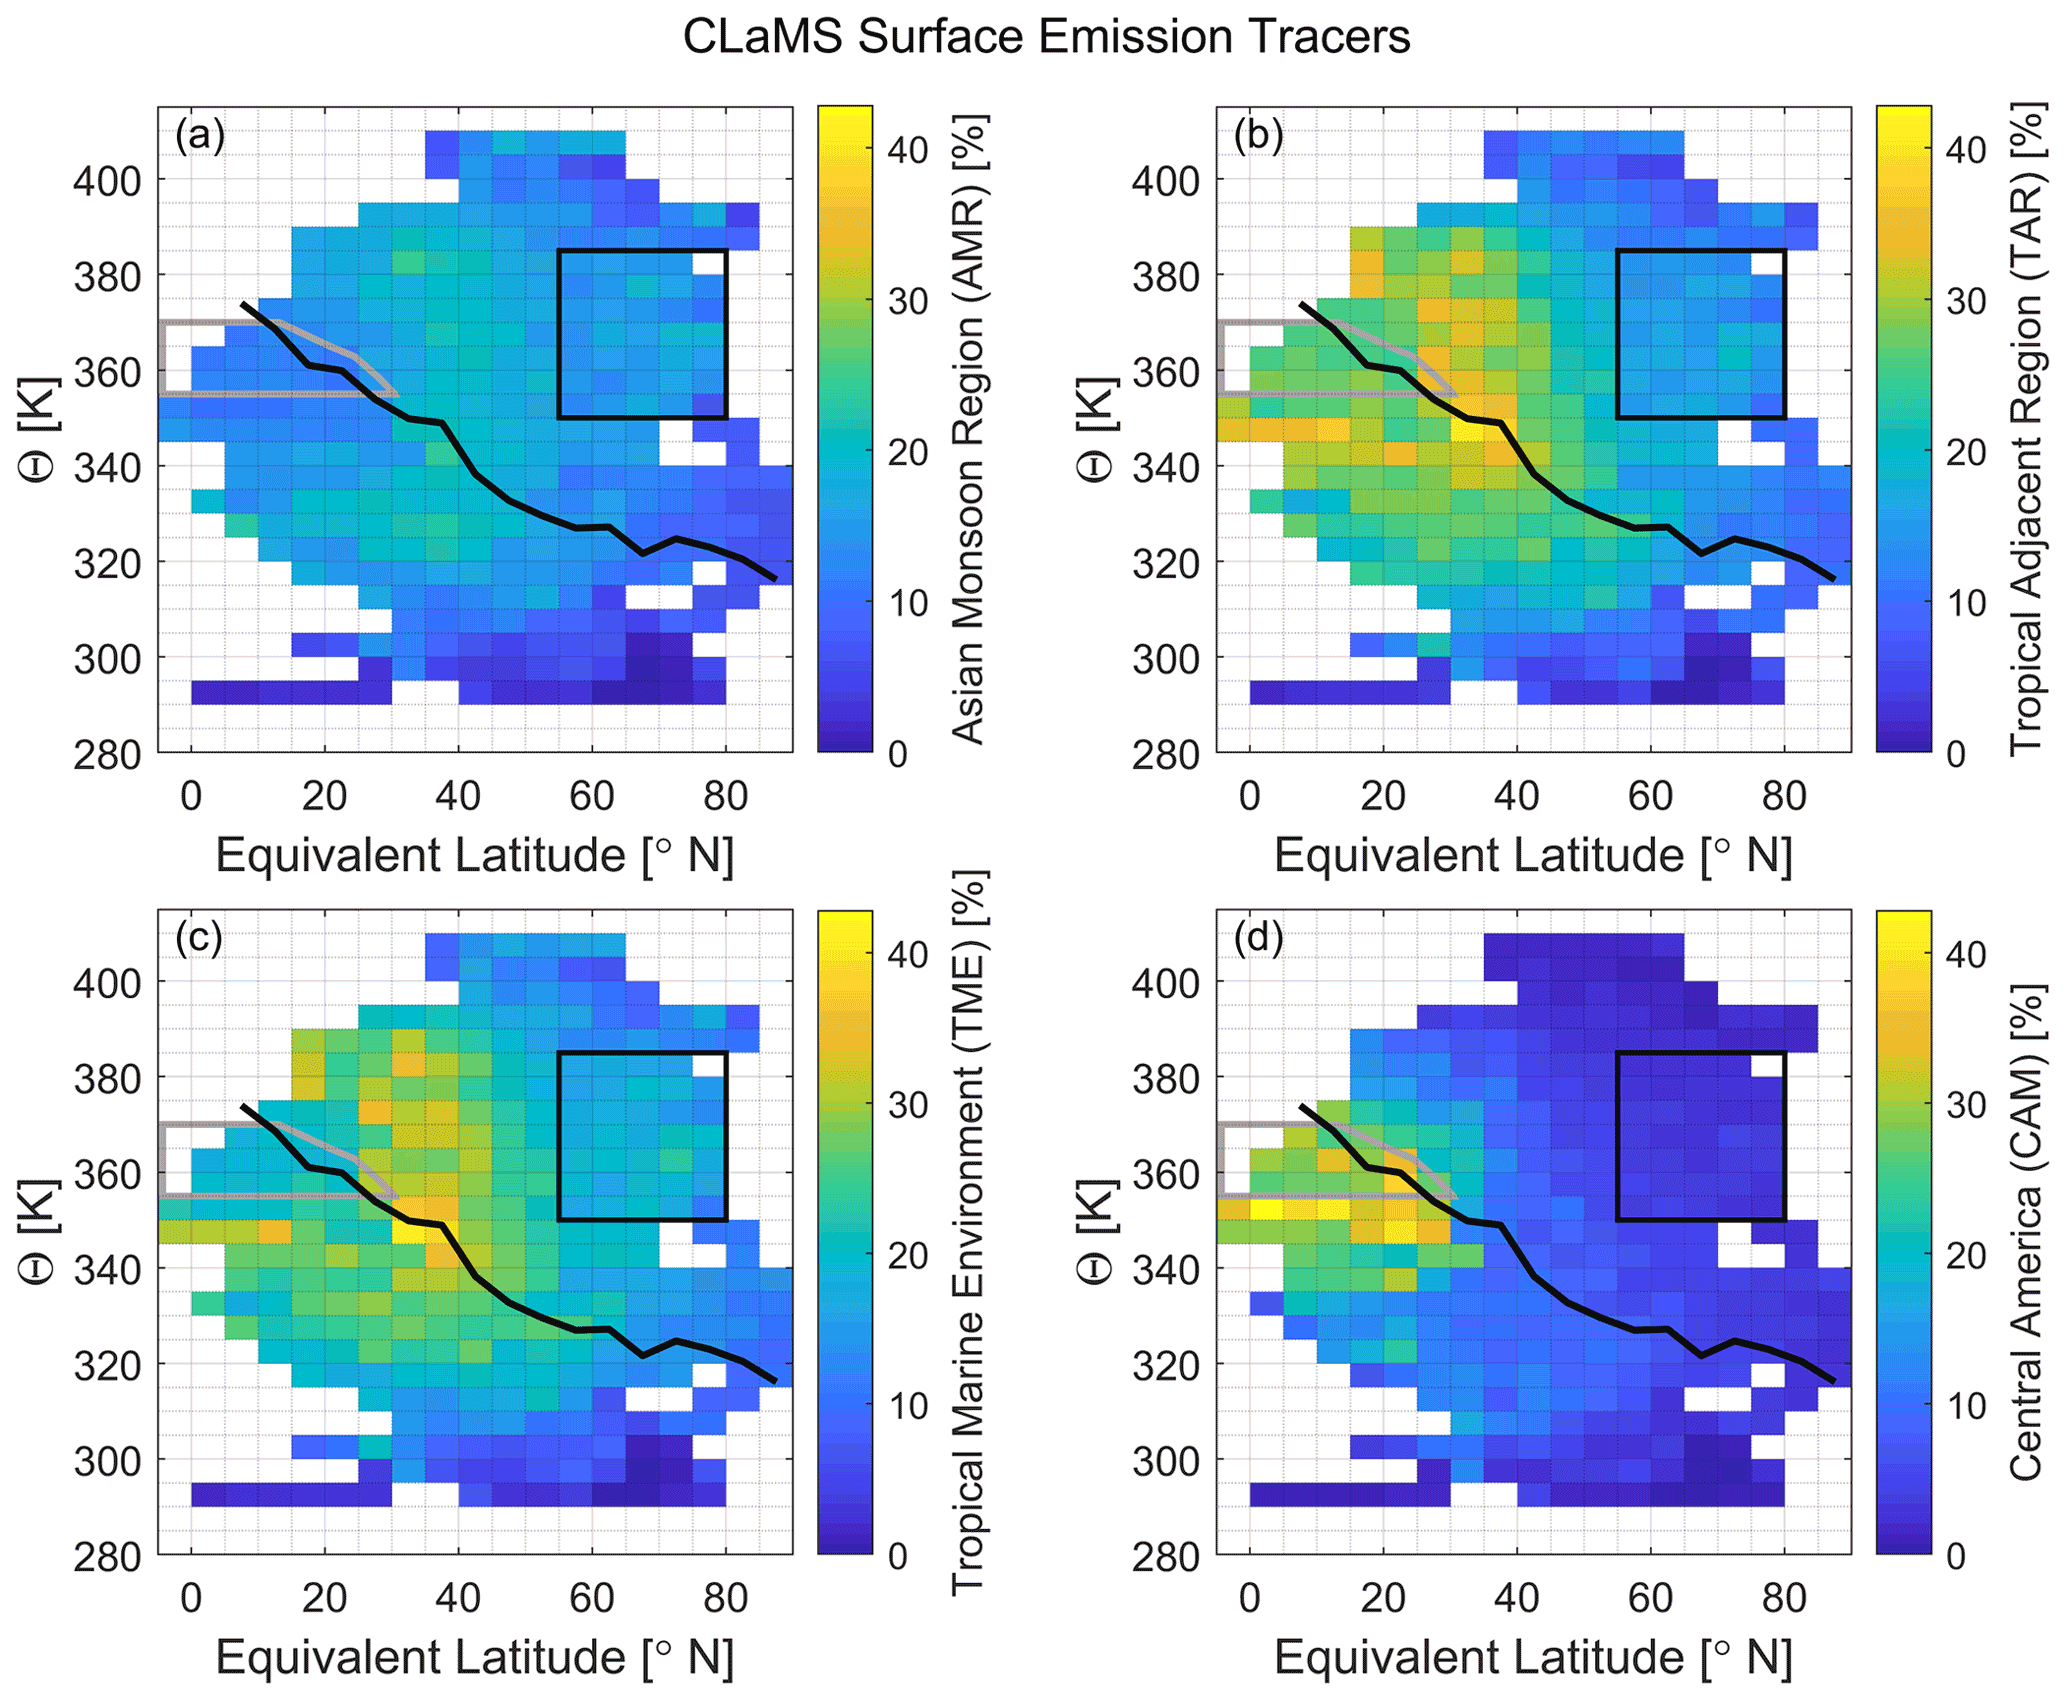
Figure 10Relative contribution of surface emission tracers during the WISE campaign. The individual surface regions are displayed in Fig. 9. The Asian monsoon anticyclone region (AMR), consisting of NIN, IND, INO, TIB, ECH, and BoB (a), and its tropical adjacent region (TAR), consisting of Wpool, SEA, TWP, TEP, NAF, and Neast (b), contribute the largest fractions of surface air to the LMS HBrR (indicated by the black box; see text for details). A subgroup of these regions, the tropical marine environment (TME consisting of SEA, Wpool, BoB, INO, TWP, and TEP) is particularly significant due to elevated emissions of brominated VSLS (c). The contribution from Central America (CAM) to the tropical UT/TTL is largely due to vertical transport of air by hurricanes Maria and Ophelia in fall 2017 (d). The gray outline marks the tropical Θhigh–PVlow region, and the solid black line is the average WMO TP.
The CLaMS simulations show that surface emissions from the Asian monsoon region (AMR; consisting of NIN, IND, INO, TIB, ECH, and BoB; refer to Fig. 9) and from its tropical adjacent region (TAR; consisting of Wpool, SEA, TWP, TEP, NAF, and Neast) have the strongest contributions of the various surface emission tracers to the LMS in late boreal summer and early fall. Maximum contributions of the AMR and TAR surface emissions are delivered to equivalent latitudes between N and from Θ=325–390 K (see Fig. 10a–b). The grouped emission tracer contributions to the HBrR and surrounding LS can be found in Table 5, and for a breakdown of all surface emission tracers, see Fig. 11c–d. The AMR accounts for 14.8 % of the air in the HBrR, while air originating from the TAR contributes a further 15.2 %. Together, the AMR and TAR make up 30.0 % of the air reaching the HBrR, which is 79.8 % of all surface air masses. The LS air masses below and above the HBrR receive less surface (younger) air compared to the HBrR, mainly because the AMR and its TAR contribute less.
This is in general agreement with results of CLaMS simulations using a previous version of surface emission tracers for 2012 and 2008 that found a flooding of the northern Ex-LS in boreal summer with young air masses from the region of the Asian monsoon and from the tropical Pacific (Vogel et al., 2016, 2019). Similarly, the Asian monsoon air masses impacting the LMS was observed by Müller et al. (2016). Furthermore, this feature is in general agreement with findings of Orbe et al. (2015), who showed that in boreal summer and fall, ∼ 20 %–30 % of the midlatitudinal LMS air at 100 mb originated from the Asian planetary boundary layer (slightly further north than defined here). The outflow of the AMR into the LMS (see Fig. 10a) has also been recently shown in a study by von Hobe et al. (2021); i.e., the main outflow is below 370 K with weaker outflow up to 380 K. Levine et al. (2007) previously also concluded that vertical transport from the tropical boundary layer into the TTL is strongest over the Indian Ocean, Indonesia, and western Pacific Ocean through convection. They further concluded that the main outflow (∼95 %) of air from the TTL is transported below 380 K into the LMS, while only ∼5 % is transported further upwards into the stratospheric “overworld”.
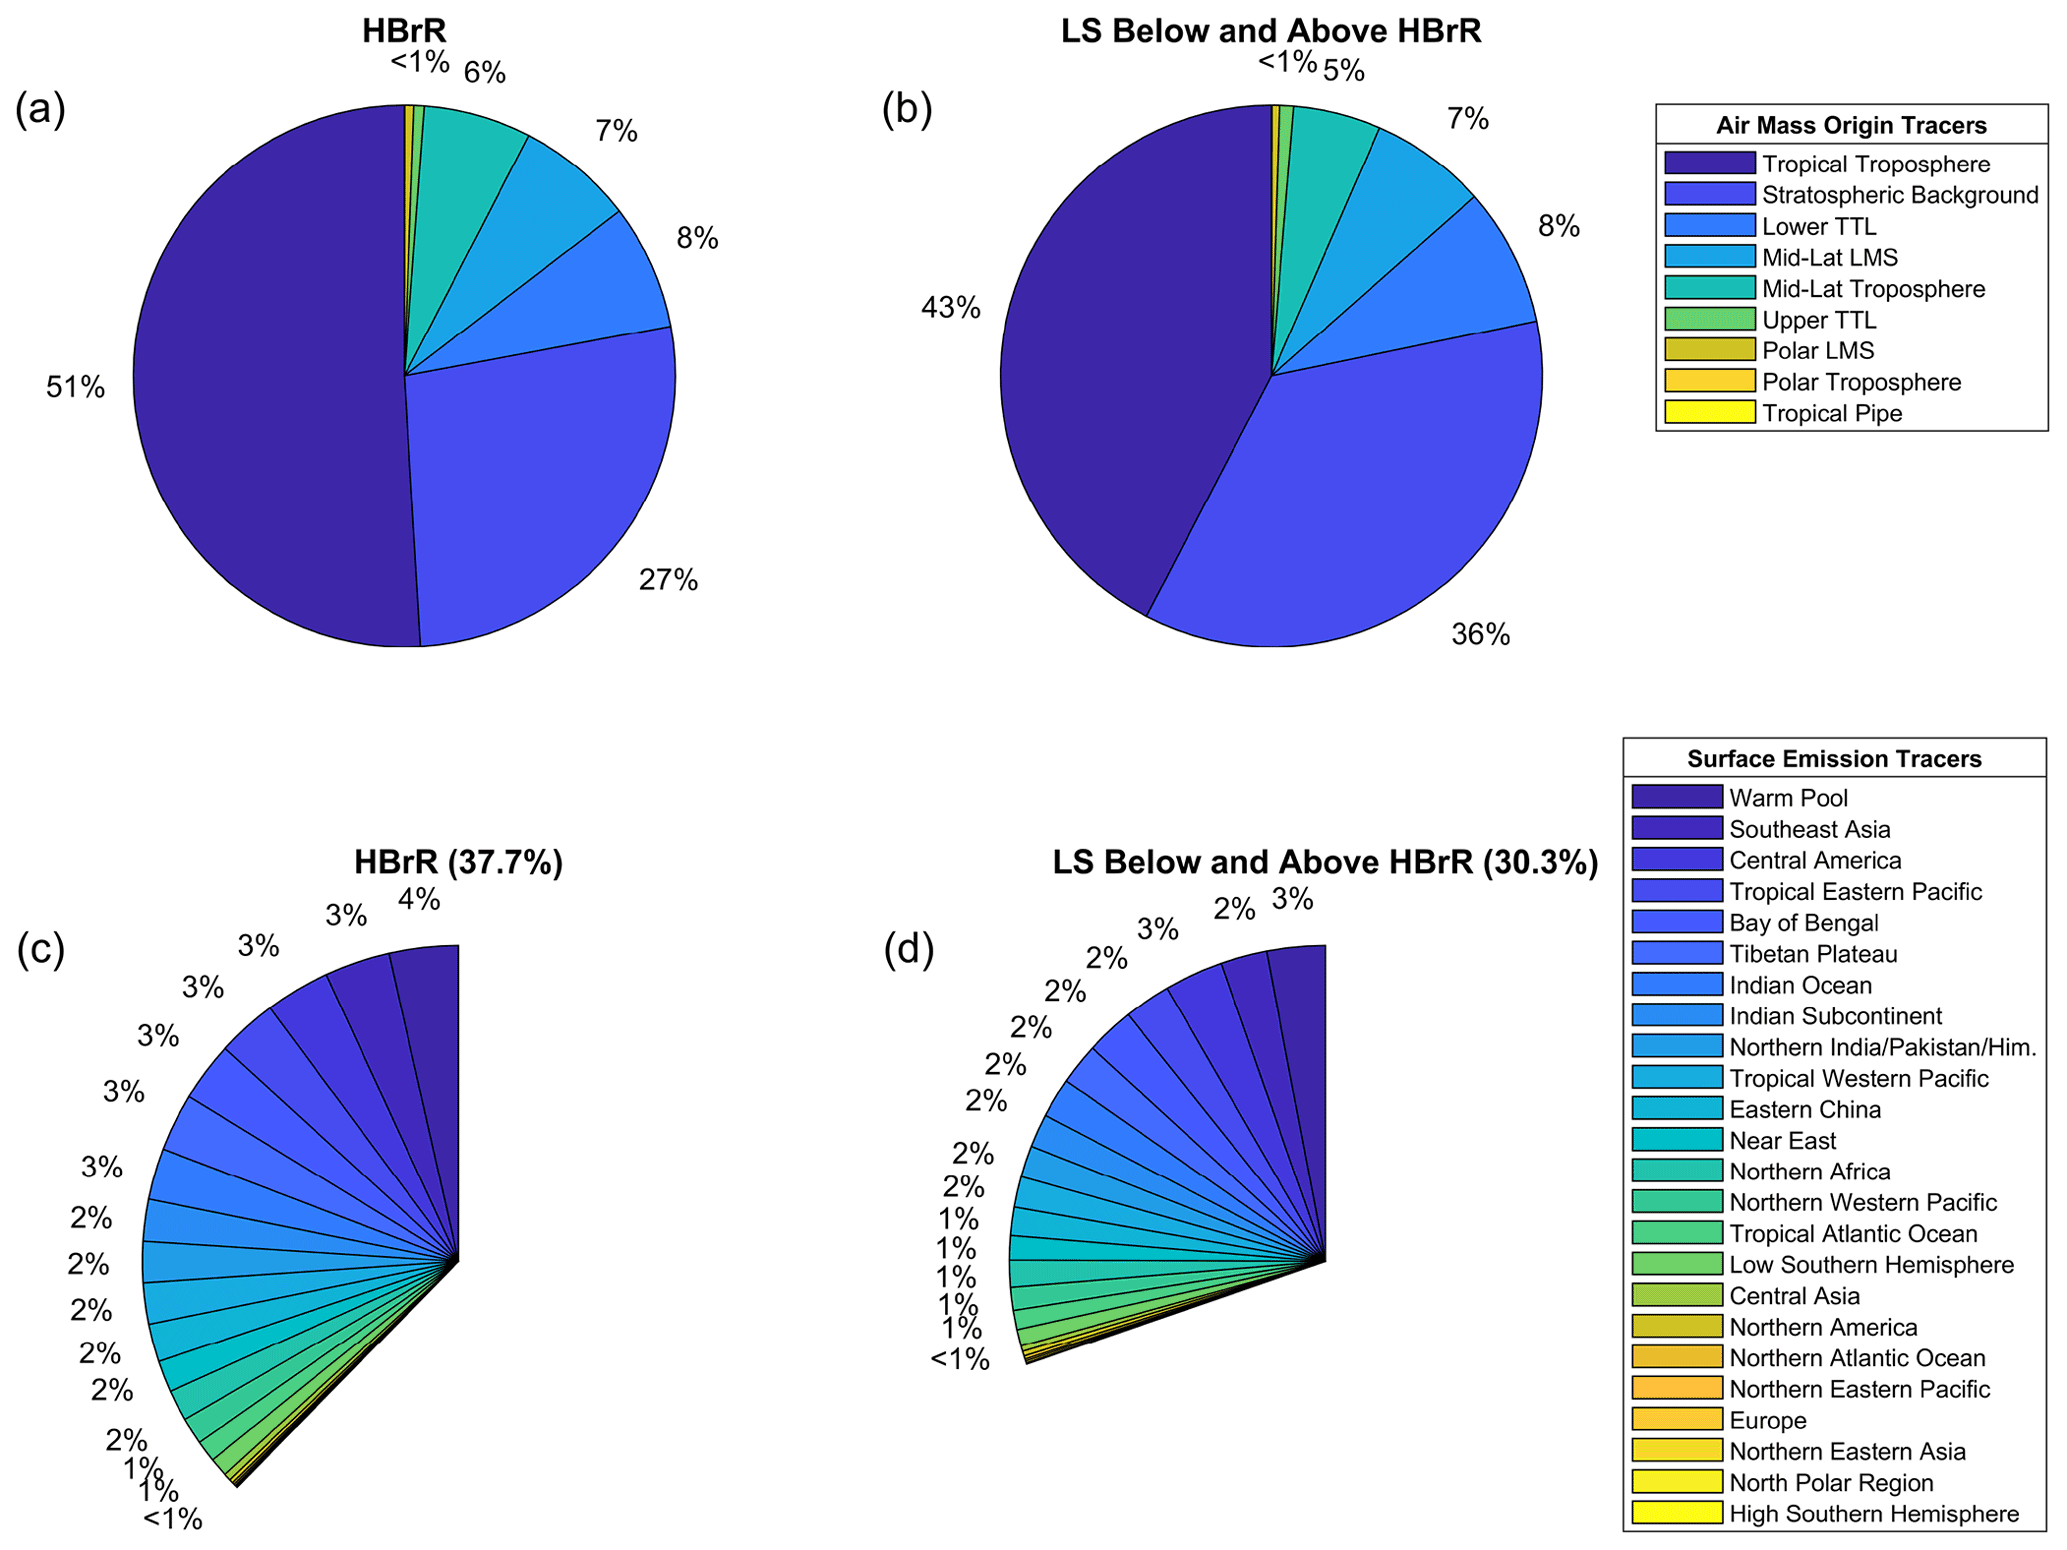
Figure 11Relative contribution of the air mass origin (a–b) and surface emission (c–d) tracers during the WISE campaign obtained from CLaMS simulations. Contributions to the HBrR (between Θ=350–385 K and equivalent latitudes N) are shown in (a) and (c), while the contributions to the LS air below and above the HBrR (i.e., from the local TP to Θ=350 K as well as Θ>385 K and between equivalent latitudes N) are displayed in (b) and (d).
A subgroup of regions from the AMR and its TAR belonging to the tropical marine environment (TME; defined by SEA, Wpool, BoB, INO, TWP, and TEP) in southeastern Asia alone contribute 17.7 % to the HBrR, which is 47.0 % of the air masses from the surface. The maximum TME air mass contribution is in the subtropics to midlatitudes between N from Θ=320–390 K, but air masses with elevated TME contributions extend to the tropical UT/TTL and the HBrR (see Fig. 10c). This suggests entrainment of TME air masses crossing the TP around 30∘ N with further transport to the tropical UT/TTL and LMS, in agreement with findings of Orbe et al. (2015). The surrounding LS air masses below and above the HBrR receive 13.8 % from the TME, i.e., a 3.9 % decrease compared to the HBrR. The variations of TME contribution per flight in the UTLS range from 17.3 %–30.1 % at flight altitude (examples are shown in Figs. 2f, 3f, and 12c–d).
The increased contribution of younger surface air to the HBrR compared to the surrounding air masses below and above has a significant influence on the trace gas composition, in particular, considering the majority of the surface air masses are transported from regions with large biological activity and known bromine sources (Engel and Rigby et al., 2018), i.e., the tropical marine environment below the Asian monsoon anticyclone and its tropical adjacent regions. This highlights the influence of surface emissions from southeastern Asia on pollutants and in particular bromine in the northern LMS during boreal fall. Adcock et al. (2021) observed enhanced CH3Br VMRs (up to 9 ppt) as well as CH2Br2 and H-1211 VMRs (up to about 0.75 and 3.5 ppt, respectively; comparable to Engel and Rigby et al., 2018) at the TP in the Asian monsoon region in 2016/2017.
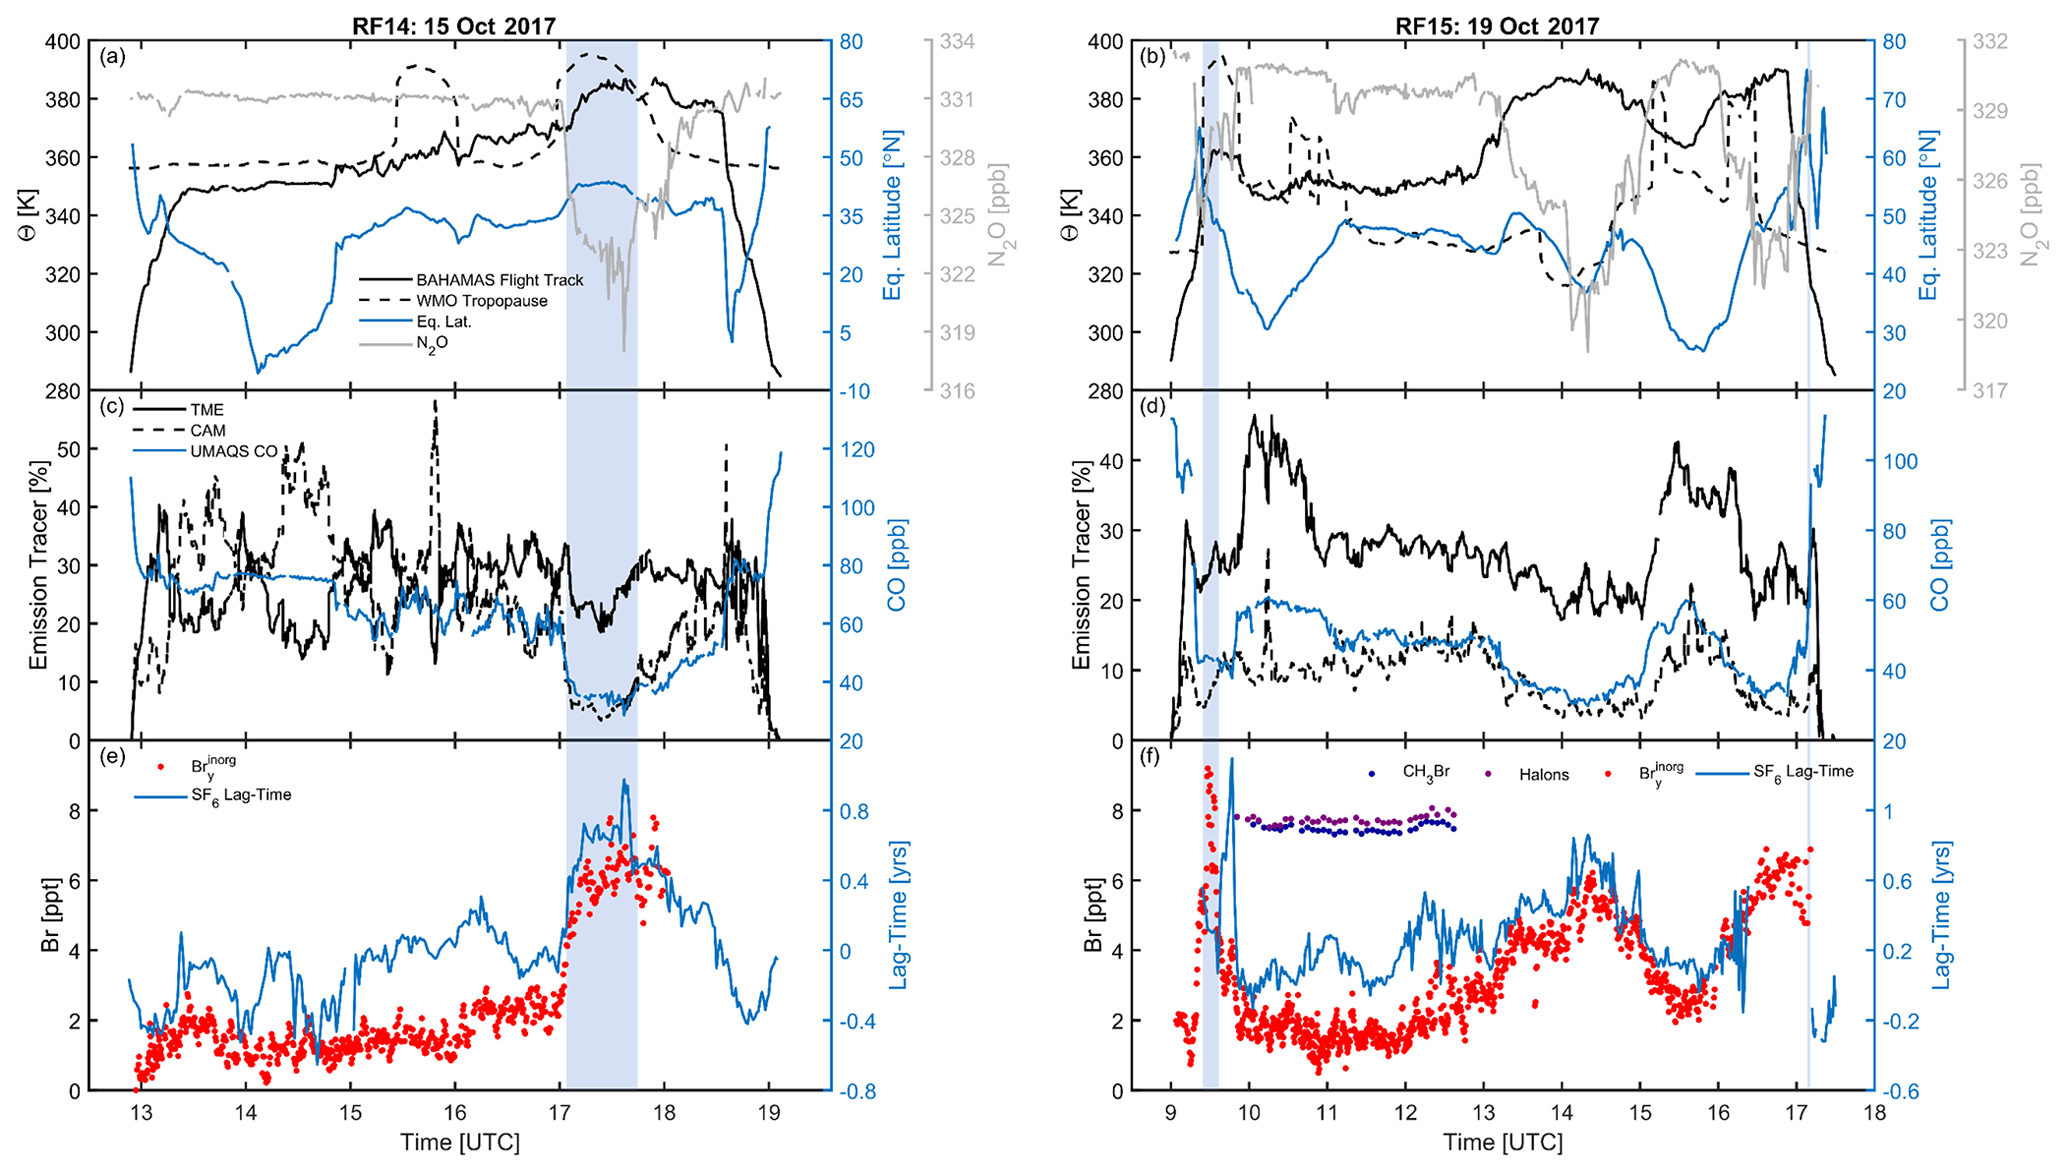
Figure 12Examples of recent air mass surface emissions from the tropical marine environment (TME) in southeastern Asia as well as elevated emissions from Central America (CAM) during flights in remnants of tropical cyclones. (a, c, e) show details of RF14 on 15 October 2017 and (b, d, f) RF15 on 19 October 2017. (a–b) show the potential temperature of the flight track (solid black line) and WMO TP (dashed black line) for each flight, along with the equivalent latitude (blue line, right axes) and N2O VMR (gray, right axes). (c–d) show the air mass fraction at flight altitude from the TME and CAM emission tracers (solid and dashed black lines, respectively), as well as the CO VMR (blue, right axes). (e–f) show the individual bromine mixing ratios of CH3Br (dark blue points), the halons (purple points), and (red points) where available along with the air mass lag time (blue line, right axes). The light blue shading indicates > 4 ppt in the UT, i.e., ΔΘ<0 K.
Using ERA-Interim reanalysis from the years 2007/2008, Vogel et al. (2019) showed that surface air masses can reach 360 K in a few days and reach 360−460 K within a few months in the tropics and subtropics due to the strong vertical spiral uplift associated with the Asian monsoon anticyclone including its tropical adjacent air masses. Using data from the ERA-Interim/ERA5 reanalysis, Bucci et al. (2020) showed that air from Nepal in July/August 2017 could rise through convection in the Asian monsoon anticyclone region with transport times up to the TP > 17 km to be ∼20 d. Similarly, Ashfold et al. (2012) reported a transport time of less than 15 d of air masses from the western Pacific boundary layer (<1 km) up to the lower TTL (∼15 km). The fast transport (on the order of days) from the Asian tropical planetary boundary layer to the TTL allows even the short-lived trace substances from the southeastern Asian region to reach the UTLS (Orbe et al., 2015).
The impact of maritime boundary sources on the chemical composition of the Asian monsoon anticyclone by convective uplift in tropical cyclones in the western Pacific is discussed by, e.g., Vogel et al. (2014) and Li et al. (2017, 2021). A study by Liang et al. (2014) concludes that deep convection transports ppt brominated VSLS from the marine boundary layer of the tropical Indian Ocean, tropical western Pacific warm pool, and the Pacific coast of Mexico to the LMS. These brominated VSLS are half in the form of source gases, and the other half consist of product gases such as BrO, and only ∼10 % is lost due to wet scavenging after transport to the TP. Hamer et al. (2020) similarly found that inside the convective system, CHBr3 (one of the VSLS) is the most efficient bromine gas to reach the UT as >85 % of surface CHBr3 is transported to the tropical UT. In addition, they simulated the presence of 1 ppt of inorganic bromine outside the convective system near Borneo, i.e., in the tropical adjacent regions, while inside the convection system inorganic bromine (<0.1 ppt) is almost completely depleted due to washout. Therefore, the solubility of the gases and local surrounding conditions may also impact the delivery to the TTL and finally the Ex-LS. This is partially when tropospheric O3 is low and prevents the soluble forms of bromine from reacting and converting to insoluble inorganic bromine compounds.
4.3.2 Contributions to UTLS bromine from recent tropical cyclones
Interestingly, emissions from Central America (CAM) also contributed to elevated Brtot in the tropical Θhigh–PVlow air masses with maximum CAM air mass fractions around K during WISE (see Fig. 10d). There are two flights with particularly large air mass fractions from CAM emissions observed during the campaign, i.e., RF08 and RF14 (discussed below), with flight segments in tropical Θhigh–PVlow air. During both flights, remnant air masses of two mesoscale convective systems in the Central American tropics were probed. For reference for the following discussion, the average contribution of emissions from CAM (excluding RF08 and RF14) per flight ranges from 4.3 %–8.9 % at flight altitude. Generally, the largest CAM emissions during the WISE campaign are seen in tropical Θhigh–PVlow air with a strong decrease in the LS. The average CAM emissions in the LS range from 2.7 %–6.2 %, with the exception of air masses during RF14 and RF15 (also discussed below). Although larger CAM air mass fractions contribute to elevated bromine in tropical Θhigh–PVlow air, the HBrR only has 3.3 % of the air fraction from CAM, similarly to the LMS, which has mostly low CAM air mass contributions.
The first flight with large segments of elevated contributions of air masses from CAM was RF08 on 1 October 2017 (Fig. 3f). This flight, off the coast of Ireland over the Atlantic Ocean (up to 15.0∘ W), encountered the remnants of Hurricane Maria, which had transitioned into an extratropical cyclone and later dissipated on 2 October 2017 (Pasch et al., 2019). The average CAM surface air fraction along the flight track is 18.0±13.0 %, with the maximum contribution reaching 60.6 % at 20:35 UTC at Θ=361 K and K (Fig. 3a, f). However, sections with increased CAM air mass fractions only reached the UT, while the two flight sections breaching into the LS have low CAM emissions. This low-pressure system transported surface air with increased CAM air mass fractions (25 %–45 %), CO, and N2O to the UT, bringing with it more brominated VSLS up to [BrVSLS] = 5.8 ppt (at 17:29 UTC in Fig. 3g), coinciding with flight sections in tropical Θhigh–PVlow air (light gray shaded sections). These flight segments in tropical Θhigh–PVlow air with large CAM air mass fractions additionally have ∼20 % of the air mass fraction from the TME, resulting in the UT [Brorg] > 19.2 ppt and [Brtot] = 20.7–23.4 ppt between 15:35–17:41 UTC. The combination of relatively large air mass fractions from CAM and TME in tropical Θhigh–PVlow air results in some of the most-bromine-rich air observed during WISE. Even though the tropospheric portions of the flight had elevated CAM emissions, the LS sections only have an average CAM air mass fraction of 3.1±1.7 % and low Brtot (17.1−18.9 ppt below the LS average, indicated by the gray dotted line in Fig. 3g). Only a short flight segment reached the HBrR, which is indicated by the dark gray shading in Fig. 3, where the CAM air mass fraction is low (∼1 %), while the TME air mass fraction is still ∼11 %. Further insights into the flight segment between 18:40−20:00 UTC are analyzed in the study by Schäfler et al. (2021). They use H2O and O3 lidar data as tropospheric and stratospheric tracers to discuss three mixing regimes near the tropopause fold indicating the presence of different air masses.
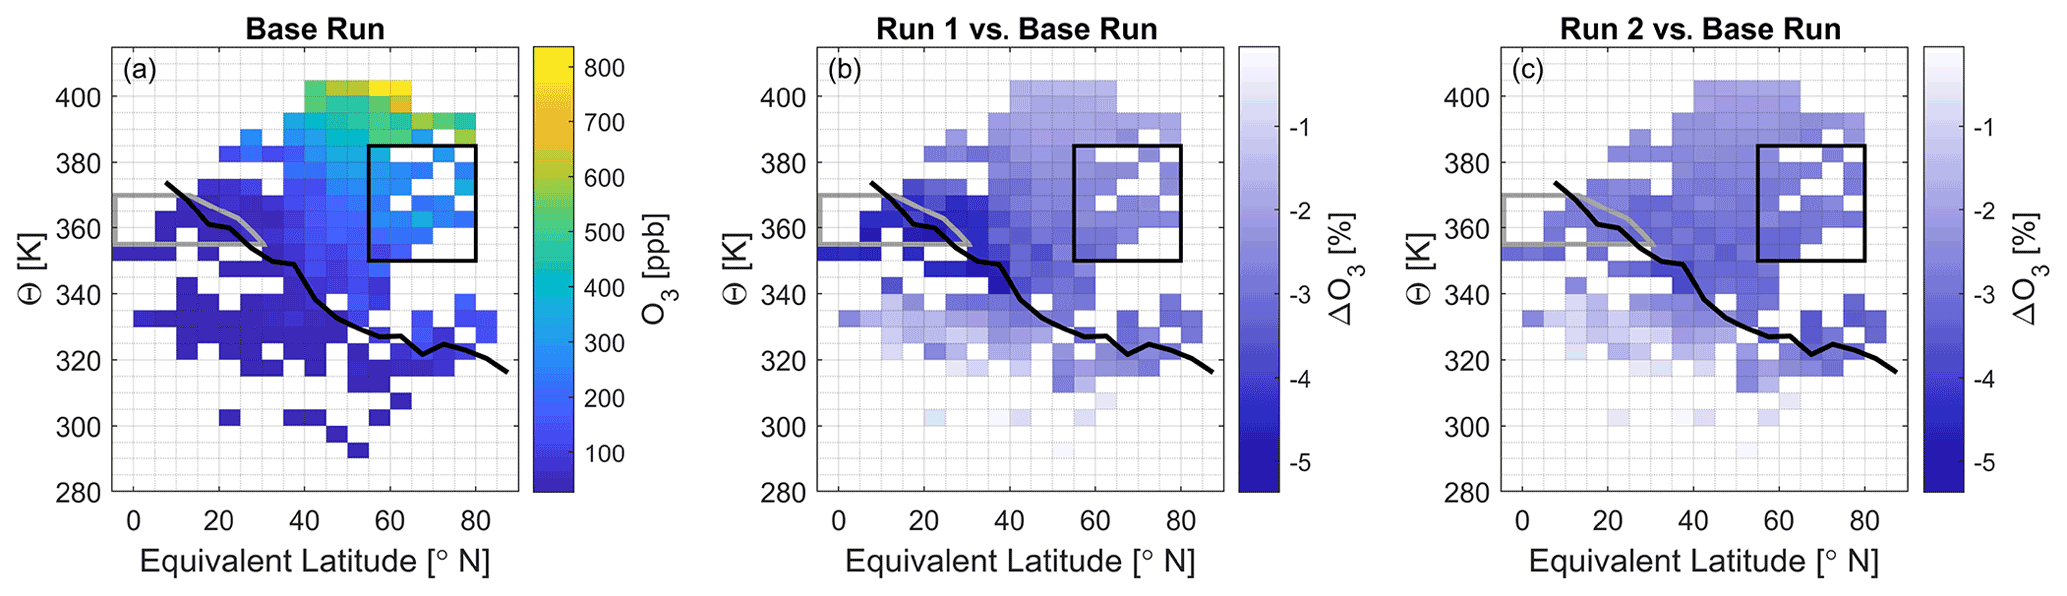
Figure 13TOMCAT model results of O3 impacted by elevated Brtot in the UTLS. Panel (a) displays the O3 VMR distribution from the base run using constant Brtot boundary conditions along the TP (see Table 3). Panel (b) shows the relative percentage ΔO3 between run 1 with elevated Brtot in the tropical UT and the base run. Panel (c) displays the relative ΔO3 between run 2 and the base run. The solid black line is the campaign-average WMO TP, the black box in the LMS is the HBrR, and the gray outline marks the tropical Θhigh–PVlow region.
A second tropical cyclone encountered during WISE was Hurricane Ophelia. It made landfall over Ireland on the 16 October 2017, dissipated over Norway 2 d later, and rapidly transported tropical air from Central America to Europe (Stewart, 2018). This is verified from data collected during RF14 on the 15 October 2017 (Fig. 12 left column). A large influence of surface emission tracers from CAM is present, with a flight average of 23.3±11.8 % (see Fig. 12a, c, e). The initial flight section between ∼ 13:20–15:00 UTC just below Θ=355 K indicates the transport of recently tropical air masses (low equivalent latitudes) with large CAM air mass fractions. Unlike RF08, this low-pressure system transported larger CAM air masses into the LMS. The average influence from CAM air masses in the LMS flight segments is 20.8±5.4 %. These are the largest influxes of CAM emissions into the LMS detected during the WISE campaign. Although this flight does not have organic bromine data available, the variability of air masses probed by the aircraft in the LMS is noticeable in . For example, between 16:04–16:58 UTC, the aircraft flew in the LMS (up to ΔΘ=16.7 K), and relatively low = 2.2±0.4 ppt was observed, with high CAM (22.3%±4.1 %) and TME (30.4±2.5 %) air fractions. Shortly after, between 17:04–17:46 UTC when the aircraft cruised in the UT (around K), elevated was observed and reached up to 7.8 ppt. During this event low CO and N2O mixing ratios, low CAM emissions (6.2±2.0 %), only slightly lower TME air mass fractions (24.2±3.6 %), and large air mass lag times (up to 1 year old) were observed in the UT. This event characterizes an intrusion of stratospheric air into the UT with >4 ppt (indicated by the light blue shading).
A third flight, RF15, on 19 October 2017 (Fig. 12 right column), around Ireland and the UK likely still captured former air masses from Hurricane Ophelia. The air of this flight is also characterized by a slightly elevated CAM influence in the LS, mainly with a surface emission of 8.9±4.1 % at extratropical equivalent latitudes (Fig. 12c–d). Only partial organic bromine data are available with slightly elevated VMRs (Fig. 12f). CH3Br VMRs up to 7.8 ppt and bromine in halons up to 8.1 ppt are observed in the LMS (ΔΘ=22 K), with elevated CAM emissions around 14 % (and TME air mass fractions ∼27 %). A similar event is again detected during the initial ascent between 09:25–09:38 UTC (light blue shading) after passing through a small stratospheric intrusion. Elevated >4 ppt and up to 9.2 ppt was observed in the UT ( K), while air mass fractions from CAM emissions were low (7.4±1.9 %), and TME emissions were around 25.0±1.8 %.
In summary, the synoptic-weather-system-related contributions from the CAM region evidently may directly impact observed UTLS bromine. The CLaMS simulations indicate the variety of different air masses influencing our observations. Near the tropical TP, high CAM air mass fractions (through rapid vertical transport by hurricanes), as well as high TME air mass fractions (uplifted by local convection associated with the Asian summer monsoon), result in significantly elevated Brtot observed in the former tropical Θhigh–PVlow air (RF08). However, in the LMS there are lower air mass fractions from CAM but still relatively high TME contributions, which also result in elevated Brtot, i.e., the HBrR during eight flights. Additionally, the two events with higher observed in the UT (shaded light blue sections in Fig. 12), with comparatively lower CAM emissions and low CO and N2O mixing ratios, are of particular interest. These events may indicate that air from the LMS intruded into the UT by a recent STE event, which is discussed in a recent study by Kunkel et al. (2019).
4.4 Impact on LMS O3
The isentropic transport of bromine-enriched air from tropical UT/TTL into the LMS likely has a significant impact on O3. In the HBrR, the average O3 measured is 301±69 ppb (with a range of 153−524 ppb), while the LS below and above has an average of 404±169 ppb (range 73−791 ppb), largely due to the significant increase of O3 further into the stratosphere that extends into the upper area of the HBrR. However, in the HBrR, lower O3 VMRs are measured with a slight increase below the HBrR (see Fig. 5e).
In order to investigate the influence of elevated bromine on the Ex-LS O3, we conducted three simulations using the 3-D global TOMCAT model with 22 months' integration time (see Sect. 2.6). The base run was initialized with constant bromine (19.6 ppt from the Ex-TP) VMRs along the entire TP. Run 1 and 2 each had elevated bromine boundary conditions in the tropical UT in addition to the Ex-TP boundary conditions from the base run (see Table 3). Run 1 and 2 are initialized with an additional [Brtot] of 1.2 and 2.1 ppt, respectively, in the tropical UT. The increase in run 1 is mainly due to increased , while the increase of Brtot in run 2 is largely due to additional BrVSLS.
These increases of bromine in the tropical UT lead to additional destruction of O3 in the LMS. The simulations can be used as a measure of the O3 sensitivity due to transport of bromine-enriched air from the tropical Θhigh–PVlow region into the LMS by the lower branch of the Brewer–Dobson circulation. The TOMCAT O3 VMR distribution over the NH from the base run is shown in Fig. 13a and is comparable to the FAIRO-measured O3 VMRs (Fig. 5e). The relative changes of TOMCAT O3 between the base run and either run 1 or 2 are displayed in Fig. 13b–c, respectively. The impact of increasing tropical UT bromine (run 1) leads to 5.0±0.4 % more Brtot in the HBrR compared to the base run, which results in an O3 change of % (panel b). Run 2 leads to 8.7±0.7 % more Brtot in the HBrR compared to the base run, which results in an O3 change of % (panel c). In the HBrR, the absolute O3 mixing ratios change by ppb (run 1) and ppb (run 2) (not shown). The decrease of O3 is not strictly linear with increasing Brtot, partially due to the nature of the increased bromine ( vs. BrVSLS) differing between run 1 and 2, as well as other feedback loops such as via lower stratospheric HOx chemistry.
The average relative O3 loss throughout the whole LS is % and % for run 1 and 2, respectively. However, the largest relative O3 decreases are observed along the tropical TP where there is the largest bromine enhancement due to the initialization. Further significant decreases of O3 extend to the midlatitudes along the TP. Run 1 has the strongest O3 decreases up to −5.4 % along the TP in the tropics to 40∘ N equivalent latitude (in comparison to the base run). As the bromine increase in run 1 is mainly in the form of , this shows the efficiency and immediate destruction of O3 by . Run 2 has a maximum O3 decrease of −3.9 %; however the strongest decreases are not near the tropical TP but rather along the midlatitude TP. As the bromine increase of run 2 is largely in the form of BrVSLS, O3 is not immediately destroyed because of the time delay for the conversion of Brorg to . Although the O3 destruction is not as strong near the source of increased bromine in run 2 compared to run 1, the O3 decrease extends further towards the pole just above the TP. The O3 decrease along the TP up to ΔΘ<20 K results in % and % for run 1 and 2, respectively (available data only between equivalent latitudes of N).
A study by Hossaini et al. (2015) analyzed the impact of increasing VSLS (bromine, chlorine and iodine) on O3 in the global LS. The model results showed LS O3 decreases of 4 %–12 %, where the brominated VSLS account for ∼85 % of the O3 destruction. In TTL, the O3 impact just below 100 hPa was %, with stronger decreases towards the TP and surface (Hossaini et al. (2015) Supplement Fig. S1). At 200 hPa at the North Pole, the relative O3 change was %, also with stronger decreases at lower altitudes. These are comparable relative O3 percentage changes to our study when considering only the bromine VSLS impact as well as a significantly larger difference of the VSLS bromine loading (up to 8 ppt) in their model runs. If the transport of source gases into the stratosphere in the tropics increases as climate change progresses, the strongest decrease in O3 can be expected near the cold-point TP in agreement with the simulations here (e.g., Hossaini et al., 2012a; Falk et al., 2017 and Ziska et al., 2017).
We report on simultaneous measurements of O3, NO2, BrO, Brorg, , and Brtot, as well as transport tracers (CO and N2O) and a tracer for the mean age of air (SF6), from the HALO aircraft during the WISE campaign of fall 2017 in the Northern Hemisphere (NH) upper troposphere and lower stratosphere (UTLS). Additionally, CLaMS simulations of O3, NO2, and BrO are reported with generally good agreement to the measurements. The majority of the observations vary between 8.5−14.5 km, reaching a potential temperature of Θ∼410 K and focusing on the lowermost stratosphere (LMS). The observations include air masses of the entire NH in equivalent latitudes, indicating geographical distributions as well as allowing for transport interpretation.
Brtot is assessed from simultaneous measurements of all relevant Brorg source gases and inferred . The Brorg source gases include CH3Br, the four halons, and the five major brominated, very short-lived substances. is inferred from remotely measured BrO scaled by the modeled partitioning. The resulting lower stratosphere (LS) weighted average is [Brtot] = 19.2±1.2 ppt. Our observations largely agree with previous measurements of Brtot in the UTLS (e.g., Engel and Rigby et al., 2018) but emphasize some of the causes for the variability in Brtot in the extratropical lower stratosphere (Ex-LS). Air mass lag times inferred from SF6 measurements vary by over 3 years.
Major insights into the causes of the Brtot variability have been gained from studying the geographical distribution of the brominated gases as well as transport tracers as a function of equivalent latitude, both from observations (Fig. 5) and transport modeling (Figs. 8 and 10). The key findings of our study are summarized in Fig. 7. Elevated Brtot is observed in a persistent region extending into the LMS, i.e., a subsection of the high bromine region (HBrR∗) with [Brtot] = 20.9±0.8 ppt.
The air mass origin tracers modeled by CLaMS agree reasonably well with our observations. They indicate that the HBrR in the LMS has 51.2 % of air originating from the tropical troposphere and 6.4 % from the midlatitude troposphere, which are mixed with only 27.1 % stratospheric background air (as well as contributions from other domains). The LS air masses below and above the HBrR show a decreasing tropospheric contribution while an approximately equivalent increasing stratospheric background contribution. This increase of approximately 10 % young (tropical and extratropical) tropospheric air in the HBrR compared to the LS below and above it is reflected in the bromine-rich air masses of the HBrR.
Additional CLaMS surface emission simulations indicate the majority of surface contributions to the HBrR are from the Asian monsoon region (AMR) and its tropical adjacent region (TAR) and account for 30.0 % of the air mass in the HBrR. Only a small fraction of air (3.3 %) in the HBrR originates from Central America (CAM). The LS regions below and above the HBrR only receive 23.2 % from the AMR and TAR. This shows the efficiency of the vertical uplift of the AMR rapidly transporting surface air from the TAR and specifically the tropical marine environment (TME) into the tropical upper troposphere and tropopause layer (UT/TTL) and further via the lower branch of the Brewer–Dobson circulation into the Ex-LS. This transport pathway in boreal late summer and fall has a direct impact on the trace gas composition and specifically of bromine in the northern LMS. Our study complements previous studies on the importance of the transport of air masses via the lower branch of the Brewer–Dobson circulation (e.g., Hoor et al., 2005; Levine et al., 2007; Bönisch et al., 2009; Vogel et al., 2016 and Hauck et al., 2020).
However, during WISE we observed additional causes for varying bromine in the UT. Notably, air masses of high bromine were transported by two hurricanes from CAM into the tropical UT, i.e., the Θhigh–PVlow region, of which the remnants were later observed to the west of the British Isles on 1 October 2017 (RF08). These large CAM (and TME) contributions led to the bromine-richest air masses observed during WISE, with [Brtot] = 21.6±0.7 ppt in the Θhigh–PVlow region. Additionally, our flights captured two stratosphere–troposphere exchange (STE) events where stratospheric air of elevated was recently transported into the UT caused by breaking Rossby waves in the extratropics.
Transport of younger bromine-rich tropospheric air masses into the LMS directly impacts LS O3. The consequences of more Brtot in the LS on O3 are analyzed with TOMCAT model simulations. An enhancement of ppt Brtot in the tropical UT and further in the LS through isentropic transport results in the LS O3 change of % (average of two elevated bromine scenarios), conveying its sensitivity to bromine. The O3 change in the 20 K layer directly above the tropopause (TP) is %.
The continuous nature of our measurements covering a large range of air mass lag times, even for individual flights, offers several advantages over previous mainly balloon and some aircraft-related studies on Brtot. This includes an improved space and time resolution as well as a higher precision and accuracy of inferred Brtot. Another major advantage of the aircraft measurements is the ability to display the widespread behavior of Brorg, , and Brtot in the investigated air masses. The multi-pathway transport of bromine (as well as of other gases) into the northern LMS via the major branches may well be very specific for the region and season (midlatitudes in boreal fall) investigated in the present study. However, it lends evidence that bromine as well as other O3-harming gases is not simply injected into the stratosphere from a single source region but that a manifold of different pathways may act (e.g., Holton et al., 1995; Homeyer and Bowman, 2013; Ploeger et al., 2015; Kunkel et al., 2019). In this respect, further probing the TP region and LS for Brtot and other O3-depleting species is required. Ultimately, the detected variability of Brtot in the UTLS may not give a firm answer on Brtot and its trend in the middle and upper stratosphere. Therefore, probing the middle and upper stratosphere for Brtot (and other O3-depleting substances) by ground-based, balloon-based instrumentation, as well as satellites, is still required in the future.
Most data are available on the HALO data depository (http://doi.org/10.17616/R39Q0T, last access: 1 October 2021, re3data.org, 2020): 7118–7147 (mini-DOAS BrO and NO2 data), 5669–5698 (FAIRO O3 data), 5616–5653 (DLR BAHAMAS aircraft data), 5974–5988 (UMAQS CO and N2O data), 5556–5585 (GhOST organic bromine and SF6 VMR and mean air mass lag time data), and 5449–5480 (CLaMS equivalent latitudes and air mass origin tracers). These data sets are accessible upon signing a data protocol. The surface emission tracer and trace gas curtains from CLaMS as well as the TOMCAT simulations are available upon request.
MKR, TH, FK, BS, and KP operated the mini-DOAS instrument; AE, TK, and TS provided the GhOST measurements; AZ and his group provided FAIRO O3 data; PH and VB provided the UMAQS data; JUG and BV provided the CLaMS simulations; and MPC provided the TOMCAT model results. MKR performed the data analysis and wrote the paper with contributions from KP.
The authors declare that they have no conflict of interest.
Publisher’s note: Copernicus Publications remains neutral with regard to jurisdictional claims in published maps and institutional affiliations.
This article is part of the special issue “WISE: Wave-driven isentropic exchange in the extratropical upper troposphere and lower stratosphere (ACP/AMT/WCD inter-journal SI)”. It is not associated with a conference.
We thank the Deutsches Zentrum für Luft- und Raumfahrt (DLR) for the support to get the instrument certified and the DLR Flugexperimente Team at Oberpfaffenhofen, in particular, Frank Probst, Martina Hierle, Andreas Minikin, and Andrea Hausold, for the support given during the WISE mission. Special thanks are given to the scientific coordinators of the WISE campaign, Peter Hoor (University of Mainz) and Martin Riese (FZJ). For more information about the WISE campaign, visit https://www.wise2017.de/ (last access: 1 October 2021). The authors gratefully acknowledge the computing time for the CLaMS curtain simulations granted on the supercomputer JURECA at Jülich Supercomputing Centre (JSC) under the VSR project ID JICG11. The TOMCAT/SLIMCAT simulations were performed on the Leeds ARC and ARCHER national HPC machines. The authors acknowledge EARLINET for providing aerosol LIDAR profiles available at https://data.earlinet.org/ (last access: 10 September 2018). The research leading to these results has received funding from the European Union’s Horizon 2020 research and innovation programme under grant agreement no. 654109 and previously from the European Union Seventh Framework Programme (FP7/2007-2013) under grant agreement no. 262254. Additionally, the authors acknowledge the use of SAGE III – ISS aerosol data, which were obtained from the NASA Langley Research Center Atmospheric Science Data Center.
This research has been supported by the Deutsche Forschungsgemeinschaft (grant nos. HALO-SPP 1294, PF 384/16, PF 384/17, PF 384/19, EN 367/11, EN 367/13, EN 367/13-1, EN 367/14-1, HO 4225/7-1, HO 4225/8-1, and VO 1276/5-1), the Bundesministerium für Bildung und Forschung (grant nos. 01LG1908D, 01LG1908B, and 01LG1908C), and the National Centre for Earth Observation (grant no. NE/R001782/1).
This paper was edited by Mathias Palm and reviewed by Qing Liang and one anonymous referee.
Adcock, K. E., Fraser, P. J., Hall, B. D., Langenfelds, R. L., Lee, G., Montzka, S. A., Oram, D. E., Röckmann, T., Stroh, F., Sturges, W. T., Vogel, B., and Laube, J. C.: Aircraft-Based Observations of Ozone-Depleting Substances in the Upper Troposphere and Lower Stratosphere in and Above the Asian Summer Monsoon, J. Geophys. Res.-Atmos., 126, e2020JD033137, https://doi.org/10.1029/2020JD033137, 2021. a, b, c, d
Aliwell, S. R., Van Roozendael, M., Johnston, P. V., Richter, A., Wagner, T., Arlander, D. W., Burrows, J. P., Fish, D. J., Jones, R. L., Tørnkvist, K. K., Lambert, J.-C., Pfeilsticker, K., and Pundt, I.: Analysis for BrO in zenith-sky spectra: An intercomparison exercise for analysis improvement, J. Geophys. Res.-Atmos., 107, D144199, https://doi.org/10.1029/2001JD000329, 2002. a, b, c
Aschmann, J. and Sinnhuber, B.-M.: Contribution of very short-lived substances to stratospheric bromine loading: uncertainties and constraints, Atmos. Chem. Phys., 13, 1203–1219, https://doi.org/10.5194/acp-13-1203-2013, 2013. a, b
Aschmann, J., Sinnhuber, B.-M., Atlas, E. L., and Schauffler, S. M.: Modeling the transport of very short-lived substances into the tropical upper troposphere and lower stratosphere, Atmos. Chem. Phys., 9, 9237–9247, https://doi.org/10.5194/acp-9-9237-2009, 2009. a
Aschmann, J., Sinnhuber, B.-M., Chipperfield, M. P., and Hossaini, R.: Impact of deep convection and dehydration on bromine loading in the upper troposphere and lower stratosphere, Atmos. Chem. Phys., 11, 2671–2687, https://doi.org/10.5194/acp-11-2671-2011, 2011. a, b
Ashfold, M. J., Harris, N. R. P., Atlas, E. L., Manning, A. J., and Pyle, J. A.: Transport of short-lived species into the Tropical Tropopause Layer, Atmos. Chem. Phys., 12, 6309–6322, https://doi.org/10.5194/acp-12-6309-2012, 2012. a
Ball, W. T., Alsing, J., Mortlock, D. J., Staehelin, J., Haigh, J. D., Peter, T., Tummon, F., Stübi, R., Stenke, A., Anderson, J., Bourassa, A., Davis, S. M., Degenstein, D., Frith, S., Froidevaux, L., Roth, C., Sofieva, V., Wang, R., Wild, J., Yu, P., Ziemke, J. R., and Rozanov, E. V.: Evidence for a continuous decline in lower stratospheric ozone offsetting ozone layer recovery, Atmos. Chem. Phys., 18, 1379–1394, https://doi.org/10.5194/acp-18-1379-2018, 2018. a, b
Ball, W. T., Alsing, J., Staehelin, J., Davis, S. M., Froidevaux, L., and Peter, T.: Stratospheric ozone trends for 1985–2018: sensitivity to recent large variability, Atmos. Chem. Phys., 19, 12731–12748, https://doi.org/10.5194/acp-19-12731-2019, 2019. a
Ball, W. T., Chiodo, G., Abalos, M., Alsing, J., and Stenke, A.: Inconsistencies between chemistry–climate models and observed lower stratospheric ozone trends since 1998, Atmos. Chem. Phys., 20, 9737–9752, https://doi.org/10.5194/acp-20-9737-2020, 2020. a
Barrera, J. A., Fernandez, R. P., Iglesias-Suarez, F., Cuevas, C. A., Lamarque, J.-F., and Saiz-Lopez, A.: Seasonal impact of biogenic very short-lived bromocarbons on lowermost stratospheric ozone between 60° N and 60° S during the 21st century, Atmos. Chem. Phys., 20, 8083–8102, https://doi.org/10.5194/acp-20-8083-2020, 2020. a, b
Birner, T. and Bönisch, H.: Residual circulation trajectories and transit times into the extratropical lowermost stratosphere, Atmos. Chem. Phys., 11, 817–827, https://doi.org/10.5194/acp-11-817-2011, 2011. a, b
Bogumil, K., Orphal, J., Homann, T., Voigt, S., Spietz, P., Fleischmann, O. C., Vogel, A., Hartmann, M., Kromminga, H., Bovensmann, H., Frerick, J., and Burrows, J. P.: Measurements of molecular absorption spectra with the SCIAMACHY pre-flight model: instrument characterization and reference data for atmospheric remote-sensing in the 230–2380 nm region, J. Photochem. Photobiol. A.: Chem., 157, 167–184, https://doi.org/10.1016/S1010-6030(03)00062-5, 2003. a
Bönisch, H., Engel, A., Curtius, J., Birner, Th., and Hoor, P.: Quantifying transport into the lowermost stratosphere using simultaneous in-situ measurements of SF6 and CO2, Atmos. Chem. Phys., 9, 5905–5919, https://doi.org/10.5194/acp-9-5905-2009, 2009. a, b, c, d, e, f, g, h
Brinckmann, S., Engel, A., Bönisch, H., Quack, B., and Atlas, E.: Short-lived brominated hydrocarbons – observations in the source regions and the tropical tropopause layer, Atmos. Chem. Phys., 12, 1213–1228, https://doi.org/10.5194/acp-12-1213-2012, 2012. a
Bucci, S., Legras, B., Sellitto, P., D'Amato, F., Viciani, S., Montori, A., Chiarugi, A., Ravegnani, F., Ulanovsky, A., Cairo, F., and Stroh, F.: Deep-convective influence on the upper troposphere–lower stratosphere composition in the Asian monsoon anticyclone region: 2017 StratoClim campaign results, Atmos. Chem. Phys., 20, 12193–12210, https://doi.org/10.5194/acp-20-12193-2020, 2020. a
Butchart, N. and Remsberg, E. E.: The Area of the Stratospheric Polar Vortex as a Diagnostic for Tracer Transport on an Isentropic Surface, J. Atmos. Sci., 43, 1319–1339, https://doi.org/10.1175/1520-0469(1986)043<1319:TAOTSP>2.0.CO;2, 1986. a, b
Chance, K. and Kurucz, R.: An improved high-resolution solar reference spectrum for earth's atmosphere measurements in the ultraviolet, visible, and near infrared, J. Quant. Spectrosc. Ra., 111, 1289–1295, https://doi.org/10.1016/j.jqsrt.2010.01.036, 2010. a, b, c
Chipperfield, M. P.: Multiannual simulations with a three-dimensional chemical transport model, J. Geophys. Res.-Atmos., 104, 1781–1805, https://doi.org/10.1029/98JD02597, 1999. a, b
Chipperfield, M. P.: New Version of the TOMCAT/SLIMCAT Off-Line Chemical Transport Model: Intercomparison of Stratospheric Tracer Experiments, Q. J. Roy. Meteor. Soc., 132, 1179–1203, https://doi.org/10.1256/qj.05.51, 2006. a, b
Chipperfield, M. P., Dhomse, S., Hossaini, R., Feng, W., Santee, M. L., Weber, M., Burrows, J. P., Wild, J. D., Loyola, D., and Coldewey-Egbers, M.: On the Cause of Recent Variations in Lower Stratospheric Ozone, Geophys. Res. Lett., 45, 5718–5726, https://doi.org/10.1029/2018GL078071, 2018. a, b, c
Chipperfield, M. P., Hossaini, R., Montzka, S. A., Reimann, S., Sherry, D., and Tegtmeier, S.: Renewed and emerging concerns over the production and emission of ozone-depleting substances, Nat. Rev. Earth Environ., 1, 251–263, https://doi.org/10.1038/s43017-020-0048-8, 2020. a, b
Dee, D. P., Uppala, S. M., Simmons, A. J., Berrisford, P., Poli, P., Kobayashi, S., Andrae, U., Balmaseda, M. A., Balsamo, G., Bauer, P., Bechtold, P., Beljaars, A. C. M., van de Berg, L., Bidlot, J., Bormann, N., Delsol, C., Dragani, R., Fuentes, M., Geer, A. J., Haimberger, L., Healy, S. B., Hersbach, H., Hólm, E. V., Isaksen, L., Kallberg, P., Köhler, M., Matricardi, M., McNally, A. P., Monge-Sanz, B. M., Morcrette, J.-J., Park, B.-K., Peubey, C., de Rosnay, P., Tavolato, C., Thepaut, J.-N., and Vitart, F.: The ERA-Interim reanalysis: configuration and performance of the data assimilation system, Q. J. Roy. Meteor. Soc., 137, 553–597, https://doi.org/10.1002/qj.828, 2011. a, b
Deutschmann, T., Beirle, S., Frieß, U., Grzegorski, M., Kern, C., Kritten, L., Platt, U., Prados-Román, C., Puķīte, J., Wagner, T., Werner, B., and Pfeilsticker, K.: The Monte Carlo Atmospheric Radiative Transfer Model McArtim: Introduction and Validation of Jacobians and 3D Features, J. Quant. Spectrosc. Ra., 112, 1119–1137, https://doi.org/10.1016/j.jqsrt.2010.12.009, 2011. a, b
Dhomse, S., Feng, W., Montzka, S., Hossaini, R., Keeble, J., Pyle, J., Daniel, J., and Chipperfield, M.: Delay in recovery of the Antarctic ozone hole from unexpected CFC-11 emissions, Nat. Commun., 10, 5781, https://doi.org/10.1038/s41467-019-13717-x, 2019. a
Dorf, M., Bösch, H., Butz, A., Camy-Peyret, C., Chipperfield, M. P., Engel, A., Goutail, F., Grunow, K., Hendrick, F., Hrechanyy, S., Naujokat, B., Pommereau, J.-P., Van Roozendael, M., Sioris, C., Stroh, F., Weidner, F., and Pfeilsticker, K.: Balloon-borne stratospheric BrO measurements: comparison with Envisat/SCIAMACHY BrO limb profiles, Atmos. Chem. Phys., 6, 2483–2501, https://doi.org/10.5194/acp-6-2483-2006, 2006a. a
Dorf, M., Butler, J., Butz, A., Camy-Peyret, C., Chipperfield, M., Kritten, L., Montzka, S., Simmes, B., Weidner, F., and Pfeilsticker, K.: Long-term observations of stratospheric bromine reveal slow down in growth, Geophys. Res. Lett., 33, https://doi.org/10.1029/2006GL027714, 2006b. a
Dorf, M., Butz, A., Camy-Peyret, C., Chipperfield, M. P., Kritten, L., and Pfeilsticker, K.: Bromine in the tropical troposphere and stratosphere as derived from balloon-borne BrO observations, Atmos. Chem. Phys., 8, 7265–7271, https://doi.org/10.5194/acp-8-7265-2008, 2008. a, b
Engel, A. and Rigby, M. (Lead authors), Burkholder, J. B., Fernandez, R. P., Froidevaux, L., Hall, B. D., Hossaini, R., Saito, T., Vollmer, M. K., and Yao, B.: Update on Ozone-Depleting Substances (ODSs) and Other Gases of Interest to the Montreal Protocol, Chap. 1, in: Scientific Assessment of Ozone Depletion: 2018, Global Ozone Research and Monitoring Project – Report No. 58, World Meteorological Organization, Geneva, Switzerland, 2018. a, b, c, d, e, f, g, h, i, j, k, l, m, n, o
Ermel, M., Oswald, R., Mayer, J.-C., Moravek, A., Song, G., Beck, M., Meixner, F. X., and Trebs, I.: Preparation Methods to Optimize the Performance of Sensor Discs for Fast Chemiluminescence Ozone Analyzers, Environ. Sci. Technol., 47, 1930–1936, https://doi.org/10.1021/es3040363, 2013. a
Falk, S., Sinnhuber, B.-M., Krysztofiak, G., Jöckel, P., Graf, P., and Lennartz, S. T.: Brominated VSLS and their influence on ozone under a changing climate, Atmos. Chem. Phys., 17, 11313–11329, https://doi.org/10.5194/acp-17-11313-2017, 2017. a, b
Fiehn, A., Quack, B., Marandino, C. A., and Krüger, K.: Transport Variability of Very Short Lived Substances From the West Indian Ocean to the Stratosphere, J. Geophys. Res.-Atmos., 123, 5720–5738, https://doi.org/10.1029/2017JD027563, 2018. a
Filus, M. T., Atlas, E. L., Navarro, M. A., Meneguz, E., Thomson, D., Ashfold, M. J., Carpenter, L. J., Andrews, S. J., and Harris, N. R. P.: Transport of short-lived halocarbons to the stratosphere over the Pacific Ocean, Atmos. Chem. Phys., 20, 1163–1181, https://doi.org/10.5194/acp-20-1163-2020, 2020. a
Fix, A., Steinebach, F., Wirth, M., Schäfler, A., and Ehret, G.: Development and application of an airborne differential absorption lidar for the simultaneous measurement of ozone and water vapor profiles in the tropopause region, Appl. Opt., 58, 5892–5900, https://doi.org/10.1364/AO.58.005892, 2019. a
Fleischmann, O. C., Hartmann, M., Burrows, J. P., and Orphal, J.: New ultraviolet absorption cross-sections of BrO at atmospheric temperatures measured by a time-windowing Fourier transform spectroscopy, J. Photochem. Photobiol. A.: Chem., 168, 117–132, https://doi.org/10.1016/j.jphotochem.2004.03.026, 2004. a
Fueglistaler, S., Wernli, H., and Peter, T.: Tropical troposphere-to-stratosphere transport inferred from trajectory calculations, J. Geophys. Res.-Atmos., 109, D03108, https://doi.org/10.1029/2003JD004069, 2004. a, b
Fueglistaler, S., Dessler, A. E., Dunkerton, T. J., Folkins, I., Fu, Q., and Mote, P. W.: Tropical tropopause layer, Rev. Geophys., 47, RG1004, https://doi.org/10.1029/2008RG000267, 2009. a, b
Garny, H. and Randel, W. J.: Transport pathways from the Asian monsoon anticyclone to the stratosphere, Atmos. Chem. Phys., 16, 2703–2718, https://doi.org/10.5194/acp-16-2703-2016, 2016. a
Gettelman, A., Hoor, P., Pan, L. L., Randel, W. J., Hegglin, M. I., and Birner, T.: The extratropical upper troposphere and lower stratosphere, Rev. Geophys., 49, RG3003, https://doi.org/10.1029/2011RG000355, 2011. a, b, c
Grooß, J.-U., Engel, I., Borrmann, S., Frey, W., Günther, G., Hoyle, C. R., Kivi, R., Luo, B. P., Molleker, S., Peter, T., Pitts, M. C., Schlager, H., Stiller, G., Vömel, H., Walker, K. A., and Müller, R.: Nitric acid trihydrate nucleation and denitrification in the Arctic stratosphere, Atmos. Chem. Phys., 14, 1055–1073, https://doi.org/10.5194/acp-14-1055-2014, 2014. a, b
Hamer, P. D., Marécal, V., Hossaini, R., Pirre, M., Krysztofiak, G., Ziska, F., Engel, A., Sala, S., Keber, T., Bönisch, H., Atlas, E., Krüger, K., Chipperfield, M., Catoire, V., Samah, A. A., Dorf, M., Siew Moi, P., Schlager, H., and Pfeilsticker, K.: Cloud-scale modelling of the impact of deep convection on the fate of oceanic bromoform in the troposphere: a case study over the west coast of Borneo, Atmos. Chem. Phys. Discuss. [preprint], https://doi.org/10.5194/acp-2020-655, in review, 2020. a
Harder, H., Camy-Peyret, C., Ferlemann, F., Fitzenberger, R., Hawat, T., Osterkamp, H., Schneider, M., Perner, D., Platt, U., Vradelis, P., and Pfeilsticker, K.: Stratospheric BrO profiles measured at different latitudes and seasons: atmospheric observations, Geophys. Res. Lett., 25, 3843–3846, https://doi.org/10.1029/1998GL900026, 1998. a
Harder, H., Bösch, H., Camy-Peyret, C., Chipperfield, M. P., Fitzenberger, R., Payan, S., Perner, D., Platt, U., Sinnhuber, B.-M., and Pfeilsticker, K.: Comparison of measured and modeled stratospheric BrO: Implications for the total amount of stratospheric bromine, Geophys. Res. Lett., 27, 3695–3698, https://doi.org/10.1029/1999GL011215, 2000. a
Harris, N. R. P., Carpenter, L. J., Lee, J. D., Vaughan, G., Filus, M. T., Jones, R. L., OuYang, B., Pyle, J. A., Robinson, A. D., Andrews, S. J., Lewis, A. C., Minaeian, J., Vaughan, A., Dorsey, J. R., Gallagher, M. W., Le Breton, M., Newton, R., Percival, C. J., Ricketts, H. M. A., Bauguitte, S. J.-B., Nott, G. J., Wellpott, A., Ashfold, M. J., Flemming, J., Butler, R., Palmer, P. I., Kaye, P. H., Stopford, C., Chemel, C., Boesch, H., Humpage, N., Vick, A., MacKenzie, A. R., Hyde, R., Angelov, P., Meneguz, E., and Manning, A. J.: Coordinated Airborne Studies in the Tropics (CAST), B. Am. Meteorol. Soc., 98, 145–162, https://doi.org/10.1175/BAMS-D-14-00290.1, 2017. a
Hauck, M., Bönisch, H., Hoor, P., Keber, T., Ploeger, F., Schuck, T. J., and Engel, A.: A convolution of observational and model data to estimate age of air spectra in the northern hemispheric lower stratosphere, Atmos. Chem. Phys., 20, 8763–8785, https://doi.org/10.5194/acp-20-8763-2020, 2020. a, b
Hendrick, F., Van Roozendael, M., Chipperfield, M. P., Dorf, M., Goutail, F., Yang, X., Fayt, C., Hermans, C., Pfeilsticker, K., Pommereau, J.-P., Pyle, J. A., Theys, N., and De Mazière, M.: Retrieval of stratospheric and tropospheric BrO profiles and columns using ground-based zenith-sky DOAS observations at Harestua, 60∘ N, Atmos. Chem. Phys., 7, 4869–4885, https://doi.org/10.5194/acp-7-4869-2007, 2007. a
Hendrick, F., Johnston, P. V., De Mazière, M., Fayt, C., Hermans, C., Kreher, K., Theys, N., Thomas, A., and Van Roozendael, M.: One-decade trend analysis of stratospheric BrO over Harestua (60∘ N) and Lauder (45∘ S) reveals a decline, Geophys. Res. Lett., 35, l14801, https://doi.org/10.1029/2008GL034154, 2008. a, b
Hendrick, F., Rozanov, A., Johnston, P. V., Bovensmann, H., De Mazière, M., Fayt, C., Hermans, C., Kreher, K., Lotz, W., Sinnhuber, B.-M., Theys, N., Thomas, A., Burrows, J. P., and Van Roozendael, M.: Multi-year comparison of stratospheric BrO vertical profiles retrieved from SCIAMACHY limb and ground-based UV-visible measurements, Atmos. Meas. Tech., 2, 273–285, https://doi.org/10.5194/amt-2-273-2009, 2009. a
Holton, J. R., Haynes, P. H., McIntyre, M. E., Douglass, A. R., Rood, R. B., and Pfister, L.: Stratosphere-troposphere exchange, Rev. Geophys., 33, 403–439, https://doi.org/10.1029/95RG02097, 1995. a, b, c, d, e, f, g
Homeyer, C. R. and Bowman, K. P.: Rossby Wave Breaking and Transport between the Tropics and Extratropics above the Subtropical Jet, J. Atmos. Sci., 70, 607–626, https://doi.org/10.1175/JAS-D-12-0198.1, 2013. a, b, c, d
Hoor, P., Fischer, H., and Lelieveld, J.: Tropical and extratropical tropospheric air in the lowermost stratosphere over Europe: A CO-based budget, Geophys. Res. Lett., 32, l07802, https://doi.org/10.1029/2004gl022018, 2005. a, b, c
Hossaini, R., Chipperfield, M. P., Dhomse, S., Ordóñez, C., Saiz-Lopez, A., Abraham, N. L., Archibald, A., Braesicke, P., Telford, P., Warwick, N., Yang, X., and Pyle, J.: Modelling future changes to the stratospheric source gas injection of biogenic bromocarbons, Geophys. Res. Lett., 39, l20813, https://doi.org/10.1029/2012GL053401, 2012a. a, b
Hossaini, R., Chipperfield, M. P., Feng, W., Breider, T. J., Atlas, E., Montzka, S. A., Miller, B. R., Moore, F., and Elkins, J.: The contribution of natural and anthropogenic very short-lived species to stratospheric bromine, Atmos. Chem. Phys., 12, 371–380, https://doi.org/10.5194/acp-12-371-2012, 2012b. a
Hossaini, R., Mantle, H., Chipperfield, M. P., Montzka, S. A., Hamer, P., Ziska, F., Quack, B., Krüger, K., Tegtmeier, S., Atlas, E., Sala, S., Engel, A., Bönisch, H., Keber, T., Oram, D., Mills, G., Ordóñez, C., Saiz-Lopez, A., Warwick, N., Liang, Q., Feng, W., Moore, F., Miller, B. R., Marécal, V., Richards, N. A. D., Dorf, M., and Pfeilsticker, K.: Evaluating global emission inventories of biogenic bromocarbons, Atmos. Chem. Phys., 13, 11819–11838, https://doi.org/10.5194/acp-13-11819-2013, 2013. a
Hossaini, R., Chipperfield, M. P., Montzka, S. A., Rap, A., Dhomse, S., and Feng, W.: Efficiency of short-lived halogens at influencing climate through depletion of stratospheric ozone, Nat. Geosci., 8, 186–190, https://doi.org/10.1038/ngeo2363, 2015. a, b, c
Hossaini, R., Patra, P. K., Leeson, A. A., Krysztofiak, G., Abraham, N. L., Andrews, S. J., Archibald, A. T., Aschmann, J., Atlas, E. L., Belikov, D. A., Bönisch, H., Carpenter, L. J., Dhomse, S., Dorf, M., Engel, A., Feng, W., Fuhlbrügge, S., Griffiths, P. T., Harris, N. R. P., Hommel, R., Keber, T., Krüger, K., Lennartz, S. T., Maksyutov, S., Mantle, H., Mills, G. P., Miller, B., Montzka, S. A., Moore, F., Navarro, M. A., Oram, D. E., Pfeilsticker, K., Pyle, J. A., Quack, B., Robinson, A. D., Saikawa, E., Saiz-Lopez, A., Sala, S., Sinnhuber, B.-M., Taguchi, S., Tegtmeier, S., Lidster, R. T., Wilson, C., and Ziska, F.: A multi-model intercomparison of halogenated very short-lived substances (TransCom-VSLS): linking oceanic emissions and tropospheric transport for a reconciled estimate of the stratospheric source gas injection of bromine, Atmos. Chem. Phys., 16, 9163–9187, https://doi.org/10.5194/acp-16-9163-2016, 2016. a, b
Hüneke, T.: The scaling method applied to HALO measurements: Inferring absolute trace gas concentrations from airborne limb spectroscopy under all sky conditions, Phd, University of Heidelberg, Heidelberg, Germany, https://www.iup.uni-heidelberg.de/research/stratosphere/publications#theses (last access: 1 October 2021), 2016. a
Hüneke, T., Aderhold, O.-A., Bounin, J., Dorf, M., Gentry, E., Grossmann, K., Grooß, J.-U., Hoor, P., Jöckel, P., Kenntner, M., Knapp, M., Knecht, M., Lörks, D., Ludmann, S., Matthes, S., Raecke, R., Reichert, M., Weimar, J., Werner, B., Zahn, A., Ziereis, H., and Pfeilsticker, K.: The novel HALO mini-DOAS instrument: inferring trace gas concentrations from airborne UV/visible limb spectroscopy under all skies using the scaling method, Atmos. Meas. Tech., 10, 4209–4234, https://doi.org/10.5194/amt-10-4209-2017, 2017. a, b, c, d, e, f, g, h, i, j, k, l, m, n, o
Höpfner, M., Orphal, J., von Clarmann, T., Stiller, G., and Fischer, H.: Stratospheric BrONO2 observed by MIPAS, Atmos. Chem. Phys., 9, 1735–1746, https://doi.org/10.5194/acp-9-1735-2009, 2009. a
Inai, Y., Fujita, R., Machida, T., Matsueda, H., Sawa, Y., Tsuboi, K., Katsumata, K., Morimoto, S., Aoki, S., and Nakazawa, T.: Seasonal characteristics of trace gas transport into the extratropical upper troposphere and lower stratosphere, Atmos. Chem. Phys., 19, 7073–7103, https://doi.org/10.5194/acp-19-7073-2019, 2019. a
Irvine, W. M.: The formation of absorption bands and the distribution of photon optical paths in a scattering atmosphere, Bull. Astron. Inst. Neth., 17, 266–279, 1964. a
Jensen, E.-J., Pfister, L., Jordan, D. E., Fahey, D. W., Newman, P. A., Thornberry, T., Rollins, A., Diskin, G., Bui, T. P., McGill, M., Hlavka, D., Lawson, R. P., Gao, R.-S., Pilewskie, P., Elkins, J., Hintsa, E., Moore, F., Mahoney, M. J., Atlas, E., Stutz, J., Pfeilsticker, K., Wofsy, S., Evan, S., and Rosenlof, K. H.: The NASA Airborne Tropical TRopopause EXperiment (ATTREX), SPARC Newsletter, 41, 15–24, http://issuu.com/sparc-climate/docs/41_sparcnewsletter_jul2013_web/24 (last access: 1 October 2021), 2013. a
Kaluza, T., Kunkel, D., and Hoor, P.: Composite analysis of the tropopause inversion layer in extratropical baroclinic waves, Atmos. Chem. Phys., 19, 6621–6636, https://doi.org/10.5194/acp-19-6621-2019, 2019. a
Keber, T., Bönisch, H., Hartick, C., Hauck, M., Lefrancois, F., Obersteiner, F., Ringsdorf, A., Schohl, N., Schuck, T., Hossaini, R., Graf, P., Jöckel, P., and Engel, A.: Bromine from short-lived source gases in the extratropical northern hemispheric upper troposphere and lower stratosphere (UTLS), Atmos. Chem. Phys., 20, 4105–4132, https://doi.org/10.5194/acp-20-4105-2020, 2020. a, b, c, d, e, f, g
Kluge, F., Hüneke, T., Knecht, M., Lichtenstern, M., Rotermund, M., Schlager, H., Schreiner, B., and Pfeilsticker, K.: Profiling of formaldehyde, glyoxal, methylglyoxal, and CO over the Amazon: normalized excess mixing ratios and related emission factors in biomass burning plumes, Atmos. Chem. Phys., 20, 12363–12389, https://doi.org/10.5194/acp-20-12363-2020, 2020. a, b
Knecht, M.: Simulation of radiative field modification due to tropical clouds, Master’s thesis, University of Heidelberg, Heidelberg, Germany, https://www.iup.uni-heidelberg.de/de/research/stratosphere/files/theses/masters/MA_thesis_Matthias_final.pdf, (last access: 29 January 2021), 2015. a
Ko, M. K. W., Newman, P. A., Reimann, S., and Strahan, E.: Lifetimes of Stratospheric Ozone-Depleting Substances, Their Replacements, and Related Species, SPARC Report, WCRP-15/2013, 1–255, http://www.sparc-climate.org/publications/sparc-reports/ (last access: 1 October 2021), 2013. a
Koenig, T. K., Volkamer, R., Baidar, S., Dix, B., Wang, S., Anderson, D. C., Salawitch, R. J., Wales, P. A., Cuevas, C. A., Fernandez, R. P., Saiz-Lopez, A., Evans, M. J., Sherwen, T., Jacob, D. J., Schmidt, J., Kinnison, D., Lamarque, J.-F., Apel, E. C., Bresch, J. C., Campos, T., Flocke, F. M., Hall, S. R., Honomichl, S. B., Hornbrook, R., Jensen, J. B., Lueb, R., Montzka, D. D., Pan, L. L., Reeves, J. M., Schauffler, S. M., Ullmann, K., Weinheimer, A. J., Atlas, E. L., Donets, V., Navarro, M. A., Riemer, D., Blake, N. J., Chen, D., Huey, L. G., Tanner, D. J., Hanisco, T. F., and Wolfe, G. M.: BrO and inferred Bry profiles over the western Pacific: relevance of inorganic bromine sources and a Bry minimum in the aged tropical tropopause layer, Atmos. Chem. Phys., 17, 15245–15270, https://doi.org/10.5194/acp-17-15245-2017, 2017. a, b, c, d
Konopka, P., Ploeger, F., Tao, M., Birner, T., and Riese, M.: Hemispheric asymmetries and seasonality of mean age of air in the lower stratosphere: Deep versus shallow branch of the Brewer-Dobson circulation, J. Geophys. Res.-Atmos., 120, 2053–2066, https://doi.org/10.1002/2014JD022429, 2015. a, b
Kovács, T., Feng, W., Totterdill, A., Plane, J. M. C., Dhomse, S., Gómez-Martín, J. C., Stiller, G. P., Haenel, F. J., Smith, C., Forster, P. M., García, R. R., Marsh, D. R., and Chipperfield, M. P.: Determination of the atmospheric lifetime and global warming potential of sulfur hexafluoride using a three-dimensional model, Atmos. Chem. Phys., 17, 883–898, https://doi.org/10.5194/acp-17-883-2017, 2017. a
Kreycy, S., Camy-Peyret, C., Chipperfield, M. P., Dorf, M., Feng, W., Hossaini, R., Kritten, L., Werner, B., and Pfeilsticker, K.: Atmospheric test of the ratio: implications for total stratospheric Bry and bromine-mediated ozone loss, Atmos. Chem. Phys., 13, 6263–6274, https://doi.org/10.5194/acp-13-6263-2013, 2013. a, b
Kunkel, D., Hoor, P., Kaluza, T., Ungermann, J., Kluschat, B., Giez, A., Lachnitt, H.-C., Kaufmann, M., and Riese, M.: Evidence of small-scale quasi-isentropic mixing in ridges of extratropical baroclinic waves, Atmos. Chem. Phys., 19, 12607–12630, https://doi.org/10.5194/acp-19-12607-2019, 2019. a, b, c, d, e, f, g
Laube, J. C., Engel, A., Bönisch, H., Möbius, T., Worton, D. R., Sturges, W. T., Grunow, K., and Schmidt, U.: Contribution of very short-lived organic substances to stratospheric chlorine and bromine in the tropics – a case study, Atmos. Chem. Phys., 8, 7325–7334, https://doi.org/10.5194/acp-8-7325-2008, 2008. a
Levine, J. G., Braesicke, P., Harris, N. R. P., Savage, N. H., and Pyle, J. A.: Pathways and timescales for troposphere-to-stratosphere transport via the tropical tropopause layer and their relevance for very short lived substances, J. Geophys. Res.-Atmos., 112, D04308, https://doi.org/10.1029/2005JD006940, 2007. a, b, c, d, e, f
Li, D., Vogel, B., Bian, J., Müller, R., Pan, L. L., Günther, G., Bai, Z., Li, Q., Zhang, J., Fan, Q., and Vömel, H.: Impact of typhoons on the composition of the upper troposphere within the Asian summer monsoon anticyclone: the SWOP campaign in Lhasa 2013, Atmos. Chem. Phys., 17, 4657–4672, https://doi.org/10.5194/acp-17-4657-2017, 2017. a
Li, D., Vogel, B., Müller, R., Bian, J., Günther, G., and Riese, M.: Tropical cyclones reduce ozone in the tropopause region over the western Pacific: An analysis of 18-year ozonesonde profiles, Earth's Future, 9, 2020EF001635, https://doi.org/10.1029/2020EF001635, 2021. a
Liang, Q., Stolarski, R. S., Kawa, S. R., Nielsen, J. E., Douglass, A. R., Rodriguez, J. M., Blake, D. R., Atlas, E. L., and Ott, L. E.: Finding the missing stratospheric Bry: a global modeling study of CHBr3 and CH2Br2, Atmos. Chem. Phys., 10, 2269–2286, https://doi.org/10.5194/acp-10-2269-2010, 2010. a
Liang, Q., Atlas, E., Blake, D., Dorf, M., Pfeilsticker, K., and Schauffler, S.: Convective transport of very short lived bromocarbons to the stratosphere, Atmos. Chem. Phys., 14, 5781–5792, https://doi.org/10.5194/acp-14-5781-2014, 2014. a, b
McKenna, D. S., Grooß, J.-U., Günther, G., Konopka, P., Müller, R., Carver, G., and Sasano, Y.: A new Chemical Lagrangian Model of the Stratosphere (CLaMS) 2. Formulation of chemistry scheme and initialization, J. Geophys. Res.-Atmos., 107, D154256, https://doi.org/10.1029/2000JD000113, 2002a. a
McKenna, D. S., Konopka, P., Grooß, J.-U., Günther, G., Müller, R., Spang, R., Offermann, D., and Orsolini, Y.: A new Chemical Lagrangian Model of the Stratosphere (CLaMS) 1. Formulation of advection and mixing, J. Geophys. Res.-Atmos., 107, D164309, https://doi.org/10.1029/2000JD000114, 2002b. a, b
Montzka, S. A., Butler, J. H., Hall, B. D., Mondeel, D. J., and Elkins, J. W.: A decline in tropospheric organic bromine, Geophys. Res. Lett., 30, 1826–1829, https://doi.org/10.1029/2003GL017745, 2003. a
Müller, S., Hoor, P., Berkes, F., Bozem, H., Klingebiel, M., Reutter, P., Smit, H. G. J., Wendisch, M., Spichtinger, P., and Borrmann, S.: In situ detection of stratosphere-troposphere exchange of cirrus particles in the midlatitudes, Geophys. Res. Lett., 42, 949–955, https://doi.org/10.1002/2014GL062556, 2015. a, b
Müller, S., Hoor, P., Bozem, H., Gute, E., Vogel, B., Zahn, A., Bönisch, H., Keber, T., Krämer, M., Rolf, C., Riese, M., Schlager, H., and Engel, A.: Impact of the Asian monsoon on the extratropical lower stratosphere: trace gas observations during TACTS over Europe 2012, Atmos. Chem. Phys., 16, 10573–10589, https://doi.org/10.5194/acp-16-10573-2016, 2016. a, b, c
NASA/LARC/SD/ASDC: SAGE III/ISS L1B Solar Event Transmission Data (HDF-EOS) V051, [data set], https://doi.org/10.5067/ISS/SAGEIII/SOLAR_HDF4_L1B-V5.1, 2017. a
Navarro, M. A., Atlas, E. L., Saiz-Lopez, A., Rodriguez-Lloveras, X., Kinnison, D. E., Lamarque, J.-F., Tilmes, S., Filus, M., Harris, N. R. P., Meneguz, E., Ashfold, M. J., Manning, A. J., Cuevas, C. A., Schauffler, S. M., and Donets, V.: Airborne measurements of organic bromine compounds in the Pacific tropical tropopause layer, P. Natl. Acad. Sci. USA, 112, 13789–13793, https://doi.org/10.1073/pnas.1511463112, 2015. a, b, c, d, e, f
Novelli, P. C., Masarie, K. A., and Lang, P. M.: Distributions and recent changes of carbon monoxide in the lower troposphere, J. Geophys. Res.-Atmos., 103, 19015–19033, https://doi.org/10.1029/98JD01366, 1998. a
Obersteiner, F., Bönisch, H., Keber, T., O'Doherty, S., and Engel, A.: A versatile, refrigerant- and cryogen-free cryofocusing–thermodesorption unit for preconcentration of traces gases in air, Atmos. Meas. Tech., 9, 5265–5279, https://doi.org/10.5194/amt-9-5265-2016, 2016. a, b
Orbe, C., Waugh, D. W., and Newman, P. A.: Air-mass origin in the tropical lower stratosphere: The influence of Asian boundary layer air, Geophys. Res. Lett., 42, 4240–4248, https://doi.org/10.1002/2015GL063937, 2015. a, b, c, d
Ordóñez, C., Lamarque, J.-F., Tilmes, S., Kinnison, D. E., Atlas, E. L., Blake, D. R., Sousa Santos, G., Brasseur, G., and Saiz-Lopez, A.: Bromine and iodine chemistry in a global chemistry-climate model: description and evaluation of very short-lived oceanic sources, Atmos. Chem. Phys., 12, 1423–1447, https://doi.org/10.5194/acp-12-1423-2012, 2012. a
Pan, L. L., Kunz, A., Homeyer, C. R., Munchak, L. A., Kinnison, D. E., and Tilmes, S.: Commentary on using equivalent latitude in the upper troposphere and lower stratosphere, Atmos. Chem. Phys., 12, 9187–9199, https://doi.org/10.5194/acp-12-9187-2012, 2012. a
Pan, L. L., Honomichl, S. B., Kinnison, D. E., Abalos, M., Randel, W. J., Bergman, J. W., and Bian, J.: Transport of chemical tracers from the boundary layer to stratosphere associated with the dynamics of the Asian summer monsoon, J. Geophys. Res.-Atmos., 121, 14159–14174, https://doi.org/10.1002/2016JD025616, 2016. a
Pan, L. L., Atlas, E. L., Salawitch, R. J., Honomichl, S. B., Bresch, J. F., Randel, W. J., Apel, E. C., Hornbrook, R. S., Weinheimer, A. J., Anderson, D. C., Andrews, S. J., Baidar, S., Beaton, S. P., Campos, T. L., Carpenter, L. J., Chen, D., Dix, B., Donets, V., Hall, S. R., Hanisco, T. F., Homeyer, C. R., Huey, L. G., Jensen, J. B., Kaser, L., Kinnison, D. E., Koenig, T. K., Lamarque, J.-F., Liu, C., Luo, J., Luo, Z. J., Montzka, D. D., Nicely, J. M., Pierce, R. B., Riemer, D. D., Robinson, T., Romashkin, P., Saiz-Lopez, A., Schauffler, S., Shieh, O., Stell, M. H., Ullmann, K., Vaughan, G., Volkamer, R., and Wolfe, G.: The Convective Transport of Active Species in the Tropics (CONTRAST) Experiment, B. Am. Meteorol. Soc., 98, 106–128, https://doi.org/10.1175/BAMS-D-14-00272.1, 2017. a
Pappalardo, G., Amodeo, A., Apituley, A., Comeron, A., Freudenthaler, V., Linné, H., Ansmann, A., Bösenberg, J., D'Amico, G., Mattis, I., Mona, L., Wandinger, U., Amiridis, V., Alados-Arboledas, L., Nicolae, D., and Wiegner, M.: EARLINET: towards an advanced sustainable European aerosol lidar network, [data set], Atmos. Meas. Tech., 7, 2389–2409, https://doi.org/10.5194/amt-7-2389-2014, 2014. a
Parrella, J. P., Chance, K., Salawitch, R. J., Canty, T., Dorf, M., and Pfeilsticker, K.: New retrieval of BrO from SCIAMACHY limb: an estimate of the stratospheric bromine loading during April 2008, Atmos. Meas. Tech., 6, 2549–2561, https://doi.org/10.5194/amt-6-2549-2013, 2013. a
Pasch, R. J., Penny, A. B., and Berg, R.: National Hurricane Center Tropical Cyclone Report: Hurricane Maria (AL152017), Tech. rep., NOAA: National Hurrican Center, Miami, FL, USA, https://www.nhc.noaa.gov/data/tcr/AL152017_Maria.pdf (last access: 1 October 2021), 2019. a
Pfeilsticker, K., Sturges, W. T., Bösch, H., Camy-Peyret, C., Chipperfield, M. P., Engel, A., Fitzenberger, R., Müller, M., Payan, S., and Sinnhuber, B.-M.: Lower stratospheric organic and inorganic bromine budget for the Arctic winter 1998/99, Geophys. Res. Lett., 27, 3305–3308, https://doi.org/10.1029/2000GL011650, 2000. a
Platt, U. and Stutz, J.: Differential Optical Absorption Spectroscopy (DOAS), Principle and Applications, ISBN 3-340-21193-4, Springer Verlag, Heidelberg, 2008. a
Ploeger, F., Günther, G., Konopka, P., Fueglistaler, S., Müller, R., Hoppe, C., Kunz, A., Spang, R., Grooß, J.-U., and Riese, M.: Horizontal water vapor transport in the lower stratosphere from subtropics to high latitudes during boreal summer, J. Geophys. Res.-Atmos., 118, 8111–8127, https://doi.org/10.1002/jgrd.50636, 2013. a
Ploeger, F., Abalos, M., Birner, T., Konopka, P., Legras, B., Müller, R., and Riese, M.: Quantifying the effects of mixing and residual circulation on trends of stratospheric mean age of air, Geophys. Res. Lett., 42, 2047–2054, https://doi.org/10.1002/2014GL062927, 2015. a, b, c, d, e
Pommrich, R., Müller, R., Grooß, J.-U., Konopka, P., Ploeger, F., Vogel, B., Tao, M., Hoppe, C. M., Günther, G., Spelten, N., Hoffmann, L., Pumphrey, H.-C., Viciani, S., D'Amato, F., Volk, C. M., Hoor, P., Schlager, H., and Riese, M.: Tropical troposphere to stratosphere transport of carbon monoxide and long-lived trace species in the Chemical Lagrangian Model of the Stratosphere (CLaMS), Geosci. Model Dev., 7, 2895–2916, https://doi.org/10.5194/gmd-7-2895-2014, 2014. a, b
Prinn, R. G., Weiss, R. F., Arduini, J., Arnold, T., DeWitt, H. L., Fraser, P. J., Ganesan, A. L., Gasore, J., Harth, C. M., Hermansen, O., Kim, J., Krummel, P. B., Li, S., Loh, Z. M., Lunder, C. R., Maione, M., Manning, A. J., Miller, B. R., Mitrevski, B., Mühle, J., O'Doherty, S., Park, S., Reimann, S., Rigby, M., Saito, T., Salameh, P. K., Schmidt, R., Simmonds, P. G., Steele, L. P., Vollmer, M. K., Wang, R. H., Yao, B., Yokouchi, Y., Young, D., and Zhou, L.: History of chemically and radiatively important atmospheric gases from the Advanced Global Atmospheric Gases Experiment (AGAGE), Earth Syst. Sci. Data, 10, 985–1018, https://doi.org/10.5194/essd-10-985-2018, 2018. a, b
Puķīte, J. and Wagner, T.: Quantification and parametrization of non-linearity effects by higher-order sensitivity terms in scattered light differential optical absorption spectroscopy, Atmos. Meas. Tech., 9, 2147–2177, https://doi.org/10.5194/amt-9-2147-2016, 2016. a, b
Quack, B., Atlas, E., Petrick, G., Stroud, V., Schauffler, S., and Wallace, D.: Oceanic bromoform sources for the tropical atmosphere, Geophys. Res. Lett., 31, L23S05, https://doi.org/10.1029/2004GL020597, 2004. a
Ray, E. A., Moore, F. L., Elkins, J. W., Rosenlof, K. H., Laube, J. C., Röckmann, T., Marsh, D. R., and Andrews, A. E.: Quantification of the SF6 lifetime based on mesospheric loss measured in the stratospheric polar vortex, J. Geophys. Res.-Atmos., 122, 4626–4638, https://doi.org/10.1002/2016JD026198, 2017. a
re3data.org: HALO database; editing status 2020-09-23; re3data.org – Registry of Research Data Repositories [data set], https://doi.org/10.17616/R39Q0T, 2020. a
Rolf, C., Vogel, B., Hoor, P., Afchine, A., Günther, G., Krämer, M., Müller, R., Müller, S., Spelten, N., and Riese, M.: Water vapor increase in the lower stratosphere of the Northern Hemisphere due to the Asian monsoon anticyclone observed during the TACTS/ESMVal campaigns, Atmos. Chem. Phys., 18, 2973–2983, https://doi.org/10.5194/acp-18-2973-2018, 2018. a
Rothman, L. S., Gordon, I. E., Barbe, A., Benner, D. C., Bernath, P. F., Birk, M., Boudon, V., Brown, L. R., Campargue, A., Champion, J.-P., Chance, K., Coudert, L. H., Dana, V., Devi, V. M., Fally, S., Flaud, J.-M., Gamache, R. R., Goldman, A., Jacquemart, D., Kleiner, I., Lacome, N., Lafferty, W. J., Mandin, J.-Y., Massie, S. T., Mikhailenko, S. N., Miller, C. E., Moazzen-Ahmadi, N., Naumenko, O. V., Nikitin, A. V., Orphal, J., Perevalov, V. I., Perrin, A., Predoi-Cross, A., Rinsland, C. P., Rotger, M., Šimečková, M., Smith, M. A. H., Sung, K., Tashkun, S. A., Tennyson, J., Toth, R. A., Vandaele, A. C., and Vander Auwera, J.: The HITRAN 2008 molecular spectroscopic database, J. Quant. Spectrosc. Ra., 110, 533–572, https://doi.org/10.1016/j.jqsrt.2009.02.013, 2009. a
Rozanov, A., Kühl, S., Doicu, A., McLinden, C., Puķīte, J., Bovensmann, H., Burrows, J. P., Deutschmann, T., Dorf, M., Goutail, F., Grunow, K., Hendrick, F., von Hobe, M., Hrechanyy, S., Lichtenberg, G., Pfeilsticker, K., Pommereau, J. P., Van Roozendael, M., Stroh, F., and Wagner, T.: BrO vertical distributions from SCIAMACHY limb measurements: comparison of algorithms and retrieval results, Atmos. Meas. Tech., 4, 1319–1359, https://doi.org/10.5194/amt-4-1319-2011, 2011. a
Sala, S., Bönisch, H., Keber, T., Oram, D. E., Mills, G., and Engel, A.: Deriving an atmospheric budget of total organic bromine using airborne in situ measurements from the western Pacific area during SHIVA, Atmos. Chem. Phys., 14, 6903–6923, https://doi.org/10.5194/acp-14-6903-2014, 2014. a, b, c, d, e
Salawitch, R. J., Weisenstein, D. K., Kovalenko, L. J., Sioris, C. E., Wennberg, P. O., Chance, K., Ko, M. K. W., and McLinden, C. A.: Sensitivity of ozone to bromine in the lower stratosphere, Geophys. Res. Lett., 32, L05811, https://doi.org/10.1029/2004GL021504, 2005. a
Sander, S., Friedl, R. R., Barker, J., Golden, D., Kurylo, M., Wine, P., Abbat, J., Burkholder, J., Kolb, C. E., Moortgat, G. K., Huie, R., and Orkin, V.: Chemical kinetics and photochemical data for use in atmospheric studies: Evaluation Number 17, Technical Report, NASA/JPL Publication, 17, https://jpldataeval.jpl.nasa.gov/previous_evaluations.html (last access: 1 October 2021), 2011. a
Schäfler, A., Fix, A., and Wirth, M.: Mixing at the extratropical tropopause as characterized by collocated airborne H2O and O3 lidar observations, Atmos. Chem. Phys., 21, 5217–5234, https://doi.org/10.5194/acp-21-5217-2021, 2021. a, b, c
Schauffler, S., Atlas, E., Blake, D., Flocke, F., Lueb, R., Lee-Taylor, J., Stroud, V., and Travnicek, W.: Distribution of brominated organic compounds in the upper troposphere and lower stratosphere, J. Geophys. Res., 104, 21513–21535, https://doi.org/10.1029/1999JD900197, 1999. a
Schauffler, S. M., Heidt, L. E., Pollock, W. H., Gilpin, T. M., Vedder, J. F., Solomon, S., Lueb, R. A., and Atlas, E. L.: Measurements of halogenated organic compounds near the tropical tropopause, Geophys. Res. Lett., 20, 2567–2570, https://doi.org/10.1029/93GL02840, 1993. a
Schauffler, S. M., Atlas, E. L., Flocke, F., Lueb, R. A., Stroud, V., and Travnicek, W.: Measurement of bromine-containing organic compounds at the tropical tropopause, Geophys. Res. Lett., 25, 317–320, https://doi.org/10.1029/98GL00040, 1998. a
Schmidt, J. A., Jacob, D. J., Horowitz, H. M., Hu, L., Sherwen, T., Evans, M. J., Liang, Q., Suleiman, R. M., Oram, D. E., Le Breton, M., Percival, C. J., Wang, S., Dix, B., and Volkamer, R.: Modeling the observed tropospheric BrO background: Importance of multiphase chemistry and implications for ozone, OH, and mercury, J. Geophys. Res.-Atmos., 121, 11819–11835, https://doi.org/10.1002/2015JD024229, 2015JD024229, 2016. a, b, c
Serdyuchenko, A., Gorshelev, V., Weber, M., Chehade, W., and Burrows, J. P.: High spectral resolution ozone absorption cross-sections – Part 2: Temperature dependence, Atmos. Meas. Tech., 7, 625–636, https://doi.org/10.5194/amt-7-625-2014, 2014. a, b, c
Sinnhuber, B.-M. and Folkins, I.: Estimating the contribution of bromoform to stratospheric bromine and its relation to dehydration in the tropical tropopause layer, Atmos. Chem. Phys., 6, 4755–4761, https://doi.org/10.5194/acp-6-4755-2006, 2006. a
Sinnhuber, B.-M., Rozanov, A., Sheode, N., Afe, O. T., Richter, A., innhuber, B.-M. and Folkins, I.: Estimating the contribution of bromoform to stratospheric bromine and its relation to dehydration in the tropical tropopause layer, Atmos. Chem. Phys., 6, 4755–4761, https://doi.org/10.5194/acp-6-4755-2006, 2006. a
Sioris, C. E., Kovalenko, L. J., McLinden, C. A., Salawitch, R. J., Van Roozendael, M., Goutail, F., Dorf, M., Pfeilsticker, K., Chance, K., von Savigny, C., Liu, X., Kurosu, T. P., Pommereau, J.-P., Bösch, H., and Frerick, J.: Latitudinal and vertical distribution of bromine monoxide in the lower stratosphere from Scanning Imaging Absorption Spectrometer for Atmospheric Chartography limb scattering measurements, J. Geophys. Res.-Atmos., 111, D14301, https://doi.org/10.1029/2005JD006479, 2006. a
Stachnik, R. A., Millán, L., Jarnot, R., Monroe, R., McLinden, C., Kühl, S., Puķīte, J., Shiotani, M., Suzuki, M., Kasai, Y., Goutail, F., Pommereau, J. P., Dorf, M., and Pfeilsticker, K.: Stratospheric BrO abundance measured by a balloon-borne submillimeterwave radiometer, Atmos. Chem. Phys., 13, 3307–3319, https://doi.org/10.5194/acp-13-3307-2013, 2013. a
Stewart, S. R.: National Hurricane Center Tropical Cyclone Report: Hurricane Ophelia (AL172017), Tech. rep., NOAA: National Hurrican Center, Miami, FL, USA, https://www.nhc.noaa.gov/data/tcr/AL172017_Ophelia.pdf (last access: 1 October 2021), 2018. a
Stutz, J., Werner, B., Spolaor, M., Scalone, L., Festa, J., Tsai, C., Cheung, R., Colosimo, S. F., Tricoli, U., Raecke, R., Hossaini, R., Chipperfield, M. P., Feng, W., Gao, R.-S., Hintsa, E. J., Elkins, J. W., Moore, F. L., Daube, B., Pittman, J., Wofsy, S., and Pfeilsticker, K.: A new Differential Optical Absorption Spectroscopy instrument to study atmospheric chemistry from a high-altitude unmanned aircraft, Atmos. Meas. Tech., 10, 1017–1042, https://doi.org/10.5194/amt-10-1017-2017, 2017. a, b, c, d, e, f
Thalman, R. and Volkamer, R.: Temperature dependent absorption cross-sections of O2–O2 collision pairs between 340 and 630 nm and at atmospherically relevant pressure, Phys. Chem. Chem. Phys., 15, 15371–15381, https://doi.org/10.1039/C3CP50968K, 2013. a, b
Vogel, B., Pan, L. L., Konopka, P., Günther, G., Müller, R., Hall, W., Campos, T., Pollack, I., Weinheimer, A., Wei, J., Atlas, E. L., and Bowman, K. P.: Transport pathways and signatures of mixing in the extratropical tropopause region derived from Lagrangian model simulations, J. Geophys. Res.-Atmos., 116, D05306, https://doi.org/10.1029/2010JD014876, 2011. a, b, c
Vogel, B., Günther, G., Müller, R., Grooß, J.-U., Hoor, P., Krämer, M., Müller, S., Zahn, A., and Riese, M.: Fast transport from Southeast Asia boundary layer sources to northern Europe: rapid uplift in typhoons and eastward eddy shedding of the Asian monsoon anticyclone, Atmos. Chem. Phys., 14, 12745–12762, https://doi.org/10.5194/acp-14-12745-2014, 2014. a, b, c
Vogel, B., Günther, G., Müller, R., Grooß, J.-U., and Riese, M.: Impact of different Asian source regions on the composition of the Asian monsoon anticyclone and of the extratropical lowermost stratosphere, Atmos. Chem. Phys., 15, 13699–13716, https://doi.org/10.5194/acp-15-13699-2015, 2015. a, b
Vogel, B., Günther, G., Müller, R., Grooß, J.-U., Afchine, A., Bozem, H., Hoor, P., Krämer, M., Müller, S., Riese, M., Rolf, C., Spelten, N., Stiller, G. P., Ungermann, J., and Zahn, A.: Long-range transport pathways of tropospheric source gases originating in Asia into the northern lower stratosphere during the Asian monsoon season 2012, Atmos. Chem. Phys., 16, 15301–15325, https://doi.org/10.5194/acp-16-15301-2016, 2016. a, b, c, d, e, f
Vogel, B., Müller, R., Günther, G., Spang, R., Hanumanthu, S., Li, D., Riese, M., and Stiller, G. P.: Lagrangian simulations of the transport of young air masses to the top of the Asian monsoon anticyclone and into the tropical pipe, Atmos. Chem. Phys., 19, 6007–6034, https://doi.org/10.5194/acp-19-6007-2019, 2019. a, b, c, d, e
Vollmer, M. K., Mühle, J., Trudinger, C. M., Rigby, M., Montzka, S. A., Harth, C. M., Miller, B. R., Henne, S., Krummel, P. B., Hall, B. D., Young, D., Kim, J., Arduini, J., Wenger, A., Yao, B., Reimann, S., O'Doherty, S., Maione, M., Etheridge, D. M., Li, S., Verdonik, D. P., Park, S., Dutton, G., Steele, L. P., Lunder, C. R., Rhee, T. S., Hermansen, O., Schmidbauer, N., Wang, R. H. J., Hill, M., Salameh, P. K., Langenfelds, R. L., Zhou, L., Blunier, T., Schwander, J., Elkins, J. W., Butler, J. H., Simmonds, P. G., Weiss, R. F., Prinn, R. G., and Fraser, P. J.: Atmospheric histories and global emissions of halons H-1211 (CBrClF2), H-1301 (CBrF3), and H-2402 (CBrF2CBrF2), J. Geophys. Res.-Atmos., 121, 3663–3686, https://doi.org/10.1002/2015JD024488, 2016. a
von Hobe, M., Ploeger, F., Konopka, P., Kloss, C., Ulanowski, A., Yushkov, V., Ravegnani, F., Volk, C. M., Pan, L. L., Honomichl, S. B., Tilmes, S., Kinnison, D. E., Garcia, R. R., and Wright, J. S.: Upward transport into and within the Asian monsoon anticyclone as inferred from StratoClim trace gas observations, Atmos. Chem. Phys., 21, 1267–1285, https://doi.org/10.5194/acp-21-1267-2021, 2021. a, b, c, d
Wales, P. A., Salawitch, R. J., Nicely, J. M., Anderson, D. C., Canty, T. P., Baidar, S., Dix, B., Koenig, T. K., Volkamer, R., Chen, D., Huey, L. G., Tanner, D. J., Cuevas, C. A., Fernandez, R. P., Kinnison, D. E., Lamarque, J.-F., Saiz-Lopez, A., Atlas, E. L., Hall, S. R., Navarro, M. A., Pan, L. L., Schauffler, S. M., Stell, M., Tilmes, S., Ullmann, K., Weinheimer, A. J., Akiyoshi, H., Chipperfield, M. P., Deushi, M., Dhomse, S. S., Feng, W., Graf, P., Hossaini, R., Jöckel, P., Mancini, E., Michou, M., Morgenstern, O., Oman, L. D., Pitari, G., Plummer, D. A., Revell, L. E., Rozanov, E., Saint-Martin, D., Schofield, R., Stenke, A., Stone, K. A., Visioni, D., Yamashita, Y., and Zeng, G.: Stratospheric Injection of Brominated Very Short-Lived Substances: Aircraft Observations in the Western Pacific and Representation in Global Models, J. Geophys. Res.-Atmos., 123, 5690–5719, https://doi.org/10.1029/2017JD027978, 2018. a, b, c, d
Wang, S., Schmidt, J. A., Baidar, S., Coburn, S., Dix, B., Koenig, T. K., Apel, E., Bowdalo, D., Campos, T. L., Eloranta, E., Evans, M. J., DiGangi, J. P., Zondlo, M. A., Gao, R.-S., Haggerty, J. A., Hall, S. R., Hornbrook, R. S., Jacob, D., Morley, B., Pierce, B., Reeves, M., Romashkin, P., ter Schure, A., and Volkamer, R.: Active and widespread halogen chemistry in the tropical and subtropical free troposphere, P. Natl. Acad. Sci. USA, 112, 9281–9286, https://doi.org/10.1073/pnas.1505142112, 2015. a, b
Wang, S., Kinnison, D., Montzka, S. A., Apel, E. C., Hornbrook, R. S., Hills, A. J., Blake, D. R., Barletta, B., Meinardi, S., Sweeney, C., Moore, F., Long, M., Saiz‐Lopez, A., Fernandez, R. P., Tilmes, S., Emmons, L. K., and Lamarque, J.: Ocean Biogeochemistry Control on the Marine Emissions of Brominated Very Short‐Lived Ozone‐Depleting Substances: A Machine‐Learning Approach, J. Geophys. Res.-Atmos., 124, 12319–12339, https://doi.org/10.1029/2019JD031288, 2019. a
Warwick, N. J., Pyle, J. A., Carver, G. D., Yang, X., Savage, N. H., O'Connor, F. M., and Cox, R. A.: Global modeling of biogenic bromocarbons, J. Geophys. Res., 111, D24305, https://doi.org/10.1029/2006JD007264, 2006. a
Werner, B., Stutz, J., Spolaor, M., Scalone, L., Raecke, R., Festa, J., Colosimo, S. F., Cheung, R., Tsai, C., Hossaini, R., Chipperfield, M. P., Taverna, G. S., Feng, W., Elkins, J. W., Fahey, D. W., Gao, R.-S., Hintsa, E. J., Thornberry, T. D., Moore, F. L., Navarro, M. A., Atlas, E., Daube, B. C., Pittman, J., Wofsy, S., and Pfeilsticker, K.: Probing the subtropical lowermost stratosphere and the tropical upper troposphere and tropopause layer for inorganic bromine, Atmos. Chem. Phys., 17, 1161–1186, https://doi.org/10.5194/acp-17-1161-2017, 2017. a, b, c, d, e, f, g, h, i, j, k, l
Wetzel, G., Oelhaf, H., Höpfner, M., Friedl-Vallon, F., Ebersoldt, A., Gulde, T., Kazarski, S., Kirner, O., Kleinert, A., Maucher, G., Nordmeyer, H., Orphal, J., Ruhnke, R., and Sinnhuber, B.-M.: Diurnal variations of BrONO2 observed by MIPAS-B at midlatitudes and in the Arctic, Atmos. Chem. Phys., 17, 14631–14643, https://doi.org/10.5194/acp-17-14631-2017, 2017. a
Wetzel, G., Friedl-Vallon, F., Glatthor, N., Grooß, J.-U., Gulde, T., Höpfner, M., Johansson, S., Khosrawi, F., Kirner, O., Kleinert, A., Kretschmer, E., Maucher, G., Nordmeyer, H., Oelhaf, H., Orphal, J., Piesch, C., Sinnhuber, B.-M., Ungermann, J., and Vogel, B.: Pollution trace gases C2H6, C2H2, HCOOH, and PAN in the North Atlantic UTLS: observations and simulations, Atmos. Chem. Phys., 21, 8213–8232, https://doi.org/10.5194/acp-21-8213-2021, 2021. a, b, c, d
Wilmouth, D. M., Janisco, T. F., Donahue, N. M., and Anderson, J. G.: Fourier Transform Ultraviolet Spectroscopy of the Transition of BrO, J. Phys. Chem. A, 103, 8935–8945, https://doi.org/10.1021/jp991651o, 1999. a
Wisher, A., Oram, D. E., Laube, J. C., Mills, G. P., van Velthoven, P., Zahn, A., and Brenninkmeijer, C. A. M.: Very short-lived bromomethanes measured by the CARIBIC observatory over the North Atlantic, Africa and Southeast Asia during 2009–2013, Atmos. Chem. Phys., 14, 3557–3570, https://doi.org/10.5194/acp-14-3557-2014, 2014. a
WMO: (World Meteorological Organisation), Scientific Assessment of Ozone Depletion: 2018, Global Ozone Research and Monitoring Project–Report No. 58, Geneve, Switzerland, p. 588, 2018. a, b, c
Yan, X., Konopka, P., Ploeger, F., Podglajen, A., Wright, J. S., Müller, R., and Riese, M.: The efficiency of transport into the stratosphere via the Asian and North American summer monsoon circulations, Atmos. Chem. Phys., 19, 15629–15649, https://doi.org/10.5194/acp-19-15629-2019, 2019. a
Yokouchi, Y., Hasebe, F., Fujiwara, M., Takashima, H., Shiotani, M., Nishi, N., Kanaya, Y., Hashimoto, S., Fraser, P., Toom-Sauntry, D., Mukai, H., and Nojiri, Y.: Correlations and emission ratios among bromoform, dibromochloromethane, and dibromomethane in the atmosphere, J. Geophys. Res.-Atmos., 110, d23309, https://doi.org/10.1029/2005JD006303, 2005. a
Zahn, A., Weppner, J., Widmann, H., Schlote-Holubek, K., Burger, B., Kühner, T., and Franke, H.: A fast and precise chemiluminescence ozone detector for eddy flux and airborne application, Atmos. Meas. Tech., 5, 363–375, https://doi.org/10.5194/amt-5-363-2012, 2012. a, b
Ziska, F., Quack, B., Abrahamsson, K., Archer, S. D., Atlas, E., Bell, T., Butler, J. H., Carpenter, L. J., Jones, C. E., Harris, N. R. P., Hepach, H., Heumann, K. G., Hughes, C., Kuss, J., Krüger, K., Liss, P., Moore, R. M., Orlikowska, A., Raimund, S., Reeves, C. E., Reifenhäuser, W., Robinson, A. D., Schall, C., Tanhua, T., Tegtmeier, S., Turner, S., Wang, L., Wallace, D., Williams, J., Yamamoto, H., Yvon-Lewis, S., and Yokouchi, Y.: Global sea-to-air flux climatology for bromoform, dibromomethane and methyl iodide, Atmos. Chem. Phys., 13, 8915–8934, https://doi.org/10.5194/acp-13-8915-2013, 2013. a
Ziska, F., Quack, B., Tegtmeier, S., Stemmler, I., and Krüger, K.: Future emissions of marine halogenated very-short lived substances under climate change, J. Atmos. Chem., 74, 245–260, https://doi.org/10.1007/s10874-016-9355-3, 2017. a, b