the Creative Commons Attribution 4.0 License.
the Creative Commons Attribution 4.0 License.
 | 14 Oct 2021
Competing effects of aerosol reductions and circulation changes for future improvements in Beijing haze
Laura J. Wilcox
Massimo Bollasina
Steven T. Turnock
Marianne T. Lund
Lixia Zhang
Despite local emission reductions, severe haze events remain a serious issue in Beijing. Previous studies have suggested that both greenhouse gas increases and aerosol decreases are likely to increase the frequency of weather patterns conducive to haze events. However, the combined effect of atmospheric circulation changes and aerosol and precursor emission changes on Beijing haze remains unclear.
We use the Shared Socioeconomic Pathways (SSPs) to explore the effects of aerosol and greenhouse gas emission changes on both haze weather and Beijing haze itself. We confirm that the occurrence of haze weather patterns is likely to increase in future under all SSPs and show that even though aerosol reductions play a small role, greenhouse gas increases are the main driver, especially during the second half of the 21st century. However, the severity of the haze events decreases on decadal timescales by as much as 70 % by 2100. The main influence on the haze itself is the reductions in local aerosol emissions, which outweigh the effects of changes in atmospheric circulation patterns. This demonstrates that aerosol reductions are beneficial, despite their influence on the circulation.
- Article
(3446 KB) - Full-text XML
-
Supplement
(3120 KB) - BibTeX
- EndNote


Over a million premature deaths in China were attributed to poor air quality in 2010, accounting for over 30 % of the mortality due to air pollution worldwide (Lelieveld et al., 2015; Zhang et al., 2017). Ambitious clean air policies, designed to address this serious issue, have resulted in dramatic reductions in Chinese emissions of the particulate matter and gases that contribute to poor air quality since 2008. Sulfur dioxide (SO2) and black carbon (BC) emissions declined by 70 % and 35 % respectively between 2008 and 2017 (Zheng et al., 2018; Li et al., 2017). However, haze, which is defined as the occurrence of low visibility (≤10 km) due to accumulation of fine particulate matter in the air (Wu, 2011), remains severe in China (Xue et al., 2019; Le et al., 2020; Chen et al., 2013; Rohde and Muller, 2015).
There are potentially a number of factors at play that may cause haze to remain a frequent occurrence despite the decrease in aerosol and precursor emissions. Meteorological conditions (Zhang et al., 2020) play an important role in modulating the occurrence and persistence of haze events. In fact, atmospheric circulation patterns conducive to haze events may increase in the future as the climate warms (Cai et al., 2017; Pei and Yan, 2018). Continued haze events could also be due to a lack of mitigation of secondary aerosols (Huang et al., 2014; Zheng et al., 2018; An et al., 2019; Le et al., 2020). In 2020, severe haze was formed during the COVID-19 lockdown despite emission reductions of 40 %, with reduction of up to 90 % from the transportation sector (Le et al., 2020).
A metric that has been recently introduced to characterize the meteorological conditions associated with haze over north China, and Beijing in particular, is the haze weather index (HWI) (Cai et al., 2017). The HWI accounts for the role of circulation and vertical stratification, the two main meteorological factors involved in haze occurrence. By analysing 15 climate models under the Representative Concentration Pathway 8.5 (RCP8.5, frequently referred to as the “business-as-usual” scenario and featuring a large future increase in greenhouse gas emissions), Cai et al. (2017) predicted a 50 % increase in the frequency and a 80 % increase in the persistence of these meteorological conditions in the second half of the 21st century compared to the 20th century as a consequence of warming and circulation changes induced by greenhouse gases.
Aerosol reductions may also modulate meteorological conditions and, subsequently, lead to increases in HWI (Jiang et al., 2017; Liu et al., 2019; Zhang et al., 2021). Affected by aerosols, and also affecting their accumulation in northeast China, the HWI is intrinsically intertwined with aerosol emissions and haze formation. Yet, meteorological conditions represent a key uncertainty in future climate projections and a large source of discrepancy among models (Callahan and Mankin, 2020). New future scenarios used in the Sixth Coupled Model Intercomparison Project (CMIP6), the Shared Socioeconomic Pathways (SSPs), are designed to cover a wide range of narratives of socioeconomic development and energy consumption in the 21st century and capture a much wider range of uncertainty in aerosol emission pathways (Fig. 1) than the Representative Concentration Pathways used in CMIP5 (Riahi et al., 2017). This presents an opportunity to explore the relative roles of aerosol and greenhouse gases in driving changes in the HWI and the interplay between the effects of aerosol changes on the atmospheric circulation and on the composition of the haze itself. In this study we examine whether distinct influences of aerosol and greenhouse gas changes can be seen in circulation-based metrics for haze. We then quantify the relative importance of forced changes in the atmospheric circulation and the direct effect of emission reductions on Beijing haze.
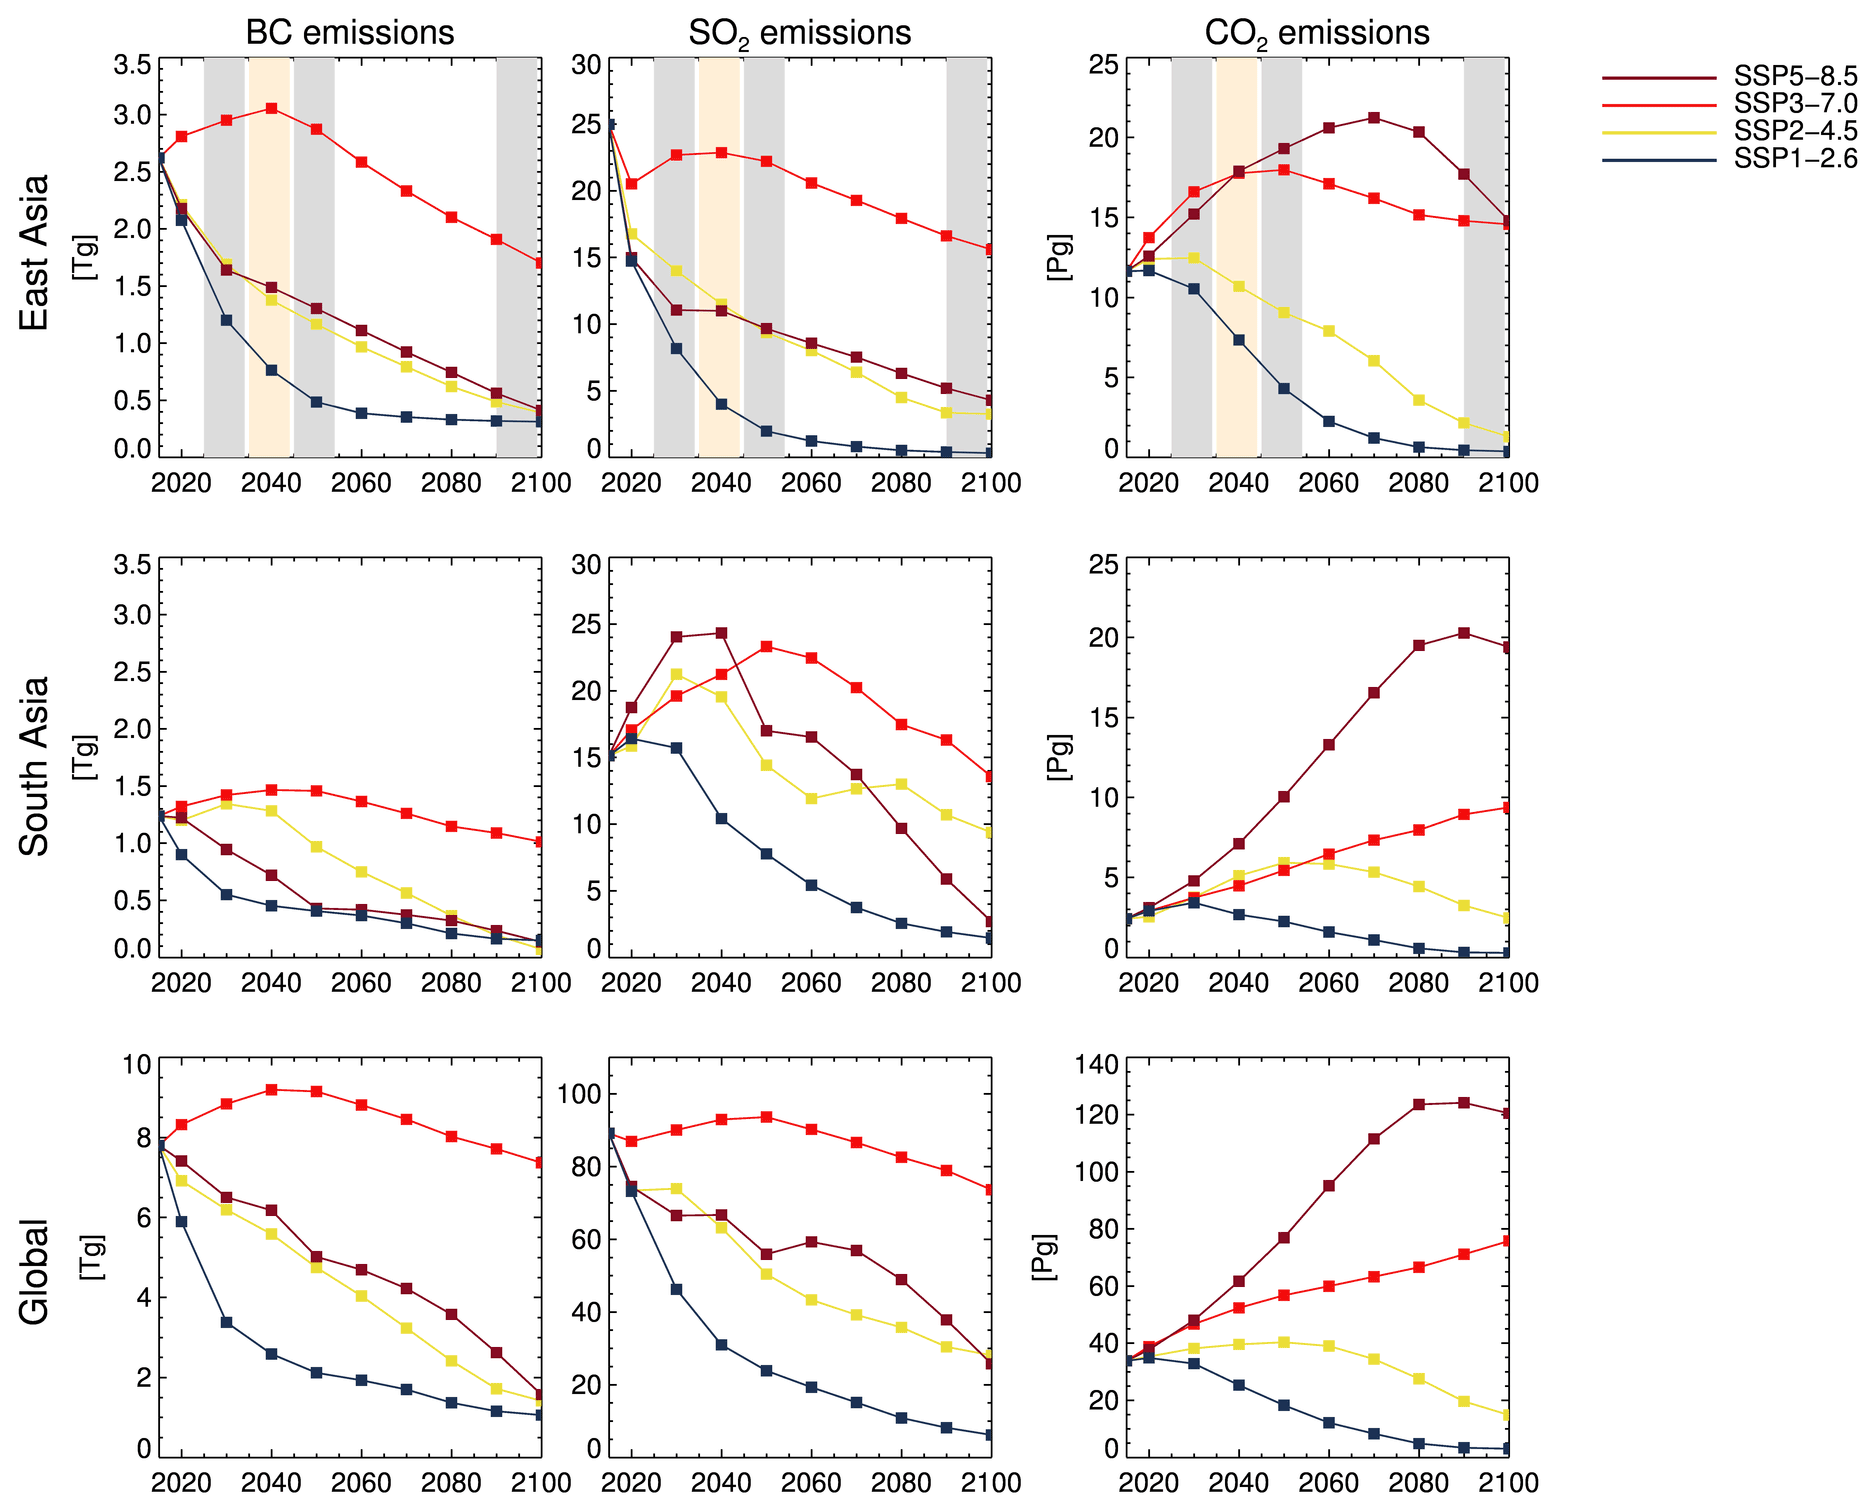
Figure 1Time series of total emissions for BC, SO2 (Tg), and CO2 (Pg) in SSPs 1–2.5, 2–4.5, 3–7.0, and 5–8.5 from East Asia, South Asia, and the globe. Periods used in analyses are highlighted in the panels of the first row.
2.1 Future emission pathways
Future aerosol and greenhouse gas pathways in CMIP6 are described by the Shared Socioeconomic Pathways (SSPs), which represent a range of socioeconomic narratives (Riahi et al., 2017), designated by the first digit of the three numbers in the scenario names: 1 describes a sustainable development; 2 is a medium-change narrative; 3 describes a regional rivalry situation; and 5 describes a fossil-fuel development. The following two digits separated by a decimal point show the global mean radiative forcing by 2100 in watts per square metre (W/m2). The air pollution pathways have been designed to be consistent with the SSPs but also make specific assumptions about the stringency of air quality policy. We use four SSPs in this work: 1–2.6, 2–4.5, 3–7.0, and 5–8.5. Figure 1 shows the time series of area-averaged SO2, BC, and CO2 emissions from East Asia, South Asia, and the globe in four SSPs, during 2015–2100. Over East Asia, both SO2 and black carbon (BC) emissions will decrease from the present day to the end of the century in most SSPs, except in SSP 3–7.0, wherein emissions continue to increase until 2040. The change in aerosol emissions over East Asia shows a rapid reduction in SSP 1–2.6 and comparable moderate reductions in SSPs 2–4.5 and 5–8.5. In SSP 1–2.6, aerosol emissions reduce rapidly until 2050 and then flatten until 2100. In SSPs 2–4.5 and 5–8.5, emissions reduce gradually and reach the minima by 2100. Radiative forcing at the end of the 21st century varies consistently with the amount of global CO2 emissions.
Both NOx and NH3 follow similar pathways to SO2 in future scenarios over East Asia, although reduction in NH3 emission is less (Fig. S1). However, a decrease in sulfate precursors can benefit nitrate formation, and we would expect an increase in nitrate burden in future (Bellouin et al., 2011). A simulation that allows nitrate formation would see slower decreases in aerosol optical depth (AOD) and in the magnitude of aerosol forcing, so it would act to moderate both the aerosol effects that we discuss in the paper. However, only a few models included the simulation of ammonium nitrate, and discrepancies in the simulation of nitrate remain large (Bian et al., 2017; Myhre et al., 2013; Turnock et al., 2020). As a result, the impact of ammonium nitrate is difficult to detect in the CMIP6 ensemble.
2.2 Air quality and circulation indices
The haze weather index (HWI) is defined following Cai et al. (2017), using a combination of meteorological variables that capture the key characteristics of weather patterns conducive to severe haze in and around Beijing.
where ΔT is the temperature difference between 850 hPa (averaged over 32.5–45∘ N, 112.5–132.5∘ E) and 250 hPa (averaged over 37.5–45∘ N, 122.5–137.5∘ E); V850 is the 850 hPa meridional wind (averaged over 30–47.5∘ N, 115–130∘ E); and ΔU is the latitudinal difference of the 500 hPa zonal wind between areas north (42.5–52.5∘ N, 110–137.5∘ E) and south (27.5–37.5∘ N, 110–137.5∘ E) of Beijing. These three terms represent, respectively, the vertical stratification of the atmospheric column over Beijing, the circulation anomaly in the region, and the magnitude of the near-surface wind. The regions used in the calculation are shown in Fig. 2. For each of the three terms, anomalies are calculated relative to the mean over the considered time periods. The time series is then standardized by the standard deviation over the same time period. The HWI is then calculated as the standardized anomaly of the sum of the three terms. HWI>0 designates a meteorological pattern conducive to a haze event.
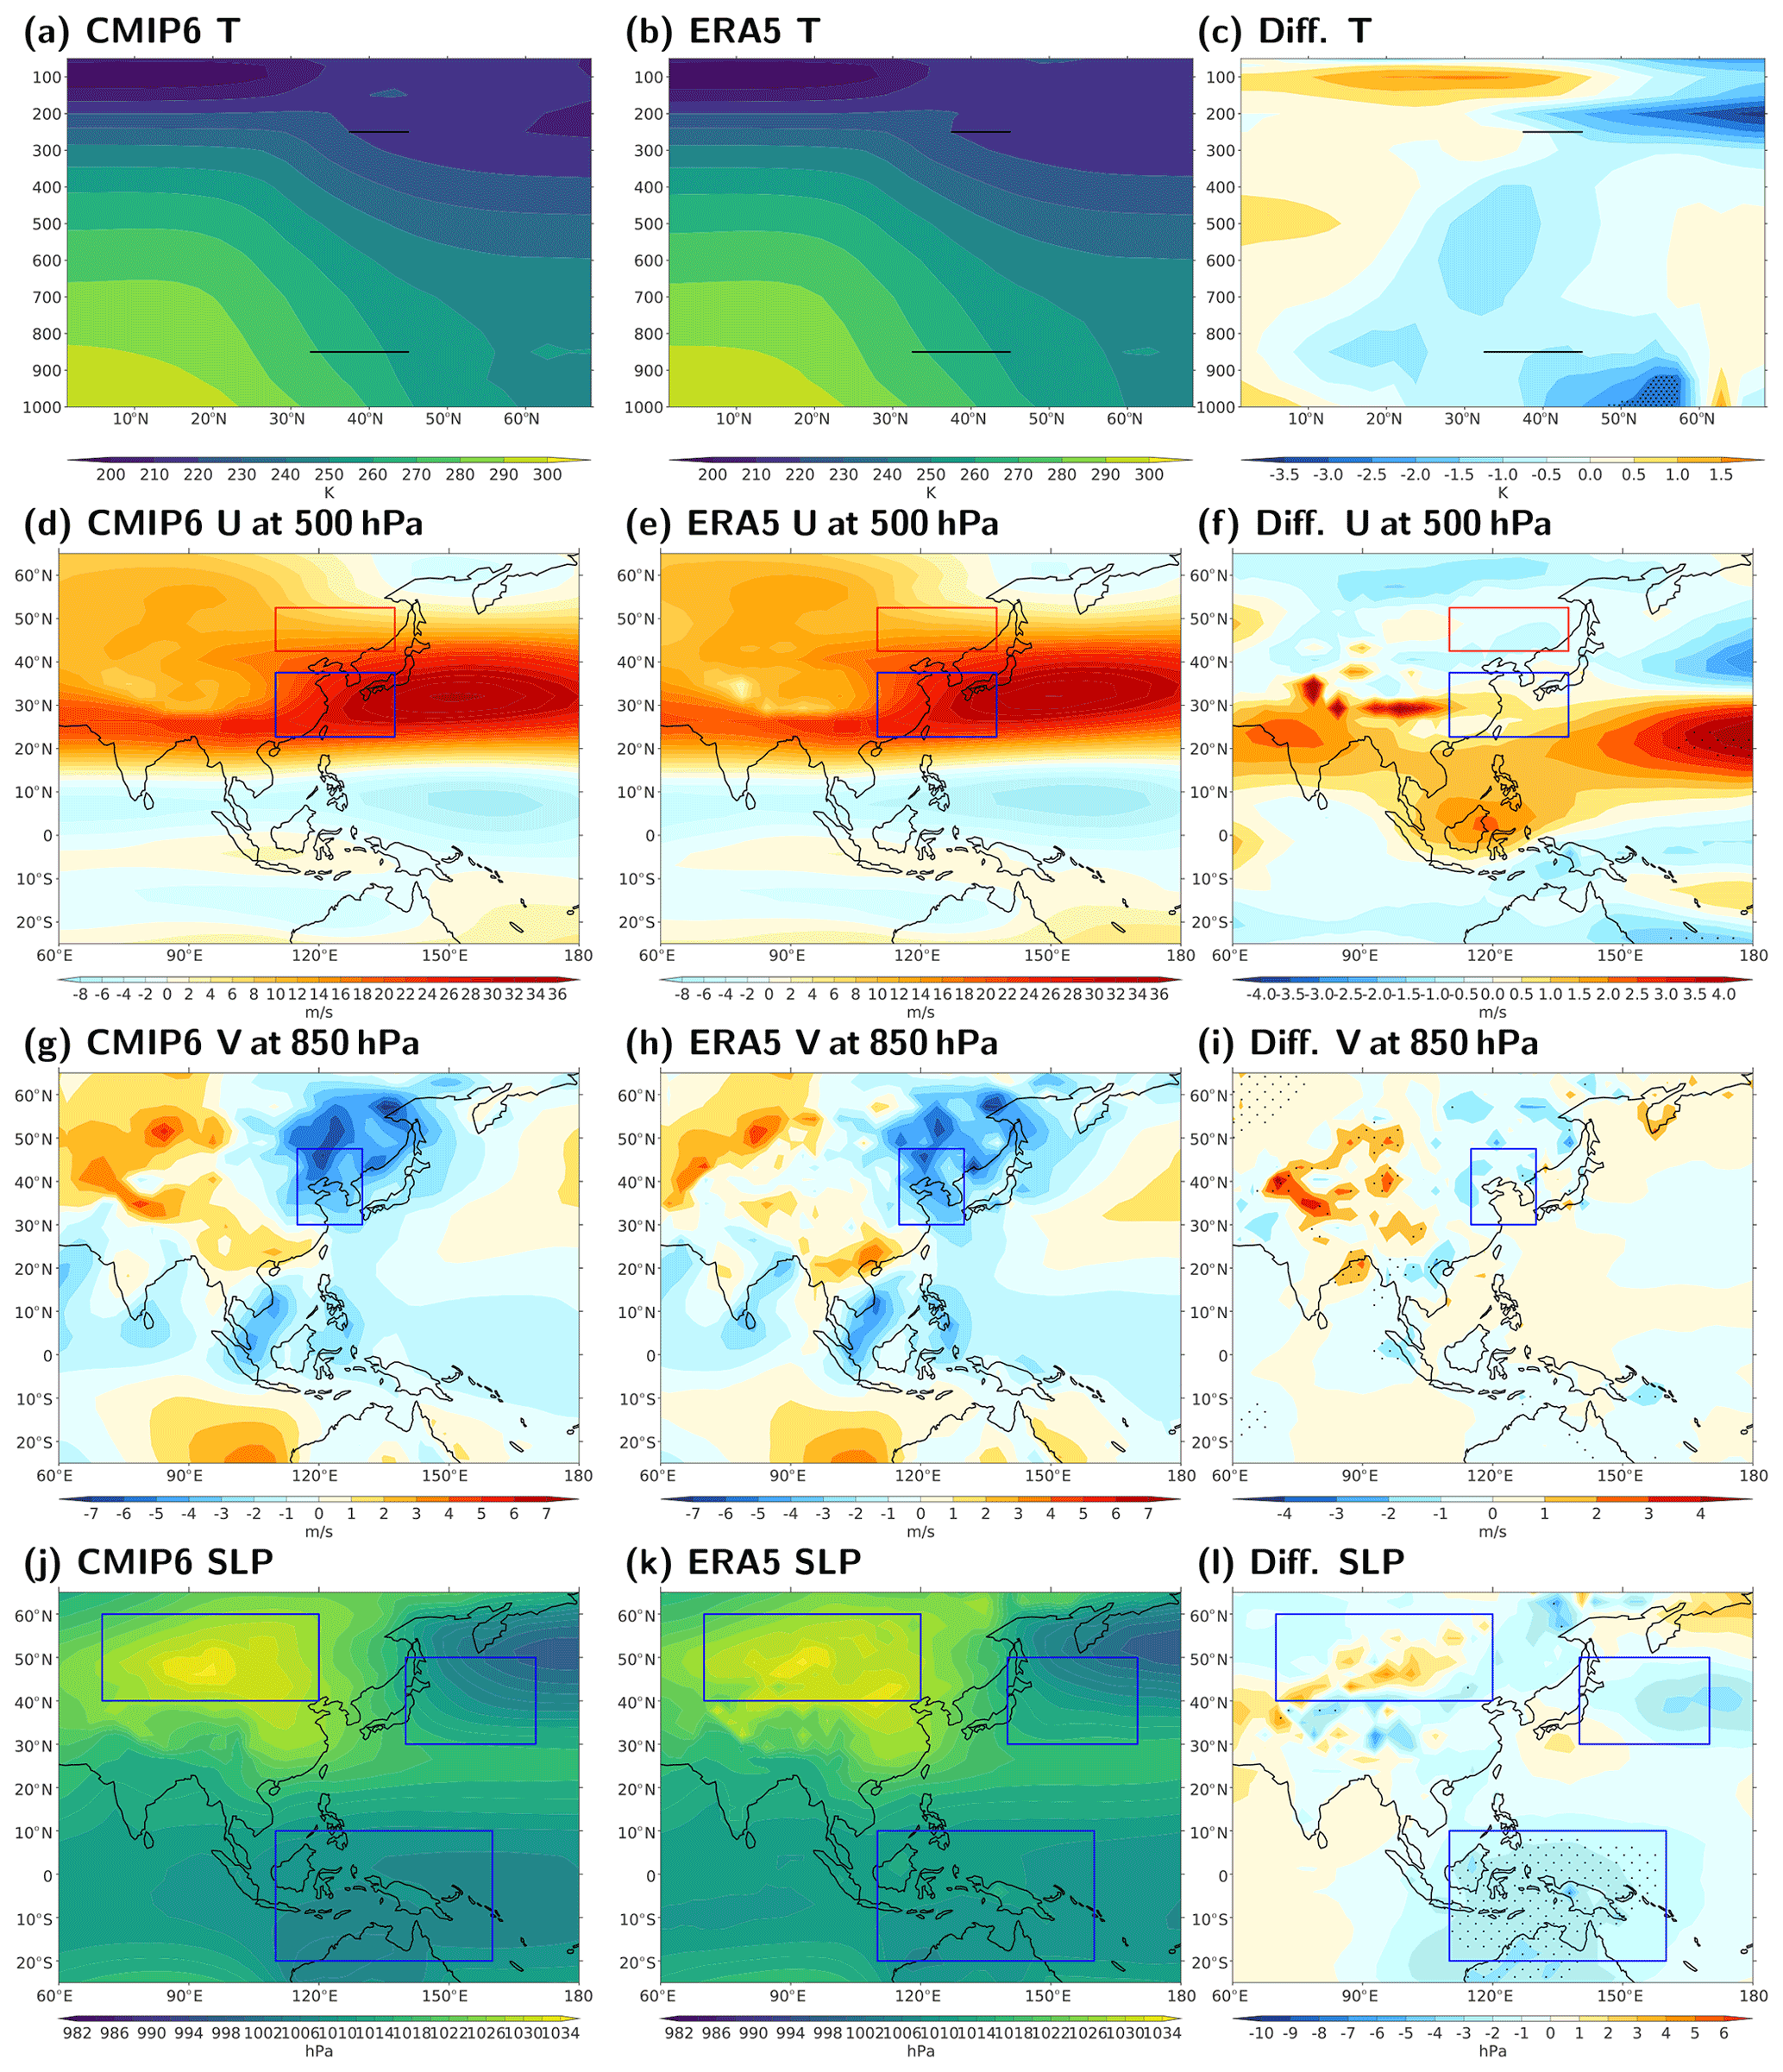
Figure 2Biases in present-day East Asian winter monsoon (DJF 1979–2014). (a–c) Zonal mean temperature averaged between 112.5–137.5∘ E for CMIP6, ERA5, and their difference. (d–f) 500 hPa zonal wind. (g–i) 850 hPa meridional wind. (j–l) Sea level pressure. Difference that is above 90 % confidence level is stippled. Boxes indicate areas from which averaged values are used to compute HWI and WCI.
The strength of the East Asian winter monsoon is measured by the Wang–Chen index (WCI; Wang and Chen, 2014), which considers the sea level pressure (SLP) differences between Siberia and the northern Pacific, as well as between Siberia and the Maritime Continent:
where SLPxx is the standardized SLP anomaly over Siberia (sib; 40–60∘ N, 70–120∘ E), the northern Pacific (np; 30–50∘ N, 140–170∘ E), or the Maritime Continent (mc; 20∘ S–10∘ N, 110–160∘ E). The first term represents a zonal pressure difference, while the second represents a meridional difference. WCI is the standardized anomaly of the sum of these differences. WCI>0 indicates a strong winter monsoon, which makes Beijing haze events less likely.
Both indices quantify the strength of the East Asian winter monsoon, although HWI is designed to capture specific patterns over Beijing. By using two indices based on different variables, any results will be considered to be more robust if they are consistent across the indices, as the different variables involved should be differently affected by model biases. HWI is negatively related to WCI, as a positive HWI indicates a weak winter monsoon (i.e., a negative WCI). To make the comparison straightforward, the sign of WCI will be reversed and denoted as WCI* throughout, so that positive values of both indices indicate an increased likelihood of haze.
2.3 Meteorological and aerosol data
Monthly pressure level variables are used to calculate seasonal-mean HWI and WCI* during December–January–February (DJF). In its original definition (Cai et al., 2017), HWI was computed from daily data. Yet, despite a slightly reduced magnitude, values of the HWI using monthly data are consistent with those based on daily data (Zhang et al., 2021). Since the use of monthly data allows us to use a greater number of CMIP6 models, monthly HWI is computed and analysed here. Any model that has data available in both the CMIP6 historical experiment and one of the SSPs is included. As a result, 17 models are used (Table 1). Model ensemble sizes in CMIP6 range from 1 member per model to 50 members. In the analysis of future anomalies in HWI and WCI*, the multi-model mean is calculated from individual model means to give an equal weight to each model. However, when evaluating model variability, individual ensemble members are used. For model evaluation, and the reference period for the calculation of future anomalies, the present day is defined as the period 1979–2014.
Table 1CMIP6 simulation availability. The number of ensemble members used for models and scenarios is shown.
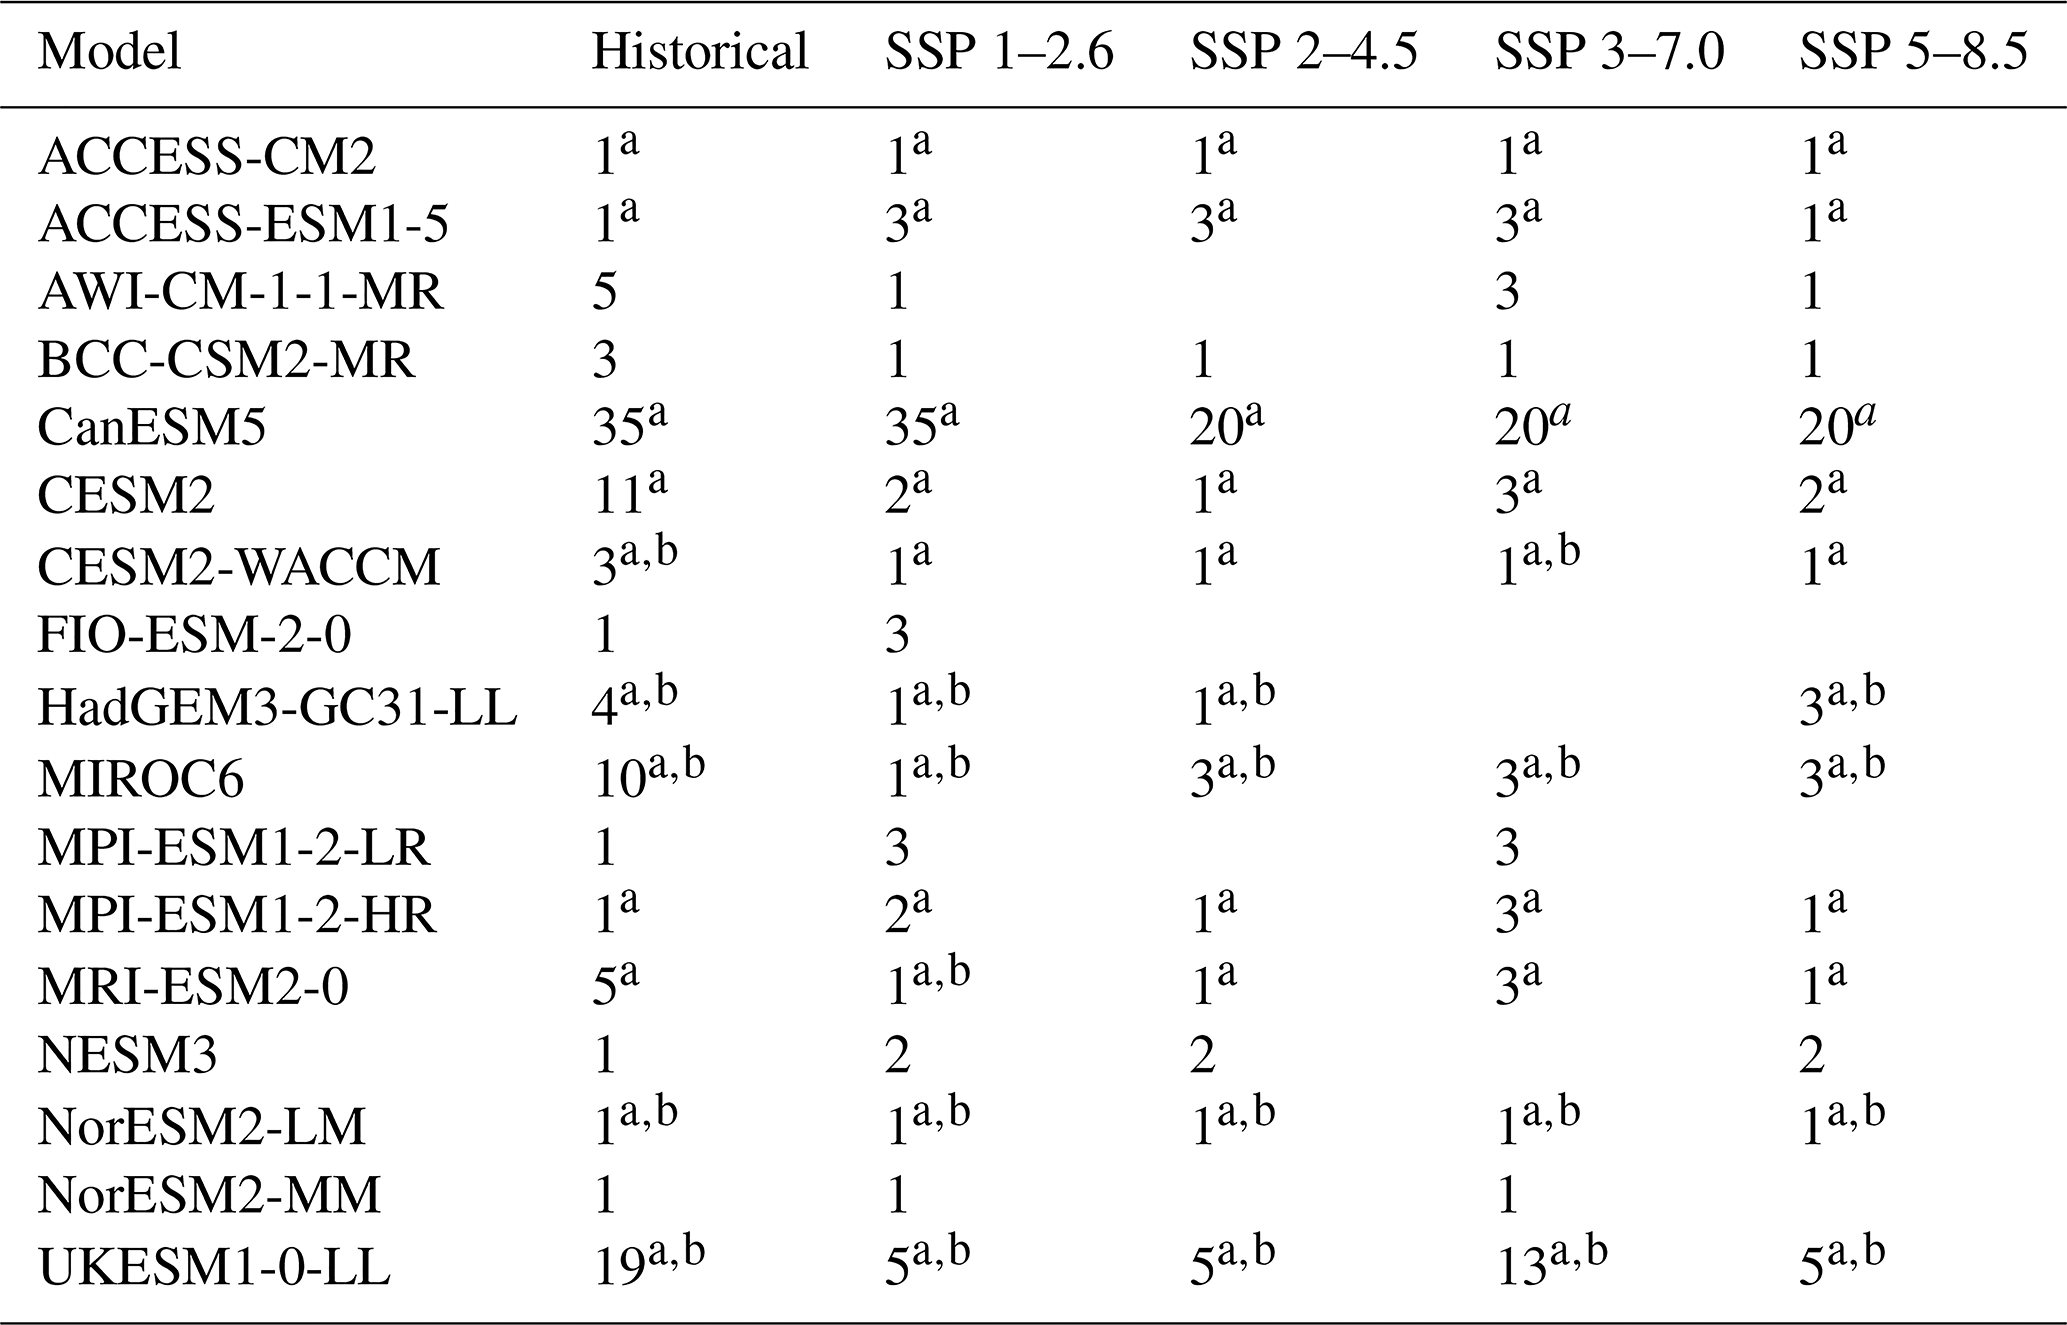
a denotes aerosol optical depth is available from at least one ensemble member. b denotes PM2.5 is available from at least one ensemble member.
In addition to the analysis of circulation indices, we evaluate the severity of haze events based on variables related to aerosol concentrations in the wider Beijing region (37.5–42.5∘ N, 114–119∘ E), as such variables give a more direct link to the haze itself: AOD at 550 nm and the concentration of surface particulate matter less than 2.5 µm in diameter (PM2.5). The particle size distribution of haze varies within a wide range of particle diameters, and the PM2.5 fraction accounts for a part of this distribution (Wu, 2011). While PM2.5 does not encompass all the constituents of haze, it is the major factor for impacts on human health and reductions in visibility (An et al., 2019). As such, it is a key metric in the WHO air quality guidelines (WHO, 2006) and has been adopted as a major index for the air quality standard in many countries (e.g. GB 3-95-2012 in China, 2008/50/EC in Europe). Previous studies have shown that the long-term change in haziness is consistent with changes in PM2.5 concentration (Schichtel et al., 2001). Besides, since haze is not a standard output from CMIP6 models, PM2.5 is the best measurement of air quality impact that we have from all of the models. PM2.5 concentrations are calculated following Turnock et al. (2020) as
where PM2.5 is the sum of the dry aerosol mass mixing ratio of BC, total organic carbon (OA – both primary and secondary sources), sulfate (SO4), sea salt (SS), and dust (DU) from the lowest model level. A scaling factor of 0.25 for SS and 0.1 for DU has been used to calculate the approximate contribution from these components to the fine size fraction (<2.5 µm) and is applied to data from all models. Unfortunately, the availability of aerosol variables from CMIP6 models is limited compared to the atmospheric variables. Models and experiments that include AOD and/or PM2.5 are highlighted in Table 1.
The fifth-generation European Centre for Medium-Range Weather Forecasts atmospheric reanalysis (ERA5; Hersbach et al., 2020) is used to evaluate the present-day distribution of HWI and WCI* and the constituent variables in CMIP6 models. Compared to previous reanalysis versions, ERA5 has improvements in model physics, core dynamics, and data assimilation.
The CMIP6 multi-model mean captures the pattern and magnitude of the key features of the East Asian winter climate reasonably well (Fig. 2). Compared to ERA5, the CMIP6 multi-model mean shows a cooler lower troposphere (Fig. 2c), a southward shifted mid-latitude westerly jet (Fig. 2f), and a stronger low-level prevailing northerly (Fig. 2i), all of which are indicative of a stronger East Asian winter monsoon.
The reanalysed (ERA5) and simulated (CMIP6) present-day (1979–2014) distribution of the magnitude of HWI and WCI* during DJF are compared in Fig. 3. CMIP6 models are consistent with ERA5, in terms of both mean and spread. A Kolmogorov–Smirnov test is applied, which indicates that indices from ERA5 and CMIP6 are drawn from the same distribution. A closer inspection of Fig. 3 shows that the CMIP6 models tend to simulate a stronger winter circulation than in ERA5, as evident by the slight shift to the left of distributions with respect to the reanalysis, which is consistent with the large-scale comparison shown in Fig. 2. However, neither difference is significant. The skilful representations of present-day observations of HWI and WCI* in CMIP6 justify the use of these models to estimate future changes in Beijing haze.
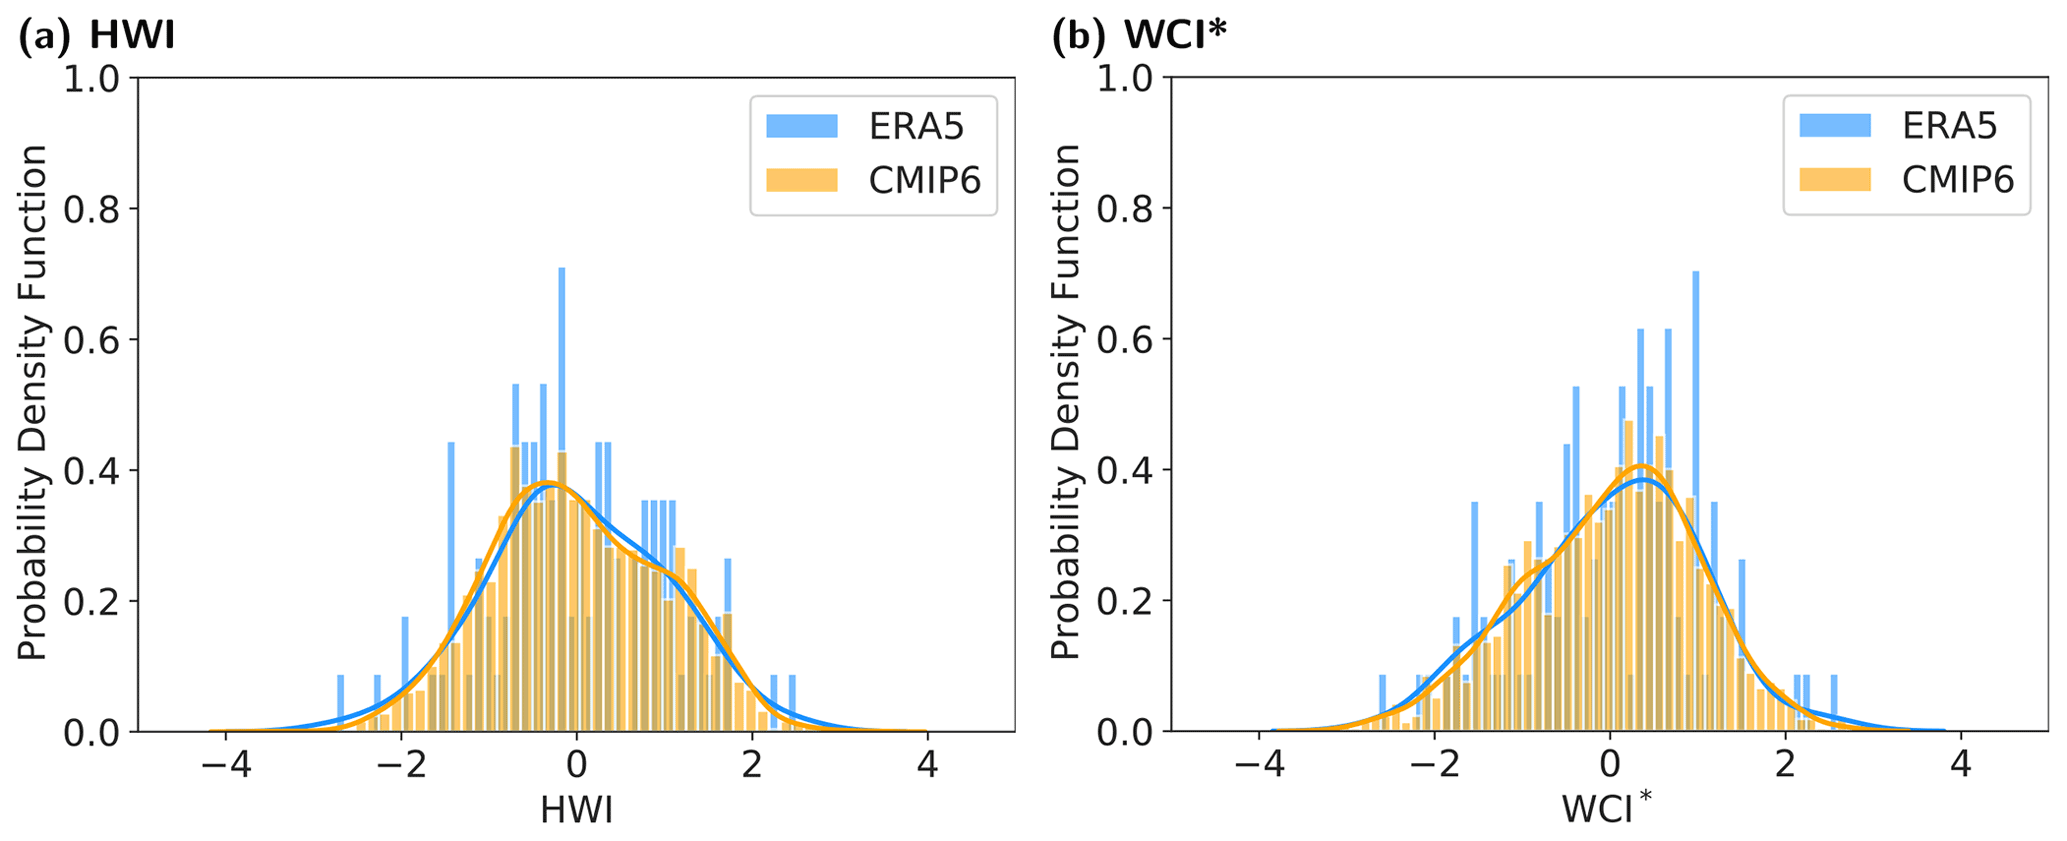
Figure 3Probability distribution of (a) HWI and (b) WCI* calculated from CMIP6 (orange) and ERA5 (azure) for present-day East Asia winter (DJF 1979–2014).
Future HWI and WCI* changes are calculated as deviations from the present-day climatological values and presented as 10-year averages for 2025–2034, 2035–2044, 2045–2054, and 2090–2099 (Fig. 4). These periods are chosen to capture the near future, when there is a rapid decline in aerosol emissions in SSP 1–2.6 and large differences in aerosol pathways across the SSPs, and the end of the century, when differences between the SSPs are dominated by CO2 emissions.
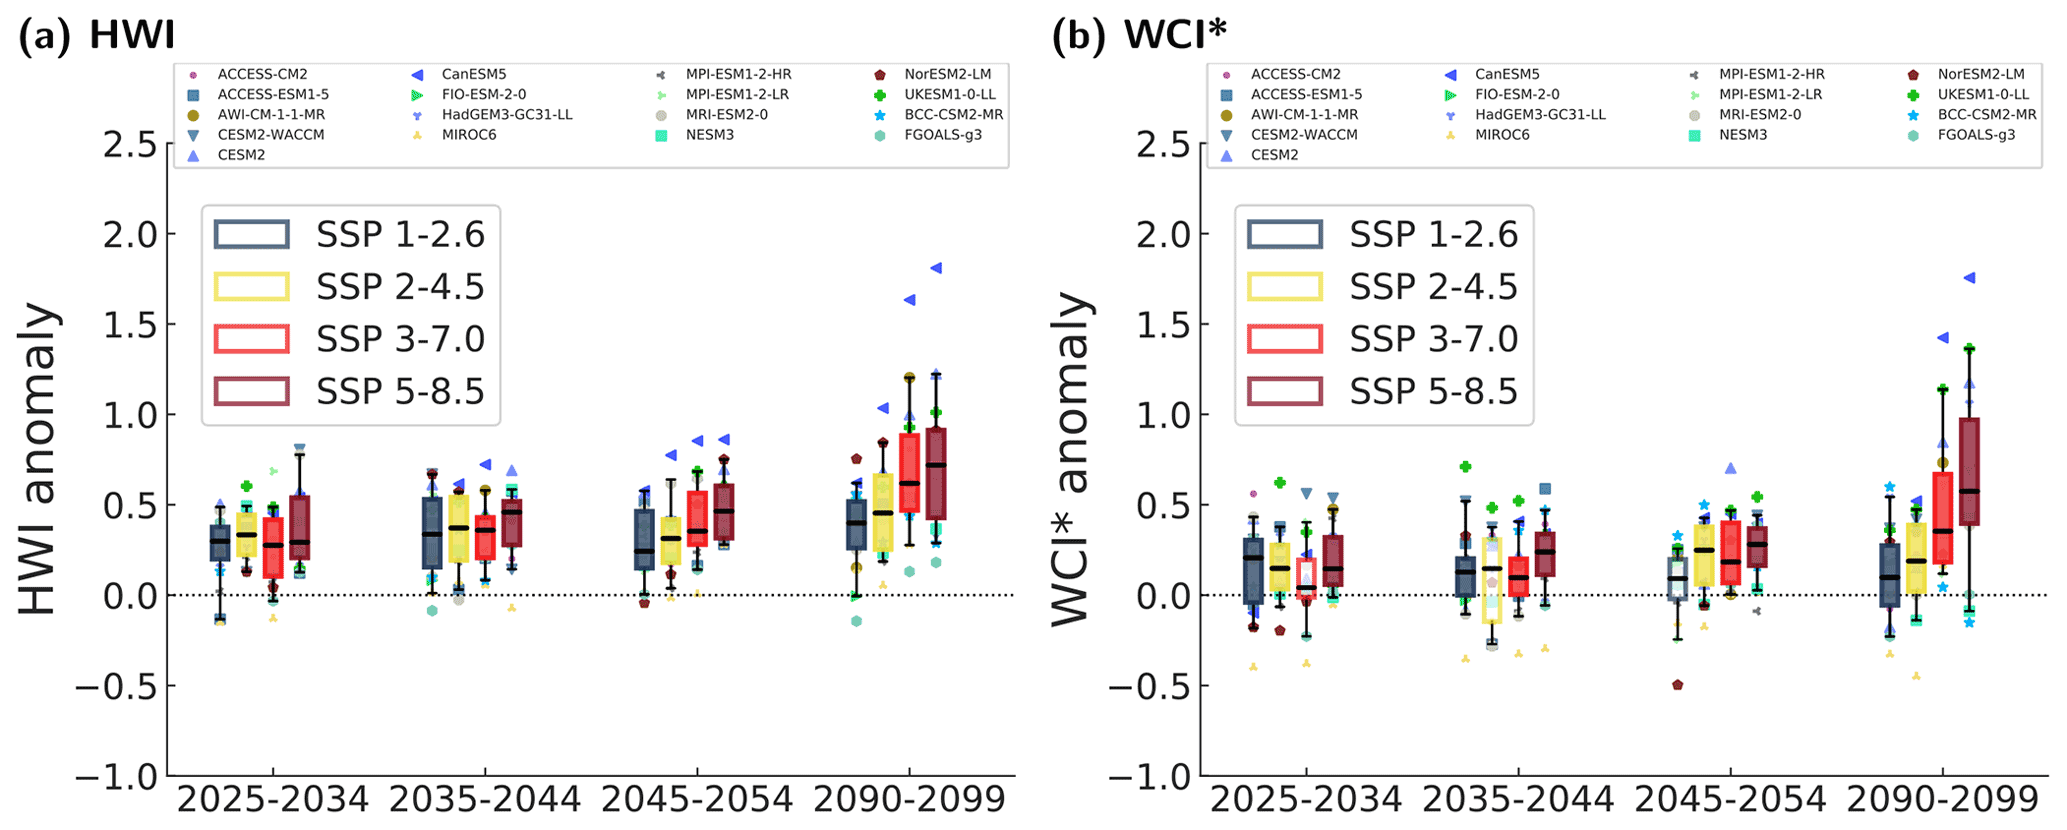
Figure 4Future HWI (a) and WCI* (b) changes from the present day (1979–2014). Coloured boxes represent the range between the first and the third quartiles of the probability distribution of index anomalies in scenarios (SSPs 1–2.6, 2–4.5, 3–7.0, and 5–8.5) during periods of 2025–2034, 2035–2044, 2045–2054, and 2090–2099. Boxes are filled if the change is significant at the 90 % confidence level according to a two-tailed t test. Black bars represent the median of distributions. Black whiskers represent the range between the 5th and 95th percentile of the probability distribution of index anomalies. Model mean values are represented by markers with different shapes and colours. . Details are given in Sect. 2.
In all future periods, HWI is larger than in the present day (Fig. 4a), indicating that weather patterns conducive to haze will occur more frequently, be more severe, or both. WCI* is also greater, indicating a weaker winter monsoon circulation and more favourable conditions for haze.
The positive HWI anomaly is larger in SSPs 3–7.0 and 5–8.5 relative to other SSPs by 2045–2054 and reaches its maximum by 2090–2099 as global CO2 emissions continue to increase in both scenarios. Similar changes occur in WCI* by 2090–2099 (Fig. 4b). Furthermore, the order of the medians of the both HWI and WCI* anomalies across the different scenarios during 2090–2099 corresponds to global accumulative CO2 emissions (Fig. 1), with the anomalies for SSPs 3–7.0 and 5–8.5 larger than in other SSPs. This indicates the dominance of CO2 in changing HWI and the winter monsoon during the second half of the 21st century. The thermal component (ΔTvertical in Eq. 1) of HWI makes the largest contribution to the future increases in HWI (Fig. S2b) and shares these characteristics of CO2-dominated changes.
In the first half of the 21st century, the competition between the response to aerosol and CO2 changes is visible. During 2025–2034, WCI* has the smallest increase in SSP 3–7.0, where aerosol emissions continue to increase. In contrast, WCI* has the largest increase in SSP 1–2.6, where aerosol emissions decrease sharply during the same period. This is consistent with aerosol reductions driving increases in haze indices identified by Zhang et al. (2021). Although changes in CO2 emissions are different between SSPs 2–4.5 and 5–8.5, reductions in aerosol emissions are similar in this period (2025–2034). This similarity is reflected in the median WCI* anomalies, further suggesting that the aerosol emission pathway influences the relative magnitude of WCI* anomalies during the early 21st century. However, compared to responses to CO2 in the second half of the 21st century, these differences in HWI and WCI* across the SSPs are small and insignificant (Fig. S4). HWI changes are similar to but weaker than WCI*, which can be attributed to the larger internal variability in HWI due to the smaller spatial scales of the component terms.
Both HWI and WCI* show that patterns conducive to haze events become more likely with increases in CO2 emissions in the long term. However, without sources of aerosol, the formation of haze is unlikely. The actual change in haze itself depends on changes in both the atmospheric circulation and aerosol concentrations. AOD at 550 nm and PM2.5 are used as indicators of haze severity. Anomalies relative to the present day for HWI>1 (the threshold for “haze days” in the present climate) are shown in Fig. 5. Changes in future AOD and PM2.5 over Beijing correspond to those in aerosol precursor emissions over East Asia (Fig. 1). The mean AOD and PM2.5 rapidly reduce to values below the present-day level (by more than 25 %) in all scenarios apart from SSP 3–7.0, where the mean AOD and PM2.5 are greater than the present-day level until 2050 (up to 35 %), consistent with continued increases in local emissions. As indicated by changes in AOD and PM2.5, haze events in all scenarios except SSP 3–7.0 become less severe (Fig. 5a and c), despite the concomitant increases in HWI and WCI*. Future changes in AOD and PM2.5 follow the reductions in future aerosol emissions, rather than the increase seen in the circulation metrics, indicating that the reduction in aerosol emissions outweighs the increase in haze weather patterns and dominates changes of future haze events.
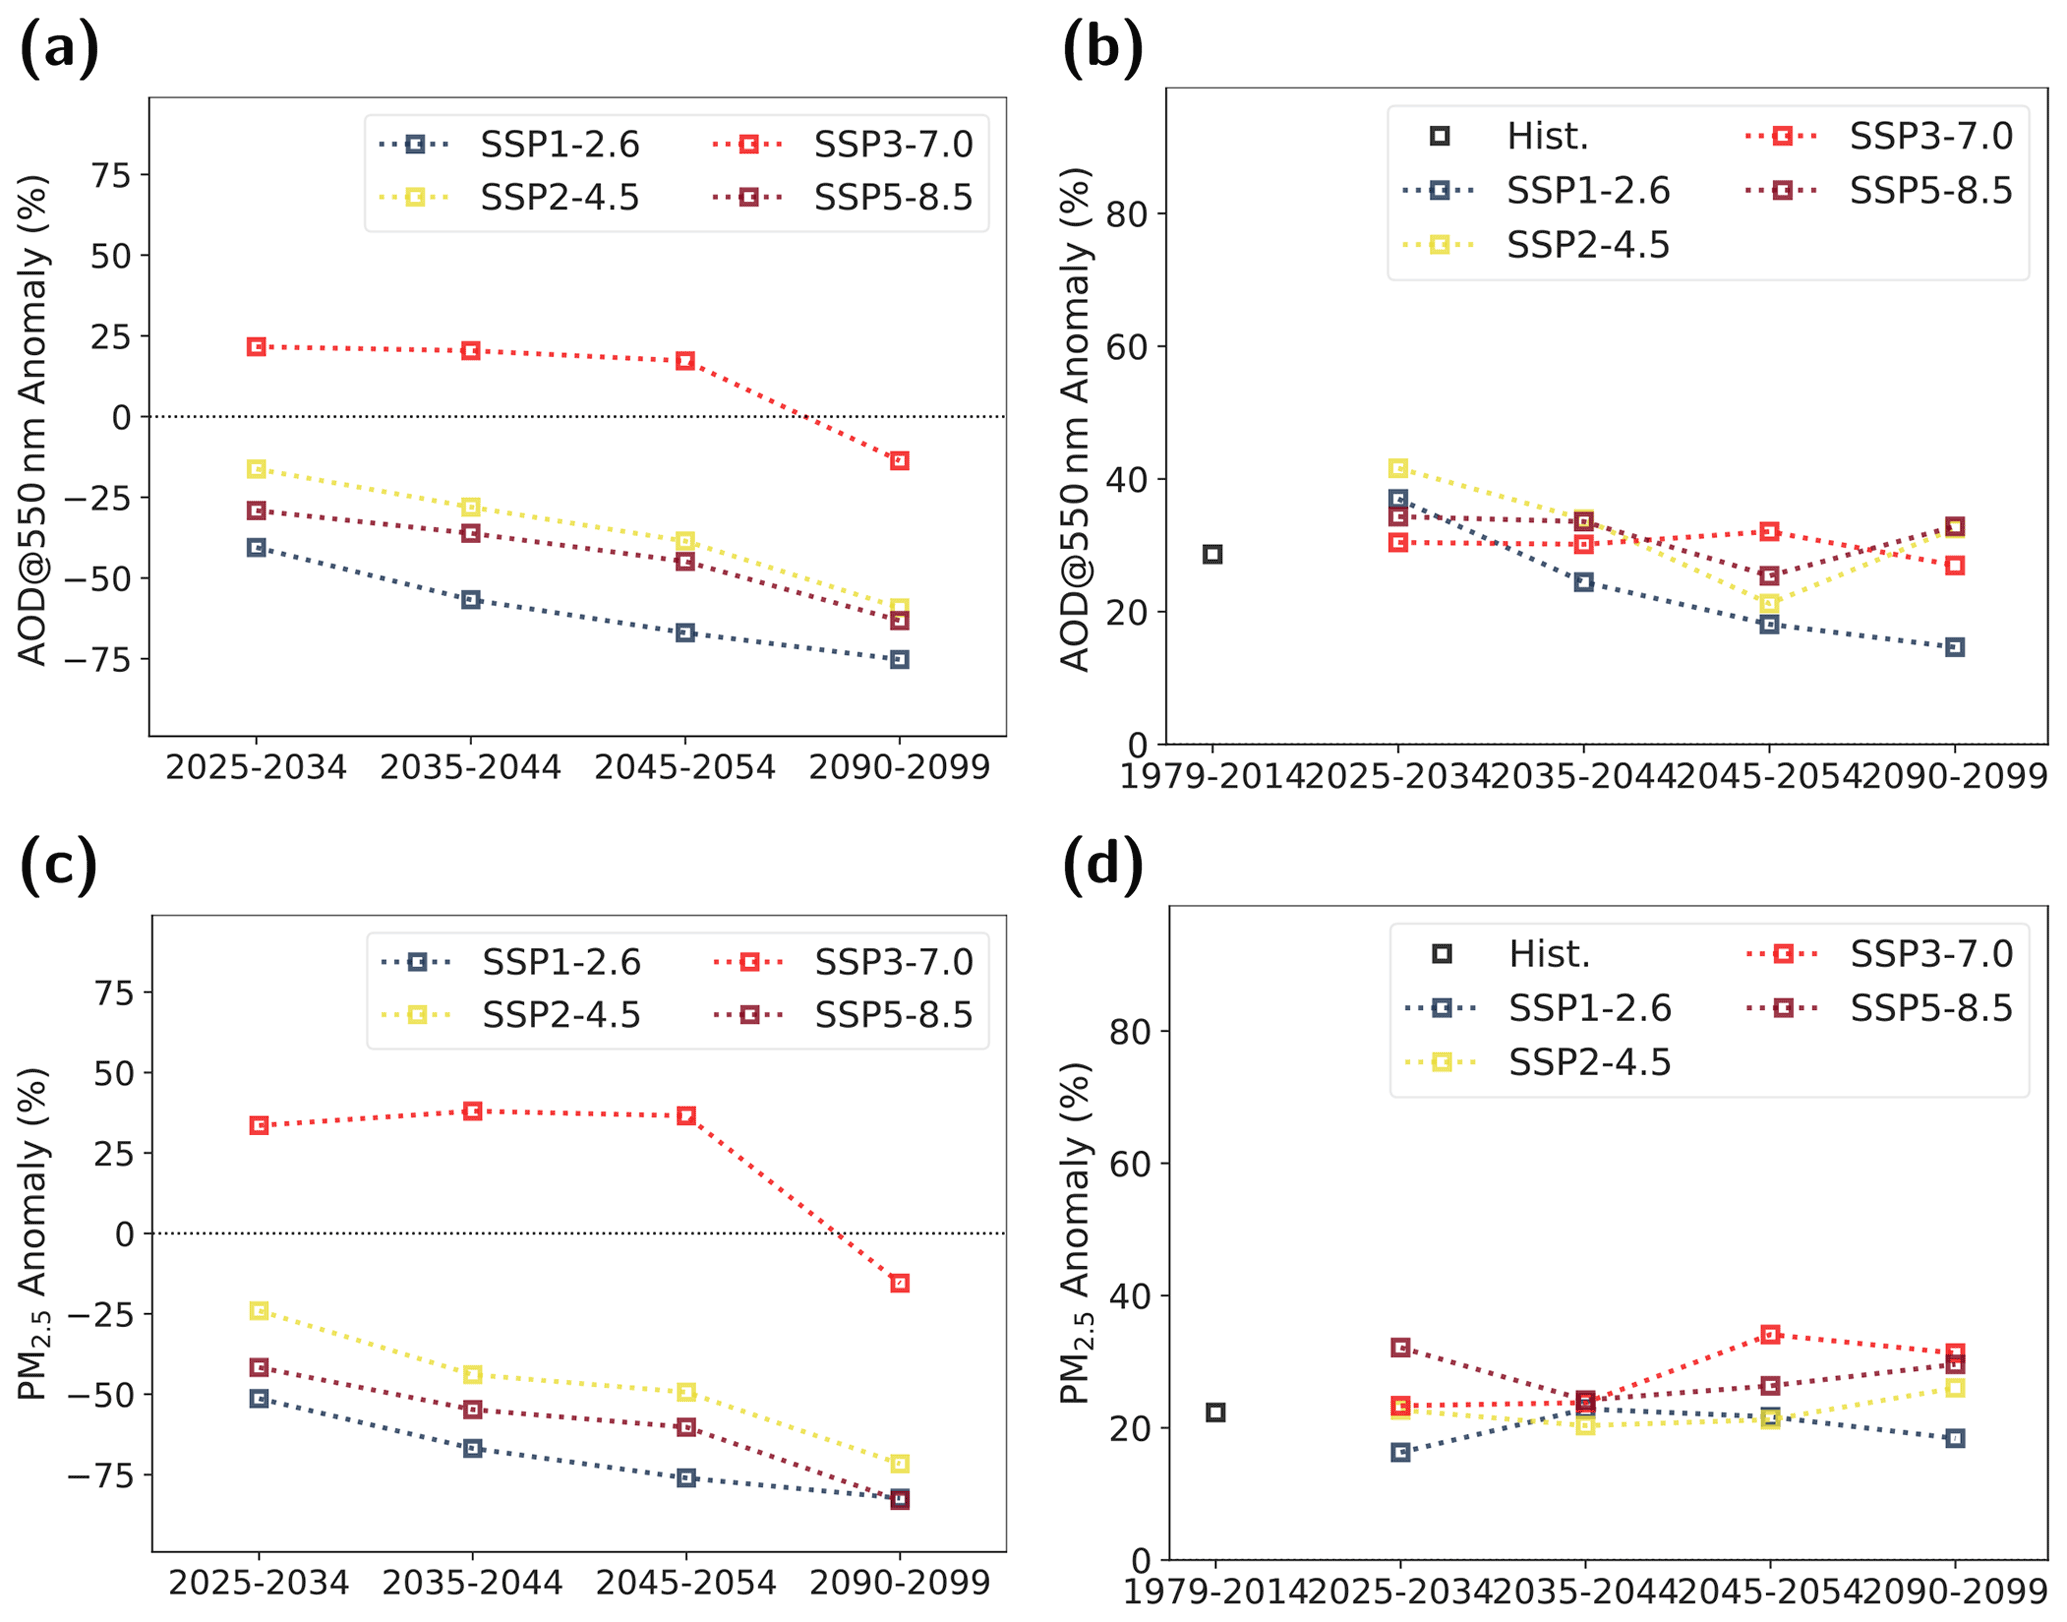
Figure 5(a) AOD at 550 nm anomalies during haze events (HWI>1) compared to the present day, averaged over Beijing (37.5–42.5∘ N, 114–119∘ E). (b) AOD at 550 nm anomalies during haze events (HWI>1) compared to contemporary non-haze days (HWI≤0) over Beijing. (c) PM2.5 anomalies (HWI>1) compared to the present day, averaged over Beijing. (d) PM2.5 anomalies compared to contemporary non-haze days (HWI≤0) over Beijing. Units: %.
HWI, however, still can be useful in predicting future haze events. Fig. 5b and d show the percentage changes in AOD and PM2.5 between haze (HWI>1) and contemporary non-haze days (HWI<0). In all periods, AOD and PM2.5 have similar relative anomalies. Except SSP 1–2.6, the anomalies range between 20∼40 %. This indicates that by using a certain value of HWI to define haze events (for example, HWI=1), the air pollutant increases by a certain amount regardless of the value of the baseline. However, as future aerosol emissions will reduce, a larger HWI threshold is likely to be needed to identify circulation patterns likely to cause PM2.5 concentrations to exceed dangerous levels.
This study investigated 21st century changes in Beijing haze events using CMIP6 models. Circulation patterns conducive to the formation of haze increase in all future scenarios due to the weakening of East Asian winter, with a clear relationship with increases in CO2 at the end of the century. Scenarios with the largest CO2 emission have significantly larger increases in two haze weather indices, HWI and WCI*, by 2100. The opposing impacts of aerosols on the circulation patterns can be seen in the near future (2025–2034) in SSP 3–7.0, where aerosol emissions continue to increase, moderating increases in the haze indices. The opposing impacts of aerosols on these patterns can be seen in the near future (2025–2034) in SSP 3–7.0, where aerosol emissions continue to increase, moderating increases in the haze indices relative to scenarios with aerosol reductions. This finding is counter-intuitive as the increasing aerosol emissions suppress the increase in the frequency and intensity of Beijing haze in the near future. This finding echoes previous studies showing that changing aerosol emissions can feedback onto the meteorological conditions, further complicating the interactions between the two factors. However, although near-future changes in HWI and WCI* are consistent with differences in aerosol emission across the SSPs, the differences in aerosol pathways are not large enough to result in significant differences between the SSPs.
Future changes in the severity of haze events themselves were evaluated using anomalies in AOD at 550 nm and surface PM2.5. Despite increases in HWI and WCI*, the severity of Beijing haze decreases with reductions in aerosol and precursor emissions. This shows that the decrease in aerosol emissions under strong air pollution mitigation scenarios outweighs the continued increase in haze weather patterns and weakening of the winter monsoon. The above findings indicate that using meteorological indices alone to investigate future changes in haze can be misleading and should be complemented by the analysis of changes in air quality metrics.
We show that reducing aerosol emissions is beneficial for Beijing air quality in the long term, despite their reductions making the atmospheric circulation patterns associated with haze more likely. The severity of haze events reduces most in SSP 1–2.6, which has the fastest and largest emission reduction, while it reduces the least in SSP 3–7.0, which has the slowest and smallest reduction.
The Python code for analysis is available on GitHub at https://github.com/lguo-uk/acp-2021-198-.git (last access: 1 October 2021) and also at https://doi.org/10.5281/zenodo.5547403 (Guo, 2021).
Data used in this study are available at https://esgf-node.llnl.gov/projects/cmip6/ (search keywords: Experiment ID: historical, ssp126, ssp245, ssp370, ssp585; ESGF, 2019).
The supplement related to this article is available online at: https://doi.org/10.5194/acp-21-15299-2021-supplement.
LJW and MB initiated the study. STT provided algorithms and PM2.5 data from CMIP6. MTL provided analysis on emissions. LZ provided HWI comparison between daily and monthly scales. LG designed and conducted the analyses and prepared the manuscript. All co-authors contributed to discussions during the research and writing processes.
The authors declare that they have no conflict of interest.
Publisher’s note: Copernicus Publications remains neutral with regard to jurisdictional claims in published maps and institutional affiliations.
This work and its contributors Liang Guo, Laura J. Wilcox, Massimo Bollasina, and Steven T. Turnock were supported by the UK-China Research and Innovation Partnership Fund through the Met Office Climate Science for Service Partnership (CSSP) China as part of the Newton Fund.
This research has been supported by the Newton Fund (CSSP China).
This paper was edited by Fangqun Yu and reviewed by two anonymous referees.
An, Z., Huang, R.-J., Zhang, R., Tie, X., Li, G., Cao, J., Zhou, W., Shi, Z., Han, Y., Gu, Z., and Ji, Y.: Severe haze in northern China: A synergy of anthropogenic emissions and atmospheric processes, P. Natl. Acad. Sci. USA, 116, 8657–8666, https://doi.org/10.1073/pnas.1900125116, 2019. a, b
Bellouin, N., Rae, J., Jones, A., Johnson, C., Haywood, J., and Boucher, O.: Aerosol forcing in the Climate Model Intercomparison Project (CMIP5) simulations by HadGEM2-ES and the role of ammonium nitrate, J. Geophys. Res., 116, D20206, https://doi.org/10.1029/2011jd016074, 2011. a
Bian, H., Chin, M., Hauglustaine, D. A., Schulz, M., Myhre, G., Bauer, S. E., Lund, M. T., Karydis, V. A., Kucsera, T. L., Pan, X., Pozzer, A., Skeie, R. B., Steenrod, S. D., Sudo, K., Tsigaridis, K., Tsimpidi, A. P., and Tsyro, S. G.: Investigation of global particulate nitrate from the AeroCom phase III experiment, Atmos. Chem. Phys., 17, 12911–12940, https://doi.org/10.5194/acp-17-12911-2017, 2017. a
Cai, W., Li, K., Liao, H., Wang, H., and Wu, L.: Weather conditions conducive to Beijing severe haze more frequent under climate change, Nat. Clim. Change, 7, 257–262, https://doi.org/10.1038/nclimate3249, 2017. a, b, c, d, e
Callahan, C. W. and Mankin, J. S.: The Influence of Internal Climate Variability on Projections of Synoptically Driven Beijing Haze, Geophys. Res. Lett., 47, e2020GL088548, https://doi.org/10.1029/2020gl088548, 2020. a
Chen, R., Zhao, Z., and Kan, H.: Heavy Smog and Hospital Visits in Beijing, China, Am. J. Resp. Crit. Car, 188, 1170–1171, https://doi.org/10.1164/rccm.201304-0678le, 2013. a
ESGF: WCRP Coupled Model Intercomparison Project (Phase 6), available at: https://esgf-node.llnl.gov/projects/cmip6/, last access: 29 April 2019. a
Guo, L.: lguo-uk/acp-2021-198-: code for acp-2021-198 (v1.0), Zenodo [code], https://doi.org/10.5281/zenodo.5547403, 2021. a
Hersbach, H., Bell, B., Berrisford, P., Hirahara, S., Horányi, A., Muñoz‐Sabater, J., Nicolas, J., Peubey, C., Radu, R., Schepers, D., Simmons, A., Soci, C., Abdalla, S., Abellan, X., Balsamo, G., Bechtold, P., Biavati, G., Bidlot, J., Bonavita, M., Chiara, G., Dahlgren, P., Dee, D., Diamantakis, M., Dragani, R., Flemming, J., Forbes, R., Fuentes, M., Geer, A., Haimberger, L., Healy, S., Hogan, R. J., Hólm, E., Janisková, M., Keeley, S., Laloyaux, P., Lopez, P., Lupu, C., Radnoti, G., Rosnay, P., Rozum, I., Vamborg, F., Villaume, S., and Thépaut, J.: The ERA5 global reanalysis, Q. J. Roy. Meteor. Soc., 146, 1999–2049, https://doi.org/10.1002/qj.3803, 2020. a
Huang, R.-J., Zhang, Y., Bozzetti, C., Ho, K.-F., Cao, J.-J., Han, Y., Daellenbach, K. R., Slowik, J. G., Platt, S. M., Canonaco, F., Zotter, P., Wolf, R., Pieber, S. M., Bruns, E. A., Crippa, M., Ciarelli, G., Piazzalunga, A., Schwikowski, M., Abbaszade, G., Schnelle-Kreis, J., Zimmermann, R., An, Z., Szidat, S., Baltensperger, U., Haddad, I. E., and Prévôt, A. S. H.: High secondary aerosol contribution to particulate pollution during haze events in China, Nature, 514, 218–222, https://doi.org/10.1038/nature13774, 2014. a
Jiang, Y., Yang, X.-Q., Liu, X., Yang, D., Sun, X., Wang, M., Ding, A., Wang, T., and Fu, C.: Anthropogenic aerosol effects on East Asian winter monsoon: The role of black carbon-induced Tibetan Plateau warming, J. Geophys. Res.-Atmos., 122, 5883–5902, https://doi.org/10.1002/2016jd026237, 2017. a
Le, T., Wang, Y., Liu, L., Yang, J., Yung, Y. L., Li, G., and Seinfeld, J. H.: Unexpected air pollution with marked emission reductions during the COVID-19 outbreak in China, Science, 369, eabb7431, https://doi.org/10.1126/science.abb7431, 2020. a, b, c
Lelieveld, J., Evans, J. S., Fnais, M., Giannadaki, D., and Pozzer, A.: The contribution of outdoor air pollution sources to premature mortality on a global scale, Nature, 525, 367–371, https://doi.org/10.1038/nature15371, 2015. a
Li, C., McLinden, C., Fioletov, V., Krotkov, N., Carn, S., Joiner, J., Streets, D., He, H., Ren, X., Li, Z., and Dickerson, R. R.: India Is Overtaking China as the World’s Largest Emitter of Anthropogenic Sulfur Dioxide, Scientific Reports, 7, 14304, https://doi.org/10.1038/s41598-017-14639-8, 2017. a
Liu, Z., Ming, Y., Wang, L., Bollasina, M., Luo, M., Lau, N., and Yim, S. H.: A Model Investigation of Aerosol‐Induced Changes in the East Asian Winter Monsoon, Geophys. Res. Lett., 46, 10186–10195, https://doi.org/10.1029/2019gl084228, 2019. a
Myhre, G., Samset, B. H., Schulz, M., Balkanski, Y., Bauer, S., Berntsen, T. K., Bian, H., Bellouin, N., Chin, M., Diehl, T., Easter, R. C., Feichter, J., Ghan, S. J., Hauglustaine, D., Iversen, T., Kinne, S., Kirkevåg, A., Lamarque, J.-F., Lin, G., Liu, X., Lund, M. T., Luo, G., Ma, X., van Noije, T., Penner, J. E., Rasch, P. J., Ruiz, A., Seland, Ø., Skeie, R. B., Stier, P., Takemura, T., Tsigaridis, K., Wang, P., Wang, Z., Xu, L., Yu, H., Yu, F., Yoon, J.-H., Zhang, K., Zhang, H., and Zhou, C.: Radiative forcing of the direct aerosol effect from AeroCom Phase II simulations, Atmos. Chem. Phys., 13, 1853–1877, https://doi.org/10.5194/acp-13-1853-2013, 2013. a
Pei, L. and Yan, Z.: Diminishing clear winter skies in Beijing towards a possible future, Environ. Res. Lett., 13, 124029, https://doi.org/10.1088/1748-9326/aaf032, 2018. a
Riahi, K., Van Vuuren, D. P., Kriegler, E., Edmonds, J., O'Neill, B. C., Fujimori, S., Bauer, N., Calvin, K., Dellink, R., Fricko, O., Lutz, W., Popp, A., Cuaresma, J. C., Kc, S., Leimbach, M., Jiang, L., Kram, T., Rao, S., Emmerling, J., Ebi, K., Hasegawa, T., Havlik, P., Humpenöder, F., Da Silva, L. A., Smith, S., Stehfest, E., Bosetti, V., Eom, J., Gernaat, D., Masui, T., Rogelj, J., Strefler, J., Drouet, L., Krey, V., Luderer, G., Harmsen, M., Takahashi, K., Baumstark, L., Doelman, J. C., Kainuma, M., Klimont, Z., Marangoni, G., Lotze-Campen, H., Obersteiner, M., Tabeau, A., and Tavoni, M.: The Shared Socioeconomic Pathways and their energy, land use, and greenhouse gas emissions implications: An overview, Global Environ. Chang., 42, 153–168, https://doi.org/10.1016/j.gloenvcha.2016.05.009, 2017. a, b
Rohde, R. A. and Muller, R. A.: Air Pollution in China: Mapping of Concentrations and Sources, PLOS ONE, 10, e0135749, https://doi.org/10.1371/journal.pone.0135749, 2015. a
Schichtel, B. A., Husar, R. B., Falke, S. R., and Wilson, W. E.: Haze trends over the United States, 1980–1995, Atmos. Environ., 35, 5205–5210, https://doi.org/10.1016/s1352-2310(01)00317-x, 2001. a
Turnock, S. T., Allen, R. J., Andrews, M., Bauer, S. E., Deushi, M., Emmons, L., Good, P., Horowitz, L., John, J. G., Michou, M., Nabat, P., Naik, V., Neubauer, D., O'Connor, F. M., Olivié, D., Oshima, N., Schulz, M., Sellar, A., Shim, S., Takemura, T., Tilmes, S., Tsigaridis, K., Wu, T., and Zhang, J.: Historical and future changes in air pollutants from CMIP6 models, Atmos. Chem. Phys., 20, 14547–14579, https://doi.org/10.5194/acp-20-14547-2020, 2020. a, b
Wang, L. and Chen, W.: An Intensity Index for the East Asian Winter Monsoon, J. Climate, 27, 2361–2374, https://doi.org/10.1175/jcli-d-13-00086.1, 2014. a
World Health Organization (WHO): Air quality guidelines: global update 2005: particulate matter, ozone, nitrogen dioxide and sulfur dioxide, World Health Organization. Regional Office for Europe, Copenhagen, Denmark, ix, 484 pp., 2006. a
Wu, D.: Formation and Evolution of Haze Weather, Environmental Science & Technology, 34, 157–161, https://doi.org/10.3969/j.issn.1003-6504.2011.03.036, 2011. a, b
Xue, T., Liu, J., Zhang, Q., Geng, G., Zheng, Y., Tong, D., Liu, Z., Guan, D., Bo, Y., Zhu, T., He, K., and Hao, J.: Rapid improvement of PM2.5 pollution and associated health benefits in China during 2013–2017, Science China Earth Sciences, 62, 1847–1856, https://doi.org/10.1007/s11430-018-9348-2, 2019. a
Zhang, L., Wilcox, L. J., Dunstone, N. J., Paynter, D. J., Hu, S., Bollasina, M., Li, D., Shonk, J. K. P., and Zou, L.: Future changes in Beijing haze events under different anthropogenic aerosol emission scenarios, Atmos. Chem. Phys., 21, 7499–7514, https://doi.org/10.5194/acp-21-7499-2021, 2021. a, b, c
Zhang, Q., Jiang, X., Tong, D., Davis, S. J., Zhao, H., Geng, G., Feng, T., Zheng, B., Lu, Z., Streets, D. G., Ni, R., Brauer, M., Van Donkelaar, A., Martin, R. V., Huo, H., Liu, Z., Pan, D., Kan, H., Yan, Y., Lin, J., He, K., and Guan, D.: Transboundary health impacts of transported global air pollution and international trade, Nature, 543, 705–709, https://doi.org/10.1038/nature21712, 2017. a
Zhang, Y., Yin, Z., and Wang, H.: Roles of climate variability on the rapid increases of early winter haze pollution in North China after 2010, Atmos. Chem. Phys., 20, 12211–12221, https://doi.org/10.5194/acp-20-12211-2020, 2020. a
Zheng, B., Tong, D., Li, M., Liu, F., Hong, C., Geng, G., Li, H., Li, X., Peng, L., Qi, J., Yan, L., Zhang, Y., Zhao, H., Zheng, Y., He, K., and Zhang, Q.: Trends in China's anthropogenic emissions since 2010 as the consequence of clean air actions, Atmos. Chem. Phys., 18, 14095–14111, https://doi.org/10.5194/acp-18-14095-2018, 2018. a, b
- Abstract
- Introduction
- Data and methods
- Present-day East Asian winter climate in CMIP6
- Haze changes throughout the 21st century
- Conclusion and discussion
- Code availability
- Data availability
- Author contributions
- Competing interests
- Disclaimer
- Acknowledgements
- Financial support
- Review statement
- References
- Supplement