the Creative Commons Attribution 4.0 License.
the Creative Commons Attribution 4.0 License.
 | 13 Oct 2021
Dramatic changes in Harbin aerosol during 2018–2020: the roles of open burning policy and secondary aerosol formation
Yuan Cheng
Qin-qin Yu
Xu-bing Cao
Ying-jie Zhong
Zhen-yu Du
Lin-lin Liang
Guan-nan Geng
Wan-li Ma
Hong Qi
Qiang Zhang
Ke-bin He
Despite the growing interest in understanding haze formation in Chinese megacities, air pollution has been largely overlooked for the Harbin–Changchun (HC) metropolitan area, located in the severe cold climate region in northeast China. In this study, we unfolded significant variations of fine particulate matter (PM2.5) in HC's central city (Harbin) during two sequential heating seasons of 2018–2019 and 2019–2020, and we explored major drivers for the observed variations. The two campaigns showed comparable organic carbon (OC) levels but quite different OC sources. The biomass burning (BB) to OC contribution decreased substantially for 2019–2020, which was attributed primarily to the transition of local policies on agricultural fires, i.e., from the “legitimate burning” policy released in 2018 to the “strict prohibition” policy in 2019. Meanwhile, the contribution of secondary OC (OCsec) increased significantly, associated with the much more frequent occurrences of high relative humidity (RH) conditions during the 2019–2020 measurement period. Similar to OCsec, the major secondary inorganic ions, i.e., sulfate, nitrate and ammonium (SNA), also exhibited RH-dependent increases. Given the considerable aerosol water contents predicted for the high-RH conditions, heterogeneous reactions were likely at play in secondary aerosol formation even in the frigid atmosphere in Harbin (e.g., with daily average temperatures down to below −20 ∘C). In brief, compared to 2018–2019, the 2019–2020 measurement period was characterized by a policy-driven decrease of biomass burning OC, a RH-related increase of OCsec and a RH-related increase of SNA, with the first two factors generally offsetting each other. In addition, we found that open burning activities were actually not eliminated by the strict prohibition policy released in 2019, based on a synthesis of air quality data and fire count results. Although not occurring during the 2019–2020 measurement period, agricultural fires broke out within a short period before crop planting in spring of 2020, and this resulted in off-the-charts air pollution for Harbin, with 1 h and 24 h PM2.5 concentrations peaking at ∼ 2350 and 900 µg/m3, respectively. This study indicates that sustainable use of crop residues remains a difficult challenge for the massive agricultural sector in northeast China.
- Article
(2433 KB) - Full-text XML
-
Supplement
(2373 KB) - BibTeX
- EndNote


Despite nationwide reductions in anthropogenic emissions (Zhang et al., 2019), severe haze pollution characterized by high concentrations of fine particulate matter (PM2.5) is far from being effectively controlled in China, e.g., haze episodes were observed in Beijing even during the COVID-19 lockdown (Lv et al., 2020). This reveals the complex yet poorly understood responses of air pollution to changes of primary emission. While secondary aerosol production has been thought to be largely responsible for this lack of understanding, the chemical mechanisms remain vague (Le et al., 2020; Wang et al., 2020b; Huang et al., 2021). For example, state-of-the-art models incorporating gas-phase and cloud chemistry frequently underestimated sulfate and secondary organic aerosol (SOA) concentrations for winter haze events in Beijing (Wang et al., 2014; B. Zheng et al., 2015; Cheng et al., 2016; J. Liu et al., 2020). The underestimation was more significant with increasing relative humidity (RH) or aerosol water content (AWC) levels, pointing to the importance of aqueous-phase reactions in aerosol water (Wang et al., 2016; Shrivastava et al., 2017; Su et al., 2020; Liu et al., 2021b). On the other hand, quantitative prediction of secondary aerosols formed through aqueous-phase reactions remains challenging, partially due to uncertainties in aerosol pH (Guo et al., 2017b; Song et al., 2018; Zheng et al., 2020) and oxidant concentrations (Ye et al., 2018; Wang et al., 2020a). In addition, despite the fact that heterogeneous chemistry has been widely accepted for sulfate formation, its effects on SOA remain unclear, with more evidence, indicating an enhancement effect (Hu et al., 2016; Kuang et al., 2020; J. Liu et al., 2020; Wang et al., 2021a), overwhelming those suggesting little influence of RH or AWC on SOA formation (G. J. Zheng et al., 2015). In all, there is a growing interest in understanding haze pollution in Chinese megacities (Shi et al., 2019), especially regarding the driving factors responsible for the spatiotemporal variations, since these factors are essential for the development of efficient air pollution control strategies.
Studies on haze in China have been historically concentrated in the North China Plain (NCP), especially around Beijing. Recently, new hotspots began to emerge, e.g., the Harbin–Changchun (HC) metropolitan area. HC is located in the severe cold climate region in northeast China, and includes 11 cities in the two provinces of Heilongjiang and Jilin. Compared to NCP and other traditional hotspots of air pollution research (e.g., the Yangtze River Delta), HC is characterized by its extremely cold winter when the daily average temperatures could drop to below −20 ∘C. Thus, the heating season is usually as long as 6 months in HC, lasting from late fall through early spring of next year. During this period, intensive energy use is expected, e.g., coal combustion for central heating in urban areas and household biomass burning (BB) for space heating in rural areas. The intensive energy use, to a large extent, determines the relatively high baseline of PM2.5 pollution in HC's heating season. According to the open-access air quality data routinely published by the China National Environmental Monitoring Center (https://air.cnemc.cn:18007/ last access: 9 October 2021), the monthly averages of PM2.5 measured during winter in Harbin stayed above 55 µg/m3 from 2013 to 2020, whereas the corresponding value could drop to below 30 µg/m3 for Beijing.
Another feature of HC is that it is located in a main agricultural region in China. For example, Heilongjiang Province provided ∼ 13 % and 15 % of the national rice and corn productions in 2019, respectively, with only ∼ 5 % of China's land area (National Bureau of Statistics of China, 2020). The massive agricultural sector results in a huge amount of crop residues, which are produced after harvesting in fall and must be disposed of before planting in spring of the next year. Although nominally prohibited, open burning persists as an important approach for the disposal of crop residues in northeast China, with a time window largely overlapped with the heating season. These agricultural fires frequently resulted in heavily polluted PM2.5 episodes, e.g., with 24 h PM2.5 peaking at ∼ 650 µg/m3 during early November of 2015 in Harbin (Li et al., 2019b). Given that the agricultural fires were never eliminated, interim provisions were released by Heilongjiang Province in 2018, which approved a window of approximately 3 months (from 11 December 2018 to 9 March 2019) for open burning of crop residues (Department of Ecology and Environment of Heilongjiang Province, 2018). However, the interim provisions were amended in 2019, i.e., the legitimate burning policy was terminated and was replaced by a toughest-ever policy on open burning, which required that agricultural fires should be strictly prohibited for the period of 15 September 2019 to 15 May 2020. The rapid transition of open burning policy reflects the ongoing attempts of local government to control the severe haze pollution caused by agricultural fires. However, the most effective and reliable approach remains inconclusive, given that very little is known about the role of biomass burning in PM2.5 pollution in northeast China. Actually, PM2.5 in northeast China is far from being well characterized yet with limited studies (e.g., Cao et al., 2016; Yang et al., 2017; Li et al., 2019b; Zhang et al., 2020), especially regarding sources and chemical mechanisms of aerosol formation.
In this study, we investigated the variations of Harbin aerosol during two sequential heating seasons of 2018–2019 and 2019–2020, with focuses on the roles of (1) rapid transition of open burning policy and (2) significant change of meteorological conditions (especially relative humidity), which would influence primary emissions and secondary aerosol formation, respectively. Policy implications for improving air quality in the HC region were also discussed.
2.1 Field observation and additional data sets used
Two campaigns were conducted at an urban site located in the campus of Harbin Institute of Technology (HIT; 45∘45′24′′ N, 126∘40′49′′ E) during the heating seasons of 2018–2019 (from 16 October 2018 to 14 April, 2019; N=180) and 2019–2020 (from 16 October 2019 to 4 February 2020; N=112), following the same sampling and analytical procedures. As described for the 2018–2019 campaign (Cheng et al., 2021a), a low-volume sampler (MiniVol; Airmetrics, OR, USA) operated at a flow rate of 5 L/min was used to collect airborne PM2.5 onto prebaked quartz-fiber filters (2500 QAT-UP; Pall Corporation, NY, USA), and the measured species included organic carbon (OC), elemental carbon (EC), organic tracers for biomass burning (levoglucosan and mannosan) and water-soluble inorganic ions (sulfate, nitrate, ammonium, etc.). Briefly, OC and EC were determined by a thermal/optical carbon analyzer (DRI-2001; Atmoslytic Inc., CA, USA), using the IMPROVE-A temperature protocol with the transmittance charring correction. Precision of the carbon analyzer was investigated by analyzing the samples using another protocol (NIOSH). Comparisons of total carbon and optical attenuation results between the two protocols suggested good repeatability for both the carbon and transmittance measurements (Fig. S1). Levoglucosan and mannosan were detected by a Dionex ion chromatography (IC) system (ICS-5000+; Thermo Fisher Scientific Inc., MA, USA), using the high-performance anion-exchange chromatography coupled to pulsed amperometric detection (HPAEC-PAD) method. In addition, IC was also used to measure the inorganic ions. Precision of the IC was evaluated by analyzing selected solutions 5–10 times, and the relative standard deviations were found to be within 5 % for all the water-soluble species detected, either organic or inorganic. Based on the observed aerosol components, PM2.5 mass was reconstructed as the sum of organic matter (determined as 1.6 × OC), EC and inorganic ions. The reconstructed PM2.5 will be specified as (PM2.5)∗ in the flowing discussions.
Air quality data including PM2.5, sulfur dioxide (SO2), nitrogen dioxide (NO2), carbon monoxide (CO), etc. were obtained from China's National Urban Air Quality Real Time Publishing Platform (https://air.cnemc.cn:18007/, last access: 9 October 2021). They were measured at monitoring sites operated by the China National Environmental Monitoring Center (CNEMC) and could be accessed with a time resolution of 1 h. There are a total of 12 CNEMC sites in Harbin. Results from the nearest one to the filter sampling site (∼ 2.4 km apart), i.e., Taiping Hongwei Park, were used in this study. In addition, hourly meteorological data including temperature and relative humidity (RH) were obtained from Weather Underground (https://www.wunderground.com/, last access: 9 October 2021).
Using levoglucosan as the reference component, the relative abundances of water-soluble potassium (K+) were found to increase substantially for five samples collected during the Chinese New Year periods in February of 2019 (N=2; Cheng et al., 2021a) and in January of 2020 (N=3; Fig. S2), pointing to the significant influence of firework emissions. Given that such emissions may result in primary sulfate and nitrate which are difficult to quantify, the firework events were excluded, and the remaining sulfate and nitrate were considered secondary in the following discussions. Then taking together observational results from the filter sampling and CNEMC sites, the sulfur oxidation ratio (SOR) was determined as the molar ratio of sulfate to the sum of sulfate and SO2, and the nitrogen oxidation ratio (NOR) was determined similarly based on nitrate and NO2.
2.2 Thermodynamic simulation
The ISORROPIA-II model (Fountoukis and Nenes, 2007) was used to predict aerosol water content (AWC) and aerosol pH. The calculations were conducted in two ways, namely, the “reverse” and “forward” modes. For the reverse mode, the measured aerosol-phase data were deployed as input to derive AWC and pH directly. For the forward mode, the model was run in an iterative way (Liu et al., 2021a). Briefly, we used the measured aerosol-phase data as initial input, ran ISORROPIA-II in the forward mode to predict gas-phase concentrations of semi-volatile species (e.g., ammonia and nitric acid), and used the sum of predicted gas-phase and measured aerosol-phase concentrations as the input for next round. The calculations were repeated until the simulated results were stable and in line with the observational data. Although the reverse and forward mode simulations showed comparable AWC levels for this campaign (Fig. S3), the latter approach has been suggested to give more accurate and robust estimation of pH (Guo et al., 2017a; Song et al., 2018). Thus, AWC and pH results predicted by the iteration approach were used in the following discussions.
2.3 Source apportionment
Source apportionment was performed using EPA's Positive Matrix Factorization (PMF) model (version 5.0), with time series of OC, EC, levoglucosan, chloride, nitrate, sulfate and ammonium from both campaigns as inputs. A total of five factors were resolved, and their profiles are shown in Fig. S4. Two factors (BB-1 and BB-2) were strongly associated with primary biomass burning emissions, since almost all the levoglucosan (∼ 90 %) was apportioned to these two factors, whereas neither of them was a major contributor to secondary ions. Another two factors were inferred to represent secondary aerosols (SA-1 and SA-2), as they had zero EC but the majority of nitrate and sulfate. The last factor (non-BBpri) was attributed to primary emissions from non-BB sources, because more than 50 % of EC but little levoglucosan was found in this factor.
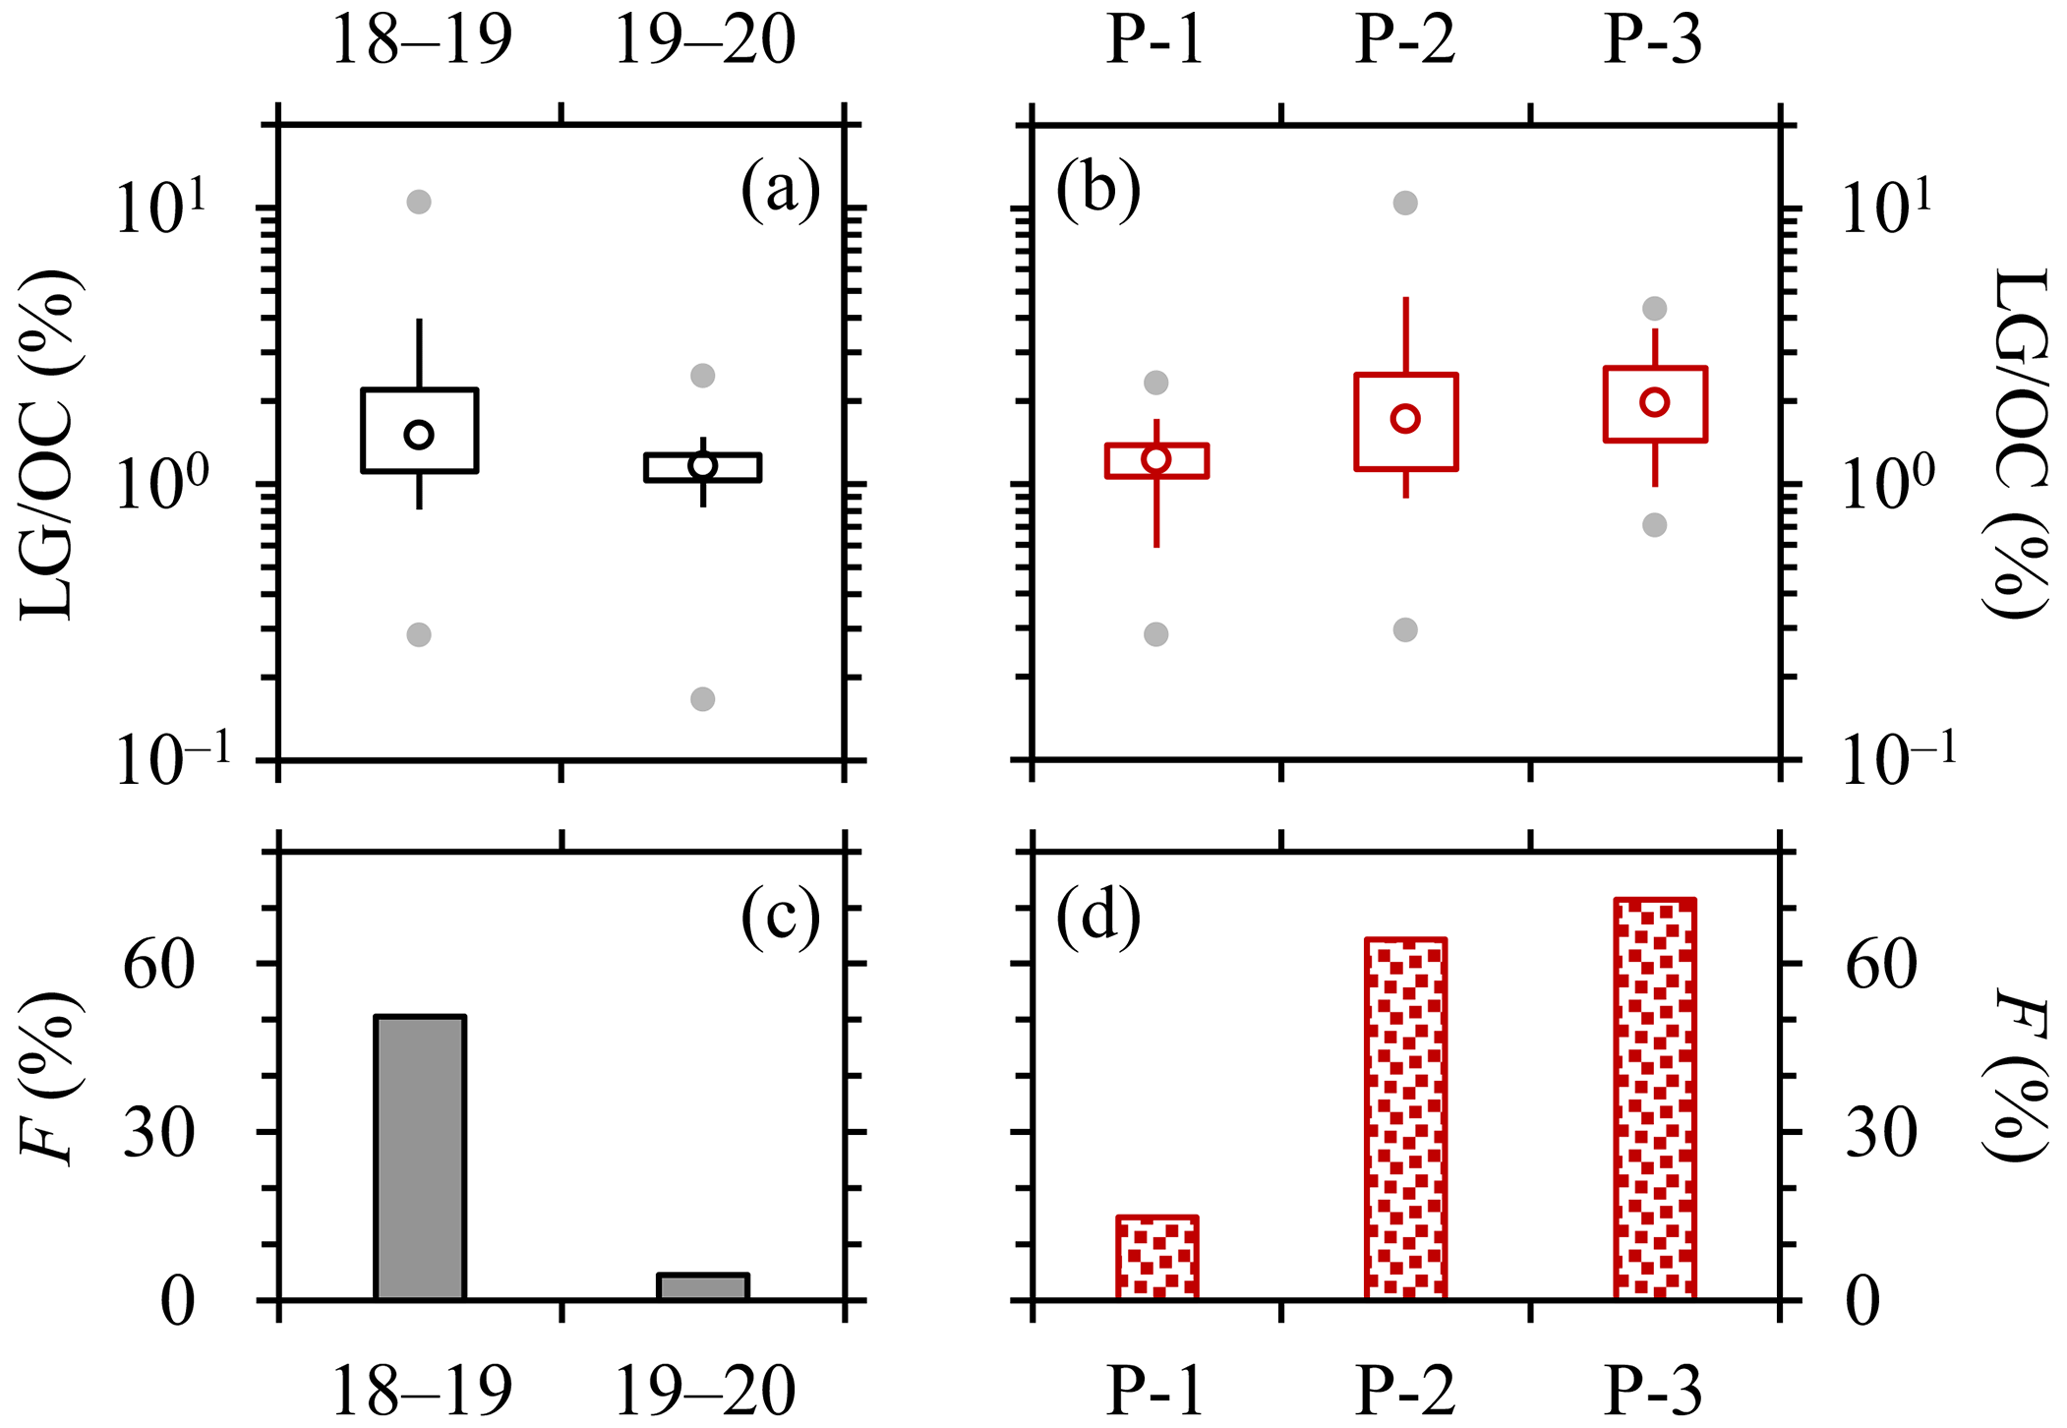
Figure 1Comparisons of levoglucosan to OC ratios, i.e., (on a basis of carbon mass), and the fractions of samples with above 1.5 % (denoted as F), (a, c) between the 2018–2019 and 2019–2020 campaigns, and (b, d) across the 2018–2019 samples collected before (P-1), during (P-2) and after (P-3) the legitimate burning periods. Lower and upper box bounds indicate the 25th and 75th percentiles, the whiskers below and above the box indicate the 5th and 95th percentiles, the solid circles below and above the box indicate the minimum and maximum, and the open circle within the box marks the median (the same hereinafter).
3.1 Variation of biomass burning (BB) OC
Although comparable OC levels were observed during the 2018–2019 and 2019–2020 measurement periods (averaging 20.66 ± 18.17 and 20.64 ± 16.76 µgC/m3, respectively), the former campaign exhibited substantially higher contributions of levoglucosan to OC (Fig. 1a). Here we applied the levoglucosan to OC ratio () as the indicator for BB impact, given that the absolute concentrations of ambient levoglucosan could be influenced by other factors in addition to biomass burning (e.g., wind speed and planetary boundary layer height). averaged 1.83 ± 1.18 % and 1.17 ± 0.30 % (on a basis of carbon mass) during 2018–2019 and 2019–2020, respectively, indicating that the influence of biomass burning was stronger during the former campaign. This difference was mainly caused by the 2018–2019 samples collected during and after the legitimate burning periods (periods of P-2 and P-3, with average ratios of 2.09 ± 1.42 % and 2.15 ± 0.94 %, respectively; Fig. 1b), whereas the ratios observed before the onset of legitimate burning (P-1, averaging 1.20 ± 0.36 %) were in general comparable with those during the 2019–2020 campaign.
Recalling the different open burning policies released in 2018 and 2019, the observed variations of appeared to be associated with agricultural fires. According to the relationship between levoglucosan and OC, Cheng et al. (2021a) classified the 2018–2019 samples into three groups (cases A, B and C) with ranges of < 1.5 %, 1.5–3.0 % and > 3.0 %, respectively. Levoglucosan exhibited strong linear correlations with OC for all the three cases (r≥0.95), with slopes, i.e., (approximately equivalent to given the close-to-zero intercepts), of 1.1 %, 2.3 % and 5.0 %, respectively. The variation of across the three cases was inferred to be driven mainly by agricultural fires that had relatively low combustion efficiencies, based on a synthesis of the following evidence (Cheng et al., 2021a): (1) the levoglucosan to K+ ratios and levoglucosan to mannosan ratios observed throughout the 2018–2019 campaign were in line with the characteristics of BB smoke emitted by the burning of crop residues; (2) no dependence of on temperature was observed, indicating that the variations of could not be explained by biomass burning for household space heating in rural areas; (3) elevated ratios were typically associated with intensive fire counts, i.e., open burning of crop residues, around Harbin; and (4) chemical signatures associated with the combustion phase exhibited changes toward smoldering-dominated burning from cases A through C, e.g., (derived from linear regression of EC on CO) decreased whereas the levoglucosan to K+ ratios increased. Following Cheng et al. (2021a), ratios higher than 1.5 % were considered an indicator for apparent impacts of agricultural fires around Harbin. As shown in Fig. 1c–d, approximately 50 % of the 2018–2019 samples exhibited above 1.5 %, with various fractions for the three periods, i.e., 15 %, 64 % and 71 % for P-1, P-2 and P-3 samples, respectively. Thus, apparent impacts of agricultural fires were frequently encountered in the 2018–2019 campaign, particularly after the onset of legitimate burning. It is noteworthy that the agricultural fires did not actually disappear after the ending of legitimate burning and instead extended to mid-April of 2019. For the 2019–2020 campaign, however, only less than 5 % of the samples showed larger than 1.5 % (Fig. 1c), indicating the rare occurrence of agricultural fires during the measurement period.
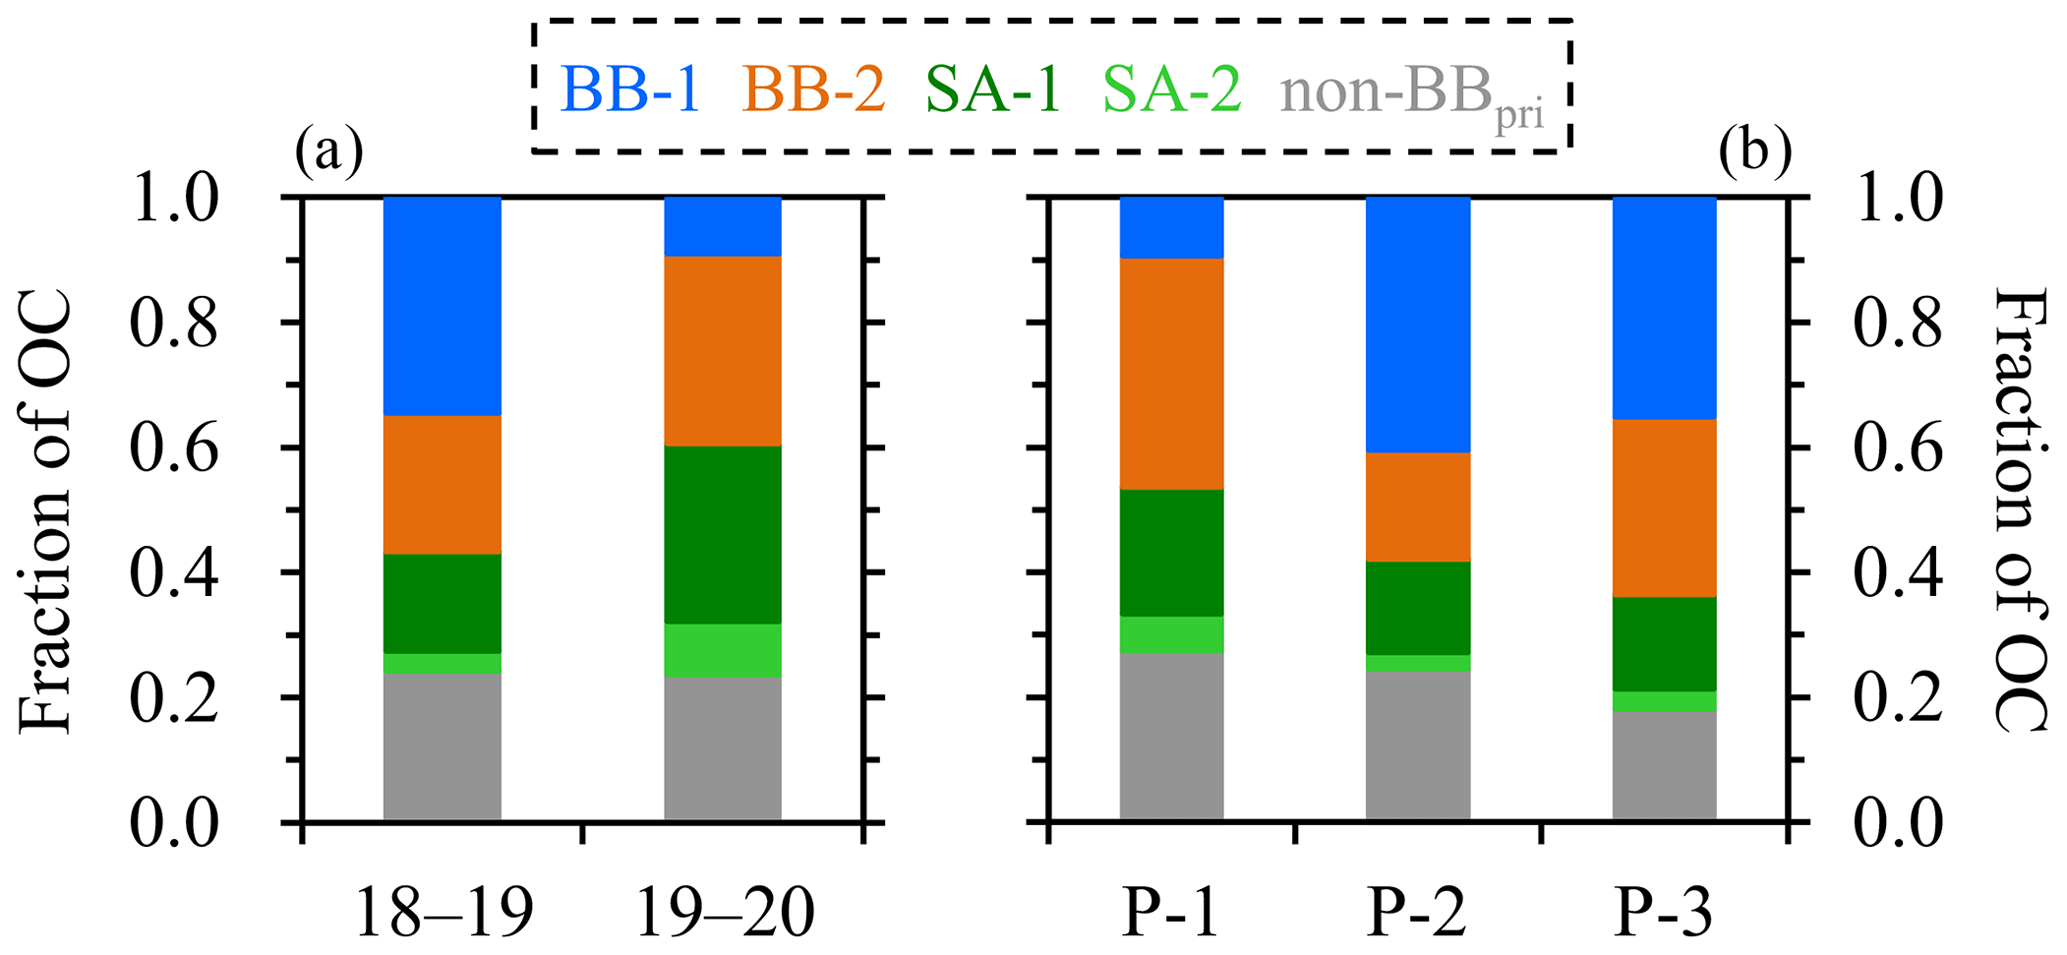
Figure 2Comparison of OC source apportionment results (a) between the 2018–2019 and 2019–2020 campaigns and (b) across the 2018–2019 samples collected before (P-1), during (P-2) and after (P-3) the legitimate burning periods.
Comparison of source apportionment results between the two campaigns also indicated substantial changes in the influence of agricultural fires. For the 2018–2019 campaign, both the OC mass apportioned to BB-1 (OCBB-1; Fig. S5) and the contribution of BB-1 to OC (fBB-1; Fig. 2) increased substantially after the onset of legitimate burning, likely indicating that this factor was representative of agricultural fire emissions. This inference was also supported by the comparison of OC source apportionment results across the three cases (A–C) with increasing ratios, i.e., with stronger impacts of agricultural fires. OCBB-1 increased drastically by ∼ 25-fold (from 1.2 to 30.9 µgC/m3) from cases A through C, with OC attributed to other factors being largely unchanged; correspondingly, fBB-1 increased sharply from 9 % to 69 % across the three cases (Fig. S6). In addition, it was noticed that negligible EC was apportioned to the BB-1 factor (Fig. S4), which was the characteristic of smoldering-dominated combustion as supported by numerous BB source emission studies (McMeeking et al., 2009; May et al., 2014; Pokhrel et al., 2016; McClure et al., 2020; Wang et al., 2020c). This feature was consistent with the inference that the agricultural fires had relatively low combustion efficiencies (Cheng et al., 2021a). During the 2018–2019 campaign, the contribution of agricultural fires to OC was rather small (9 %) before the onset of legitimate burning, whereas after this time point the contribution increased to ∼ 40 % (Fig. 2). The overall fBB-1 was 34 % for the entire measurement period of 2018–2019, suggesting agricultural fire emissions as the dominant source of OC. For the 2019–2020 campaign, however, fBB-1 was substantially lower (9 %; Fig. 2), comparable with that determined for the 2018–2019 samples collected during P-1, i.e., before the onset of legitimate burning. Regarding the temporal variation of agricultural fire impacts, the same patterns were observed based on the comparisons of and PMF results across various measurement periods.
Unlike OCBB-1, OC masses apportioned to the BB-2 factor (OCBB-2) were comparable for the 2018–2019 samples collected before, during and after the legitimate burning periods (Fig. S5). OCBB-2 was also largely unchanged across the three cases (A–C) with stronger impacts of agricultural fires (Fig. S6). Therefore, it seems that BB-2 was associated with biomass burning activities that did not have significant daily variation, with the most likely candidate being household combustion of crop residues (for cooking and heating). In addition, OCBB-2 appeared to be slightly higher for the 2019–2020 campaign compared to 2018–2019 (6.24 vs. 4.51 µgC/m3; Fig. S5), presumably because more crop residues were consumed through household use in response to the strict prohibition open burning policy.
The two biomass burning factors constituted 57 % of OC for the 2018–2019 campaign (Fig. 2). Before the onset of legitimate burning, the total contribution of biomass burning (fBB) was 46 % and was dominated by the BB-2 factor (i.e., household burning of crop residues), whereas after this time point, fBB increased to 59 % and was dominated by BB-1 (agricultural fires). For the case C samples, i.e., under the strongest impacts of agricultural fires, fBB was as high as 79 % (Fig. S6). A prominent reduction in OCBB-1, however, occurred for the 2019–2020 measurement period, and fBB dropped to 39 % with BB-2 as the dominant contributor (Figs. 2 and S5). It is noteworthy that compared to the typical fBB determined during winter in Beijing (∼ 10 %–20 %, derived from field observations using aerosol mass spectrometer; Hu et al., 2016; Sun et al., 2018; Li et al., 2019a; Xu et al., 2019), the BB contributions were much higher in Harbin even when the contribution of agricultural fires was limited (e.g., during the 2019–2020 campaign and P-1 in 2018–2019), pointing to strong emissions from residential burning of crop residues throughout the heating season in northeast China.
3.2 Variation of secondary OC
OC masses apportioned to the SA-1 and SA-2 factors (OCsec) were considered secondary. OCsec values were 3.9 and 7.6 µgC/m3 for the 2018–2019 and 2019–2020 campaigns, respectively, constituting 19 % and 37 % of OC (Figs. 2 and S5). It was noticed that for biomass burning OC and OCsec, their inter-campaign differences showed comparable absolute values but opposite signs. This explains why the two heating seasons had significantly different OC sources but almost the same OC levels.
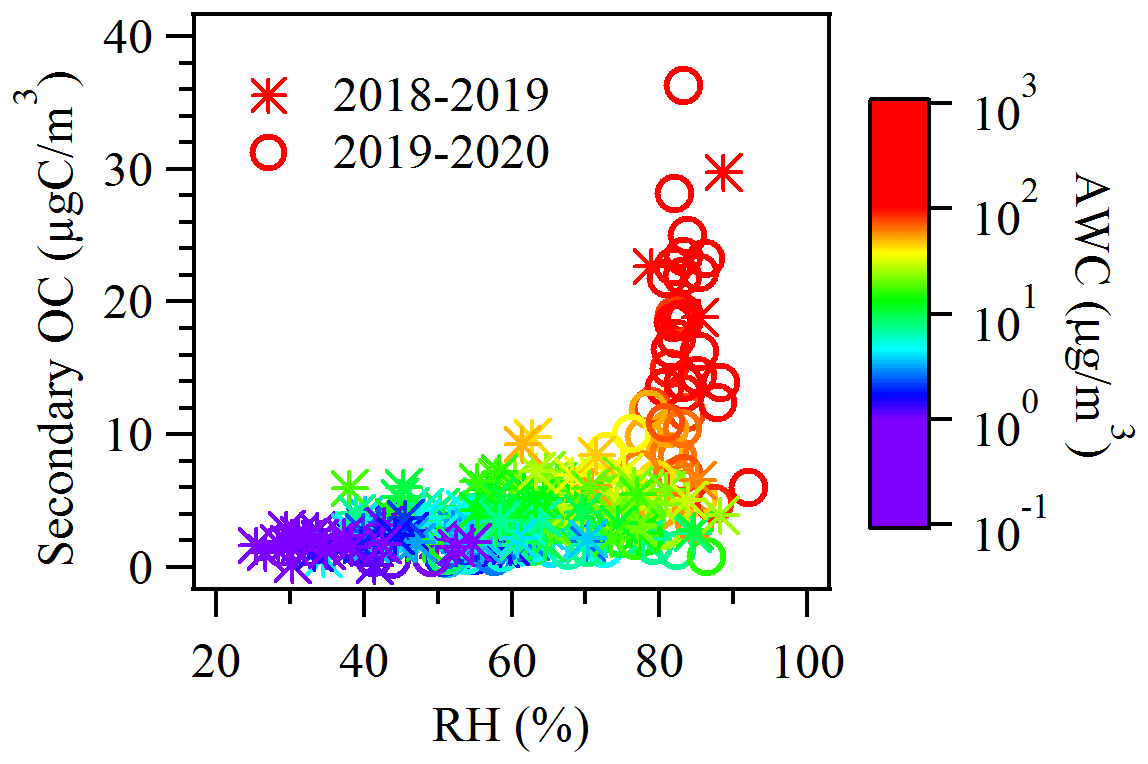
Figure 3Dependence of secondary OC (OCsec) on RH among the two campaigns, color-coded by AWC levels. Results from the 2018–2019 campaign and 2019–2020 campaign were marked using stars and circles, respectively. A majority of the data points with RH above 80 % were observed during 2019–2020. RH exceeded 80 % for only 10 samples collected during 2018–2019, and only 3 out of these 10 samples showed an RH-dependent increase of OCsec.
As shown in Fig. 3, OCsec exhibited a positive dependence on RH, with an explosive increase of OCsec after RH exceeded 80 %. Only ∼ 6 % of the 2018–2019 samples (10 out of 180) experienced such humid conditions, whereas this fraction was as high as ∼ 37 % for 2019–2020 (corresponding to 42 out of the 112 samples). Thus the potential influence of RH on SOA formation was primarily investigated based on results from the 2019–2020 campaign. Figure 4 compares OC source apportionment results across different RH ranges (< 60 %, 60 %–80 % and > 80 %), which are termed low-, medium- and high-RH conditions, respectively, for this measurement period. Not only OCsec but also its contribution to OC (fsec) increased significantly from the low- through high-RH conditions, by factors of 9.8 and 2.6, respectively. Although the 2019–2020 campaign experienced much lower ambient temperatures (as low as −20 ∘C) compared to Beijing's winter (∼ 0 ∘C), the fsec of Harbin reached 42 % for the RH range of > 80 %, generally comparable with the typical range of oxygenated organic aerosol (OOA) contribution (∼ 35 %–60 %) determined under humid winter conditions in Beijing (Sun et al., 2013, 2014, 2018; Hu et al., 2016; Xu et al., 2019). Given the considerable AWC levels predicted for the high-RH conditions (typically above 50 µg/m3; Fig. 3), it was inferred that heterogeneous reactions might be at play in the RH-dependent increase of fsec.
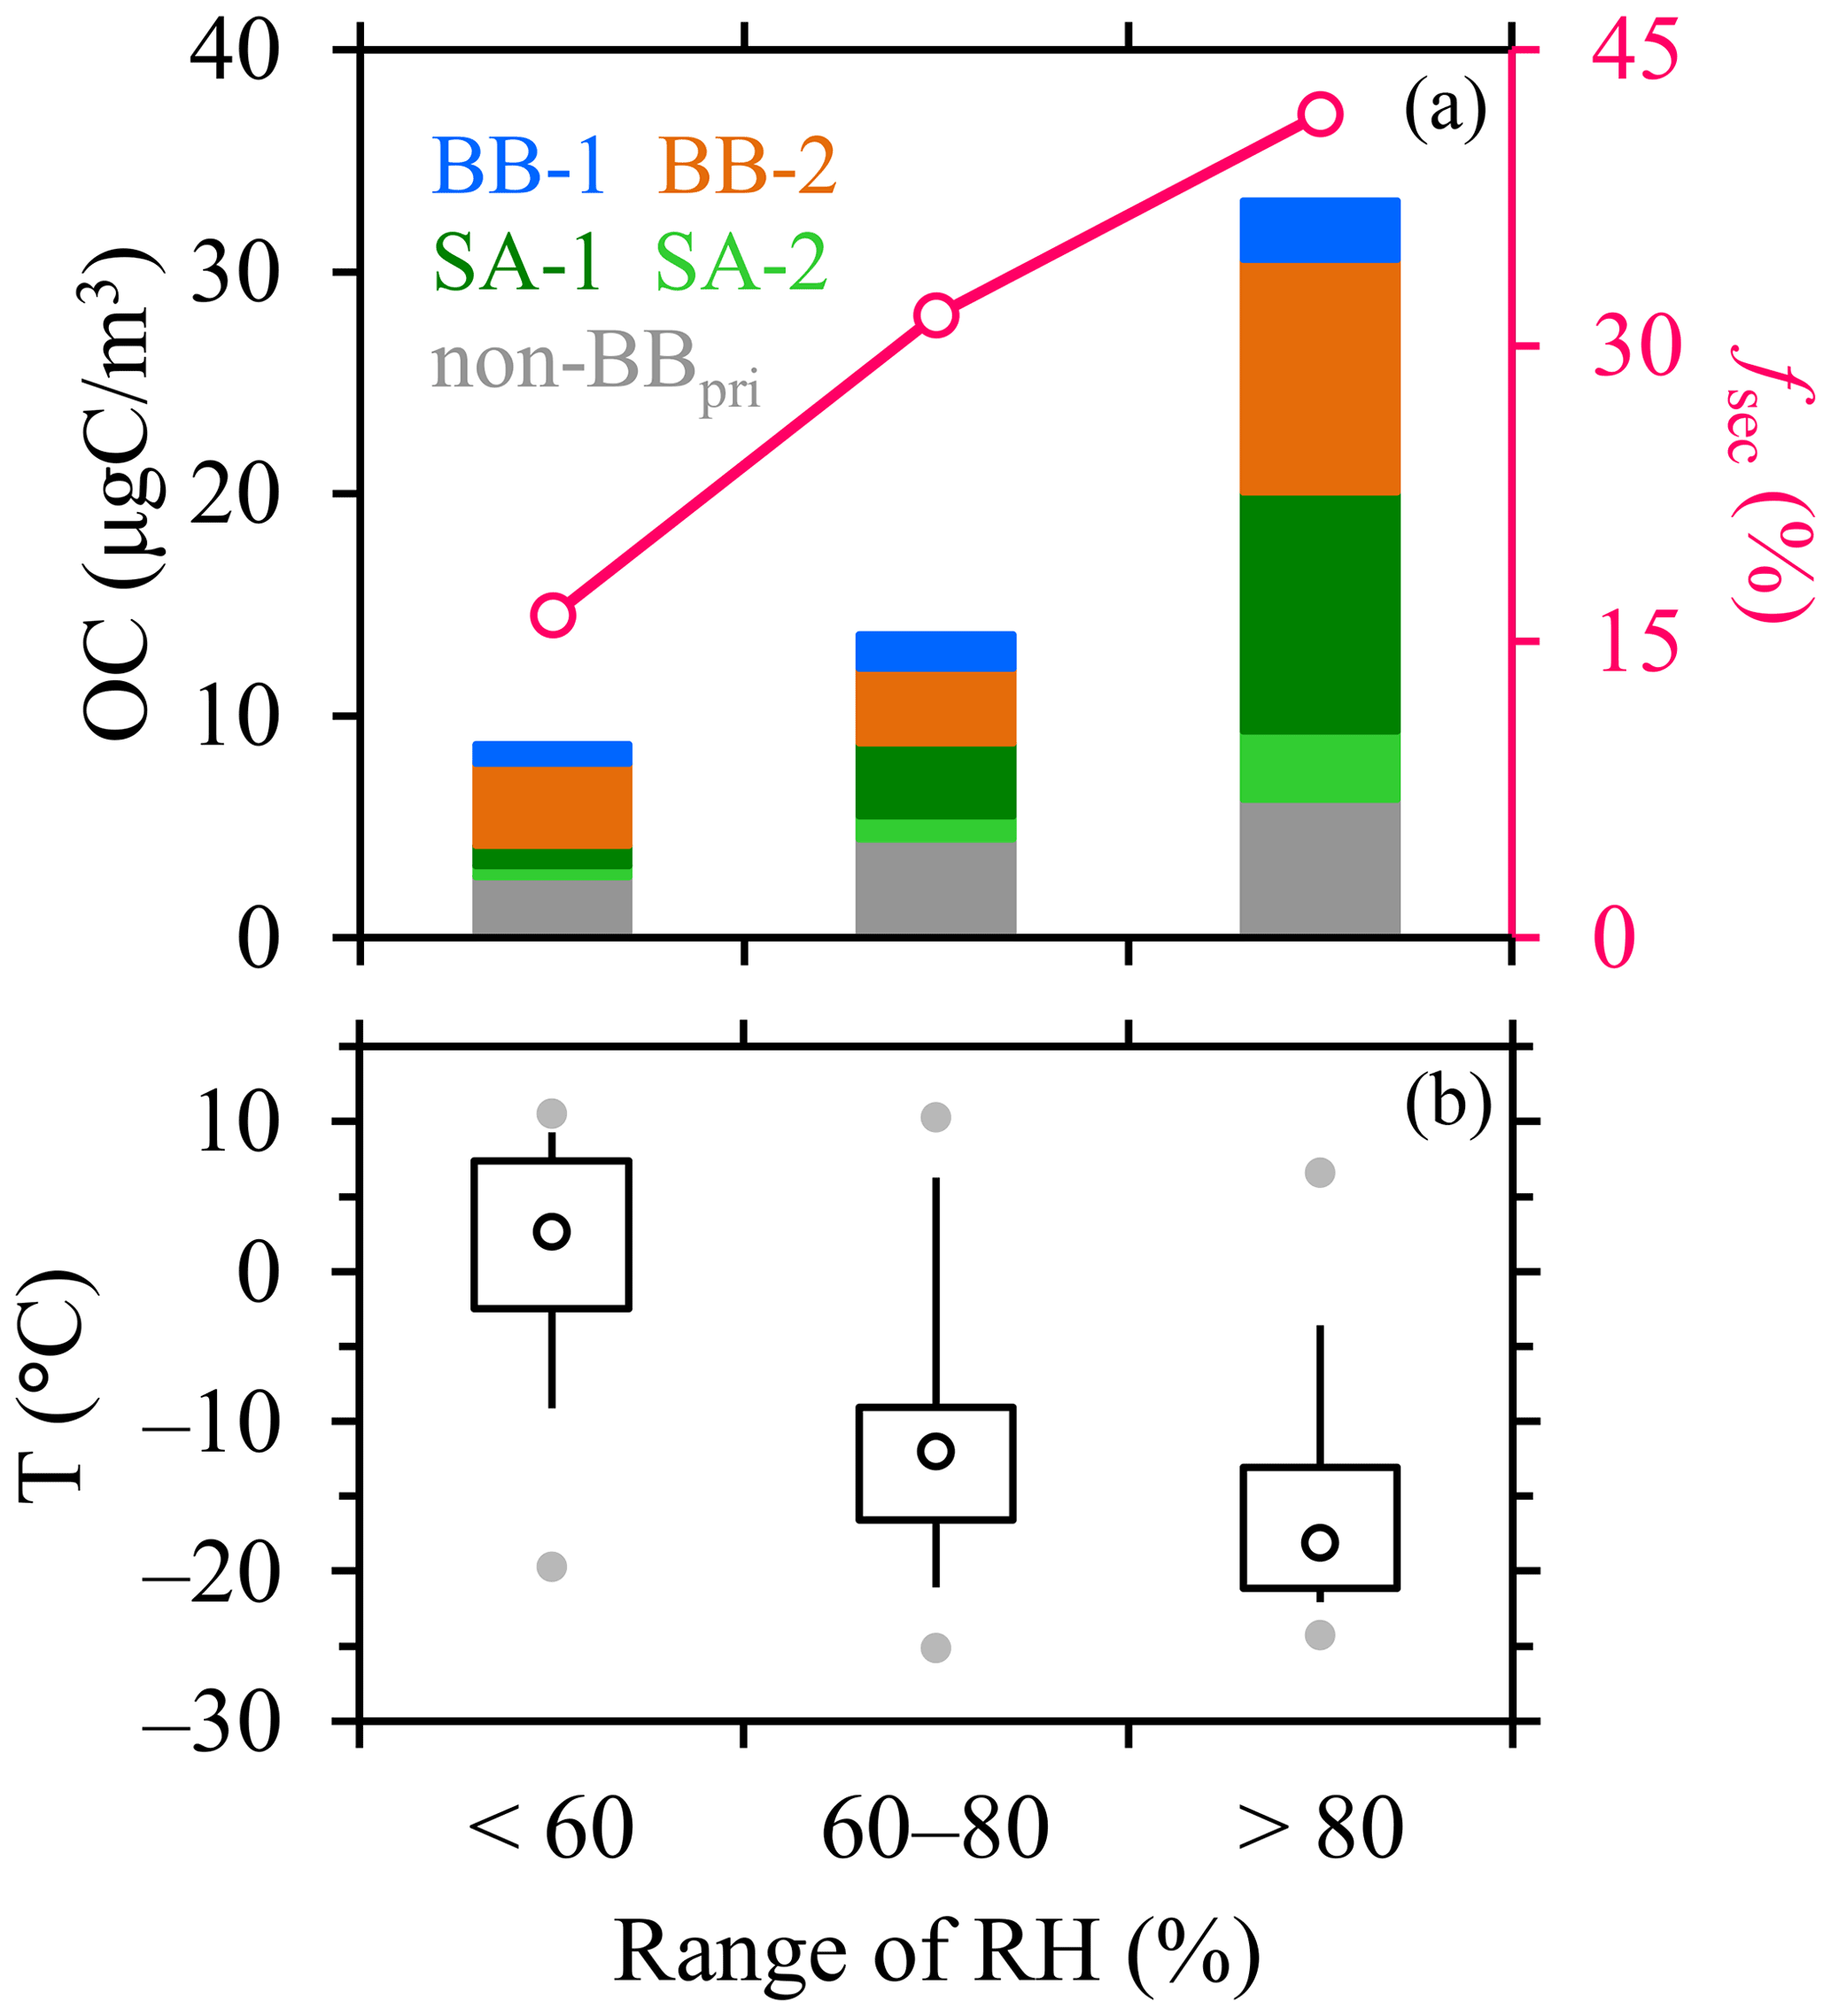
Figure 4Comparisons of (a) OC source apportionment results (left axis), the contributions of PMF-based OCsec to OC (fsec; right axis), and (b) ambient temperatures across different RH ranges for the 2019–2020 campaign.
The OC to EC ratio () is also a commonly used indicator for SOA, giving rise to the EC-tracer method for the estimation of OCsec mass. However, it has long been recognized that SOA formation is usually not the only factor that can increase , and another factor that could be playing a crucial role is the biomass burning smoke with relatively high emission ratios of OC to EC. Among the three primary factors resolved in this study, for the primary emissions of BB-1 (extremely high as negligible EC was apportioned to this factor; Fig. S4) and BB-2 (3.5) were both larger than that of non-BBpri (2.8). Thus the influences of not only SOA but also biomass burning emissions need to be considered when interpreting the observed . For the 2018–2019 campaign, the temporal variation of was mainly driven by biomass burning emissions (especially the BB-1 factor), as can be seen from the positive dependence of on levoglucosan and the comparison of across the three cases with increasing (Fig. S7). In this case, the EC-tracer method should be used with caution, since the basic assumption, i.e., variation of can be attributed primarily to SOA formation, was invalid. Unlike 2018–2019, SOA was the dominant driver for the variation of during the 2019–2020 measurement period, as indicated by the positive dependence of on sulfate and the comparison of across the low- through high-RH conditions (Fig. S8). During the 2019–2020 campaign, similar patterns of temporal variation were observed for OCsec retrieved using the EC-tracer method and PMF approach, and both results supported the RH-dependent increase of OCsec (Fig. S9). However, compared to the PMF-based fsec, the EC-tracer method resulted in a higher contribution of OCsec to OC for the high-RH conditions (60 % vs. 42 %). This is not surprising, as variation of biomass burning emissions could also contribute to the elevated of the high-RH conditions (Fig. S8), but this contribution could not be distinguished from that of SOA by the EC-tracer method. Nonetheless, enhanced SOA formation was evident for the high-RH conditions, which mainly occurred within the coldest months (December and January) during the 2019–2020 measurement period.
3.3 Variation of secondary inorganic aerosol
Both sulfate and SOR exhibited increasing trends as RH became higher (Fig. 5), e.g., SOR averaged 0.09 ± 0.04 and 0.20 ± 0.07 for the RH ranges of below and above 80 %, respectively. The apparent increase of SOR after RH exceeded 80 % pointed to enhanced sulfate formation, presumably through heterogeneous reactions given the high AWC levels (as can be seen from Fig. 3). In addition, NO2 appeared to be at play in the heterogeneous conversion of SO2 to sulfate, because the RH-dependent increase of SOR was more significant for the samples with relatively high NO2 concentrations (e.g., above 30 µg/m3; Fig. 6). Based on the observational results available, however, it was inconclusive whether NO2 was the dominant oxidant for the heterogeneous formation of sulfate. Simulation results by ISORROPIA-II suggested moderately acidic aerosols (pH of 4.2 ± 1.1) for the high-RH conditions, and the importance of other oxidants (e.g., H2O2) could be comparable with or even overwhelm NO2 for the oxidation of SO2 in aerosol water at such pH levels (Guo et al., 2017b; Liu et al., 2017; Ye et al., 2018; Wang et al., 2021b). Nonetheless, the relationship between SOR and RH observed in Harbin was in general consistent with the wintertime results from Beijing. However, the threshold RH for sharp increase of SOR was higher in Harbin (80 %) than that in Beijing (∼ 40 %–70 %), and the SOR values in Harbin with RH above 80 % (averaging 0.2) were at the lower end of the corresponding values observed during winter in Beijing (typically with averages of ∼ 0.2–0.6) (Sun et al., 2013; G. J. Zheng et al., 2015; Zhang et al., 2018; Li et al., 2019a; P. Liu et al., 2020). A likely cause for these differences was the relatively low temperatures during the measurement period, which would reduce the rate coefficients of relevant aqueous-phase reactions (Cheng et al., 2016).
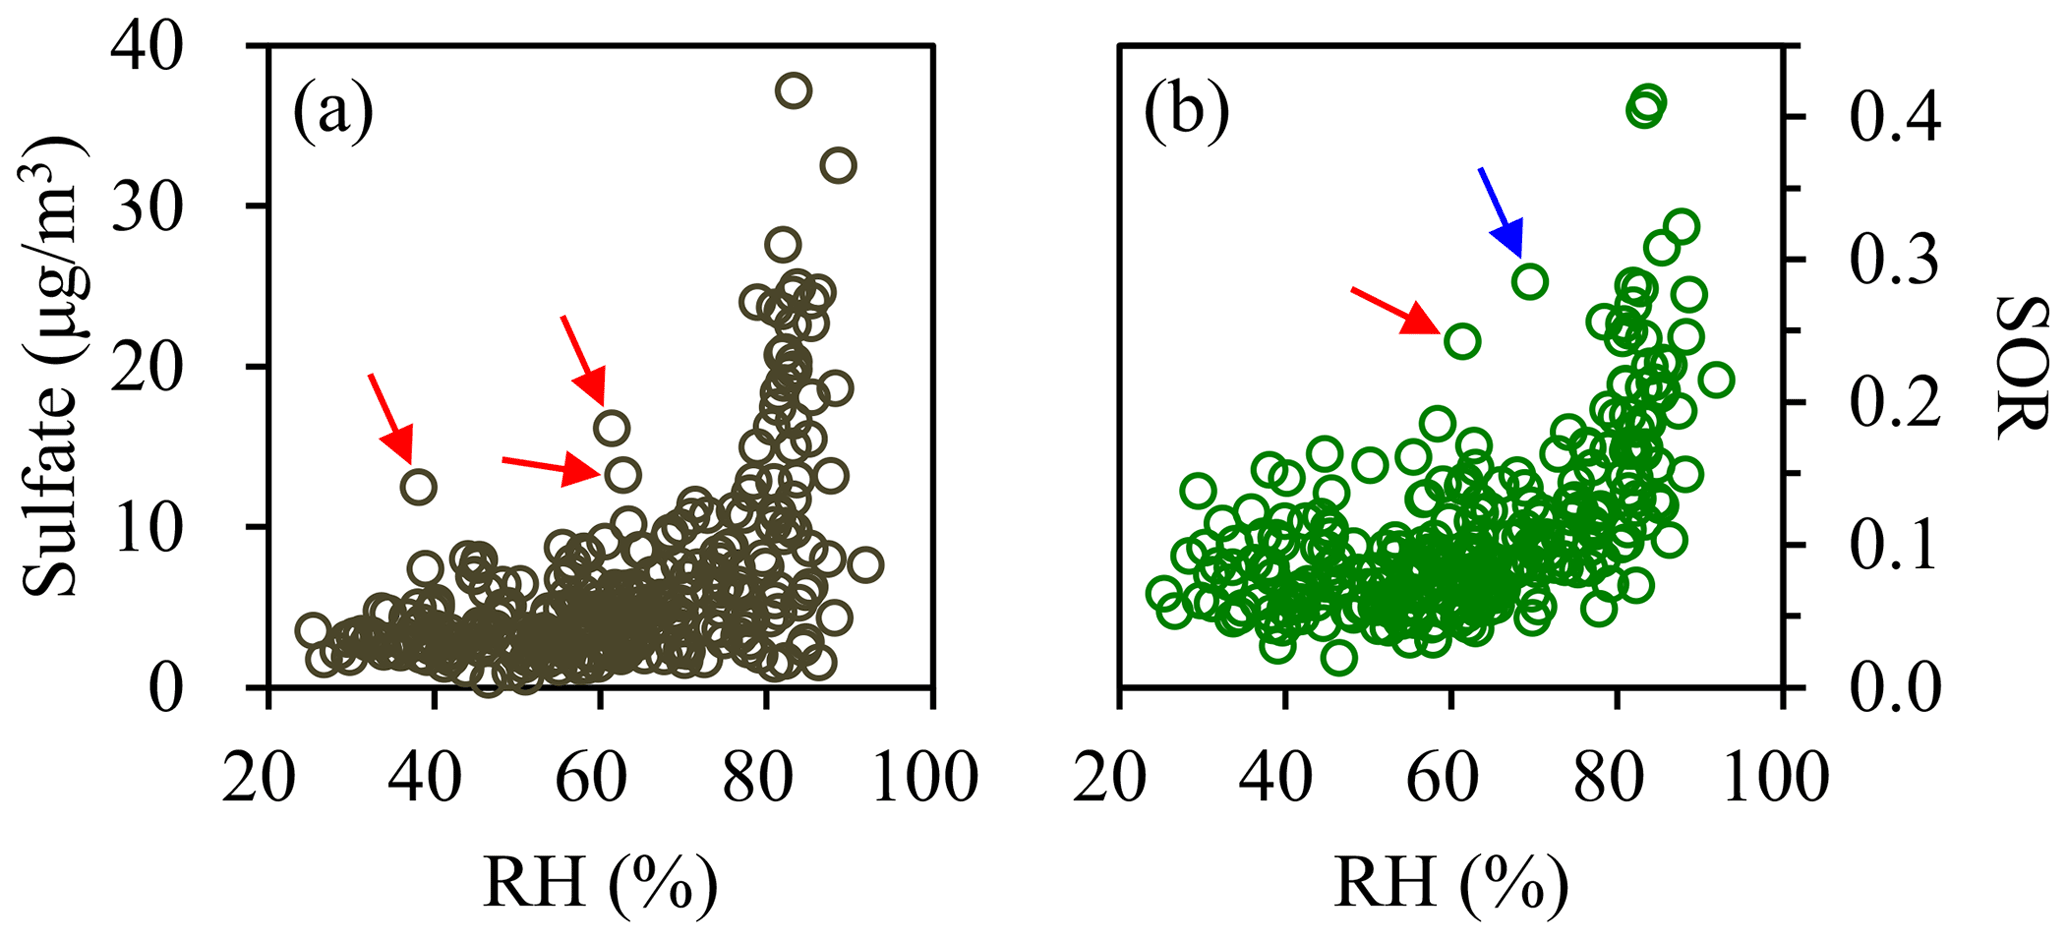
Figure 5Dependences of (a) sulfate and (b) SOR on RH. Results from the 2018–2019 and 2019–2020 campaigns are combined. Relatively high sulfate values are typically observed for the conditions with RH above 80 %, which is also the case for SOR. There appear to be several outliers showing considerably higher sulfate or SOR than other samples at similar RH. All the outliers occurred during the 2018–2019 measurement period, and most of them were accompanied with extremely high levoglucosan concentrations (above 5 µg/m3), as highlighted by the red arrows. The outlier highlighted by the blue arrow was observed at an ambient temperature of above 10 ∘C, which was uncommon for the heating season. The outliers indicate that factors other than RH were also at play in sulfate formation, but the influences were evident for only several samples.
The 2018–2019 and 2019–2020 campaigns exhibited comparable sulfate concentrations for the RH range of below 80 %, with median values of 3.72 and 3.39 µg/m3, respectively (Fig. S10). RH-dependent increase of sulfate was evident for both campaigns but was less significant for the former one, e.g., the median sulfate values were 5.32 and 15.84 µg/m3 for the high-RH conditions of 2018–2019 and 2019–2020, respectively. As mentioned earlier, only 10 out of the 180 samples from the 2018–2019 campaign fell into the high-RH conditions. Among these 10 samples, the RH-dependent increase of sulfate was observed for only 3 samples with NO2 concentrations of above 60 µg/m3 but was not evident for the remaining samples which had much lower NO2 (mostly below 30 µg/m3; Fig. 7). For the 2019–2020 campaign, however, the majority of the samples with RH above 80 % showed NO2 concentrations of above 60 µg/m3, accompanied with elevated sulfate. Therefore, the different NO2 levels under high-RH conditions between the two campaigns (with median concentrations of 21.27 and 72.41 µg/m3 during 2018–2019 and 2019–2020, respectively; Fig. S11) were a likely cause of the more significant RH-dependent increase of sulfate observed during the 2019–2020 campaign.
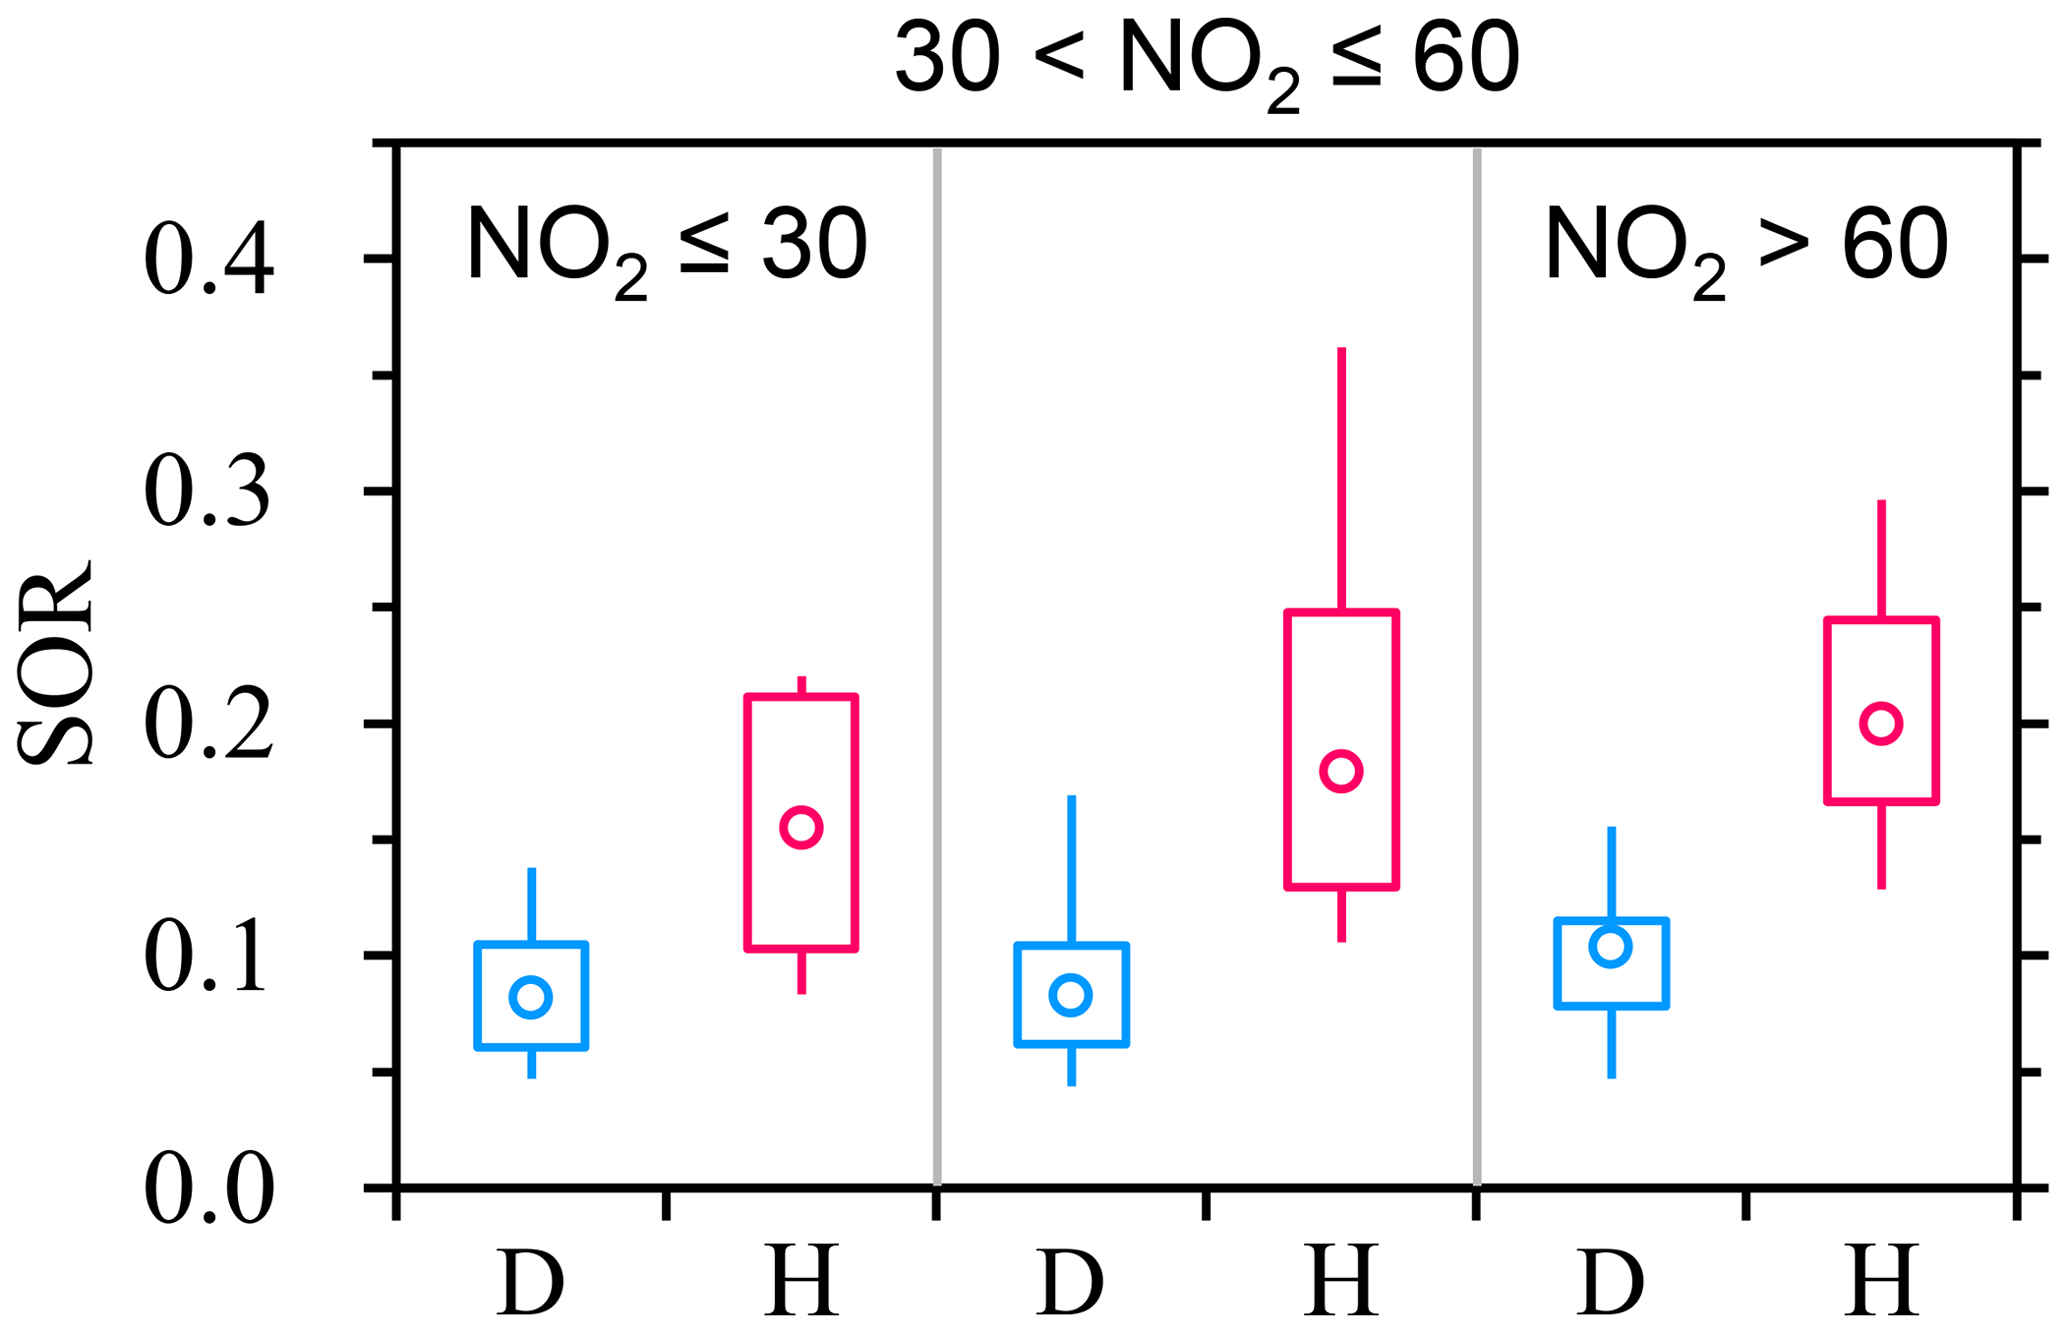
Figure 6Comparisons of SOR between different RH levels, with results from different NO2 ranges (below 30, 30–60 and above 60 µg/m3) shown separately. Results from both the 2018–2019 and 2019–2020 campaigns are included. The terms “D” and “H” indicate relatively dry (RH below 80 %) and more humid conditions (RH above 80 %), respectively.
The 2019–2020 campaign also exhibited more significant RH-dependent increase of nitrate, similar to sulfate (Fig. S12). In addition, an obvious difference between the two campaigns was that the nitrate to sulfate ratios () tended to be higher during 2019–2020 (Fig. S13), with an average of 1.28 ± 0.51 (compared to 1.10 ± 0.66 for 2018–2019). This trend was somewhat surprising, as the 2019–2020 measurement period experienced substantially lower temperatures than 2018–2019 (Fig. S13) and consequently was expected to be impacted by stronger heating-induced coal combustion emissions, which were a large source of SO2. However, SO2 values were actually lower for the 2019–2020 campaign, presumably due to the implementation of clean air actions targeting pollutants from coal combustion. On the other hand, NO2 values were higher during 2019–2020. Factors responsible for this increase were unclear, while a possible explanation was that the meteorological conditions of 2019–2020 were generally less favorable for dispersion of air pollution, as indicated by the frequent occurrences of high RH. In this case, the decrease of SO2 emissions in 2019–2020 was inferred to be more significant after accounting for the unfavorable meteorological conditions. In general, the 2019–2020 campaign exhibited higher NO2 to SO2 ratios (Fig. S13), which were in line with the observed variation of nitrate to sulfate ratios.
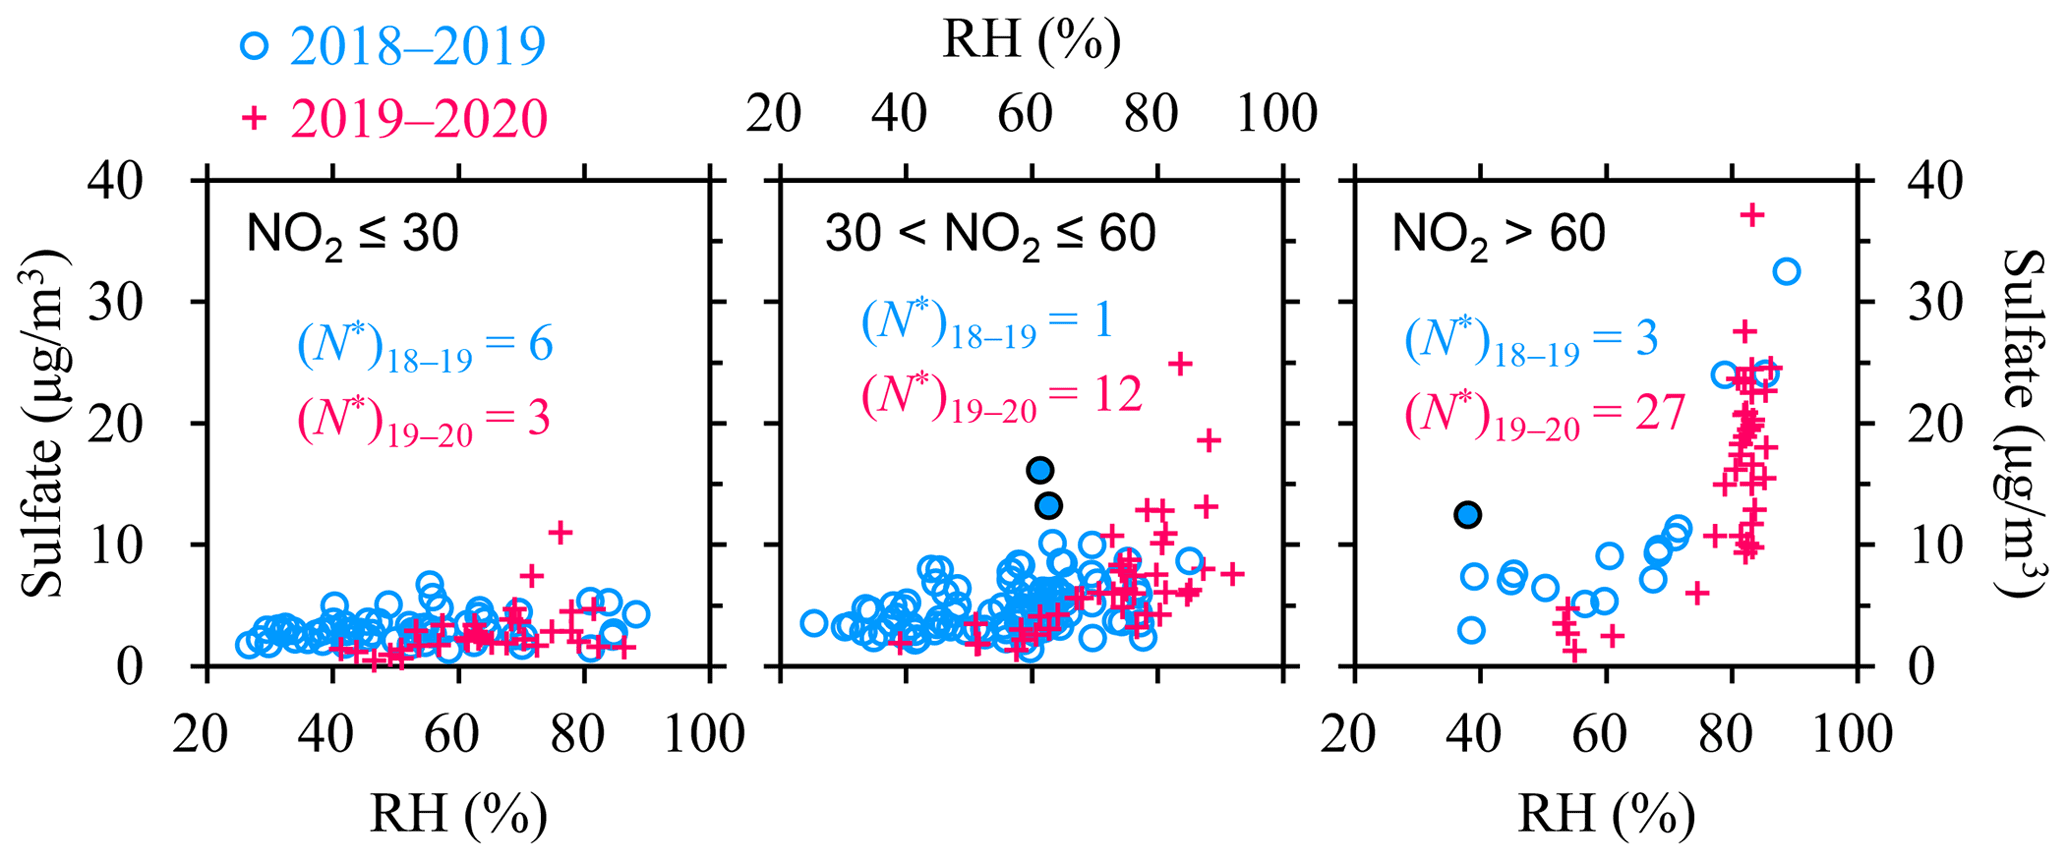
Figure 7Dependences of sulfate on RH in different NO2 ranges (below 30, 30–60 and above 60 µg/m3). Results from the 2018–2019 and 2019–2020 campaigns are shown using different markers. The outliers in Fig. 5a are highlighted by the solid circles. N∗ indicates the number of samples with RH above 80 %. High-RH conditions were typically accompanied with NO2 concentrations of below 30 µg/m3 during 2018–2019 and NO2 above 60 µg/m3 during 2019–2020, respectively.
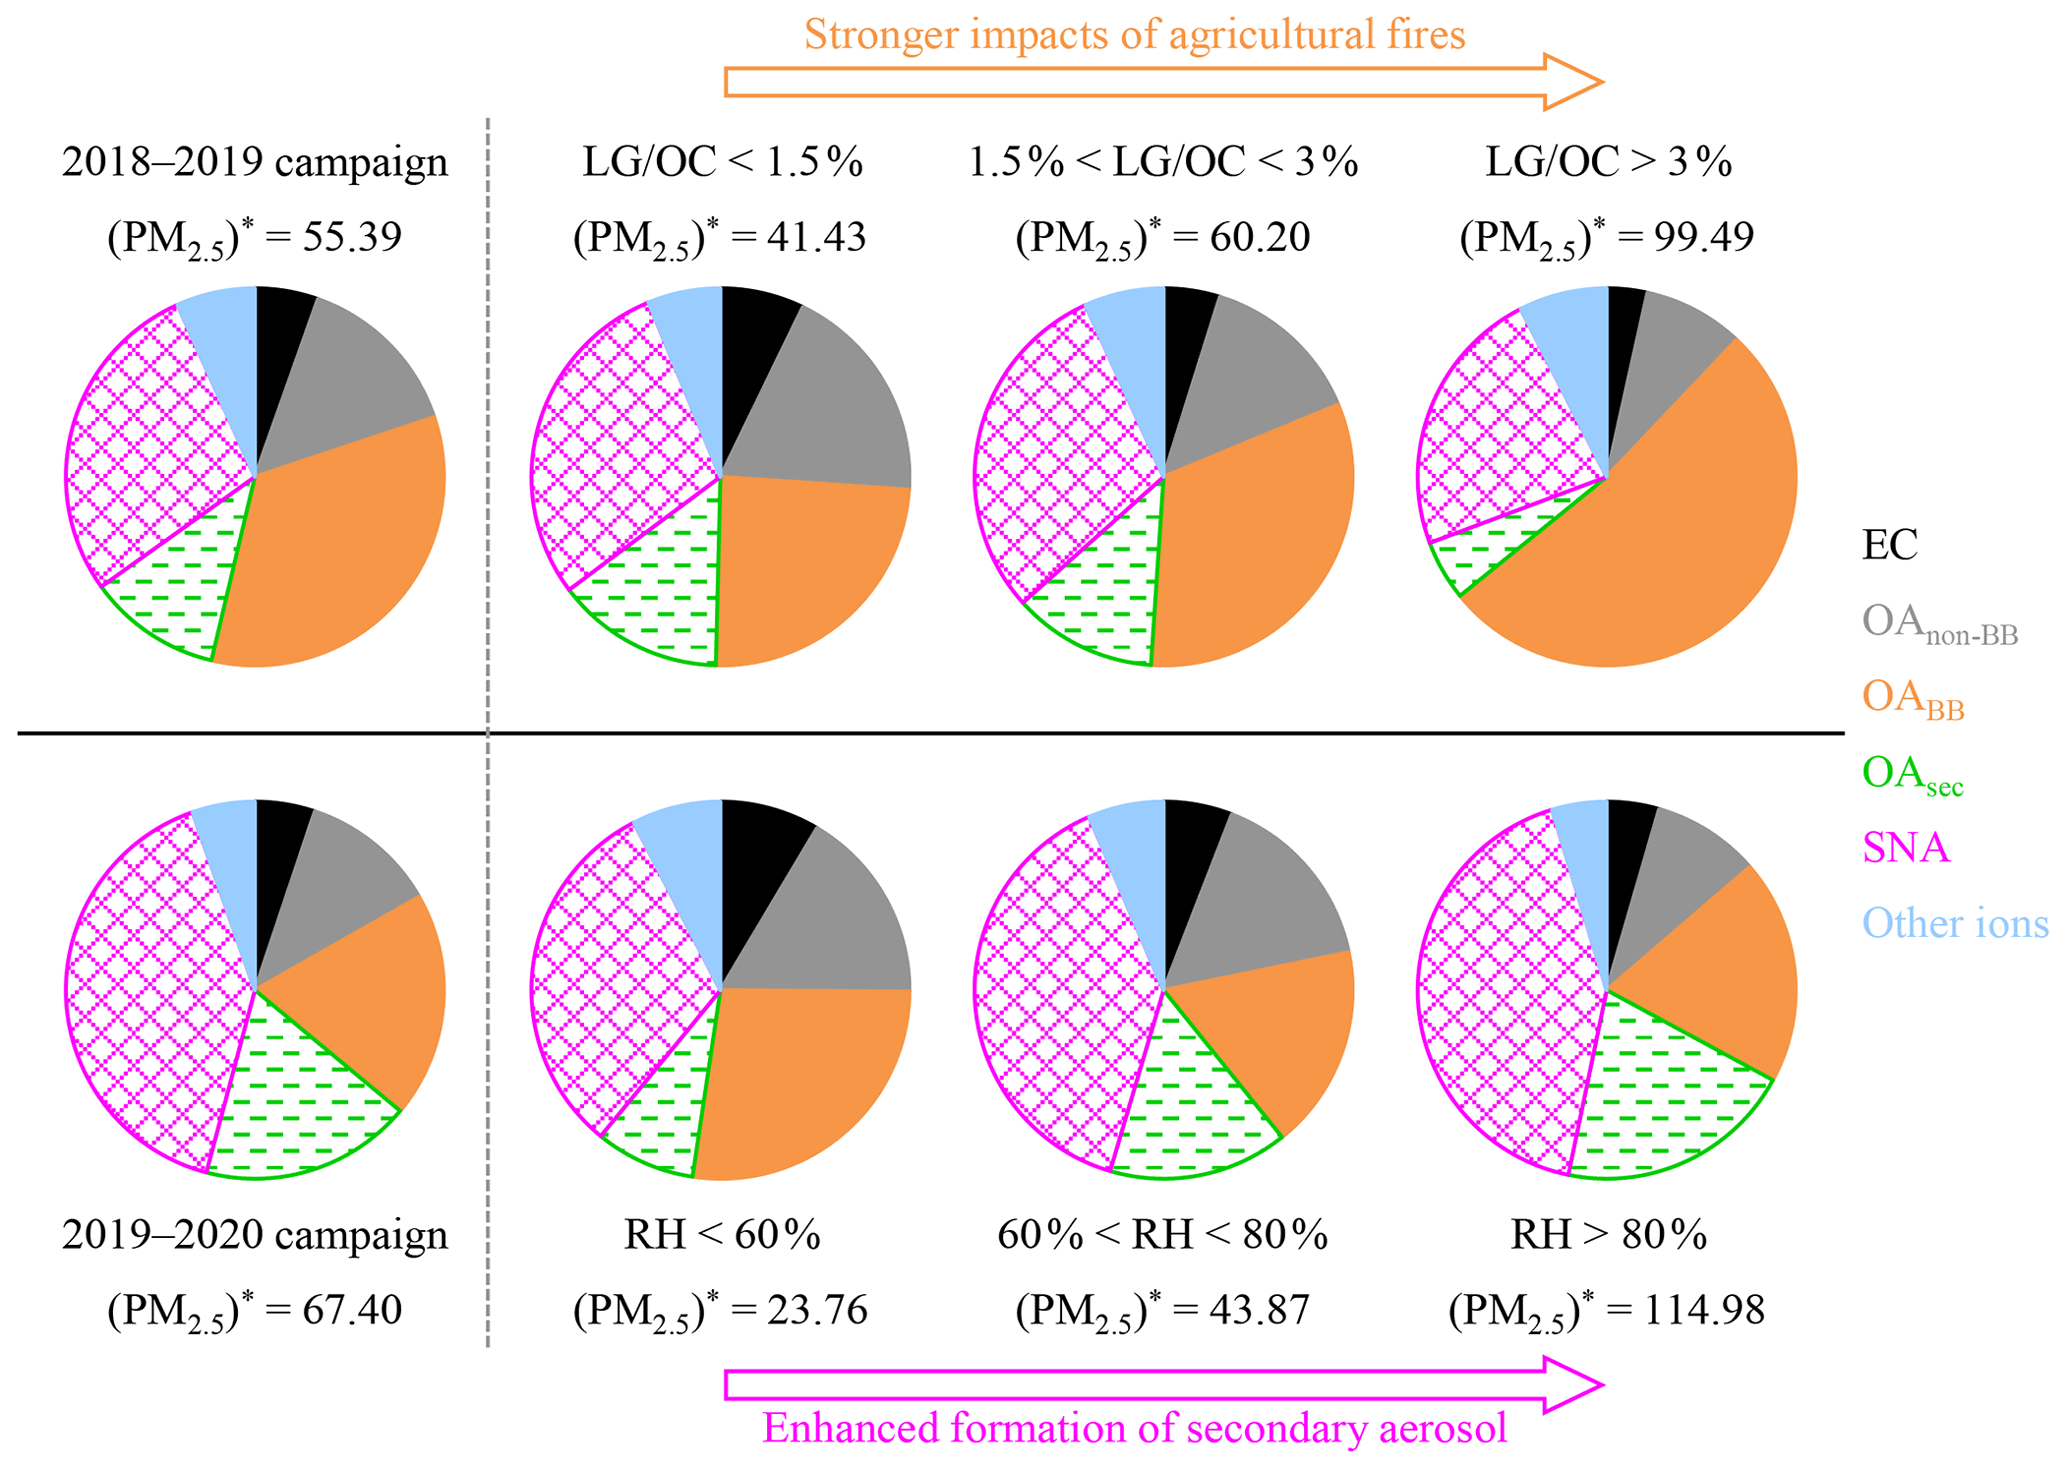
Figure 8Comparison of aerosol compositions measured for the 2018–2019 and 2019–2020 campaigns. The 2018–2019 measurement period experienced relatively dry meteorological conditions (with RH levels rarely exceeding 80 %) and was characterized by a wide window of ∼ 3 months for legitimate burning. Correspondingly, variations of (PM2.5)∗ concentration (in µg/m3) and aerosol composition observed during 2018–2019 were mainly driven by agricultural fires. However, the legitimate burning policy was terminated in 2019, and the 2019–2020 campaign did not show clear evidence for apparent influence of agricultural fires. On the other hand, high-RH conditions occurred much more frequently during the 2019–2020 measurement period compared to 2018–2019. Correspondingly, variations of (PM2.5)∗ concentration and aerosol composition observed during 2019–2020 were mainly driven by RH-dependent increase of secondary aerosols.
In addition to the relative abundances of NO2 and SO2, the influence of their gas-to-particle conversion ratios should also be considered when comparing across different conditions. The two campaigns differed with respect to humidity levels and biomass burning emissions, both of which could influence SNA (sulfate, nitrate and ammonium) formation. Although NOR and SOR were indeed influenced by RH, did not show clear dependence on RH (Fig. S14). In addition, there was observational evidence indicating that biomass burning emissions could enhance photochemical oxidation of NO2, whereas this effect was much weaker for SO2 (Akagi et al., 2012; Collier et al., 2016), i.e., stronger BB impacts favor the increase of . Therefore, the larger during the 2019–2020 campaign could not be explained by the reduced BB influences or the elevated RH levels, and instead they should be attributed primarily to the higher NO2 to SO2 ratios. The increasing trend of observed in this study was consistent with inventory results which typically indicated a more rapid decrease of SO2 emissions compared to NO2 during recent years in China (Zheng et al., 2018).
3.4 Variation of aerosol composition
The discussions above indicated significant differences between the two campaigns regarding the characteristics of both primary emissions and secondary aerosol formation. This in turn resulted in substantially different aerosol compositions between the two measurement periods, with the dominant drivers for the variation of aerosol composition being different as well (Fig. 8).

Figure 9Comparison of RH measured during January in Harbin across the past 20 years (from 2001 through 2020). Time resolution is 1 h for the RH data. No observational result is available for January of 2004.
For the 2018–2019 campaign, the contribution of organic aerosol (OA) to (PM2.5)∗ was much higher than that of SNA (60 vs. 28 %). The variation of (PM2.5)∗ composition was driven mainly by biomass burning emissions (especially those from agricultural fires), which tended to increase the OA contribution and correspondingly decrease the relative abundance of SNA. During the most intensive BB episodes (with above 3.0 %), the OA contribution reached 66 %, whereas the SNA contribution dropped to 23 %. For the 2019–2020 campaign, however, the contribution of SNA to (PM2.5)∗ was largely comparable with OA (41 vs. 49 %), and heterogeneous chemistry became the dominant driver for the variation of (PM2.5)∗ composition. The relative abundances of both SNA and SOA increased considerably from the low-RH through high-RH conditions, with their total contributions reaching 62 % for the RH range of above 80 %.
During the 2019–2020 measurement period, significantly higher levels of major secondary ions were observed than 2018–2019, i.e., the total concentrations of SNA averaged 27.30 and 15.53 µg/m3, respectively. This difference was largely explained by the RH-dependence. For the 2019–2020 campaign, the sampling events with RH above 80 % were mainly encountered in January of 2020 (N=20) as well as in December of 2019 (N=17), when the daily average temperatures were typically below −10∘C. The frequent occurrences of high RH were uncommon for Harbin's winter, as can be seen from the comparison of RH in January across the past 20 years (Fig. 9). Thus, the 2019–2020 campaign provided a unique opportunity to explore heterogeneous chemistry in Chinese cities located in the severe cold climate region, and this might be considered an upper limit regarding the RH-dependent enhancement of secondary aerosols. On the other hand, the effective increase of SNA and SOA under high-RH conditions implied the abundances of gaseous precursors, both organic and inorganic. To avoid the occurrence of extreme pollution events, a more fundamental solution would point to the effective control of gaseous pollutants.
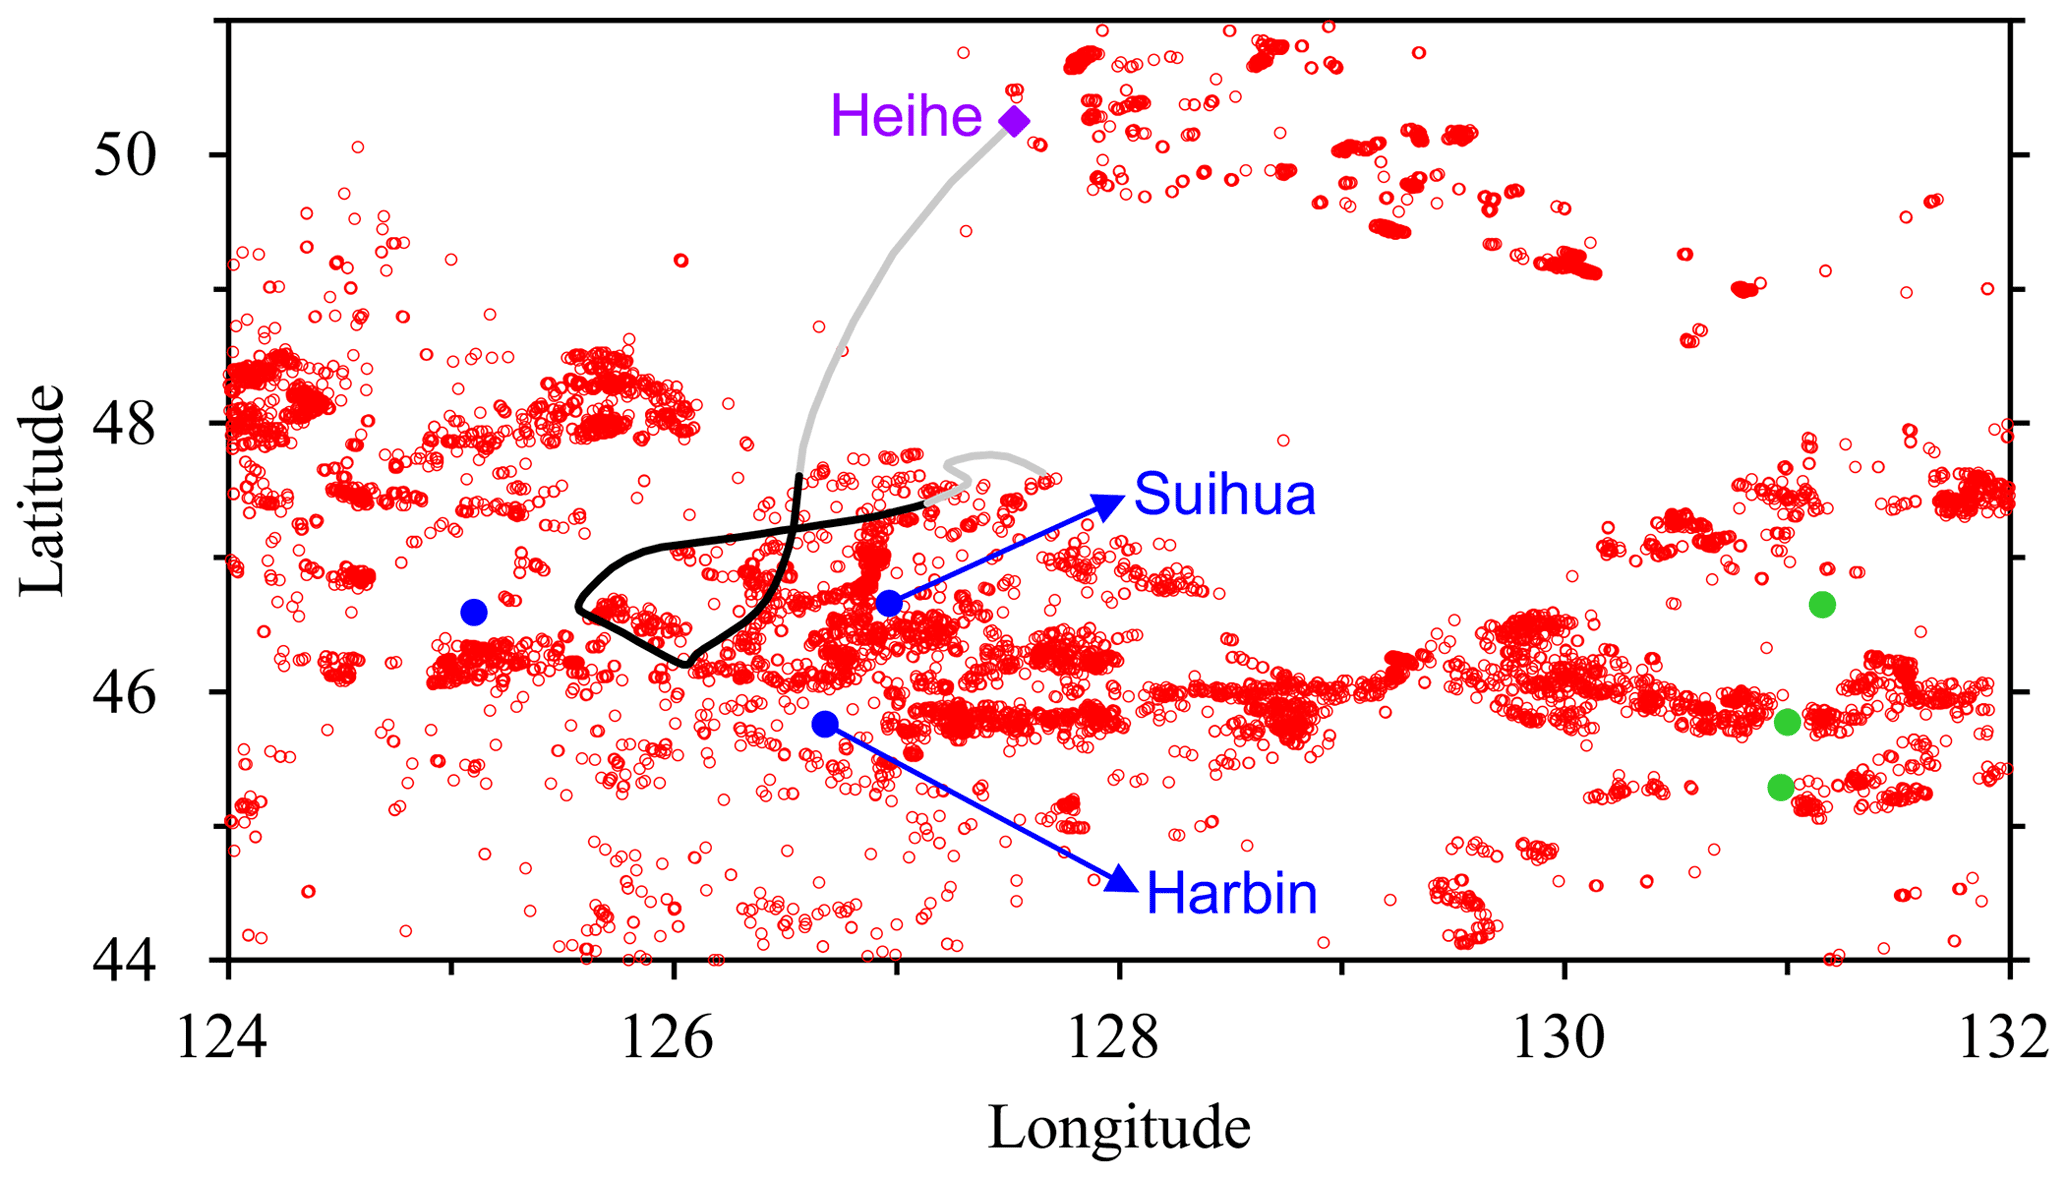
Figure 10Active fires (red circles) detected by the joint NASA/NOAA Suomi National Polar-orbiting Partnership (S-NPP) satellite for Heilongjiang Province during 17–18 April 2020. Three cities located in the Songnen Plain are shown using blue dots (the unlabeled city is Daqing), and three cities located in the Sanjiang Plain (i.e., Shuangyashan, Qitaihe and Jixi with decreasing latitudes) are shown using green dots. The two plains, separated by mountains, are the main agricultural regions in Heilongjiang. Intensive agricultural fires are evident for both plains during the 2 d episode, indicating the open burning activities are province-wide, although prohibited. The agricultural fires resulted in severe PM2.5 pollution for nearby cities, e.g., the 24 h concentrations peaked at ∼ 900 and 675 µg/m3 in Harbin and Jixi, respectively. A PM2.5 episode was observed even for Heihe (∼ 500 km away from Harbin) on 19 April 2020, which was attributed to the pollutants transported from the Harbin–Suihua region. The solid line indicates the 72 h back trajectory ending at 07:00 in Heihe, accompanied with the highest 1 h PM2.5 observed on 19 April 2020 (∼ 310 µg/m3). The trajectory indicates transport pathway of air masses impacting Heihe, with the segment in black showing locations of the air masses during 17–18 April 2020.
3.5 Agricultural fires missed by the 2019–2020 campaign
The 2019–2020 campaign was designed to cover the entire heating season but was interrupted by the outbreak of COVID-19. Although there was no observational result for aerosol composition after 5 February 2020, a severe PM2.5 episode caused by agricultural fires was identified during 17–18 April 2020, as indicated by the intensive fire counts recorded for Harbin and the surrounding areas (Fig. 10). According to the open-access air quality data, the 24 h PM2.5 in Harbin reached ∼ 500 and 900 µg/m3 on these two days, respectively, with the hourly concentrations peaking at ∼ 2350 µg/m3. During this period, similarly high PM2.5 levels were observed for a nearby city, Suihua, which is located in the same region (the Songnen Plain) as Harbin. Based on a synthesis of air quality data and air mass trajectory, we found that the massive amounts of air pollutants in the Harbin–Suihua region, which were emitted by the agricultural fires within a concentrated period of two days, could be transported ∼ 500 km northward to Heihe, a city located on the border between China and Russia. As shown in Figs. 10 and S15, PM2.5 in Heihe started to increase when the back trajectory suggested air masses were passing over the Harbin–Suihua region, resulting in an episode with a peak PM2.5 concentration of ∼ 310 µg/m3. The discussions above indicated that although agricultural fires were not evident during the 2019–2020 measurement period, they were postponed to late April of 2020. Thus, agricultural fires were not actually eliminated by the toughest-ever policy on open burning but broke out within a short period before the planting of crops in spring instead. It is noteworthy that the intensive open burning activities resulted in not only off-the-charts air pollution for the nearby cities but also heavily polluted episodes for downwind regions far away from the source areas. We suggest that transboundary transport of agricultural fire emissions from the Northeast China Plain, especially the two provinces of Heilongjiang and Jilin, deserves more attention.
Significant differences were observed between aerosol properties measured during two sequential heating seasons in the central city of the HC metropolitan area, i.e., Harbin. Briefly, the differences were caused by inter-campaign variations of both primary emissions and secondary aerosol formation. The 2018–2019 measurement period was characterized by (i) frequent occurrences of agricultural fires, which were boosted by the legitimate burning policy, and (ii) overall low RH levels which were unfavorable for heterogeneous formation of secondary aerosols. Correspondingly, the observed (PM2.5)∗ was dominated by organic aerosol, with a substantially higher contribution than SNA (60 % vs. 28 %). Biomass burning emissions were the largest OC source for this measurement period. The BB to OC contribution (fBB) was 46 % before the onset of legitimate burning primarily due to household burning of crop residues and increased to 59 % after the onset of legitimate burning with the major contribution from agricultural fire emissions. In addition to OC, the temporal variations of (PM2.5)∗ mass concentration and chemical composition were mainly driven by biomass burning as well, especially by agricultural fires. The average (PM2.5)∗ reached ∼ 100 µg/m3 for the most intensive BB episodes, with an enhanced OA contribution of 66 % and a reduced SNA contribution of 23 %.
Compared to 2018–2019, the 2019–2020 campaign was influenced by (i) a transition of open burning policy, i.e., agricultural fires were strictly prohibited, and (ii) frequent occurrences of high-RH conditions. In this case, no evidence was observed to indicate apparent influence of agricultural fires; correspondingly, the fBB (39 %) was dominated by household burning of crop residues. In addition, both SNA and secondary OC (OCsec) exhibited significant RH-dependent increases. For the RH range of above 80 %, SOR and the OCsec to OC contribution reached 0.2 % and 42 %, respectively, despite the low ambient temperatures encountered (averaging about −16∘C in terms of daily average). Unlike 2018–2019, organic aerosol and SNA showed comparable contributions to (PM2.5)∗ for the 2019–2020 campaign (49 % vs. 41 %), and the variations of (PM2.5)∗ during this measurement period were mainly driven by secondary components.
This study has crucial implications for further improving the air quality in HC region. First, fBB remained relatively high for the heating season of Harbin (e.g., compared to the wintertime results from Beijing), even without apparent influence of agricultural fires. This highlights the importance of reducing domestic use of crop residues, on top of previous clean air actions implemented for the residential sector primarily focusing on coal combustion. Second, driven by the transition of open burning policy, agricultural fires exhibited different patterns but were never eliminated. For example, although there was no legitimate burning period during 2019–2020 and agricultural fires did not occur as frequently as during 2018–2019, burning did break out in spring of 2020 before crop planting. Thus, neither the legitimate burning policy released in 2018 nor the toughest-ever strict prohibition policy released in 2019 could be considered successful for the effective control of agricultural fires. More studies are necessary to design a new roadmap towards sustainable use of crop residues in northeast China, which may contribute to the dual targets of air quality improvement and climate change mitigation. Third, it is noteworthy that (PM2.5)∗ averaged ∼ 115 µg/m3 for the high-RH conditions of 2019–2020, even higher than results from the most intensive BB episodes during 2018–2019. This reveals the need for effective control of gaseous precursors, both organic and inorganic, of secondary aerosols. Given the increasing trends of and observed between 2018 and 2020, control of the NO2-related sources should be strengthened.
It should be noted that the discussions on heterogeneous formation of SOA and SNA did not necessarily exclude the reactions in fog/cloud water. Actually, based on the observational results available, we could not robustly distinguish the relative importance of various aqueous-phases pathways for secondary aerosol formation. To address this problem, air quality modeling with a focus on HC should be conducted in future studies, which could also quantitatively evaluate the contributions of various factors (e.g., meteorology, emissions and regional transport) to long-term trends of PM2.5 concentration and chemical composition. An essential precondition is that the model could properly reproduce the observational results, which appears to be a substantial challenge for Harbin as indicated by the limited inter-comparison studies, especially for the periods with intensive agricultural fires or high RH levels (Cheng et al., 2021b).
Data are available from the corresponding author upon request (jiumengliu@hit.edu.cn).
The supplement related to this article is available online at: https://doi.org/10.5194/acp-21-15199-2021-supplement.
YC and JL designed the study and prepared the paper with inputs from all the coauthors. QY, XC, YZ, ZD and LL carried out the experiments. GG provided the air quality data. WM and HQ participated in the field campaign and data analysis. QZ and KB supervised the study.
Author Qiang Zhang is a member of the editorial board of the journal.
Publisher’s note: Copernicus Publications remains neutral with regard to jurisdictional claims in published maps and institutional affiliations.
The authors thank Shu-ping Dong at the National Research Center for Environmental Analysis and Measurement for his help in sample analysis.
This research has been supported by the National Natural Science Foundation of China (grant no. 41805097), the Natural Science Foundation of Heilongjiang Province (grant no. YQ2019D004), the State Key Laboratory of Urban Water Resource and Environment (grant no. 2020DX14) and Heilongjiang Touyan Team.
This paper was edited by Hailong Wang and reviewed by two anonymous referees.
Akagi, S. K., Craven, J. S., Taylor, J. W., McMeeking, G. R., Yokelson, R. J., Burling, I. R., Urbanski, S. P., Wold, C. E., Seinfeld, J. H., Coe, H., Alvarado, M. J., and Weise, D. R.: Evolution of trace gases and particles emitted by a chaparral fire in California, Atmos. Chem. Phys., 12, 1397–1421, https://doi.org/10.5194/acp-12-1397-2012, 2012.
Cao, F., Zhang, S. C., Kawamura, K., and Zhang, Y. L.: Inorganic markers, carbonaceous components and stable carbon isotope from biomass burning aerosols in Northeast China, Sci. Total Environ., 572, 1244–1251, 2016.
Cheng, Y., Zheng, G. J., Wei, C., Mu, Q., Zheng, B., Wang, Z. B., Gao, M., Zhang, Q., He, K. B., Carmichael, G., Pöschl, U., and Su, H.: Reactive nitrogen chemistry in aerosol water as a source of sulfate during haze events in China, Sci. Adv., 2, e1601530, https://doi.org/10.1126/sciadv.1601530, 2016.
Cheng, Y., Yu, Q. Q., Liu, J. M., Du, Z. Y., Liang, L. L., Geng, G. N., Zheng, B., Ma, W. L., Qi, H., Zhang, Q., and He, K. B.: Strong biomass burning contribution to ambient aerosol during heating season in a megacity in Northeast China: effectiveness of agricultural fire bans?, Sci. Total Environ., 754, 142144, https://doi.org/10.1016/j.scitotenv.2020.142144, 2021a.
Cheng, Y., Yu, Q. Q., Liu, J. M., Zhu, S. Q., Zhang, M. Y., Zhang, H. L., Zheng, B., and He, K. B.: Model vs. observation discrepancy in aerosol characteristics during a half-year long campaign in Northeast China: the role of biomass burning, Environ. Pollut., 269, 116167, https://doi.org/10.1016/j.envpol.2020.116167, 2021b.
Collier, S., Zhou, S., Onasch, T. B., Jaffe, D. A., Kleinman, L., Sedlacek, A. J., Briggs, N. L., Hee, J., Fortner, E., Shilling, J. E., Worsnop, D., Yokelson, R. J., Parworth, C., Ge, X. L., Xu, J. Z., Butterfield, Z., Chand, D., Dubey, M. K., Pekour, M. S., Springston, S., and Zhang, Q.: Regional influence of aerosol emissions from wildfires driven by combustion efficiency: insights from the BBOP campaign, Environ. Sci. Technol., 50, 8613–8622, 2016.
Department of Ecology and Environment of Heilongjiang Province: Interim Provisions of Heilongjiang Province on Reward and Punishment for Straw Open Burning Management, available at: http://www.gov.cn/xinwen/2018-09/15/content_5322298.htm (last access: 9 October 2021), 2018.
Fountoukis, C. and Nenes, A.: ISORROPIA II: a computationally efficient thermodynamic equilibrium model for K+–Ca2+–Mg2+–NH–Na+–SO–NO–Cl−–H2O aerosols, Atmos. Chem. Phys., 7, 4639–4659, https://doi.org/10.5194/acp-7-4639-2007, 2007.
Guo, H. Y., Liu, J., Froyd, K. D., Roberts, J. M., Veres, P. R., Hayes, P. L., Jimenez, J. L., Nenes, A., and Weber, R. J.: Fine particle pH and gas–particle phase partitioning of inorganic species in Pasadena, California, during the 2010 CalNex campaign, Atmos. Chem. Phys., 17, 5703–5719, https://doi.org/10.5194/acp-17-5703-2017, 2017a.
Guo, H. Y., Weber, R. J., and Nenes, A.: High levels of ammonia do not raise fine particle pH sufficiently to yield nitrogen oxide-dominated sulfate production, Sci. Rep., 7, 12109, https://doi.org/10.1038/s41598-017-11704-0, 2017b.
Hu, W. W., Hu, M., Hu, W., Jimenez, J. L., Yuan, B., Chen, W. T., Wang, M., Wu, Y. S., Chen, C., Wang, Z. B., Peng, J. F., Zeng, L. M., and Shao, M.: Chemical composition, sources, and aging process of submicron aerosols in Beijing: contrast between summer and winter, J. Geophys. Res.-Atmos., 121, 1955–1977, 2016.
Huang, X., Ding, A. J., Gao, J., Zheng, B., Zhou, D. R., Qi, X. M., Tang, R., Wang, J. P., Ren, C. H., Nie, W., Chi, X. G., Xu, Z., Chen, L. D., Li, Y. Y., Che, F., Pang, N., Wang, H. K., Tong, D., Qin, W., Cheng, W., Liu, W. J., Fu, Q. Y., Liu, B. X., Chai, F. H., Davis, S. J., Zhang, Q., and He, K. B.: Enhanced secondary pollution offset reduction of primary emissions during COVID-19 lockdown in China, Nat. Sci. Rev., 8, nwaa137, https://doi.org/10.1093/nsr/nwaa137, 2021.
Kuang, Y., He, Y., Xu, W. Y., Yuan, B., Zhang, G., Ma, Z. Q., Wu, C. H., Wang, C. M., Wang, S. H., Zhang, S. Y., Tao, J. C., Ma, N., Su, H., Cheng, Y. F., Shao, M., and Sun, Y. L.: Photochemical aqueous-phase reactions induce rapid daytime formation of oxygenated organic aerosol on the North China Plain, Environ. Sci. Technol., 54, 3849–3860, 2020.
Le, T. H., Wang, Y., Liu, L., Yang, J. N., Yung, Y. L., Li, G. H., and Seinfeld, J. H.: Unexpected air pollution with marked emission reductions during the COVID-19 outbreak in China, Science, 369, 702–706, 2020.
Li, H., Cheng, J., Zhang, Q., Zheng, B., Zhang, Y., Zheng, G., and He, K.: Rapid transition in winter aerosol composition in Beijing from 2014 to 2017: response to clean air actions, Atmos. Chem. Phys., 19, 11485–11499, https://doi.org/10.5194/acp-19-11485-2019, 2019a.
Li, Y. C., Liu, J., Han, H., Zhao, T. L., Zhang, X., Zhuang, B. L., Wang, T. J., Chen, H. M., Wu, Y., and Li, M. M.: Collective impacts of biomass burning and synoptic weather on surface PM2.5 and CO in Northeast China, Atmos. Environ., 213, 64–80, 2019b.
Liu, J., Wang, P. F., Zhang, H. L., Du, Z. Y., Zheng, B., Yu, Q. Q., Zheng, G. J., Ma, Y. L., Zheng, M., Cheng, Y., Zhang, Q., and He, K. B.: Integration of field observation and air quality modeling to characterize Beijing aerosol in different seasons, Chemosphere, 242, 125195, https://doi.org/10.1016/j.chemosphere.2019.125195, 2020.
Liu, J., Alexander, L., Fast, J. D., Lindenmaier, R., and Shilling, J. E.: Aerosol characteristics at the Southern Great Plains site during the HI-SCALE campaign, Atmos. Chem. Phys., 21, 5101–5116, https://doi.org/10.5194/acp-21-5101-2021, 2021a.
Liu, P., Ye, C., Xue, C., Zhang, C., Mu, Y., and Sun, X.: Formation mechanisms of atmospheric nitrate and sulfate during the winter haze pollution periods in Beijing: gas-phase, heterogeneous and aqueous-phase chemistry, Atmos. Chem. Phys., 20, 4153–4165, https://doi.org/10.5194/acp-20-4153-2020, 2020.
Liu, T. Y., Chan, A. W. H., and Abbatt, J. P. D.: Multiphase oxidation of sulfur dioxide in aerosol particles: implications for sulfate formation in polluted environments, Environ. Sci. Technol., 8, 4227–4242, 2021b.
Lv, Z. F., Wang, X. T., Deng, F. Y., Ying, Q., Archibald, A. T., Jones, R. L., Ding, Y., Cheng, Y., Fu, M. L., Liu, Y., Man, H. Y., Xue, Z. G., He, K. B., Hao, J. M., and Liu, H.: Source-receptor relationship revealed by the halted traffic and aggravated haze in Beijing during the COVID-19 lockdown, Environ. Sci. Technol., 54, 15660–15670, 2020.
May, A. A., McMeeking, G. R., Lee, T., Taylor, J. W., Craven, J. S., Burling, I., Sullivan, A. P., Akagi, S., Collett, J. L., Flynn, M., Coe, H., Urbanski, S. P., Seinfeld, J. H., Yokelson, R. J., and Kreidenweis, S. M.: Aerosol emissions from prescribed fires in the United States: a synthesis of laboratory and aircraft measurements, J. Geophys. Res.-Atmos., 119, 11826–11849, 2014.
McClure, C. D., Lim, C. Y., Hagan, D. H., Kroll, J. H., and Cappa, C. D.: Biomass-burning-derived particles from a wide variety of fuels – Part 1: Properties of primary particles, Atmos. Chem. Phys., 20, 1531–1547, https://doi.org/10.5194/acp-20-1531-2020, 2020.
McMeeking, G. R., Kreidenweis, S. M., Baker, S., Carrico, C. M., Chow, J. C., Collett, J. L., Hao, W. M., Holden, A. S., Kirchstetter, T. W., Malm, W. C., Moosmüller, H., Sullivan, A. P., and Wold, C. E.: Emissions of trace gases and aerosols during the open combustion of biomass in the laboratory, J. Geophys. Res., 114, D19210, https://doi.org/10.1029/2009JD011836, 2009.
National Bureau of Statistics of China: China Statistical Yearbook 2020, available at: http://www.stats.gov.cn/tjsj/ndsj/2020/indexeh.htm (last access: 9 October 2021), 2020.
Pokhrel, R. P., Wagner, N. L., Langridge, J. M., Lack, D. A., Jayarathne, T., Stone, E. A., Stockwell, C. E., Yokelson, R. J., and Murphy, S. M.: Parameterization of single-scattering albedo (SSA) and absorption Ångström exponent (AAE) with for aerosol emissions from biomass burning, Atmos. Chem. Phys., 16, 9549–9561, https://doi.org/10.5194/acp-16-9549-2016, 2016.
Shi, Z., Vu, T., Kotthaus, S., Harrison, R. M., Grimmond, S., Yue, S., Zhu, T., Lee, J., Han, Y., Demuzere, M., Dunmore, R. E., Ren, L., Liu, D., Wang, Y., Wild, O., Allan, J., Acton, W. J., Barlow, J., Barratt, B., Beddows, D., Bloss, W. J., Calzolai, G., Carruthers, D., Carslaw, D. C., Chan, Q., Chatzidiakou, L., Chen, Y., Crilley, L., Coe, H., Dai, T., Doherty, R., Duan, F., Fu, P., Ge, B., Ge, M., Guan, D., Hamilton, J. F., He, K., Heal, M., Heard, D., Hewitt, C. N., Hollaway, M., Hu, M., Ji, D., Jiang, X., Jones, R., Kalberer, M., Kelly, F. J., Kramer, L., Langford, B., Lin, C., Lewis, A. C., Li, J., Li, W., Liu, H., Liu, J., Loh, M., Lu, K., Lucarelli, F., Mann, G., McFiggans, G., Miller, M. R., Mills, G., Monk, P., Nemitz, E., O'Connor, F., Ouyang, B., Palmer, P. I., Percival, C., Popoola, O., Reeves, C., Rickard, A. R., Shao, L., Shi, G., Spracklen, D., Stevenson, D., Sun, Y., Sun, Z., Tao, S., Tong, S., Wang, Q., Wang, W., Wang, X., Wang, X., Wang, Z., Wei, L., Whalley, L., Wu, X., Wu, Z., Xie, P., Yang, F., Zhang, Q., Zhang, Y., Zhang, Y., and Zheng, M.: Introduction to the special issue “In-depth study of air pollution sources and processes within Beijing and its surrounding region (APHH-Beijing)”, Atmos. Chem. Phys., 19, 7519–7546, https://doi.org/10.5194/acp-19-7519-2019, 2019.
Shrivastava, M., Cappa, C. D., Fan, J. W., Goldstein, A. H., Guenther, A. B., Jimenez, J. L., Kuang, C., Laskin, A., Martin, S. T., Ng, N. L., Petaja, T., Pierce, J. R., Rasch, P. J., Roldin, P., Seinfeld, J. H., Shilling, J., Smith, J. N., Thornton, J. A., Volkamer, R., Wang, J., Worsnop, D. R., Zaveri, R. A., Zelenyuk, A., and Zhang, Q.: Recent advances in understanding secondary organic aerosol: implications for global climate forcing, Rev. Geophys., 55, 509–559, 2017.
Song, S., Gao, M., Xu, W., Shao, J., Shi, G., Wang, S., Wang, Y., Sun, Y., and McElroy, M. B.: Fine-particle pH for Beijing winter haze as inferred from different thermodynamic equilibrium models, Atmos. Chem. Phys., 18, 7423–7438, https://doi.org/10.5194/acp-18-7423-2018, 2018.
Su, H., Cheng, Y. F., and Pöschl, U.: New multiphase chemical processes influencing atmospheric aerosols, air quality, and climate in the Anthropocene, Acc. Chem. Res., 53, 2034–2043, 2020.
Sun, Y. L., Jiang, Q., Wang, Z. F., Fu, P. Q., Li, J., Yang, T., and Yin, Y.: Investigation of the sources and evolution processes of severe haze pollution in Beijing in January 2013, J. Geophys. Res.-Atmos., 119, 4380–4398, 2014.
Sun, Y. L., Wang, Z. F., Fu, P. Q., Jiang, Q., Yang, T., Li, J., and Ge, X. L.: The impact of relative humidity on aerosol composition and evolution processes during wintertime in Beijing, China, Atmos. Environ., 77, 927–934, 2013.
Sun, Y. L., Xu, W., Zhang, Q., Jiang, Q., Canonaco, F., Prévôt, A. S. H., Fu, P., Li, J., Jayne, J., Worsnop, D. R., and Wang, Z.: Source apportionment of organic aerosol from 2-year highly time-resolved measurements by an aerosol chemical speciation monitor in Beijing, China, Atmos. Chem. Phys., 18, 8469–8489, https://doi.org/10.5194/acp-18-8469-2018, 2018.
Wang, G. H., Zhang, R. Y., Gomez, M. E., Yang, L. X., Zamora, M. L., Hu, M., Lin, Y., Peng, J. F., Guo, S., Meng, J. J., Li, J. J., Cheng, C. L., Hu, T. F., Ren, Y. Q., Wang, Y. S., Gao, J., Cao, J. J., An, Z. S., Zhou, W. J., Li, G. H., Wang, J. Y., Tian, P. F., Marrero-Ortiz, W., Secrest, J., Du, Z. F., Zheng, J., Shang, D. J., Zeng, L. M., Shao, M., Wang, W. G., Huang, Y., Wang, Y., Zhu, Y. J., Li, Y. X., Hu, J. X., Pan, B. W., Cai, L., Cheng, Y. T., Ji, Y. M., Zhang, F., Rosenfeld, D., Liss, P. S., Duce, R. A., Kolb, C. E., and Molina, M. J.: Persistent sulfate formation from London Fog to Chinese haze, P. Natl. Acad. Sci. USA, 113, 13630–13635, 2016.
Wang, J. F., Li, J. Y., Ye, J. H., Zhao, J., Wu, Y. Z., Hu, J. L., Liu, D. T., Nie, D. Y., Shen, F. Z., Huang, X. P., Huang, D. D., Ji, D. S., Sun, X., Xu, W. Q., Guo, J. P., Song, S. J., Qin, Y. M., Liu, P. F., Turner, J. R., Lee, H. C., Hwang, S., Liao, H., Martin, S. T., Zhang, Q., Chen, M. D., Sun, Y. L., Ge, X. L., and Jacob, D. J.: Fast sulfate formation from oxidation of SO2 by NO2 and HONO observed in Beijing haze, Nat. Commun., 11, 2844, https://doi.org/10.1038/s41467-020-16683-x, 2020a.
Wang, J. F., Ye, J. H., Zhang, Q., Zhao, J., Wu, Y. Z., Li, J. Y., Liu, D. T., Li, W. J., Zhang, Y. G., Wu, C., Xie, C. H., Qin, Y. M., Lei, Y. L., Huang, X. P., Guo, J. P., Liu, P. F., Fu, P. Q., Li, Y. J., Lee, H. C., Choi, H., Zhang, J., Liao, H., Chen, M. D., Sun, Y. L., Ge, X. L., Martin, S. T., and Jacob, D. J.: Aqueous production of secondary organic aerosol from fossil-fuel emissions in winter Beijing haze, P. Natl. Acad. Sci. USA, 118, e2022179118, https://doi.org/10.1073/pnas.2022179118, 2021a.
Wang, P. F., Chen, K. Y., Zhu, S. Q., Wang, P., and Zhang, H. L.: Severe air pollution events not avoided by reduced anthropogenic activities during COVID-19 outbreak, Resour. Conserv. Recy., 158, 104814, https://doi.org/10.1016/j.resconrec.2020.104814, 2020b.
Wang, W. G., Liu, M. Y., Wang, T. T., Song, Y., Zhou, L., Cao, J. J., Hu, J. N., Tang, G. G., Chen, Z., Li, Z. J., Xu, Z. Y., Peng, C., Lian, C. F., Chen, Y., Pan, Y. P., Zhang, Y. H., Sun, Y. L., Li, W. J., Zhu, T., Tian, H. Z., and Ge, M. F.: Sulfate formation is dominated by manganese-catalyzed oxidation of SO2 on aerosol surfaces during haze events, Nat. Commun., 12, 1993, https://doi.org/10.1038/s41467-021-22091-6, 2021b.
Wang, Y., Hu, M., Xu, N., Qin, Y., Wu, Z., Zeng, L., Huang, X., and He, L.: Chemical composition and light absorption of carbonaceous aerosols emitted from crop residue burning: influence of combustion efficiency, Atmos. Chem. Phys., 20, 13721–13734, https://doi.org/10.5194/acp-20-13721-2020, 2020c.
Wang, Y. X., Zhang, Q. Q., Jiang, J. K., Zhou, W., Wang, B. Y., He, K. B., Duan, F. K., Zhang, Q., Philip, S., and Xie, Y. Y.: Enhanced sulfate formation during China's severe winter haze episode in January 2013 missing from current models, J. Geophys. Res.-Atmos., 119, 10425–10440, 2014.
Xu, W. Q., Sun, Y. L., Wang, Q. Q., Zhao, J., Wang, J. F., Ge, X. L., Xie, C. H., Zhou, W., Du, W., Li, J., Fu, P. Q., Wang, Z. F., Worsnop, D. R., and Coe, H.: Changes in aerosol chemistry from 2014 to 2016 in winter in Beijing: insights from high-resolution aerosol mass spectrometry, J. Geophys. Res. Atmos., 124, 1132–1147, 2019.
Yang, T., Gbaguidi, A., Yan, P. Z., Zhang, W. D., Zhu, L. L., Yao, X. F., Wang, Z. F., and Chen, H.: Model elucidating the sources and formation mechanisms of severe haze pollution over Northeast mega-city cluster in China, Atmos. Environ., 230, 692–700, 2017.
Ye, C., Liu, P. F., Ma, Z. B., Xue, C. Y., Zhang, C. L., Zhang, Y. Y., Liu, J. F., Liu, C. T., Sun, X., and Mu, Y. J.: High H2O2 concentrations observed during haze periods during the winter in Beijing: importance of H2O2 oxidation in sulfate formation, Environ. Sci. Technol. Lett., 5, 757–763, 2018.
Zhang, J., Liu, L., Xu, L., Lin, Q., Zhao, H., Wang, Z., Guo, S., Hu, M., Liu, D., Shi, Z., Huang, D., and Li, W.: Exploring wintertime regional haze in northeast China: role of coal and biomass burning, Atmos. Chem. Phys., 20, 5355–5372, https://doi.org/10.5194/acp-20-5355-2020, 2020.
Zhang, Q., Zheng, Y. X., Tong, D., Shao, M., Wang, S. X., Zhang, Y. H., Xu, X. D., Wang, J. N., He, H., Liu, W. Q., Ding, Y. H., Lei, Y., Li, J. H., Wang, Z. F., Zhang, X. Y., Wang, Y. S., Cheng, J., Liu, Y., Shi, Q. R., Yan, L., Geng, G. N., Hong, C. P., Li, M., Liu, F., Zheng, B., Cao, J. J., Ding, A. J., Gao, J., Fu, Q. Y., Huo, J. T., Liu, B. X., Liu, Z. R., Yang, F. M., He, K. B., and Hao, J. M.: Drivers of improved PM2.5 air quality in China from 2013 to 2017, P. Natl. Acad. Sci. USA, 116, 24463–24469, 2019.
Zhang, R., Sun, X. S., Shi, A. J., Huang, Y. H., Yan, J., Nie, T., Yan, X., and Li, X.: Secondary inorganic aerosols formation during haze episodes at an urban site in Beijing, China, Atmos. Environ., 177, 275–282, 2018.
Zheng, B., Tong, D., Li, M., Liu, F., Hong, C., Geng, G., Li, H., Li, X., Peng, L., Qi, J., Yan, L., Zhang, Y., Zhao, H., Zheng, Y., He, K., and Zhang, Q.: Trends in China's anthropogenic emissions since 2010 as the consequence of clean air actions, Atmos. Chem. Phys., 18, 14095–14111, https://doi.org/10.5194/acp-18-14095-2018, 2018.
Zheng, B., Zhang, Q., Zhang, Y., He, K. B., Wang, K., Zheng, G. J., Duan, F. K., Ma, Y. L., and Kimoto, T.: Heterogeneous chemistry: a mechanism missing in current models to explain secondary inorganic aerosol formation during the January 2013 haze episode in North China, Atmos. Chem. Phys., 15, 2031–2049, https://doi.org/10.5194/acp-15-2031-2015, 2015.
Zheng, G. J., Duan, F. K., Su, H., Ma, Y. L., Cheng, Y., Zheng, B., Zhang, Q., Huang, T., Kimoto, T., Chang, D., Pöschl, U., Cheng, Y. F., and He, K. B.: Exploring the severe winter haze in Beijing: the impact of synoptic weather, regional transport and heterogeneous reactions, Atmos. Chem. Phys., 15, 2969–2983, https://doi.org/10.5194/acp-15-2969-2015, 2015.
Zheng, G. J., Su, H., Wang, S. W., Andreae, M. O., Pöschl, U., and Cheng, Y. F.: Multiphase buffer theory explains contrasts in atmospheric aerosol acidity, Science, 369, 1374–1377, 2020.