the Creative Commons Attribution 4.0 License.
the Creative Commons Attribution 4.0 License.
 | 13 Oct 2021
Comparison of the influence of two types of cold surge on haze dispersion in eastern China
Shiyue Zhang
Gang Zeng
Xiaoye Yang
Ruixi Wu
Zhicong Yin
Cold surge (CS) is considered a favorable weather process to improve air quality and is widely recognized. However, there is no detailed study on the differences in the dispersion ability of different types of CSs in relation to haze days in eastern China (HDEC). This paper uses the hierarchical clustering algorithm to classify the cool-season (November to February of the following year) CSs across eastern China into blocking CSs and wave-train CSs and compares their influences on the number of HDEC from 1980 to 2017. Results show that the wave-train CSs can significantly improve the visibility in eastern China and generally improve air quality for about 2 d longer than the blocking CSs, which indicates that the blocking CSs have a weaker ability to dissipate HDEC compared with the wave-train CSs. The CSs affect the HDEC by changing meteorological elements like thermal inversion potential, horizontal surface wind, sea level pressure (SLP), and surface air temperature (SAT). A period of 4 d after the outbreak of CSs, the variations of thermal inversion potential and horizontal surface wind of two types of CSs tend to be consistent. However, the negative SAT anomalies and the positive SLP anomalies caused by the blocking CSs lasted shorter than those caused by the wave-train CSs, forming favorable conditions for the rapid growth of HDEC. Furthermore, results show that in recent years, especially after the 1990s, the frequency of wave-train CSs has decreased significantly, while the frequency of blocking CSs has slightly increased, indicating that the overall ability of CSs to dissipate HDEC has weakened in general. This work may provide reference for the future formulation of haze control policies in East Asia.
- Article
(30558 KB) - Full-text XML
-
Supplement
(1294 KB) - BibTeX
- EndNote


Haze in eastern China is generally referred to as the polluted particulate aerosols suspended in the air (Yin et al., 2019) and can reduce visibility and affect traffic and ecological sustainability (Xu et al., 2013; Xie et al., 2014; Wang et al., 2016). Studies have shown that the haze in China is mainly concentrated in the eastern region of China (EC), and its peak is noticeable in winter and spring (Wang et al., 2015, 2016). During haze days, the concentration of aerosol particles increases and results in a wide range of visibility decline (Luo et al., 2001; Xu, 2001; Wu et al., 2012; Fu et al., 2013; Wu et al., 2014). For example, in the winter of 2015, severe haze in the Beijing–Tianjin–Hebei region caused heavy pollution in 37 cities (Chang et al., 2016; Zhang et al., 2016). After this event, researchers and policymakers paid more attention to the studies related to haze events. In addition, strict control measures of air pollution and energy emissions have also been put in place.
Many studies have indicated that the long-term trends of haze are closely related to fossil-fuel emissions (Shi et al., 2008; Wei et al., 2017). On the other hand, meteorological conditions also play an important role in determining regional air quality. In addition to the influence of human activities, the formation of haze is closely related to static and calm weather conditions, such as strong thermal inversion potential (TIP), a negative sea level pressure (SLP) anomaly, and weak wind speed (Niu et al., 2010; Cai et al., 2017). In recent years, due to decreased relative humidity, it is difficult for haze particles to transform into fog drops, making the number of haze days present a rising trend (Ding and Liu, 2014). In addition, the anomalies of atmospheric circulation caused by global warming may also enhance the stability of the lower atmosphere, which leads to more severe and frequent haze pollution (Cai et al., 2017). All these points emphasize that the threat of haze to human society could be more serious in the near future.
Global warming leads to the decrease of cold days and cold surges (CSs) by raising the surface air temperature (SAT), which also provides favorable conditions for the increase of haze days (Lin et al., 2009). CS is a typical extreme weather process in East Asia, which significantly impacts the atmospheric circulation in the improvement of the local air quality (Hu et al., 2000; Qu et al., 2015; Wang et al., 2016). With the outbreak of CSs, a series of abrupt variations of meteorological elements such as the positive SLP anomaly, the decrease of SAT, and the enhancement of north wind component will occur in the areas which the CSs pass (Compo et al., 1999). When a CS occurs, the arrival of fresh and dry cold air can dissipate and reduce local air pollutants (Lin et al., 2009). Wang et al. (2016) proposed that the “early in the north and late in the south” feature of air quality improvement in mainland China results from the cold air masses moving southward from high latitudes to low latitudes after the outbreak of CSs. Although some studies have shown that the weakening of the East Asian winter monsoon and global warming leads to the decrease of CSs (Qu et al., 2015; Wang and Ding, 2006), extreme low-temperature events are still frequent (Park et al., 2011a), which means the assessment of the haze dispersion capacity of cold air activities is still full of uncertainty.
Previous studies have shown that the outbreak of CSs has an obvious effect on haze dispersion (Lin et al., 2009; Hien et al., 2011; Ashfold et al., 2017). However, most of them analyzed the haze variation during the CSs based on case analyses or considering the interannual influence of CS frequency on haze. Furthermore, studies have shown that there are large differences between individual cases of CSs in terms of circulation anomalies, influence path, and range (Park et al., 2014; Cai et al., 2019). Therefore, it is necessary to consider the influence of classified CSs on haze. Based on this limitation, the following two questions are proposed in this paper: are there different effects of CSs' types on the haze days in EC (HDEC)? If so, what is the physical mechanism that makes the difference? The solution to these issues will help us understand the mechanism of CSs in dissipating the haze and improve its predictability in the future. The variation of HDEC and its relationship with different types of CSs are described in Sect. 3.1.
The rest of this paper is organized as follows: Sect. 2 introduces the data and methods, while Sect. 3 presents the study findings and discussion. The variation of HDEC and its relationship with two types of CSs are shown in Sect. 3.1. Section 3.2 explains the reason why different types of CSs have different abilities to dissipate HDEC. Finally, the main conclusions are presented in Sect. 4.
2.1 Data
The datasets employed in this study were (1) daily ERA-Interim atmospheric fields including SLP, air temperature at different levels, SAT, horizontal wind, and geopotential height (GPH) provided by the European Center for Medium-Range Weather Forecasts (ECMWF) (Dee et al., 2011). They have a horizontal resolution of 1.0∘ × 1.0∘. (2) Daily observational datasets for 756 meteorological stations from 1980 to 2017 collected by the National Meteorological Information Center of China Meteorological Administration, including relative humidity (RH), visibility, and weather phenomena (referring to the physical phenomena of precipitation, surface condensation, visual range obstacle, atmospheric optics, lightning, and wind in the atmosphere and near surface) were used. These datasets were observed four times per day (02:00, 08:00, 14:00, and 20:00 LT). Stations with more than 5 % missing data were eliminated, while sporadic missing data (less than 3 d) were filled by cubic spline interpolation. Successive (3 d and more) missing data were discarded.
In addition, we also used PM2.5 concentration data (acquired from the China National Environmental Monitoring Centre and widely used in the research of PM2.5 in China; refer to Yin et al., 2021 and Wang et al., 2021) together with NCEP/NCAR Reanalysis datasets (Kalnay et al., 1996) to verify the response of PM2.5 to the two types of CSs from 2014 to 2019. Such a scheme can effectively avoid the dependence of conclusions on datasets and ensure that our results are based on many CS samples.
2.2 Definition of HDEC
Visibility and RH are routinely used in meteorology to distinguish haze (Yin and Wang, 2017). After filtering the other weather parameters affecting visibility (i.e., dust, precipitation, sandstorm), we defined a haze day as a day with visibility lower than 10 km and the RH less than 90 % occurring at any of the four times (02:00, 08:00, 14:00, and 20:00 LT) (Yin et al., 2019) from 1980–2013. However, the visibility observation in China was switched from manual observation to high temporal resolution automated observation after 2013 (Yin et al., 2017). Therefore, because of systematic biases between manual and automated observation, the 7.5 km automated observed visibility (Zhang et al., 2021) and RH less than 90 % are suggested for the occurrence of haze. Figure S1 shows the climatology of haze days in China from 1980 to 2017. The haze days are mainly concentrated in the EC (22–37∘ N, 106–121∘ E), which is selected as the target area in the present study. The number of the monthly average of HDEC by regional average indicated that the HDEC mainly peaks (Fig. S1b) in the cool season (November to February of the following year, NDJF).
2.3 Definition of CS
The CS is a cooling process superimposed on a cold day (Park et al., 2011a). The outbreak of the CSs in East Asia is closely related to the Siberian high, known as the Siberian high surge (Compo et al., 1999). In this study, we first divided EC into 5∘ × 5∘ grid boxes as shown in Fig. 1 and then calculated the average SAT for each box to avoid the extreme SAT anomaly in a single grid. To explore the impact of CSs on HDEC, the selection of CS in this paper fulfills the following three criteria (Park et al., 2008, 2011b, 2015): (1) the maximum pressure center in the domain of the Siberian high (Fig. 1) should exceed 1035 hPa on the day of the CS outbreak. (2) The daily temperature drops (SATt − SATt−1) and the SAT anomalies should exceed −1.5 standard deviation (i.e., the standard deviation of the SAT from 1980 to 2017) at least one box (setting the threshold to 1.5 times the standard deviation can not only obtain the CS time with sufficient intensity relative to the local climate, but also ensure enough CS samples). (3) The haze day appeared in the box where the CS occurs from −2 to 0 d related to the CS that has occurred. A total of 187 CSs that might affect a haze day in EC were identified.
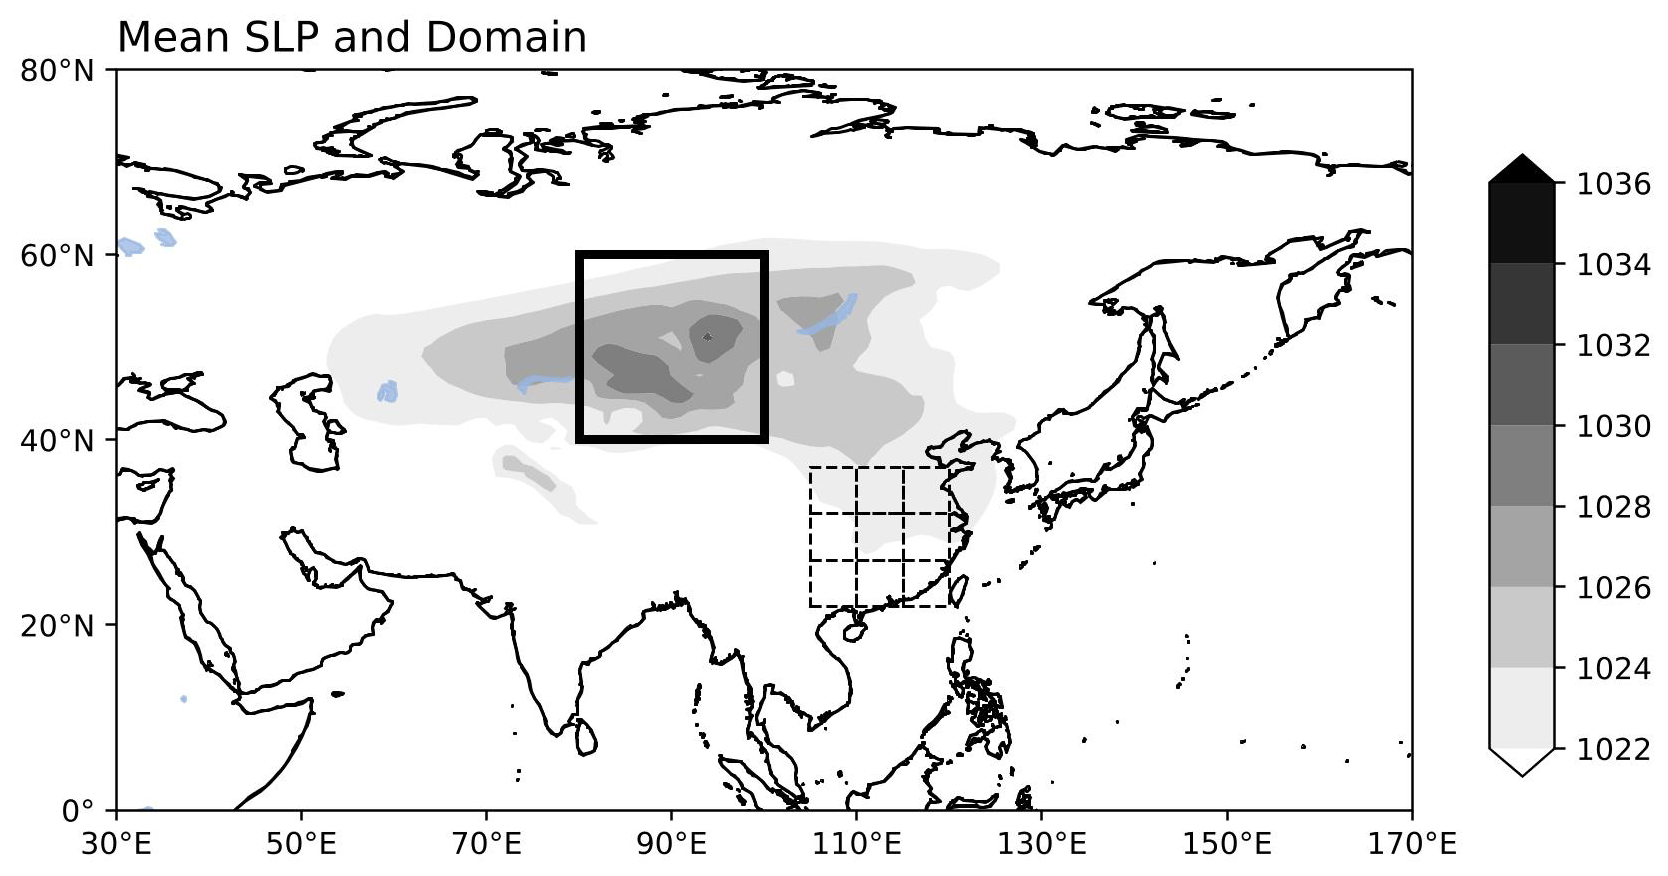
Figure 1The domain of the Siberian high (thick solid box; 40–60∘ N, 80–100∘ E) and EC (dotted box; 22–37∘ N, 106–121∘ E) divided into 5∘ × 5∘ grid boxes. Shading indicates the cool-season mean SLP.
2.4 Classification of CS
Referring to the research of Park et al. (2008) and Yang et al. (2020b), this paper uses the hierarchical clustering algorithm (HCA) to classify the CS types. The HCA (Rokach and Maimon, 2005) creates a hierarchical nested clustering tree by calculating the similarity between different categories of data samples. In the clustering tree, the original data samples of different types are at the lowest level of the tree, and the top level of the tree is the root point of a cluster. This paper uses Euclidean distance to calculate the distance (similarity) between different samples. Here, we introduce the silhouette coefficient to determine the best classification number (Rousseeuw, 1987). For any sample i, the silhouette coefficient s(i) is defined as
where a(i) is the average distance from sample i to all other samples in the cluster it belongs to, and b(i) is the lowest average distance from sample i to all samples in any other cluster. The silhouette coefficient of the clustering result is the average of the silhouette coefficients of all samples. The range of silhouette coefficient is −1 to 1. The closer to 1, the better the classification results. In this paper, the GPH anomalies in the region of 30–170∘ E, 0–80∘ N at 300 hPa on the outbreak day of the CS were used to perform HCA.
3.1 The influence of two types of CSs on HDEC
The circulation evolution with different types of CSs is quite different (Park et al., 2014) and leads to the different distribution of surface meteorological conditions and haze. Here we display the evolutions of two typical CS events (Fig. 2). These two events were selected because they belong to different types of CSs, referring to Park et al. (2008 and 2014), and have a large, different effect on HDEC. Figure 2a, e, i, and m show a CS that occurred on 31 December 2000, with positive and negative GPH anomalies over the subarctic and East Asian coast, respectively, which fits the definition of a blocking CS (Park et al., 2015). The blocking structure has a relatively stable life cycle, so the HDEC only has a certain dispersion on the day of the CS outbreak, and heavy HDEC begins to emerge 2 d after the CS outbreak (Fig. 2j and n). Figure 2c, g, k, and o indicate a CS that occurred on 7 January 1983, which meets the definition of the wave-train CS (Chai et al., 2002; Park et al., 2015). The CS is associated with the wave-train structure of “” at the upper troposphere. The cold air moves from west to east and invades EC along with this zonal wave train (Yang et al., 2020a). Therefore, the wave-train CS has a better ability to disperse HDEC, and no HDEC appears for about a week after the wave-train CS erupts (Fig. 2l and p).
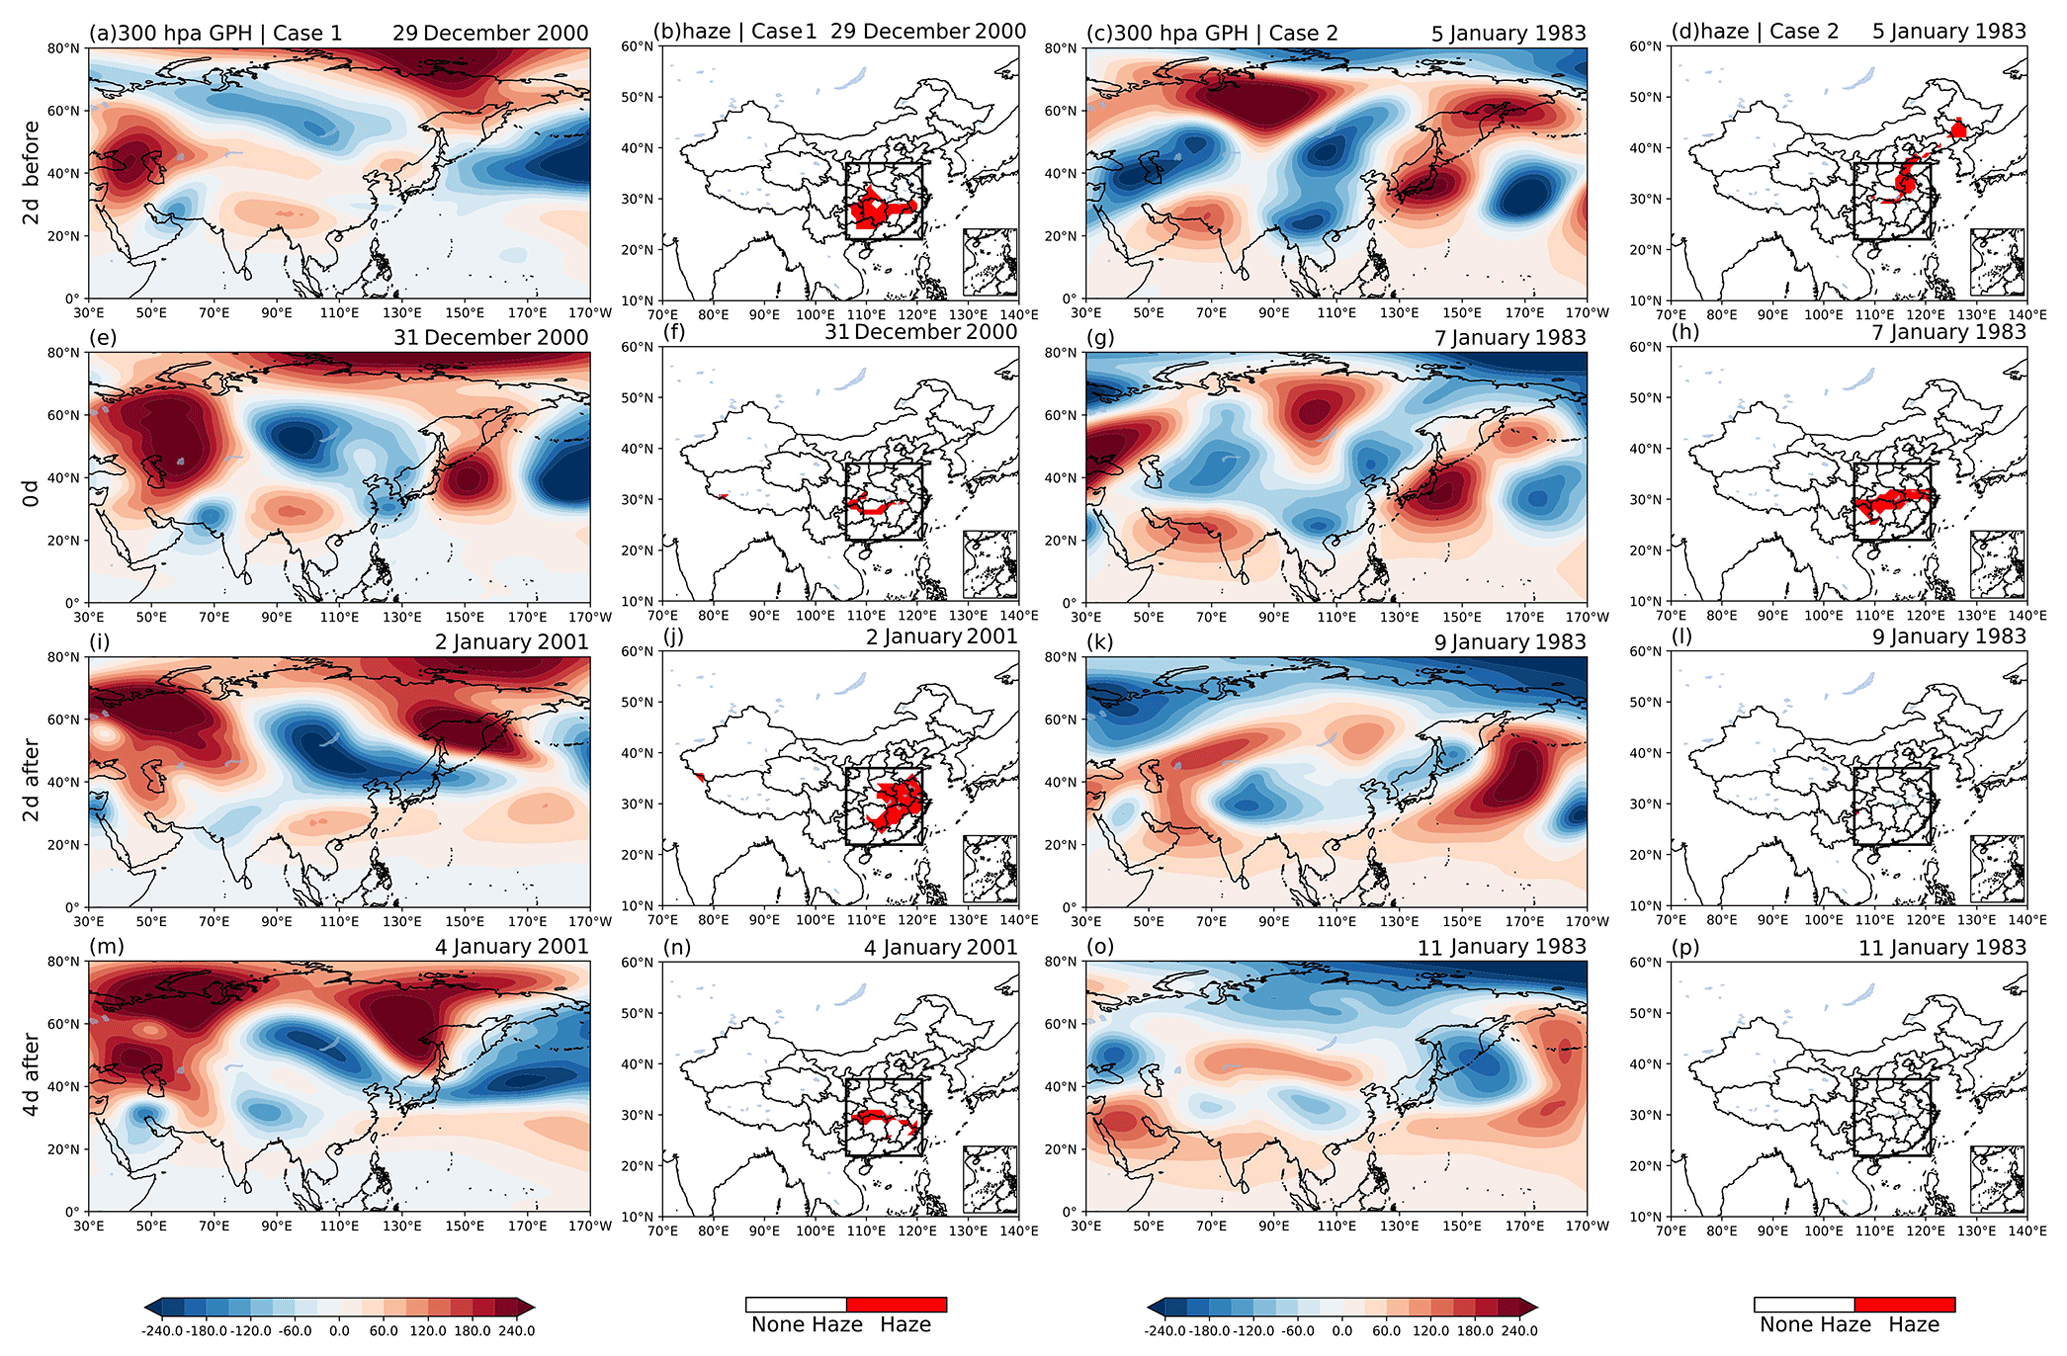
Figure 2Composite of GPH anomalies (shading; gpm) at 300 hPa from −2 to 4 d for the case 1 CS outbreak on 31 December 2000 (a, e, i, m) and the case 2 CS outbreak on 7 January 1983 (c, g, k, o) and the related spatial distribution of HDEC (shading) (b, f, j, n) and (d, h, l, p).
The case analysis results indicate that the ability of different types of CSs to disperse haze is different. According to the principle of maximum distance between clusters, the CSs from 1980–2017 can be classified into two categories (Fig. 3a). The silhouette coefficient of the clustering model shows that when all CSs are divided into two types, the difference between them is the largest. Figure 3c and d show the composite GPH anomalies at 300 hPa that depict the blocking CSs and wave-train CSs. Such classification results are consistent with previous studies (Park et al., 2014, 2015), which are mainly manifested in the location of the center of circulation anomalies. The cold air of the blocking CSs mainly moves in a north–south direction that invades EC from Siberia, and the cold air of the wave-train CSs originating from the Ural Mountains converged near Lake Baikal then invaded EC.
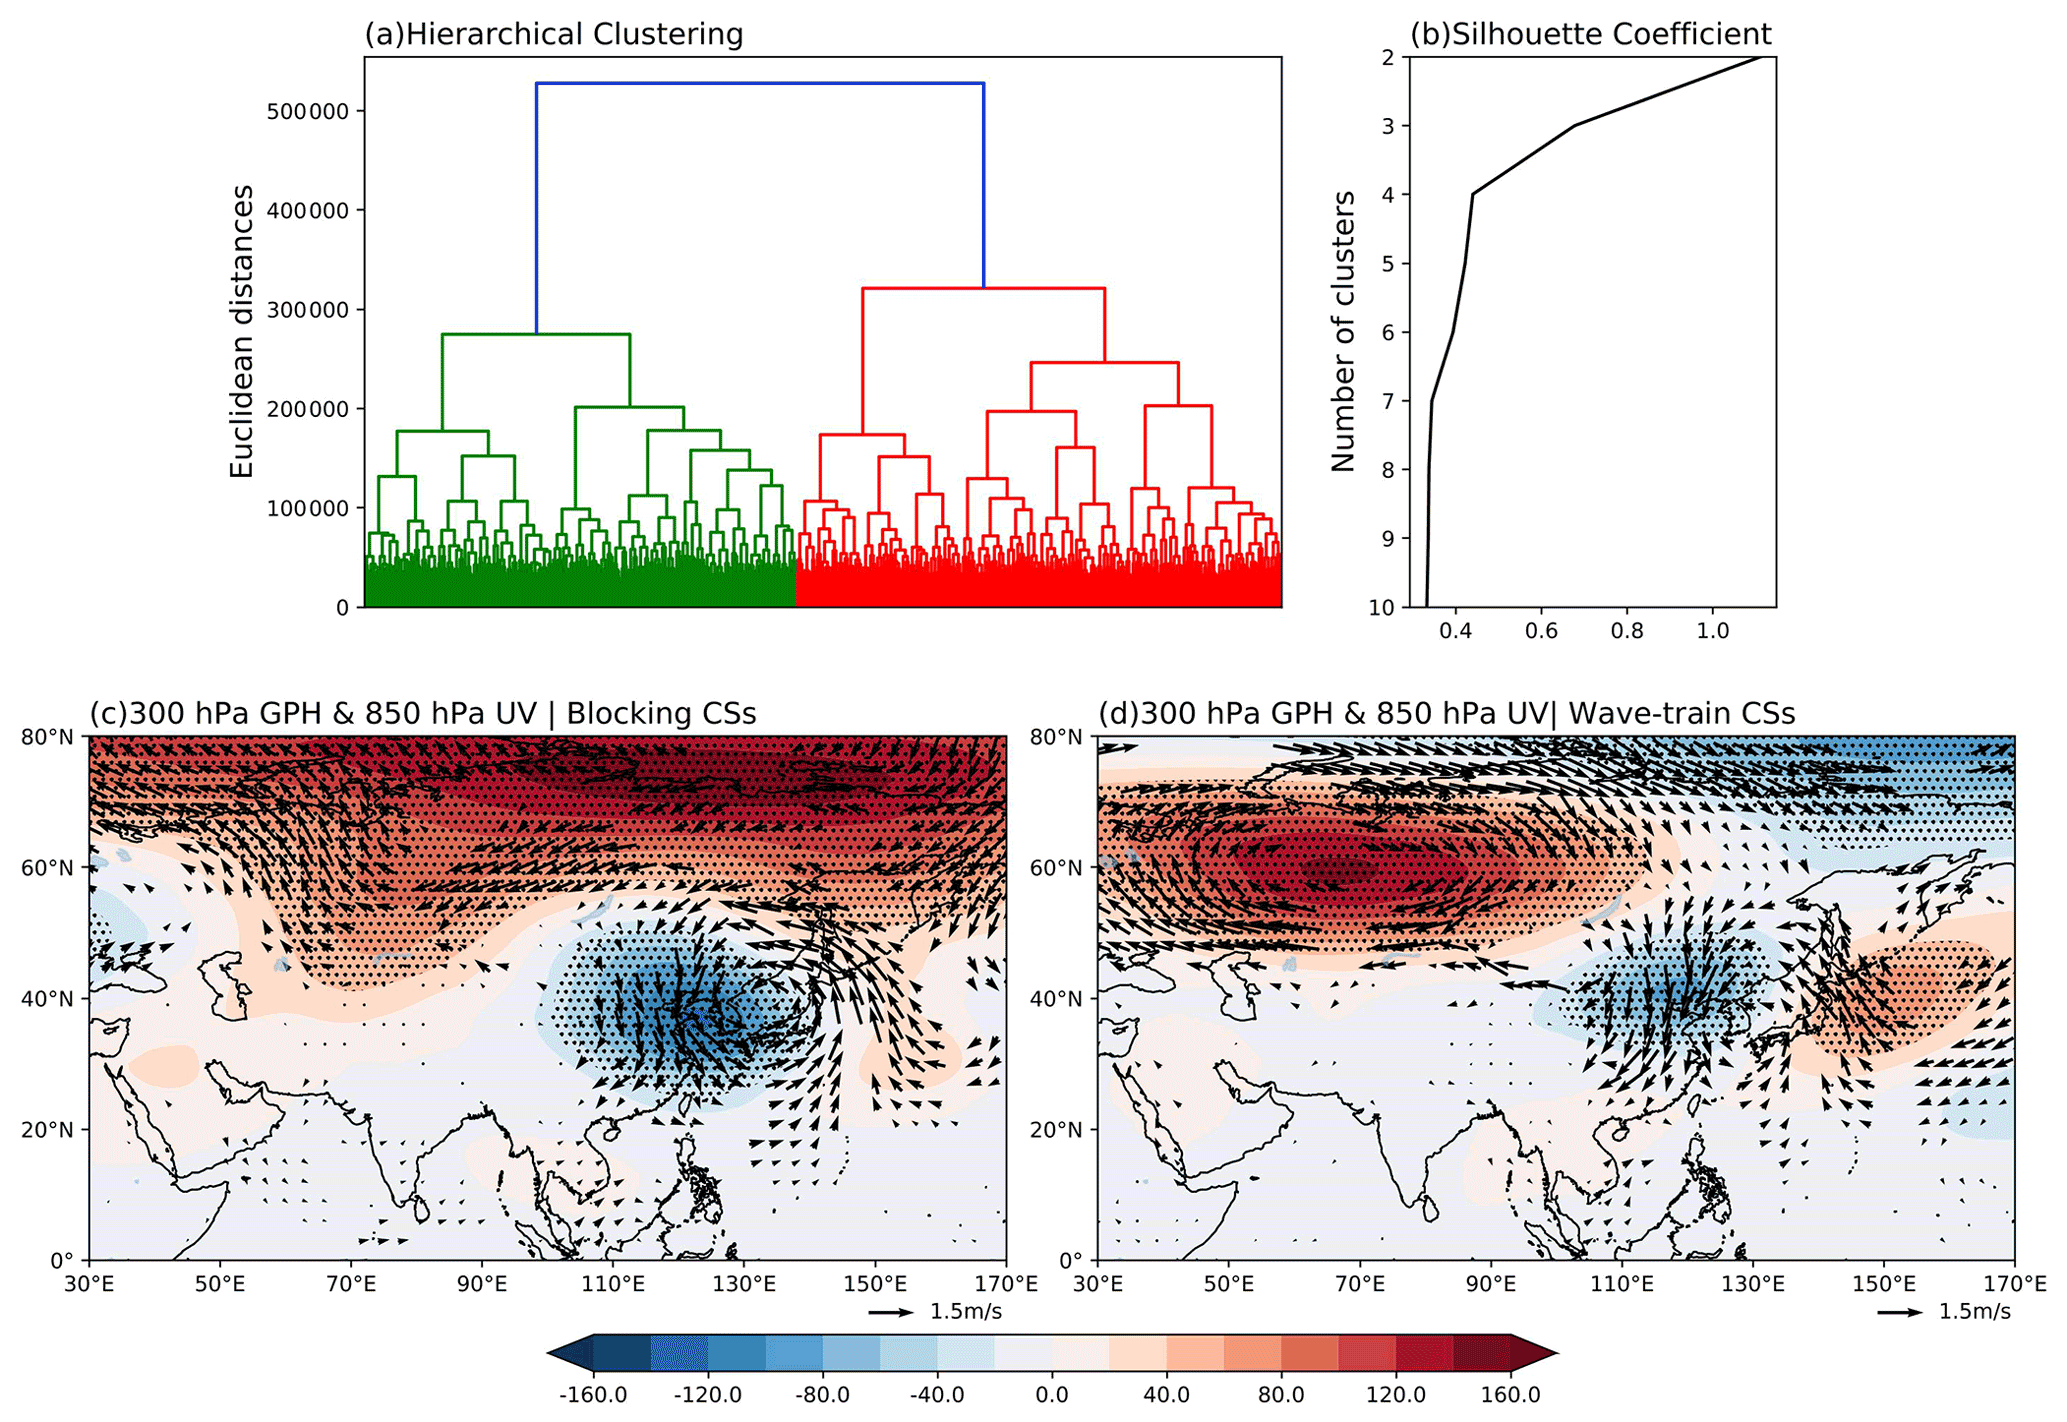
Figure 3Hierarchical clustering tree (a) and silhouette coefficient (b) of cool-season CSs in the EC. Composite of GPH anomalies at 300 hPa (shading; gpm; dotted areas are statistically significant at the 95 % confidence level) and horizontal wind anomalies at 850 hPa (vectors; m s−1; only the areas are shown which are statistically significant at the 95 % confidence level) relative to blocking CSs (c) and wave-train CSs (d).
Figure 4 presents the circulation anomalies from −2 to 6 d of the CS events in the two types and the related evolution of HDEC. For the blocking CSs, largely positive and negative GPH anomalies at 300 hPa are found over the Arctic and EC. The HDEC tends to dissipate first and then increase rapidly after the CSs erupt. By 6 d after the eruption of CSs, the haze reaches a relatively large value (Fig. 4i). For the wave-train CSs, a zonal wave-train structure of GPH anomalies can be seen in the midlatitude of the Eurasian landmass. From −2 to 6 d, the zonal wave train appears to move toward EC. With the movement of the wave train, the haze dissipates rapidly, and EC can maintain high air quality weather for a longer time. Sporadic HDEC does not appear until 6 d after, which is different from the existence of HDEC when the blocking CSs occur. It shows that blocking CSs have a weak ability to dissipate haze compared with wave-train CSs. This conclusion is also consistent with the individual cases mentioned above (Fig. 2). In addition, we verify the response of PM2.5 to the two types of CSs from 2014 to 2019, and similar results were obtained (Fig. S2). It shows that the selection of datasets does not affect the main conclusions of this paper.
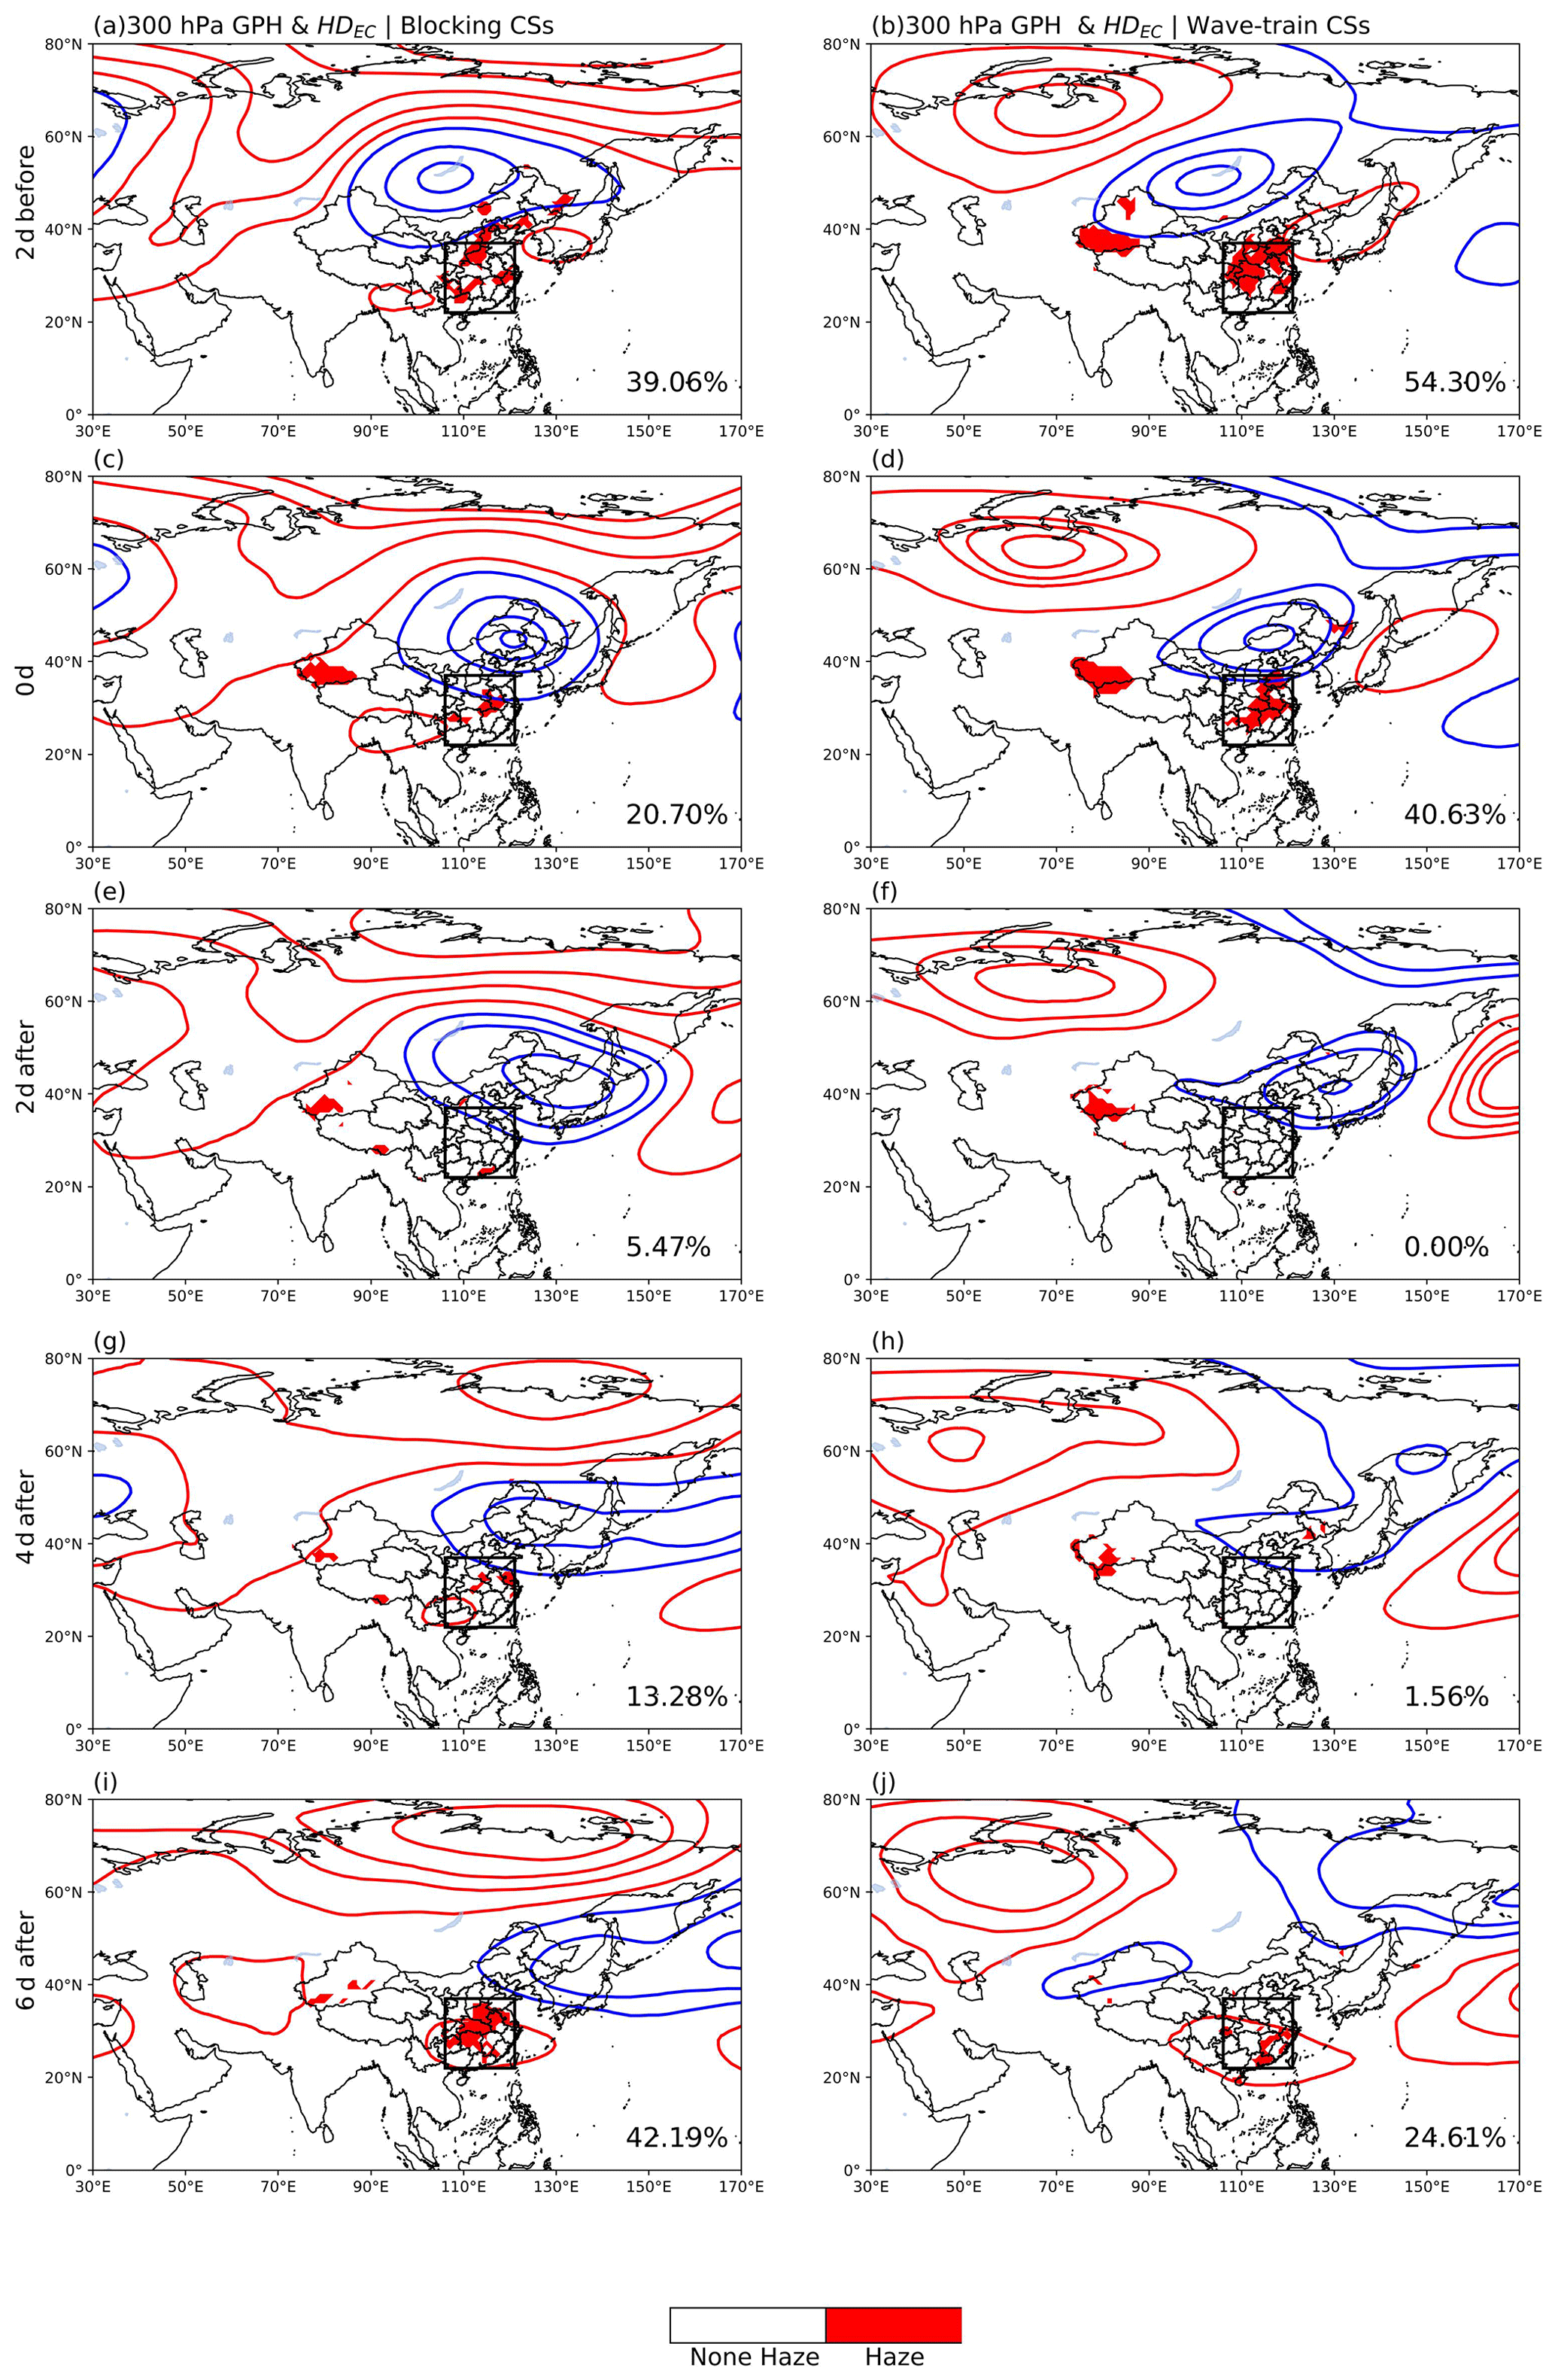
Figure 4Composite of GPH anomalies at 300 hPa (contour; in intervals of 20 gpm) from −2 to 6 d relative to the outbreak of CSs and the corresponding spatial distribution of HDEC (shading; only the areas are shown which are statistically significant at the 95 % confidence level by a t test) for blocking CSs (a, c, e, g, i) and wave-train CSs (b, d, f, h, j). The number in the lower right corner of each figure represents the ratio of the grid of HDEC to that of EC.
3.2 Why are two types of CSs different in dispersing HDEC?
According to the definition of HDEC, which combines visibility and RH in this study, we composite the daily visibility anomalies and RH anomalies for 9 d before and after the outbreak of the blocking CSs and wave-train CSs, respectively (Fig. 5). This helps to understand why the two types of CSs have different abilities to disperse HDEC. According to our definition, haze is determined by visibility and RH. Considering two types of CSs, it was found that there is no significant difference in RH between the two kinds of CSs, which was reflected in the trend and difference between the lower limit of blocking CS and the upper limit of wave-train CS after the outbreak of CS. However, the blocking CSs are generally less effective in improving visibility than the wave-train CSs. When there is an outbreak of blocking CSs, the visibility shows an increasing trend; however, it begins to deteriorate continuously 3 d later. Though the visibility in EC has a noticeable downward trend 5 d before the outbreak of the wave-train CSs, it improves significantly on the day of the outbreak of wave-train CSs and rapidly deteriorates again about 3 d after the wave-train CSs occur. To further understand the differences between the two types of CS, a closer investigation of additional meteorological parameters was performed.
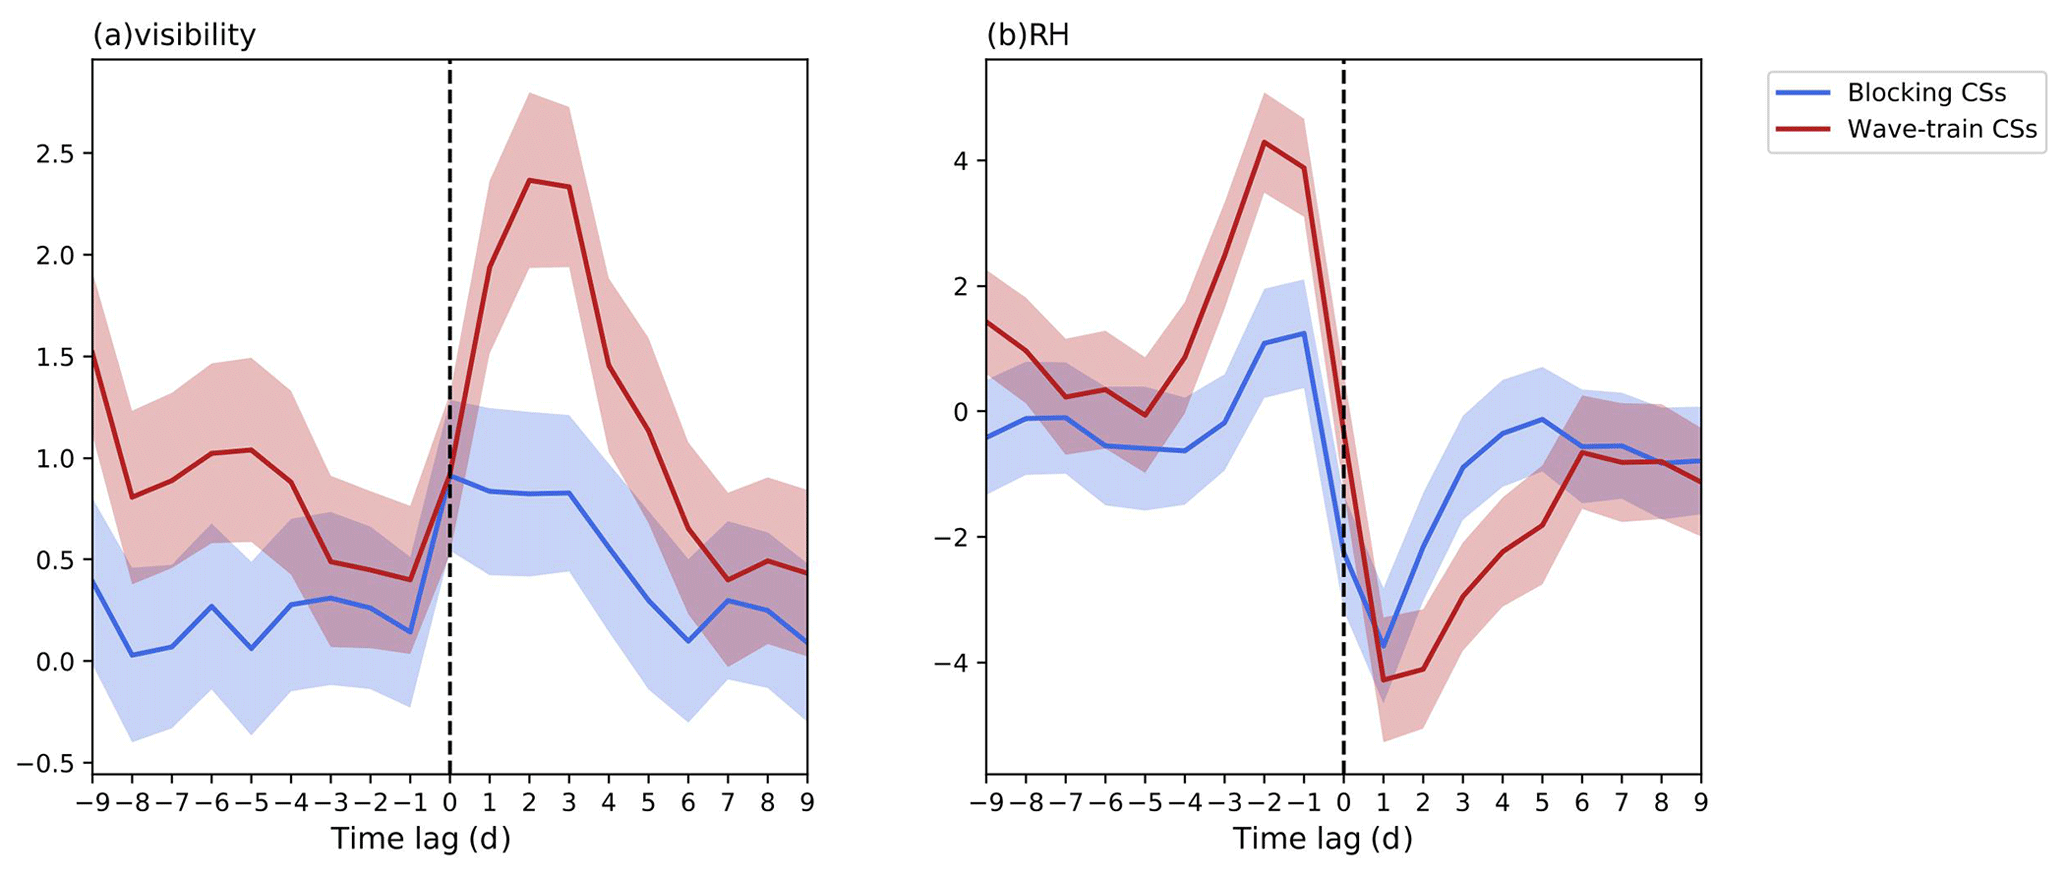
Figure 5Regional averaged (a) visibility anomalies (km) and (b) RH anomalies (%) over EC during 9 d before and after the outbreak of the blocking CSs (blue lines) and wave-train CSs (red lines), respectively. Shading represents ±1 standard deviation among the CSs.
Previous studies show that haze is influenced by surface meteorological conditions (Wang et al., 2015; Yin et al., 2019), which have significant variations after the outbreak of CSs (Park et al., 2014). Figure 6 reveals the thermal inversion potential anomalies (TIP, defined as the air temperature at 850 hPa minus SAT; refer to Yin and Wang, 2017), surface horizontal wind speed (UV_sfc) anomalies, SAT anomalies, and SLP anomalies for 4 d before and after the outbreak of the blocking CSs and wave-train CSs. The results show that the high variations of meteorological elements reached the strongest on the day of the outbreak of CSs, and their anomalies weakened in the next 4 d. The variation of meteorological elements during wave-train CSs is larger than during blocking CSs. A period of 4 d after the outbreak of the two types of CSs, the difference of TIP and UV_sfc between the two types of CSs tended to be the same. However, the negative SAT anomalies and the positive SLP anomalies caused by the wave-train CSs lasted longer than those caused by the blocking CSs. This is in line with the difference in HDEC dispersion ability between the two types of CSs. Namely, the negative anomaly of temperature and the positive anomaly of pressure change are not conducive to the maintenance of haze (Yin et al., 2019).
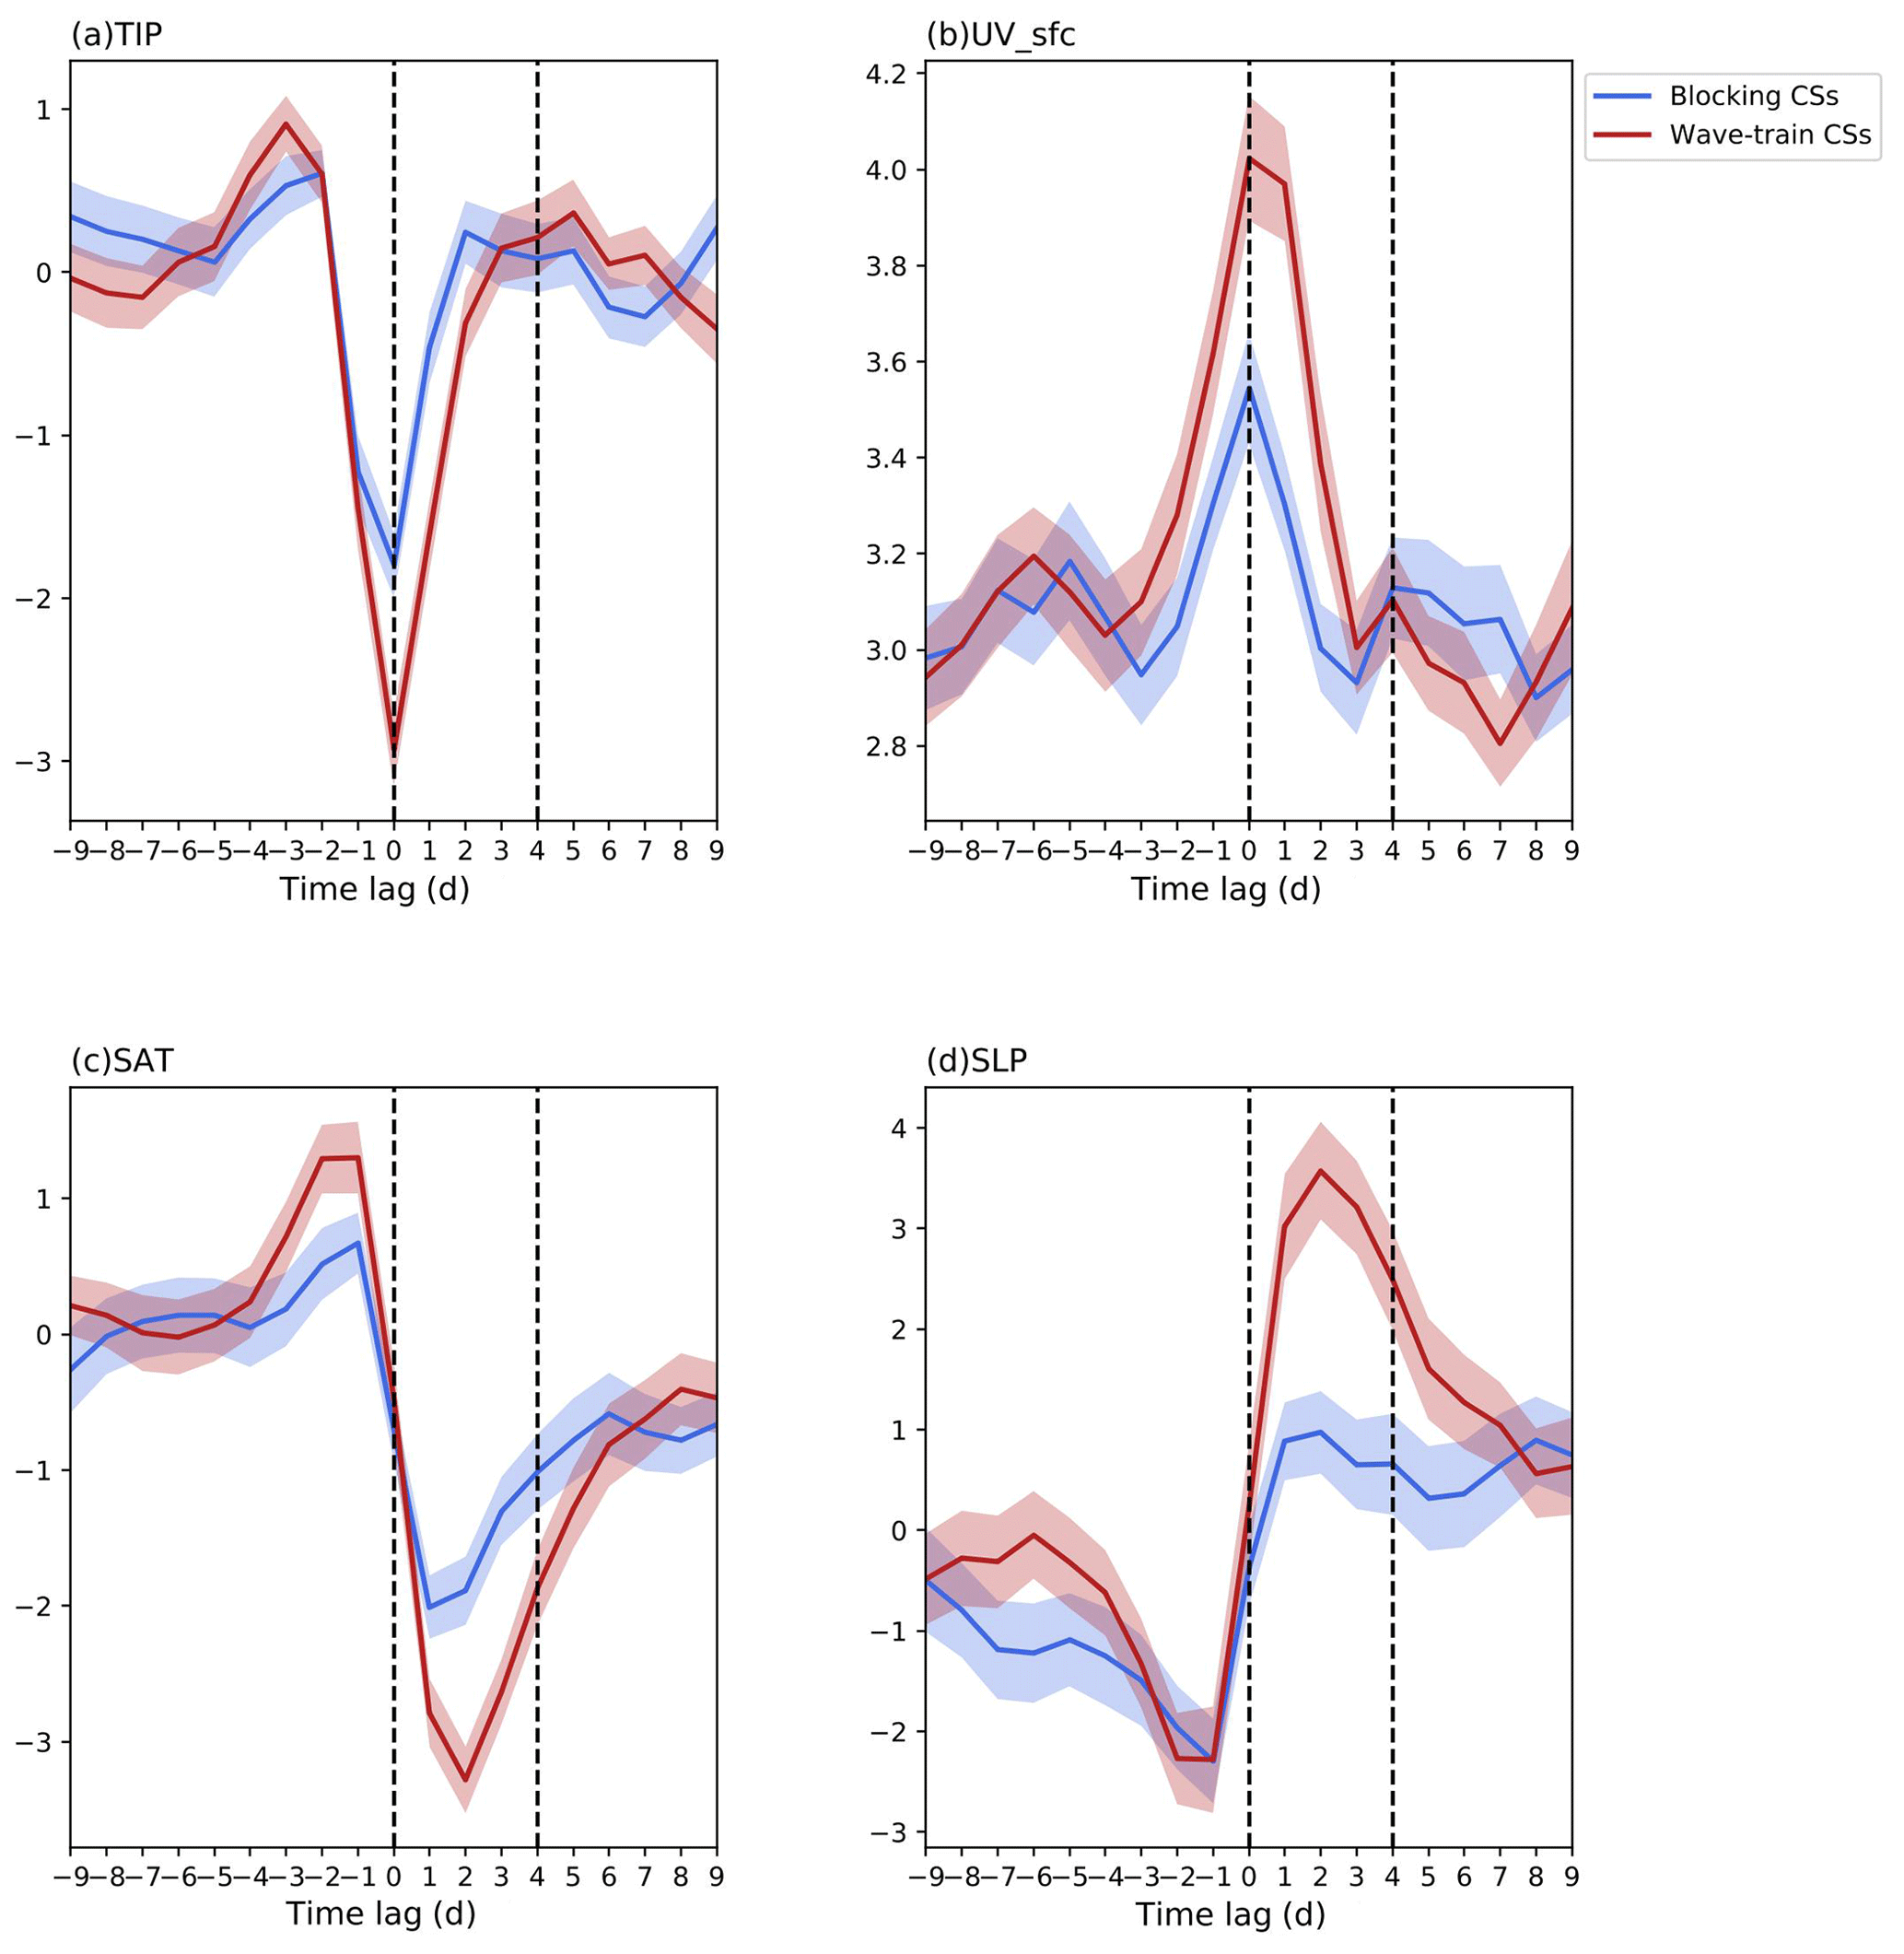
Figure 6Regional averaged (a) TIP anomalies (K), (b) UV_sfc anomalies (m s−1), (c) SAT anomalies (K), and (d) SLP anomalies (hPa) over EC during 9 d before and after the outbreak of the blocking CSs (blue lines) and wave-train CSs (red lines), respectively. Shading represents ±1 standard deviation among the CSs.
It should be noted that the SAT and SLP anomalies caused by the two types of CSs in this paper are different from those of Park et al. (2014), who identified CSs in a different region, which included the northern part of Northeast Asia. This is because the invasion of cold air is generally from north to south, so their research covers more CSs in Northeast Asia, while the present study only focuses on CSs in eastern China with heavy haze. Nevertheless, if we choose the same region, similar results can be obtained (Fig. S3).

Figure 7Composite anomalies of TIP (shading; K; dotted areas are statistically significant at the 95 % confidence level) and UV_sfc (vectors; m s−1) from −2 to 6 d relative to the outbreak of blocking CSs (a, c, e, g, i) and the wave-train CSs (b, d, f, h, j).
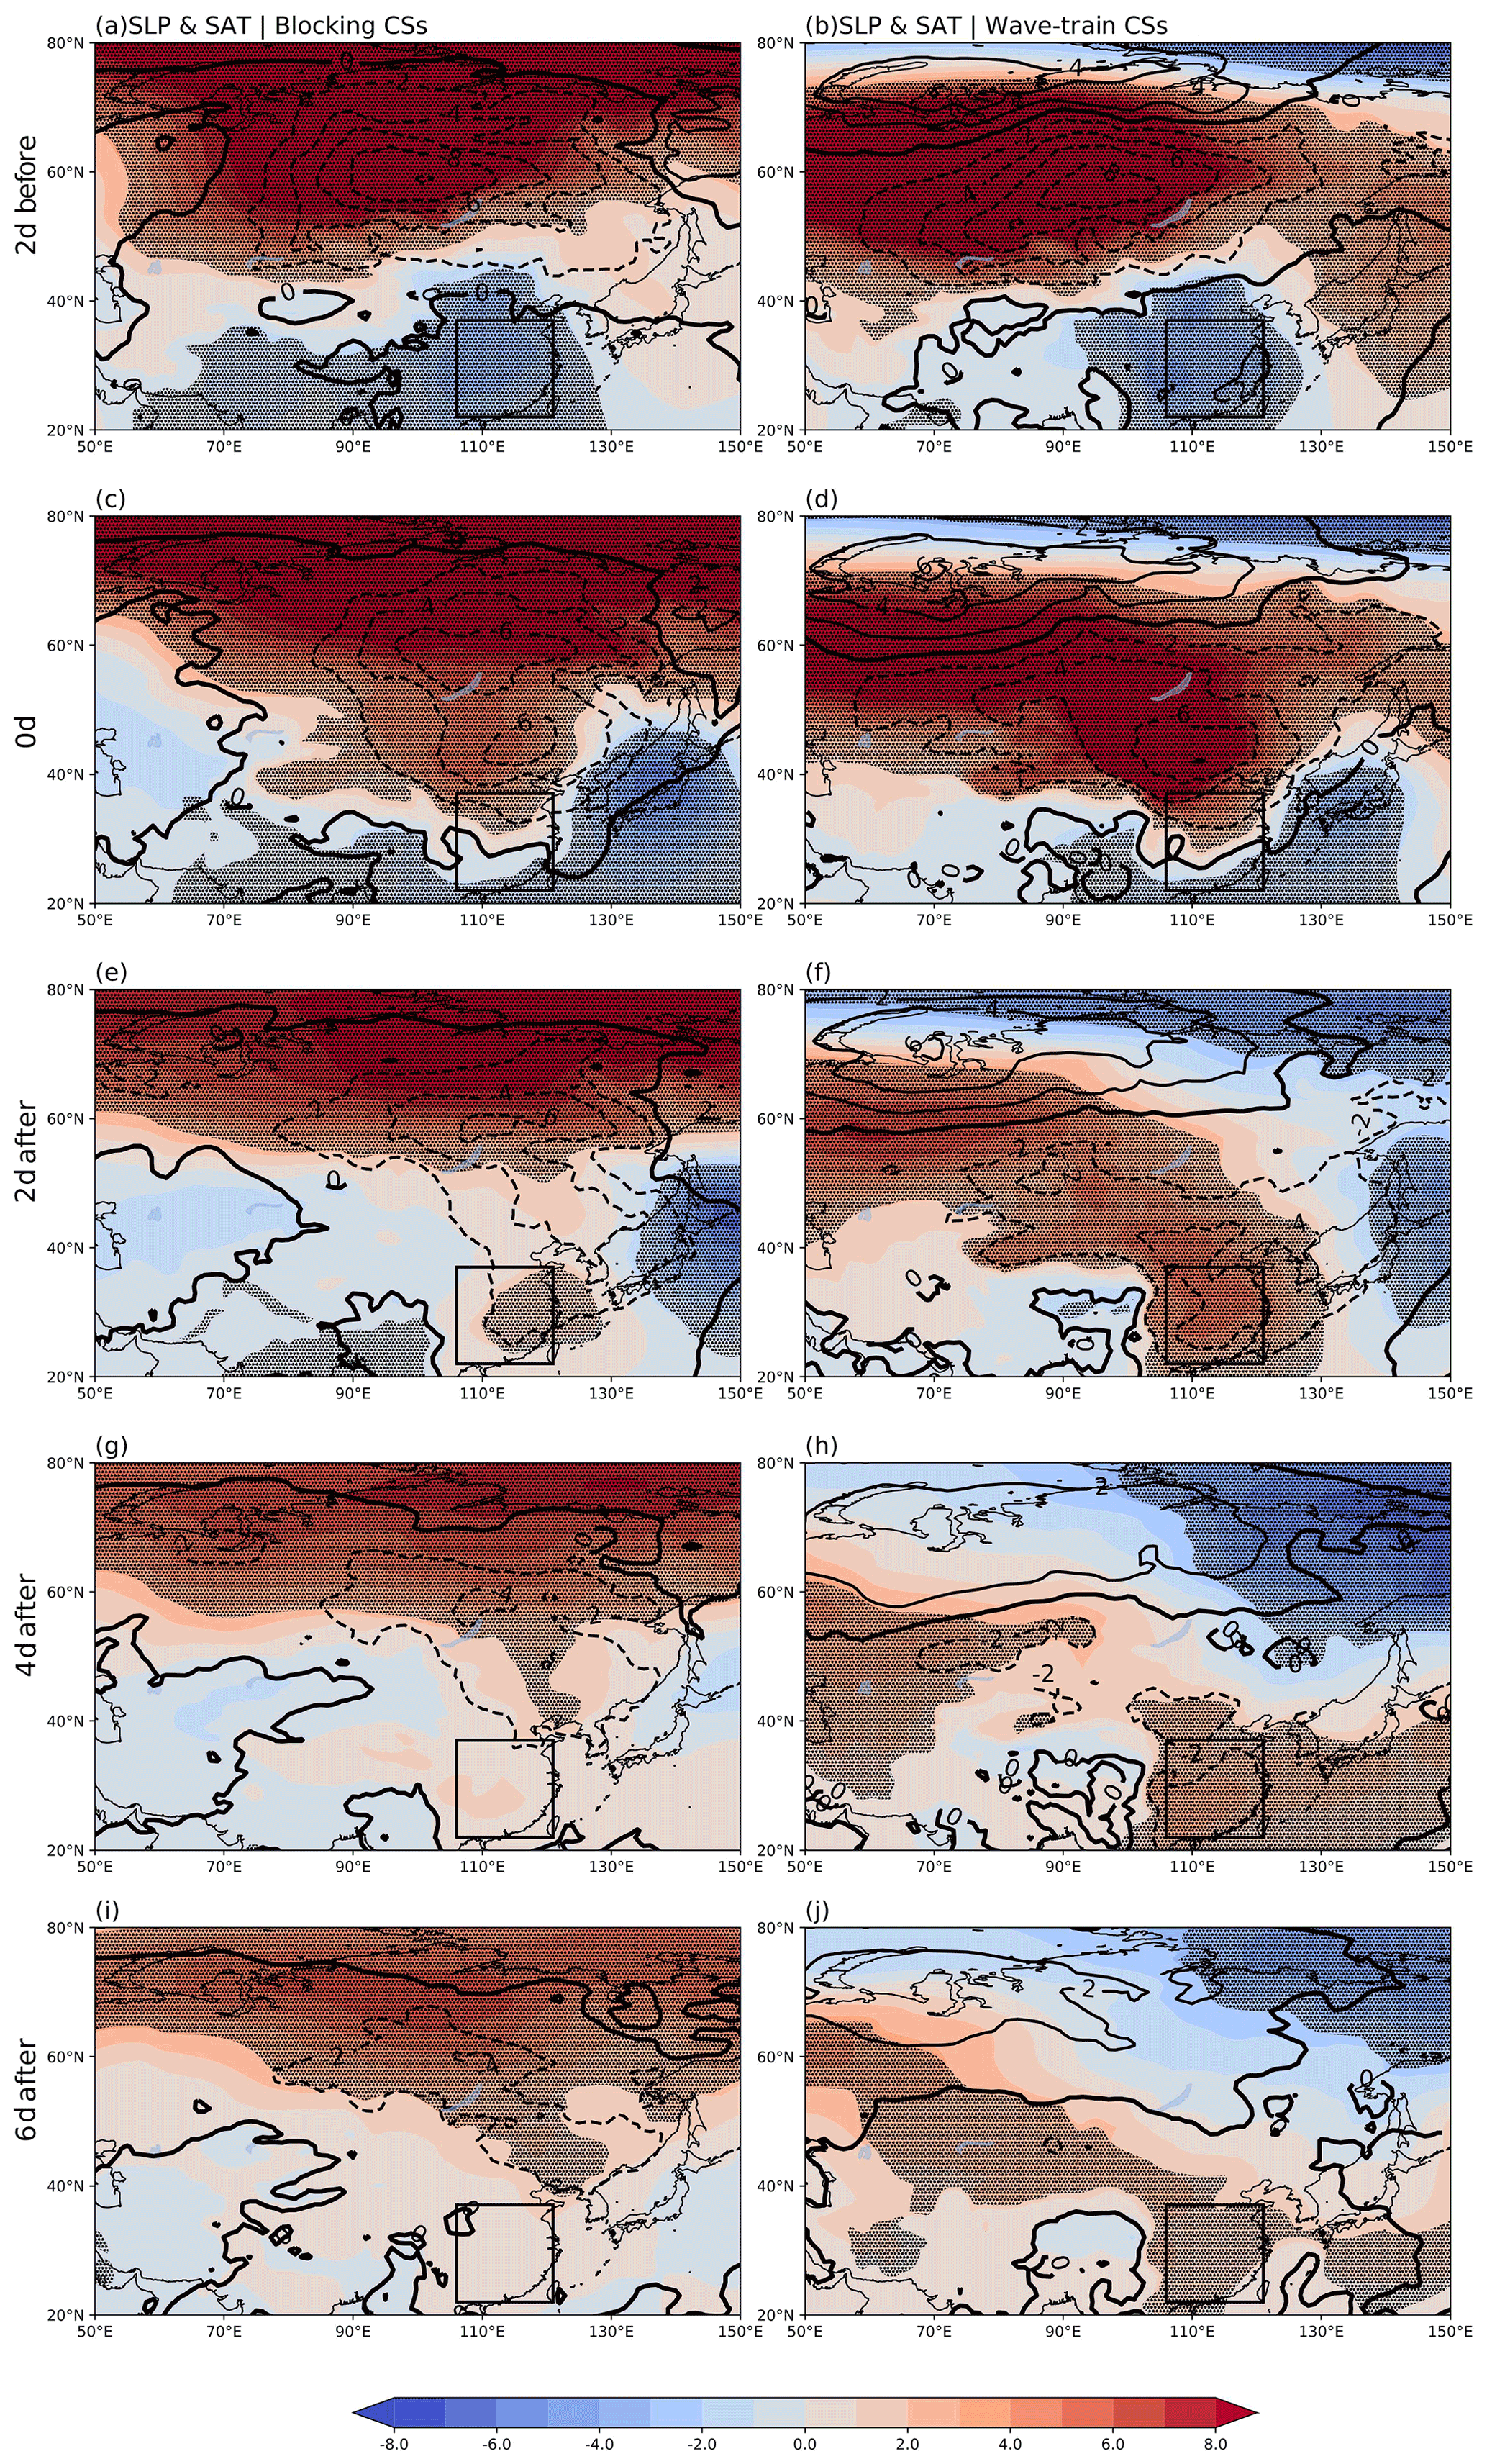
Figure 8Composite anomalies of SLP (shading; hPa; dotted areas are statistically significant at the 95 % confidence level) and SAT (contour; K) from −2 to 6 d relative to the outbreaks of blocking CSs (a, c, e, g, i) and the wave-train CSs (b, d, f, h, j). The thick black isoline represents the 0 value of SAT anomalies.
CSs invading EC would cause a sharp drop in temperature, strengthening the TIP in the lower atmosphere (Lin et al., 2009). The strong TIP is unfavorable for the vertical dispersion of haze, making it difficult for the cold, dry, and clear air to spread (Chen and Wang, 2015; Zhong et al., 2019). Figure 7 indicates that the cold front (the edge of the positive anomaly) will lead to large positive TIP values to control EC, forming a condition conducive to HDEC, which may also be a reason for the rapid decline of visibility in EC 2 d after the outbreak of CSs. Compared with the wave-train CSs, the TIP after the outbreak of blocking CSs was maintained for a longer time and a larger control region in EC, which may cause the weak ability to disperse HDEC. From the perspective of UV_sfc, the cold air was limited to the north, and the warm and humid conditions in EC were maintained before the outbreak of the CSs. Therefore, the CSs cause the airflow with the northern wind component to invade EC, rapidly dispersing the haze and causing the visibility to rise. However, after the outbreak of the CSs, the anomalies of UV_sfc in EC decrease, providing conducive conditions to the generation and maintenance of haze. The anomalies of UV_sfc in EC after the outbreak of blocking CSs are weaker and have a shorter duration than wave-train CSs.
The increase of Siberian high accompanies the outbreak of CSs, and the splitting and southward movement of the Siberian high leads cold air into EC. Comparatively speaking, the distribution of SLP anomalies in Eurasia before the blocking CSs form a pattern similar to the negative phase of the Arctic Oscillation. Figure 8 shows that when the blocking CSs occur, the positive SLP anomalies and the negative SAT anomalies in the high latitudes move southward. At the same time, the positive SLP anomalies control EC. A period of 2 d after the outbreak of the blocking CSs, the positive SLP anomalies and the negative SAT anomalies in the EC decline rapidly, providing favorable conditions for the accumulation of pollutants. On the other hand, the occurrence of wave-train CSs is accompanied by the eastward movement of significant positive SLP anomalies and negative SAT anomalies. A period of 2 d after, the positive SLP anomalies affect EC continuously, resulting in a longer period of high visibility in EC. In addition, RH also has significant effects on the hygroscopic growth of particles, which will change the mass concentration of aerosols and in turn the visibility (Wang et al., 2019). After the occurrence of the two types of CSs, most regions of EC present negative RH anomalies. The negative RH anomalies caused by wave-train CSs have a longer duration, stronger intensity, and wider influence range (Fig. S4). This shows that the wave-train CS has a stronger ability to dissipate haze.
The results discussed earlier indicate that the blocking CSs have a weak ability to dissipate the HDEC, while the outbreak of wave-train CSs can make EC maintain high air quality for a longer time. Thus, the frequency variations of the two types of CSs may also affect the trend of HDEC in recent years. Figure 9a displays the time series of the frequency of blocking CSs and wave-train CSs. The results show that the wave-train CSs have an obvious downward trend, and the blocking CSs have a slight upward trend. It means that in recent years, the ability of CSs to dissipate HDEC has decreased in general. We further calculated the partial correlation coefficients between the frequency of the two types of CS and HDEC to exclude the influence of the other type of CSs. It is found that there is a significant positive correlation between blocking CSs and HDEC (Fig. 9b). It should be noted that this does not mean that more blocking CSs cause more haze, but it reflects the weak dispersion ability of blocking CSs to HDEC, resulting in the relatively higher number of HDEC. The negative correlation between wave-train CSs and HDEC is significant (Fig. 9c), which is consistent with the result above.
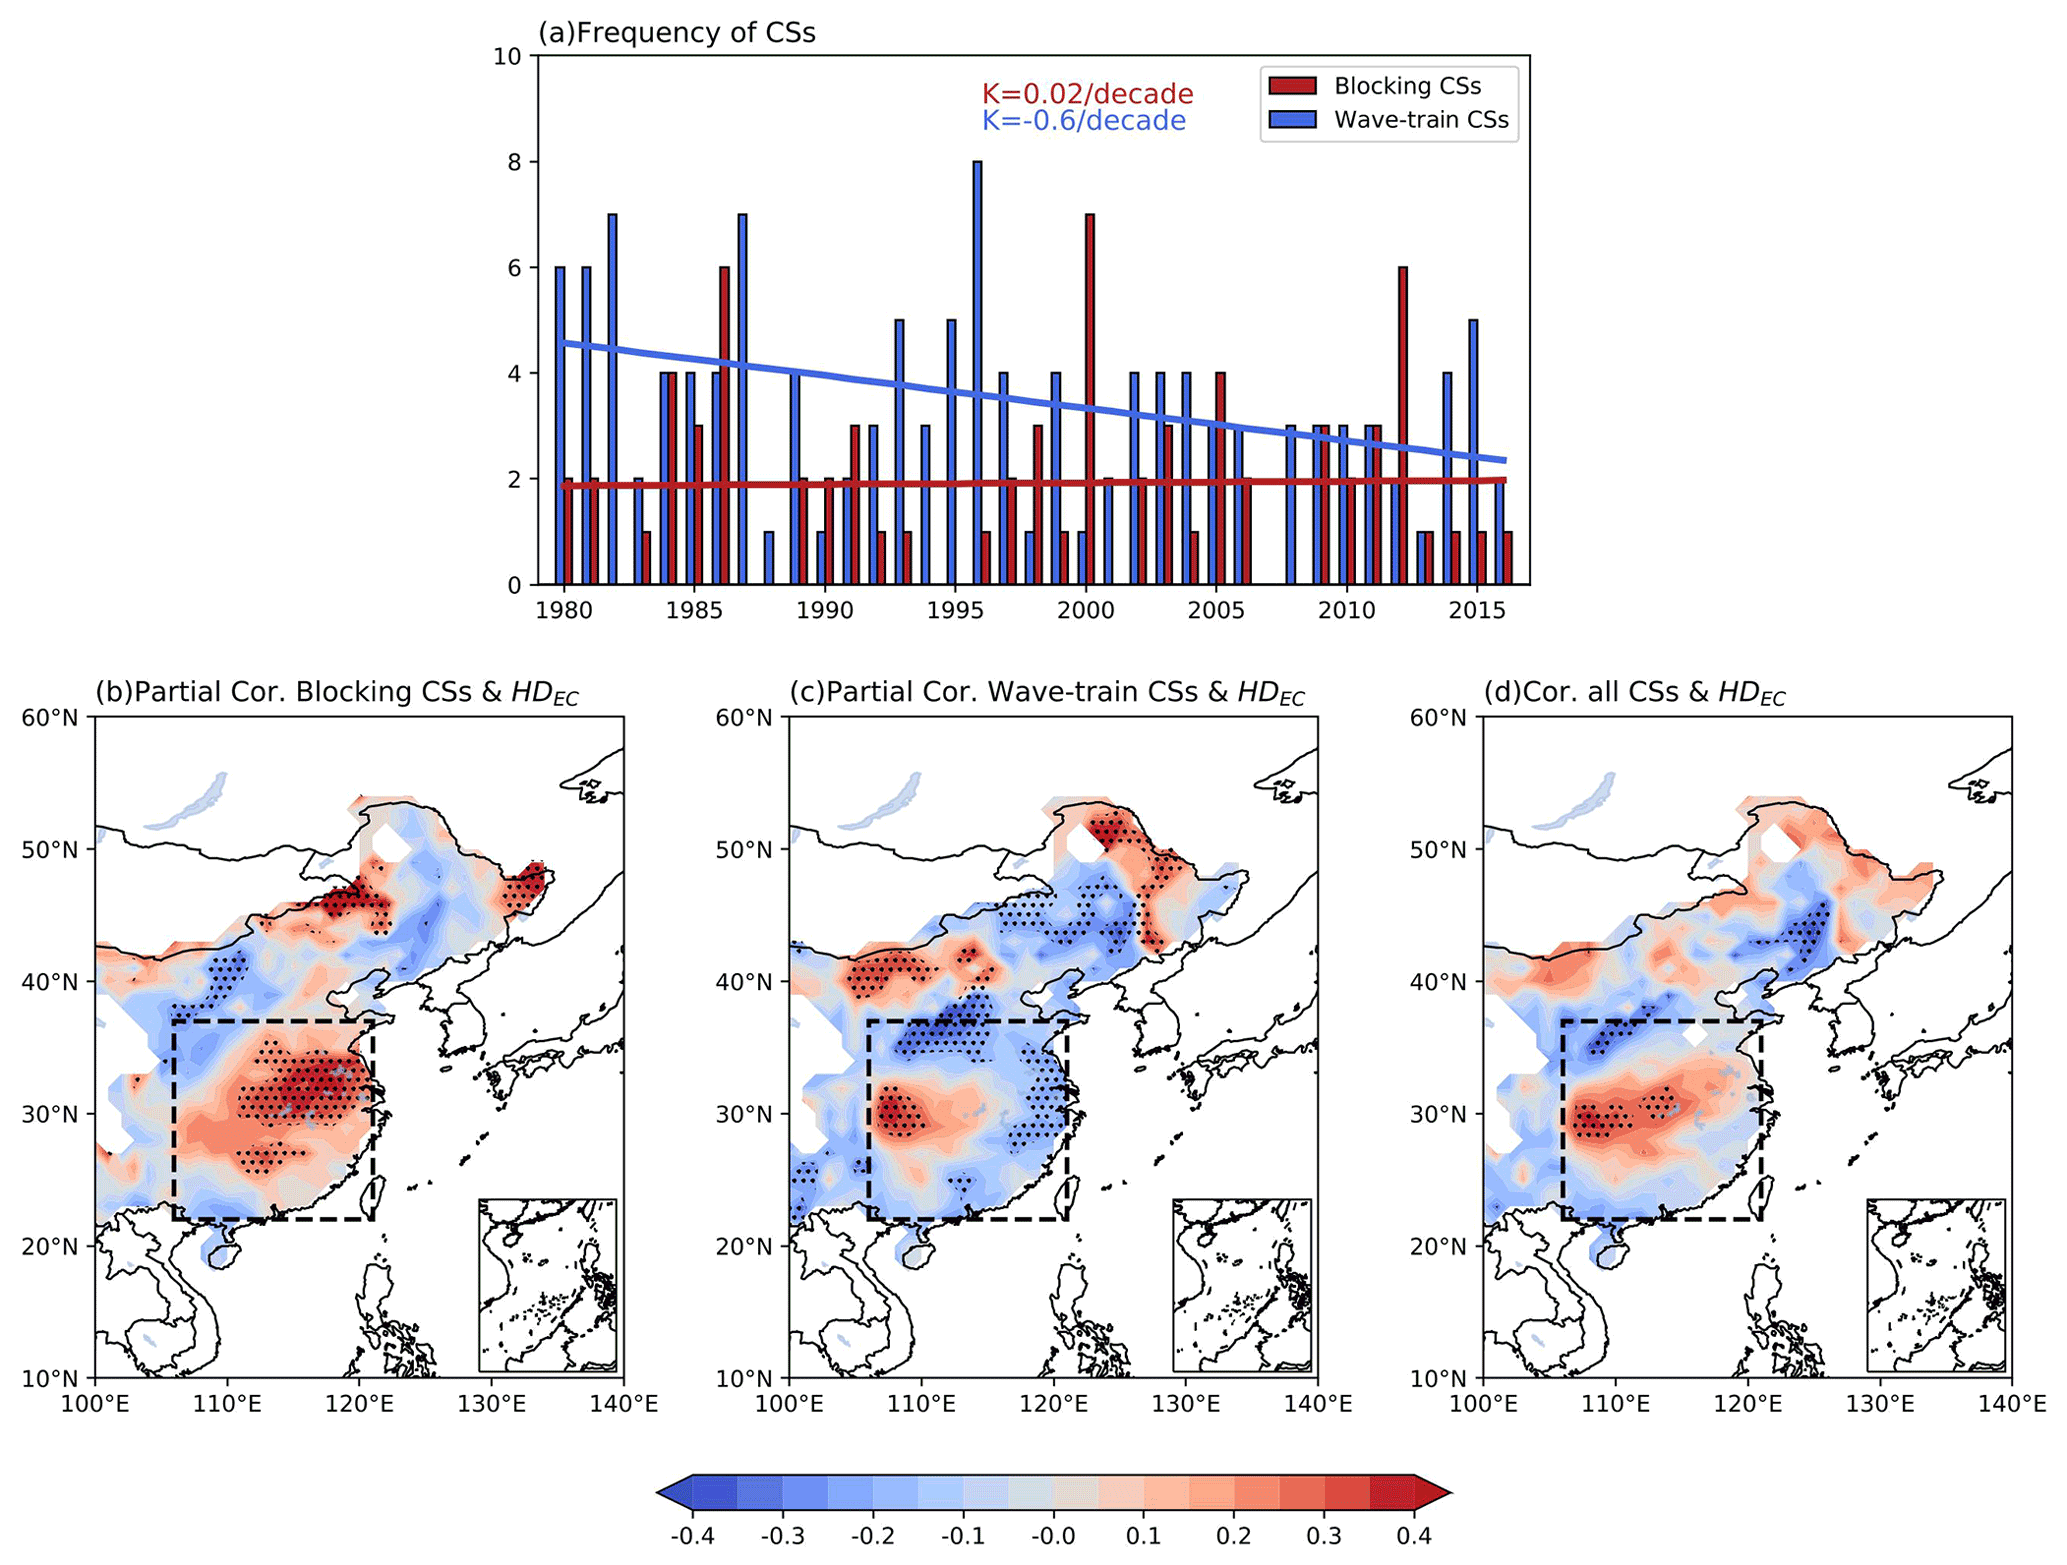
Figure 9(a) Time series of the blocking CSs and the wave-train CSs (The solid line is the linear regression of the time series, and the text in the upper right corner indicates the trend of the solid lines.). The partial correlation coefficient between HDEC and the frequency of blocking CSs (b) and the wave-train CSs (c) and the correlation coefficient between HDEC and the frequency of all CSs (d). Dotted areas are statistically significant at the 95 % confidence level.
In addition, we also evaluated the relationship between the trend of the total number of CSs (of both types) and HDEC (Fig. 9d). The results show that the correlation is weaker than that between a single type of CSs and HDEC, which is the interference caused by the difference in the ability of the two types of CSs to dissipate haze. In fact, the relatively higher number of HDEC in the central EC caused by variations of total CSs can be supported by a previous study (Yang et al., 2020a). The pattern of total CSs changes from a wave-train type to a blocking type, especially after the mid-1990s.
Furthermore, previous studies have also shown that with the appearance of a warm Arctic–cold Eurasian pattern, more blocking highs are expected to be maintained in the winter (Cohen et al., 2014; Luo et al., 2016), causing the pattern of CSs to change from a wave-train type to a blocking type (Yang et al., 2020b). Therefore, it can be considered that the ability of CSs to dissipate haze in East Asia being weakened in the future is mainly due to the significant reduction of wave-train CSs, and policymakers are required to consider the problem of air pollution.
This paper investigates the connection between the CSs and the cool-season haze over the EC based on the observational and reanalysis datasets from 1980 to 2017. The 187 CSs over EC are classified into two types by HCA, blocking CSs and wave-train CSs. Usually, the blocking CSs are accompanied by a meridional dipole in the upper tropospheric GPH anomalies, which consists of a stable blocking structure. The blocking structure tends to control the EC for a long time and forms a relatively stable meteorological condition, which has the disadvantage of dissipating the HDEC. Correspondingly, the local meteorological conditions, especially TIP and the quiescent wind band, rapidly appear after the outbreak of blocking CSs and provide a haze-prone background. In addition, the positive SLP anomalies induced by the outbreak of the blocking CSs can rapidly restore to normal, and the SAT warms up under the influence of the weakening of the north wind component. Therefore, the ability of blocking CSs to dissipate HDEC is limited. Conversely, high air quality in EC can last longer due to the shorter duration of TIP and longer duration of positive SLP anomalies after the wave-train CS. HDEC can generally remain at a low level for a shorter (longer) time after the outbreak of blocking (wave-train) CSs. It is confirmed that blocking CSs have been increasing over the past few years (Park et al., 2011a; Luo et al., 2018). Furthermore, the decreasing trend of wave-train CSs is likely to continue in the future, while the frequency of blocking CSs is expected to remain stable, which may weaken the dispersion of haze and worsen the HDEC.
The ground observations are from http://data.cma.cn (last access: 29 September 2021, CMA, 2021). Daily mean meteorological data are obtained from the ERA-Interim reanalysis data (https://doi.org/10.1002/qj.828, Dee et al., 2011) archive at http://www.ecmwf.int/en/research/climate-reanalysis/era-interim (last access: 29 September 2021, ERA-Interim, 2021) and NCEP/NCAR data (https://doi.org/10.1175/1520-0477(1996)077<0437:TNYRP>2.0.CO;2) archive at http://www.esrl.noaa.gov/psd/data/gridded/data.ncep.reanalysis.html (last access: 29 September 2021, NCEP/NCAR, 2021).
The supplement related to this article is available online at: https://doi.org/10.5194/acp-21-15185-2021-supplement.
SZ and GZ put forward the idea and design of the research, and RW provided observational data including relative humidity, visibility, and weather phenomena. SZ and XY performed research, and ZY provided valuable suggestions. SZ wrote the manuscript with contributions from all co-authors.
The contact author has declared that neither they nor their co-authors have any competing interests.
Publisher’s note: Copernicus Publications remains neutral with regard to jurisdictional claims in published maps and institutional affiliations.
The authors thank the reviewers for their helpful comments and suggestions which improved this paper. The authors also express thanks for the financial support from the National Natural Science Foundation of China and the National Key Research and Development Program of China.
This research has been supported by the National Natural Science Foundation of China (grant nos. 42175035 and 42175034) and the National Key Research and Development Program of China (grant no. 2017YFA0603804).
This paper was edited by Geraint Vaughan and reviewed by two anonymous referees.
Ashfold, M. J., Latif, M. T., Samah, A. A., Mead, M. I., and Harris, N. R. P.: Influence of Northeast Monsoon cold surges on air quality in Eastern Asia, Atmos. Environ., 166, 498–509, https://doi.org/10.1016/j.atmosenv.2017.07.047, 2017.
Cai, B., Zeng, G., Zhang, G., and Li, Z.: Autumn cold surge paths over North China and the associated atmospheric circulation, Atmosphere, 10, 134, https://doi.org/10.3390/atmos10030134, 2019.
Cai, W. J., Li, K., Liao, H., Wang, H. J., and Wu, L. X.: Weather Conditions Conducive to Beijing Severe Haze More Frequent under Climate Change, Nat. Clim. Change, 7, 257–262, https://doi.org/10.1038/nclimate3249, 2017.
Compo, G. P., Kiladis, G. N., and Webster, P. J.: The horizontal and vertical structure of East Asia winter monsoon pressure surges, Q. J. Roy. Meteor. Soc., 125, 29–54, https://doi.org/10.1002/qj.49712555304, 1999.
Chai, D. H., Wu, M. H., Li, J. X., and Zhao, Y. Q.: Analysis of greenhouse effect of cold wave low temperature on different structures in 2000, Meteorological Science, 22, 367–371, https://doi.org/10.3969/j.issn.1009-0827.2002.03.016, 2002 (in Chinese).
Chang, L. Y., Xu, J. M., Tie, X. X., and Wu, J. B.: Impact of the 2015 El Nino event on winter air quality in China, Sci. Rep., 6, 34275, https://doi.org/10.1038/srep34275, 2016.
Chen, H. P. and Wang, H. J.: Haze Days in North China and the associated atmospheric circulations based on daily visibility data from 1960 to 2012, J. Geophys. Res.-Atmos., 120, 5895–5909, https://doi.org/10.1002/2015JD023225, 2015.
CMA: Ground observations, CMA [data set], available at: http://data.cma.cn/, last access: 29 September 2021.
Cohen, J., Screen, J., Furtado, J., Barlow, M., Whittleston, D., Coumou, D., Francis, J., Dethloff, K., Entekhabi, D., Overland, J., and Jones, J.: Recent Arctic amplification and extreme mid-latitude weather, Nat. Geosci., 7, 627–637, https://doi.org/10.1038/ngeo2234, 2014.
Compo, G. P., Kiladis, G. N., and Webster, P. J.: The horizontal and vertical structure of east Asian winter monsoon pressure surges, Q. J. Roy. Meteor. Soc., 125, 29–54, https://doi.org/10.1002/qj.49712555304, 1999.
Dee, D. P., Uppala, S. M., Simmons, A. J., Berrisford, P., Poli, P., Kobayashi, S., Andrae, U., Balmaseda, M. A., Balsamo, G., Bauer, P., Bechtold, P., Beljaars, A. C. M., van de Berg, L., Bidlot, J., Bormann, N., Delsol, C., Dragani, R., Fuentes, M., Geer, A. J., Haimberger, L., Healy, S. B., Hersbach, H., Hólm, E. V., Isaksen, L., Kållberg, P., Köhler, M., Matricardi, M., McNally, A. P., Monge-Sanz, B. M., Morcrette, J.-J., Park, B.-K., Peubey, C., de Rosnay, P., Tavolato, C., Thépaut, J.-N., and Vitart, F.: The ERA-interim reanalysis: configuration and performance of the data assimilation system, Q. J. Roy. Meteor. Soc., 137, 553–597, https://doi.org/10.1002/qj.828, 2011.
Ding, Y. H. and Liu, Y. J.: Analysis of long-term variations of fog and haze in China in recent 50 years and their relations with atmospheric humidity, Sci. China Ser. D: Earth Sci., 57, 36–46, https://doi.org/10.1007/s11430-013-4792-1, 2014.
ECMWF: ERA-Interim, ECMWF [data set], available at: http://www.ecmwf.int/en/research/climate-reanalysis/era-interim, last access: 1 September 2019.
ERA-Interim: Atmospheric data, ERA-Interim [data set], available at http://www.ecmwf.int/en/research/climate-reanalysis/era-interim, last access: 29 September 2021.
Fu, C. B., Wu, J., Gao, Y. C., Zhao, D. M., and Han, Z. W.: ConECutive extreme visibility events in China during 1960–2009, Atmos. Environ., 68, 1–7, https://doi.org/10.1016/j.atmosenv.2012.11.035, 2013.
Hien, P. D., Loc, P. D., and Dao, N. V.: Air pollution episodes associated with East Asian winter monsoons, Sci. Total. Environ, 409, 5063–5068, https://doi.org/10.1016/j.scitotenv.2011.08.049, 2011.
Hu, Z. Z., Bengtsson, L., and Arpe, K.: Impact of global warming on the Asian winter monsoon in a coupled GCM, J. Geophys. Res., 5, 4607–4624, https://doi.org/10.1029/1999JD901031, 2000.
Kalnay, E., Kanamitsu, M., Kistler, R., Collins, W., Deaven, D., Gandin, L., Iredell, M., Saha, S., White, G., Woollen, J., Zhu, Y., Leetmaa, A., Reynolds, R., Chelliah, M., Ebisuzaki, W., Higgins, W., Janowiak, J., Mo, K. C., Ropelewski, C., Wang, J., Jenne, R., and Joseph, D.: The NCEP/NCAR 40-year reanalysis project, B. Am. Meteorol. Soc., 77, 437–471, https://doi.org/10.1175/1520-0477(1996)077<0437:TNYRP>2.0.CO;2, 1996.
Lin, C. Y., Lung, S. C. C., Guo, H. R., Wu, P. C., and Su, H. J.: Climate variability of cold surge and its impact on the air quality of Taiwan, Climatic Change, 94, 457–471, https://doi.org/10.1007/s10584-008-9495-9, 2009.
Luo, D. H., Xiao, Y. Q., Yao, Y., Dai, A. G., Simmonds, I., and Franzke, C.: Impact of Ural Blocking on Winter Warm Arctic–Cold Eurasian Anomalies. Part I: Blocking-Induced Amplification, J. Climate, 29, 3925–3947, https://doi.org/10.1175/JCLI-D-15-0611.1, 2016.
Luo, D. H., Chen, X. D., Dai, A. G., and Simmonds, I.: Changes in Atmospheric Blocking Circulations Linked with Winter Arctic Warming: A New Perspective, J. Climate, 31, 7661–7678, https://doi.org/10.1175/JCLI-D-18-0040.1, 2018.
Luo, Y. F., Lu, D., Zhou, X. J., and Li, W. L.: Characteristics of the spatial distribution and yearly variation of aerosol optical depth over China in last 30 years, J. Geophys. Res., 106, 14501–14513, https://doi.org/10.1029/2001JD900030, 2001.
NCEP/NCAR: Atmospheric data, NCEP/NCAR [data set], https://doi.org/10.1175/1520-0477(1996)077<0437:TNYRP>2.0.CO;2, 2021 (data available at: http://www.esrl.noaa.gov/psd/data/gridded/data.ncep.reanalysis.html, last access: 29 September 2021).
Niu, F., Li, Z. Q., Li, C., Lee, K.-H., and Wang, M. Y.: Increase of wintertime fog in China: Potential impacts of weakening of the eastern Asian monsoon circulation and increasing aerosol loading, J. Geophys. Res., 115, D00K20, https://doi.org/10.1029/2009JD013484, 2010.
Park, T. W., Jeong, J. H., Ho, C. H., and Kim, S. J.: Characteristics of atmospheric circulation associated with cold surge occurrences in East Asia: A case study during 2005/06 winter, Adv. Atmos. Sci., 25, 791–804, https://doi.org/10.1007/s00376-008-0791-0, 2008.
Park, T. W., Ho, C. H., Jeong, J. H., Choi, Y. S., Park., S. K., and Song, C. K.: Different characteristics of cold day and cold surge frequency over East Asia in a global warming situation, J. Geophys. Res.-Atmos., 116, D12118, https://doi.org/10.1029/2010JD015369, 2011a.
Park, T. W., Ho, C. H., and Yang, S.: Relationship between the Arctic Oscillation and Cold Surges over East Asia, J. Climate, 24, 68–83, https://doi.org/10.1175/2010jcli3529.1, 2011b.
Park, T. W., Ho, C. H., and Deng, Y.: A synoptic and dynamical characterization of wave-train and blocking cold surge over East Asia, Clim. Dynam., 43, 753–770, https://doi.org/10.1007/s00382-013-1817-6, 2014.
Park, T. W, Ho, C. H, Jeong, J. H, Heo, J. W., and Deng, Y.: A new dynamical index for classification of cold surge types over East Asia, Clim. Dynam., 45, 2469–2484, https://doi.org/10.1007/s00382-015-2483-7, 2015.
Qian, Y., Leung, L. R., Ghan, S. J., and Giorgi, F.: Regional climate effects of aerosols over China: Modeling and observation, Tellus, 55B, 914–934, https://doi.org/10.3402/tellusb.v55i4.16379, 2003.
Qu, W., Wang, J., Zhang, X., Yang, Z., and Gao, S.: Effect of cold wave on winter visibility over eastern China, J. Geophys. Res., 120, 2394–2406, https://doi.org/10.1002/2014JD021958, 2015.
Rokach, L. and Maimon, O.: Clustering methods, in: Data mining and knowledge discovery handbook, Springer, US, 321–352, 2005.
Rousseeuw, P.: Silhouettes: A graphical aid to the interpretation and validation of cluster analysis, J. Comput. Appl. Math., 20, 5365, https://doi.org/10.1016/0377-0427(87)90125-7, 1987.
Shi, C., Zhang, H., Roth, M., and Li, Z.: Impacts of urbanization on long-term fog variation in Anhui Province, China, Atmos. Environ., 42, 8484–8492, https://doi.org/10.1016/j.atmosenv.2008.08.002, 2008.
Wang, H. J., Chen, H. P., and Liu, J. P.: Arctic Sea Ice Decline Intensified Haze Pollution in Eastern China, Atmospheric and Oceanic Science Letters, 8, 1–9, https://doi.org/10.3878/AOSL20140081, 2015.
Wang, X., Zhang, R., and Yu, W.: The Effects of PM2.5 Concentrations and Relative Humidity on Atmospheric Visibility in Beijing, J. Geophys. Res.-Atmos., 124, 2235–2259, 2019.
Wang, X., Zhang, R., Tan, Y., and Yu, W.: Dominant synoptic patterns associated with the decay process of PM2.5 pollution episodes around Beijing, Atmos. Chem. Phys., 21, 2491–2508, https://doi.org/10.5194/acp-21-2491-2021, 2021.
Wang, Z. and Ding, Y.: Climate change of the cold wave frequency of China in the last 53 years and the possible reasons, Chin. J. Atmos. Sci., 30, 1068–1076, 2006 (in Chinese).
Wang, Z. S., Liu, X. D., and Xie, X. N.: Effects of Strong East Asian Cold Surges on Improving the Air Quality over Mainland China, Atmosphere, 7, 38, https://doi.org/10.3390/atmos7030038, 2016.
Wei, Y., Li, J., Wang, Z., Chem, H., Wu, Q., Li, J., Wang, Y., and Wang, W.: Trends of surface PM2.5 over Beijing–Tianjin–Hebei in 2013–2015 and their causes: emission controls vs. meteorological conditions, Atmos. Oceanic Sci. Lett., 10, 276–283, https://doi.org/10.1080/16742834.2017.1315631, 2017.
Wu, J., Fu, C. B., Zhang, L. Y., and Tang, J. P.: Trends of visibility on sunny days in China in the recent 50 years, Atmos. Environ., 55, 339–342, https://doi.org/10.1016/j.atmosenv.2012.03.037, 2012.
Wu, J., Luo, J. G., Zhang, L. Y., Xia, L., Zhao, D. M., and Tang, J. P.: Improvement of aerosol optical depth retrieval using visibility data in China during the past 50 years, J. Geophys. Res.-Atmos., 119, 13370–13387, https://doi.org/10.1002/2014JD021550, 2014.
Xie, Y. B., Chen, J., and Li, W.: An assessment of PM2.5 related health risks and impaired values of Beijing residents in a consecutive high-level exposure during heavy haze days, Environ. Sci., 35, 1–8, 2014.
Xu, P., Chen, Y. F., and Ye, X. J.: Haze, air pollution, and health in China, Lancet, 382, 2067, https://doi.org/10.1016/S0140-6736(13)62693-8, 2013.
Xu, Q.: Abrupt change of themid-summer climate in central east China by the influence of atmospheric pollution, Atmos. Environ., 35, 5029–5040, https://doi.org/10.1016/S1352-2310(01)00315-6, 2001.
Yang, X. Y., Zeng, G., Zhang, G. W., and Li, Z. X.: Interdecadal Variation of Winter Cold Surge Path in East Asia and Its Relationship with Arctic Sea Ice, J. Climate, 33, 4907–4925, https://doi.org/10.1175/JCLI-D-19-0751.1, 2020a.
Yang, X. Y., Zeng, G., Zhang, G. W., Vedaste, I., and Xu, Y.: Future projections of winter cold surge paths over East Asia from CMIP6 models, Int. J. Climatol., 41, 1230–1245, https://doi.org/10.1002/joc.6797, 2020b.
Yin, Z. and Wang, H.: Role of atmospheric circulations in haze pollution in December 2016, Atmos. Chem. Phys., 17, 11673–11681, https://doi.org/10.5194/acp-17-11673-2017, 2017.
Yin, Z., Wang, H., and Chen, H.: Understanding severe winter haze events in the North China Plain in 2014: roles of climate anomalies, Atmos. Chem. Phys., 17, 1641–1651, https://doi.org/10.5194/acp-17-1641-2017, 2017.
Yin, Z., Li, Y., and Wang, H.: Response of early winter haze in the North China Plain to autumn Beaufort sea ice, Atmos. Chem. Phys., 19, 1439–1453, https://doi.org/10.5194/acp-19-1439-2019, 2019.
Yin, Z., Zhang, Y., Wang, H., and Li, Y.: Evident PM2.5 drops in the east of China due to the COVID-19 quarantine measures in February, Atmos. Chem. Phys., 21, 1581–1592, https://doi.org/10.5194/acp-21-1581-2021, 2021.
Yin, Z. C., Wang, H. J., and Ma, X. H.: Possible Relationship between the Chukchi Sea Ice in the Early Winter and the February Haze Pollution in the North China Plain, J. Climate, 32, 5179–5190, https://doi.org/10.1175/JCLI-D-18-0634.1, 2019.
Zhang, L. Y., Lu, X. B., Yang, L. L., Ding, F., Zhu, Z. F., and Rui, D. M.: Study on the Effects of the Strong El Nino Event on Air Quality of Eastern China in Winter, The Administration and Technique of Environmental Monitoring, 28, 23–27, 2016.
Zhang X. Y., Yin, Z. C., Wang, H. J., and Duan M. K.: Monthly Variations of Atmospheric Circulations Associated with Haze Pollution in the Yangtze River Delta and North China, Adv. Atmos. Sci., 38, 569–580, https://doi.org/10.1007/s00376-020-0227-z, 2021.
Zhong, W., Yin, Z., and Wang, H.: The relationship between anticyclonic anomalies in northeastern Asia and severe haze in the Beijing–Tianjin–Hebei region, Atmos. Chem. Phys., 19, 5941–5957, https://doi.org/10.5194/acp-19-5941-2019, 2019.