the Creative Commons Attribution 4.0 License.
the Creative Commons Attribution 4.0 License.
 | 12 Oct 2021
Temporary pause in the growth of atmospheric ethane and propane in 2015–2018
Connor Davel
Christine Wiedinmyer
Gabrielle Pétron
Jashan Chopra
Jacques Hueber
Brendan Blanchard
Ilann Bourgeois
Isaac Vimont
Stephen A. Montzka
Ben R. Miller
James W. Elkins
Detlev Helmig
Atmospheric non-methane hydrocarbons (NMHCs) play an important role in the formation of secondary organic aerosols and ozone. After a multidecadal global decline in atmospheric mole fractions of ethane and propane – the most abundant atmospheric NMHCs – previous work has shown a reversal of this trend with increasing atmospheric abundances from 2009 to 2015 in the Northern Hemisphere. These concentration increases were attributed to the unprecedented growth in oil and natural gas (O&NG) production in North America. Here, we supplement this trend analysis building on the long-term (2008–2010; 2012–2020) high-resolution (∼3 h) record of ambient air C2–C7 NMHCs from in situ measurements at the Greenland Environmental Observatory at Summit station (GEOSummit, 72.58 ∘ N, 38.48 ∘ W; 3210 m above sea level). We confirm previous findings that the ethane mole fraction significantly increased by +69.0 [+47.4, +73.2; 95 % confidence interval] ppt yr−1 from January 2010 to December 2014. Subsequent measurements, however, reveal a significant decrease by −58.4 [−64.1, −48.9] ppt yr−1 from January 2015 to December 2018. A similar reversal is found for propane. The upturn observed after 2019 suggests, however, that the pause in the growth of atmospheric ethane and propane might only have been temporary. Discrete samples collected at other northern hemispheric baseline sites under the umbrella of the NOAA cooperative global air sampling network show a similar decrease in 2015–2018 and suggest a hemispheric pattern. Here, we further discuss the potential contribution of biomass burning and O&NG emissions (the main sources of ethane and propane) and conclude that O&NG activities likely played a role in these recent changes. This study highlights the crucial need for better constrained emission inventories.
- Article
(5658 KB) - Full-text XML
-
Supplement
(2027 KB) - BibTeX
- EndNote


Non-methane hydrocarbons (NMHCs) are emitted to the atmosphere by a variety of biogenic and anthropogenic sources. Their atmospheric oxidation contributes to the production of surface ozone and aerosols, with impacts on air quality and climate forcing (Houweling et al., 1998). The abundance of atmospheric NMHCs (ethane, propane, i-butane, n-butane, i-pentane, n-pentane) increased steadily after 1950 until reduced emissions from oil and natural gas (O&NG) production and emission regulations from diverse sources (e.g., automobiles and industrial processes) were implemented in the 1970s (Helmig et al., 2014). Emission reductions led to a gradual decline (3 %–12 % per year) of NMHCs at urban and semi-rural sites in the last 5 decades (e.g., von Schneidemesser et al., 2010; Warneke et al., 2012). Accounting for an approximate atmospheric lifetime (at OH = 6.5×10⁵ molecules cm−3) ranging from 4.5 d for pentanes to 2 months for ethane, these emission reductions are also reflected in observations of background air composition, as seen in northern hemispheric firn air records (Aydin et al., 2011; Worton et al., 2012; Helmig et al., 2014): light alkanes increased steadily post-1950, peaking ∼50 % above 1950 levels around 1970–1985, and then steadily declined until 2010 to levels that were close to 1950 levels. After some 40 years of steadily declining atmospheric ethane and propane mixing ratios, Helmig et al. (2016) reported a reversal in this behavior: the analysis of weekly discrete air samples showed that between mid-2009 and mid-2014, ethane abundance at surface sites in the Northern Hemisphere (NH) increased at a rate of 2.9 %–4.7 % per year. These observations and conclusions were further substantiated by solar Fourier transform infrared (FTIR) ethane column retrievals showing similar increases in the middle to upper tropospheric ethane column (Franco et al., 2015, 2016; Hausmann et al., 2016). The largest increase rates for ethane and propane mixing ratios were found at sites located in the eastern United States and in the North Atlantic region, indicating larger emissions from the central to eastern parts of the United States, with the likely sources being increased emissions from shale O&NG extraction operations.
Interestingly, there is a strong latitudinal gradient of absolute NMHC dry-air mole fractions – with the highest abundances in the Arctic, where atmospheric removal rates are low during the polar winter (Helmig et al., 2016, 2009; Rudolph, 1995). Despite the sensitivity of the Arctic to pollution transport from lower latitudes, climate change, and already recognized and further anticipated feedbacks on the global climate, long-term in situ atmospheric composition observations within the Arctic are sparse. A large part of our current knowledge of polar atmospheric chemistry stems from research aircraft missions and campaign-type observations (e.g., Hartery et al., 2018; Jacob et al., 2010; Law et al., 2014). However, long-term continuous measurements or regularly repeated observations with consistent methodology and instrumentation are indispensable for establishing a baseline record of environmental conditions at clean remote sites and for observing their changes over time. Such data also serve as a legacy for future research that will rely on comparison with archived observations of environmental conditions.
In that context, the National Oceanic and Atmospheric Administration (NOAA) Global Monitoring Laboratory (GML) initiated a cooperative air sampling network at Niwot Ridge, Colorado, in 1967 (hereafter referred to as the NOAA/GML Carbon Cycle Greenhouse Gases (CCGG) network (https://www.esrl.noaa.gov/gmd/ccgg/, last access: 26 November 2020)). This network is nowadays an international effort, and discrete air samples are collected approximately weekly from a globally distributed network of sites, including four Arctic sites: Utqiaġvik (formerly known as Barrow; Alaska, USA), Alert (Nunavut, Canada), Summit (Greenland), and Ny-Ålesund (Svalbard, Norway). These samples are analyzed for CO2, CH4, CO, H2, N2O, and SF6 at GML (e.g., Geller et al., 1997; Komhyr et al., 1985; Steele et al., 1991) and at the University of Colorado Institute for Arctic and Alpine Research (INSTAAR) for stable isotopes of CO2 and CH4 (Miller et al., 2002; Trolier et al., 1996). These samples have also been analyzed for a variety of volatile organic compounds (VOCs) including C2–C7 NMHCs at INSTAAR since 2004 (Pollmann et al., 2008; Schultz et al., 2015). In 2014, measurements of ethane and propane were added to discrete air samples collected under the umbrella of the NOAA/GML Halocarbons and other Atmospheric Trace Species (HATS) network since 2004 (https://www.esrl.noaa.gov/gmd/hats/flask/flasks.html, last access: 26 November 2020).
The discrete, typically weekly, air sampling by cooperative global networks has been at the forefront of studies to identify and quantify long-term trends in the background air abundances of important trace gases (e.g., Masarie and Tans, 1995; Montzka et al., 2018; Nisbet et al., 2014, 2019). In parallel, higher temporal resolution in situ measurements allows for the investigation of gases' variability and of shorter term trends at specific sites. Here, we report in situ 2- to 4-hourly ambient air C2–C7 NMHC dry-air mole fractions from measurements at the Greenland Environmental Observatory at Summit station (GEOSummit) by gas chromatography (GC) and flame ionization detection (FID). Despite the advent of new methods based on optical measurement (e.g., FTIR spectroscopy) and mass spectrometry (e.g., photon-transfer mass spectrometry), GC-FID remains the dominant method in routine VOC observations due to its stable long-term response characteristics and relatively low maintenance cost (Schultz et al., 2015). NMHCs were first monitored with high temporal frequency at GEOSummit from 2008 to 2010 with support from the NASA Research Opportunities in Space and Earth Sciences (ROSES) program (Kramer et al., 2015). NMHC monitoring resumed in 2012 as part of the National Science Foundation (NSF) Arctic Observing Network program and was continuous and uninterrupted until March 2020, providing one of the few high temporal resolution long-term records of NMHCs in the Arctic. In this paper, we investigate and discuss seasonal variations, rates of change, and potential sources of NMHCs in the high Arctic. We also analyze multiyear trace gas data from other background sites under the umbrella of the NOAA/GML CCGG and HATS sampling networks to support our findings.
GEOSummit (72.58∘ N, 38.48∘ W; 3210 m above sea level) is a research facility located on the Greenland ice sheet, funded by the U.S. NSF and operated in collaboration with the Government of Greenland (see Fig. 1). The station hosts a diverse array of geoscience and astrophysics research projects (https://geo-summit.org/instruments, last access: 4 October 2021) and is the only high-altitude remote atmospheric observatory in the Arctic. Ambient air is monitored at the Temporary Atmospheric Watch Observatory (TAWO) located ∼ 1 km south of the research camp.

Figure 1Location of the Greenland Environmental Observatory at Summit station (red dot, SUM) where long-term in situ monitoring was carried out and of Alert (ALT), Utqiaġvik (formerly known as Barrow (BRW)), Mace Head (MHD), Park Falls (LEF), and Cape Kumukahi (KUM), where discrete samples were collected by both the NOAA/ESRL/GML CCGG and HATS flask sampling programs. The map is centered over the North Pole.
2.1 In situ NMHC measurements
C2–C7 NMHCs (ethane, propane, iso-butane, n-butane, acetylene, iso-pentane, n-pentane, n-hexane, benzene, toluene) were analyzed from July 2008 to July 2010 and from May 2012 to March 2020 by GC-FID using a fully automated and remotely controlled custom-built system. Ambient air was continuously sampled from a 10 m high inlet on the meteorological tower adjacent to the TAWO building through a heated (∼30 ∘C) sampling line. The sampling frequency increased from 6 ambient NMHC runs to 12 daily runs in 2018. The GC-FID system, tailored towards the remote, unattended, and long-term operation, is a further development of the instrument described in detail by Tanner et al. (2006) and Kramer et al. (2015). The instrument relies on a cryogen-free sample enrichment and injection system. Air was pulled from the tower inlet, and aliquots of the sample stream were first passed through a water trap (U-shaped stainless-steel-treated Silcosteel™ tube cooled using thermoelectric coolers) to dry the sample to a dew point of −20 ∘C, and NMHCs were then concentrated on a Peltier-cooled (−35 ∘C) multi-stage adsorbent trap. Analysis was accomplished by thermal desorption and injection onto an Al2O3 PLOT column for cryogen-free separation on an SRI Model 8610 gas chromatograph with a flame ionization detector. Our monitoring effort followed the World Meteorological Organization (WMO) Global Atmospheric Watch (GAW) quality control guidelines: blanks and calibration standards were injected every other day from the manifold and processed in the exact same way as ambient samples. The limit of detection was ∼ 2 ppt (pmol mol−1 by volume) for all compounds, and no significant blank contamination was ever noticed. Quantification was based on monthly FID response factors (Scanlon and Willis, 1985) calculated from the repeated analysis of two independently prepared and cross-referenced standards in use at any given time. Tables S1 and S2 summarize these response factors along with the associated relative standard deviation (<5 % on average for all compounds) for 2008–2010 and 2012–2020, respectively. The in situ GC-FID system provided a stable response from 2008 to 2020, with monthly response factors varying by ≤ 5 % for ethane, propane, and butanes and by ≤20 % for other compounds over this period. The monitoring program was audited by the World Calibration Center for Volatile Organic Compounds at the site in July 2017 (https://www.imk-ifu.kit.edu/wcc-voc/, last access: 26 November 2020). All reported VOC results were found to be within the Global Atmospheric Watch program quality objectives (WMO, 2007).
Table 1Rates of change and 95 % confidence interval (in brackets) inferred from discrete flask sampling (in ppt yr−1). ALT, BRW, MHD, LEF, and KUM refer to Alert, Utqiaġvik (formerly Barrow), Mace Head, Park Falls, and Cape Kumukahi. The localization of the sites can be found in Fig. 1. The symbols shown next to each rate of change relate to how statistically significant the estimate is: p<0.001= ***, p<0.01= **, and p<0.05= *.

2.2 Discrete measurements
We used NMHC data from Alert, Utqiaġvik, Mace Head (Ireland), Park Falls (Wisconsin, USA), and Cape Kumukahi (Hawaii, USA; see Fig. 1) collected as part of the NOAA/GML CCGG (October 2004 to August 2016) and HATS (August 2014 to March 2020) sampling and measurement programs. Note that we combined measurements from the two networks here.
2.2.1 CCGG discrete sampling and analysis
As described by Steele et al. (1987) and Dlugokencky et al. (1994), air samples are collected approximately weekly in pairs in 2.5 L borosilicate flasks with two glass-piston stopcocks sealed with Teflon O-rings. Flasks are flushed in series for 5 to 10 min and then pressurized to ∼1.2 atm with a portable sampling system. Samples collected from October 2004 to August 2016 were analyzed at INSTAAR in Boulder, Colorado, by GC-FID. The analysis, on a HP-5890 series II gas chromatograph, first involved the drying of approximately 600 cm3 of sample gas by running the sample gas through a 6.4 mm (outer diameter) stainless steel tube cooled to −25 ∘C. The analytes were then preconcentrated at −35 ∘C on an adsorbent bed (Carboxen 1000/1016). Samples were thermally desorbed at 310 ∘C onto a short capillary guard column before separation on an Al2O3 PLOT capillary column (0.53 mm × 60 m). Weekly instrument calibrations were performed using primary calibration standards acquired from the NOAA Global Monitoring Laboratory, the UK National Physics Laboratory, and the U.S. National Institute of Technology. These standard scales have been maintained since 2006 by regular inter-comparison and propagation of the scale with newly acquired standards. Deviations in the response factors from these different standards were smaller than 5 %, with results for ethane and propane typically being equal to or having less than 2 %–3 % deviation. Instrument FID response is linear within the range of observed ambient concentrations. The INSTAAR NMHC laboratory was audited by the WMO GAW World Calibration Center for VOCs (WCC-VOC; https://www.imk-ifu.kit.edu/wcc-voc/, last access: 26 November 2020) in 2008 and in 2016, and both times all measurement results passed the WMO data quality criteria (WMO, 2007).
2.2.2 HATS discrete sampling and analysis
At GEOSummit, paired borosilicate glass flasks are also pressurized to ∼ 1 atm overpressure with ambient air as part of the HATS sampling program. At other NH sites, electropolished stainless-steel flasks are used. All flasks are analyzed by GC with mass spectrometry analysis with a preconcentration system similar to Miller et al. (2008) to strip water vapor and CO2 from the airstream prior to injection of condensates (VOCs, halocarbons, solvents, and other gases) onto a 0.32 mm (inner diameter) GasPro capillary column. Results are tied to a suite of standards prepared in-house with gravimetric techniques.
2.3 Ancillary data
Continuous monitoring of carbon monoxide (CO) was conducted at GEOSummit between May 2019 and March 2021 with a cavity ring-down spectroscopy (CRDS) analyzer (Picarro G-2401). A switching manifold allowed regular sampling of ambient air and calibration gases. Three NOAA GML standards were integrated into the automated calibration. Low (69.6 ppb) and high (174.6 ppb) calibration points were performed for ∼ 3 min every 2 d, while an intermediate (117.4 ppb) calibration was carried out in between. Using the last minute of each calibration, the low and high calibration points were used to determine the linear relationship between the certified calibration values and the analyzer's reported calibration values. The calibration offset (slope and intercept) was calculated and used to correct the third intermediate calibration point. The mean absolute difference between the corrected and certified intermediate calibration paired values was 1.6 ppb, i.e., 1.4 %. The minute-averaged CRDS CO ambient air data were corrected using the calibration offset. The CRDS has a manufacturer-specified precision at 5 s, 5 min, and 60 min of 15, 1.5, and 1 ppb for CO (G2401 Gas Concentration Analyzer | Picarro, 2020).
We also use ethane, propane, tetrachloroethylene (C2Cl4), and hydrogen cyanide (HCN) data collected in the free troposphere during the global-scale airborne Atmospheric Tomography mission (ATom; https://espo.nasa.gov/atom/, last access: 4 October 2021) on board the NASA DC-8 aircraft (Wofsy et al., 2018). Canisters collected with the University of California Irvine Whole Air Sampler (WAS) were analyzed for more than 50 trace gases, including ethane, propane, and tetrachloroethylene by GC-FID and GC with mass spectrometric detection (Barletta et al., 2020). Hydrogen cyanide was measured in situ with the California Institute of Technology Chemical Ionization Mass Spectrometer (CIT-CIMS; Allen et al., 2019). For the purpose of our analysis, we removed data collected over continents, in the marine boundary layer (altitude < 0.4 km), or corresponding to stratospheric air (ozone to water vapor ratio > 1 ppb ppm−1).
2.4 Curve fitting method and trend analysis
We used the curve fitting method developed by Thoning et al. (1989) and described in detail at https://www.esrl.noaa.gov/gmd/ccgg/mbl/crvfit/crvfit.html (last access: 26 November 2020). Briefly, the data were fitted with a function consisting of a polynomial and series of harmonics to represent the average long-term trend and seasonal cycle. Residuals from the function were calculated, transformed into frequency domain with a fast Fourier transform algorithm, then filtered with two low-pass filters. One eliminates harmonics less than ∼ 1 month. When converted back to time domain and added to the function, it gives a smoothed curve. The other filter eliminates periods less than ∼ 1 year; when transformed back to the time domain and added to the polynomial, it gives the deseasonalized trend (hereafter referred to as the trend). Sen's slope estimate of the trend was calculated using the function TheilSen in the R package openair (Carslaw and Ropkins, 2012). Note that the p values and all uncertainties are calculated through bootstrap simulations (https://davidcarslaw.github.io/openair/reference/TheilSen.html, last access: 12 February 2021).
2.5 Source apportionment analysis
In order to identify potential source regions, we performed a potential source contribution function (PSCF) analysis using the trajLevel function in the R package openair (Carslaw and Ropkins, 2012). Based on air-mass back-trajectories (see below) and NMHC residuals (Sect. 2.4), the PSCF calculates the probability that a source is located at latitude i and longitude j. PSCF solves
where nij is the number of times that the trajectories passed through the cell (i, j) and mij the number of trajectories passing through that cell in which the NMHC residual was greater than a given threshold (90th percentile of the measured results distribution). Note that cells with very few trajectories passing through them have a weighting factor applied to reduce their effect.
For each NMHC in situ measurement, HYSPLIT (Hybrid Single Particle Lagrangian Integrated Trajectory; Draxler and Rolph, 2013) 5 d air-mass back-trajectories used in the PSCF analysis were generated using the Python package pysplit (Warner, 2018) and processor pysplitprocessor, available at https://github.com/brendano257/pysplit (last access: 26 November 2020) and https://github.com/brendano257/pysplitprocessor (last access: 26 November 2020) respectively. The HYSPLIT Lagrangian particle dispersion model was run from April 2012 to June 2019 using the National Center for Environmental Prediction Global Data Assimilation System (NCEP GDAS) 0.5∘ × 0.5∘ meteorological inputs available at ftp://arlftp.arlhq.noaa.gov/pub/archives/gdas0p5 (last access: 18 December 2020). We did not generate back-trajectories for observations after June 2019 due to the unavailability of the GDAS 0.5∘ × 0.5∘ archive.
3.1 Seasonal variation
The seasonal variation of C2–C7 NMHCs at GEOSummit is displayed in Fig. 2. Summer refers to June–August, fall to September–November, winter to December–February, and spring to March–May. NMHCs exhibit a strong and consistent seasonal pattern year after year, with maximum mole fractions during winter and early spring and a rapid decline towards summer. Anthropogenic sources of NMHCs do not vary much seasonally (Pozzer et al., 2010). Therefore, the observed seasonal cycle is primarily driven by the seasonally changing sink strength by reaction with the photochemically formed OH radical (Goldstein et al., 1995) – the dominant oxidizing agent in the global troposphere (Levy, 1971; Logan et al., 1981; Thompson, 1992). During the summer period, mole fractions of the heavier NMHCs were below or close to the detection limit (Fig. 2b). As already noted by Goldstein et al. (1995) and Kramer et al. (2015) based on a limited dataset, the phase of each NMHC is shifted due to the rate of reaction with OH. Ethane, the lightest and longest lived of the NMHCs shown in Fig. 2, peaks in February/March with a median of 2110 ppt and declines to a minimum of 734 ppt in July. Heavier and shorter lived NMHCs have lower mole fractions, peak earlier in the year (January/February), and reach a minimum earlier in summer (June) due to their faster rate of reaction with OH (Chameides and Cicerone, 1978).

Figure 2Monthly variation of (a) ethane and propane and (b) C4–C7 non-methane hydrocarbons measured in ambient air at GEOSummit as inferred from 2008–2010 and 2012–2020 in situ measurements. In the monthly boxplots, the lower and upper end of the box correspond to the 25th and 75th percentiles, while the whiskers extend from the 5th to the 95th percentiles.
Because changes in NMHC sources and sinks can affect the seasonal cycle amplitude, we investigated whether there is a trend in the NMHC's amplitude at GEOSummit. We focus here on ethane and propane, the most abundant hydrocarbons in the remote atmosphere after methane. Figure 3 shows the amplitude of the ethane and propane seasonal cycles, determined as the relative difference between the maximum and minimum values from the smooth curve for each annual cycle (Dlugokencky et al., 1997). The peak-to-minimum relative amplitude ranged from 64 % to 71 % for ethane and from 92 % to 96 % for propane, and there is no indication of a significant overall trend in amplitude. This range of amplitudes is in good agreement with the literature: the typical seasonal amplitudes for ethane are on the order of 50 % at midlatitude sites and can increase up to 80 % at remote sites (Franco et al., 2016; Helmig et al., 2016). Changes in mole fractions are further investigated and discussed in the following section.
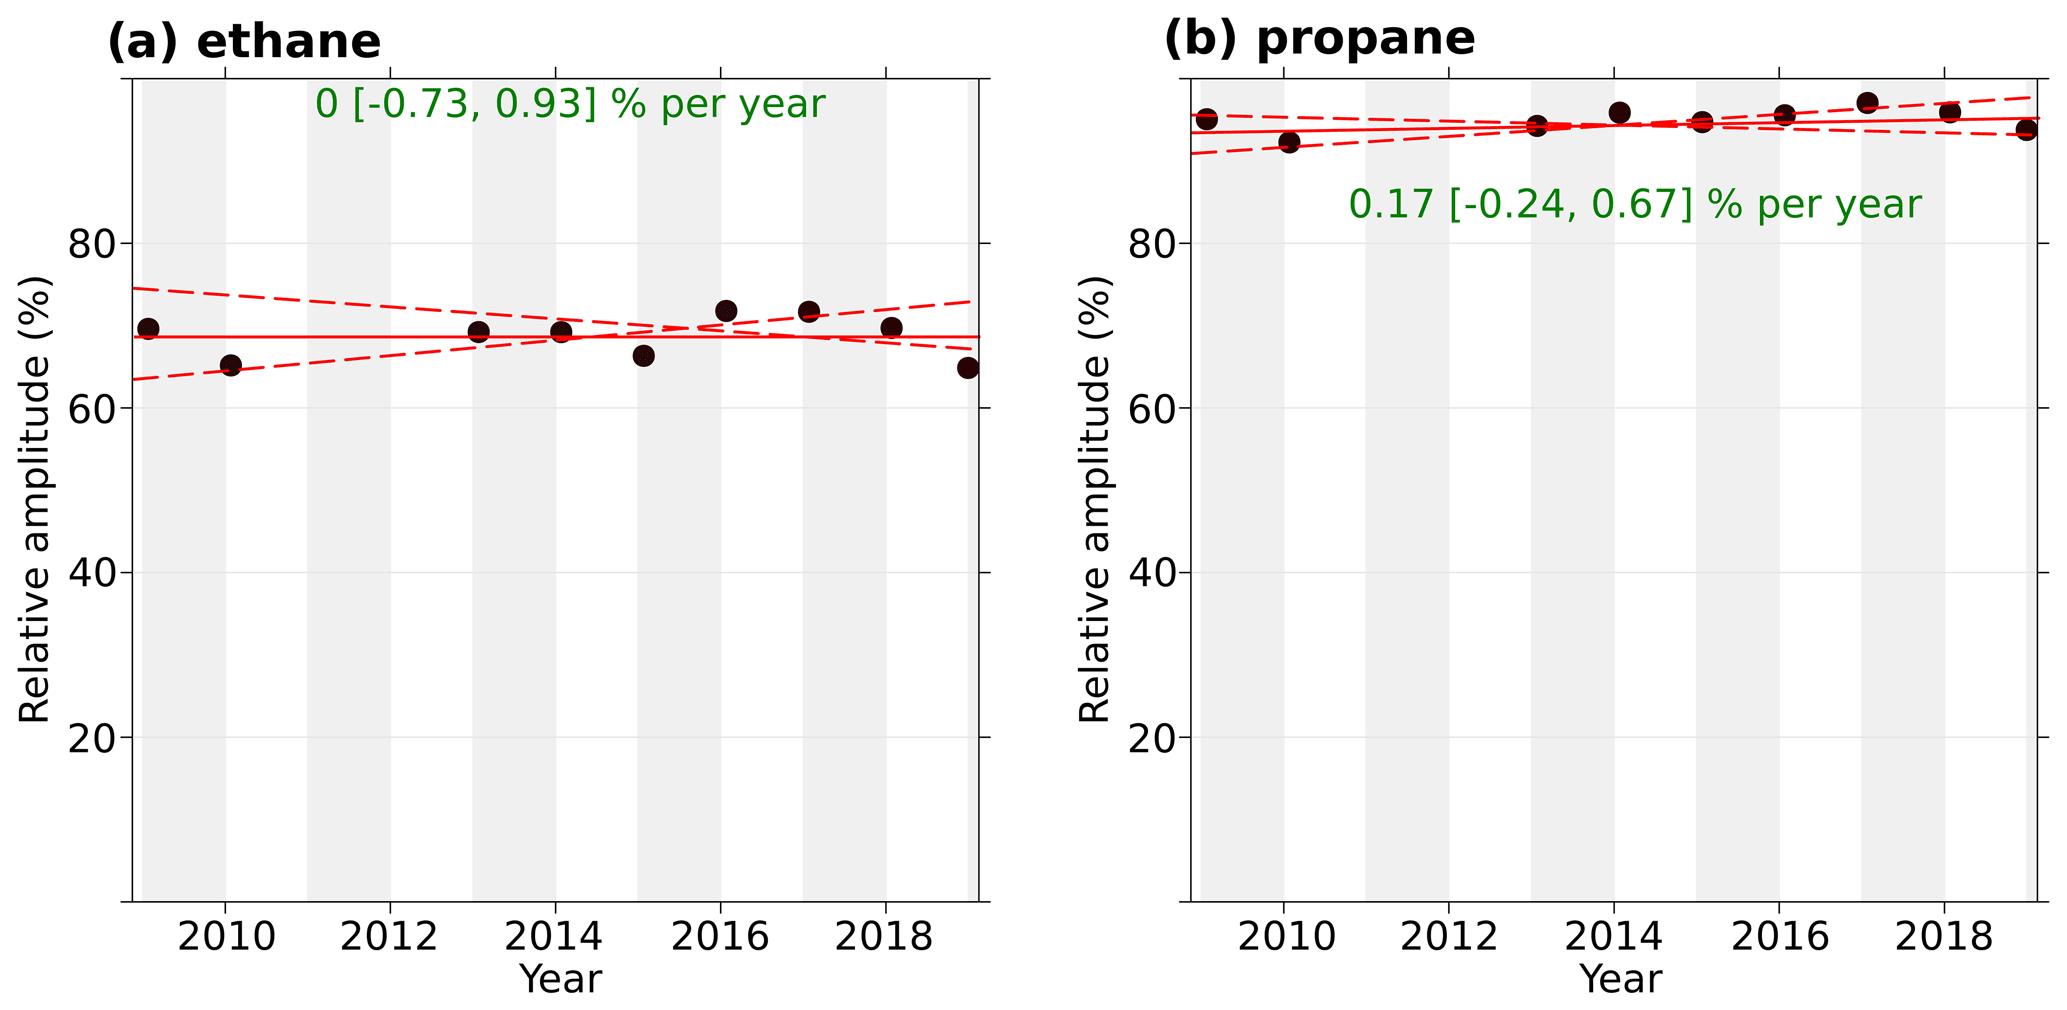
Figure 3Trend in peak-to-peak seasonal amplitude of (a) ethane and (b) propane at GEOSummit, calculated as the relative difference between the maximum and minimum values from the smooth curve for each annual cycle. The solid red line shows the trend estimate, and the dashed red lines show the 95 % confidence interval for the trend based on resampling methods. The overall trend is shown at the top, along with the 95 % confidence interval in the slope.
3.2 Reversal of ethane and propane rates of change at GEOSummit in 2015
Ethane is released from seepage of fossil carbon deposits, volcanoes, fires, and human activities – with O&NG extraction, processing, distribution, and industrial use being the primary sources (Pozzer et al., 2010). Based on the inventory developed for the Hemispheric Transport of Air Pollutants, Phase II (HTAP2, Janssens-Maenhout et al., 2015), biogenic emissions from MEGAN 2.1 (Guenther et al., 2012), and fire emissions from FINNv1.5 (Wiedinmyer et al., 2011), Helmig et al. (2016) estimated that ∼ 4 %, 18 %, and 78 % of global ethane emissions are due to biogenic, biomass burning, and anthropogenic sources, respectively. Global ethane emission rates decreased by 21 % from 1984 to 2010, likely due to decreased venting and flaring of natural gas in oil producing fields (Simpson et al., 2012). As a consequence, atmospheric ethane background air mixing ratios significantly declined during 1984–2010, by an average of ppt yr−1 in the Northern Hemisphere (Aydin et al., 2011; Worton et al., 2012; Helmig et al., 2014). However, the analysis by Helmig et al. (2016) of 10 years (2004–2014) of NMHC data from air samples collected at NOAA GML remote global sampling sites (including GEOSummit) showed a reversal of the global ethane trend from mid-2009 to mid-2014 (ethane growth rates > 50 ppt yr−1 at 32 sites). This trend reversal was attributed to increased US O&NG production (Helmig et al., 2016). Figure 4a shows the July 2008–March 2020 ethane trend at GEOSummit, as inferred from our in situ measurements (dotted line). Note that the same time series but also showing individual data points can be found in Fig. S1. Ethane mixing ratios at GEOSummit significantly (p value < 0.001) increased by +69.0 [+47.4, +73.2; 95 % confidence interval] ppt yr−1 from January 2010 to December 2014. A reversal is, however, evident after 2015: ethane mixing ratios significantly (p value < 0.001) decreased by −58.4 [−64.1, −48.9] ppt yr−1 from January 2015 to December 2018. Data collected after 2019, however, suggest that the pause in the growth of atmospheric ethane might have only been temporary. We focus hereafter on the 2015–2018 reversal period. Similar to ethane, a reversal is evident in late 2014 for propane (see Fig. 4b; dotted line): mixing ratios significantly (p value < 0.001) increased by +47.9 [+32.3, +52.3] ppt from January 2010 to June 2014 but significantly (p value < 0.001) decreased at a rate of −70.5 [−76.1, −65.8] ppt yr−1 from July 2014 to July 2016. Propane mixing ratios remained fairly stable (+10.2 [+6.6, +14.6] ppt yr−1; p value < 0.001) from July 2016 to December 2019. It should be noted that the pause in the growth of atmospheric ethane and propane at GEOSummit in 2015–2018 is confirmed by independent discrete sampling under the umbrella of the NOAA/GML CCGG and HATS networks (see Fig. 4; solid lines). Figure S2 shows the good agreement (R2=0.97 for ethane, R2=0.99 for propane) between in situ GC-FID measurements and discrete samples.
The temporary pause in the growth of ethane and propane at GEOSummit could either suggest changes in (i) the OH sink strength, (ii) atmospheric transport from source regions, and/or (iii) natural/anthropogenic emissions.
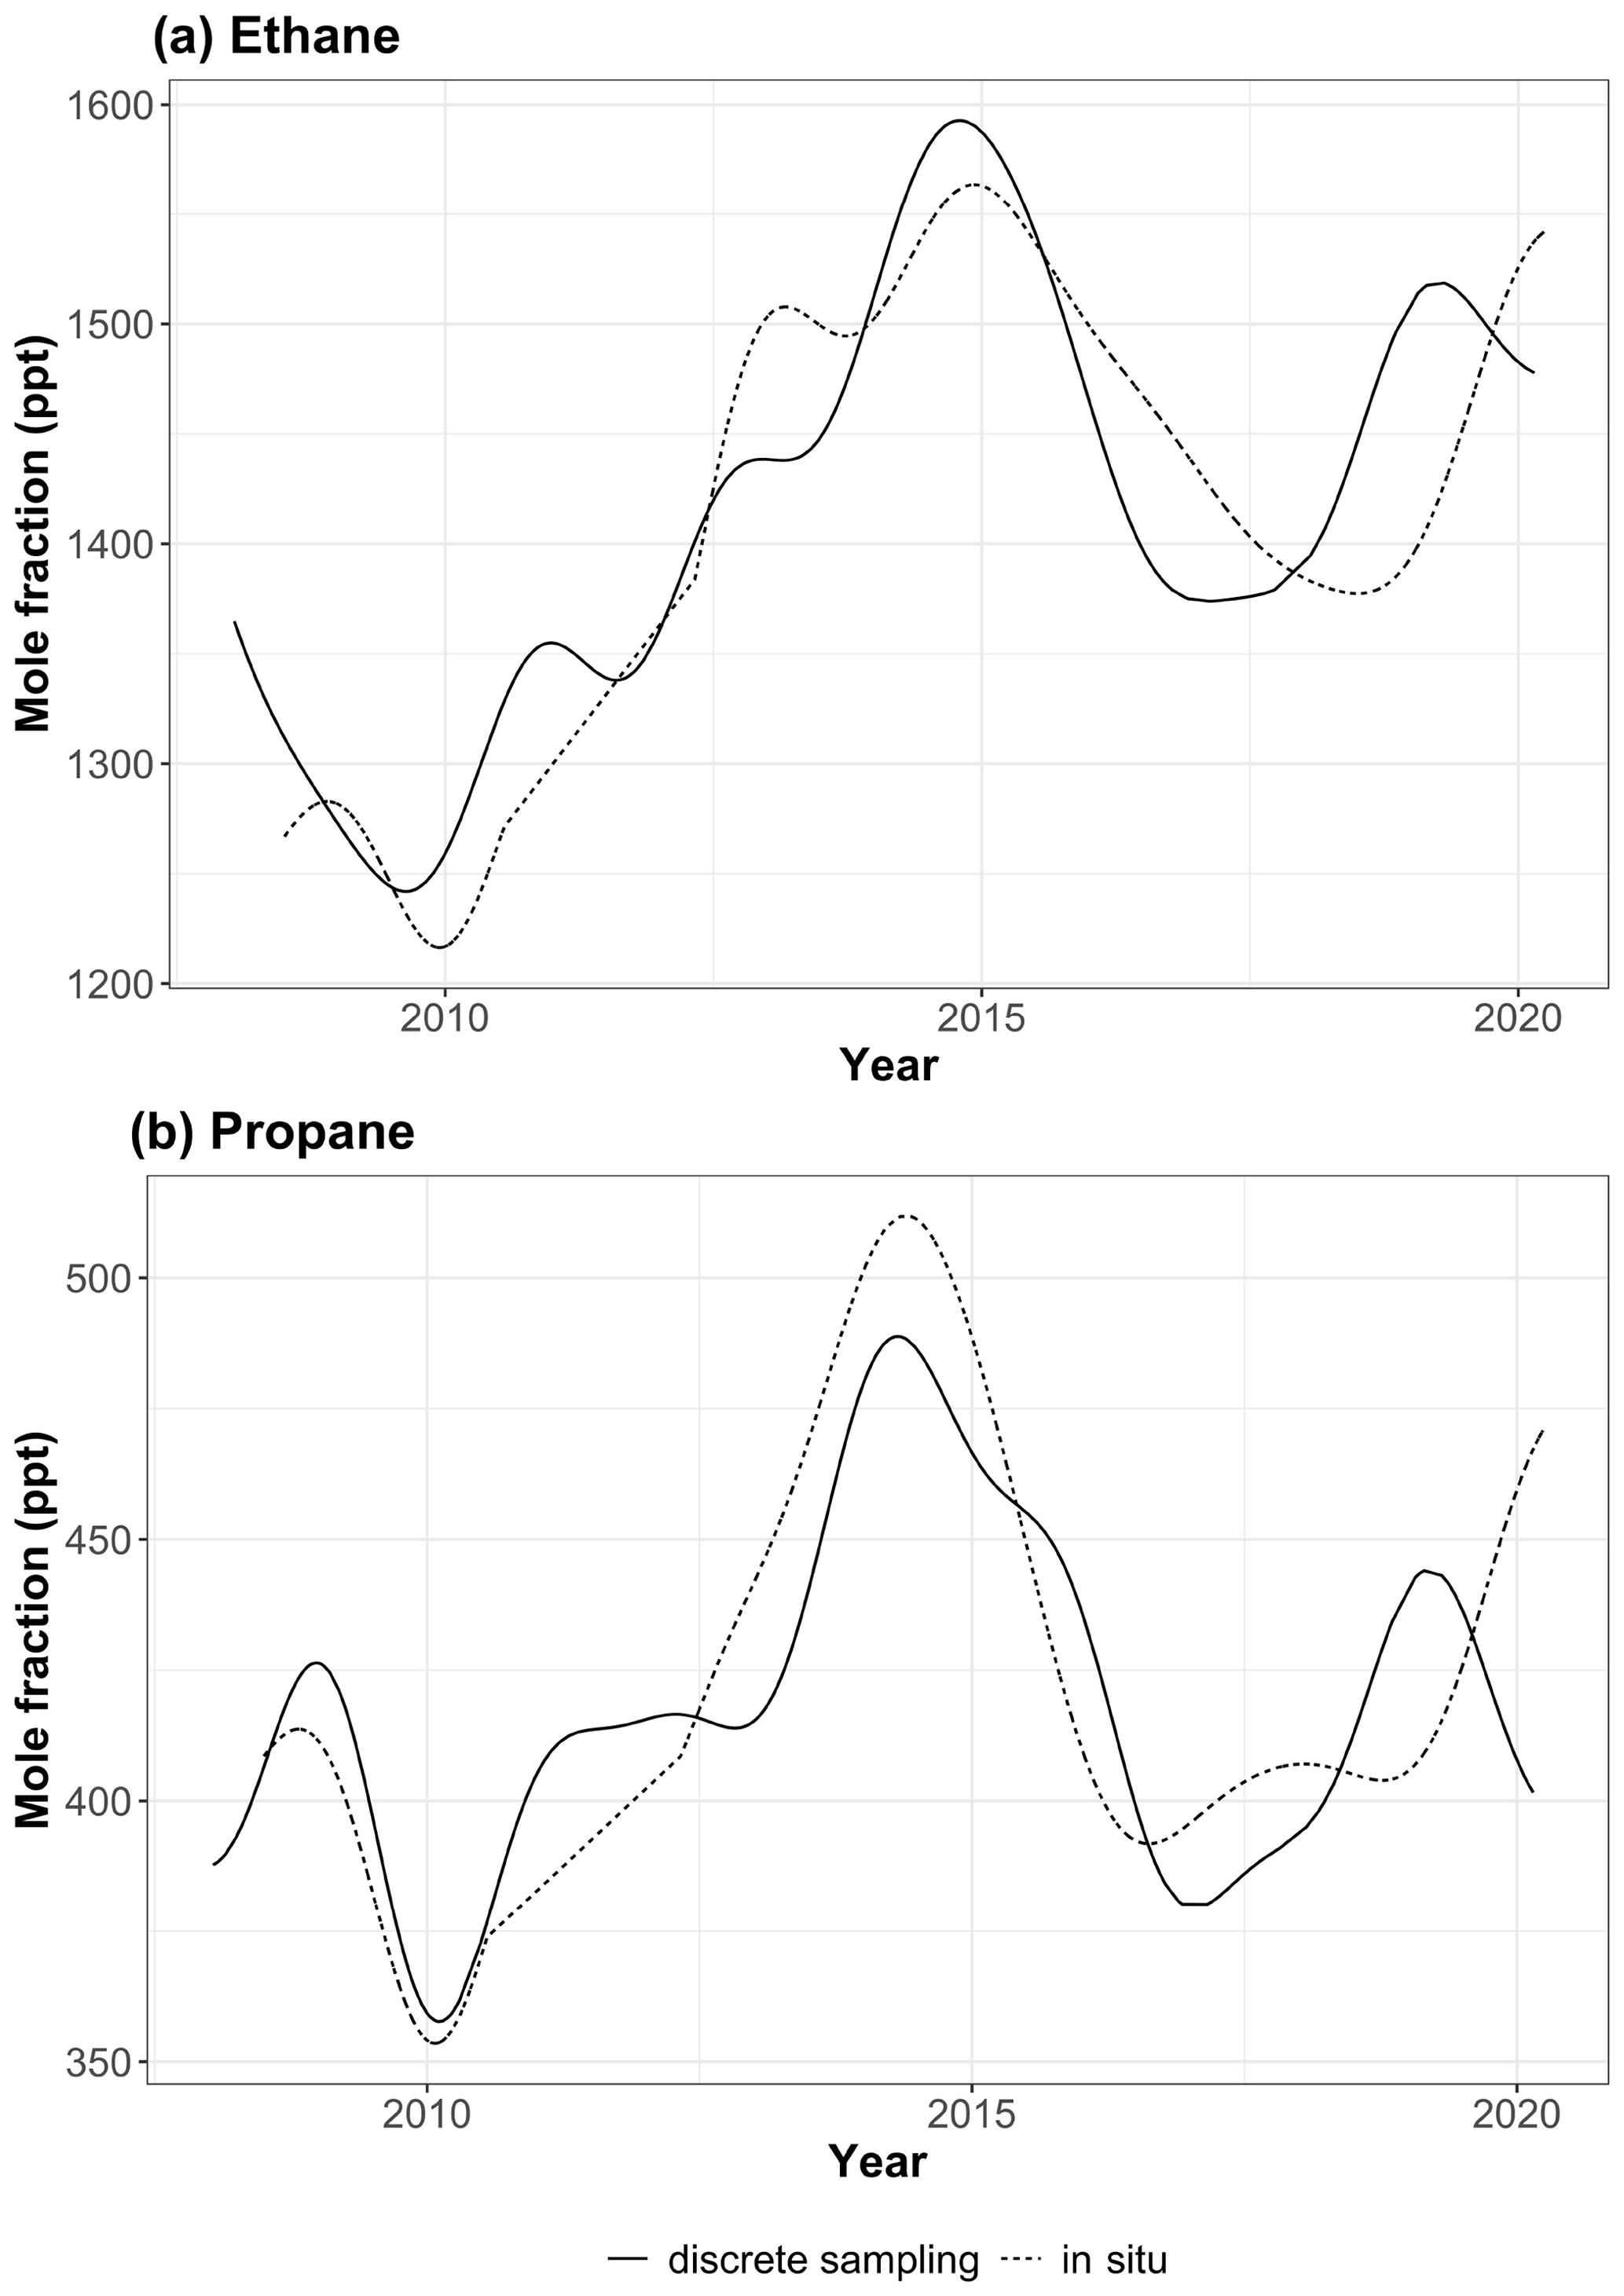
Figure 4(a) Ethane and (b) propane trends at GEOSummit from July 2008 to March 2020. Trends inferred from in situ and discrete flask sampling are shown by the dotted and solid lines, respectively.
The tropospheric abundance of OH is driven by a complex series of chemical reactions involving tropospheric ozone, methane, carbon monoxide, NMHCs, and nitrogen oxides and by the levels of solar radiation and humidity (Logan et al., 1981; Thompson, 1992). Building on the comparison of modeled and observed methane and methyl chloroform lifetimes, Naik et al. (2013) showed that OH concentrations changed little from 1850 to 2000. The authors suggested that the increases in factors that enhance OH (humidity, tropospheric ozone, nitrogen oxide emissions, and UV radiation) were compensated for by increases in OH sinks (methane abundance, carbon monoxide, and NMHC emissions). More recently, Naus et al. (2020) used a 3D model inversion of methyl chloroform to constrain the atmospheric oxidative capacity – largely determined by variations in OH – for the period 1998–2018. The authors showed that the interannual variations were typically small (<3 % per year) and found no evidence of a significant long-term trend in OH over the study period. Changes in NMHC mole fractions at GEOSummit are well outside what could be explained by a 3 % change in OH tropospheric concentrations. There is, however, likely a difference between global and regional OH variations (Brenninkmeijer et al., 1992; Spivakovsky et al., 2000; Lelieveld et al., 2004). In the absence of data on the Arctic and midlatitude OH abundance, we concede that OH may play a role in the observed pause but do not discuss that hypothesis further. The latter two hypotheses are investigated and verified or rejected in the following sections.
3.3 Changes in transport from source regions
The synoptic-scale tropospheric circulation in the Arctic is driven by three major semi-permanent pressure systems: (i) the Aleutian Low, a low-pressure center located south of the Bering Sea area; (ii) the Icelandic Low, a low-pressure system located southeast of Greenland near Iceland; and (iii) the Siberian High, a high-pressure center located over eastern Siberia (Barrie et al., 1992). During positive phases of the North Atlantic Oscillation (NAO), the Icelandic Low is strengthened and transport into the Arctic enhanced, resulting in higher Arctic pollution levels (Duncan and Bey, 2004; Eckhardt et al., 2003). Negative phases of the NAO are associated with decreased transport from Europe and Siberia and an increased relative contribution from North America (Octaviani et al., 2015). In addition, midlatitude atmospheric blocking events – quasi-stationary features characterized by a high-pressure cell centered around 60∘ N and lasting up to ∼15 d (Rex, 1950) – are known to enhance transport of polluted air to the Arctic (Iversen and Joranger, 1985). Here, we test the hypothesis of a pause in the growth of atmospheric ethane and propane at GEOSummit driven by the interannual variability of pollution transport from source regions. We investigated the potential influence of the NAO using monthly mean values from the NOAA Climate Prediction Center. We found a somewhat weak but significant positive correlation between the NAO and monthly averaged mixing ratios over the 2008–2019 period (R2=0.4, p value < 0.01 for both ethane and propane), in line with enhanced transport of pollution to the Arctic during positive phases of the NAO. We also investigated the potential influence of the Northern Annular Mode (NAM), which has a strong interannual component (Hu and Feng, 2010). We found a low correlation between the NAM and monthly averaged mixing ratios (R2<0.2, p value = 0.1 for both ethane and propane). Previous studies have shown that the influence of the NAM varies by regional section of the Arctic; while persistent organic pollutant concentrations were found to correlate with NAM phases at Ny-Ålesund (Svalbard), no correlation was found at Alert (Nunavut, Canada) (Becker et al., 2008; Octaviani et al., 2015).
Figure 5 shows the origin of air masses influencing GEOSummit (annual gridded back-trajectory frequencies), and Fig. 6a summarizes the relative contribution of each geographical sector for each year. Contrary to other Arctic sites (Hirdman et al., 2010), GEOSummit is mostly influenced by transport from North America and Europe, whereas Siberia has relatively little influence (0 %–2 %). These results are in agreement with the isobaric 10 d back-trajectory study by Kahl et al. (1997) and the 20 d backward FLEXPART simulations by Hirdman et al. (2010). European air masses represented 3 %–6 % of the total, with a 10 % high in 2018. The relative contribution of North Atlantic air masses (“ocean”) ranged from 1 % to 9 %, with a 14 % high from January to August 2019. The frequency of North American air masses exhibited the most variability, ranging from 2 % to 20 %. Years with enhanced transport from North America (e.g., 2012, 2019) coincided with a negative NAO index, known to drive decreased (increased) relative contribution from Europe/Asia (North America) (Octaviani et al., 2015). Assuming that the ethane and propane trends are driven by emissions in North America (Helmig et al., 2016) and that these emissions are constant, one would expect higher ethane and propane mixing ratios in years when the relative influence of North American air masses peaked. There is, however, an anticorrelation: a 2 %–3 % relative contribution of North American air masses in 2014 and 2015 when ethane and propane mixing ratios reached a maximum and 19 % in 2018 when mixing ratios reached a minimum. This leaves two possibilities: either North American emissions dropped over the studied time period (see Sect. 3.4), or ethane and propane trends observed at GEOSummit are not driven by emissions in North America (see below).
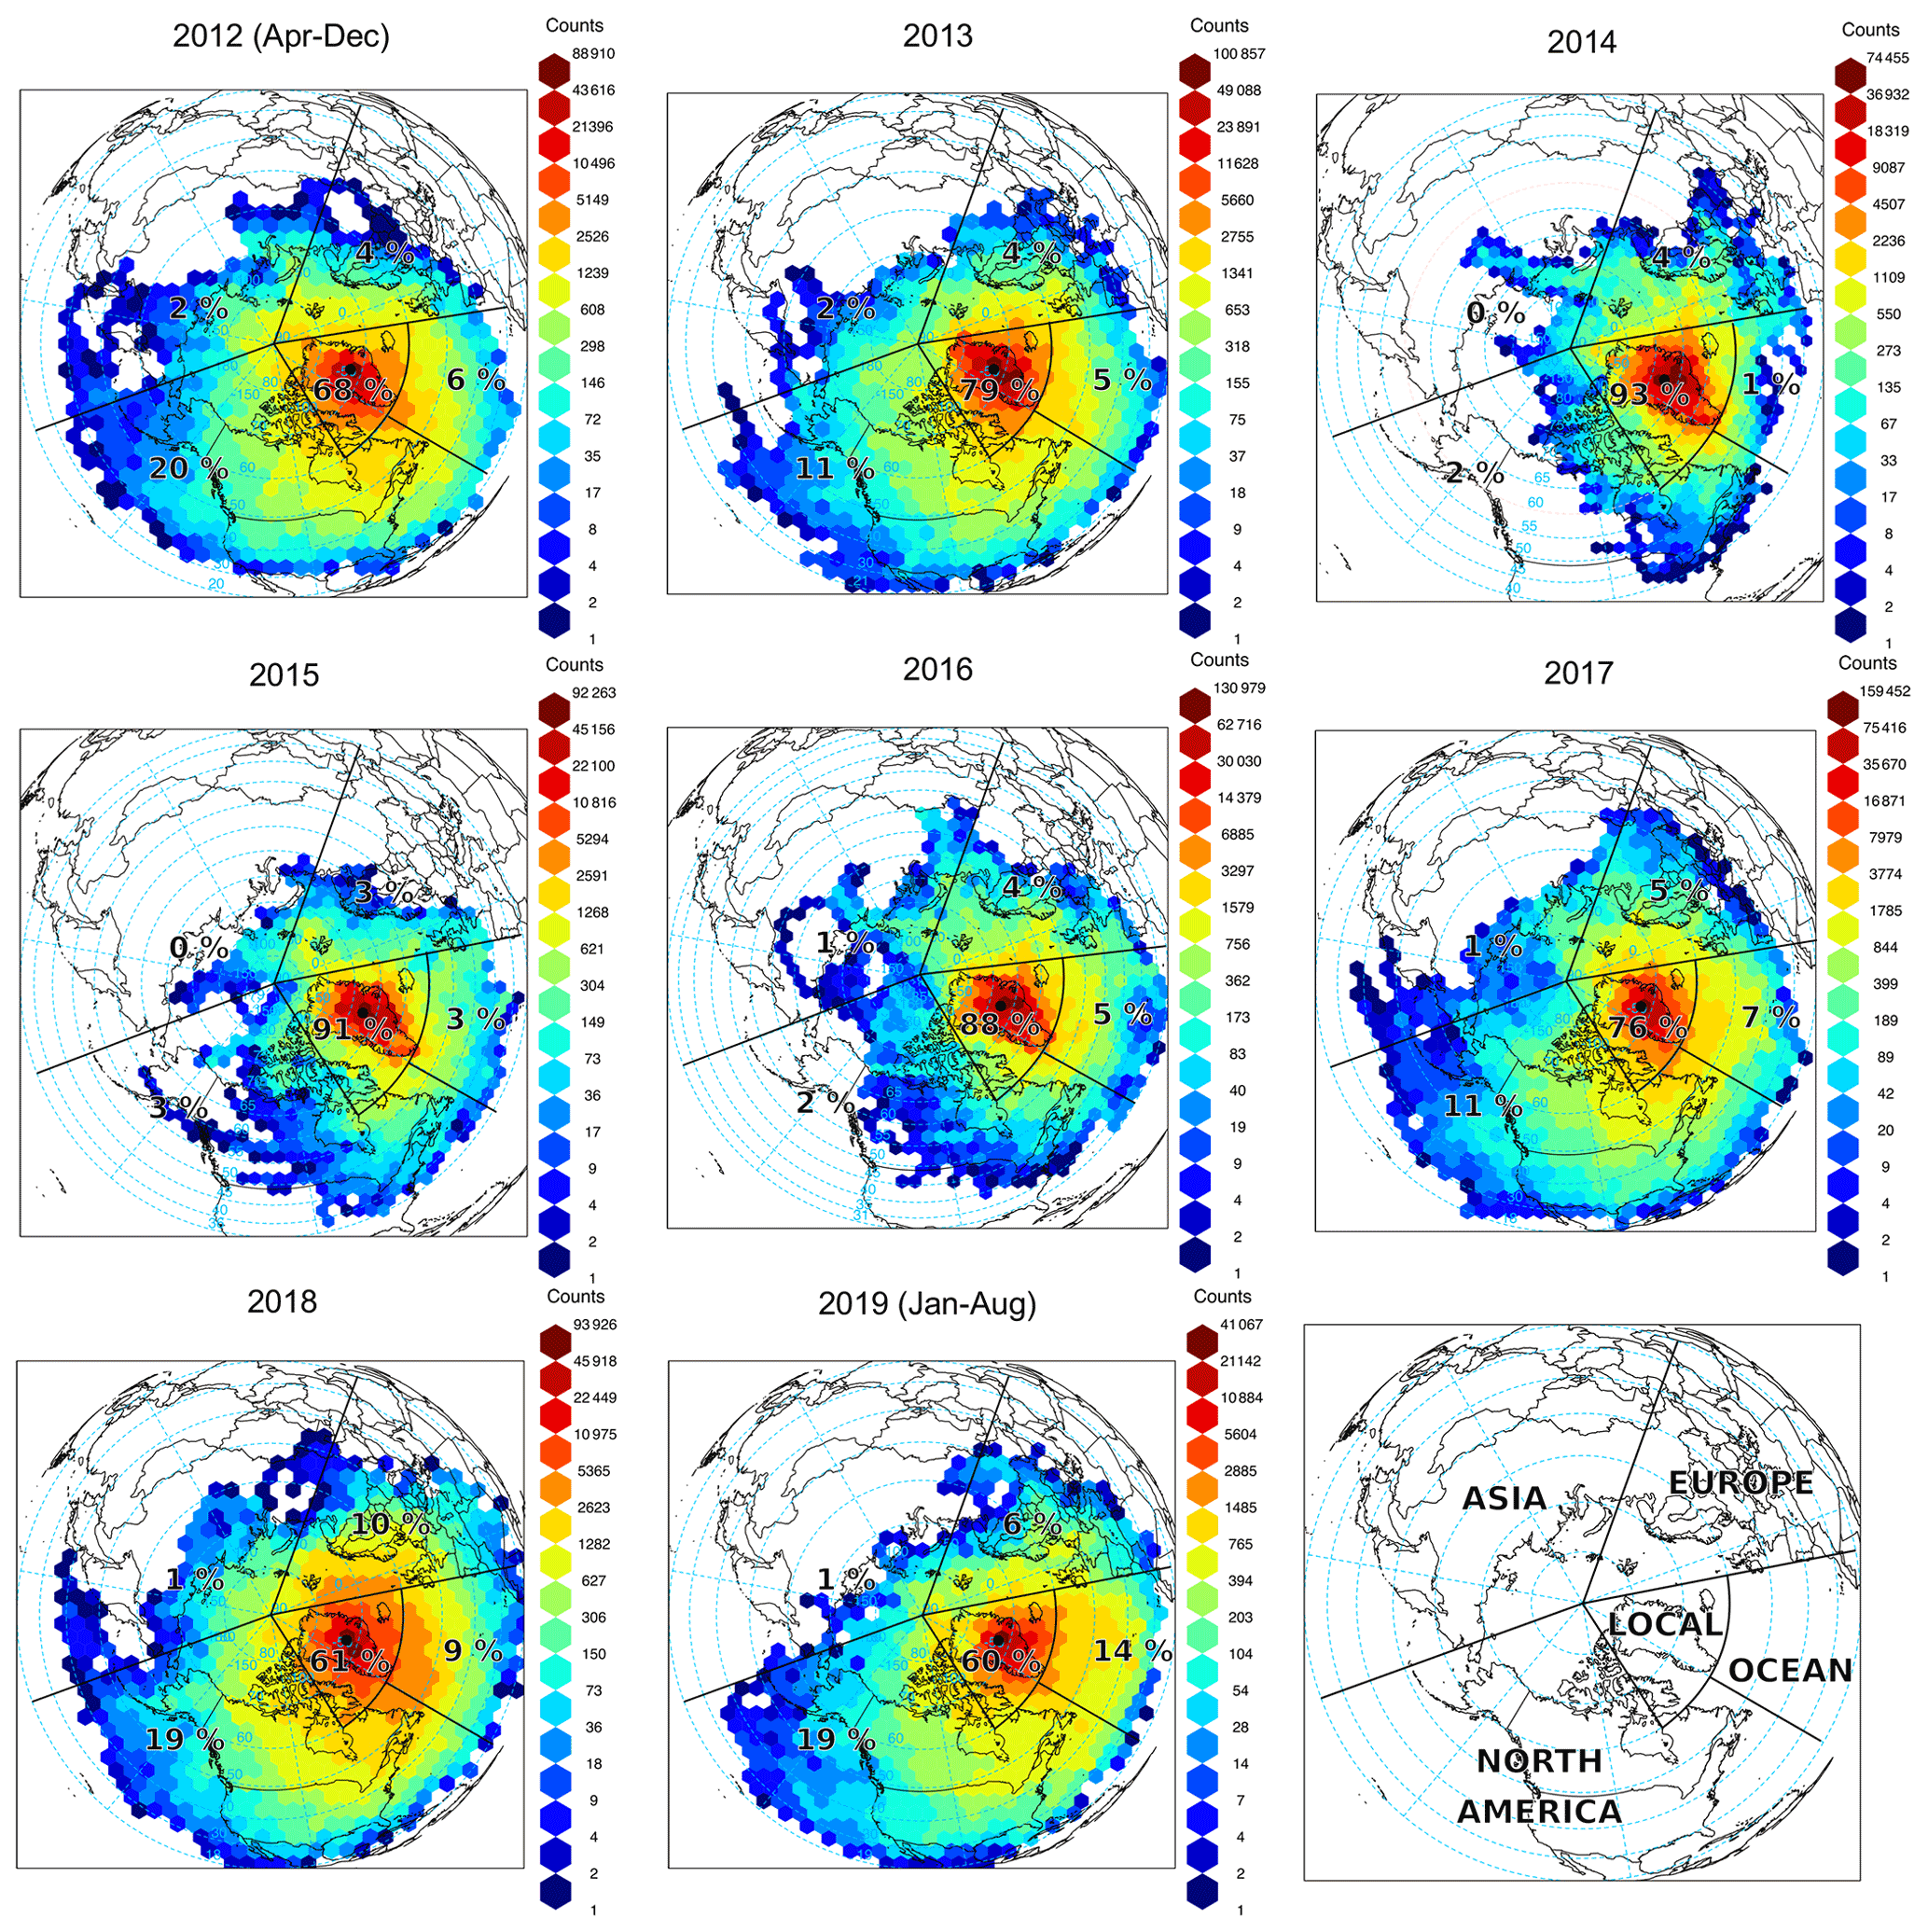
Figure 5Origin of air masses influencing GEOSummit (black dot). Gridded back-trajectory frequencies using an orthogonal map projection (centered over the North Pole) with hexagonal binning. The tiles represent the number of incidences and the numbers the relative influence of the various sectors.
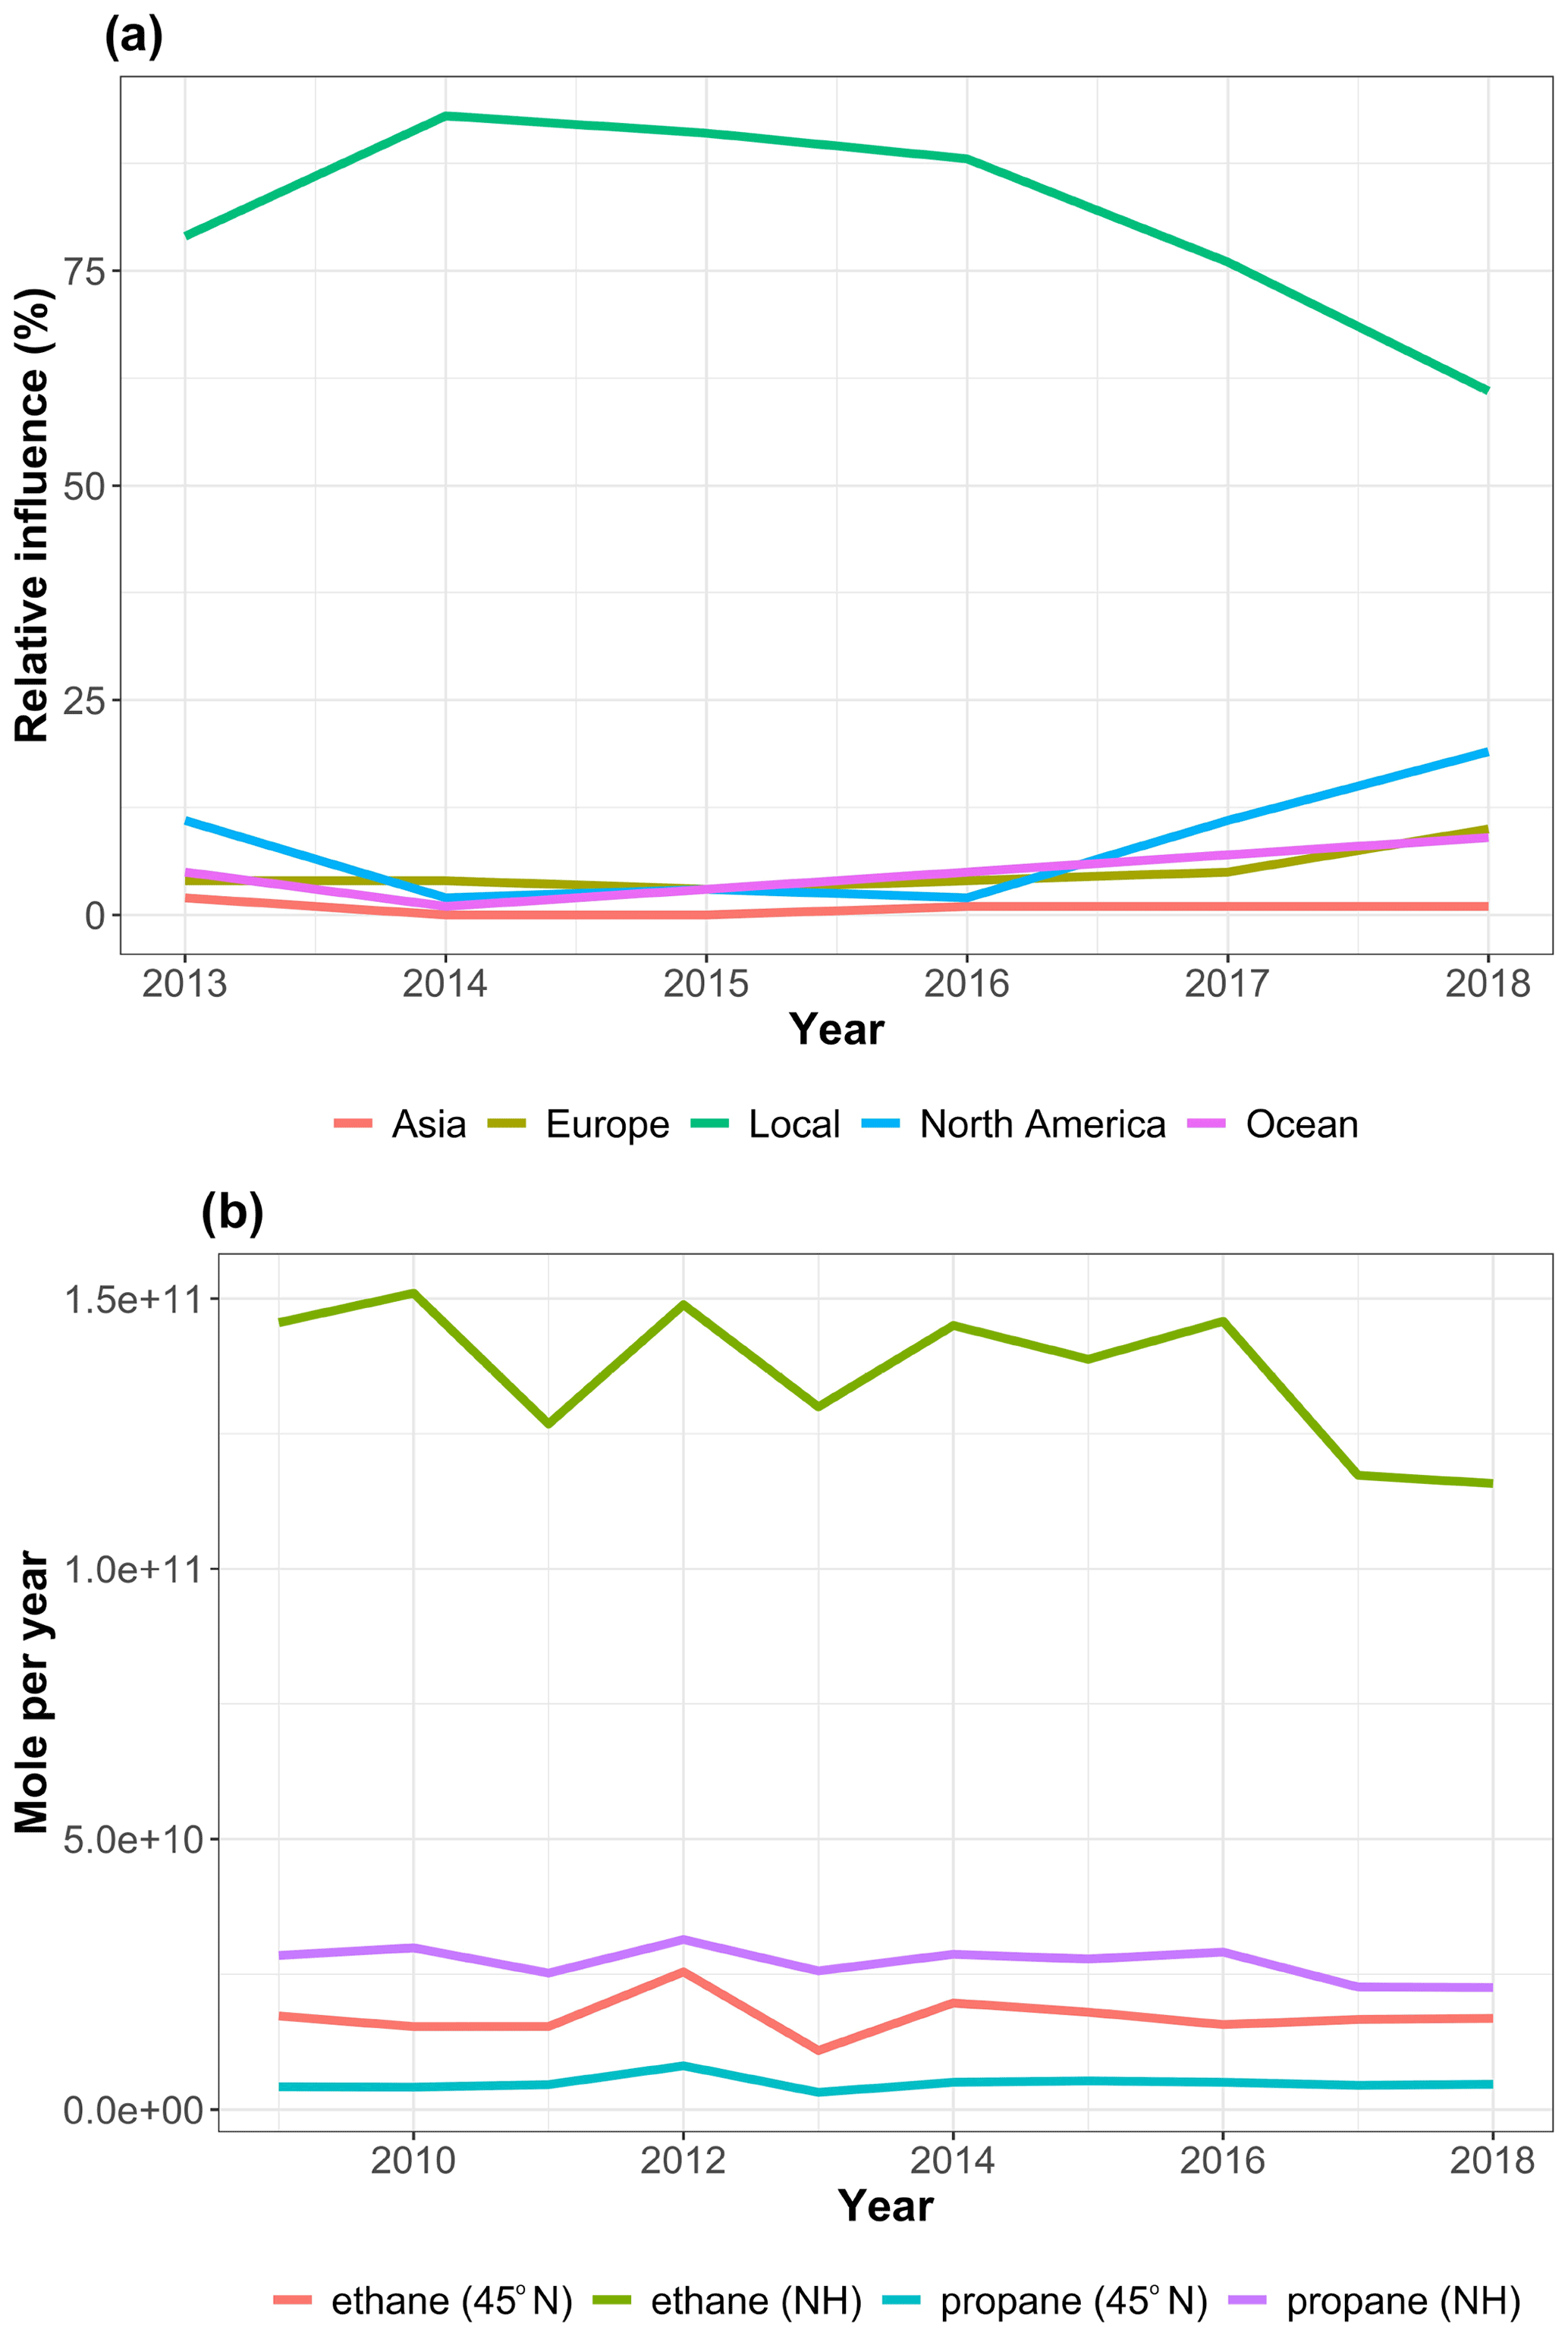
Figure 6(a) Annual relative contribution of different geographical sectors to air masses influencing GEOSummit according to the HYSPLIT back-trajectory analysis. (b) Annual biomass burning emissions (in moles per year) from all open burning north of 45∘ N and north of the Equator (Northern Hemisphere, NH) according to the Fire INventory from NCAR (FINNv2.2) emission estimates (MODIS only).
The relative contribution of local/regional air masses (i.e., around Greenland, see Fig. 5) increased from 79 % in 2012 to 91 %–93 % in 2014–2015, before gradually dropping to 61 % in 2018. The apparent correlation between the relative contribution of local/regional air masses and the ethane and propane trend raises the question of whether these are connected. In order to identify potential sources in this sector, we performed a PSCF analysis to investigate source–receptor relationships (e.g., Pekney et al., 2006; Perrone et al., 2018; Yu et al., 2015; Zhou et al., 2018; Zong et al., 2018). The PSCF calculates the probability that a source is located at latitude i and longitude j (Pekney et al., 2006). Figure S3 shows the results of the PSCF analysis for ethane and propane residuals and shows no consistent pattern associated with elevated concentrations. In both winter and summer, the probability of an ethane or propane source from this analysis is low (<2 % on average).
The history of petroleum exploration activities on the Greenland continental shelf dates back to the 1970s (Arctic Oil & Gas Development: The Case of Greenland, 2020). More recently, Greenland's government announced the opening of three new offshore areas for exploration in November 2020 (Greenland Opens Offshore Areas for Drilling, 2020). Despite exploration drilling activities, there has never been any O&NG exploitation of Greenland resources (Arctic Oil & Gas Development: The Case of Greenland, 2020). Building on the above, the possibility of a significant local/regional source can be ruled out and so can the hypothesis that the pause in the growth of ethane and propane is driven by local/regional emissions. The last remaining hypothesis is that this pause is due to a change in emissions from any of the other source sectors, or a combination of them, or total NH emissions and associated change in baseline NH atmospheric levels. This hypothesis is tested in the following section using observations at other baseline sites.
3.4 Evidence for a hemispheric pattern
Table 1 summarizes the rate of change and 95 % confidence interval for 2010–2014 and 2015–2018 at Alert (ALT, Nunavut, Canada), Utqiaġvik (formerly Barrow; BRW, Alaska, USA), Cape Kumukahi (KUM, Hawaii, USA), Park Falls (LEF, Wisconsin, USA), and Mace Head (MHD, Ireland; see Fig. 1) where discrete samples were collected for the NOAA/GML CCGG and HATS cooperative networks. The ethane and propane time series at the various sites are shown in Figs. S4, S5, respectively. A clear reversal in interannual changes for ethane and propane mixing ratios is observed in 2015 at ALT, BRW, KUM, and LEF. These results support the observed changes at GEOSummit and indicate a hemispheric pattern, likely due to a change in northern hemispheric emissions, with a turning point around late 2014. Biomass burning and anthropogenic activities being the main emitters of NMHCs, we hereafter focus the discussion on these two sources.
3.4.1 Biomass burning
Occasional biomass burning plumes were observed at GEOSummit. For example, Fig. 7 shows the simultaneous increase in CO, ethane, propane, and benzene mixing ratios for a short number of days in July and August 2019. According to the Whole Atmosphere Community Climate Model (WACCM; Gettelman et al., 2019) CO forecast simulations, available at https://www.acom.ucar.edu/waccm/forecast/ (last access: 11 February 2021), these enhancements can be attributed to intense Siberian wildfires occurring at that time (Bondur et al., 2020). In good agreement with the WACCM simulations, emission ratios (amount of compound emitted divided by that of a reference compound) derived from these two plumes for ethane and propane (5.4–5.9 × 10⁻³ and 1.5–1.6 × 10⁻³ ppb ppb−1 of CO, respectively; see Fig. S6) are within the range of values reported for boreal forest and peat fires (Andreae, 2019).

Figure 7Time series of (a) carbon monoxide (CO), (b) propane, (c) ethane, and (d) benzene mixing ratios in ambient air at GEOSummit in July–August 2019. The two vertical red lines show the simultaneous enhancement of mixing ratios in two biomass burning plumes.
Despite the observation of occasional plumes at GEOSummit, the question remains of whether biomass burning could drive the observed hemispheric pause in the growth of atmospheric ethane and propane. For ethane, the sensitivity to biomass burning emissions from boreal fires is almost entirely balanced by the larger magnitude of emissions from non-boreal fires (Nicewonger et al., 2020). For propane, being shorter lived, the fire component over Greenland should be dominated by emissions from boreal fires. We thus investigated the interannual variability of biomass burning emissions from both all open burning north of 45∘ N (boreal fires) and north of the Equator (all NH fires). Figure 6b gives annual biomass burning emissions according to the Fire Inventory from NCAR (FINNv2.2) emission estimates driven by MODIS fire detections (Wiedinmyer et al., 2021). Emissions north of 45∘ N peaked in 2012, known for being an exceptional wildfire season in North America (e.g., Lassman et al., 2017; Val Martin et al., 2013). NH ethane and propane emissions slightly decreased in 2017 and 2018 but were fairly stable over the 2008–2016 time period. We did not find any significant correlation between annual biomass burning emissions and annually averaged mixing ratios (using either 2009–2018 or 2015–2018 data and using either all open burning north of 45∘ N or north of the Equator). The seasonal analysis of the correlation between ambient air mixing ratios and biomass burning emissions yielded similar results. This suggests that the observed pause in the growth of atmospheric ethane and propane is likely not driven by biomass burning emissions.
This conclusion is further supported by measurements during the aircraft mission ATom over the Pacific and Atlantic Oceans. Using ethane and propane data collected in the northern hemispheric (>20∘ N) remote free troposphere during the four ATom seasonal deployments (July–August 2016, January–February 2017, September–October 2018, and April–May 2018), we found a significant positive correlation of ethane and propane with tetrachloroethylene (R2=0.6, p value < 0.001) and a poor correlation with hydrogen cyanide (R2<0.1, p value < 0.001; see Fig. S7), used as tracers of anthropogenic and biomass burning emissions, respectively (Bourgeois et al., 2021). These results from the remote free troposphere confirm that atmospheric ethane and propane ambient air levels are mostly driven by anthropogenic activities rather than by biomass burning emissions, in line with results from other studies (e.g., Xiao et al., 2008).
3.4.2 O&NG activities
Discrete samples collected at northern hemispheric baseline sites show that the strongest change was observed at LEF, located downwind from the Bakken oil field in North Dakota (Gvakharia et al., 2017), with an increase of ethane mixing ratios of +167.7 [+157.5, +186.0] ppt yr−1 in 2010–2014 and a decrease of −247.8 [−312.2, −158.2] ppt yr−1 in 2015–2018 (see Table 1). This result, along with previous findings by Helmig et al. (2016) and Franco et al. (2015), supports the hypothesis that US O&NG emissions could play a major role in driving atmospheric ethane and propane concentrations in the NH. Here we further discuss this potential contribution to the observed hemispheric pause in the growth of atmospheric ethane and propane in 2015–2018.
The United States has experienced dramatic increases in O&NG production since 2005, underpinned by technological developments such as horizontal drilling and hydraulic fracturing (Caporin and Fontini, 2017; Feng et al., 2019). This shale revolution has transformed the United States into the world's top O&NG producer (Gong, 2020). Coincident with the shale gas boom, US production of natural gas liquids (ethane, propane, butane, iso-butane, and pentane) has significantly increased in the past decade from 0.6–0.7 ×10⁹ barrels in the 2000s to 1.1×10⁹ barrels in 2014 and close to 1.8×10⁹ barrels in 2019 (U.S. Field Production of Natural Gas Liquids, 2021). The main source of ethane and propane has been identified to be leakage during the production, processing, and transportation of natural gas (Tzompa-Sosa et al., 2019; Pétron et al., 2012; Roest and Schade, 2017).
Propane is extracted from natural gas stream and used as a heating fuel. As shown in Fig. 8, US propane field production temporarily plateaued from June 2014 to December 2016 (U.S. Field Production of Propane, 2021) due to a slowdown in natural gas production in response to low natural gas prices. As we consider recent changes in emissions, however, changes in emissions per unit of production must also be considered. A recent study in the Northeastern Colorado Denver–Julesburg Basin showed little change in atmospheric hydrocarbons, including propane, in 2008–2016 despite a 7-fold increase in oil production and a nearly tripling of natural gas production, suggesting a significant decrease in leak and/or venting rate per unit of production (Oltmans et al., 2021). While we cannot reliably estimate how propane emissions might have changed during this recent period, these two influences, combined together, could explain the observed temporary pause in the growth of atmospheric propane.
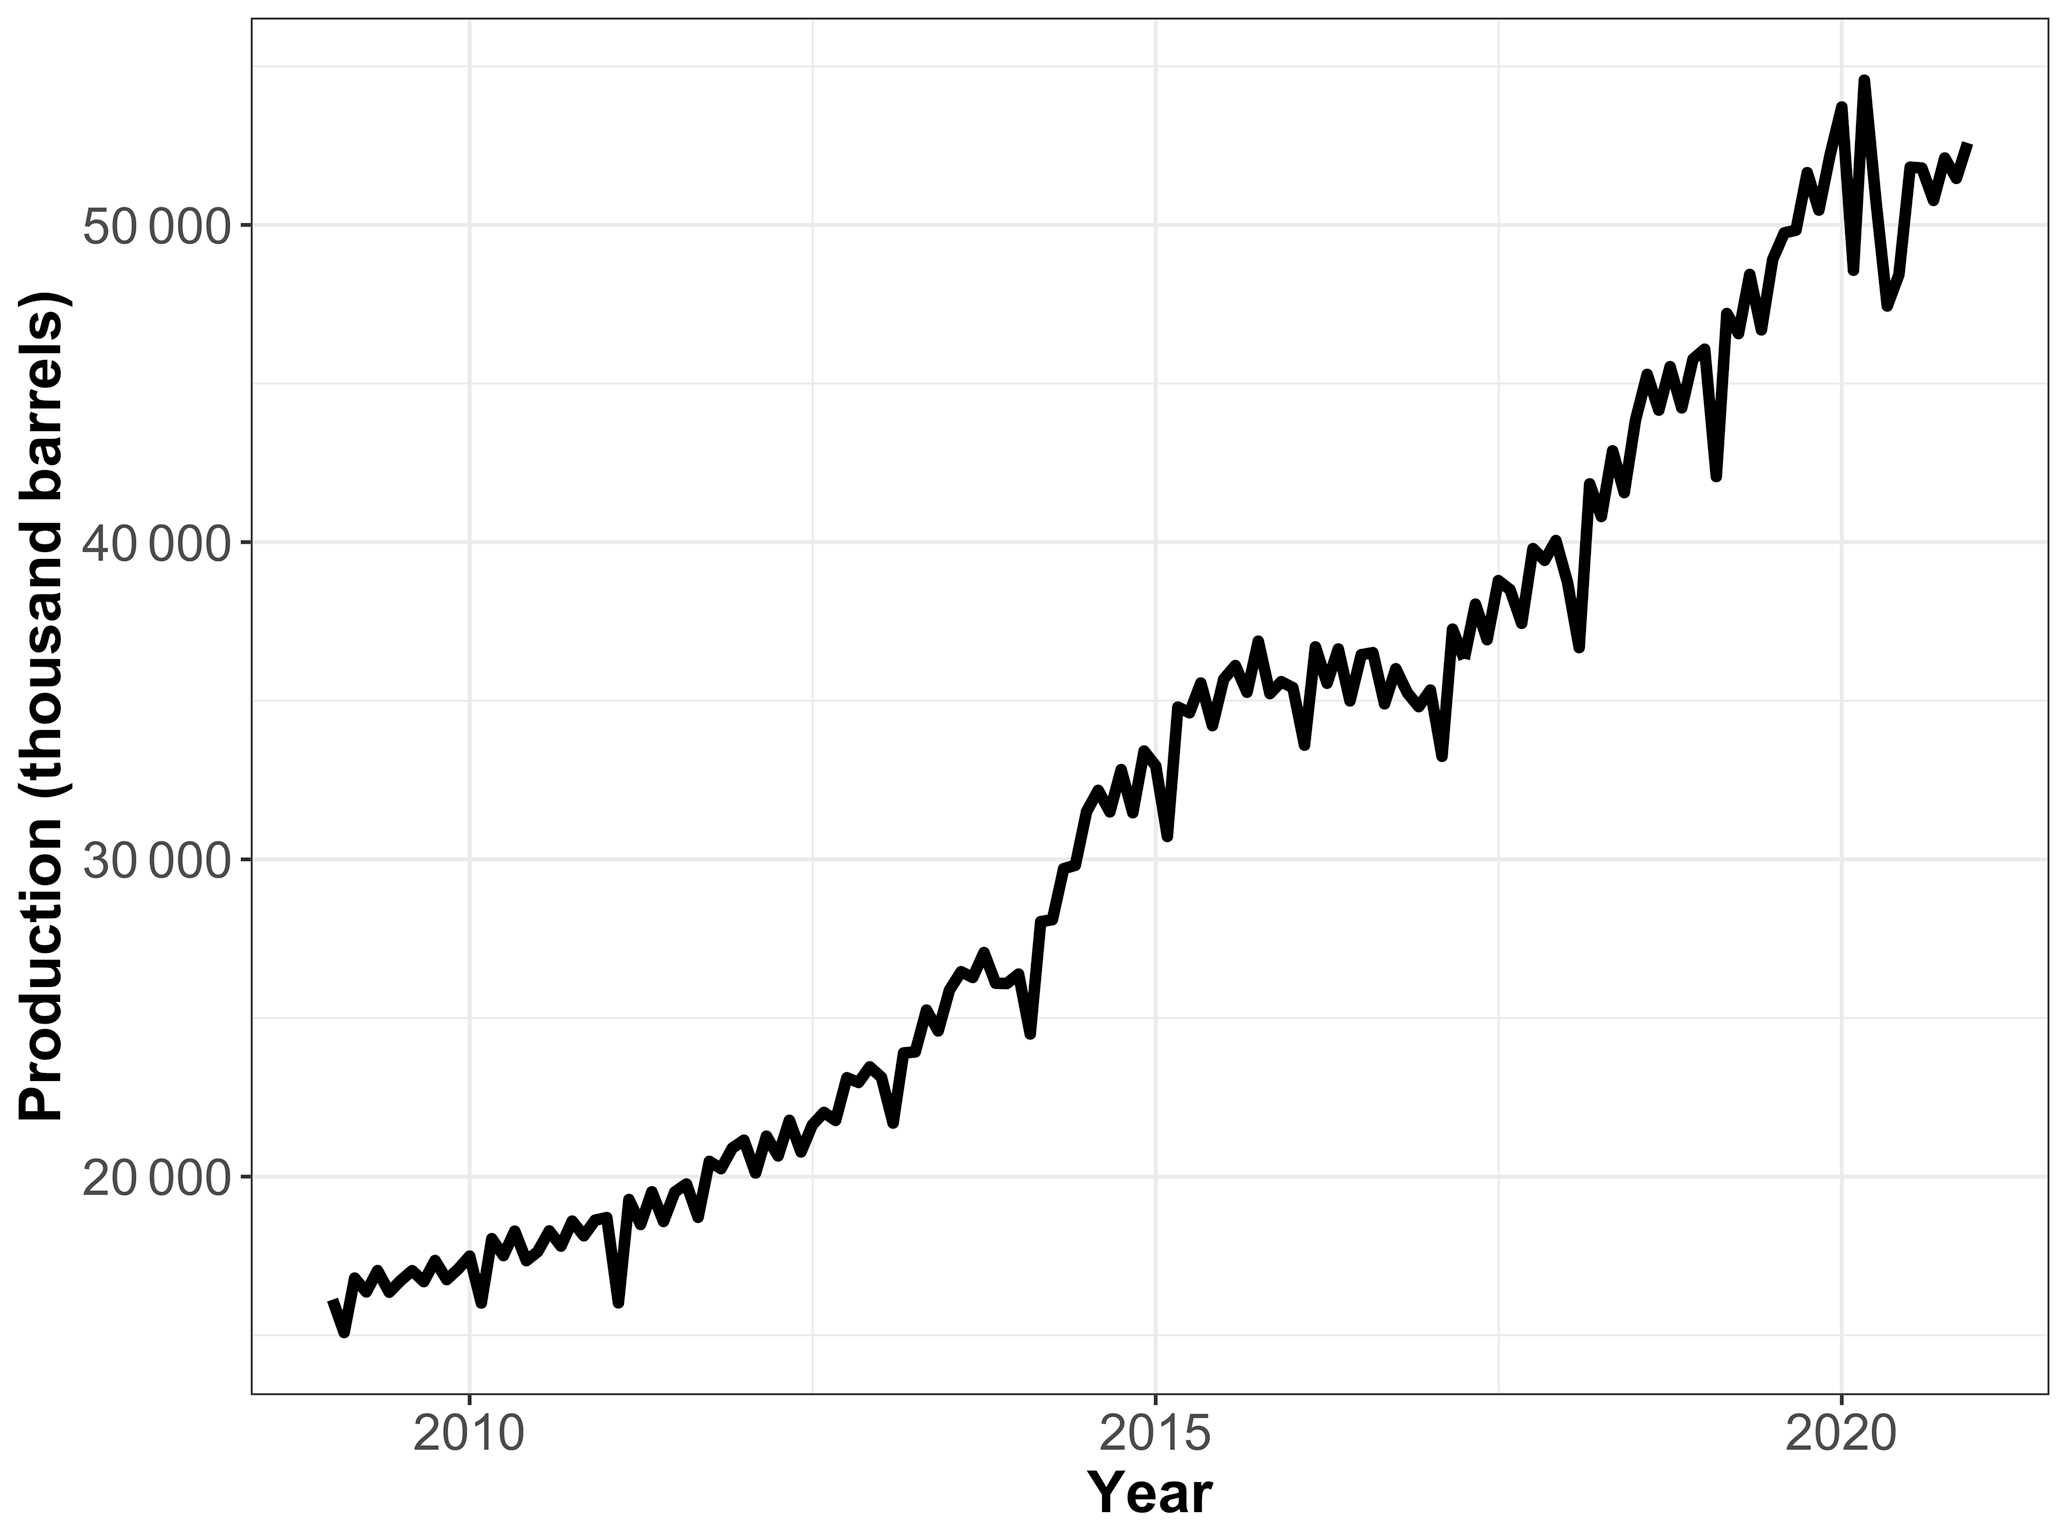
Figure 8US field production of propane in thousands of barrels per month. Data courtesy of the U.S. Energy Information Administration. The production plateaued from June 2014 to December 2016.
Estimating the total production, and ultimately emissions of ethane, is even more complex as it depends on the ethane-to-natural gas price differential. Ethane has long been considered an unwanted byproduct of O&NG drilling, much of it burned away in the natural gas stream or flared off at well sites. Today, ethane is a key feedstock for petrochemical manufacturing, and the United States is currently the world's top producer and exporter of ethane (Sicotte, 2020). Depending on the price of ethane relative to natural gas, ethane can be left in the natural gas stream and sold along with natural gas – a process known as ethane rejection – or separated at natural gas processing plants along with other natural gas liquids (such as propane). Assuming the same leak rates for ethane as for methane, 85 % of ethane emissions are due to natural gas extraction and processing, while processed natural gas transportation and use only represent 15 % of the natural gas supply chain ethane loss rate (Alvarez et al., 2018). The slowdown in natural gas production from June 2014 to December 2016 (see above) may thus have contributed to the atmospheric ethane plateauing. However, these estimates do not take into account emissions of ethane from its own supply chain (e.g., separation, storage, liquefaction for export, ethane cracker to produce ethylene and plastic resins) – for which leak rates remain unknown. A number of top-down studies, focusing on specific regions or time periods (e.g., 2010–2014), have shown that current inventories underestimate ethane emissions (e.g., Tzompa-Sosa et al., 2017; Pétron et al., 2014). The modeling study led by Dalsøren et al. (2018) focusing on the year 2011 claimed that fossil fuel emissions of ethane are likely biased low by a factor of 2–3. In this highly dynamic context, where ethane production and volume rejected continuously vary and where leak rates change over time (Schwietzke et al., 2014), there is a need for further hemispheric- or global-scale top-down studies focusing on the interannual variability of ethane emissions.
Ethane and propane are the most abundant atmospheric NMHCs, and they exert a strong influence on tropospheric ozone, a major air pollutant and greenhouse gas. Increasing levels have been reported in the literature from 2009 to 2014, with evidence pointing at US O&NG activities as the most likely cause (Kort et al., 2016; Helmig et al., 2016; Franco et al., 2016; Hausmann et al., 2016). The long-term high-resolution records of ambient air C2–C7 NMHCs at GEOSummit presented here confirm that atmospheric ethane and propane levels increased in the remote arctic troposphere from 2009 to 2015 but also reveal a pause in their growth in 2015–2018. Using independent discrete samples collected at other NH baseline sites, we show that this pause is observed throughout the Northern Hemisphere – suggesting a change in total NH emissions and in baseline NH atmospheric levels. We further investigated and discussed the contribution of the two main NMHC emitters: biomass burning and O&NG production. We did not find any correlation between atmospheric ethane and propane mixing ratios and the FINNv2.2 biomass burning emission estimates. Additionally, data collected in the NH remote free troposphere during the ATom aircraft campaign support that atmospheric ethane and propane ambient air levels are mostly driven by anthropogenic activities rather than by biomass burning emissions. The fact that the strongest rate of change reversal was observed at a site located downwind from the Bakken oil field in North Dakota tends to suggest that US O&NG activities yet again played a major role here. The slowdown in US natural gas production from June 2014 to December 2016 combined with a decrease in leak rate per unit of production could have contributed to the observed temporary pause. This conclusion is, however, tentative given the large uncertainties associated with emission estimates, especially with ethane emissions from its supply chain. We hope this work can be used as a starting point to understand what led to the pause in the growth of atmospheric ethane and propane in 2015–2018 and, more generally, to what extent ON&G activities could be responsible for variations in NH baseline ethane and propane levels.
All non-methane hydrocarbons and carbon monoxide in situ data used in this study are archived and publicly available on the Arctic Data Center database (https://doi.org/10.18739/A2FX73Z7B, Angot et al., 2020, and https://doi.org/10.18739/A2RS0X, Helmig, 2017). NOAA/GML HATS and CCGG discrete data are available at https://gml.noaa.gov/aftp/data/hats/PERSEUS/ (NOAA GML, 2021) and https://gml.noaa.gov/aftp/data/trace_gases/voc/ (Helmig et al., 2021), respectively.
The supplement related to this article is available online at: https://doi.org/10.5194/acp-21-15153-2021-supplement.
DH initiated the long-term monitoring effort at GEOSummit and secured funding over the years. JH designed and built the gas chromatograph with the flame ionization detector used for NMHC in situ monitoring and performed approximately biannual on-site visits for maintenance and calibration operations. CD, JC, and BB performed the in situ data processing (i.e., GC peak identification, peak integration, background subtraction, and calculation of mixing ratios). CD, JC, and HA analyzed the data under the supervision of CW and DH. GP helped evaluate the impact of ON&G activities on NMHC trends, while IB and CW helped evaluate the impact of biomass burning. IV, SAM, BRM, and JWE provided the NOAA/GML HATS discrete data. JH and DH provided the NOAA/GML CCGG NMHC discrete data with contributions from CD, JC, and BB. HA wrote the manuscript with contributions from all co-authors.
The contact author has declared that neither they nor their co-authors have any competing interests.
Publisher’s note: Copernicus Publications remains neutral with regard to jurisdictional claims in published maps and institutional affiliations.
We would like to thank the GEOSummit science technicians and CH2M HILL Polar Services for their tremendous support in enabling on-site and flask collections at the station. Hélène Angot, Jacques Hueber, and Detlev Helmig would like to acknowledge Maria Soledad Pazos, Miguel Orta Sanchez, and all students involved in the NMHC flask analysis at INSTAAR. Isaac Vimont, Stephen A. Montzka, and Ben R. Miller express thanks for the instrumental analysis assistance of Carolina Siso and Molly Crotwell and standards prepared and maintained by Brad Hall at the NOAA GML. We would also like to thank Donald Blake, Paul Wennberg, Michelle Kim, Hannah Allen, John Crounse, and Alex Teng for the ATom dataset used in this analysis.
The long-term observations and analysis efforts were supported by the US National Science Foundation (grant nos. 1108391 and 1822406) and the NASA ROSES program (grant no. NNX07AR26G). Hélène Angot also received financial support from the Swiss National Science Foundation (grant no. 200021_188478). Undergraduate students Connor Davel and Jashan Chopra received financial support from the University of Colorado Boulder's Undergraduate Research Opportunities Program (UROP; grant nos. 7245334 and 5269631, respectively). Support for most CIRES employees is from NOAA award no. NA17OAR4320101. ATom was funded by NASA ROSES-2013 NRA NNH13ZDA001N-EVS2.
This paper was edited by Andreas Engel and reviewed by Murat Aydin and one anonymous referee.
Allen, H. M., Crounse, J. D., Kim, M. J., Teng, A. P., and Wennberg, P. O.: Atmospheric Tomography Mission (ATom)ATom: L2 In Situ Data from Caltech Chemical Ionization Mass Spectrometer (CIT-CIMS), 79.481444 MB, ORNL DAAC (Oak Ridge National Laboratory Distributed Active Archive Center), https://doi.org/10.3334/ORNLDAAC/1713, 2019.
Alvarez, R. A., Zavala-Araiza, D., Lyon, D. R., Allen, D. T., Barkley, Z. R., Brandt, A. R., Davis, K. J., Herndon, S. C., Jacob, D. J., Karion, A., Kort, E. A., Lamb, B. K., Lauvaux, T., Maasakkers, J. D., Marchese, A. J., Omara, M., Pacala, S. W., Peischl, J., Robinson, A. L., Shepson, P. B., Sweeney, C., Townsend-Small, A., Wofsy, S. C., and Hamburg, S. P.: Assessment of methane emissions from the U.S. oil and gas supply chain, Science, 361, 186–188, https://doi.org/10.1126/science.aar7204, 2018.
Andreae, M. O.: Emission of trace gases and aerosols from biomass burning – an updated assessment, Atmos. Chem. Phys., 19, 8523–8546, https://doi.org/10.5194/acp-19-8523-2019, 2019.
Angot, H., Helmig, D., Hueber, J., Chopra, J., Davel, C., and Wiedinmyer, C.: Atmospheric tracers for Arctic wildfires, air pollution, atmospheric chemistry, and climate change at GEOSummit, Greenland, since 2018, Arctic Data Center [data set] https://doi.org/10.18739/A2FX73Z7B, 2020.
Arctic Oil & Gas Development: The Case of Greenland, available at: https://arcticyearbook.com/arctic-yearbook/2018/2018-scholarly-papers/285-arctic-oil-gas-development-the-case-of-greenland, last access: 25 November 2020.
Aydin, M., Verhulst, K. R., Saltzman, E. S., Battle, M. O., Montzka, S. A., Blake, D. R., Tang, Q., and Prather, M. J.: Recent decreases in fossil-fuel emissions of ethane and methane derived from firn air, Nature, 476, 198–201, https://doi.org/10.1038/nature10352, 2011.
Barletta, B., Biggs, B. C., Blake, D. R., Blake, N., Hoffman, A., Hughes, S., Meinardi, S., Vizenor, N., and Woods, C. T.: ATom: L2 Halocarbons and Hydrocarbons from the UC-Irvine Whole Air Sampler (WAS), ORNL DAAC (Oak Ridge National Laboratory Distributed Active Archive Center), https://doi.org/10.3334/ORNLDAAC/1751, 2020.
Barrie, L. A., Gregor, D., Hargrave, B., Lake, R., Muir, D., Shearer, R., Tracey, B., and Bidleman, T.: Arctic contaminants: sources, occurrence and pathways, Sci. Total Environ., 122, 1–74, https://doi.org/10.1016/0048-9697(92)90245-N, 1992.
Becker, S., Halsall, C. J., Tych, W., Kallenborn, R., Su, Y., and Hung, H.: Long-term trends in atmospheric concentrations of α and γ HCH in the Arctic provide insight into the effects of legislation and climatic fluctuations on contaminant levels, Atmos. Environ., 42, 8225–8233, https://doi.org/10.1016/j.atmosenv.2008.07.058, 2008.
Bondur, V. G., Mokhov, I. I., Voronova, O. S., and Sitnov, S. A.: Satellite Monitoring of Siberian Wildfires and Their Effects: Features of 2019 Anomalies and Trends of 20 Year Changes, Dokl. Earth Sc., 492, 370–375, https://doi.org/10.1134/S1028334X20050049, 2020.
Bourgeois, I., Peischl, J., Neuman, A., Brown, S., Thompson, C., Aikin, K. C., Allen, H. M., Angot, H., Apel, E. C., Baublitz, C. B., Brewer, J., Campuzano-Jost, P., Commane, R., Crounse, J. D., Daube, B. C., DiGangi, J. P., Diskin, G. S., Emmons, L. K., Fiore, A. M., Gkatzelis, G. I., Hills, A., Hornbrook, R. S., Huey, L. G., Kim, M., Lacey, F., McKain, L. T., Nault, B. A., Parrish, D. D., Ray, E., Sweeney, C., Tanner, D., Wofsy, S. C., and Ryerson, T. B.: Large contribution of biomass burning emissions to ozone throughout the global remote trosposphere, P. Natl. Acad. Sci, in review, 2021.
Brenninkmeijer, C. A. M., Manning, M. R., Lowe, D. C., Wallace, G., Sparks, R. J., and Volz-Thomas, A.: Interhemispheric asymmetry in OH abundance inferred from measurements of atmospheric 14 CO, Nature, 356, 50–52, https://doi.org/10.1038/356050a0, 1992.
Caporin, M. and Fontini, F.: The long-run oil–natural gas price relationship and the shale gas revolution, Energ. Econ., 64, 511–519, https://doi.org/10.1016/j.eneco.2016.07.024, 2017.
Carslaw, D. and Ropkins, K.: openair – An R package for air quality data analysis, Environ. Modell. Softw., 27–28, 52–61, https://doi.org/10.1016/j.envsoft.2011.09.008, 2012.
Chameides, W. L. and Cicerone, R. J.: Effects of nonmethane hydrocarbons in the atmosphere, 83, 947–952, https://doi.org/10.1029/JC083iC02p00947, 1978.
Dalsøren, S. B., Myhre, G., Hodnebrog, Ø., Myhre, C. L., Stohl, A., Pisso, I., Schwietzke, S., Höglund-Isaksson, L., Helmig, D., Reimann, S., Sauvage, S., Schmidbauer, N., Read, K. A., Carpenter, L. J., Lewis, A. C., Punjabi, S., and Wallasch, M.: Discrepancy between simulated and observed ethane and propane levels explained by underestimated fossil emissions, Nature Geosci., 11, 178–184, https://doi.org/10.1038/s41561-018-0073-0, 2018.
Dlugokencky, E. J., Steele, L. P., Lang, P. M., and Masarie, K. A.: The growth rate and distribution of atmospheric methane, J. Geophys. Res.-Atmos., 99, 17021–17043, https://doi.org/10.1029/94JD01245, 1994.
Dlugokencky, E. J., Masarie, K. A., Tans, P. P., Conway, T. J., and Xiong, X.: Is the amplitude of the methane seasonal cycle changing?, Atmos. Environ., 31, 21–26, https://doi.org/10.1016/S1352-2310(96)00174-4, 1997.
Draxler, R. R. and Rolph, G. D.: HYSPLIT (HYbrid Single-Particle Lagrangian Integrated Trajectory) Model access via NOAA ARL READY Website, available at: http://www.arl.noaa.gov/HYSPLIT.php (last access: 24 October 2015), NOAA Air Resources Laboratory, College Park, MD, 2013.
Duncan, B. N. and Bey, I.: A modeling study of the export pathways of pollution from Europe: Seasonal and interannual variations (1987–1997), J. Geophys. Res.-Atmos., 109, D08301, https://doi.org/10.1029/2003JD004079, 2004.
Eckhardt, S., Stohl, A., Beirle, S., Spichtinger, N., James, P., Forster, C., Junker, C., Wagner, T., Platt, U., and Jennings, S. G.: The North Atlantic Oscillation controls air pollution transport to the Arctic, Atmos. Chem. Phys., 3, 1769–1778, https://doi.org/10.5194/acp-3-1769-2003, 2003.
Feng, G.-F., Wang, Q.-J., Chu, Y., Wen, J., and Chang, C.-P.: Does the shale gas boom change the natural gas price-production relationship? Evidence from the U.S. market, Energ. Econ., 93, 104327, https://doi.org/10.1016/j.eneco.2019.03.001, 2019.
Franco, B., Bader, W., Toon, G. C., Bray, C., Perrin, A., Fischer, E. V., Sudo, K., Boone, C. D., Bovy, B., Lejeune, B., Servais, C., and Mahieu, E.: Retrieval of ethane from ground-based FTIR solar spectra using improved spectroscopy: Recent burden increase above Jungfraujoch, J. Quant. Spectrosc. Ra., 160, 36–49, https://doi.org/10.1016/j.jqsrt.2015.03.017, 2015.
Franco, B., Mahieu, E., Emmons, L. K., Tzompa-Sosa, Z. A., Fischer, E. V., Sudo, K., Bovy, B., Conway, S., Griffin, D., Hannigan, J. W., Strong, K., and Walker, K. A.: Evaluating ethane and methane emissions associated with the development of oil and natural gas extraction in North America, Environ. Res. Lett., 11, 044010, https://doi.org/10.1088/1748-9326/11/4/044010, 2016.
G2401 Gas Concentration Analyzer | Picarro: https://www.picarro.com/products/g2401_gas_concentration_analyzer, last access: 31 March 2020.
Geller, L. S., Elkins, J. W., Lobert, J. M., Clarke, A. D., Hurst, D. F., Butler, J. H., and Myers, R. C.: Tropospheric SF6: Observed latitudinal distribution and trends, derived emissions and interhemispheric exchange time, Geophys. Res. Lett., 24, 675–678, https://doi.org/10.1029/97GL00523, 1997.
Gettelman, A., Mills, M. J., Kinnison, D. E., Garcia, R. R., Smith, A. K., Marsh, D. R., Tilmes, S., Vitt, F., Bardeen, C. G., McInerny, J., Liu, H.-L., Solomon, S. C., Polvani, L. M., Emmons, L. K., Lamarque, J.-F., Richter, J. H., Glanville, A. S., Bacmeister, J. T., Phillips, A. S., Neale, R. B., Simpson, I. R., DuVivier, A. K., Hodzic, A., and Randel, W. J.: The Whole Atmosphere Community Climate Model Version 6 (WACCM6), J. Geophys. Res.-Atmos., 124, 12380–12403, https://doi.org/10.1029/2019JD030943, 2019.
Goldstein, A. H., Wofsy, S. C., and Spivakovsky, C. M.: Seasonal variations of nonmethane hydrocarbons in rural New England: Constraints on OH concentrations in northern midlatitudes, J. Geophys. Res.-Atmos., 100, 21023–21033, https://doi.org/10.1029/95JD02034, 1995.
Gong, B.: The Development and Implication of Nature Gas Market in the Context of the Shale Revolution, in: Shale Energy Revolution: The Rise and Fall of Global Oil and Gas Industry, edited by: Gong, B., Springer, Singapore, 19–36, https://doi.org/10.1007/978-981-15-4855-0_2, 2020.
Greenland Opens Offshore Areas for Drilling: https://www.rigzone.com/news/greenland_opens_offshore_areas_for_drilling-05-nov-2020-163772-article/, last access: 25 November 2020.
Guenther, A. B., Jiang, X., Heald, C. L., Sakulyanontvittaya, T., Duhl, T., Emmons, L. K., and Wang, X.: The Model of Emissions of Gases and Aerosols from Nature version 2.1 (MEGAN2.1): an extended and updated framework for modeling biogenic emissions, Geosci. Model Dev., 5, 1471–1492, https://doi.org/10.5194/gmd-5-1471-2012, 2012.
Gvakharia, A., Kort, E. A., Brandt, A., Peischl, J., Ryerson, T. B., Schwarz, J. P., Smith, M. L., and Sweeney, C.: Methane, Black Carbon, and Ethane Emissions from Natural Gas Flares in the Bakken Shale, North Dakota, Environ. Sci. Technol., 51, 5317–5325, https://doi.org/10.1021/acs.est.6b05183, 2017.
Hartery, S., Commane, R., Lindaas, J., Sweeney, C., Henderson, J., Mountain, M., Steiner, N., McDonald, K., Dinardo, S. J., Miller, C. E., Wofsy, S. C., and Chang, R. Y.-W.: Estimating regional-scale methane flux and budgets using CARVE aircraft measurements over Alaska, Atmos. Chem. Phys., 18, 185–202, https://doi.org/10.5194/acp-18-185-2018, 2018.
Hausmann, P., Sussmann, R., and Smale, D.: Contribution of oil and natural gas production to renewed increase in atmospheric methane (2007–2014): top-down estimate from ethane and methane column observations, Atmos. Chem. Phys., 16, 3227–3244, https://doi.org/10.5194/acp-16-3227-2016, 2016.
Helmig, D.: Atmospheric hydrocarbons as tracers for climate change, air transport, and oxidation chemistry in the Arctic, GEOSummit, Greenland, 2008–2017, Arctic Data Center [data set], https://doi.org/10.18739/A2RS0X, 2017.
Helmig, D., Bottenheim, J., Galbally, I. E., Lewis, A., Milton, M. J. T., Penkett, S., Plass-Duelmer, C., Reimann, S., Tans, P., and Thiel, S.: Volatile Organic Compounds in the Global Atmosphere, EOS, 90, 513–514, https://doi.org/10.1029/2009EO520001, 2009.
Helmig, D., Petrenko, V., Martinerie, P., Witrant, E., Röckmann, T., Zuiderweg, A., Holzinger, R., Hueber, J., Thompson, C., White, J. W. C., Sturges, W., Baker, A., Blunier, T., Etheridge, D., Rubino, M., and Tans, P.: Reconstruction of Northern Hemisphere 1950–2010 atmospheric non-methane hydrocarbons, Atmos. Chem. Phys., 14, 1463–1483, https://doi.org/10.5194/acp-14-1463-2014, 2014.
Helmig, D., Rossabi, S., Hueber, J., Tans, P., Montzka, S. A., Masarie, K., Thoning, K., Plass-Duelmer, C., Claude, A., Carpenter, L. J., Lewis, A. C., Punjabi, S., Reimann, S., Vollmer, M. K., Steinbrecher, R., Hannigan, J. W., Emmons, L. K., Mahieu, E., Franco, B., Smale, D., and Pozzer, A.: Reversal of global atmospheric ethane and propane trends largely due to US oil and natural gas production, Nature Geosci., 9, 490–495, https://doi.org/10.1038/ngeo2721, 2016.
Helmig, D., Hueber, J., and Tans, P.: University Of Colorado Institute Of Arctic And Alpine Research (INSTAAR), & NOAA GML CCGG Group, University of Colorado Institute of Arctic and Alpine Research (INSTAAR) Flask-Air Sample Measurements of Atmospheric Non Methane Hydrocarbons Mole Fractions from the NOAA GML Carbon Cycle Surface Network at Global and Regional Background Sites, 2004–2016 (Version 2021.05.04), NOAA Global Monitoring Laboratory [data set], https://doi.org/10.15138/6AV8-GS57, 2021.
Hirdman, D., Sodemann, H., Eckhardt, S., Burkhart, J. F., Jefferson, A., Mefford, T., Quinn, P. K., Sharma, S., Ström, J., and Stohl, A.: Source identification of short-lived air pollutants in the Arctic using statistical analysis of measurement data and particle dispersion model output, Atmos. Chem. Phys., 10, 669–693, https://doi.org/10.5194/acp-10-669-2010, 2010.
Houweling, S., Dentener, F., and Lelieveld, J.: The impact of nonmethane hydrocarbon compounds on tropospheric photochemistry, J. Geophys. Res.-Atmos., 103, 10673–10696, https://doi.org/10.1029/97JD03582, 1998.
Hu, Q. and Feng, S.: Influence of the Arctic oscillation on central United States summer rainfall, J. Geophys. Res.-Atmos., 115, D01102, https://doi.org/10.1029/2009JD011805, 2010.
Iversen, T. and Joranger, E.: Arctic air pollution and large scale atmospheric flows, Atmos. Environ. (1967), 19, 2099–2108, https://doi.org/10.1016/0004-6981(85)90117-9, 1985.
Jacob, D. J., Crawford, J. H., Maring, H., Clarke, A. D., Dibb, J. E., Emmons, L. K., Ferrare, R. A., Hostetler, C. A., Russell, P. B., Singh, H. B., Thompson, A. M., Shaw, G. E., McCauley, E., Pederson, J. R., and Fisher, J. A.: The Arctic Research of the Composition of the Troposphere from Aircraft and Satellites (ARCTAS) mission: design, execution, and first results, Atmos. Chem. Phys., 10, 5191–5212, https://doi.org/10.5194/acp-10-5191-2010, 2010.
Janssens-Maenhout, G., Crippa, M., Guizzardi, D., Dentener, F., Muntean, M., Pouliot, G., Keating, T., Zhang, Q., Kurokawa, J., Wankmüller, R., Denier van der Gon, H., Kuenen, J. J. P., Klimont, Z., Frost, G., Darras, S., Koffi, B., and Li, M.: HTAP_v 2.2: a mosaic of regional and global emission grid maps for 2008 and 2010 to study hemispheric transport of air pollution, Atmos. Chem. Phys., 15, 11411–11432, https://doi.org/10.5194/acp-15-11411-2015, 2015.
Kahl, J. D. W., Martinez, D. A., Kuhns, H., Davidson, C. I., Jaffrezo, J.-L., and Harris, J. M.: Air mass trajectories to Summit, Greenland: A 44-year climatology and some episodic events, J. Geophys. Res.-Oceans, 102, 26861–26875, https://doi.org/10.1029/97JC00296, 1997.
Komhyr, W. D., Gammon, R. H., Harris, T. B., Waterman, L. S., Conway, T. J., Taylor, W. R., and Thoning, K. W.: Global atmospheric CO2 distribution and variations from 1968–1982 NOAA/GMCC CO2 flask sample data, J. Geophys. Res.-Atmos., 90, 5567–5596, https://doi.org/10.1029/JD090iD03p05567, 1985.
Kort, E. A., Smith, M. L., Murray, L. T., Gvakharia, A., Brandt, A. R., Peischl, J., Ryerson, T. B., Sweeney, C., and Travis, K.: Fugitive emissions from the Bakken shale illustrate role of shale production in global ethane shift, Geophys. Res. Lett., 43, 4617–4623, https://doi.org/10.1002/2016GL068703, 2016.
Kramer, L. J., Helmig, D., Burkhart, J. F., Stohl, A., Oltmans, S., and Honrath, R. E.: Seasonal variability of atmospheric nitrogen oxides and non-methane hydrocarbons at the GEOSummit station, Greenland, Atmos. Chem. Phys., 15, 6827–6849, https://doi.org/10.5194/acp-15-6827-2015, 2015.
Lassman, W., Ford, B., Gan, R. W., Pfister, G., Magzamen, S., Fischer, E. V., and Pierce, J. R.: Spatial and temporal estimates of population exposure to wildfire smoke during the Washington state 2012 wildfire season using blended model, satellite, and in situ data, GeoHealth, 1, 106–121, https://doi.org/10.1002/2017GH000049, 2017.
Law, K. S., Stohl, A., Quinn, P. K., Brock, C., Burkhart, J., Paris, J.-D., Ancellet, G., Singh, H. B., Roiger, A., Schlager, H., Dibb, J., Jacob, D. J., Arnold, S. R., Pelon, J., and Thomas, J. L.: Arctic Air Pollution: New Insights from POLARCAT-IPY, B. Am. Meteorol. Soc., 95, 1873–1895, https://doi.org/10.1175/BAMS-D-13-00017.1, 2014.
Lelieveld, J., Dentener, F. J., Peters, W., and Krol, M. C.: On the role of hydroxyl radicals in the self-cleansing capacity of the troposphere, Atmos. Chem. Phys., 4, 2337–2344, https://doi.org/10.5194/acp-4-2337-2004, 2004.
Levy, H.: Normal Atmosphere: Large Radical and Formaldehyde Concentrations Predicted, Science 173, 141–143, https://doi.org/10.1126/science.173.3992.141, 1971.
Logan, J. A., Prather, M. J., Wofsy, S. C., and McElroy, M. B.: Tropospheric chemistry: A global perspective, J. Geophys. Res.-Oceans, 86, 7210–7254, https://doi.org/10.1029/JC086iC08p07210, 1981.
Masarie, K. A. and Tans, P. P.: Extension and integration of atmospheric carbon dioxide data into a globally consistent measurement record, 100, J. Geophys. Res.-Atmos., 11593–11610, https://doi.org/10.1029/95JD00859, 1995.
Miller, B. R., Weiss, R. F., Salameh, P. K., Tanhua, T., Greally, B. R., Mühle, J., and Simmonds, P. G.: Medusa: A Sample Preconcentration and GC/MS Detector System for in Situ Measurements of Atmospheric Trace Halocarbons, Hydrocarbons, and Sulfur Compounds, Anal. Chem., 80, 1536–1545, https://doi.org/10.1021/ac702084k, 2008.
Miller, J. B., Mack, K. A., Dissly, R., White, J. W. C., Dlugokencky, E. J., and Tans, P. P.: Development of analytical methods and measurements of 13C/12C in atmospheric CH4 from the NOAA Climate Monitoring and Diagnostics Laboratory Global Air Sampling Network, J. Geophys. Res.-Atmos., 107, ACH 11-1–ACH 11-15, https://doi.org/10.1029/2001JD000630, 2002.
Montzka, S. A., Dutton, G. S., Yu, P., Ray, E., Portmann, R. W., Daniel, J. S., Kuijpers, L., Hall, B. D., Mondeel, D., Siso, C., Nance, J. D., Rigby, M., Manning, A. J., Hu, L., Moore, F., Miller, B. R., and Elkins, J. W.: An unexpected and persistent increase in global emissions of ozone-depleting CFC-11, Nature, 557, 413–417, https://doi.org/10.1038/s41586-018-0106-2, 2018.
Naik, V., Voulgarakis, A., Fiore, A. M., Horowitz, L. W., Lamarque, J.-F., Lin, M., Prather, M. J., Young, P. J., Bergmann, D., Cameron-Smith, P. J., Cionni, I., Collins, W. J., Dalsøren, S. B., Doherty, R., Eyring, V., Faluvegi, G., Folberth, G. A., Josse, B., Lee, Y. H., MacKenzie, I. A., Nagashima, T., van Noije, T. P. C., Plummer, D. A., Righi, M., Rumbold, S. T., Skeie, R., Shindell, D. T., Stevenson, D. S., Strode, S., Sudo, K., Szopa, S., and Zeng, G.: Preindustrial to present-day changes in tropospheric hydroxyl radical and methane lifetime from the Atmospheric Chemistry and Climate Model Intercomparison Project (ACCMIP), Atmos. Chem. Phys., 13, 5277–5298, https://doi.org/10.5194/acp-13-5277-2013, 2013.
Naus, S., Montzka, S. A., Patra, P. K., and Krol, M. C.: A three-dimensional-model inversion of methyl chloroform to constrain the atmospheric oxidative capacity, Atmos. Chem. Phys., 21, 4809–4824, https://doi.org/10.5194/acp-21-4809-2021, 2021.
Nicewonger, M. R., Aydin, M., Prather, M. J., and Saltzman, E. S.: Extracting a History of Global Fire Emissions for the Past Millennium From Ice Core Records of Acetylene, Ethane, and Methane, J. Geophys. Res.-Atmos., 125, e2020JD032932, https://doi.org/10.1029/2020JD032932, 2020.
Nisbet, E. G., Dlugokencky, E. J., and Bousquet, P.: Methane on the Rise – Again, Science, 343, 493–495, https://doi.org/10.1126/science.1247828, 2014.
Nisbet, E. G., Manning, M. R., Dlugokencky, E. J., Fisher, R. E., Lowry, D., Michel, S. E., Myhre, C. L., Platt, S. M., Allen, G., Bousquet, P., Brownlow, R., Cain, M., France, J. L., Hermansen, O., Hossaini, R., Jones, A. E., Levin, I., Manning, A. C., Myhre, G., Pyle, J. A., Vaughn, B. H., Warwick, N. J., and White, J. W. C.: Very Strong Atmospheric Methane Growth in the 4 Years 2014–2017: Implications for the Paris Agreement, Global Biogeochem. Cy., 33, 318–342, https://doi.org/10.1029/2018GB006009, 2019.
NOAA GML: Index of /aftp/data/hats/PERSEUS/, available at: https://gml.noaa.gov/aftp/data/hats/PERSEUS/, NOAA GML [data set], last access: 4 October 2021.
Octaviani, M., Stemmler, I., Lammel, G., and Graf, H. F.: Atmospheric Transport of Persistent Organic Pollutants to and from the Arctic under Present-Day and Future Climate, Environ. Sci. Technol., 49, 3593–3602, https://doi.org/10.1021/es505636g, 2015.
Oltmans, S. J., Cheadle, L. C., Helmig, D., Angot, H., Pétron, G., Montzka, S. A., Dlugokencky, E. J., Miller, B., Hall, B., Schnell, R. C., Kofler, J., Wolter, S., Crotwell, M., Siso, C., Tans, P., and Andrews, A.: Atmospheric oil and natural gas hydrocarbon trends in the Northern Colorado Front Range are notably smaller than inventory emissions reductions, Elementa: Science of the Anthropocene, 9, 00136, https://doi.org/10.1525/elementa.2020.00136, 2021.
Pekney, N. J., Davidson, C. I., Zhou, L., and Hopke, P. K.: Application of PSCF and CPF to PMF-Modeled Sources of PM2.5 in Pittsburgh, Aerosol Sci. Technol., 40, 952–961, https://doi.org/10.1080/02786820500543324, 2006.
Perrone, M. G., Vratolis, S., Georgieva, E., Török, S., Šega, K., Veleva, B., Osán, J., Bešlić, I., Kertész, Z., Pernigotti, D., Eleftheriadis, K., and Belis, C. A.: Sources and geographic origin of particulate matter in urban areas of the Danube macro-region: The cases of Zagreb (Croatia), Budapest (Hungary) and Sofia (Bulgaria), Sci. Total Environ., 619–620, 1515–1529, https://doi.org/10.1016/j.scitotenv.2017.11.092, 2018.
Pétron, G., Frost, G., Miller, B. R., Hirsch, A. I., Montzka, S. A., Karion, A., Trainer, M., Sweeney, C., Andrews, A. E., Miller, L., Kofler, J., Bar-Ilan, A., Dlugokencky, E. J., Patrick, L., Moore, C. T., Ryerson, T. B., Siso, C., Kolodzey, W., Lang, P. M., Conway, T., Novelli, P., Masarie, K., Hall, B., Guenther, D., Kitzis, D., Miller, J., Welsh, D., Wolfe, D., Neff, W., and Tans, P.: Hydrocarbon emissions characterization in the Colorado Front Range: A pilot study, J. Geophys. Res.-Atmos., 117, D04304, https://doi.org/10.1029/2011JD016360, 2012.
Pétron, G., Karion, A., Sweeney, C., Miller, B. R., Montzka, S. A., Frost, G. J., Trainer, M., Tans, P., Andrews, A., Kofler, J., Helmig, D., Guenther, D., Dlugokencky, E., Lang, P., Newberger, T., Wolter, S., Hall, B., Novelli, P., Brewer, A., Conley, S., Hardesty, M., Banta, R., White, A., Noone, D., Wolfe, D., and Schnell, R.: A new look at methane and nonmethane hydrocarbon emissions from oil and natural gas operations in the Colorado Denver-Julesburg Basin, J. Geophys. Res.-Atmos., 119, 6836–6852, https://doi.org/10.1002/2013JD021272, 2014.
Pollmann, J., Helmig, D., Hueber, J., Plass-Dülmer, C., and Tans, P.: Sampling, storage, and analysis of C2–C7 non-methane hydrocarbons from the US National Oceanic and Atmospheric Administration Cooperative Air Sampling Network glass flasks, J. Chromatogr. A, 1188, 75–87, https://doi.org/10.1016/j.chroma.2008.02.059, 2008.
Pozzer, A., Pollmann, J., Taraborrelli, D., Jöckel, P., Helmig, D., Tans, P., Hueber, J., and Lelieveld, J.: Observed and simulated global distribution and budget of atmospheric C2–C5 alkanes, Atmos. Chem. Phys., 10, 4403–4422, https://doi.org/10.5194/acp-10-4403-2010, 2010.
Rex, D. F.: Blocking Action in the Middle Troposphere and its Effect upon Regional Climate, Tellus, 2, 275–301, https://doi.org/10.1111/j.2153-3490.1950.tb00339.x, 1950.
Roest, G. and Schade, G.: Quantifying alkane emissions in the Eagle Ford Shale using boundary layer enhancement, Atmos. Chem. Phys., 17, 11163–11176, https://doi.org/10.5194/acp-17-11163-2017, 2017.
Rudolph, J.: The tropospheric distribution and budget of ethane, J. Geophys. Res.-Atmos., 100, 11369–11381, https://doi.org/10.1029/95JD00693, 1995.
Scanlon, J. T. and Willis, D. E.: Calculation of Flame Ionization Detector Relative Response Factors Using the Effective Carbon Number Concept, J. Chromatogr. Sci., 23, 333–340, https://doi.org/10.1093/chromsci/23.8.333, 1985.
Schultz, M. G., Akimoto, H., Bottenheim, J., Buchmann, B., Galbally, I. E., Gilge, S., Helmig, D., Koide, H., Lewis, A. C., Novelli, P. C., Dülmer, C. P.-, Ryerson, T. B., Steinbacher, M., Steinbrecher, R., Tarasova, O., Tørseth, K., Thouret, V., and Zellweger, C.: The Global Atmosphere Watch reactive gases measurement network, Elementa: Science of the Anthropocene, 3, 000067, https://doi.org/10.12952/journal.elementa.000067, 2015.
Sicotte, D. M.: From cheap ethane to a plastic planet: Regulating an industrial global production network, Energy Research & Social Science, 66, 101479, https://doi.org/10.1016/j.erss.2020.101479, 2020.
Simpson, I. J., Andersen, M. P. S., Meinardi, S., Bruhwiler, L., Blake, N. J., Helmig, D., Rowland, F. S., and Blake, D. R.: Long-term decline of global atmospheric ethane concentrations and implications for methane, Nature, 488, 490–494, https://doi.org/10.1038/nature11342, 2012.
Spivakovsky, C. M., Logan, J. A., Montzka, S. A., Balkanski, Y. J., Foreman-Fowler, M., Jones, D. B. A., Horowitz, L. W., Fusco, A. C., Brenninkmeijer, C. a. M., Prather, M. J., Wofsy, S. C., and McElroy, M. B.: Three-dimensional climatological distribution of tropospheric OH: Update and evaluation, J. Geophys. Res.-Atmos., 105, 8931–8980, https://doi.org/10.1029/1999JD901006, 2000.
Steele, L. P., Fraser, P. J., Rasmussen, R. A., Khalil, M. A. K., Conway, T. J., Crawford, A. J., Gammon, R. H., Masarie, K. A., and Thoning, K. W.: The global distribution of methane in the troposphere, J. Atmos. Chem., 5, 125–171, https://doi.org/10.1007/BF00048857, 1987.
Steele, L. P., Lang, P. M., and Sepanski, R. J.: Atmospheric methane concentrations—the NOAA/CMDL global cooperative flask sampling network, 1983–1988, United States: US Department of Energy, available at: https://www.osti.gov/biblio/5480352 (last access: 11 October 2021), 1991.
Tanner, D., Helmig, D., Hueber, J., and Goldan, P.: Gas chromatography system for the automated, unattended, and cryogen-free monitoring of C2 to C6 non-methane hydrocarbons in the remote troposphere, J. Chromatogr. A, 1111, 76–88, https://doi.org/10.1016/j.chroma.2006.01.100, 2006.
Thompson, A. M.: The Oxidizing Capacity of the Earth's Atmosphere: Probable Past and Future Changes, Science, 256, 1157–1165, https://doi.org/10.1126/science.256.5060.1157, 1992.
Thoning, K. W., Tans, P. P., and Komhyr, W. D.: Atmospheric carbon dioxide at Mauna Loa Observatory: 2. Analysis of the NOAA GMCC data, 1974–1985, 94, 8549–8565, https://doi.org/10.1029/JD094iD06p08549, 1989.
Trolier, M., White, J. W. C., Tans, P. P., Masarie, K. A., and Gemery, P. A.: Monitoring the isotopic composition of atmospheric CO2: Measurements from the NOAA Global Air Sampling Network, J. Geophys. Res., 101, 25897–25916, https://doi.org/10.1029/96JD02363, 1996.
Tzompa-Sosa, Z. A., Mahieu, E., Franco, B., Keller, C. A., Turner, A. J., Helmig, D., Fried, A., Richter, D., Weibring, P., Walega, J., Yacovitch, T. I., Herndon, S. C., Blake, D. R., Hase, F., Hannigan, J. W., Conway, S., Strong, K., Schneider, M., and Fischer, E. V.: Revisiting global fossil fuel and biofuel emissions of ethane, J. Geophys Res.-Atmos., 122, 2493–2512, https://doi.org/10.1002/2016JD025767, 2017.
Tzompa-Sosa, Z. A., Henderson, B. H., Keller, C. A., Travis, K., Mahieu, E., Franco, B., Estes, M., Helmig, D., Fried, A., Richter, D., Weibring, P., Walega, J., Blake, D. R., Hannigan, J. W., Ortega, I., Conway, S., Strong, K., and Fischer, E. V.: Atmospheric Implications of Large C2–C5 Alkane Emissions From the U.S. Oil and Gas Industry, J. Geophys Res.-Atmos., 124, 1148–1169, https://doi.org/10.1029/2018JD028955, 2019.
U.S. Field Production of Natural Gas Liquids: https://www.eia.gov/dnav/pet/hist/LeafHandler.ashx?n=PET&s=M_EPL2_FPF_NUS_MBBLD&f=A, last access: 8 March 2021.
U.S. Field Production of Propane: https://www.eia.gov/dnav/pet/hist/LeafHandler.ashx?n=PET&s=M_EPLLPA_FPF_NUS_MBBL&f=M, last access: 8 March 2021.
Val Martin, M., Heald, C. L., Ford, B., Prenni, A. J., and Wiedinmyer, C.: A decadal satellite analysis of the origins and impacts of smoke in Colorado, Atmos. Chem. Phys., 13, 7429–7439, https://doi.org/10.5194/acp-13-7429-2013, 2013.
von Schneidemesser, E., Monks, P. S., and Plass-Duelmer, C.: Global comparison of VOC and CO observations in urban areas, Atmos. Environ., 44, 5053–5064, https://doi.org/10.1016/j.atmosenv.2010.09.010, 2010.
Warneke, C., Gouw, J. A. de, Holloway, J. S., Peischl, J., Ryerson, T. B., Atlas, E., Blake, D., Trainer, M., and Parrish, D. D.: Multiyear trends in volatile organic compounds in Los Angeles, California: Five decades of decreasing emissions, J. Geophys Res.-Atmos., 117, https://doi.org/10.1029/2012JD017899, 2012.
Warner, M. S. C.: Introduction to PySPLIT: A Python Toolkit for NOAA ARL's HYSPLIT Model, Comput. Sci. Eng., 20, 47–62, https://doi.org/10.1109/MCSE.2017.3301549, 2018.
Wiedinmyer, C., Akagi, S. K., Yokelson, R. J., Emmons, L. K., Al-Saadi, J. A., Orlando, J. J., and Soja, A. J.: The Fire INventory from NCAR (FINN): a high resolution global model to estimate the emissions from open burning, Geosci. Model Dev., 4, 625–641, https://doi.org/10.5194/gmd-4-625-2011, 2011.
Wiedinmyer, C., Kumra, Y., McDonald-Buller, E. C., Seto, K., Emmons, L. K., Buccholz, R., Tang, W., Joseph, M., Barsanti, K., Carlton, A. M., and Yokelson, R. J.: The Fire Inventory from NCAR version 2: an updated global fire emissions model for climate and chemistry applications, J. Adv. Model. Earth Sy., in preparation, 2021.
WMO: GAW Report, 171, A WMO/GAW Expert Workshop on Global Long-term Measurements of Volatile Organic Compounds, WMO, Geneva, 36 pp., 2007.
Wofsy, S. C., Afshar, S., Allen, H. M., Apel, E. C., Asher, E. C., Barletta, B., Bent, J., Bian, H., Biggs, B. C., Blake, D. R., Blake, N., Bourgeois, I., Brock, C. A., Brune, W. H., Budney, J. W., Bui, T. P., Butler, A., Campuzano-Jost, P., Chang, C. S., Chin, M., Commane, R., Correa, G., Crounse, J. D., Cullis, P. D., Daube, B. C., Day, D. A., Dean-Day, J. M., Dibb, J. E., Digangi, J. P., Diskin, G. S., Dollner, M., Elkins, J. W., Erdesz, F., Fiore, A. M., Flynn, C. M., Froyd, K. D., Gesler, D. W., Hall, S. R., Hanisco, T. F., Hannun, R. A., Hills, A. J., Hintsa, E. J., Hoffman, A., Hornbrook, R. S., Huey, L. G., Hughes, S., Jimenez, J. L., Johnson, B. J., Katich, J. M., Keeling, R. F., Kim, M. J., Kupc, A., Lait, L. R., Lamarque, J.-F., Liu, J., Mckain, K., Mclaughlin, R. J., Meinardi, S., Miller, D. O., Montzka, S. A., Moore, F. L., Morgan, E. J., Murphy, D. M., Murray, L. T., Nault, B. A., Neuman, J. A., Newman, P. A., Nicely, J. M., Pan, X., Paplawsky, W., Peischl, J., Prather, M. J., Price, D. J., Ray, E. A., Reeves, J. M., Richardson, M., Rollins, A. W., Rosenlof, K. H., Ryerson, T. B., Scheuer, E., Schill, G. P., Schroder, J. C., Schwarz, J. P., St. Clair, J. M., Steenrod, S. D., Stephens, B. B., Strode, S. A., Sweeney, C., Tanner, D., Teng, A. P., Thames, A. B., Thompson, C. R., Ullmann, K., Veres, P. R., Vizenor, N., Wagner, N. L., Watt, A., Weber, R., Weinzierl, B., Wennberg, P. O., Williamson, C. J., Wilson, J. C., Wolfe, G. M., Woods, C. T., Zeng, L. H., and Vieznor, N.: ATom: Merged Atmospheric Chemistry, Trace Gases, and Aerosols, ORNL DAAC (Oak Ridge National Laboratory Distributed Active Archive Center), https://doi.org/10.3334/ORNLDAAC/1581, 2018.
Worton, D. R., Sturges, W. T., Reeves, C. E., Newland, M. J., Penkett, S. A., Atlas, E., Stroud, V., Johnson, K., Schmidbauer, N., Solberg, S., Schwander, J., and Barnola, J.-M.: Evidence from firn air for recent decreases in non-methane hydrocarbons and a 20th century increase in nitrogen oxides in the northern hemisphere, Atmos. Environ., 54, 592–602, https://doi.org/10.1016/j.atmosenv.2012.02.084, 2012.
Xiao, Y., Logan, J. A., Jacob, D. J., Hudman, R. C., Yantosca, R., and Blake, D. R.: Global budget of ethane and regional constraints on U.S. sources, J. Geophys. Res.-Atmos., 113, D21306, https://doi.org/10.1029/2007JD009415, 2008.
Yu, Y., Hung, H., Alexandrou, N., Roach, P., and Nordin, K.: Multiyear Measurements of Flame Retardants and Organochlorine Pesticides in Air in Canada's Western Sub-Arctic, Environ. Sci. Technol., 49, 8623–8630, https://doi.org/10.1021/acs.est.5b01996, 2015.
Zhou, H., Hopke, P. K., Zhou, C., and Holsen, T. M.: Ambient mercury source identifications at a New York State urban site: Rochester, NY, Sci. Total Environ., 650, 1327–1337, https://doi.org/10.1016/j.scitotenv.2018.09.040, 2018.
Zong, Z., Wang, X., Tian, C., Chen, Y., Fu, S., Qu, L., Ji, L., Li, J., and Zhang, G.: PMF and PSCF based source apportionment of PM2.5 at a regional background site in North China, Atmos. Res., 203, 207–215, https://doi.org/10.1016/j.atmosres.2017.12.013, 2018.