the Creative Commons Attribution 4.0 License.
the Creative Commons Attribution 4.0 License.
 | 04 Feb 2021
An overview of the ORACLES (ObseRvations of Aerosols above CLouds and their intEractionS) project: aerosol–cloud–radiation interactions in the southeast Atlantic basin
Robert Wood
Paquita Zuidema
Sarah J. Doherty
Bernadette Luna
Samuel E. LeBlanc
Michael S. Diamond
Yohei Shinozuka
Ian Y. Chang
Rei Ueyama
Leonhard Pfister
Ju-Mee Ryoo
Amie N. Dobracki
Arlindo M. da Silva
Karla M. Longo
Meloë S. Kacenelenbogen
Connor J. Flynn
Kristina Pistone
Nichola M. Knox
Stuart J. Piketh
James M. Haywood
Paola Formenti
Marc Mallet
Philip Stier
Andrew S. Ackerman
Susanne E. Bauer
Ann M. Fridlind
Gregory R. Carmichael
Pablo E. Saide
Gonzalo A. Ferrada
Steven G. Howell
Steffen Freitag
Brian Cairns
Brent N. Holben
Kirk D. Knobelspiesse
Simone Tanelli
Tristan S. L'Ecuyer
Andrew M. Dzambo
Ousmane O. Sy
Greg M. McFarquhar
Michael R. Poellot
Siddhant Gupta
Joseph R. O'Brien
Athanasios Nenes
Mary Kacarab
Jenny P. S. Wong
Jennifer D. Small-Griswold
Kenneth L. Thornhill
David Noone
James R. Podolske
K. Sebastian Schmidt
Peter Pilewskie
Hong Chen
Sabrina P. Cochrane
Arthur J. Sedlacek
Timothy J. Lang
Eric Stith
Michal Segal-Rozenhaimer
Richard A. Ferrare
Sharon P. Burton
Chris A. Hostetler
David J. Diner
Felix C. Seidel
Steven E. Platnick
Jeffrey S. Myers
Kerry G. Meyer
Douglas A. Spangenberg
Hal Maring
Southern Africa produces almost a third of the Earth's biomass burning (BB) aerosol particles, yet the fate of these particles and their influence on regional and global climate is poorly understood. ORACLES (ObseRvations of Aerosols above CLouds and their intEractionS) is a 5-year NASA EVS-2 (Earth Venture Suborbital-2) investigation with three intensive observation periods designed to study key atmospheric processes that determine the climate impacts of these aerosols. During the Southern Hemisphere winter and spring (June–October), aerosol particles reaching 3–5 km in altitude are transported westward over the southeast Atlantic, where they interact with one of the largest subtropical stratocumulus (Sc) cloud decks in the world. The representation of these interactions in climate models remains highly uncertain in part due to a scarcity of observational constraints on aerosol and cloud properties, as well as due to the parameterized treatment of physical processes. Three ORACLES deployments by the NASA P-3 aircraft in September 2016, August 2017, and October 2018 (totaling ∼350 science flight hours), augmented by the deployment of the NASA ER-2 aircraft for remote sensing in September 2016 (totaling ∼100 science flight hours), were intended to help fill this observational gap. ORACLES focuses on three fundamental science themes centered on the climate effects of African BB aerosols: (a) direct aerosol radiative effects, (b) effects of aerosol absorption on atmospheric circulation and clouds, and (c) aerosol–cloud microphysical interactions. This paper summarizes the ORACLES science objectives, describes the project implementation, provides an overview of the flights and measurements in each deployment, and highlights the integrative modeling efforts from cloud to global scales to address science objectives. Significant new findings on the vertical structure of BB aerosol physical and chemical properties, chemical aging, cloud condensation nuclei, rain and precipitation statistics, and aerosol indirect effects are emphasized, but their detailed descriptions are the subject of separate publications. The main purpose of this paper is to familiarize the broader scientific community with the ORACLES project and the dataset it produced.
Please read the corrigendum first before continuing.
-
Notice on corrigendum
The requested paper has a corresponding corrigendum published. Please read the corrigendum first before downloading the article.
-
Article
(36054 KB)
-
The requested paper has a corresponding corrigendum published. Please read the corrigendum first before downloading the article.
- Article
(36054 KB) - Full-text XML
- Corrigendum
- BibTeX
- EndNote


The radiative and cloud-altering impacts of anthropogenic aerosol particles constitute the largest source of uncertainty in anthropogenic climate forcing (IPCC, 2013). Aerosol particles interact directly with solar radiation through scattering and absorption of radiation, which leads to a direct radiative forcing whose sign depends on the ratio of the absorption to the total aerosol extinction and on the albedo of the underlying surface–atmosphere system (Coakley and Chylek, 1975). Heating of the atmosphere by aerosol absorption can induce changes in atmospheric circulation and mixing that can either enhance or decrease cloudiness (Ackerman et al., 2000; Koch and Del Genio, 2010). Aerosol particles also serve as cloud condensation nuclei (CCN), which can enhance cloud albedo by increasing the concentration of cloud droplets and reducing their size when aerosol concentrations increase at fixed liquid water content (Twomey, 1974), and also potentially drive changes in cloud condensate or cloud cover by altering cloud lifetimes (Simpson and Wiggert, 1969; Albrecht, 1989; Ackerman et al., 2004; Wood, 2007). The magnitudes of all effects and even the sign of the latter two aerosol effects are not well quantified globally (IPCC, 2013) and are expected to be geographically and seasonally heterogeneous because the total aerosol forcing is dependent upon the nature and amount of different aerosol species, cloud type and cover, and surface albedo, all of which vary on such scales.
Biomass burning (BB) is one of the largest sources of absorbing aerosol globally (Bond et al., 2013). BB aerosol particles contain black carbon, the most strongly absorbing of all aerosol constituents found in the atmosphere. The sign of the direct aerosol forcing is highly dependent upon the relative vertical locations of aerosol and clouds, with forcing changing from negative to positive when BB aerosol layers overlie low clouds rather than a dark ocean surface (Chand et al., 2009). BB aerosols also contain oxidized organic carbon and other soluble inorganic species that can act as effective CCN if transported into clouds.
The southeast Atlantic (SEA) region has some of the highest optical depths of BB aerosol on the planet. It is also the location of large inter-model differences in aerosol forcing assessments (Schulz et al., 2006; Stier et al., 2013; Zuidema et al., 2016). The neighboring southern African biomass burning (BB) source regions account for almost one third of the Earth's BB emissions (550 Tg C yr−1; van der Werf et al., 2010), producing optically thick BB aerosol layers that are routinely transported across much of the South Atlantic basin (Chand et al., 2009; Zuidema et al., 2016). While burned areas are decreasing in size globally, burned areas in Africa are increasing, raising interesting questions about BB aerosol interactions with climate in that region in the future (Andela et al., 2017).
The SE Atlantic is also home to one of the Earth's largest subtropical stratocumulus (Sc) cloud decks, which plays a key role in the energetic balance of the region. The physical processes governing the feedbacks between sea surface temperature (SST) and cloud properties in these Sc decks are poorly represented in climate models (Bony and Dufresne, 2005). In the Austral spring (July to October), the Sc deck interacts with the African BB aerosols that have been transported westward by prevailing mid-tropospheric tropical easterly winds. These aspects of the SE Atlantic attracted several international field experiments on aerosol–cloud–climate interactions in the region. These projects were based out of deployment sites distributed throughout the SE Atlantic (Fig. 1) and were scheduled between 2016 and 2018 to allow for collaborative science. These experiments include the NASA ORACLES project described in this paper, deploying from Walvis Bay, Namibia, in 2016 and São Tomé in 2017 and 2018; the UK CLARIFY (Clouds and Aerosol Radiative Impacts and Forcing), deploying from Ascension Island in 2017; the French AEROCLO-sA (Aerosol, Radiation and Clouds in southern Africa) project, deploying from Walvis Bay, Namibia, in 2017; and the DOE Atmospheric Radiation Measurement mobile facility LASIC (Layered Atlantic Smoke Interactions with Clouds) deployment to Ascension Island in 2016–2017, all described in more detail in Sect. 3.4.
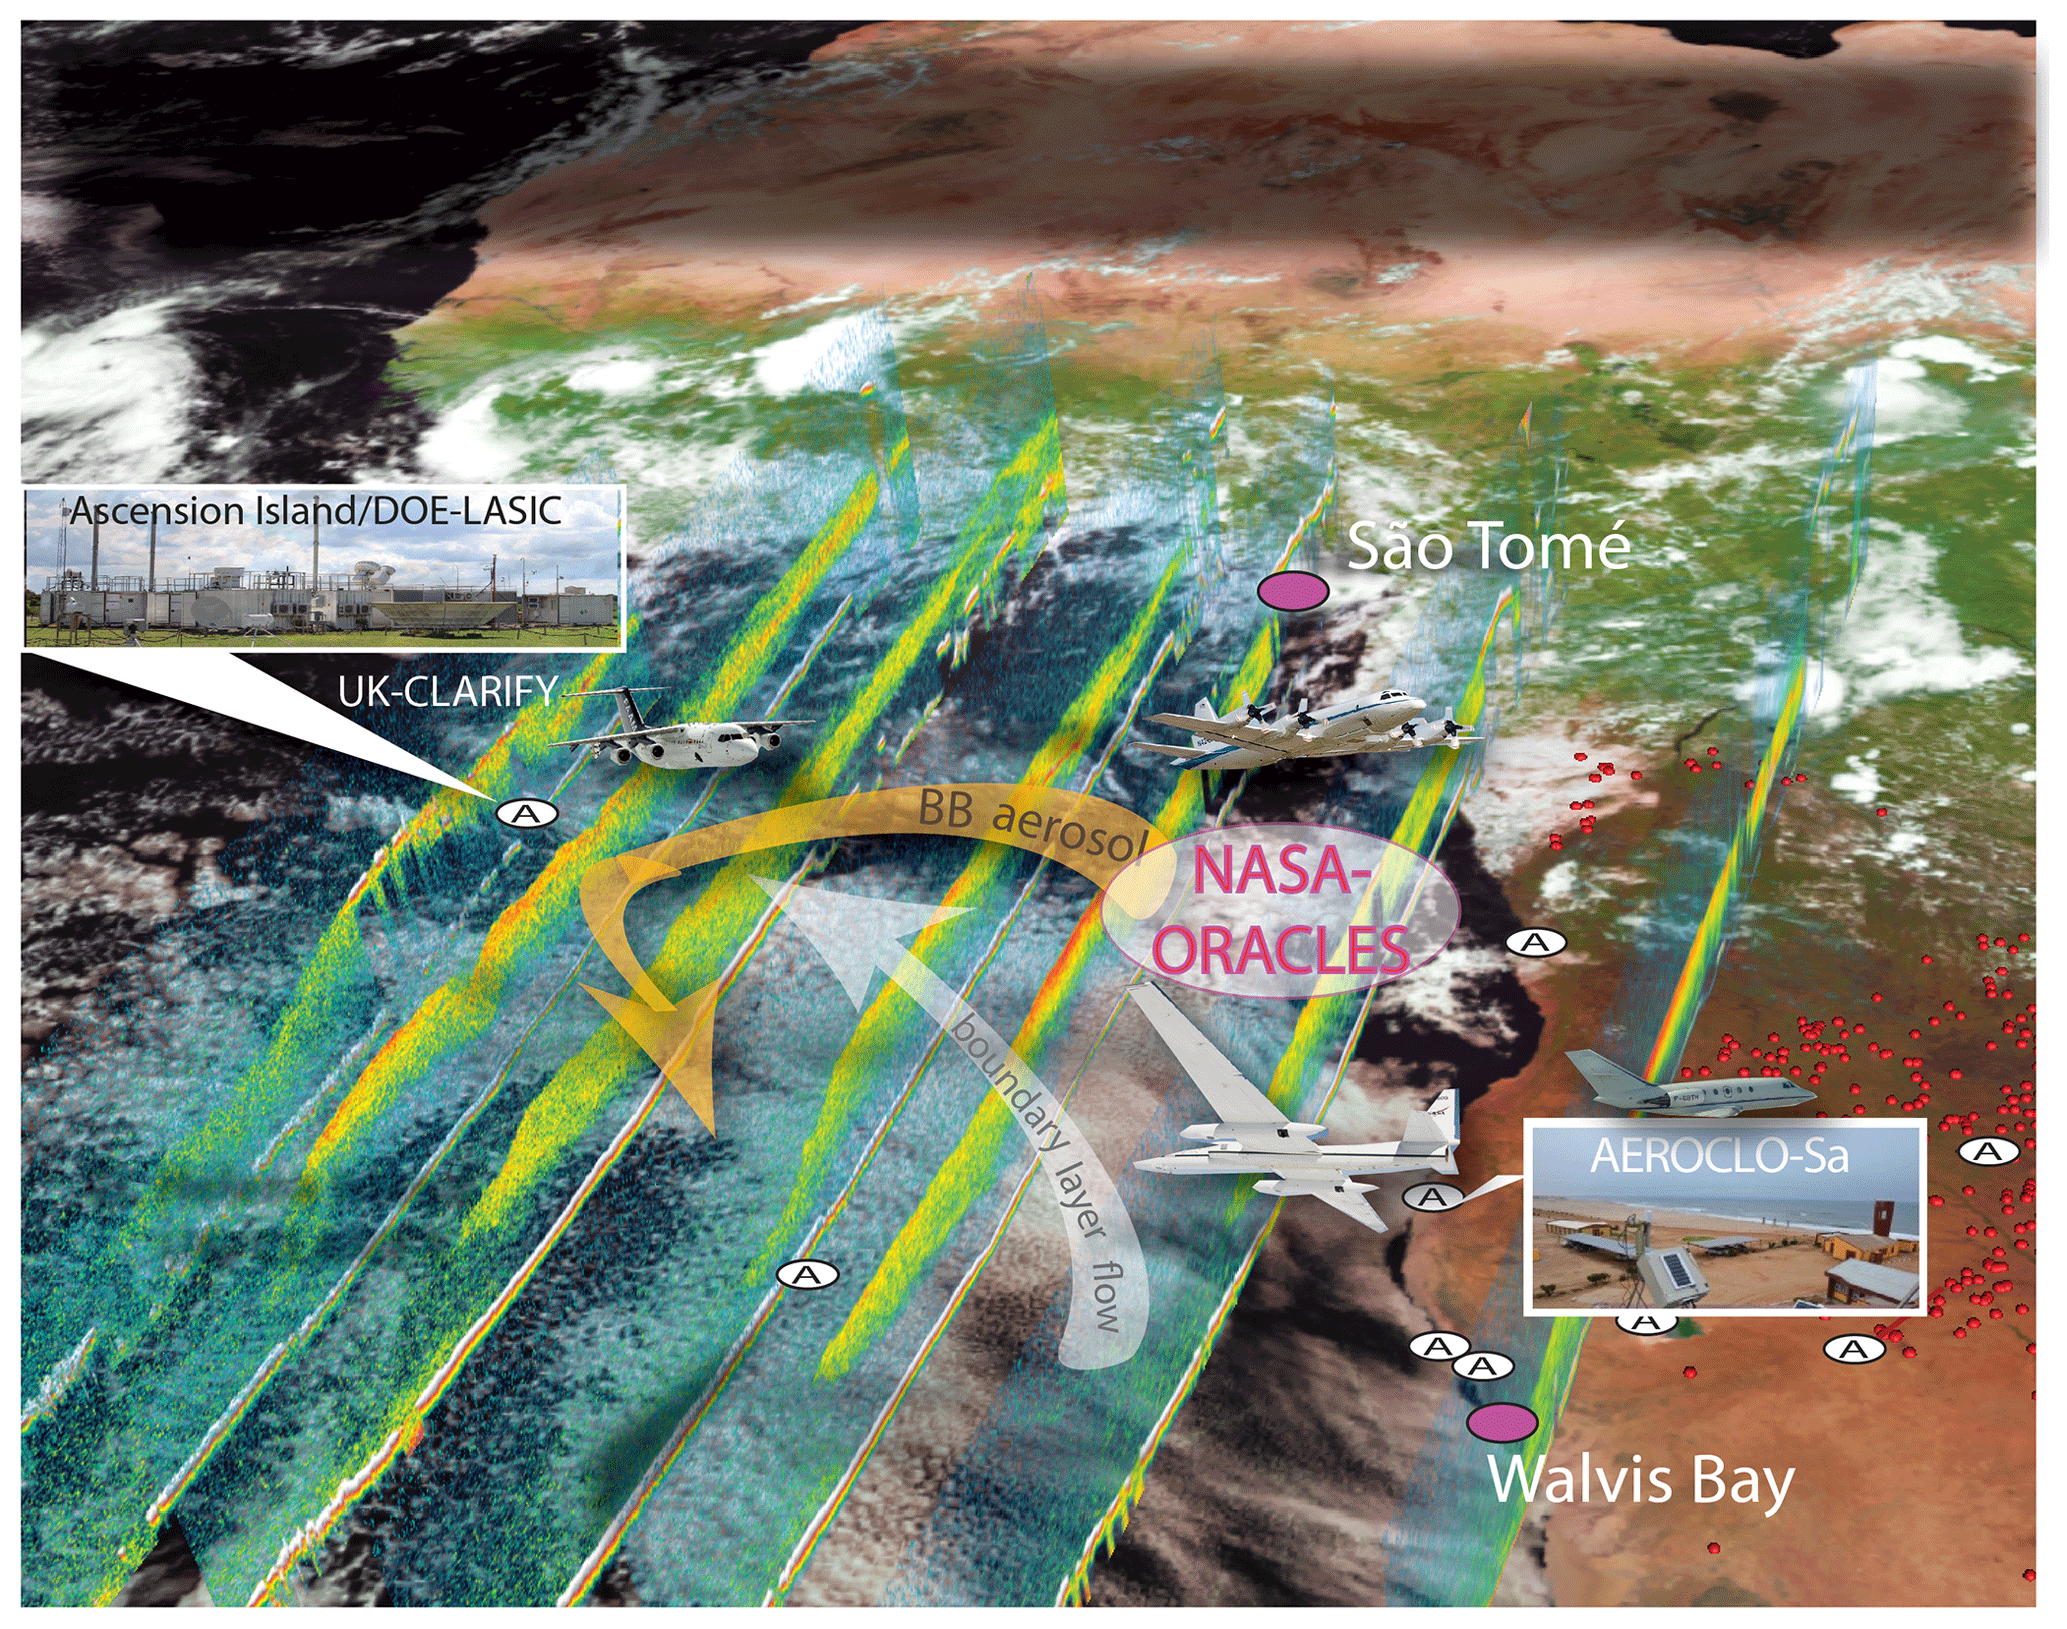
Figure 1Deployment sites for the 2016–2018 ORACLES field experiments and collaborative international deployment activities (see text), along with CALIOP curtain data visualized by Charles Trepte (NASA Langley), adapted from © Google Maps 2020. The ovals with the letter A indicate new or refurbished AERONET sites (Holben et al., 2018).
The southern and central African fires producing BB aerosol occur during the warm, dry season over the continent, so emissions are lofted in the convective boundary layer to an altitude of several kilometers. As they advect offshore, the BB aerosol layers form a plume that initially overlays the cloud deck over the Atlantic (Fig. 2; see also Adebiyi and Zuidema, 2016; Zuidema et al., 2016; Deaconu et al., 2019) and exerts a direct radiative forcing (RF) whose sign and magnitude depend upon the reflectance and coverage of the clouds below and on the absorptivity of the aerosols (Keil and Haywood, 2003; Chand et al., 2009). Depending on the relative vertical location of the aerosols and the cloud deck, cloud condensate may increase or decrease in response to aerosol absorption and subsequent changes in atmospheric stability, relative humidity, and subsidence (semi-direct forcing). Cloud optical thickness and areal coverage may also be influenced by aerosol-induced changes in cloud microphysics (forcing from aerosol–cloud interactions) when BB aerosols are mixed into the marine boundary layer (MBL). This is expected to occur more frequently offshore as the MBL deepens in response to warming sea surface temperatures (e.g., Eastman et al., 2017), raising cloud top heights (Zuidema et al., 2009) and easing entrainment of the overlying aerosol, and as BB aerosol layers descend in response to prevailing large-scale subsidence (Fig. 2).
Satellite- and model-based assessments of aerosol–cloud–climate interactions in this region (e.g., Chand et al., 2009; Wilcox, 2012; Stier et al., 2013; De Graaf et al., 2014; Zhang et al., 2016; Adebiyi and Zuidema, 2018; Zhang and Zuidema, 2019; Kacenelenbogen et al., 2019; Sayer et al., 2019) indicate that improved observations of aerosol properties and loading, cloud fraction, albedo, and liquid water path (LWP) are needed to constrain the local aerosol radiative impacts. Such studies are hampered by problematic aerosol retrievals in regions of extensive low clouds and difficulties retrieving cloud microphysical properties underneath dense aerosol layers (Haywood et al., 2004; Coddington et al., 2010; Deaconu et al., 2017). The observations used in these studies often have severe limitations and require significant assumptions about aerosol and cloud properties (Yu et al., 2012; Yu and Zhang, 2013; Jethva et al., 2014; Knobelspiesse et al., 2015; Meyer et al., 2015; Sayer et al., 2016).
An example of a satellite-based retrieval of both aerosols and clouds is given in Fig. 2, which shows the altitude of aerosol and cloud layers during 3 months as a function of longitude, as operationally retrieved from the Cloud-Aerosol Lidar with Orthogonal Polarization (CALIOP) space-based lidar. Multiple filters have been applied for quality assurance of these data. However, the simple message this figure conveys, of an elevated aerosol layer that is typically far above the low cloud, is somewhat misleading because (i) there could be multiple aerosol layers above the uppermost cloud and (ii) the CALIOP-derived aerosol layer base height has been found to be biased high, based on airborne measurements made during ORACLES as well as CALIOP retrievals that have been constrained by above-cloud aerosol optical thickness derived from the CALIOP data. The latter results from the fact that, especially for the daytime retrievals from CALIOP, there is a significant reduction in the signal-to-noise ratio in the presence of optically thick aerosol layers. Hence, the separation between clouds and overlying aerosols (Fig. 2, yellow bars) is also likely biased high (see also Rajapakshe et al., 2017). Such observational uncertainty and the differing conclusions one may draw based on the separation between the BB aerosol layer and the underlying Sc clouds in this region were a significant contributing impetus for the ORACLES project. We include the CALIOP-derived Fig. 2 here to provide the scientific information available at the ORACLES proposal stage, which partially motivated the project in the first place and greatly influenced its design (Watson-Parris et al., 2018).
Surface-based measurements also have limitations. AERONET (Aerosol Robotic Network) sky radiance observations (Holben et al., 1998) are used frequently to tune global model estimates of aerosol absorption (Bond et al., 2013) but can be routinely performed only from land and in the absence of clouds. Although historically a number of AERONET stations existed near the main African BB sources, just prior to ORACLES, there were no operational AERONET stations in the main BB region, with the exception of Ascension Island far downwind.
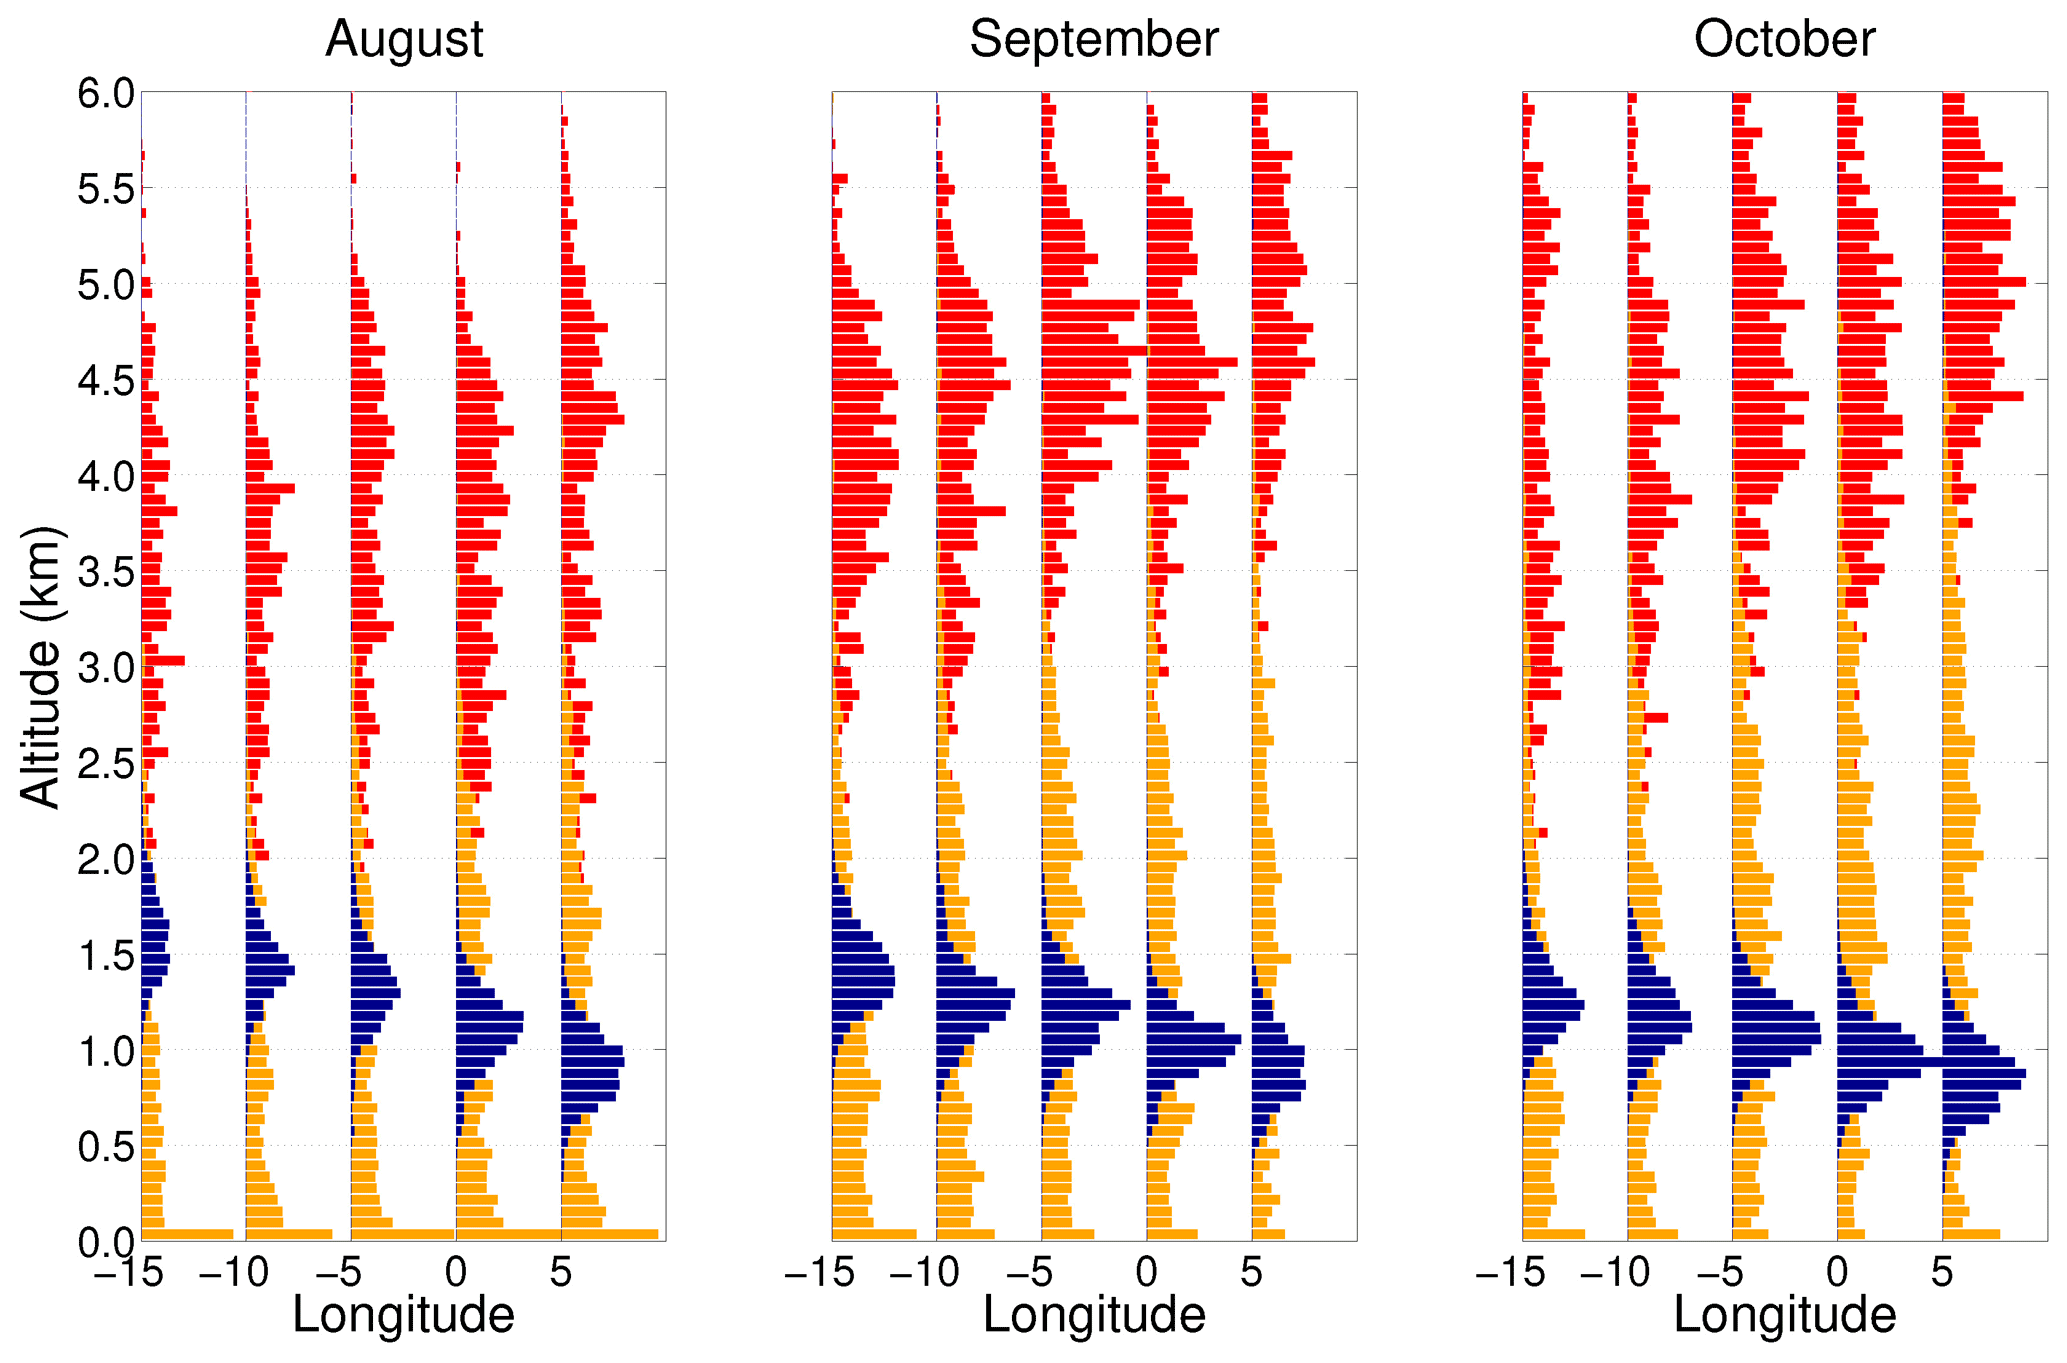
Figure 2Distributions of aerosol top height (red), cloud top height (blue), and the separation between clouds and overlying aerosols (yellow) as a function of longitude, between 10–22.5∘ S. Observations are taken from the Cloud-Aerosol Lidar with Orthogonal Polarization (CALIOP) version 3 aerosol profile product from 2006 to 2012 (7 years).
Airborne instruments provide measurements of aerosols and clouds under co-varying meteorological conditions that are currently impossible to obtain from space. High-resolution airborne observations, over scales that resolve processes of interest, provide critical constraints for parameterizing aerosol–cloud–climate interactions in models. They can also be used to enhance satellite-based remote sensing, by resolving in situ characteristics and variability within a particular scene, by providing a direct test of retrieved properties, and in the long term by guiding the development of new and improved remote-sensing techniques. Because previous efforts to study BB emissions in South Africa (e.g., SAFARI-2K, Swap et al., 2003; TRACE-A, Fishman et al., 1996) were focused over land or in close proximity to the coastal zone (e.g., Haywood et al., 2003), prior to ORACLES, there was a dearth of measurements over the SE Atlantic Ocean, where the major radiative impacts of BB aerosols are taking place.
In response to the need for new measurement constraints, in 2014 NASA funded the ORACLES project as one of the Earth Venture Suborbital-2 investigations. The goal of ORACLES is to provide a process-level understanding of the role of aerosols in climate by providing observations of all relevant aerosol effects over the SE Atlantic, a region with some of the largest aerosol loadings on the planet that is readily accessible with airborne platforms. The overarching ORACLES science goals, which encompass the specific science themes and questions in the abstract and Table 1 below, are as follows.
-
Determine the impact of African BB aerosol on cloud properties and the radiation balance over the South Atlantic, using state-of-the-art in situ and remote-sensing instruments to generate datasets that can also be used to verify and refine current and future observation methods, including instrument concepts with potential for deployment to space.
-
Acquire a process-level understanding of aerosol–cloud–radiation interactions and resulting cloud adjustments that can be applied in global models.
In this paper, we provide an overview of all three ORACLES deployments, highlighting aerosol absorptive and cloud-nucleating properties, their vertical distribution relative to clouds, the locations and degree of aerosol mixing into clouds, and cloud changes in response to such mixing. We make an initial assessment of the differences and similarities of the BB plume and cloud properties as observed from the 2016 deployment site (Walvis Bay, Namibia) at the plume's southern edge and from the 2017 and 2018 deployment site (São Tomé and Príncipe) near the plume's northern edge. We conclude with an outlook for the integrative work we envision to address the overarching science questions regarding aerosol–radiation–climate interactions in the SE Atlantic and how these suborbital observations will aid long-term modeling and satellite remote-sensing efforts.
2.1 Motivation for 3-year field deployment
Prior to the ORACLES implementation stage, an analysis of satellite data in the study area had revealed pronounced shifts in aerosol altitude, concentration, and optical properties through the July to October BB season. That combined body of work suggested that aerosol loadings peak in September (Fig. 3, see also Adebiyi et al., 2015), whereas single-scattering albedo (SSA) increases over the season, reflecting either a change in BB aerosol composition (Eck et al., 2013) or the mix of aerosol types present (Bond et al., 2013). Another striking seasonal change is that, on average, the gap between cloud top and the aerosol layer increases dramatically (Fig. 2), primarily due to higher aerosol layers.
The closer vertical proximity of BB aerosol layers to clouds early in the season (shown in Fig. 2) suggested that studies of aerosol–cloud interactions would be most feasible then, while larger gaps later in the season would suggest weaker indirect effects. Observing and quantifying these seasonal changes and the changing importance of the aerosol semi-direct and indirect effects over the BB season required either an impractically extended deployment or separate deployments spread across the season. The ORACLES team decided on separate deployments in September 2016, August 2017, and October 2018, a decision that was aided by a relative lack of interannual variability in meteorology. This variability was predominantly linked to SST variations known as Benguela Niños that mainly occur in boreal spring, not fall, and are much less frequent than the better-known Pacific El Niños (Rouault, 2012). Interannual variability in fire emissions was expected to be low as well (van der Werf et al., 2010). As a result, aerosol loading in the ORACLES region was expected to be repeatable, with Moderate Resolution Imaging Spectroradiometer (MODIS) clear-sky aerosol optical depth (AOD) retrievals implying year-to-year variability through the burning season of only 20 % of the mean. In reality, recently developed above-cloud AOD retrievals reveal a significant interannual variability in the properties of the above-cloud aerosol plume (see Sect. 4.2–4.3 below); investigations into the particular reasons are ongoing. Finally, a practical consideration for the attempt to cover the BB seasonal cycle with three separate deployments was based on the fact that airborne instrument performance has a tendency to significantly decrease as mission durations extend beyond 4 weeks.
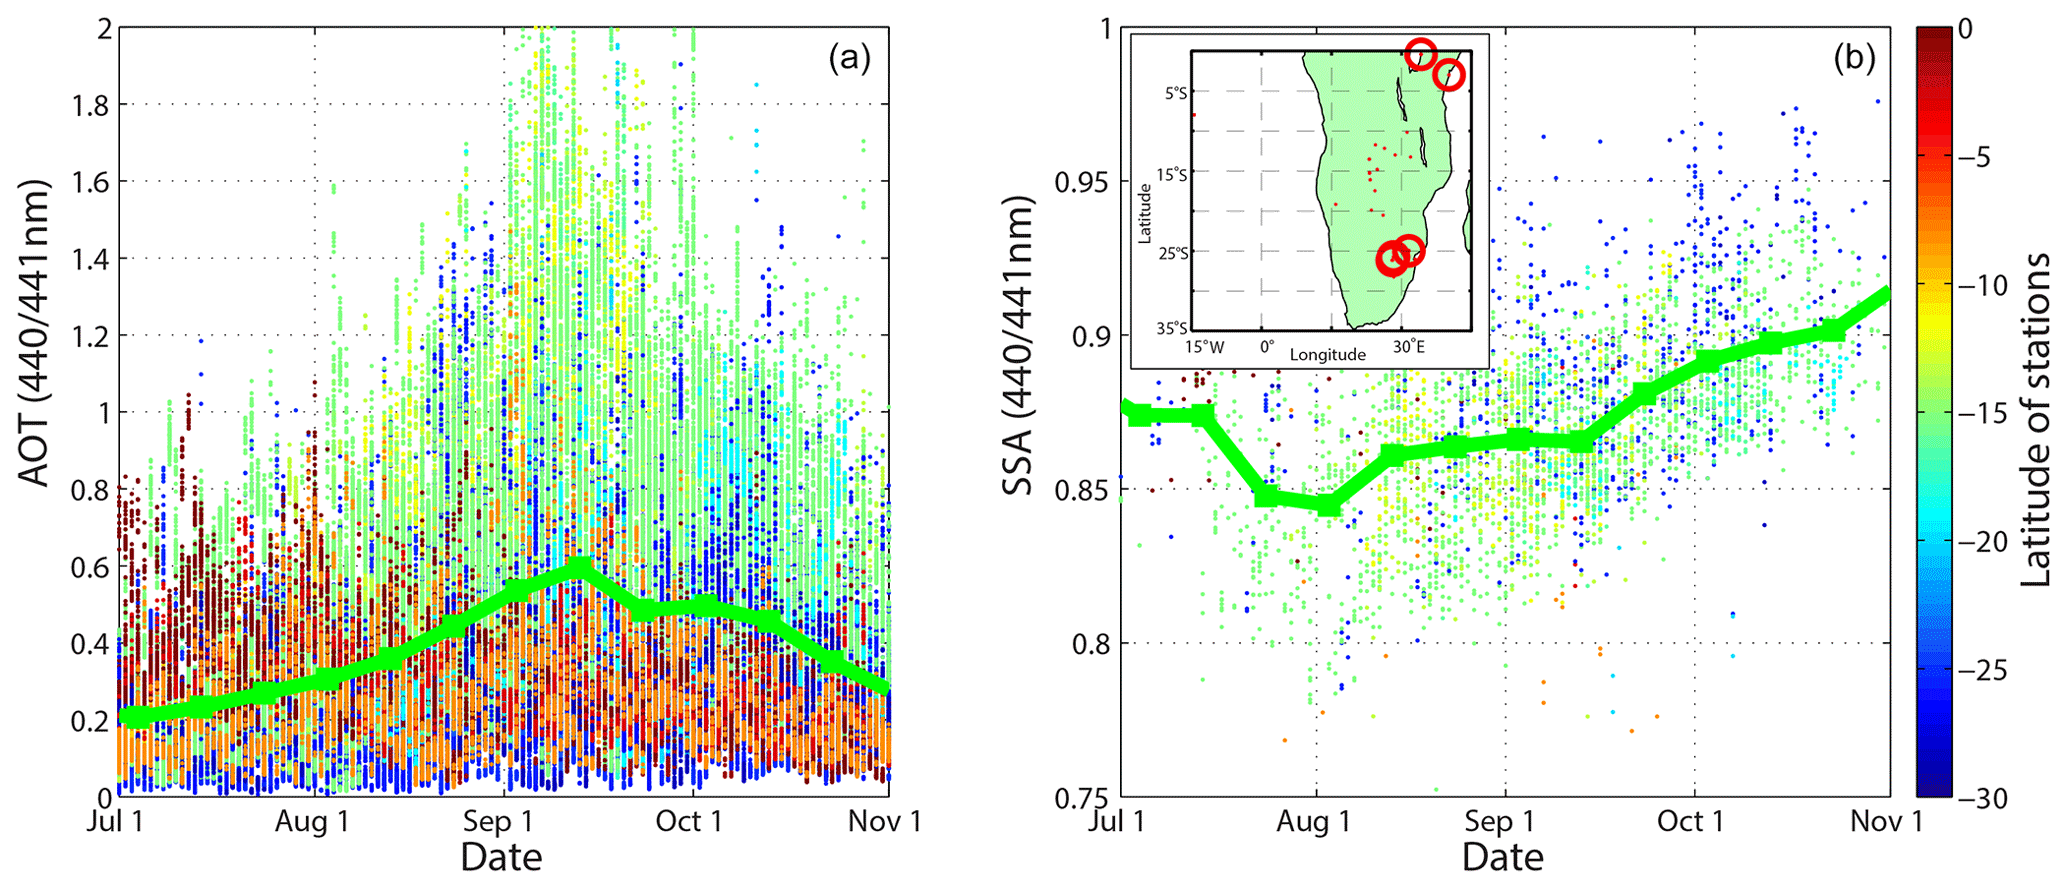
Figure 3Aerosol optical depth at 440/441 nm (a) from AERONET sites in southern Africa peaks in early September, while SSA at 440/441 nm (b) shows a significant increase between August and November. Red circles in the inset indicate the few stations operating between 2011 and 2013. Both panels contain data from 1995 to 2013 to represent the state of knowledge prior to the ORACLES deployments.
2.2 Science questions and objectives
ORACLES science questions and related objectives are generally focused on direct, semi-direct, and indirect aerosol effects on climate. Table 1 summarizes science questions and objectives as originally posed. The general approach for developing these objectives was to include goals that were highly achievable first and to increase the complexity of objectives gradually. The objectives related to science questions 1 and 2, i.e., direct and semi-direct effects, constituted the “threshold” (for success) science mission. The science objectives associated with question 3, i.e., indirect effect assessments, were part of the “baseline” science mission, which in NASA terminology indicates the full mission scope.
Table 1A summary of ORACLES science questions and related objectives.

2.3 Project implementation
2.3.1 Logistics and deployment details
The Walvis Bay airport in western Namibia was originally considered the ideal location for ORACLES due to its proximity to the ocean and cloud deck, runway length and hangar size for the ER-2, and due to its use during the SAFARI-2K campaign by the University of Washington CV-580 aircraft. The runway had been extended to ∼3350 m, but certification of the extension was still in progress as ORACLES began. It was our intention to deploy only one aircraft in the first year and grow the activity after acclimating to the locality and airspace. However, during the ORACLES-2016 deployment planning, the UK CLARIFY team announced plans to fly its airborne assets in 2016 as well. In response, leadership re-ordered ORACLES deployments to bring both aircraft to Walvis Bay in 2016, so as to maximize their impact in a concerted effort with the international partners.
In the event that the facilities were found to be inadequate or unready or unavailable, alternate airfields were investigated. Specifically, Upington (FAUP), South Africa, and São Tomé (FPST) were pursued with due diligence until country approval was obtained from Namibia. Upington had no usable hangar but an extremely long runway, little competing traffic, and the benefit of a long-standing collaborative relationship with the USA and NASA. São Tomé's runway length and hangars could not accommodate the ER-2 requirements, but officials were very enthusiastic about a NASA collaboration. Both locations could support a P-3-only deployment. A temporary hangar in Upington, South Africa, or Windhoek, Namibia, might have supported the ER-2. Ascension Island also had no hangar and posed significant constraints to the commercial import/transport of people and equipment. In later years, Ascension Island was subject to runway construction, but it did serve as an overnight transit stop for the P-3 in 2016 and 2017 and as the target for suitcase (overnight stay) flights in 2017.
ORACLES experiment requirements dictated deployment of up to 80 people (110 in 2016) for three 5-week periods, centered on the months of September 2016, August 2017, and October 2018.
2.3.2 Choice of measurement platforms: envisioned versus realized capabilities
The revised ORACLES project implementation plan called for the operation of two aircraft in 2016 and the operation of only one aircraft in 2017 and 2018. The choice to deploy the ER-2 aircraft in 1 year only was solely based on funding considerations, as its operations are considerably more complicated and costly.
The ORACLES platforms and instruments were selected to efficiently and quantitatively address the science questions outlined above through measurements of radiative fluxes, derivation of heating rates, observations of aerosol and cloud microphysical and radiative properties, atmospheric thermodynamics, and chemistry. The desired flight plans were driven by expected aerosol–cloud features and their interactions within the region, by regional model forecasts, and by recent (same-flight or previous-flight) observations. When the P-3 was the sole NASA aircraft deployed (August 2017 and October 2018), Research Scanning Polarimeter (RSP) and High Spectral Resolution Lidar (HSRL-2) instruments (Table A4) were added to its payload to capture relevant science data by flying above, within, and below aerosol layers and clouds. When both the P-3 and ER-2 were present (September 2016), the ER-2 served in a remote-sensing role, obviating the need for the P-3 to fly above both cloud and aerosol layers.
It was known from the planning stage that the range of the P-3 aircraft was dependent on payload and flight pattern flown; spirals and low-altitude flight reduce flight time. Based on DISCOVER-AQ's successful inclusion of spirals from 1000 to 5000 ft (305 to 1525 m) during 8 h flights, ORACLES flights were expected to be similar in duration and character. From Walvis Bay, Namibia, this covered the target science zone (5 to 35∘ S, westward from the coast to approximately the prime meridian), transit to Ascension Island for suitcase flights and for coordination with the UK's CLARIFY team, and transit to São Tomé Island, located near the northern edge of the climatological BB plume, with margins for headwinds, profiles, and low-altitude flight.
During the 2016 deployment, it became obvious that there was merit in P-3 flights that extended beyond the originally estimated 8 h duration. The NASA P-3 crew accommodated this request as far as crew rest considerations permitted; the average flight duration for local P-3 science flights (excluding transits) in 2016 was 8.3 h (see Sect. 4.4). In 2017 and 2018, while flying from São Tomé, a larger P-3 flight crew was able to average 9.1 and 8.3 flight hours respectively for similar flights, with the 2018 average affected by increased safety margins due to expected inclement weather.
For ORACLES, ER-2 flights were envisioned to be up to 8 h in duration, similar to the prior Studies of Emissions and Atmospheric Composition, Clouds and Climate Coupling by Regional Surveys (SEAC4RS) campaign. Due to the 2 h pre-flight hands-off period and pilot 12 h duty day, there were concerns that weather delays (e.g., low ceilings) would result in flight duration limitations and therefore limitations in the final geographical coverage. The ER-2 deployed only once for ORACLES, to Walvis Bay, Namibia, during September 2016. The payload consisted of the Enhanced MODIS Airborne Simulator (eMAS), Airborne Multiangle SpectroPolarimetric Imager (AirMSPI), RSP, and HSRL-2 (Table B2) for various aspects of cloud composition, aerosol properties, and the overall cloud/aerosol morphology, as well as the Solar Spectral Flux Radiometer (SSFR) for radiative flux measurements. The aircraft operated as expected, and the average flight duration from Walvis Bay was 8.1 h. Especially during the second half of the campaign, the ER-2 pilots were extremely accommodating, frequently extending individual flight duration to 9 h.
2.3.3 Choice of instrumentation
In this section, we discuss the choice of instrumentation for each platform and deployment. Depending on ORACLES deployment year, the P-3 carried 8 to 11 instruments or instrument suites, with the following included for all deployments: cloud suite (UND/OU); phase Doppler interferometer (PDI); Hawaii Group for Environmental Aerosol Research (HiGEAR) in situ measurement suite for aerosols; SSFR/CG-4 for radiative fluxes; Spectrometer for Sky-Scanning, Sun-Tracking Atmospheric Research (4STAR) for aerosol optical depth, cloud, and sky radiances; Airborne Third Generation Precipitation Radar (APR-3) for cloud and precipitation observations; Research Scanning Polarimeter (RSP); CO Measurements and Analysis (COMA) for CO, CO2, and H2O mixing ratios; CCN spectrometer for cloud condensation nuclei; and Water Isotope System for Precipitation and Entrainment Research (WISPER) for water isotope measurements. In certain years there were targeted additions/deletions, listed as follows.
-
The HSRL-2 was added to the P-3 payload for deployments without the ER-2, i.e., 2017 and 2018.
-
Advanced Microwave Precipitation Radiometer (AMPR) was included in the first deployment year only (2016), when the ER-2 also carried the HSRL-2 and RSP.
-
The PTI (photothermal interferometer) was included in the 2016 and 2018 deployments only, as it suffered a failure before the 2017 deployment.
-
The counterflow virtual impactor (CVI) was added for 2017 and 2018 as part of WISPER to enable cloud residual aerosol and droplet water isotope ratio measurements.
-
An aerosol filter system (AFS) for trapping aerosol particles for post-flight analysis was added in 2017 and 2018.
-
In 2017 and 2018, a duplicate cloud droplet probe (CDP) was mounted in a position more forward relative to the leading edge of the wing, in an attempt to determine whether proximity to the leading edge affected cloud particle measurements.
-
In 2018, two customized versions of the sunshine pyranometer (Badosa et al., 2014) were added to the P-3, as was a nadir-viewing geo-referenced and radiometrically calibrated fish-eye camera.
As part of ORACLES, two new AERONET stations were established, i.e., the “Namibe” site in Namibe, Angola, and the “SEGC_Lope_ Gabon” site near Libreville, Gabon. Many other sites in the region were revamped or established with separate funding and are shown in Fig. 1 (see https://aeronet.gsfc.nasa.gov/cgi-bin/site_info_v3, last access: December 2019, for a list of sites).
Tables B1 to B3 in Appendix B provide full payload tables, including instrument names, instrument descriptions, primary measurements, and derived geophysical observables for each instrument.
2.3.4 Experiment strategy: dry-run exercise
ORACLES conducted a 2-week “dry-run” activity from 14–28 September 2015, prior to its first deployment in 2016. Project meteorologists, platform scientists, pilots, and the leadership team met by phone and Cisco Webex to examine daily weather forecasts, chemical weather predictions, and flight conditions. In response to these forecasts, detailed flight plans were developed for the upcoming 1 or 2 possible flight days, using a flight planning tool that was specifically designed for multi-aircraft flight operations (LeBlanc, 2018). Longer-range forecasts up to 5 d were used to plan for extended flight strategies relative to overarching flight objectives. Satellite data, primarily Meteosat-10 Spinning Enhanced Visible and Infrared Imager (SEVIRI) visible imagery and Cloud-Aerosol-Transport System (CATS) and CALIPSO vertical feature mask and attenuated backscatter profiles, were used to evaluate the likely success of a given flight plan for a given day. The process familiarized the science team with items that impacted real flight planning: aircraft limitations, staff fatigue limits (e.g., down days, crew rest), aviation authority coordination timelines, the availability and latency of meteorological forecasts, and the use of the flight planning tool. This practice time made ORACLES actual deployments more efficient, although the complexity and scope of actual chemical and meteorological forecasts in the field ended up being well beyond the scope of the dry-run exercise. This increased complexity was undoubtedly the result of lessons learned during the dry-run exercise itself.
2.3.5 Experiment strategy: forecasting and flight planning
The forecasting effort for ORACLES deployments in the field entailed both meteorological and chemical weather predictions. The meteorological forecasting effort for the ORACLES mission consisted of three components: (i) forecasting for flight planning, (ii) nowcasting during flights for real-time flight direction, and (iii) forecasting local weather for flight operations. Each of the three ORACLES deployments featured daily planning meetings. On non-flight days, the flight planning team met at 08:00 local time to discuss the weather and chemical weather forecasts for a period of up to 5 d, with special emphasis on the upcoming 1 or 2 flight days. On flight days, the team would assemble at 05:00 local time to assess whether the latest forecasts warranted any changes to flight plans made the day prior. Also on flight days, the forecast team would provide in-flight nowcasting that often led to significant adjustments of flight plans, usually to respond to actual cloud conditions that materialized on a given flight day or in response to changing local conditions.
Clouds were the primary focus of the meteorological forecasting effort for both flight planning and nowcasting. Low clouds (i.e., stratocumulus at the inversion) were of primary scientific interest for their interaction with the African smoke plume. However, middle and high clouds were also important since the presence of these clouds complicated the radiation measurements of some instruments (e.g., 4STAR, SSFR). Verification studies prior to the ORACLES deployments showed that the European Centre for Medium Range Weather Forecasts (ECMWF; Pappenberger et al., 2008; ECMWF Newsletter, 2012; Ye et al., 2014) and United Kingdom Meteorological Office (UKMO; Ran et al., 2018) global forecast models provided the best performance for cloud forecasts. ECMWF digital data were available at 0.125∘ longitude × latitude resolution and included the primary meteorological variables (relative humidity and horizontal winds at 925, 850, 800, 700, 600, 500, 400, 300, 150, and 100 hPa levels; 1000–500 hPa layer thickness; surface wind speed; mean sea level pressure; boundary layer height; precipitation; convective available potential energy) as well as 3-D ice and liquid water mass. We also used the 2-D ECMWF products of cloud fraction and cloud base for the low, middle, and high clouds, which were found to be adequate for our forecasting requirements. The ECMWF cloud forecasts were supplemented by low, middle, and high cloud distribution forecasts from the UKMO global forecast model. In order to forecast the overall circulation over the southeast Atlantic, with an emphasis on wind and relative humidity distributions from the surface to 500 hPa, we used a suite of forecast products from ECMWF, UKMO, Global Forecasting System (GFS) from the National Centers for Environmental Prediction (Environmental Modeling Center, 2003), and the NASA Goddard Earth Observing System, Version 5 (GEOS-5) model (Molod et al., 2012).
Our primary nowcasting tool during the flights was the geostationary satellite imagery from the SEVIRI instrument aboard Meteosat-10 and Meteosat-11. Raw imagery from the infrared and visible channels was useful for establishing the evolution and distribution of clouds during flight. Satellite cloud properties described by Minnis et al. (2008, 2020) were calculated from SEVIRI raw radiances by NASA Langley, including cloud altitude, water path, and effective radius, and were also used in real-time flight direction. For forecasting local weather for flight operations, particularly during the October 2018 deployment in São Tomé, we primarily relied on satellite imagery over the past 12–24 h for a short-term (i.e., a day or less) outlook of heavy precipitation at the airport, as precipitation forecasts from the models were largely unreliable.
Chemical forecasts were done using both global and regional models, with the regional models providing a lot of the detail required for flight planning on a daily basis. We used three global systems: GEOS5 (https://gmao.gsfc.nasa.gov/GEOS/, last access: May 2020), the Copernicus Atmosphere Monitoring Service (CAMS, https://atmosphere.copernicus.eu/, last access: May 2020), and a bespoke three-component aerosol (carbonaceous, mineral dust, and industrial pollution) modeling system developed by the UK Met Office for their CLARIFY deployment in 2017. Five-day aerosol forecasts provided the expected spatial and vertical location of the main smoke coming from the African continent. These models were also useful in identifying times when the smoke was expected to be mixed with dust aerosols, especially during the 2016 deployment from Walvis Bay.
For regional model forecasts, two configurations of the Weather Research and Forecasting Model (WRF; Skamarock et al., 2008) were employed. One of them used WRF coupled to chemistry (WRF-Chem, Grell et al., 2005) using the physics package from the Community Atmosphere Model version 5 (CAM5, Ma et al., 2014), run by a team from the University of Iowa (WRF-CAM5, PI: Gregory Carmichael). This model provided daily 72 h aerosol forecasts for similar purposes as for the global models by using a full chemistry suite with hundreds of chemical species considered. WRF was also configured using an aerosol-aware microphysics (AAM) scheme (Saide et al., 2016) maintained by a team from NCAR/UCLA (PI: Pablo E. Saide). The Weather Research and Forecasting aerosol-aware microphysics (WRF-AAM) model provided forecasts for lead times of up to 4 d at 12 km resolution. The system included a near-real-time emission constraint using satellite-based aerosol optical depth (Saide et al., 2016), which to our knowledge corresponds to the first near-real-time system to perform such tasks. Two simulations were performed per forecasting cycle turning smoke emissions on and off in the model. Since WRF-AAM resolves aerosol–cloud–radiation interactions, these simulations allowed assessment of the effects of smoke on weather in forecasting mode by taking the difference between the two forecasts. The forecasts also included tracers tagged to each day of smoke emissions from the African continent, which were used to provide a distribution of smoke age based on the tracer concentrations and the days since emissions. Statistics such as mean and mode were extracted from the age distribution and used for flight planning to target plumes with different ages to explore the temporal evolution of aerosol properties.
Another task performed during the planning meetings was near-real-time evaluation of the forecasts. These were focused on assessing forecast performance in predicting clouds and the aerosol plume location, and relied mostly on the latest SEVIRI cloud retrievals, and clear-sky and above-cloud AOD from MODIS. This exercise allowed the team to track forecast failures and successes and provided a sense of reliability when making decisions based on forecasts.
2.3.6 Routine flights vs. target-of-opportunity flights
The ORACLES investigation concept featured a combination of routine flights to facilitate comparisons with climate models and to ensure sampling of a wide range of aerosol loadings and cloud conditions, with other flights addressing “targets of opportunity”. The “routine” flights all took place along a fixed latitude–longitude line with sampling at a range of altitudes and remote sensing of the full column. In 2016, the routine flight track was along a diagonal with endpoints of 20∘ S/10∘ E and 10∘ S/0∘ E; in 2017 and 2018 the routine flight track extended from the Equator to ∼15∘ S along 5∘ E. See Fig. 11 in Sect. 4.4 for a complete set of flight tracks.
In situ observations of aerosol microphysical and optical properties during the routine flights were envisioned to map the evolution of BB aerosol radiative properties during transport. HSRL-2 (High Spectral Resolution Lidar) observations from the P-3 or ER-2 helped map the spatial extent of the layers, while SSFR (Solar Spectral Flux Radiometer) and 4STAR (Spectrometer for Sky-Scanning, Sun-Tracking Atmospheric Research) observations provided additional insights into the in situ-derived aerosol properties via optical and radiative closure experiments. Measurements to address seasonal variations in direct aerosol radiative effects and their controlling factors were derived from the routine flights. The routine flight requirements were derived based on the assumption that the statistics of important observed aerosol and cloud properties, given sampling and measurement uncertainties, are sufficiently constrained to distinguish between climate model estimates. For this, we assumed that the variability in aerosol properties at model-relevant scales (100 km2) can be extrapolated from the analysis of Shinozuka and Redemann (2011) to be less than 20 % and that such variability is well below the inter-model differences on such scales.
Another motivation for the routine flights was to ensure sampling of a wide range of aerosol loadings and cloud conditions. The five to six envisioned routine flights (equaling ∼40–50 flight hours per deployment) that comprise the ORACLES threshold science objectives were intended to yield aerosol and cloud data in about 200 100 km2 climate model grid boxes. Prior to the start of the campaign, we investigated probability density functions (PDFs) of MODIS daily 1×1∘ averaged AOD between 10–20∘ S and 5∘ W–5∘ E for September 2001 derived from the then-available dark target algorithm. We randomly subsampled the roughly 3000 1×1∘ MODIS AOD boxes with the planned 200 airborne observations and found that the resulting PDFs were a good representation of the parent population of MODIS AOD. We concluded that the number of threshold science flight hours was adequate to compile probability density functions of aerosol properties that allow assessments of climate model differences at these spatial scales. This was confirmed by analysis after the first deployment (Shinozuka et al., 2020).
About half of the flight hours in each campaign focused on targets of opportunity, as detailed in Tables A1–A3 in Appendix A. These flights targeted specific science goals (e.g., capturing a range of aerosol ages, or contrasting conditions in terms of aerosol–cloud interactions). Flight patterns (e.g., “radiation walls”, square spirals) were optimized to leverage the measurement capabilities of the range of instruments on board the P-3 and to allow for later comparison of different methods of measuring a common parameter (e.g., aerosol SSA). During the 2017 and 2018 deployments, the target-of-opportunity flights were planned to be near the routine flight track whenever possible to improve sampling statistics.
2.3.7 Considerations for 2016 deployment with ER-2 and P-3
The planning for the 2016 field deployment in Namibia started in early 2015, with multiple site visits to the Walvis Bay airport, logistics and hotel providers, Namibian science partners, and representatives of various Namibian government organizations. This planning started early because the unexpected change to deploy both ORACLES aircraft in 2016 brought along a significant set of challenges due to the large contingency of scientific and aircraft support equipment needed, with this being the first of the three ORACLES deployments. The ORACLES team gratefully acknowledges the help provided by the Honorable Thomas F. Daughton, US Ambassador to Namibia from 2014 to 2017, and the support by the US embassy staff led by John Kowalski. The US embassy proved instrumental in receiving flight permissions and in arranging the student program in August 2016. The ORACLES team also received invaluable feedback and support from the Namibia University of Science and Technology (NUST), led by its rector, Tjama Tjivikua, and Dean Lameck Mwewa. In addition to NUST, the Gobabeb Training and Research Center led by Gillian Maggs-Kolling, the University of Namibia represented by Martin Hipondoka and Michael Backes as well as North-West University (South Africa) represented by Stuart Piketh provided information and logistics support throughout the 2016 campaign. As we describe in Sect. 3.5 below, these contacts were the springboard for the outreach efforts that led to the deployment of seven graduate students in the 2016 field campaign, including five students from NUST and the University of Namibia. In their totality, we hope that the efforts expended by the Namibian government and the Namibian and South African science community, as well as the reciprocating efforts by the ORACLES science team, can be considered a transformational effort in the context of science diplomacy (Annegarn and Swap, 2012), at least in so far as the experience for the individual students that participated in the outreach efforts are concerned.
2.4 Linkage with international deployment efforts (LASIC, CLARIFY, AEROCLO-sA)
ORACLES was not the only recent experimental investigation in the southeast Atlantic (see Fig. 1). The UK CLARIFY project, which deployed their BAe-146 plane from Ascension Island in August–September 2017 (Haywood et al., 2020), and the French AEROCLO-sA project, which deployed a Falcon-20 plane from Walvis Bay, Namibia, in August 2017 (Formenti et al., 2019), shared similar science objectives with ORACLES, as did the DOE Atmospheric Radiation Measurement mobile facility deployment to Ascension Island from June 2016 through October 2017 for the LASIC project (Zuidema et al., 2015). All four campaigns were active in August–September 2017, and a “suitcase” flight to Ascension Island by the NASA P-3 plane included a direct instrument intercomparison flight with the CLARIFY BAe-146 on 18 August 2017. Collaboration between all four campaigns continued through a joint data workshop held in Paris in April 2019, prior to a joint session at the annual meeting of the European Geophysical Union. The excitement generated from sharing insights and points of view, some similar and some not, from the individual campaigns led to a decision to hold another joint workshop in May 2020, planned for the United States but held virtually due to the COVID-19 pandemic. In one example, a different view of the relationship of the single-scattering albedo to aerosol aging was noted, with ORACLES scientists focusing more on the vertical structure (Fig. 12) and CLARIFY scientists interested in investigating the change in SSA with distance from the continent. The latter is an excellent example of the synergism afforded between the two campaigns, with ORACLES sampling air closer to the continent and the CLARIFY campaign sampling ∼1700 km offshore.
2.5 Outreach efforts
2.5.1 Namibia – 2016
During the field campaign held in Namibia in 2016, the gathering of science data not only benefited the scientists directly involved in the project; through an outreach program the science was extended to the Namibian population (and to some extent the broader southern African region). The outreach effort was multi-tiered and aimed to inform the public, develop young scientists, and encourage children to enter into STEM fields of study. Outreach activities included public lectures, interviews with local radio and newspapers, and open days at the airfield. In addition, ORACLES scientists traveled to northern Namibia for several days to participate in the Ongwediva Annual Trade Fair (OATF) together with students, staff, and faculty from the University of Namibia (UNAM), the Namibia University of Science and Technology (NUST), and the Gobabeb Research and Training Center. The OATF showcased collaborative environmental research from participating research institutes and was attended by Ongwediva-area students, business leaders, and local dignitaries.
In addition to these broader public engagement outreach activities, a targeted science development program was initiated with support from the US Embassy in Namibia and NUST. This 3-week full immersion outreach program was developed to provide promising local and regional young scientists with an opportunity to experience different components of a large complex airborne research field campaign. In total, seven post-graduate students (master's and PhD level), from Namibia (five students) and South Africa (two students), participated in the student guest program (Fig. 4). Student guests were exposed to the planning, modeling, and instrumentation used within the ORACLES field campaign. In addition to these broad field campaign skills, they received a solid foundation in basic atmospheric science through tutorials from the participating campaign scientists, some introductory programming tutorials, and an opportunity to interact with scientists aligned with their field of research. Within the duration of the program they also all had an opportunity to join a science flight. Further regional expansion of this student guest program was planned for the 2017 and 2018 field campaigns in collaboration with the CLARIFY and AEROCLO-sA campaigns, but with the move of the ORACLES field campaigns to São Tomé this expansion outreach effort could not be implemented.
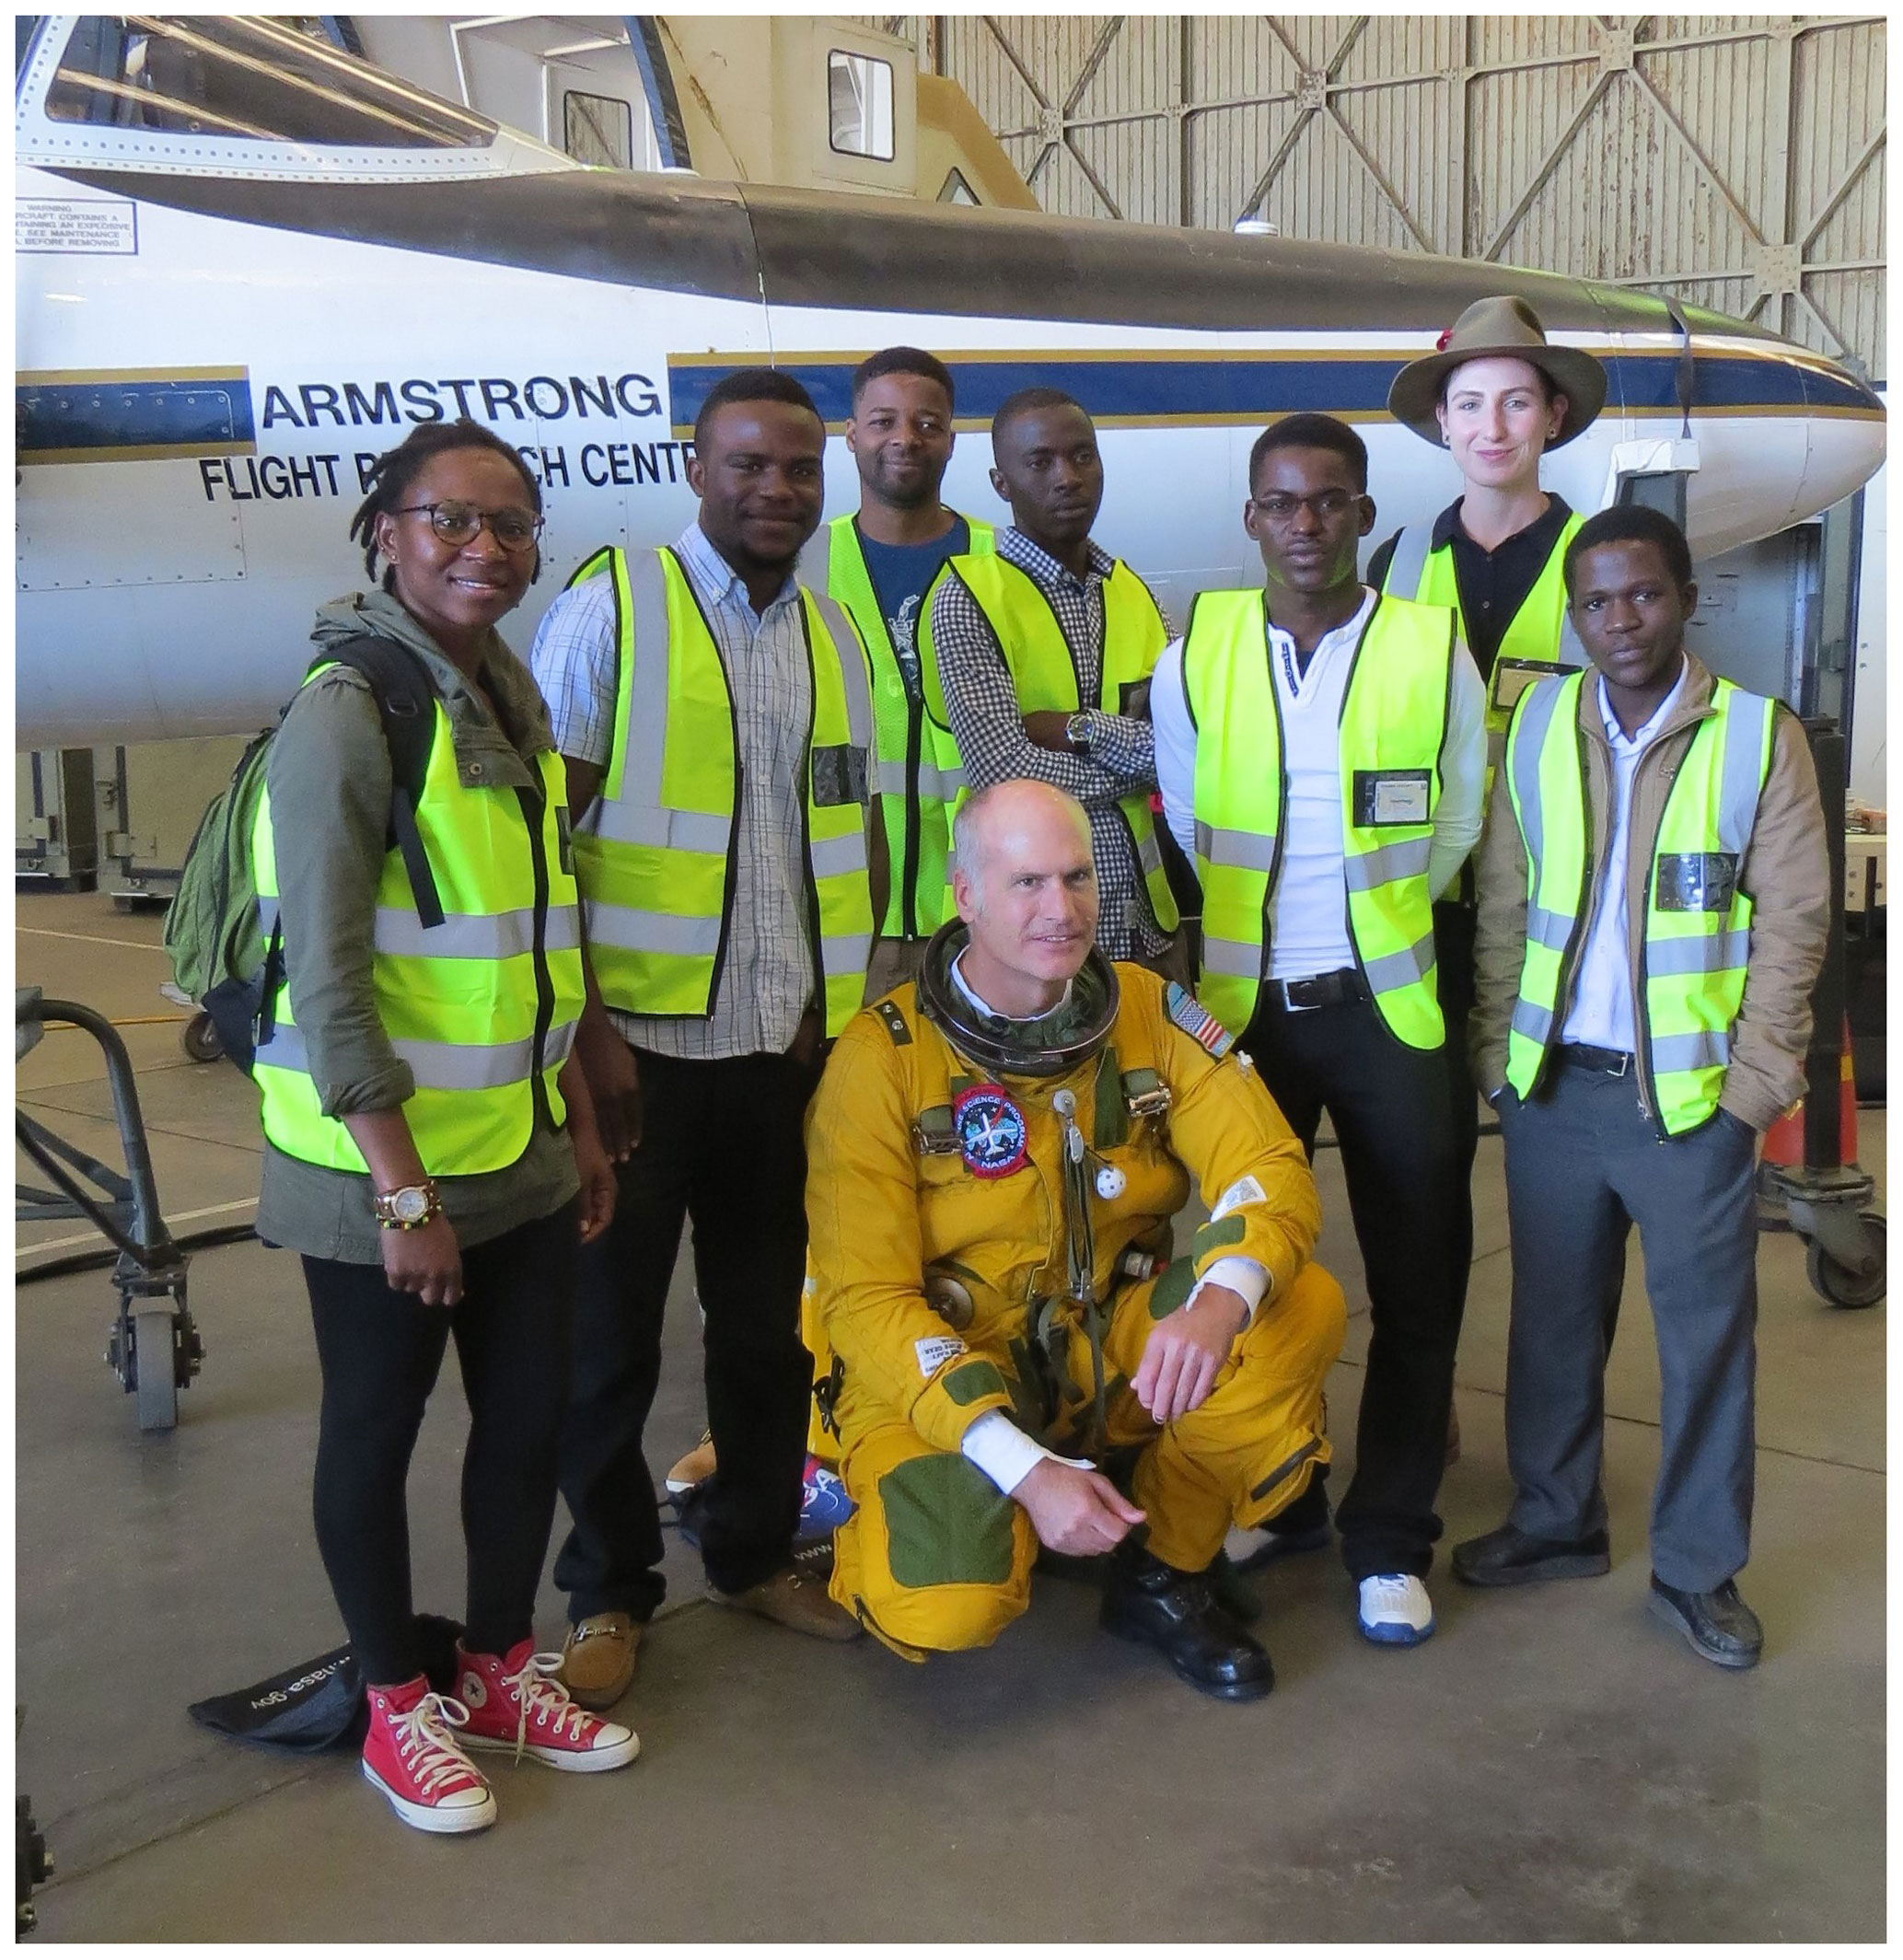
Figure 4The ORACLES guest students, together with ER-2 pilot, James Gregory Nelson, at the Walvis Bay airport.
2.5.2 São Tomé and Príncipe (STP) – 2017 and 2018
To understand the challenges of implementing an outreach program as part of a scientific project like ORACLES in São Tomé and Príncipe (STP), one needs to know a little about the history of this young country of just over 200 000 inhabitants. Previously uninhabited, the STP Archipelago was colonized by Portugal throughout the 16th century, when it served as a warehouse for the slave trade and established itself as a producer of sugarcane, coffee, and cocoa. STP independence from Portugal came in 1975, keeping Portuguese as its official language, although minority groups also speak at least four other dialects.
During an initial exploratory visit in 2015, built on a previous NSF-sponsored site visit, the ORACLES team contacted the Instituto Nacional de Meteorologia (INM) to establish collaborations. The INM operates at STP airport facilities and showed great initial enthusiasm for ORACLES deployments from STP. During the 2 years of ORACLES operations in 2017 and 2018, INM kindly issued daily weather reports tailored to ORACLES needs. There were several visits from the ORACLES team to INM, and Aristómenes Amadeu do Nascimento of INM attended various ORACLES weather briefings.
The only public university in STP and the most important one, the University of STP (USTP), was established only in 2014. The creation of USTP came to address fundamental and emergency problems of the country, which included training of personnel for the health and education sectors, agriculture, and food production. When the ORACLES team deployed to STP in 2017, USTP had, in its current format, only 2 years of existence, still consolidating its vocations and priorities. Nevertheless, the institution represented by Aires Bruzaca (dean), João Pontífice (vice dean), and Manuel do Sacramento Ramos Penhor was enthusiastic about establishing scientific collaborations with NASA.
The ORACLES team organized a series of seminars about ORACLES scientific objectives for the USTP and INM communities. The seminar themes also included the AERONET (Aerosol Robotic Network) and Pandora NASA projects, global networks of spectrometers designed to retrieve, respectively, aerosol optical depth and microphysical parameters (Holben et al., 1998; Dubovik and King, 2000), and total columns of ozone and other trace gases in the atmosphere from direct-Sun measurements (Herman et al., 2009, 2015; Tzortziou et al., 2012). All lectures were presented by ORACLES science team members in Portuguese to address potential language barriers.
A Pandora Spectrometer Instrument (PSI) and an AERONET instrument were brought to STP as part of the ORACLES deployment. The main goal, especially for the PSI deployment, was to assess whether mutual goodwill, interest, and capabilities exist for NASA, USTP, and INM to collaborate scientifically long term. The team was successful in training professors of the USTP to operate the PSI and the AERONET instruments (Fig. 5), and this resulted in additional aerosol measurements beyond the campaign periods. Moreover, it laid the foundation to have STP as one of the sites of the Pandora network, with an official agreement between NASA and the USTP signed in 2018.
The ORACLES team found in STP a community open to and eager for the establishment of a fruitful scientific cooperation. Our experience points out that involvement with the local community is of extreme importance, not only for the dissemination of scientific knowledge but also to facilitate engagement between the young scientists from both communities. Collaboration with local scientific communities during field deployments such as ORACLES has the dual benefits of enhancing local scientific capabilities in under-resourced areas of the world and producing tangible benefits for this and future missions in the region.
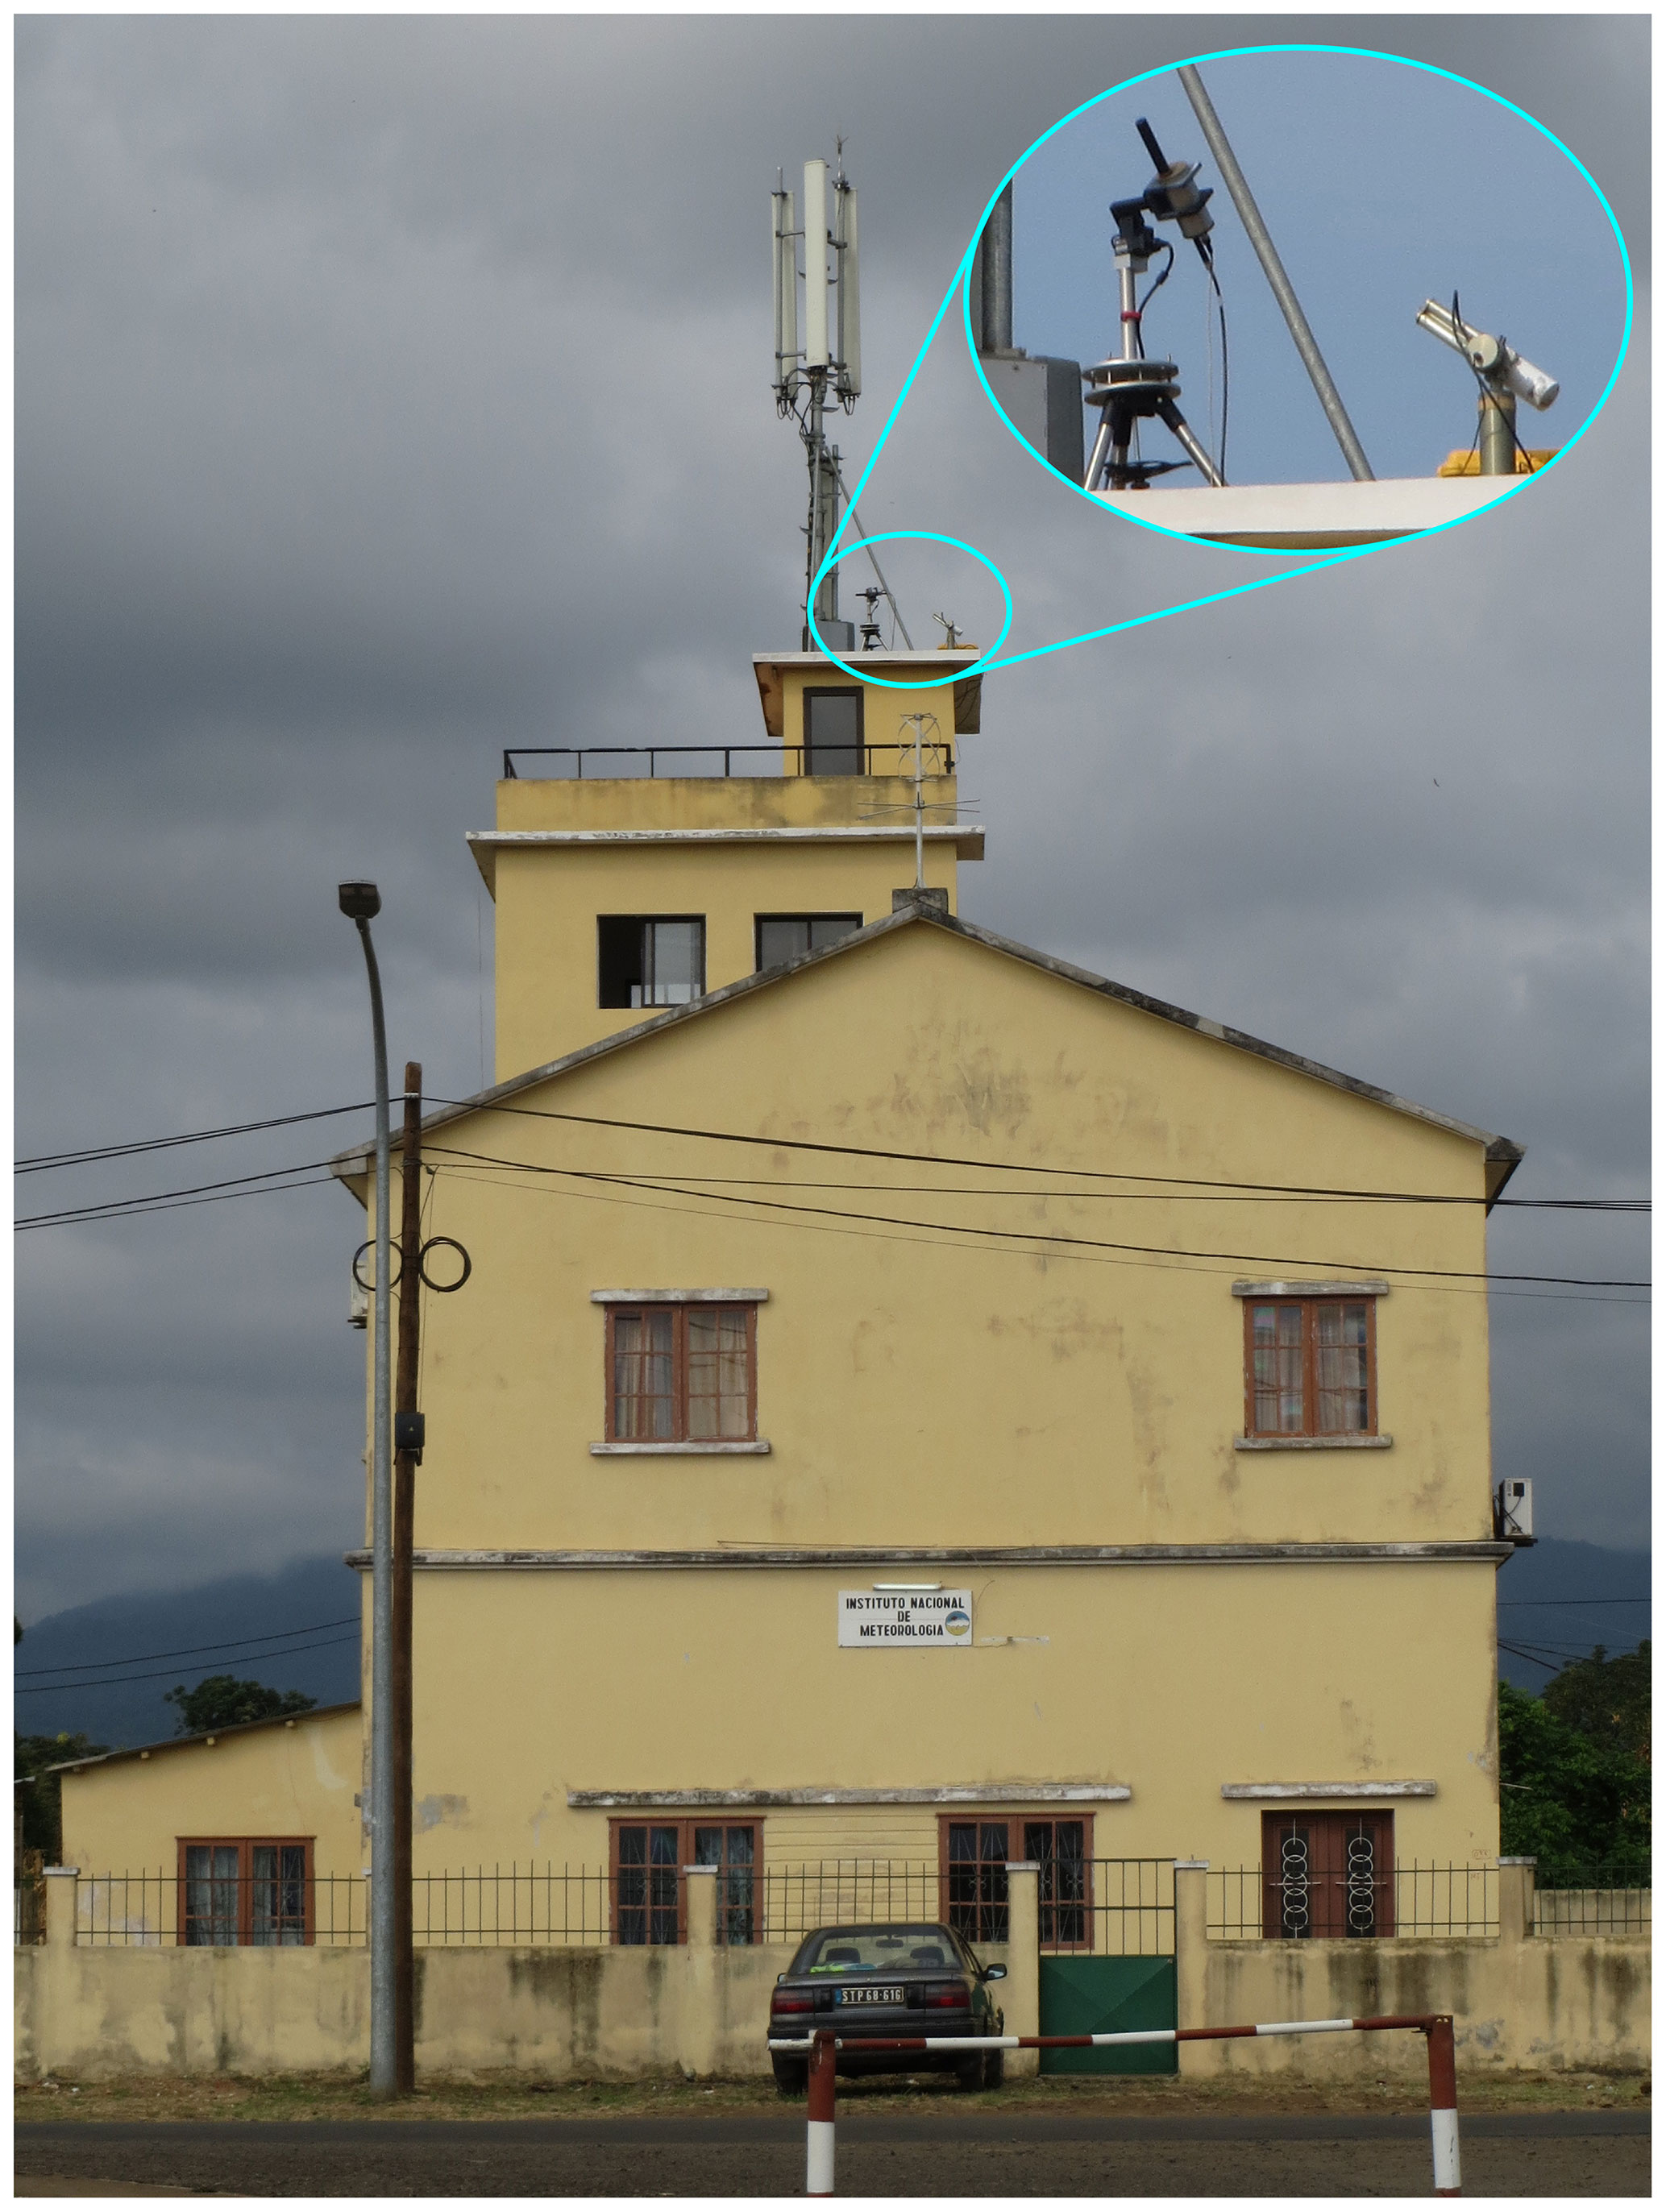
Figure 5A picture of the STP Instituto Nacional de Meteorologia (INM), with an inset of the Pandora and AERONET instruments temporarily installed on the rooftop. Photo credit: James Podolske.
3.1 Meteorological context
The key feature of the circulation that transports fire emissions from the African continent over the southeast Atlantic is the easterly flow above about 2 km. Figure 6 shows the 4 km flow and relative humidity (RH) from the ERA-Interim reanalysis, along with the southerly limit of significant rainfall from the monthly 0.25∘ satellite-based 3B43 dataset (Huffman et al., 2007) for the 19-year September mean (2000–2018). The easterly flow maximizes around 8∘ S, reaching minima near 4∘ N and 18∘ S. This flow is maintained by the thermally direct circulation over the continent, which is driven by heating of the elevated African plateau south of 10∘ S (Adebiyi and Zuidema, 2016). The moister regions to the north are cooler, consistent with the thermal wind relation and the easterly shear below the jet. The jet is similar in character to the northern African Easterly Jet (NAEJ; consistent with the temperature gradient between the hot Sahara desert and the cooler equatorial region), if not as pronounced. Since there is no heating source over the southeast Atlantic, the jet decreases in intensity as soon as the winds leave the continent. The mean 4 km flow then curls anticyclonically near 10–20∘ W and merges with the midlatitude jet, most pronounced in September–October. Smoke associated with this flow has been observed as far away as the South Pacific (Chatfield et al., 2002).
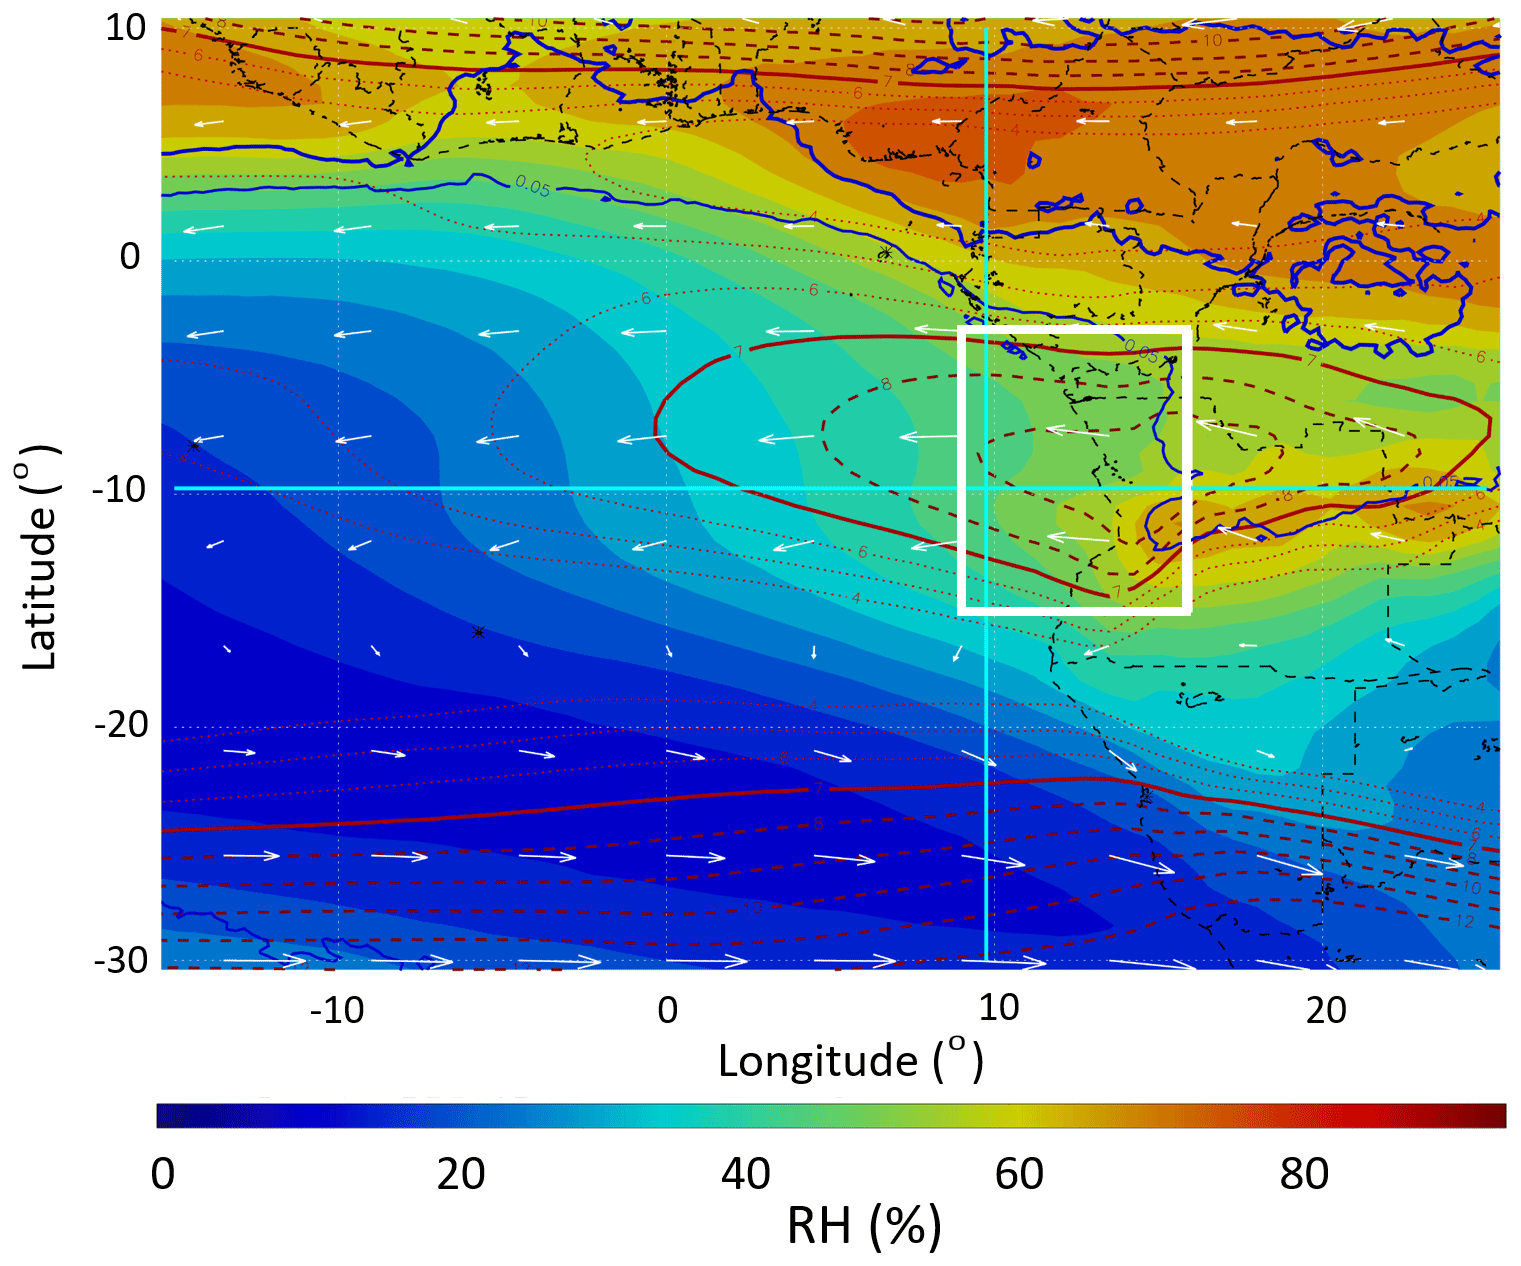
Figure 6September-mean relative humidity (RH – color fill) and horizontal winds at 4 km (averaged over 600–650 hPa – red contours and white arrows), and the southerly limit of significant rainfall averaged over 19 years (2000–2018 – blue contour). Heavy solid and dashed red contours indicate elevated wind speeds (7 m s−1 – solid; 8 and 9 m s−1 – dashed). The white rectangle encompasses 8–16∘ E and 14–3∘ S. The cyan lines refer to 9.75∘ S and 9.75∘ E, respectively (see Fig. 7). RH and winds are from the ERA-Interim analyses, and the rainfall is from the monthly 0.25∘ satellite-based 3B43 dataset.
The RH at 4 km altitude provides a useful qualitative indicator of the effects of upward vertical motion (Fig. 6). North of about 3∘ S, rainfall is substantial (averaging 0.25 mm h−1), and the enhanced RH is almost certainly due to moist convection. The 4 km RH decreases south of 3∘ S, with a secondary maximum near 10–11∘ S. This feature is present in other analyses as well (e.g., Modern Era-Retrospective Analysis for Research and Applications, MERRA-2, not shown) and occurs at the boundary between the Congo River basin (about 300 m) and the elevated African plateau (up to 1500 m). Though moist convection is present in this region, most of the vertical mixing is probably due to dry convection. The effects of this dry convection on the temperature and RH profile have been seen in the occasional radiosondes over south central Africa and downstream over St. Helena Island.
Figure7a and b show latitudinal and longitudinal cross sections along the lines indicated in cyan in Fig. 6, also for the 19-year September mean. Figure 7a clearly shows the southern African Easterly Jet (SAEJ) near 4 km and 8∘ S, just offshore at 9.75∘ E. The enhanced RH extends up to about 5–6 km between 10 and 20∘ S, at times moist enough to support mid-level clouds (Adebiyi et al., 2020). Notably, even though the flow is easterly (though weaker) above 6 km, the air is dry, indicating that convection is not reaching those levels on a consistent basis. Farther north, moist convection is maintaining RH exceeding 80 % up to 7 km (and higher, not shown). Another notable feature is the dry tongue extending to 10–15∘ S at 1–2 km, just above the moist boundary layer. At low levels, there is a strong southerly jet associated with the St. Helena high-pressure system. Potential temperature surfaces slope downward and northward to about 15∘ S, implying subsidence and drying of the northward flow (Fig. 6a).

Figure 7September-mean (a) meridional and (b) zonal cross sections of RH (shading), potential temperature (black contours), and horizontal winds (white barbs), with wind speeds exceeding 7 m s−1 outlined in magenta contours (7 m s−1 – solid; 8 and 9 m s−1 – dashed), at (a) 9.75∘ E and (b) 9.75∘ S, respectively, averaged over 19 years (2000–2018). (c) Strength of the SAEJ averaged over the volume defined by the white rectangles in panels (a) and (b). The solid lines represent the individual and 19-year (2000–2018) means; the dashed lines represent the standard deviation during the 19-year period.
The longitudinal cross section at 9.75∘ S, the approximate meridional center of the SAEJ, indicates that the SAEJ is strongest at the coastline. The top of the moist layer is roughly consistent with the top of the daytime boundary layer over the continent near 16∘ E (Fig. 6b). The RH decreases in the mean as the air flows westward, consistent with the overall subsidence over the SE Atlantic. This subsidence is consistent with modest radiative cooling in this region.
An analysis of the SAEJ (averaged over a volume the white rectangle in Fig. 6 and the upper left panels in Fig. 7a and b) shown in Fig. 7c reveals that some months during deployment years deviated substantially from the average (such as October 2016). The actual deployment months varied – the SAEJ strength in September 2016 is ∼0.7 m s−1 weaker than the climatological mean, the SAEJ strength in August 2017 is weaker than the climatological mean, and the SAEJ strength in October 2018 is very similar to the climatological jet intensity. The individual August–October months of the three ORACLES deployment years are compared to the climatological means of RH and winds at 4 km altitude (represented as the SAEJ) in Fig. 8.

Figure 8The same as Fig. 6 except for the 19-year mean (2000–2018) and 3 years of the ORACLES deployment (2016, 2017, and 2018). The boxes with magenta frames indicate the ORACLES deployment months. The white rectangle represents the area over 8–16∘ E and 14–3∘ S.
Clearly apparent is the southward progression of the regions of significant rainfall as the seasons change and the strengthening of the SAEJ. Note that the basic westward circulation at 4 km is present for all 3 months but is only about half as strong in August as in the other 2 months. The other rows represent the three ORACLES years (2016–2018), with the relevant deployment months outlined in magenta. A number of features are apparent. Rainfall in September 2016 was greater in the SAEJ region than typical, and RH values were higher. The strength of the SAEJ in 2016 was about average. The August SAEJ strength was about average during the 2017 deployment year, though RH values were lower than climatology. The October 2018 SAEJ strength was also about average, rainfall was about typical, and RH values were lower than the climatology.
Similar to the SAEJ feature, the southeasterly low-level jet and boundary layer flow intensity during deployment years are within the range of climatological mean, even though some months deviated substantially from the average. The most important feature of the boundary layer height (BLH) over the area that ORACLES sampled is an overall decrease in BLH from August to October (not shown), consistent with climatological monthly-mean radiosonde profiles at St. Helena Island (Adebiyi et al., 2015).
3.2 Aerosol and cloud context
As pointed out above, the interannual variability in fire emissions in southern Africa was expected to be low (van der Werf et al., 2010), and as a result, aerosol loading in the ORACLES region was expected to be repeatable, with analyses of MODIS clear-sky AOD retrievals in the project planning stage implying year-to-year variability through the burning season of only 20 % of the mean. Since the beginning of the ORACLES project, a number of MODIS- and SEVIRI-based retrieval algorithms for above-cloud aerosol optical depth (ACAOD) have been developed (Meyer et al., 2015; Jethva et al., 2016, 2018; Peers et al., 2019; Sayer et al., 2019), allowing a study of the interannual variability of the aerosol loading above clouds, which is more relevant for ORACLES science objectives than clear-sky AOD. In this section, we describe the interannual variability of MODIS-detected fire counts, ACAOD, and Sc cloud fractions in August, September, and October for the three ORACLES flights years, i.e., 2016–2018. We compare them to the climatologies of the same quantities for the period of 2003 to 2018 for context (Fig. 9). MODIS data are a composite of Terra and Aqua, where available.
Within each panel, Fig. 9 shows monthly averages of fire counts as blue-to-red shading over land, ACAOD as yellow-to-red shading over ocean (Meyer et al., 2015), and low cloud fractions as black contours over ocean, for August, September, and October. The top row of panels shows the 2003 to 2018 climatological means, while the second, third, and fourth row of plots provide the August, September, and October means for the 3 deployment years, i.e., 2016 to 2018.
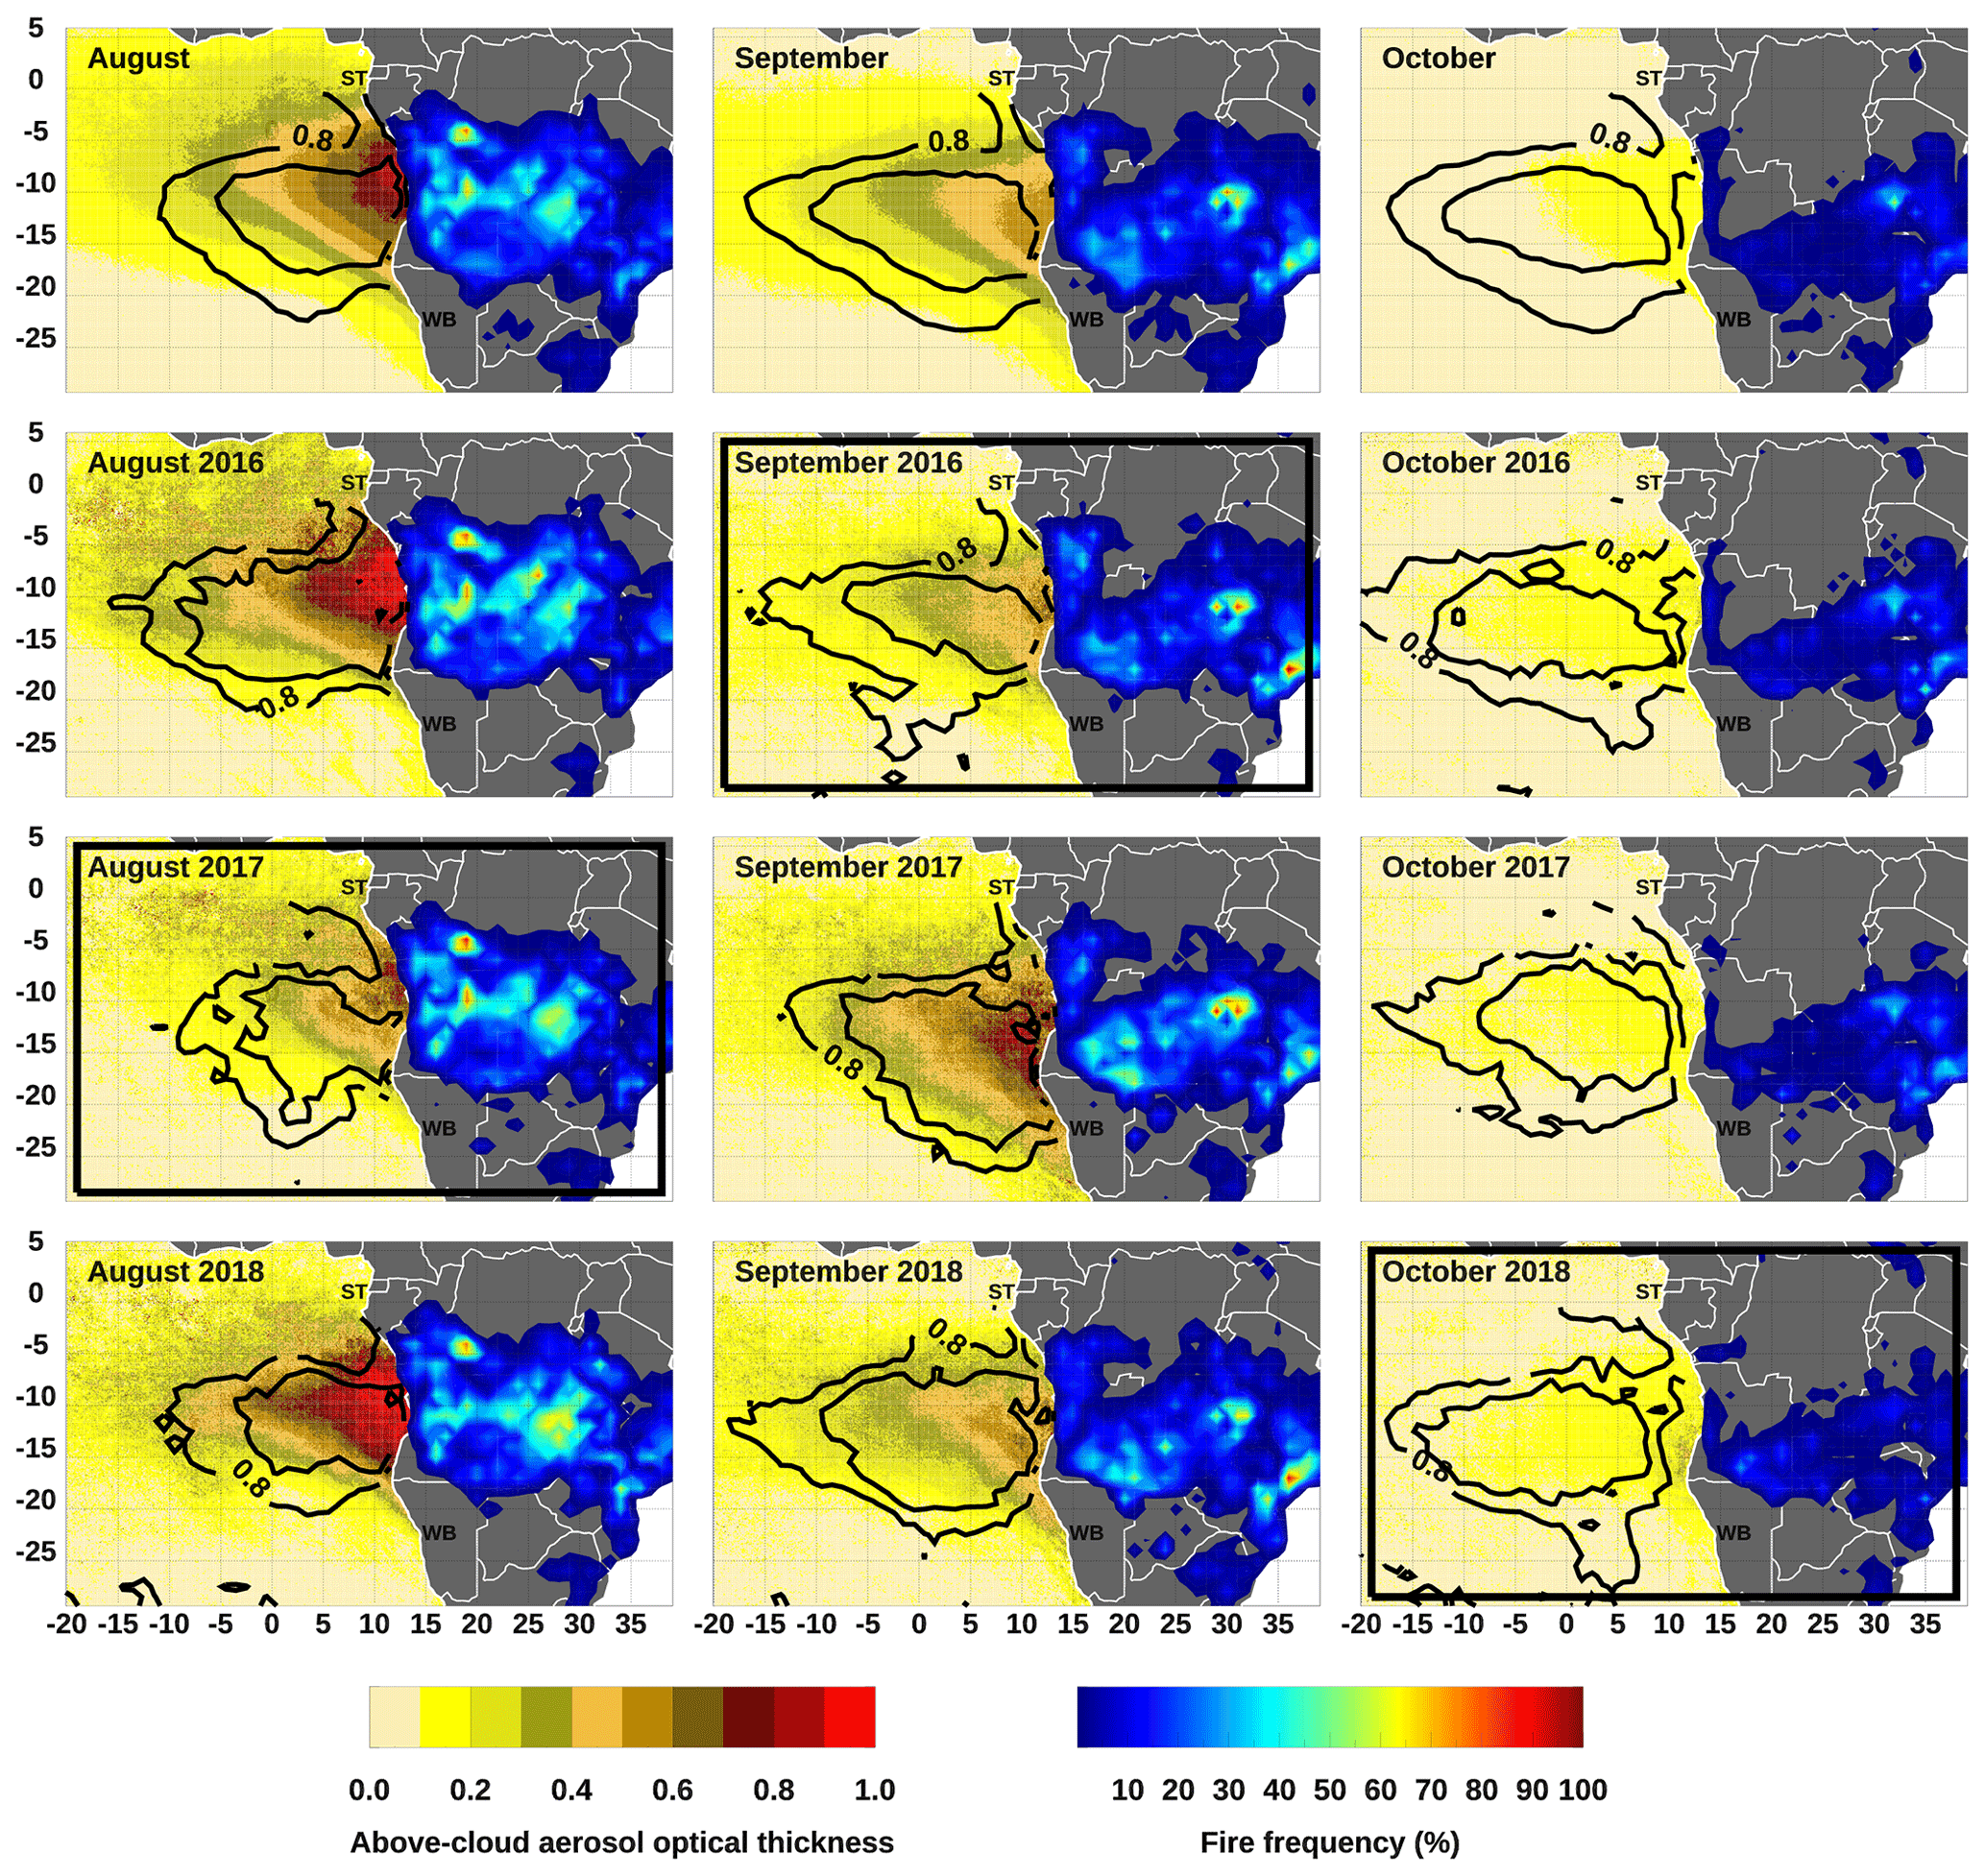
Figure 9Combined Terra–Aqua data for August, September, and October, aggregated at 0.1∘. Yellow to red shading over water indicates above-cloud AOD, black open contours indicate low-level (cloud top below 2.5 km) cloud fraction of 0.8 and 0.9, and color shading over land indicates MODIS fire frequency for fires with detection confidence above 70 %. Top row: climatologies computed over 2003–2018 (coinciding with the Aqua record). Second through fourth row: monthly averages for August through October 2016, 2017, and 2018, respectively. ST and WB stand for São Tomé and Walvis Bay. Bold black frames indicate ORACLES deployment months.
Overall, Fig. 9 corroborates the initial assumption that the interannual variability in fire locations and fire counts is relatively small. While there are differences from month to month, both in a given year and in the climatology, the fire counts in the three deployment years are very similar to the climatologies, with minor differences discussed below. We attribute this to the interannual consistency in agricultural practices in the various burning regions. The extent of the Sc cloud deck exhibits some interannual variability. The August Sc cloud distributions in 2016 to 2018 appear quite similar to the August climatologies, while some of the September and October distributions appear to extend slightly farther south or west. The largest interannual differences of any of the quantities shown in Fig. 9 are in the ACAOD. The August 2016 and 2018 plumes appear stronger than the climatological plume, while the August 2017 plume appears weaker than the climatology; the September 2016 and 2018 plumes appear slightly weaker than the climatologies, while the September 2017 plume appears slightly stronger than the climatological plume; the October plumes in 2016 to 2018 are somewhat reproducible year to year, but they all appear slightly stronger than the October climatology. Overall, this supports the conclusion of an earlier and possibly prolonged presence of the BB plume over the SE Atlantic in recent years, relative to the 2003 to 2018 climatology.
As far as the specific ORACLES deployment months are concerned (black outlined panels in Fig. 9), September 2016 shows a slightly weaker ACAOD plume than the climatology. We attribute this mainly to slightly weaker free troposphere (FT) winds in the SAEJ and slightly lower RH at plume level (see RH contours, and 7 m s−1 contours not extending as far westward in Fig. 8). August 2017 also has a slightly weaker ACAOD plume than the climatology; since fires are as strong or even stronger than the climatology, we again attribute this to a slightly weaker SAEJ than the climatological mean. October 2018 has a slightly stronger plume than the climatology: the SAEJ winds are very similar to the climatology, but fires in southern Angola appear to be slightly stronger and a more expansive area of elevated RH is present by comparison to the climatology, likely giving rise to the more expansive BB plume in this month.
3.3 Cloud droplet number concentrations and boundary layer winds
As ORACLES science objectives encompassed direct, semi-direct, and indirect effects, we were keenly aware of the interannual variability of marine boundary layer pollution levels, as well as boundary layer wind strengths and directions. In analogy to Sect. 4.2, this section summarizes our current assessment of the interannual variability of boundary layer winds and of cloud droplet number concentrations, Nc, the latter as a proxy for BL pollution.
Cloud droplet number concentrations are derived following Painemal and Zuidema (2011) as
where COD is the cloud optical depth and CER is the cloud droplet effective radius near cloud top. Equation (1) assumes an adiabatic liquid water content profile and a vertically uniform Nc (Szczodrak et al., 2001). Nc is computed from COD and CER products that have accounted for the above-cloud AOD (Meyer et al., 2015). These products are used instead of those from the MODIS standard product (i.e., MXD06) where CODs are typically underestimated in the retrievals due to the top of atmosphere (TOA) shortwave reflectance absorption by overlying smoke aerosols (Haywood et al., 2004; Coddington et al., 2010; Meyer et al., 2013).
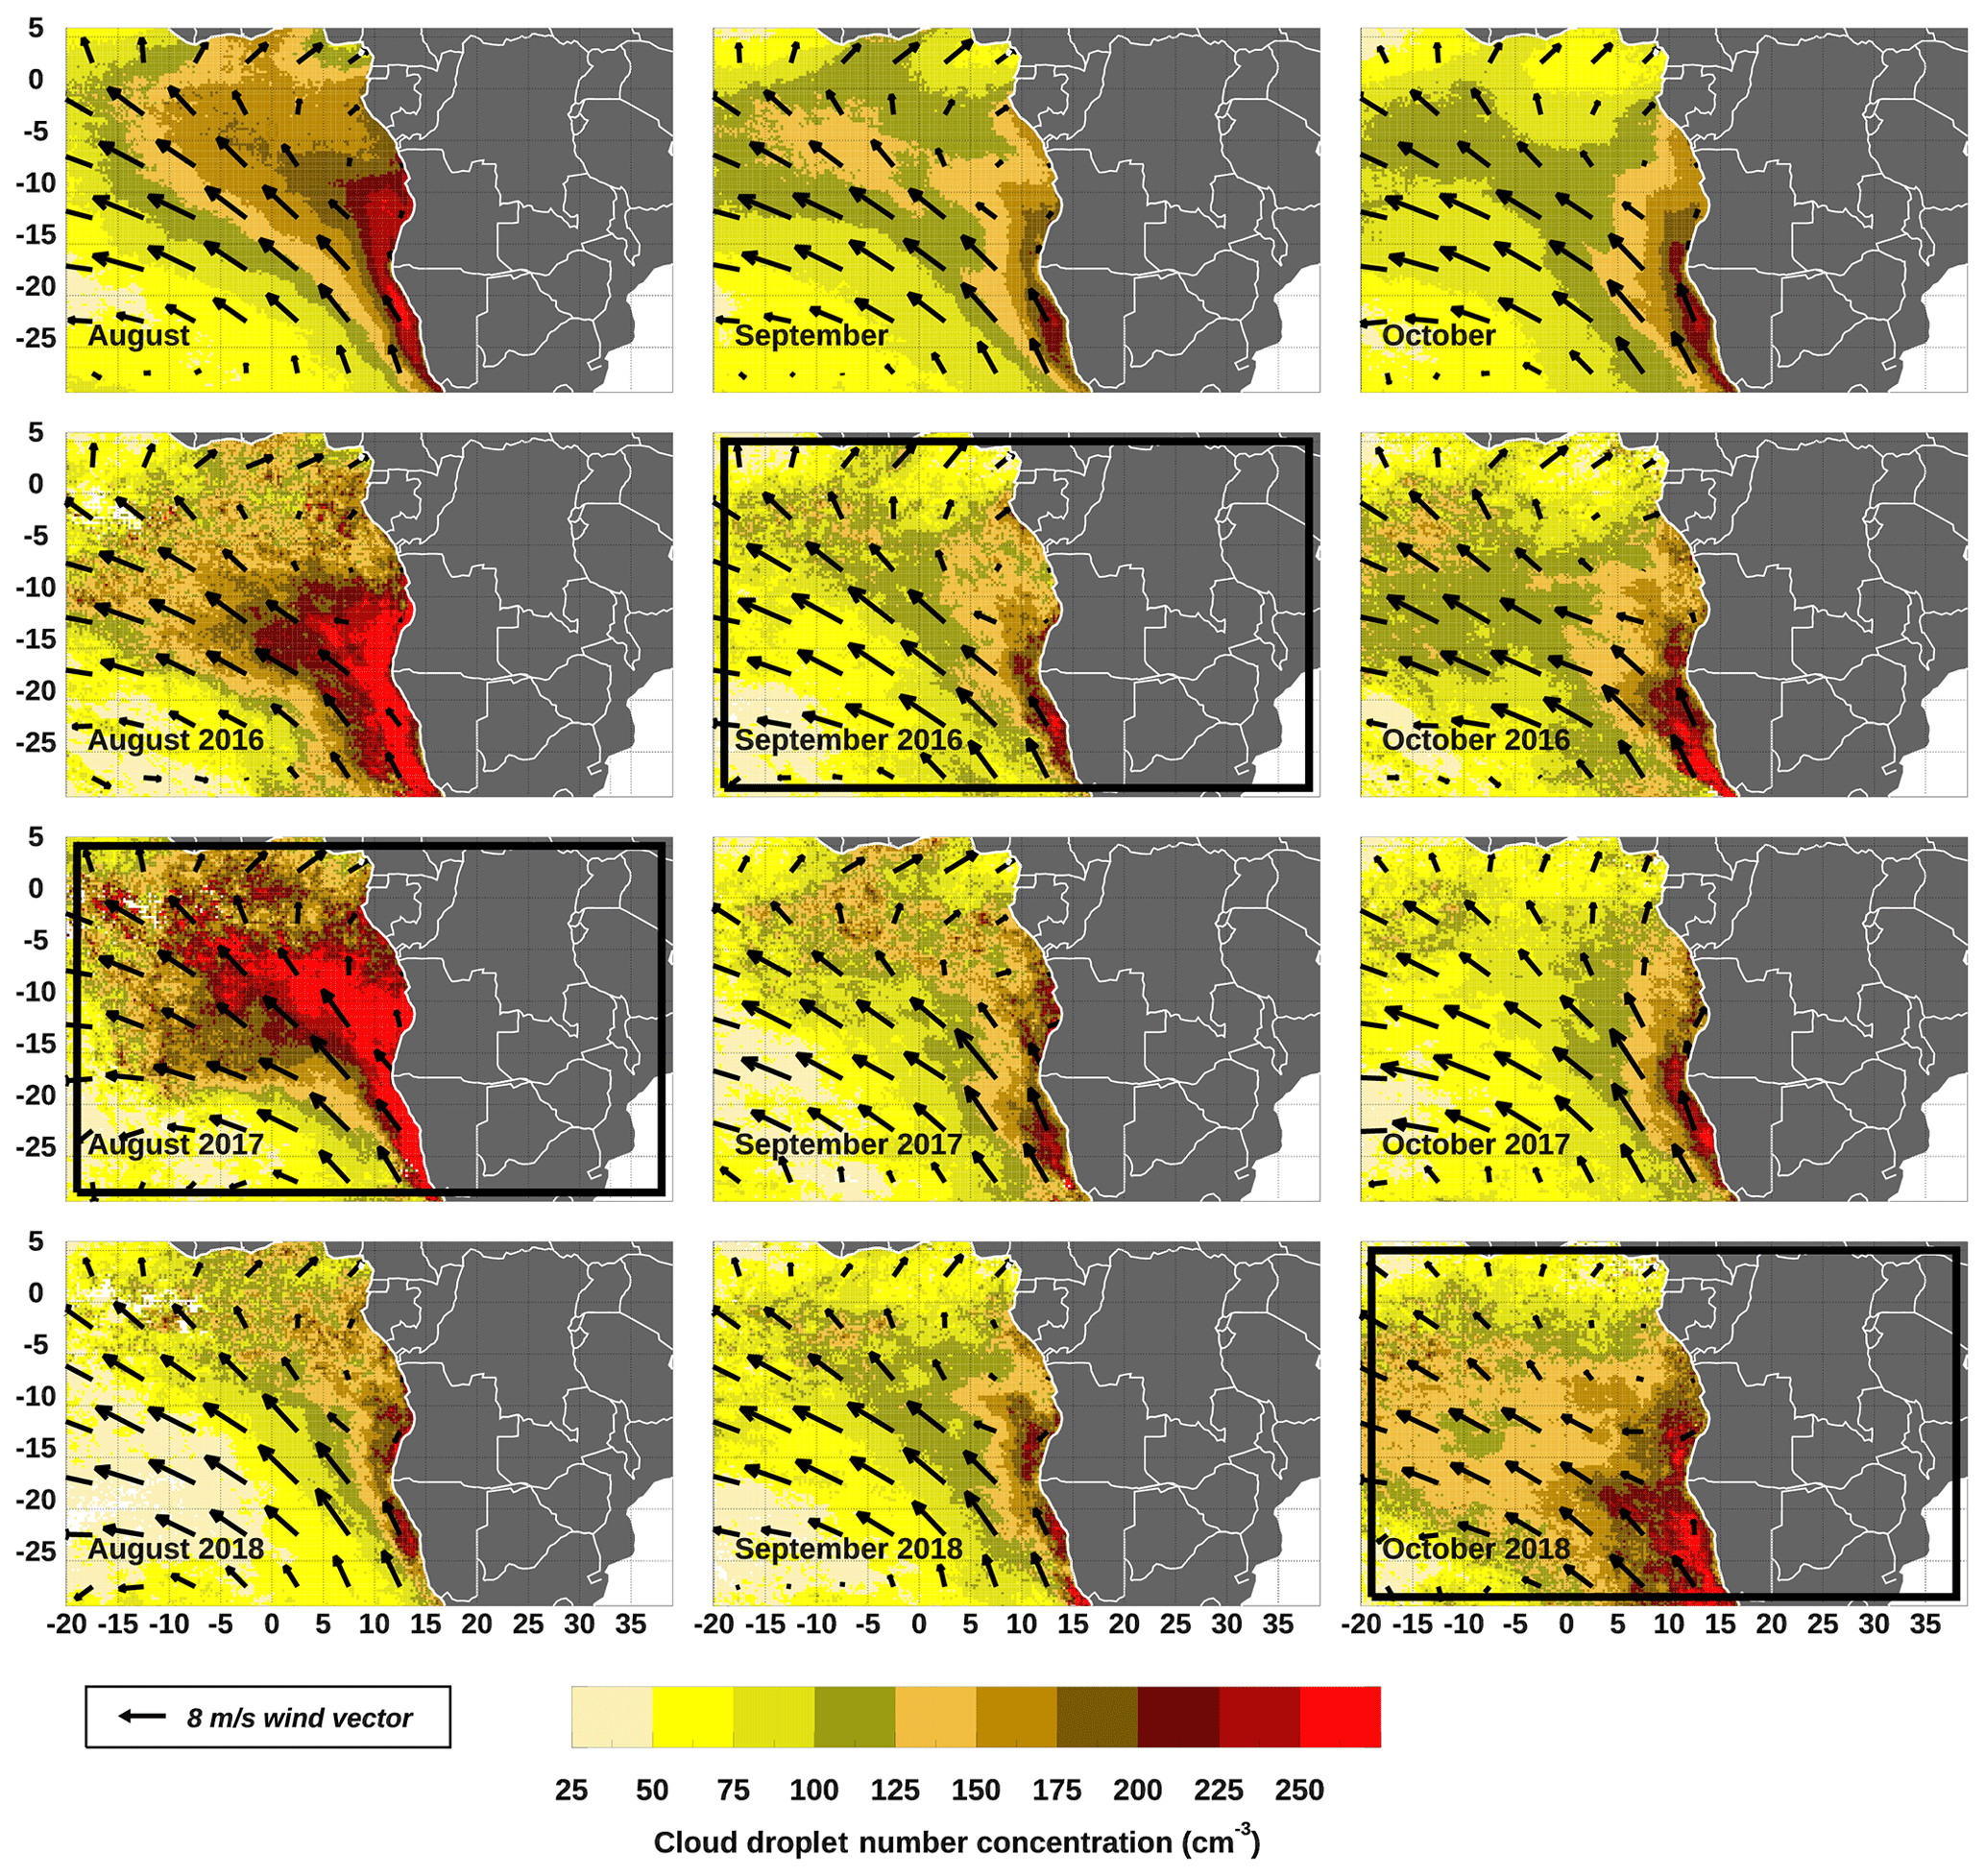
Figure 10As in Fig. 9, but for Nc from combined Terra–Aqua retrievals for August, September, and October, aggregated at 0.1∘. Black arrows denote 925 mb wind vectors with 8 m s−1 wind vector scale shown in the black box. The bold black frames indicate ORACLES deployment months.
Within each panel, Fig. 10 shows monthly averages of Nc calculated from MODIS Aqua and Terra cloud optical depth (COD) and effective radius (CER) retrievals as yellow-to-red shaded contours, along with 925 mb wind data from the National Centers for Environmental Prediction (NCEP) reanalysis. As in Fig. 9, the top row of plots shows the climatological mean from 2003 to 2018 for August, September, and October, while the second, third, and fourth row show the monthly means for the same months in 2016, 2017, and 2018, respectively. Overall, there are striking deviations in the Nc averages in every year relative to the climatological mean. August 2016 and August 2017 show significantly larger Nc, while August 2018 shows a lower Nc relative to climatology. By contrast, the September Nc values in 2016 to 2018 resemble the climatological mean quite closely. October 2016 and October 2017 are again quite similar to the October climatology while the October 2018 Nc values are significantly elevated relative to climatology. MBL winds in most months were similar to the climatological means, with the notable exception of the 2018 October ORACLES deployment, when the MBL winds were somewhat weaker than the climatological means.
To summarize our findings regarding the general plume and MBL pollution levels during the ORACLES deployment months (September 2016, August 2017, and October 2018), we note that the September 2016 FT plume and boundary layer Nc values were quite similar to the climatologies of these quantities. August 2017 featured a FT BB plume with notably lower ACAOD but an MBL with significantly elevated Nc relative to the climatologies. October 2018 featured a markedly more expansive FT ACAOD plume and a simultaneously more polluted MBL with significantly elevated Nc. Detailed explanations for these interannual variations are currently the subject of at least one ORACLES-related investigation. Taking all 3 years together, mean ACAOD values were slightly lower than their climatological mean values for August–October and Nc values slightly higher than climatology. These deviations are substantially smaller than the day-to-day variability sampled in the three campaigns, and we therefore consider the ORACLES measurements to have captured representative conditions overall. Detailed assessment of the representativeness of the actual aircraft observations, which only sampled a fraction of the days within each of the three measurement months, has been undertaken in the model–observation intercomparison studies (Shinozuka et al., 2020). This assessment indicates that the airborne sampling provides averages sufficiently representative of the monthly means to be able to characterize and test model skill at representing geographical gradients in climatological mean plume structure. The wide range of varying aerosol–cloud vertical structures sampled are sufficient for addressing all of the originally postulated objectives.
3.4 Description of flights and links to data
In total, the P-3 aircraft flew 350.6 flight hours in 44 flights for science operations between September 2016 and October 2018, while the ER-2 flew 97.3 flight hours in 12 science flights in 2016. Both tallies include transit flights with science data collections into and out of the deployment sites, because on many occasions valuable science data were collected during these flights. The P-3 flight hours and flight counts exclude an attempt at a transit flight from Ascension Island in 2017, which had to be aborted due to an aircraft malfunction.
Figure 11 shows the flight tracks of the three P-3 ORACLES deployments in 2016 (light blue), 2017 (orange), and 2018 (dark blue) and the ER-2 flights in 2016 (green). In each of the flight years, about half of the P-3 flights lie on top of each other along the routine flight track as described above. For clarity, the 2018 P-3 flight tracks have been offset by 0.1∘ in longitude to allow distinction from 2017 P-3 flight tracks. In their totality, these flight tracks cover a vast portion of the climatological SE Atlantic Sc cloud deck and the overlying BB plume.
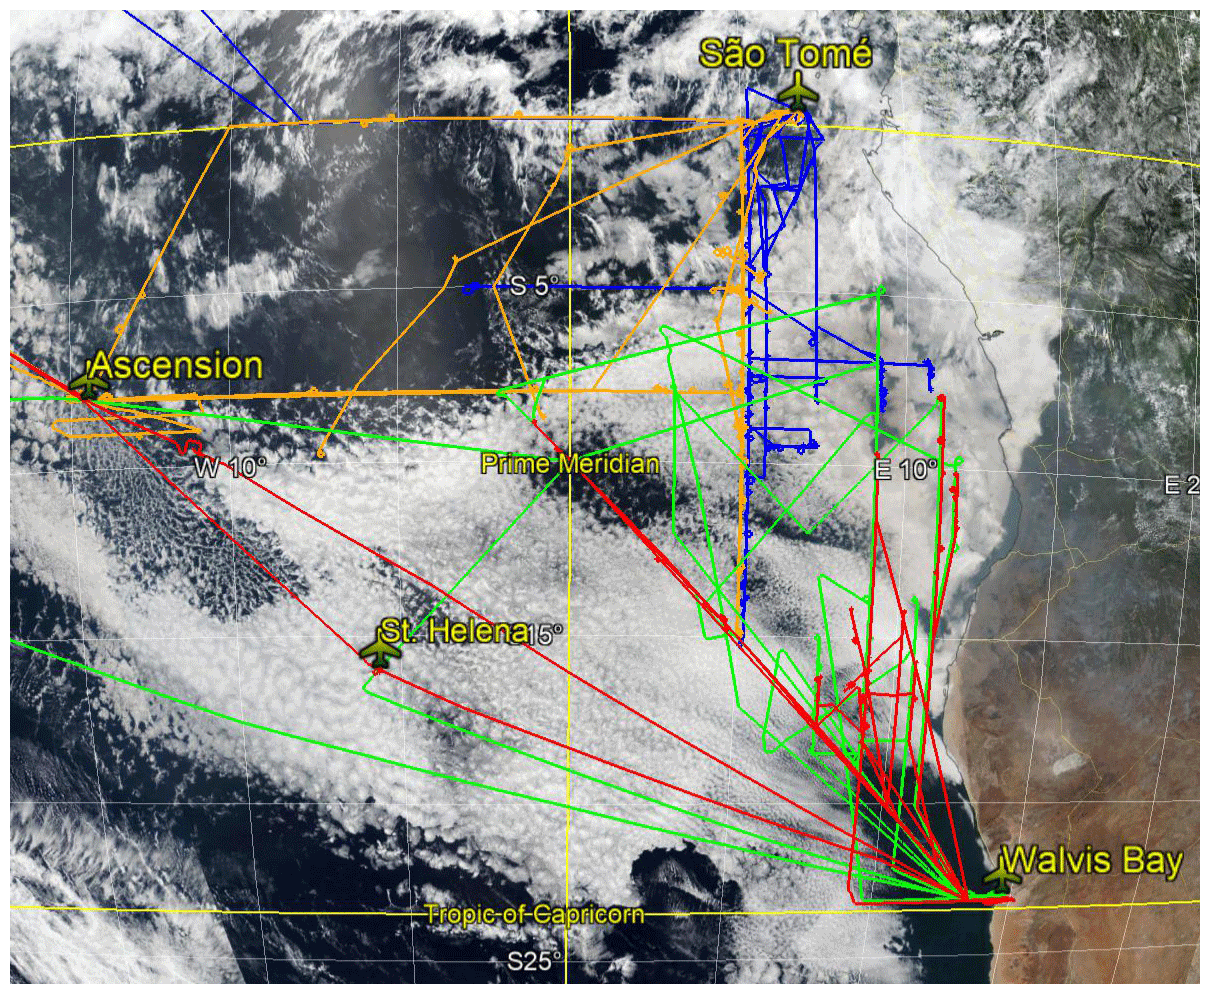
Figure 11Flight tracks of the ORACLES aircraft in 2016 to 2018, overlain on a MODIS-Aqua True Color Image acquired on 13 September 2018. ER-2 flight tracks in 2016 (only deployment year) are shown in green, adapted from © Google Maps 2020. P-3 flight tracks in 2016, 2017, and 2018 are shown in red, orange, and blue, respectively. The 2018 P-3 flight tracks are offset by 0.1∘ in longitude to allow distinction from 2017 flight tracks.
Table 2 summarizes eight types of flight maneuvers conducted during research flights and briefly describes the purpose for each maneuver. Figure 12 provides a schematic representation of each of these flight maneuvers.
Table 2P-3 flight maneuvers conducted during research flights, and their primary purpose.
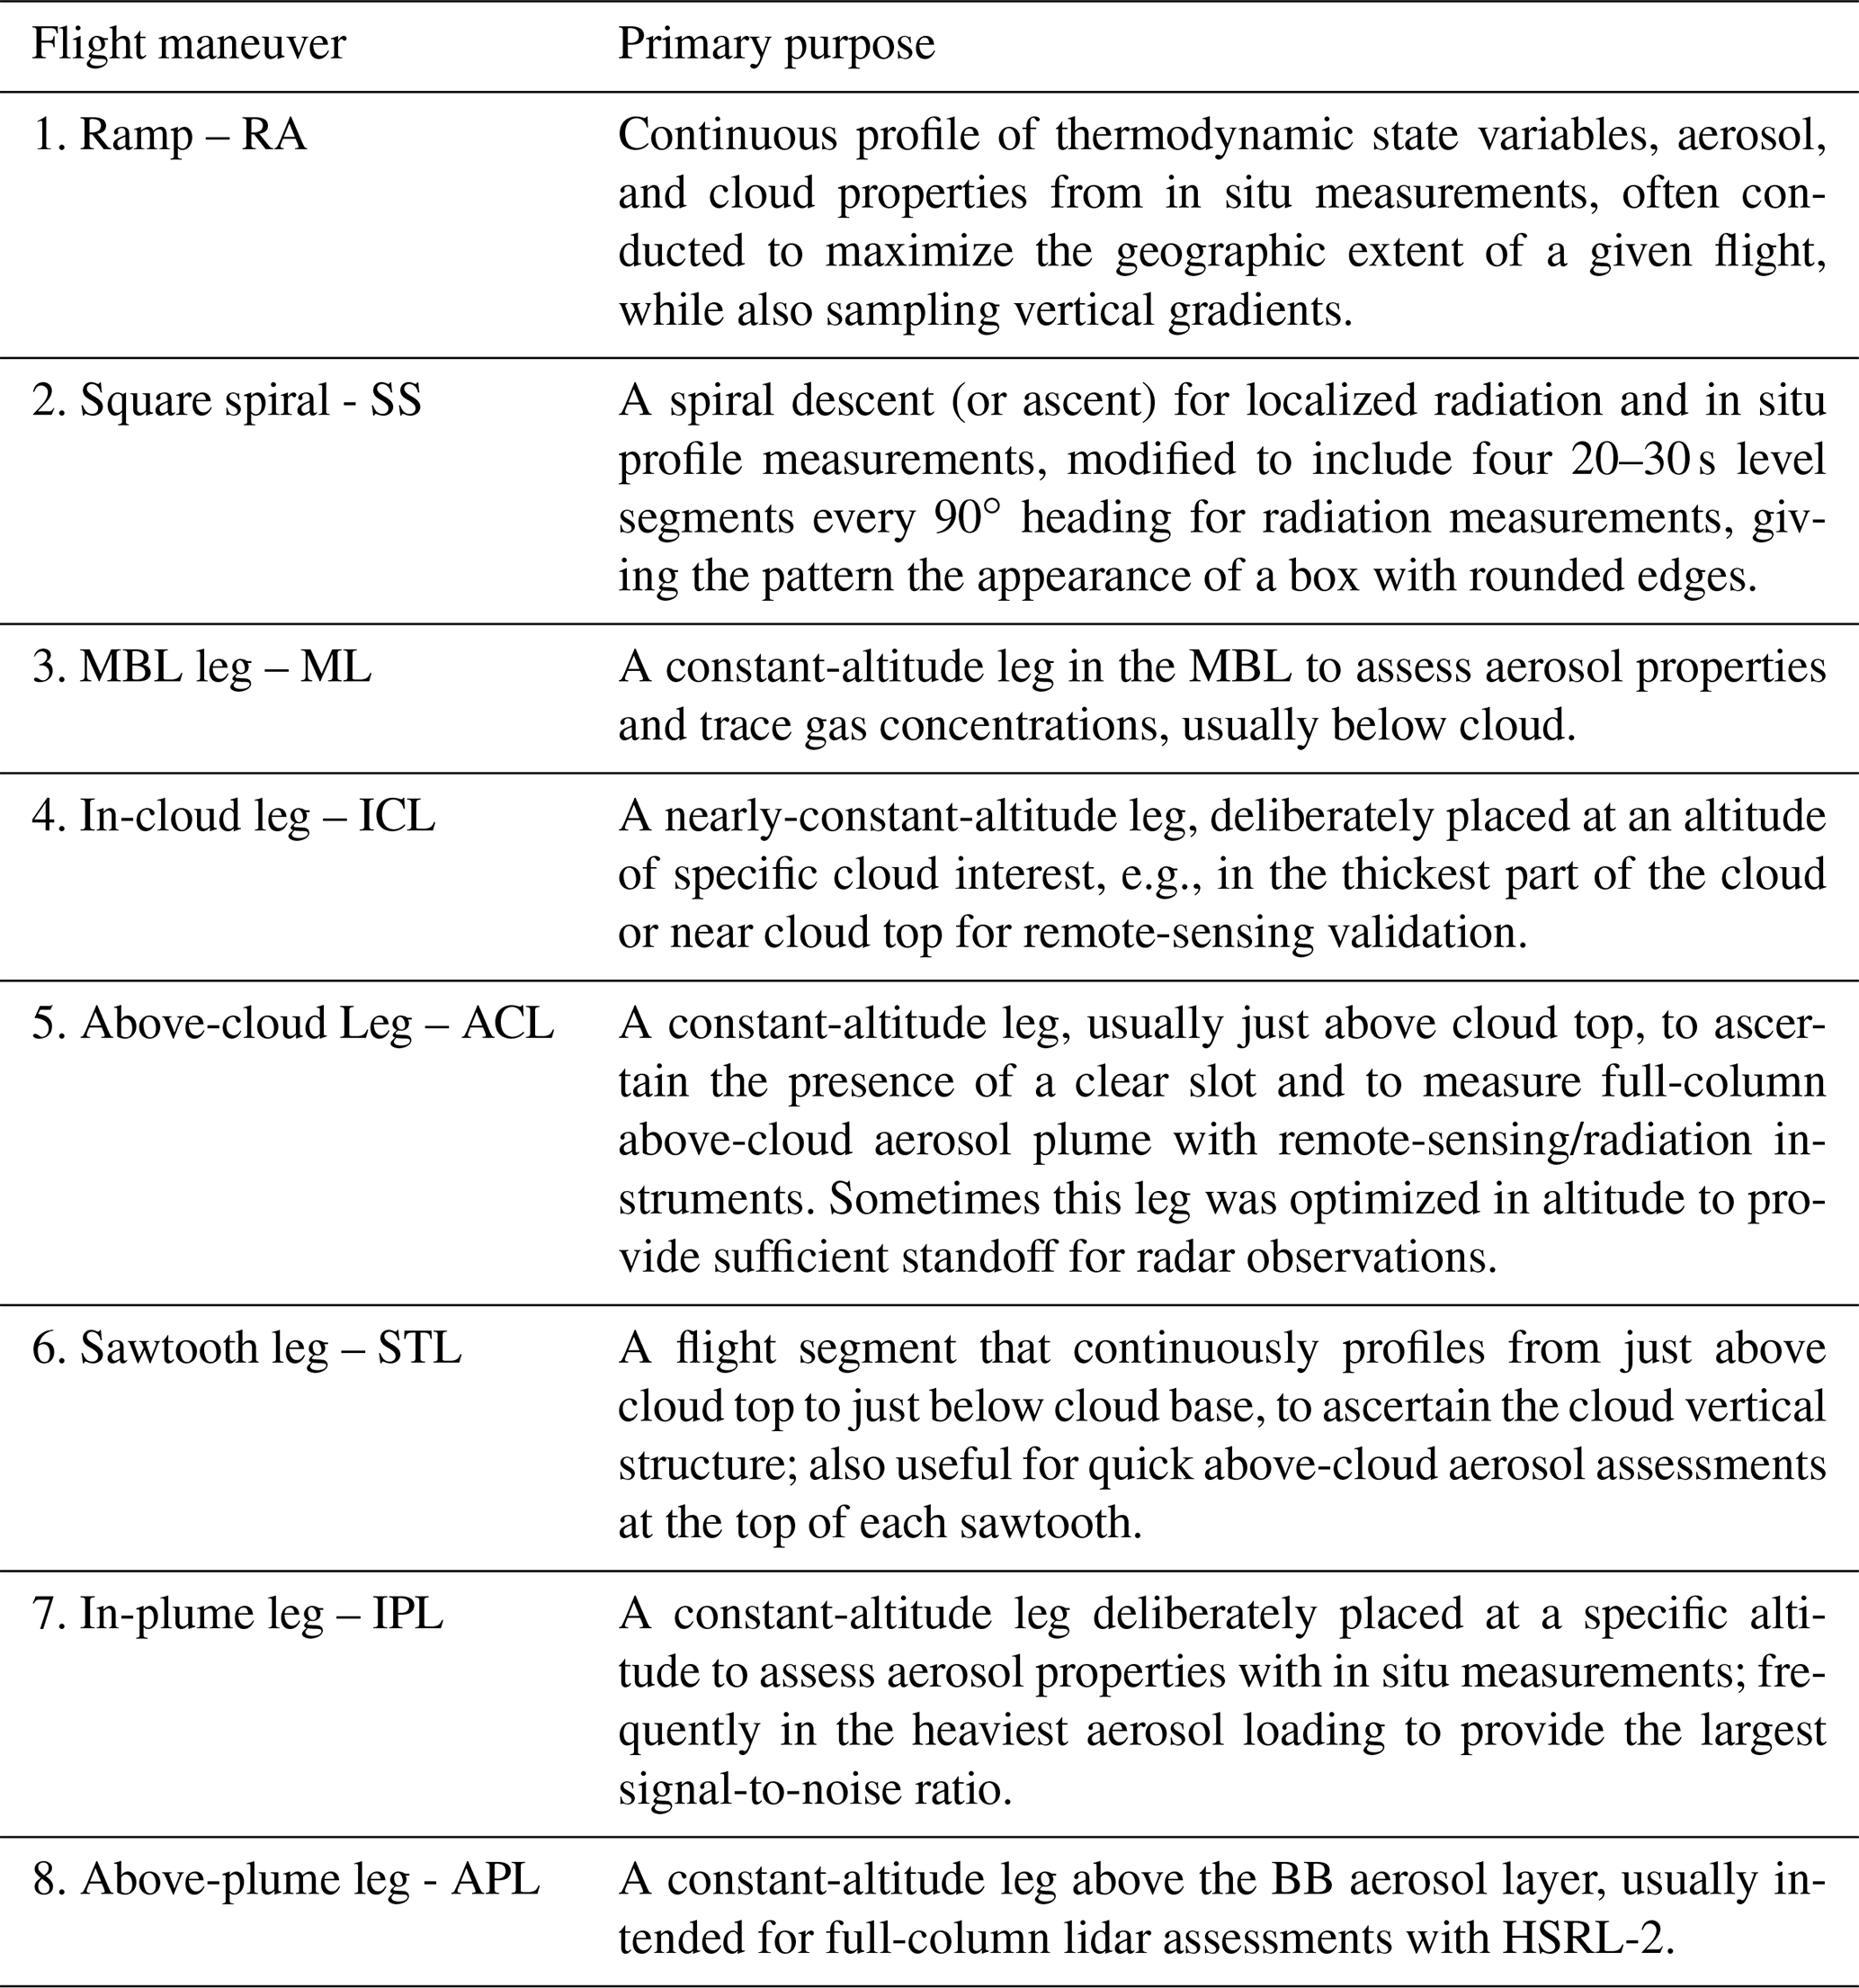
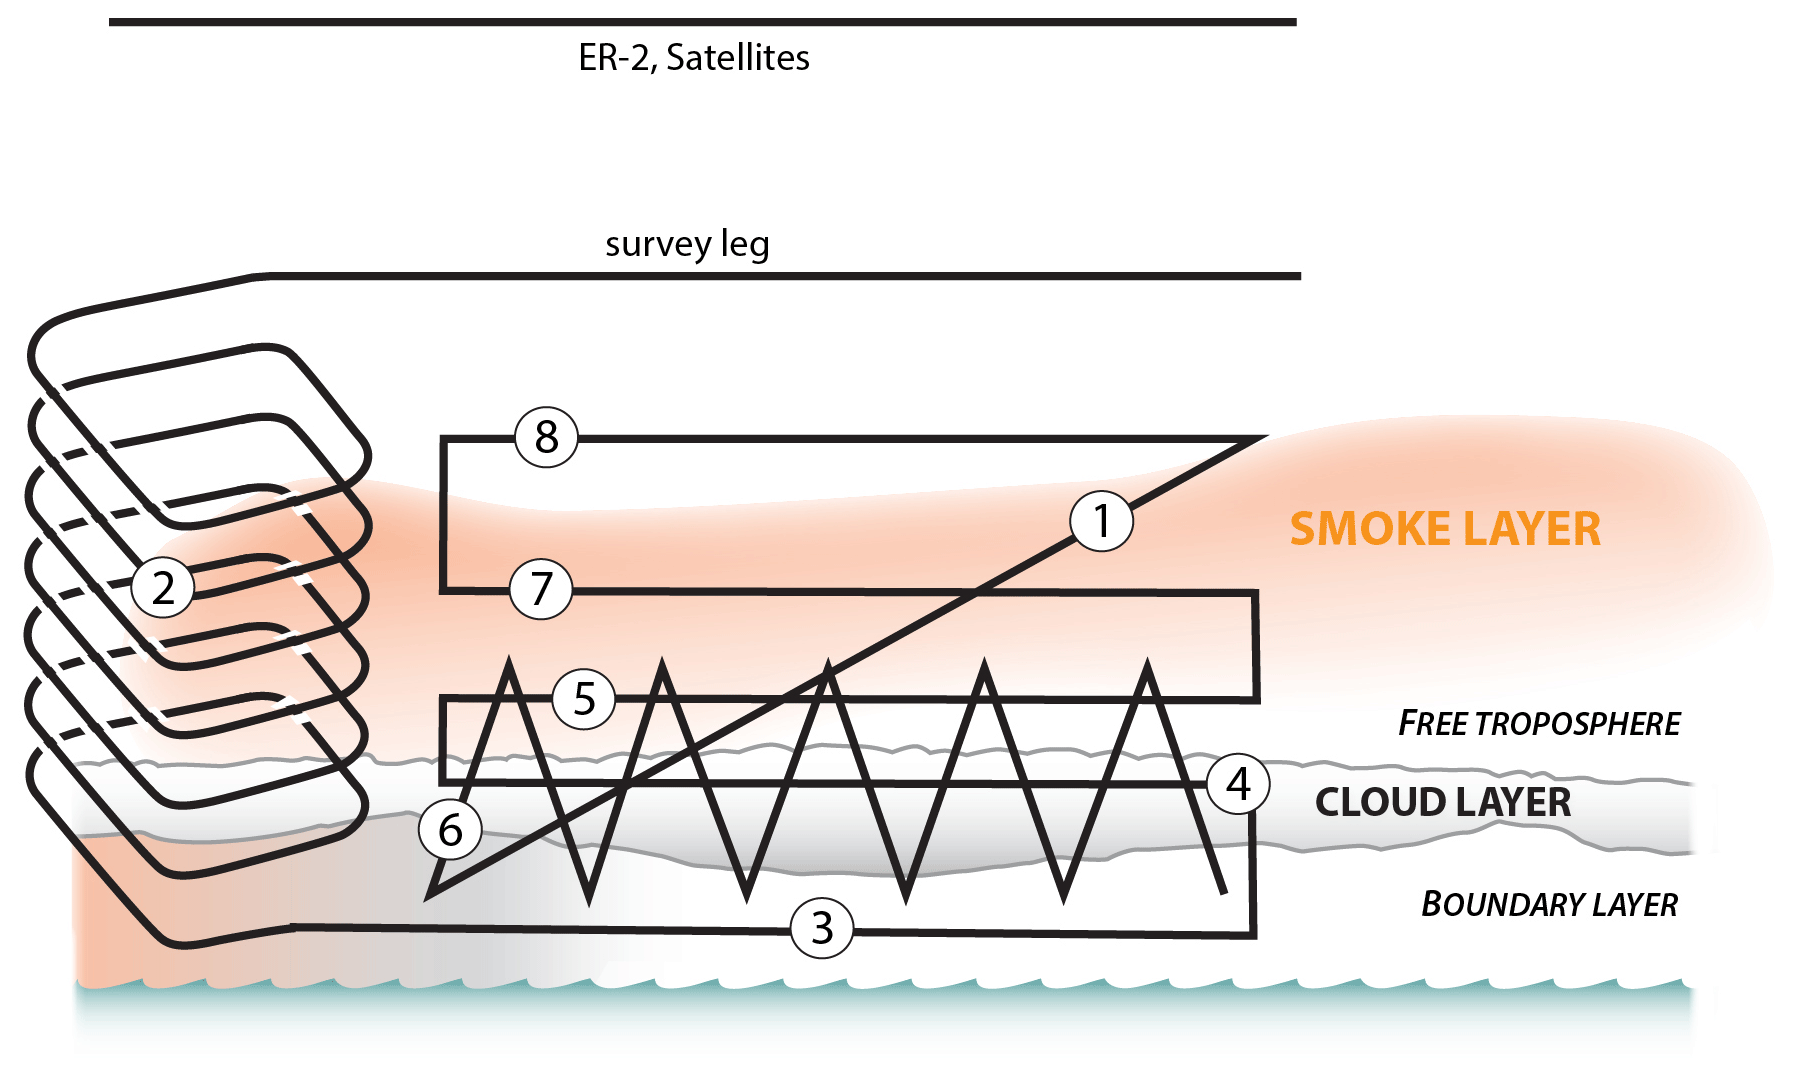
Figure 12Schematic of flight maneuvers during research flight linked to descriptions in Table 2 and flight synopses in Tables A1–A3.
Tables A1–A3 in Appendix A summarize the flights of both ORACLES aircraft in 2016, 2017, and 2018. They include a brief flight synopsis and the number of each of the eight flight maneuvers described in Table 2 for every flight. Detailed flight reports for each of the flights listed in Tables A1–A3 can be found at the project web page: https://espo.nasa.gov/oracles/mission-flight-docs (last access: May 2020). ORACLES data are archived permanently with separate digital objective identifiers (DOIs) for each deployment year and separate DOI for the two aircraft participating in the 2016 deployment (see references for ORACLES Science Team, 2020–2016 P-3 data, 2016 ER2 data, 2017 P-3 data, and 2018 P-3 data). A link to images and KMZ files for flight tracks, data from ground-based instruments, and other auxiliary information can be found at https://espo.nasa.gov/home/oracles/content/ORACLES_Science (last access: May 2020). Video footage from the P-3 front and nadir cameras is available at https://asp-archive.arc.nasa.gov/Oracles/N426NA/Video/ (last access: May 2020).
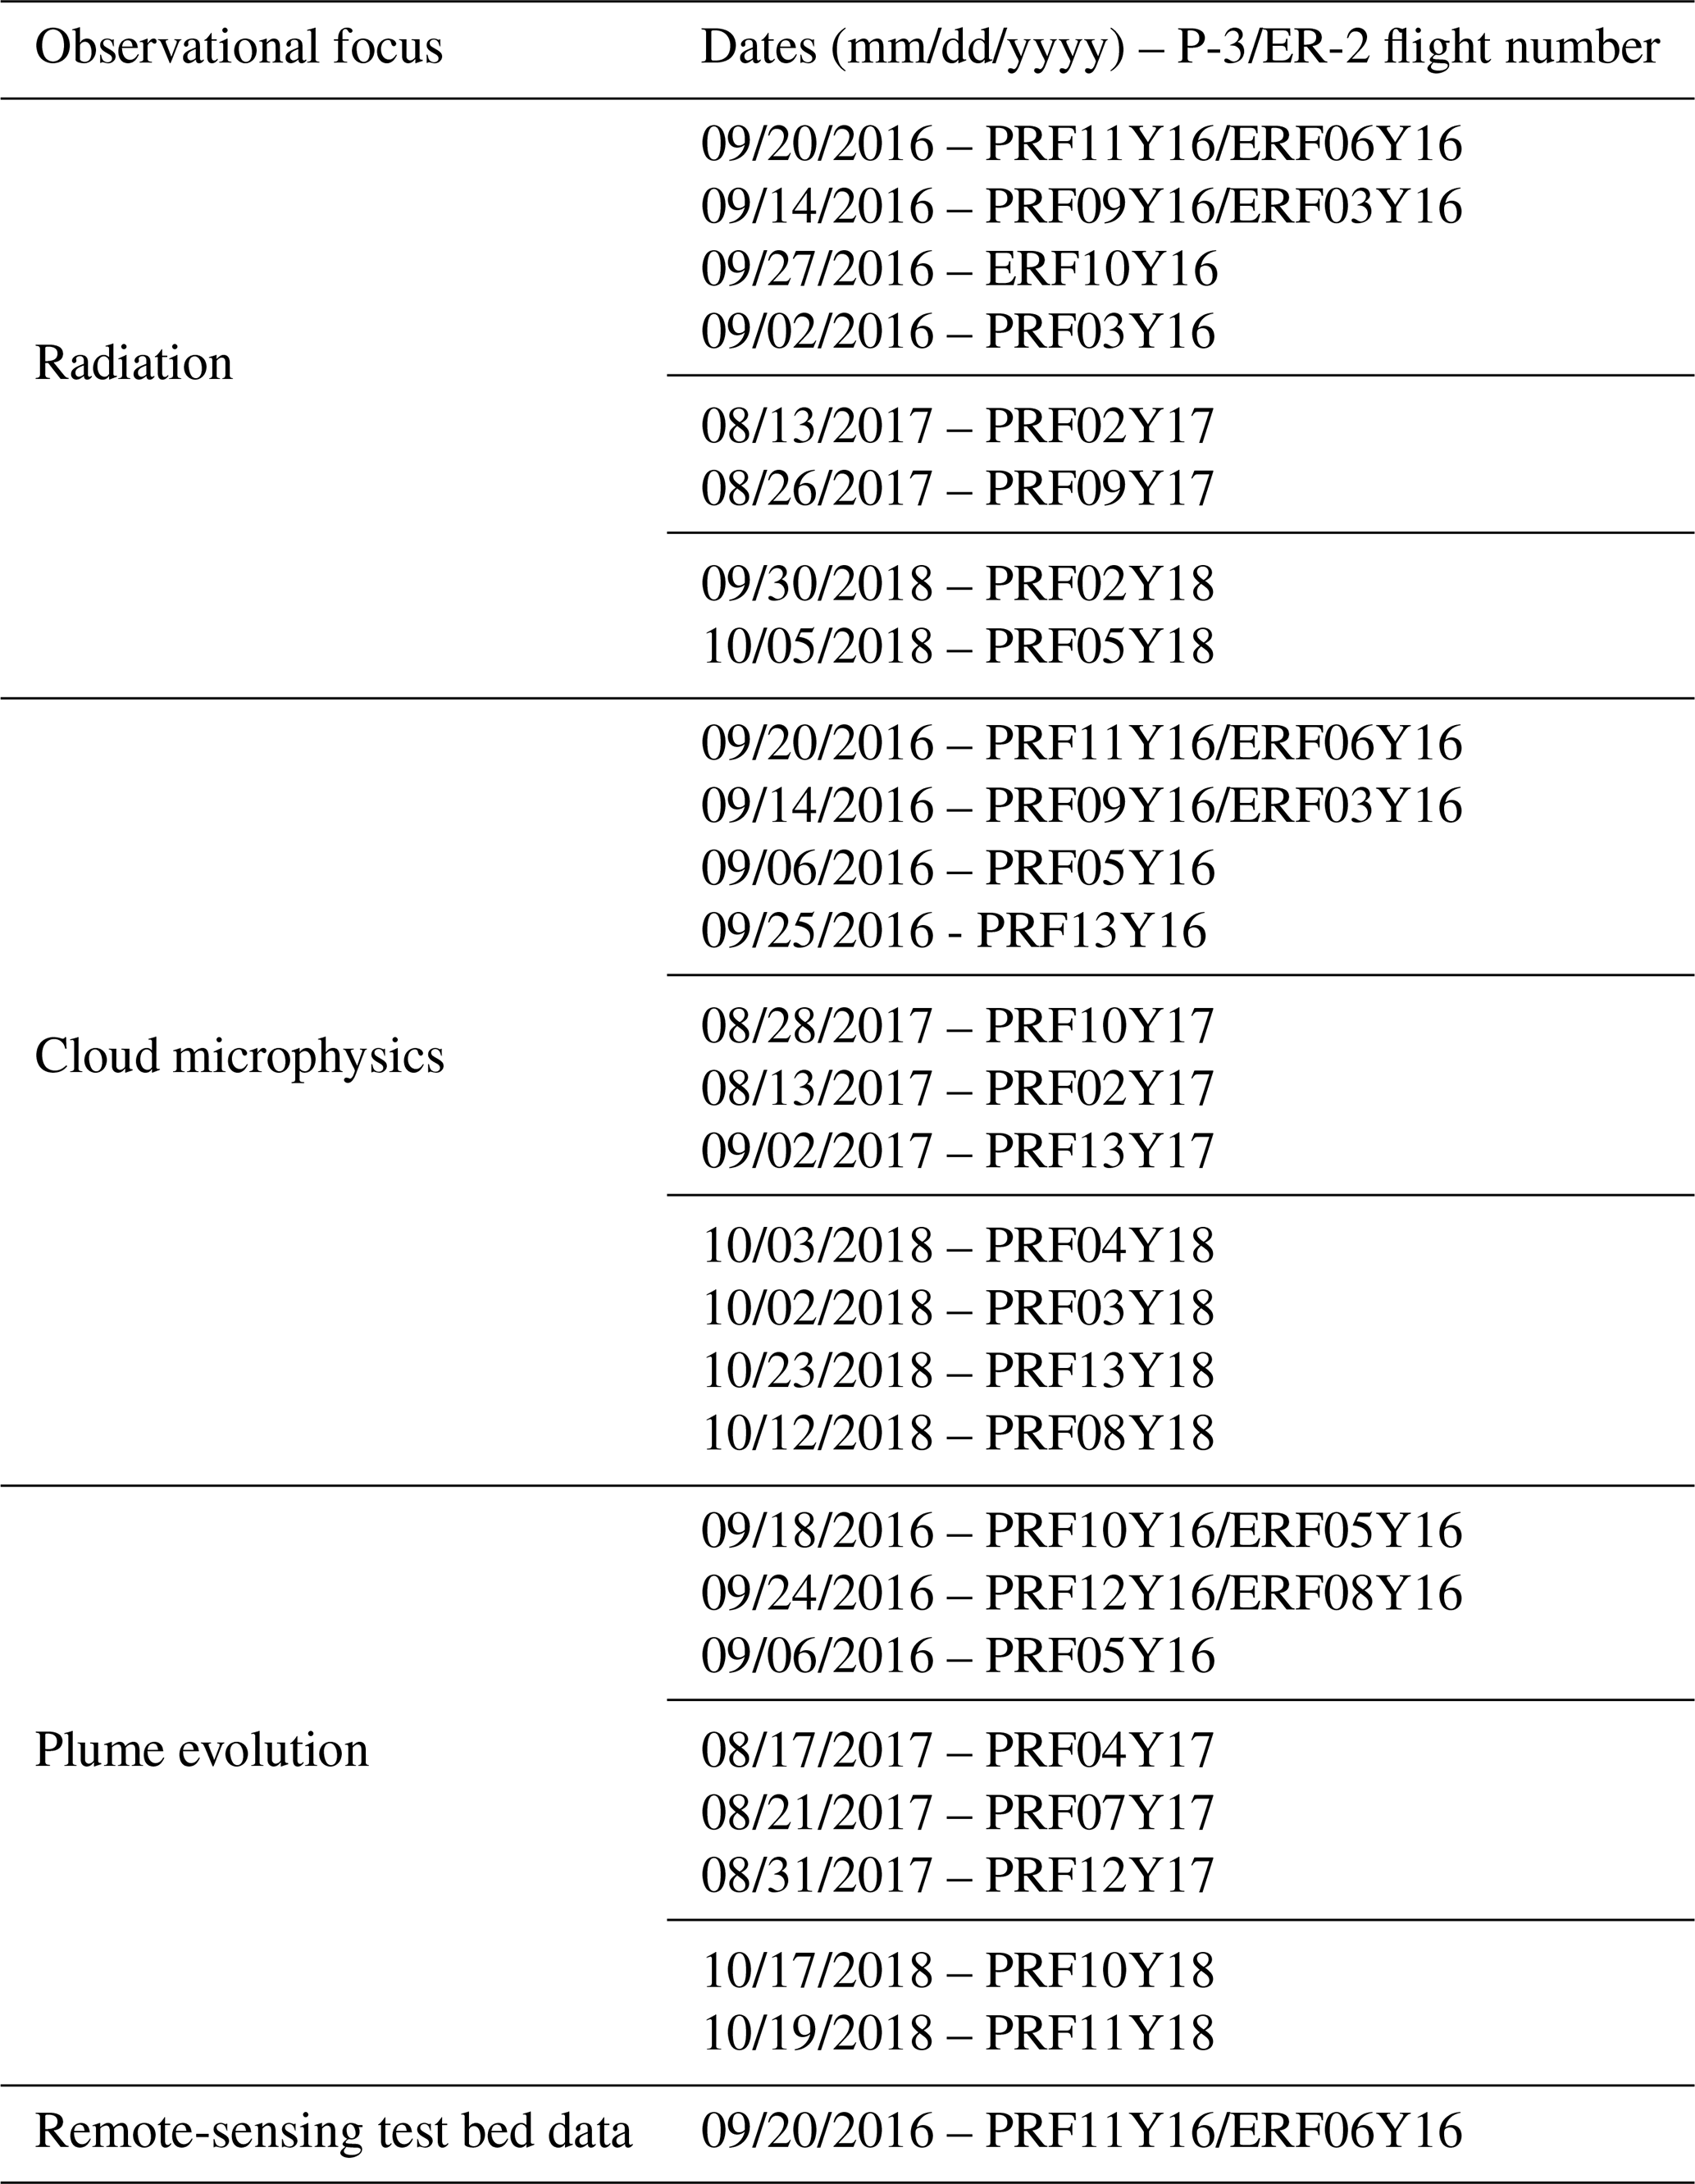
4.1 List of golden days for various objectives
The target-of-opportunity flights, described in Sect. 4.4, usually were designed to address more focused scientific objectives within the context of the general science objectives. Broadly, these objectives can be characterized as pertaining to (i) the radiative interactions of aerosols and clouds (radiation flights); (ii) the microphysical interactions of aerosols and clouds as they are affected by vertical mixing, drizzle suppression, etc. (cloud microphysics flights); and (iii) the spatiotemporal evolution of aerosol microphysics in the BB plume (plume evolution flights). In addition, a number of flights provided an excellent dataset for the evaluation of remote-sensing concepts (see Sect. 5.3.7), often on the basis of successful coordination of the P-3 with the ER-2 in 2016 or with satellite assets in 2017 and 2018. Table 3 provides a list of “golden days” for each observational focus, to be interpreted as the likely best start of exploration of the ORACLES dataset for an uninitiated science user. The ordering of flights within each category is based on a preliminary assessment of the utility and quality of the data to address the observational objective. Flights with coordinated P-3 and ER-2 sampling in 2016 are postulated to provide superior data and hence appear before any single-aircraft flights. Future analyses are likely to provide a revised list of useful flight days in the context of detailed and overarching ORACLES objectives.
4.2 Examples of significant findings
4.2.1 HSRL-2 statistics on contact of plume and cloud tops
An important line of inquiry and indeed a major motivation for the ORACLES project was the question of how frequently Sc clouds in the SE Atlantic MBL are in physical contact with the BB plume emanating from the southern African continent. The only prior work in the area using in situ aircraft measurements (Haywood et al., 2003) found frequent separation between cloud and aerosol close to the coast of Namibia and Angola but potential interactions between cloud and aerosol in the vicinity of Ascension Island. However, the statistical relevance of those findings is impossible to establish given the scarcity of the available in situ data. For a large number of coincident CALIOP and MODIS aerosol and cloud retrievals in the SE Atlantic region, Costantino and Bréon (2013) found that more than half of the vertical profiles they studied indicated “well-separated” aerosol and cloud layers, i.e., an “aerosol-free gap” above cloud top. They went on to attribute the differences in cloud effective radii between separated and unseparated cases to the probable paucity of aerosols in the MBL in the separated cases. ORACLES observations show that the separation of aerosol and cloud layers in an instantaneous profile is a poor indicator for the concentration of aerosol in the MBL, because there are many other pathways for the aerosol to reach the MBL at a given location. However, the physical contact of the BB plume and Sc cloud tops is indicative of active entrainment of BB aerosol into the MBL and is often associated with significant BB aerosol in the MBL. The relatively low signal-to-noise ratio (SNR) in CALIOP vertical profiles after traversing a BB plume with significant optical attenuation, also alluded to in Sect. 2.1, raises the question of how accurate the CALIOP-indicated frequent separation between the BB plume and Sc cloud tops (shown in Fig. 2) really is.
To help address this question, we investigate here how frequently the HSRL-2 aerosol extinction profiles in the three ORACLES deployments indicate separation or lack thereof between the BB plume base and the Sc cloud tops. The left panel of Fig. 13 shows mean aerosol extinction profiles at 532 nm for each ORACLES deployment year, along with mean cloud top heights as horizontal solid lines. Because ORACLES-2016 had a somewhat different geographic focus from ORACLES-2017 and ORACLES-2018, Fig. 13 only shows data for the geographic box bounded by 5–15∘ S and 2.5–7.5∘ E, where there are data present in all 3 flight years.

Figure 13(a) A composite of vertical profiles of aerosol extinction at 532 nm, derived from HSRL-2 measurements for each of the deployment months bounded by 5–15∘ S and 2.5–7.5∘ E. Shaded regions represent 1 standard deviation of extinction measurements. Solid horizontal lines indicate the mean cloud top heights for each dataset. (b) Cumulative distribution function for mean aerosol backscattering in the 300 m layer above cloud top.
The mean extinction profiles show that the BB plume in ORACLES-2017 (August) has a local maximum of aerosol extinction at altitudes between 2–3 km, while the ORACLES-2016 (September) and ORACLES-2018 (October) mean profiles have maximum aerosol loading between 3.0 and 4.5 km in altitude, albeit with somewhat lower values. In all 3 years, there is a relative minimum in aerosol loading near the location of the mean cloud tops. This suggests that the air mass just above cloud top may indeed be significantly older, more processed, and scavenged than the FT above and possibly even the BL below, which may have been subject to entrainment of FT air upstream of the BL flow, to the south of the bounding box.
The separation between the BB plume base and the cloud tops for each year is indicated in the right hand panel in Fig. 13. It shows the cumulative distribution of HSRL-derived aerosol backscattering coefficient at 532 nm in the 300 m layer just above cloud top for the same geographic region as the left panel. The cumulative distribution of aerosol backscatter values near the cloud top varies sigmoidally, without any discontinuity that would indicate an unambiguous lower edge to the aerosol layer. Instead, it is apparent that the assessment of an aerosol-free gap depends entirely on the definition of the aerosol loading. For example, the August 2017 and October 2018 deployments featured a relatively low fraction of profiles with less than 0.25 M m−1 Sr−1 aerosol backscatter coefficient in the first 300 m above cloud, i.e., 3 % and 15 % for 2017 and 2018, respectively. The September 2016 profiles in this region on the other hand show less than 0.25 M m−1 Sr−1 aerosol backscatter coefficient, and hence an aerosol-free gap, almost 50 % of the time. Regardless of the exact threshold chosen, September 2016 showed by far the highest frequency of aerosol-free gaps above clouds when compared to the 2017 and 2018 deployments. The representativeness of this September maximum in aerosol-free gaps above clouds is unknown and will need to be explored with future satellite lidar observations of sufficient accuracy. Overall, we found significant spatial and temporal variability in the degree of contact between BB aerosol and Sc clouds in the SEA region and that the frequency of occurrence of aerosol-free gaps is likely much lower than previously assumed (Costantino and Bréon, 2013). These findings need to be considered when interpreting previous results on aerosol–cloud interactions in the region.
ORACLES data provide a useful test bed for algorithm development in support of future satellite missions, for example NASA's ACCP (Aerosols, Clouds, Convection and Precipitation) mission. For instance, ORACLES observations are currently being used to develop joint polarimeter–lidar retrievals of aerosol and cloud properties. Whether such observations will successfully detect features such as the clear-air layers in the SEA will depend on specific instrument characteristics, but the ORACLES measurements should provide useful benchmarks for the testing of candidate observing concepts.
4.2.2 Vertical plume structure and chemical composition
The lidar-derived increase in extinction with height for September (2016) in Fig. 13 is accompanied by a similar increase with height of the mean in situ SSA (derived from the in situ PSAP absorption paired with nephelometer scattering at 530 nm) from 0.84 to 0.87 (Fig. 14, middle of top row). The SSA values are in reasonable agreement with values of ∼0.83 for dry conditions in Davies et al. (2019) derived using state-of-the-art photoacoustic and cavity ring-down instrumentation. Pistone et al. (2019) compare the ORACLES absorption–scattering measurements with SSA derived by several different airborne remote-sensing methods at wavelengths between 400 and 995 nm and found reasonable agreement both for specific case studies and for the range of measured spectral SSA over the full ORACLES-2016 deployment.
Black carbon is the primary absorber of sunlight within BB aerosol (e.g., Bond et al., 2013). Although a corresponding decrease with height of the refractory black carbon (BC) mass concentration relative to the mean organic aerosol (OA) mass concentration is not clearly apparent in Fig. 14, (middle of middle row), an example from an individual profile from the 24 September 2016 flight indicates more nitrate and organic aerosol above 3.5 km than below it, relative to the black carbon mass concentration (Fig. 14, middle of bottom row). This is consistent with an increase in SSA with height. Examples of individual profiles are shown from each year, broken down by aerosol species – black carbon, organic aerosol, nitrate (NO3), ammonium (NH4) and sulfates (SO4), indicate distinct vertical structures (Fig. 14 bottom row).
Profiles from August 2017 also indicate some vertical structure to the SSA without a clear mapping to the BC∕OA ratio, while the mean SSA from the October 2018 deployment increases even more sharply with altitude than does the mean SSA from September (2016). For October 2018, the increase of SSA with height is clearly consistent with the proportional increase in organic aerosol relative to black carbon. Work is ongoing to attribute changes in SSA to both thermodynamically driven changes in gas–particle phase partitioning (e.g., Wu et al., 2020) and more irreversibly driven changes related to forms of photodegradation in this near-equatorial, sun-exposed environment. Overall the SSA values are less than has been previously assumed, with that implication further explored within the modeling study of Mallet et al. (2020).
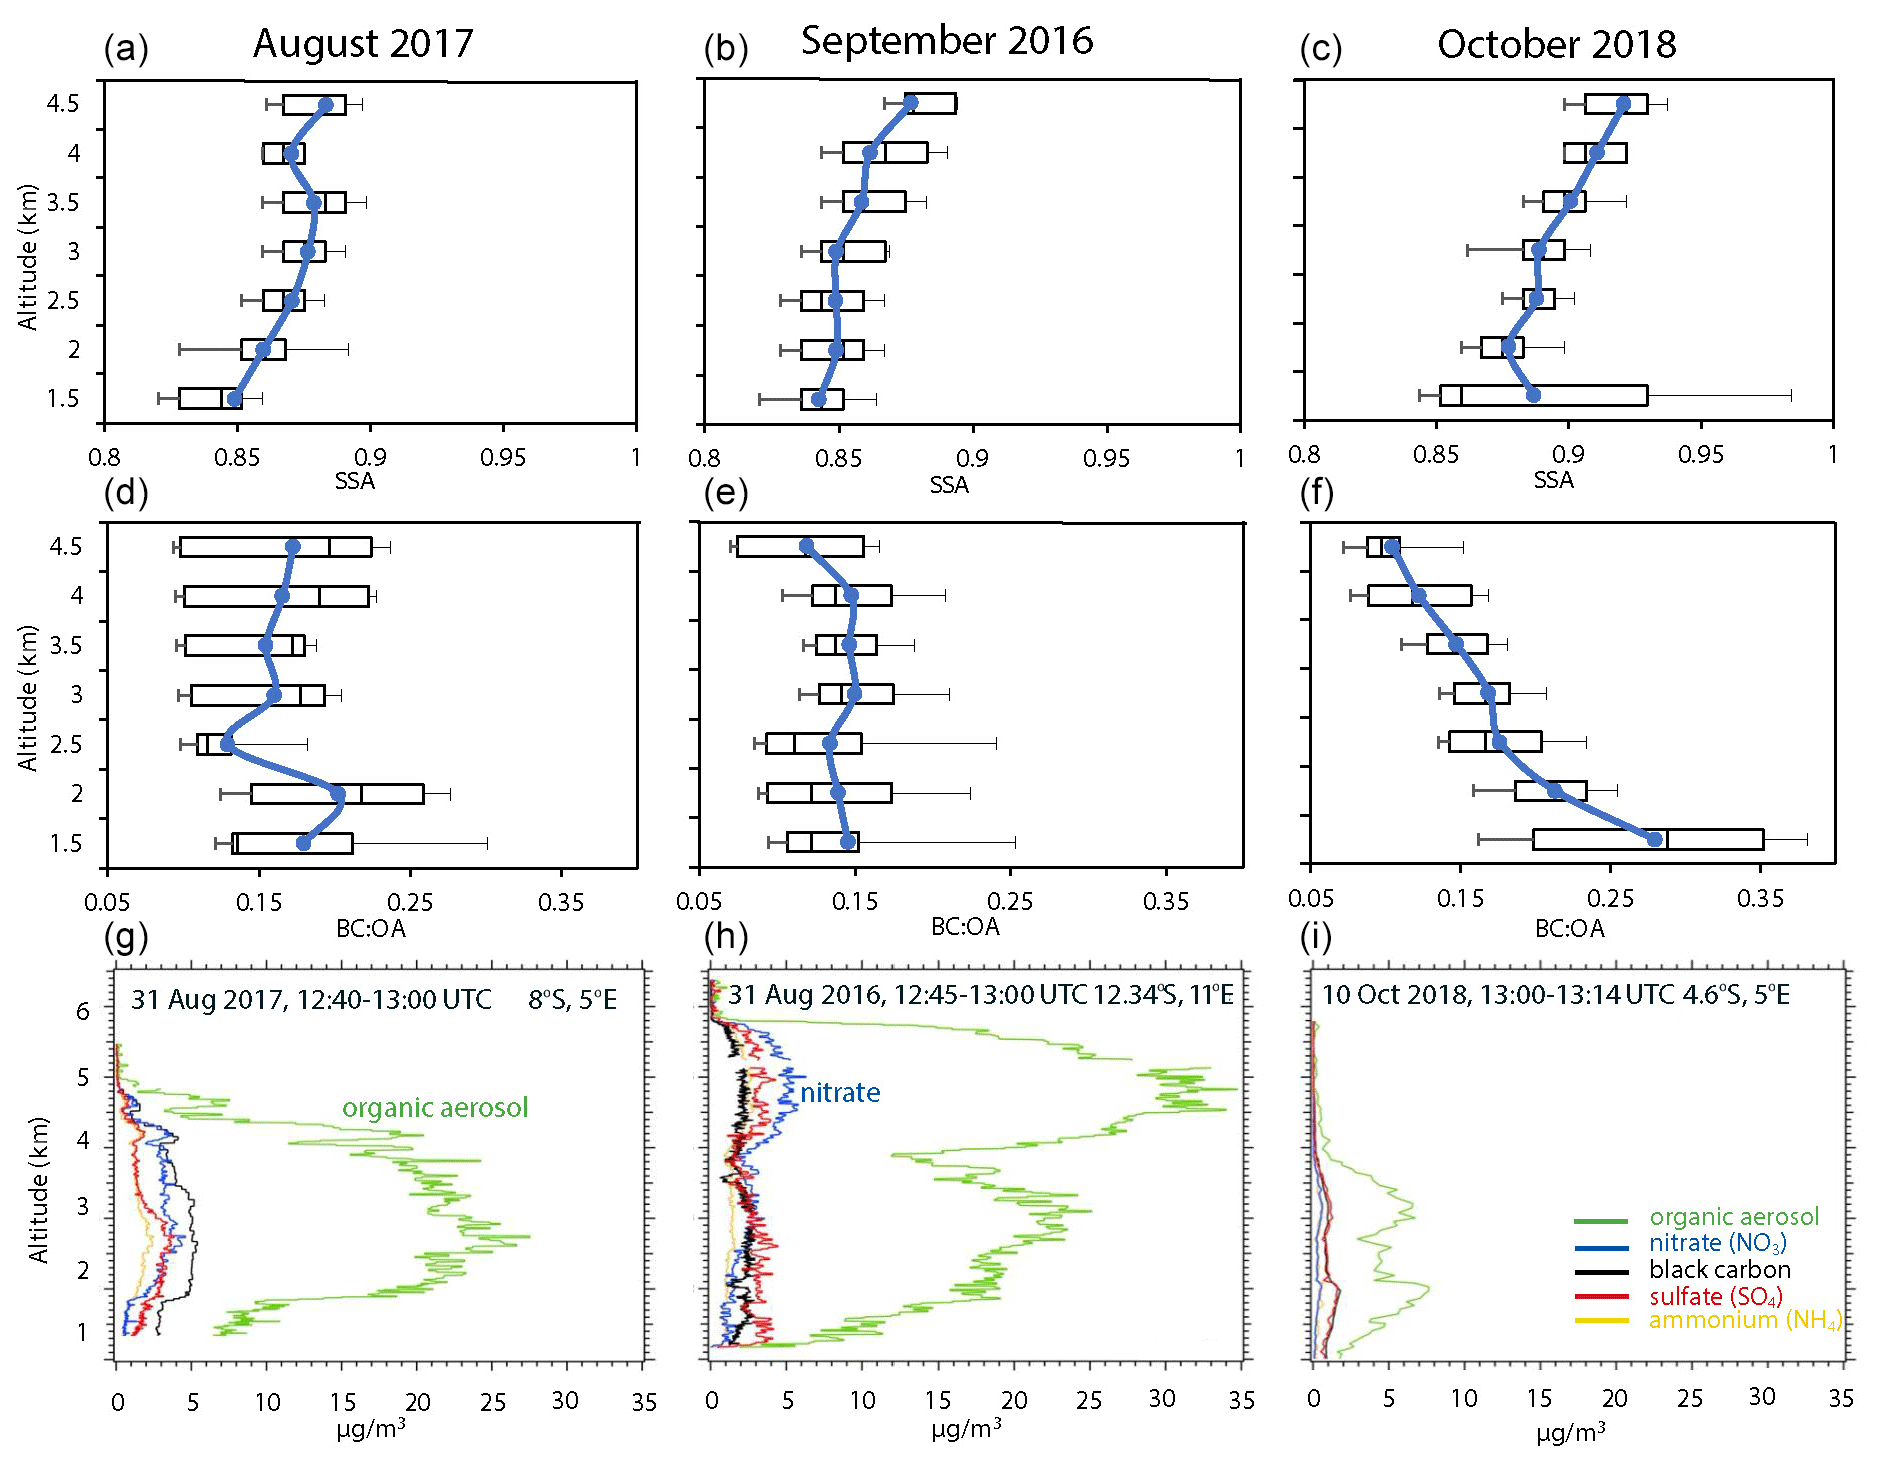
Figure 14(a–c) Deployment-mean 530 nm SSA vertical profiles for each year for the August (2017), September (2016), and October (2018) deployments. (d–f) The corresponding mean black carbon to organic aerosol ratio (BC:OA) profiles. (g–i) Example profiles of individual aerosol species, from left to right: 30 August 2017, 12:40–13:00 UTC, 8∘ S/∘ E; 24 September 2016, 12:45–13:00 UTC, 12.34∘ S/11∘ E; and 4 October 2018, 13:00–13:15 UTC, 4.6∘ S/5∘ E. A blue line connects mean values, with box–whisker plots indicating the 10th, 25th, 50th, 75th, and 90th percentile values.
Some of the differences between the individual profiles in Fig. 14, bottom row, can be related to differences in the prevailing meteorology shown in Fig. 8. The distinctive two-layer aerosol structure profiled on 24 September 2016 reflects the ability of strong winds at 4 km (see also Fig. 6) to disperse aerosol westward, with the aerosol lower down, at 2–3 km, resulting from an anticyclonic circulation (Fig. 8). The strong 4 km zonal winds are much less apparent in August, consistent with a lower-lying, less layered aerosol vertical structure. The free-tropospheric winds remain strong into October, but by then the fire emissions have reduced considerably and less aerosol appears to reach the altitude at which the zonal winds are strongest.
4.2.3 Chemical aging
Ongoing analysis of the ORACLES dataset is relating the observed vertical structure in aerosol composition and optical properties to aerosol aging. Rather than using an aircraft to track the evolution of a smoke plume as it advects, or using an aerosol chemical component as a “chemical clock” to determine aerosol age, an alternative approach links a model-derived mean aerosol age to in situ aerosol characteristics. Particles, including at fire emission sources, are marked at the time of the model initialization and tracked in time thereafter (Saide et al., 2016), with the particle ages subsequently extracted along the flight legs and these modeled ages combined with the in situ datasets. An example is shown in Fig. 15 for 24 September 2016 (a profile from this flight is also shown in Fig. 14), using aerosol age derived from one of the ORACLES in-field aerosol forecasting models, WRF-AAM (see Sect. 3.3.5). The model-derived mean aerosol age height–latitude cross section is overlaid with measurements of f44, the mass-to-charge ratio m∕z 44 relative to total organics. Higher fractions of f44 reflect the formation of carboxylic acids, which coincide with older aerosol ages up to approximately 10 d. The ORACLES f44 values shown here are on par with those reported for Siberian biomass burning aerosol after trans-Pacific transport to Alaska. Notable is that younger aerosol overlies older aerosol on this day, coinciding with the altitude range of strong zonal winds (not shown, but consistent with Fig. 6). This figure also highlights the wide range of aerosol ages beyond 4 d that ORACLES sampled during its flights, marking another unique contribution by the ORACLES campaign. Ongoing work is relating the model-derived aerosol aging to a continuous depletion of non-black-carbon aerosols.
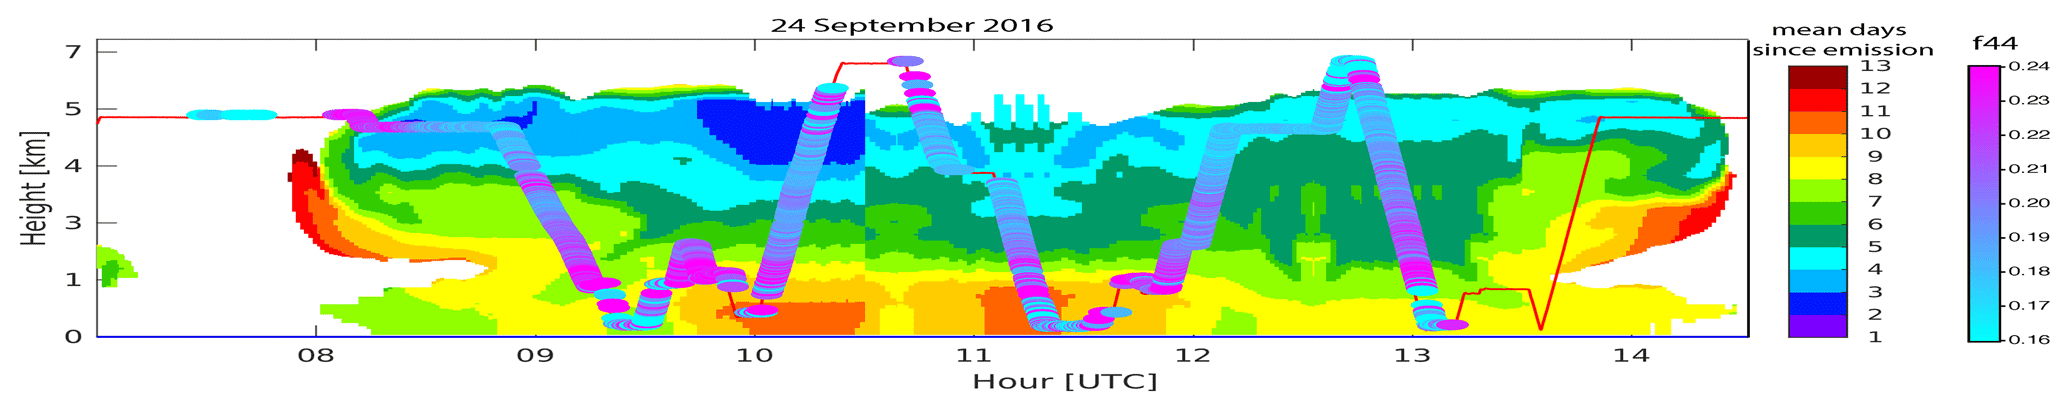
Figure 15The WRF-AAM model-derived mean aerosol age along the P-3 flight track for 24 September 2016, overlain with a measure of aerosol oxidation derived from in situ f44 measurements on the P-3 aircraft.
4.2.4 Boundary layer clouds – CCN, cloud, and rain statistics
ORACLES scientific objective 3 (Table 1) seeks to understand the extent to which smoke aerosol from southern Africa mixes into the MBL and impacts marine low cloud microphysical processes. Smoke may enhance the population of cloud condensation nuclei (CCN), which can lead to increases in cloud droplet concentration and smaller droplet sizes. It can also potentially induce changes in cloud condensate through suppressing precipitation rates, enhancing cloud top entrainment, and otherwise influencing cloud macrophysical properties. These indirect effects lead to significant increases in albedo in global models, but little in situ data are available over the SE Atlantic to test these models.
According to HSRL-2 observations (Fig. 13), a denser, more frequent smoke layer in the FT occurred in 2017 than in 2016 or 2018. CCN measurements made on all three ORACLES deployments (Kacarab et al., 2020) provide evidence that FT CCN concentrations were also higher in 2017 (Fig. 16a). Despite the frequent contact of the smoke with the sub-cloud planetary boundary layer (PBL) top, concentrations of CCN in the PBL are much lower than those in the FT (compare panels a and b in Fig. 16). Also, despite very similar FT CCN concentrations in 2016 and 2018, PBL CCN levels were actually significantly higher in 2018 than in 2016 (Fig. 16b), suggesting that the FT CCN concentration alone is not a unique determinant of microphysical properties in the PBL. As noted in Diamond et al. (2018), it is the history of subsidence and entrainment of smoke into the PBL, rather than the instantaneous presence of aerosol immediately above clouds, that sets the MBL CCN level and therefore cloud droplet concentration (Nc). Seasonally, satellite evidence (Fig. 10) indicates that the highest Nc values offshore occurred in 2017, and this is consistent with the highest measured PBL CCN concentrations (at supersaturations >0.25 %) occurring during 2017. October 2018 also showed high Nc values offshore consistent with the higher measured CCN concentrations.
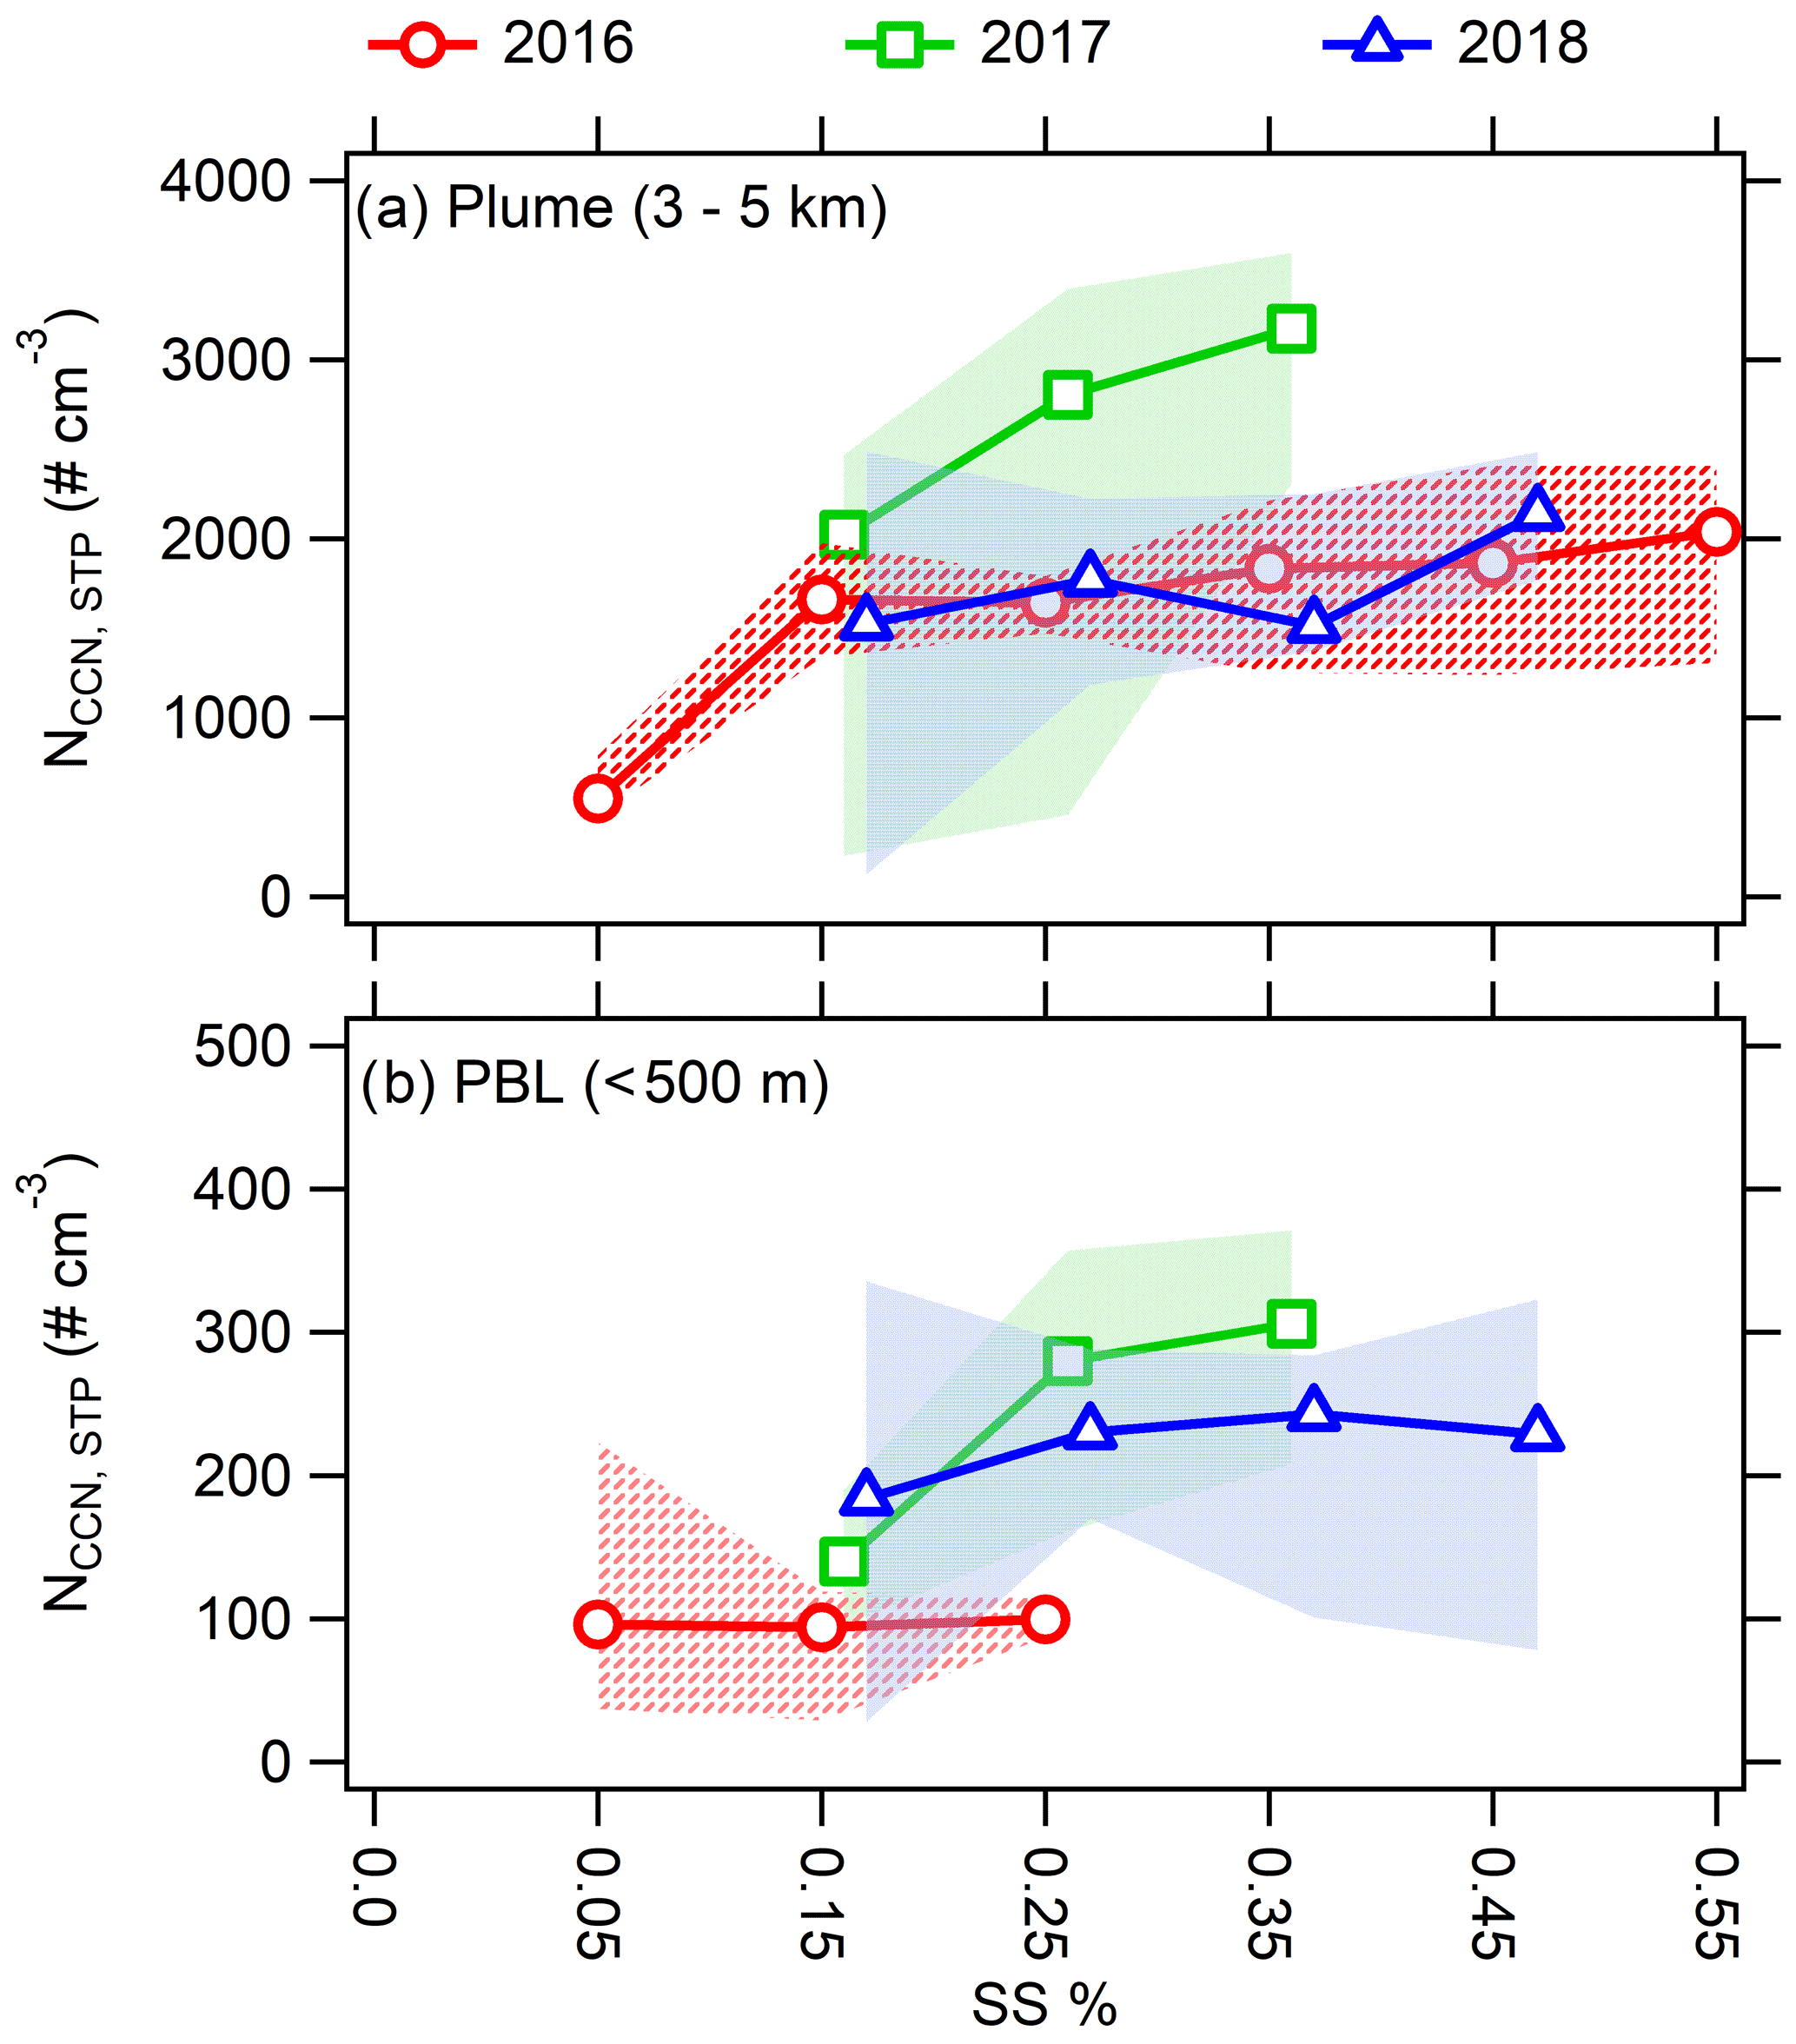
Figure 16Composite CCN supersaturation spectra (concentration of CCN as a function of the applied supersaturation, SS) for (a) the free-tropospheric BB plume and (b) the MBL within a region (5–15∘ S and 2.5–7.5∘ E) sampled during all three deployments.
In addition to entrainment of smoke from the FT, the concentration of CCN and resulting droplet concentrations in the marine PBL are also modulated strongly by coalescence scavenging by light precipitation (Wood et al., 2012). In addition, evidence suggests that precipitation can be suppressed in clouds with high CCN and Nc (e.g., Sorooshian et al., 2009). The APR-3 radar on the P-3 is sufficiently sensitive to detect this light precipitation. Measurements of precipitation from the APR-3 indicated significant differences in precipitation during the three campaigns (Fig. 17). Comparing the two campaigns flown out of São Tomé (2017 and 2018), precipitation was significantly lighter in 2017 (Fig. 17), which may indicate suppression due to higher droplet concentrations, but additional analysis of cloud thickness and liquid water path differences between the campaigns is underway to quantify these impacts (see also Dzambo et al., 2020).
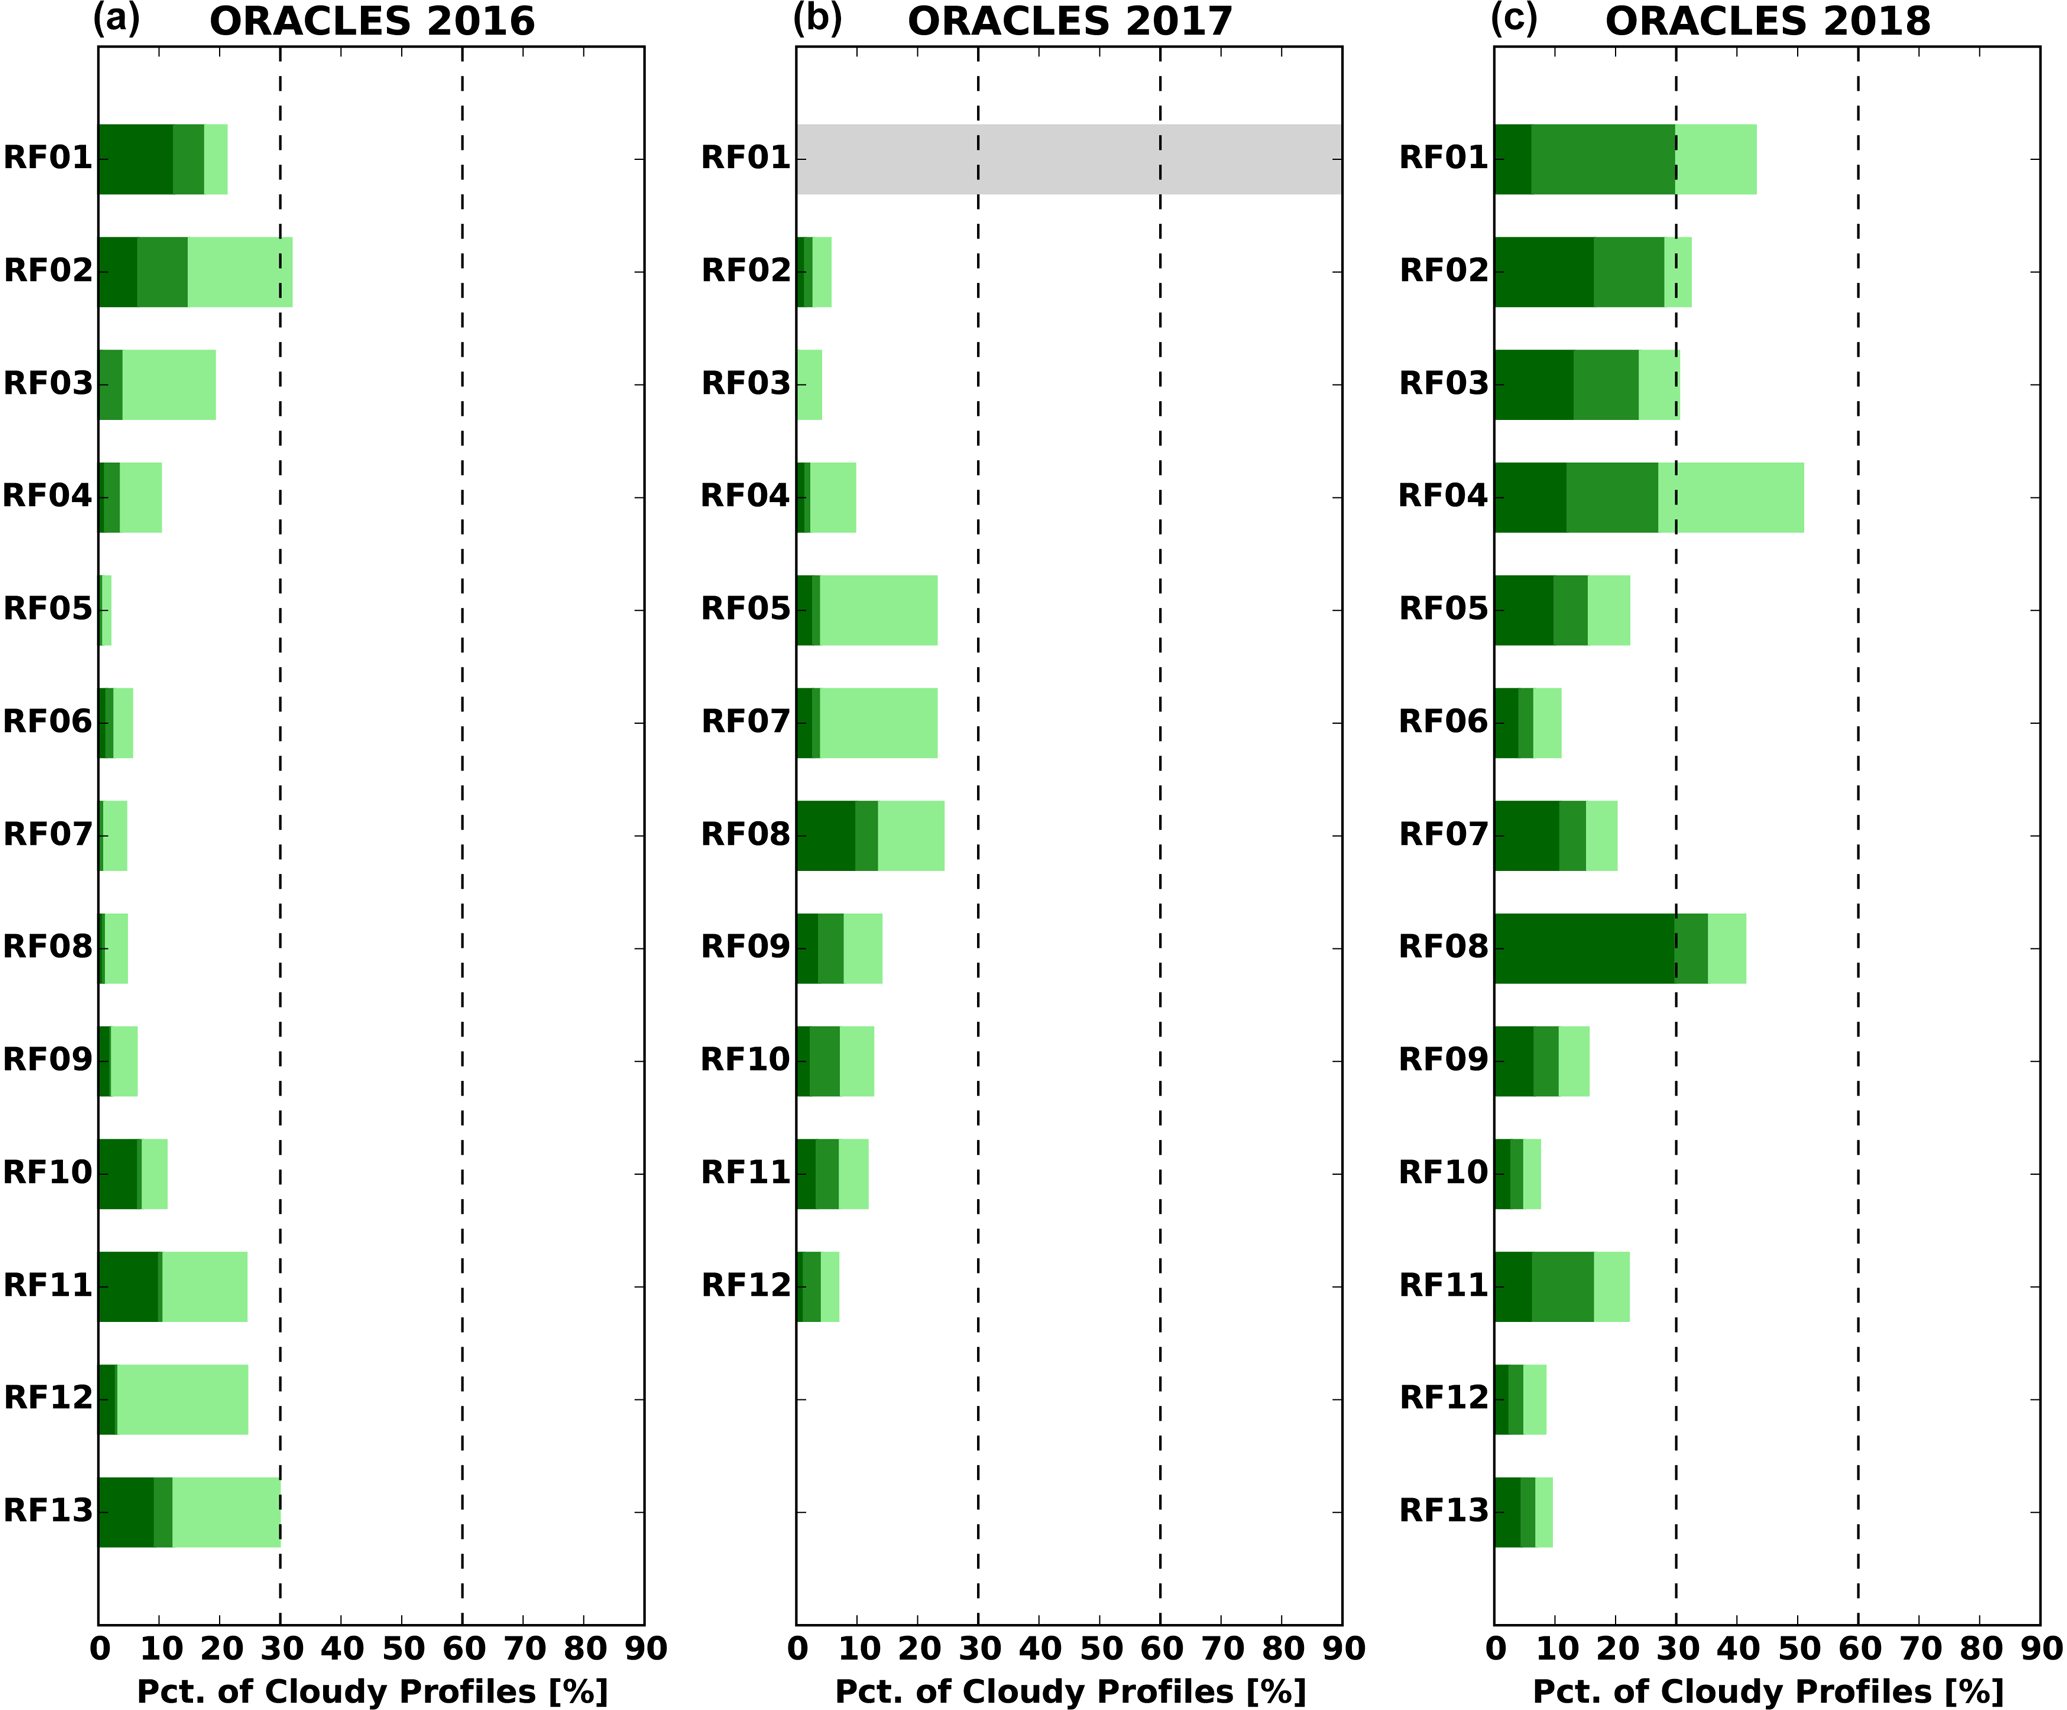
Figure 17The fraction of clouds in which rain is possible, probable, and certain, for the ORACLES research flights in 2016 (a), 2017 (b), and 2018 (c) as detected using the APR-3 radar. Certain rain (dark green), probable rain (medium green), and possible rain or drizzle (light green) are shown left to right for each research flight, which are determined by each cloudy profile's maximum reflectivity being greater than 0, −7.5, and −15 dBZ respectively (see Haynes et al., 2009, for more information).
4.2.5 Evidence of aerosol indirect effects
Observations obtained by in situ probes installed on the NASA P-3 are being used to investigate cloud–aerosol interactions. Over the 3-year period of ORACLES, 397 vertical profiles were flown through clouds during either sawtooth profiles (see Fig. 11) or in individual cloud profiles isolated in time–space from other profiles. The vertical dependence of cloud properties in a common reference frame is examined using a normalized altitude ZN, defined as (, where Z is altitude, Zt cloud top altitude and Zb cloud base altitude. This allows us to composite the vertical microphysical structure of cloud decks from many different clouds.
We select 397 vertical profiles through the cloud layer when accumulation-mode ( µm) aerosol concentration (Na) was measured at least 100 m above and below cloud using the Passive Cavity Aerosol Spectrometer Probe (PCASP). Each profile was classified as “Contact” or “Separated” based on whether the layer of enhanced above-cloud aerosol concentration (defined as PCASP Na>500 cm−3) was in contact with cloud top or separated from it by at least 100 m. Each of the “Contact” and “Separated” profiles was further classified based on whether the average PCASP Na within the 100 m layer below cloud base was greater than or less than 250 cm−3. Four different regimes were thus defined based on the below-cloud boundary layer Na and by whether or not the cloud layer was in contact with an overlying biomass burning aerosol (BBA) plume or separated from it.
Figure 18 shows the mean cloud droplet concentration Nc as a function of ZN for the four regimes. The average boundary layer Na values for the regimes are as follows: Contact/Na<250, 184 cm−3; Contact/Na>250, 507 cm−3; Separated/Na<250, 113 cm−3; Separated/Na>250, 318 cm−3. The average boundary layer Na is a good predictor of the vertical mean Nc across the four regimes, consistent with the primary source for droplets being aerosols ingested into cloud base (Diamond et al., 2018). Although Nc is approximately constant with height for the two Separated regimes and the Contact/Na<250 cm−3 regime, consistent with many previous studies (Nicholls and Leighton, 1986; Martin et al., 1994; Miles et al., 2000; Painemal and Zuidema, 2011; Wood, 2012), it experiences a significant and unexpected increase with ZN for the Contact/Na>250 cm−3 case. The highest Nc values occur where the MBL has both high Na and is in contact with overlying BB aerosol layers. The lowest boundary layer Na is found where there is separation from the overlying aerosol. It is perhaps surprising that clouds within boundary layers with higher Na but not overlain by aerosol, or clouds within boundary layers with lower Na but overlain by aerosol, possess very similar Nc. This further suggests that clouds' history of interacting with aerosol within the prior days (Mauger and Norris, 2007; Diamond et al., 2018) can have an impact on Nc but that aerosols entrained from above cloud top also have an impact on Nc. These findings are further described by Gupta et al. (2020).
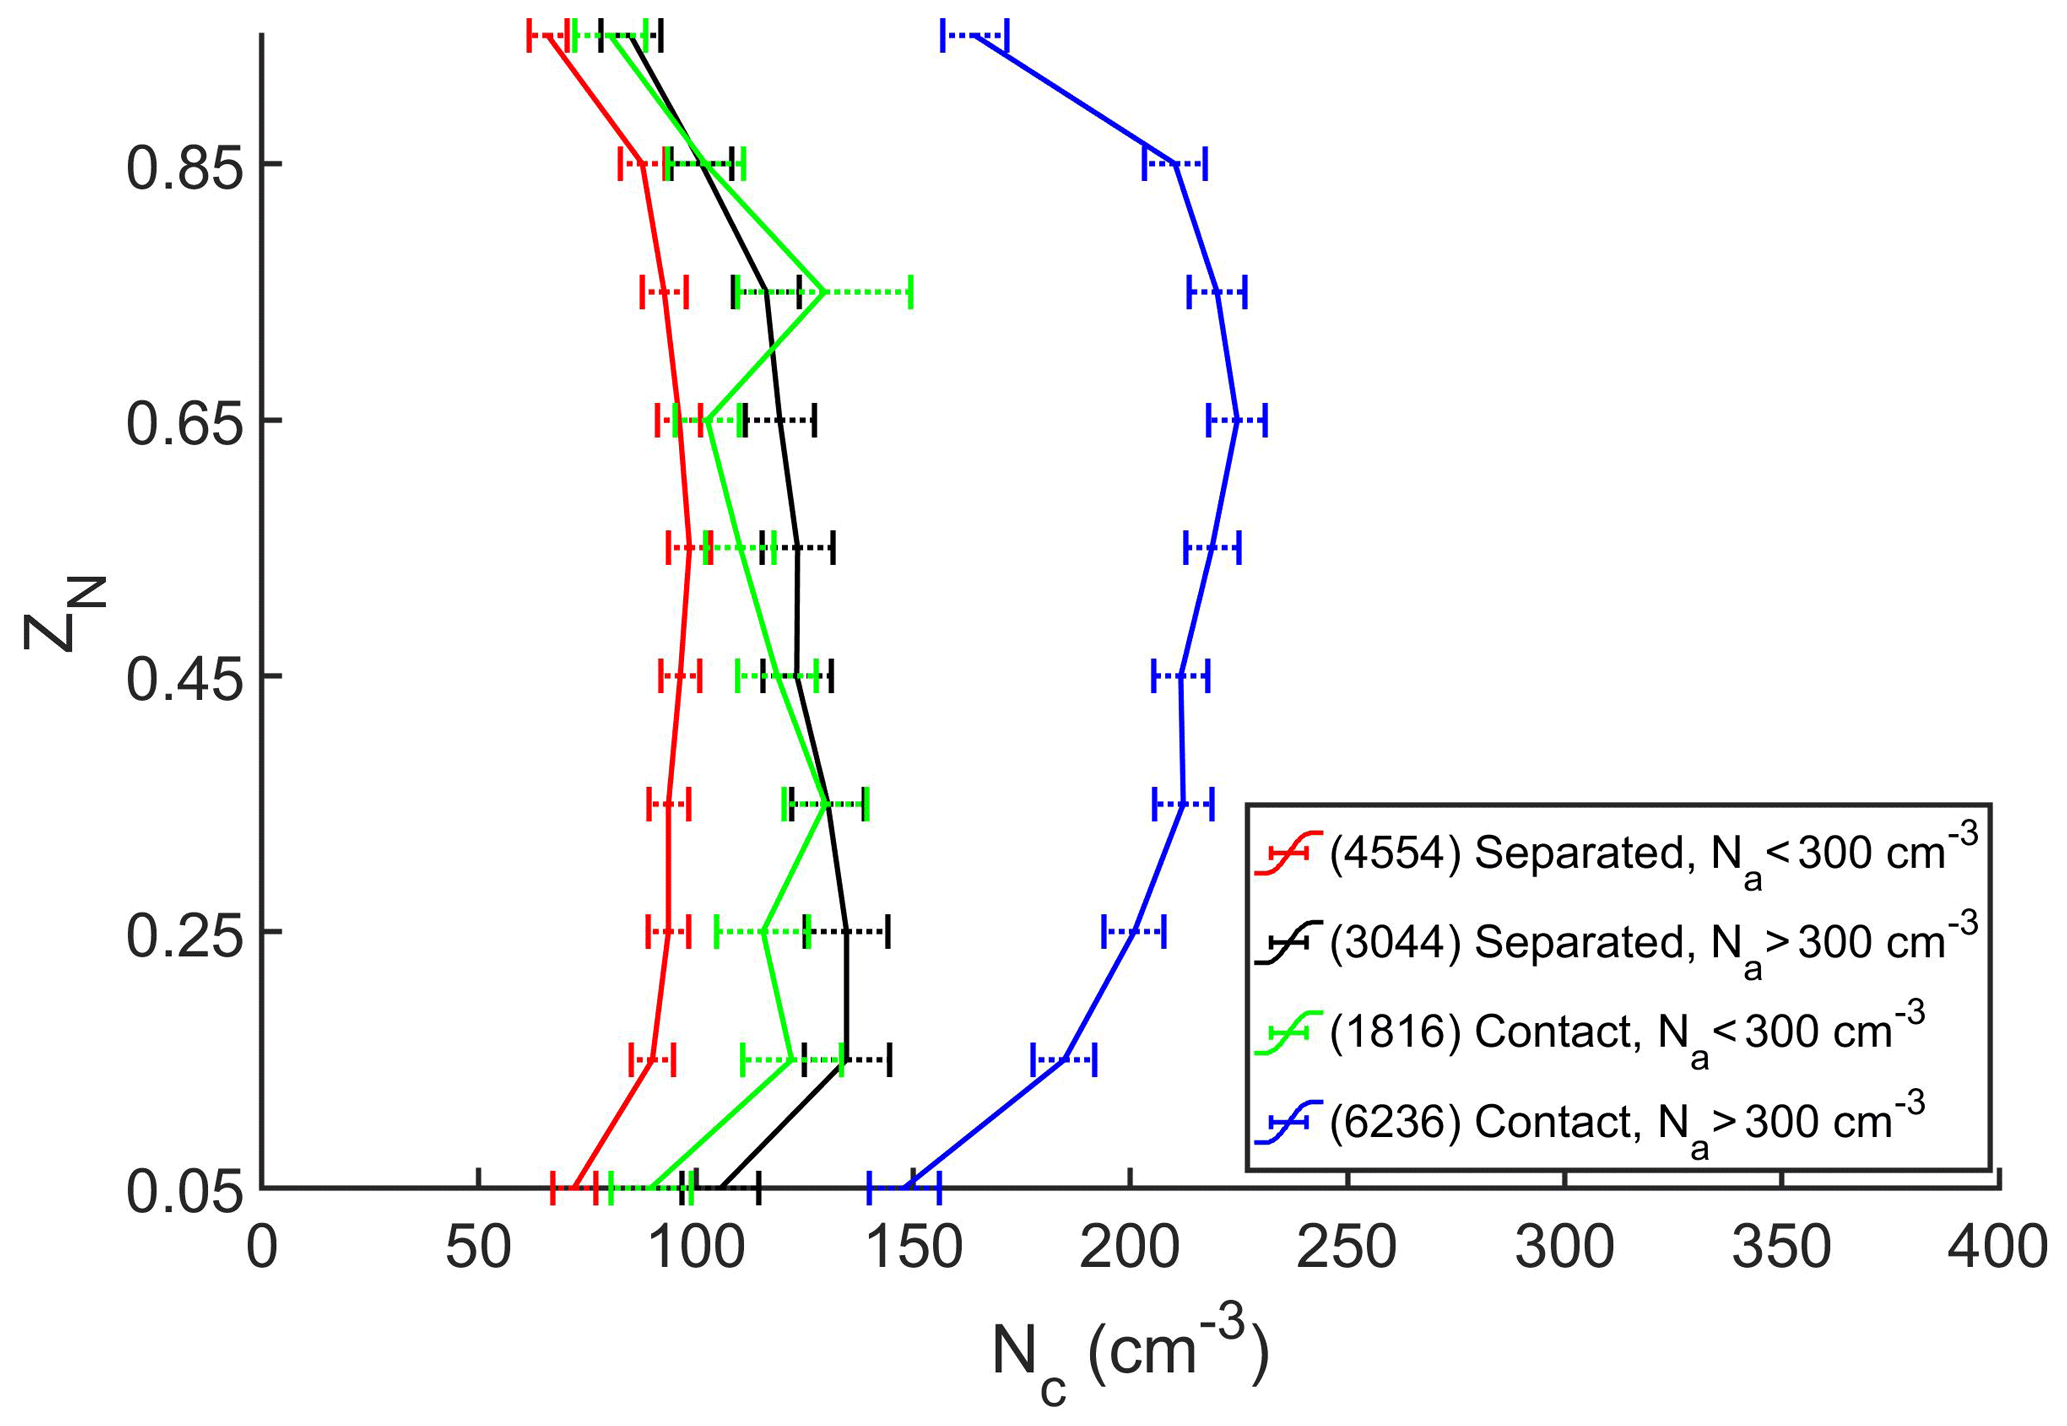
Figure 18Mean cloud droplet number concentration (Nc) as a function of normalized cloud depth (ZN), where the mean is computed for 397 vertical profiles flown during the three ORACLES campaigns. Different colors correspond to whether the boundary layer below cloud has average aerosol concentration Na<250 cm−3 or Na>250 cm−3 as measured by PCASP and according to whether a layer of BB aerosol is in contact with (Na>500 cm−3 within 100 m of cloud top) or separated from cloud top (no layer with Na>500 cm−3 within 100 m of cloud top). Uncertainties indicated by horizontal error bars represent the 95 % confidence intervals. Numbers in parentheses represent the number of 1 s data points included in each of the profiles. See text for details.
4.2.6 Comparisons of models and observations
Approximately one-half of all of the flights were devoted to a routine path, motivated by a desire to facilitate model improvement through an unbiased sampling performed frequently enough to adequately capture the monthly mean (see Sect. 3.3.6). An a priori evaluation based on the random sampling of clear-sky aerosol optical depths rationalized the decision to allocate six to eight flights to a routinely sampled flight line, on random days during the deployment. The initial model–observation comparison (Shinozuka et al., 2020), which is based on the 2016 measurements only, includes model versions similar to those used for the aerosol forecasts in the field (WRF-CAM5 (Weather Research and Forecasting – Community Atmosphere Model 5) and GEOS-5 (Goddard Earth Observing System, Version 5)), as well as the UK Meteorological Office Unified Model (UM), the French ALADIN-Climate (Aire Limitée Adaptation dynamique Développement InterNational – Climate, Mallet et al., 2019), the global GEOS-Chem (Goddard Earth Observing System – Chemistry) model, and the E3SM (Energy Exascale Earth System Model) Atmosphere Model (EAM). Measured variables which are compared include the aerosol layer top/bottom boundaries (as determined from lidar and in situ), aerosol extinction (lidar and in situ), black carbon and organic aerosol mass concentrations (SP2 and AMS), carbon monoxide, scattering and absorption Ångström exponents, and the single-scattering albedo (in situ). The new datasets allow an extension beyond previous assessments emphasizing the aerosol layer boundaries only (Das et al., 2017; Koffi et al., 2012). Not all of the models include all of these variables, and no effort is made to standardize model features such as the emissions databases and frequency of initialization. The project confronted the issue of how best to compare infrequently sampled but detailed measurements to frequently sampled but coarsely resolved model output, through aggregating both measured and model data into approximately 2 by 2∘ grid boxes centered on the routine flight track (see Fig. 19 for an example). This approach is similar to that applied within the AeroCom community (e.g., Katich et al., 2018; Myhre et al., 2013). The smaller grid spacings applied within a larger domain also clarify the ability of models to transport aerosol further offshore. A further study will apply a similar approach to model–observation comparisons based on the 2017 and 2018 deployments.
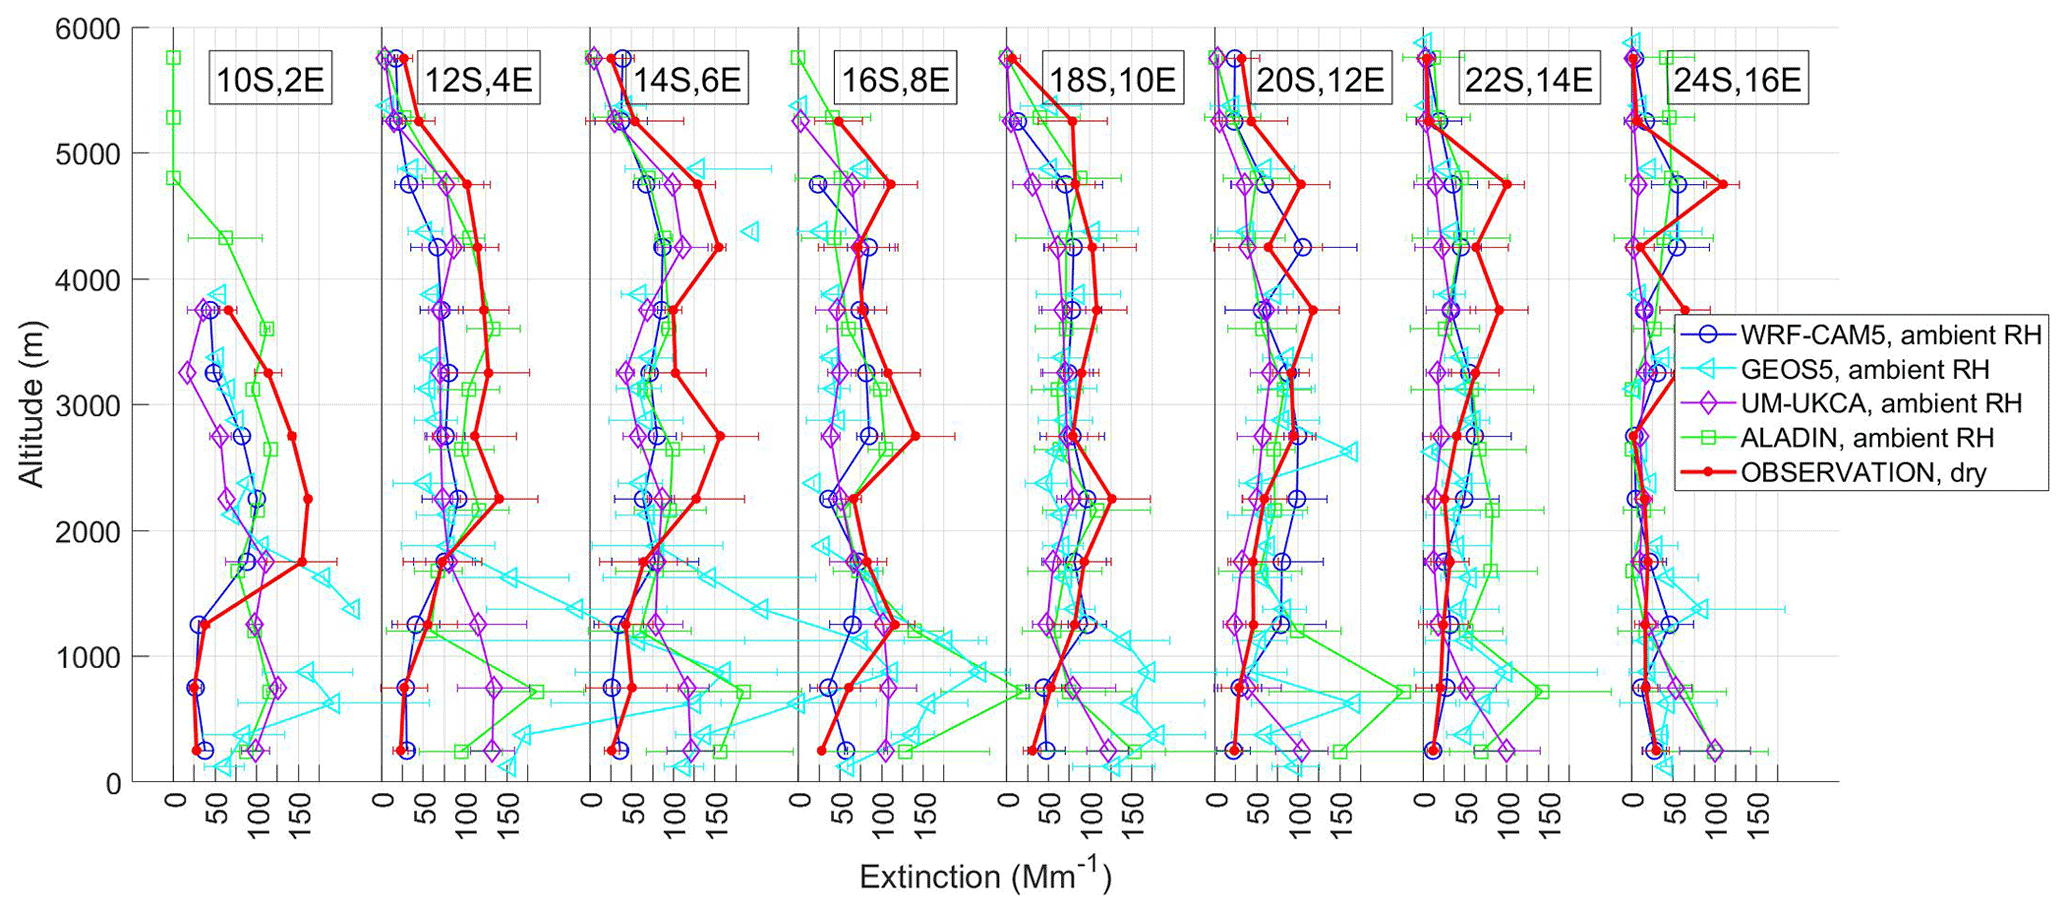
Figure 19Vertical distribution of mid-visible ambient aerosol extinction from four models compared to dry ORACLES observations in 2×2∘ grid boxes (locations indicated) along the 2016 routine flight track.
Shinozuka et al. (2020) assessed modeled aerosol properties through examining three separate layers and concluded that the upper 3–6 km layer generally contains less aerosol in the models than is observed, primarily because the aerosol layer tops are placed too low. Another approach, applied within Doherty et al. (2021) is examining the vertical distribution of aerosol (as in Fig. 19) and those cloud properties (cloud fraction and optical depth) important for quantifying the direct aerosol radiative effect. For example, they find significant differences in both the absolute value and vertical structure of SSA in the observations versus in the models, as well as significant differences between models. Consistent with Shinozuka et al. (2020), the model bias has an altitude dependence that results from the models generally placing the plume at too low an altitude. The covariance in the model bias in extinction and SSA with altitude affects the column SSA – the parameter of interest for determining plume aerosol direct radiative effect. Therefore Doherty et al. (2021) also compare observed to modeled extinction-weighted (or column-aerosol) SSA for the smoke plume. This and related analyses in the paper lay the groundwork for determining which modeled parameters are contributing most to biases in modeled aerosol direct radiative effect of the smoke.
4.2.7 Illustration of remote-sensing test bed
As alluded to in Sect. 2.1, a subordinate, yet important objective for ORACLES was the acquisition of data that can be used for the refinement and testing of retrieval capabilities for instrument concepts that have a potential for deployment to space. Among the remote-sensing instruments participating in ORACLES, the following have a link to space-based instrument concepts: HSRL-2 (future HSRL in space), APR-3 (CloudSat's CPR, GPM's DPR, RainCube's radar, EarthCARE's CPR, and candidate radars for future missions targeting clouds, convection, and precipitation), RSP (APS on Glory), AirMSPI (MAIA), and eMAS (MODIS). Examples of algorithm developments using ORACLES data include Xu et al. (2018), Segal-Rozenhaimer et al. (2018), and Miller et al. (2020), who created new cloud retrieval algorithms for the AirMSPI and RSP instruments. Additionally, the NASA Ames 4STAR instrument was used to provide AERONET-like retrievals of aerosol microphysics on the basis of sky radiance measurements from an airborne platform (Pistone et al., 2019), the SSFR instrument provided within-atmosphere spectral radiative flux observations for direct measurements of scene and cloud albedos both from the P-3 and from the ER-2 in 2016 (Cochrane et al., 2019), and HSRL-2 successfully deployed a very stable and accurate density-tuned interferometer as a prototype for spaceborne instrumentation and leveraged the resulting high accuracy in the measurements to infer aerosol microphysical properties (Burton et al., 2018). In combination, these instruments provide a powerful and unprecedented toolset for retrieving atmospheric trace gases, aerosol, and cloud properties, with simultaneous closure opportunities against the spectral radiative flux observations (see Fig. 20). The resulting dataset will be used in the testing of instrument and algorithm concepts for future satellite missions, such as the NASA Aerosol, Clouds-Convection and Precipitation (ACCP) mission, recommended by the 2018 Decadal Survey for Earth Observations from Space (National Academies of Sciences, Engineering, and Medicine, 2018) and the NASA Plankton, Aerosol, Cloud, Ocean Ecosystem (PACE) mission (Werdell et al., 2019), due for launch in 2023.

Figure 20Illustrative remote-sensing observations in ORACLES-2016. (a) Vertical structure of aerosol backscatter and W-band reflectivity from HSRL-2 and APR-3, respectively. (b) Degree of linear polarization (DoLP) and RGB imagery from AirMSPI (bow-tie patterns) and eMAS, respectively. (c) Above-cloud AOD (ACAOD) retrievals from various P-3, ER-2, and satellite instruments. (d) COD retrievals from various P-3, ER-2, and satellite instruments.
4.3 A revised schematic view of the system
Based on the knowledge acquired thus far from ORACLES analysis, we present a revised schematic of the system (Fig. 21) compared with what was described in Sect. 2 as the state of knowledge during ORACLES conception and planning. Smoke from biomass burning over the southern African continent in Austral winter and spring (July–October) is emitted into a continental boundary layer that is potentially warmer, and therefore more buoyant, than the cold marine PBL to the west. As this smoke moves westward over the SEA, it must first cool to allow it to subside and be entrained into the PBL. In the free troposphere, clear-sky longwave cooling by emission to space helps drive large-scale subsidence. This process is slow, with typical radiatively driven subsidence rates of 200 400 m d−1 (Betts and Ridgway, 1988). Solar heating by absorbing aerosol may significantly slow down this process (Sakaeda et al., 2011). As the smoke moves initially westward over the SEA, it typically takes 6–10 d to subside from the jet core to the top of the marine PBL. Typical free-tropospheric wind speeds over the SEA in the southern African Easterly Jet (SAEJ) can reach 5 m s−1, so smoke can travel hundreds to a few thousand kilometers offshore in the time taken to descend from the main smoke outflow altitude of 4–5 km. However, FT wind speeds over the SEA are quite variable (see Fig. 15 in Adebiyi and Zuidema, 2016) and are modulated by tropical wave disturbances and by incursions of midlatitude systems into the tropics over the Southern Ocean. Depending upon winds in the FT, smoke trajectories may result in only modest horizontal displacement or may (as in the case shown in the schematic Fig. 21) be advected as far south as 30∘ S, especially when midlatitude systems result in re-circulating trajectories that move air back toward the African continent after initial outflow. Thus, smoke aerosol may be entrained into the PBL over a relatively wide geographical region.
Because subsidence is strongest off the coast of Namibia and southern Angola, this makes it a favored region for entrainment of smoke into the marine PBL, especially from recirculating trajectories like the one shown in Fig. 21. This setup results in a typical (September) vertical plume structure in the ORACLES sampling region comprising relatively young aerosol aloft, more aged aerosol immediately above cloud, and the oldest aerosol typically in the marine PBL itself. However, the extensive lateral displacement of the core, and a wind structure with significant vertical shear, means that the presence of smoke immediately above cloud top is intermittent. The PBL over the SEA therefore entrains a considerable volume of clean air, especially from the Southern Ocean. Thus, mean CO levels in the PBL are lower than 100 ppm, while FT plume mean values are typically 150–200 ppm (Shinozuka et al., 2020). With typical unpolluted background levels of 50–70 ppm, this suggests that the majority of the air in the PBL has origins in regions other than those affected by biomass burning. Although this is the case, smoke plumes in the FT have very high aerosol levels (mass, concentration) compared with those in the pristine marine PBL (see Shinozuka et al., 2020), so even quite small mean elevations of CO in the PBL are associated with large aerosol perturbations.

Figure 21A schematic showing an example of a commonly occurring trajectory pathway into the marine PBL for smoke aerosol ejected from southern Africa in the core (3–5 km altitude) of the southern African Easterly Jet (SAEJ). This is overlaid onto an August–October mean climatology of cloud droplet concentration (colors) derived using MODIS (Bennartz and Rausch, 2017). Trajectories over the SEA are variable. Depending upon the winds in the FT, the trajectory may remain relatively static or may (as in the case shown here) be advected as far south as 30∘ S and back toward the African continent by the incursion of midlatitude disturbances that lead to westerly lower tropospheric winds extending into tropical latitudes.
As with any significant suborbital field deployment, we expect substantial data analysis efforts to extend well beyond the nominal project end date. In this section, we describe ongoing analyses not previously mentioned. Future work that may be facilitated by ORACLES data is captured in Sect. 7.
Science objective 1 on direct aerosol radiative effects (DAREs) is being pursued with a number of different approaches. At the finest spatiotemporal scale, these approaches entail instantaneous assessments of DAREs on the basis of very complete measurements of aerosol and cloud radiative properties from designated flight maneuvers on a particular flight day. On the larger scales, these approaches combine geostationary satellite observations of diurnally varying cloud properties and above-cloud AOD, both adjusted for aerosol radiative properties measured in situ and possibly nudged by chemical transport model outputs, with campaign-average models of aerosol intensive properties. A designated group of ORACLES scientists meets routinely to discuss the results of the DARE assessment efforts and to avoid duplication of research efforts. Participation in these teleconferences can be requested through email to the corresponding authors of this paper.
Current work on science objective 2, the semi-direct aerosol effect, focuses on understanding how the vertical structure in the SSA depicted in Fig. 14 relates to aerosol aging versus source composition (fuel type and flaming/smoldering conditions) and how the aging relates to aerosol transport patterns. Such work is primarily aimed at developing an understanding of the processes affecting the aerosol SSA and is crosscutting across the different campaigns. Other work is examining how clouds adapt to variations in the absorbing aerosol vertical structure. The discrimination between cloud adaptations to the aerosol shortwave absorption, cloud-nucleating properties, and variability in the large-scale circulation is inherently complex. While this work will assuredly require focused modeling activities that can control more easily for cause–effect relationships, ongoing analysis of ORACLES datasets will frame the modeling activities. In one example, the multiple routine flights along 5∘ E, conducted in both August 2017 and October 2018, are being analyzed to determine the dominant thermodynamic, dynamic, and aerosol features. In another example, remote-sensing data from the ER-2 platform in September 2016 on the aerosol vertical structure and cloud properties are being constrained by sea surface temperature and location to assess liquid water path responses to aerosol loading and vertical structure.
Science objective 3 focuses on effects of smoke CCN on the microphysical properties of clouds and precipitation. Concentrations of CCN in the PBL are much lower than those in the FT smoke plume because (a) subsidence and entrainment of smoke into the PBL is relatively slow and (b) there are significant losses in the PBL from both dry and wet deposition. Work is currently underway to understand the transport pathways from the FT into the PBL using a combination of measurements of water vapor, tracers such as carbon monoxide (CO), and the isotopic composition of both water vapor and liquid water to understand the smoke contribution to the PBL CCN budget. Cloud droplet concentration closure is being used to quantify the efficacy with which smoke aerosols serve as nuclei for cloud droplet activation. Remote-sensing and in situ measurements are being used to understand both how smoke suppresses precipitation and the extent to which precipitation is a removal process for CCN. The airborne polarimeter and in situ observations are being used to provide constraints to correct satellite estimates of cloud droplet concentrations that may be affected by overlying smoke. Analyses to assess the Lagrangian evolution of clouds will help quantify how entrainment of smoke aerosol can impact Nd and change liquid water path and cloudiness. One such Lagrangian case, observed by both the P-3 and the UK BAe-146 aircraft over several days, involved a major smoke entrainment event and is currently being used to constrain large eddy simulations to evaluate both semi-direct and indirect aerosol effects.
All of the ongoing analyses on the overarching science objectives depend critically on the comparisons of observations and models described in Sect. 5.3.6. This dependence is manifested in two separate ways. The first, and more obvious way, is that the models are being evaluated for their ability to fill in missing pieces of information required for the assessment of direct, semi-direct, or indirect aerosol radiative effects in the SE Atlantic. If models are shown to provide reasonable predictions of relevant parts of the aerosol–cloud system, the predictions of these parts can be used to extrapolate aerosol and cloud properties beyond the available spatial and temporal domains. The second, and slightly less obvious way, is that the models can be used to study the representativeness of the airborne and even some of the satellite observations. In the case of the airborne measurements, for example, the comparison of a model output averaged over all time steps coincident with the measurements to the model averaged over all times in a given month may provide an assessment of how representative the relatively sparse airborne observations are for a monthly mean. If the two averages vary significantly, then we may conclude that the airborne observations should not be used directly but instead should be adjusted by the model results, for the purpose of calculating monthly mean aerosol effects. Relatedly, the in situ-measured aerosol properties should only be used to evaluate model results if both the monthly average model output and the output subsampled to the airborne observations show the same discrepancy to the model, as such a consistent discrepancy is attributable to a model deficiency rather than a sampling error.
Radiative closure studies will be equally important for progress on the overarching science questions. In a broad sense, these closure studies relate the aerosol and cloud properties measured in situ on the P-3 to remotely measured radiances or irradiances, either from the ER-2 (in 2016), from satellites, or from radiation measurements on the P-3 itself. They may be as ambitious as exploring the connection between the measured aerosol chemical composition, aerosol and cloud radiative properties, and the radiation field or as simply comparing the aerosol radiative properties measured in situ to those measured from remote-sensing instruments. Either way, the knowledge gained from these closure studies will be crucial for assessing large-scale aerosol–cloud–radiation interactions.

Figure 22Longitudinal cross section of the HSRL-2 scattering ratio curtain collected during the ER-2 transit from Recife, Brazil, to Walvis Bay, Namibia, on 26 August 2016.
The ORACLES project is a highly successful NASA EVS-2 project that had well surpassed its Level-1 baseline science requirements upon the conclusion of its last field deployment in October 2018. We conducted a total of three flight deployments totaling 350.6 science flight hours with the NASA P-3 aircraft and one flight deployment with the NASA ER-2 totaling 97.3 science flight hours, surveying, probing, and exploring the various features of the SE Atlantic aerosol–cloud–climate system. The ORACLES dataset permits the study of aerosol radiative and cloud-nucleating properties, their vertical distribution relative to clouds, the locations and degree of aerosol mixing into clouds, and cloud changes in response to such mixing. Here, we have only touched upon some of the key findings, leaving the detailed exploration of the various factors determining aerosol–cloud–climate interactions in the SE Atlantic to the individual investigations being conducted as part of, or spawned by, the ORACLES project. A high-level summary of some of the main scientific findings and conclusions from our project includes the following:
-
the marine boundary layer of the SE Atlantic is more frequently affected by BB aerosol than previously thought, with the variety of pathways by which BB aerosol reach the BL complex not yet fully explored (Zuidema et al., 2018); the transport and climate models used in ORACLES flight planning had limited success in forecasting the locations and levels of MBL aerosol pollution;
-
BB aerosol layers appear to be in much more frequent contact with the Sc cloud deck underneath than previously estimated, but the correlation of cloud droplet number concentrations with above-cloud smoke properties is weak (Diamond et al., 2018); in situ data from August 2017 suggest that cloud droplet number and above-cloud aerosol can be anticorrelated, owing to the anticorrelation of MBL aerosol with above-cloud aerosol amount (Kacarab et al., 2020);
-
cloud vertical velocity tends to correlate positively with MBL aerosol number; this covariance tends to enhance cloud droplet number considerably beyond what is expected from aerosol changes alone (Kacarab et al., 2020); most of the observed droplet variability in clouds in polluted boundary layers during the August 2017 deployment appears driven by vertical velocity and its variability (Kacarab et al., 2020);
-
interannual variations in the seasonal evolution of aerosol loading in the FT and cloud droplet number concentrations in the MBL over the SE Atlantic during the BB season are greater than previously appreciated (see Sect. 4.2 and 4.3); they are affected by interannual variations in BB location and strength and possibly by variations in the SAEJ (see Sect. 4.1);
-
direct airborne measurements of the above-cloud AOD have shown a slight overestimation by current remote-sensing techniques from spaceborne instruments (MOD06ACAERO, Deep Blue MODIS, and VIIRS) and some potential difficulties in cloud masking (LeBlanc et al., 2020; Sayer et al., 2019) but a generally consistent meridionally distribution between the airborne and orbital observations;
-
aerosol radiative properties, such as the single-scattering albedo and asymmetry parameter, especially in column-integrated values, show reproducible spectral dependence and a fairly-well-constrained range of absolute values in each deployment year (Pistone et al., 2019; Cochrane et al., 2020); their vertical dependence appears to be reproducible as well (see Sect. 5.2.6); overall these highlight that the aerosol is more absorbing than previously thought;
-
aerosol radiative properties can correlate well to the relative proportion of BC and organics during plume aging (see Sect. 5.2.2 and 5.2.3), a process not previously investigated by suborbital means as it requires the sampling of smoke well beyond the near-field fire environment – this sampling of smoke properties up to 2 weeks after emission is a unique accomplishment of ORACLES;
-
despite the large aerosol loadings, water vapor also contributes significantly to the total heating rate at most altitudes (Mallet et al., 2019; Cochrane et al., 2020), if less to the range in total heating rates;
-
there was ample evidence for aerosol-induced modifications of Sc cloud properties (Fig. 18) and those of mid-level clouds (Adebiyi et al., 2020);
-
a new cloud/rain dataset produced by a joint multi-wavelength cloud radar and multi-angle/multi-wavelength polarimeter will allow for further investigation for the suppression of drizzle by aerosol (Dzambo et al., 2019, 2020);
-
chemical transport models and climate models exhibit a fairly systematic underestimation of aerosol loadings in the SE Atlantic (Shinozuka et al., 2020).
An analogous summary of lessons learned for logistics and planning of large field campaigns to address aerosol–cloud–climate interactions includes the following:
-
the ORACLES science objectives and questions provided crucial guidance for flight execution in each of the deployment years;
-
progress towards achieving science objectives was facilitated by the bookkeeping of flight maneuvers that relate directly to the various detailed science objectives, although such bookkeeping proved challenging in the field;
-
the joint efforts in developing flight plans by scientists with nominally different flight objectives (e.g., cloud microphysics and radiation) revealed that relatively minor adjustments to flight maneuvers often resulted in datasets that are conducive to addressing a broad range of science questions, well beyond the benefits of flight plans that were developed by any one focused group in isolation;
-
the scientific connection to international deployment efforts conducted by the CLARIFY and AEROCLO-sA teams in the same region and timeframe as ORACLES-2017 proved a worthy investment of time – while the connecting science is ongoing, there are already measurable outcomes from the international scientific collaborations in terms of the geographic extension of datasets and related publications (e.g., Mallet et al., 2019; Formenti et al., 2019; Haywood et al., 2020);
-
the routine sampling strategy for about half of the ORACLES flights allowed for a statistical assessment of climate and chemical transport models, unprecedented for suborbital efforts in this field of study;
-
the involvement of the modeling community in the conception and development of the ORACLES project in general, and its flight planning specifically, proved to be invaluable for collecting a dataset that can be used for addressing model deficiencies that hamper our ability to accurately simulate aerosol–cloud–climate interactions.
Future work will likely need to focus on aspects of the science that remain poorly understood and/or physics that is well understood but not well represented in models. Such topics will likely include long-term changes in biomass burning activity, convection and FT transport in the BB source region, the location and degree of mixing of BB aerosols into the SE Atlantic MBL, and the separation of synoptic-scale variations in the meteorological environment from aerosol-induced changes in Sc cloud properties, to name a few.
We conclude this paper with a figure that represents the complexity of the SE Atlantic aerosol–cloud system well. Figure 22 shows the longitudinal transect of the HSRL-2 scattering ratio curtain collected during the ER-2 transit from Recife, Brazil, to Walvis Bay, Namibia, on 26 August 2016. In addition to expected features, such as an increasing MBL height with increasing distance from southern Africa, and the general dilution of the BB plume with distance from shore, the high signal-to-noise ratio in the HSRL-2 data also reveals a complexity of the layering structure within the BB plume that was previously not appreciated. The layering includes horizontal and vertical gradients in loading, and likely in microphysics, with small-scale features that bear explanation. Future studies of the SE Atlantic climate system are well advised to embrace this complexity.
Tables A1a and A1b summarize the P-3 and ER-2 flights in 2016, respectively, while Tables A2 and A3 summarize the P-3 flights in 2017 and 2018, respectively. The entries for each flight are comprised of the flight date and identifiers (format xRFnnYyy, where x is the platform indicator – P for the P-3 or E for the ER-2; RF is static and stands for research flight; yy is the flight number for this platform and year; Y is static and stands for year, nn is the numerical year – 16, 17, or 18) in the first column. Column 2 indicates the total flight time. Column 3 contains a brief flight synopsis and numbers that indicate the number of specific flight maneuvers indicated in each flight.
Table A1(a) The 2016 flight summary for the P-3 aircraft. The number of each type of flight maneuver (as given in the table header) is shown in parentheses for each flight. Flight synopsis indicates whether the flight was a designated routine or target-of-opportunity flight. (b) The 2016 flight summary for the ER-2 aircraft.
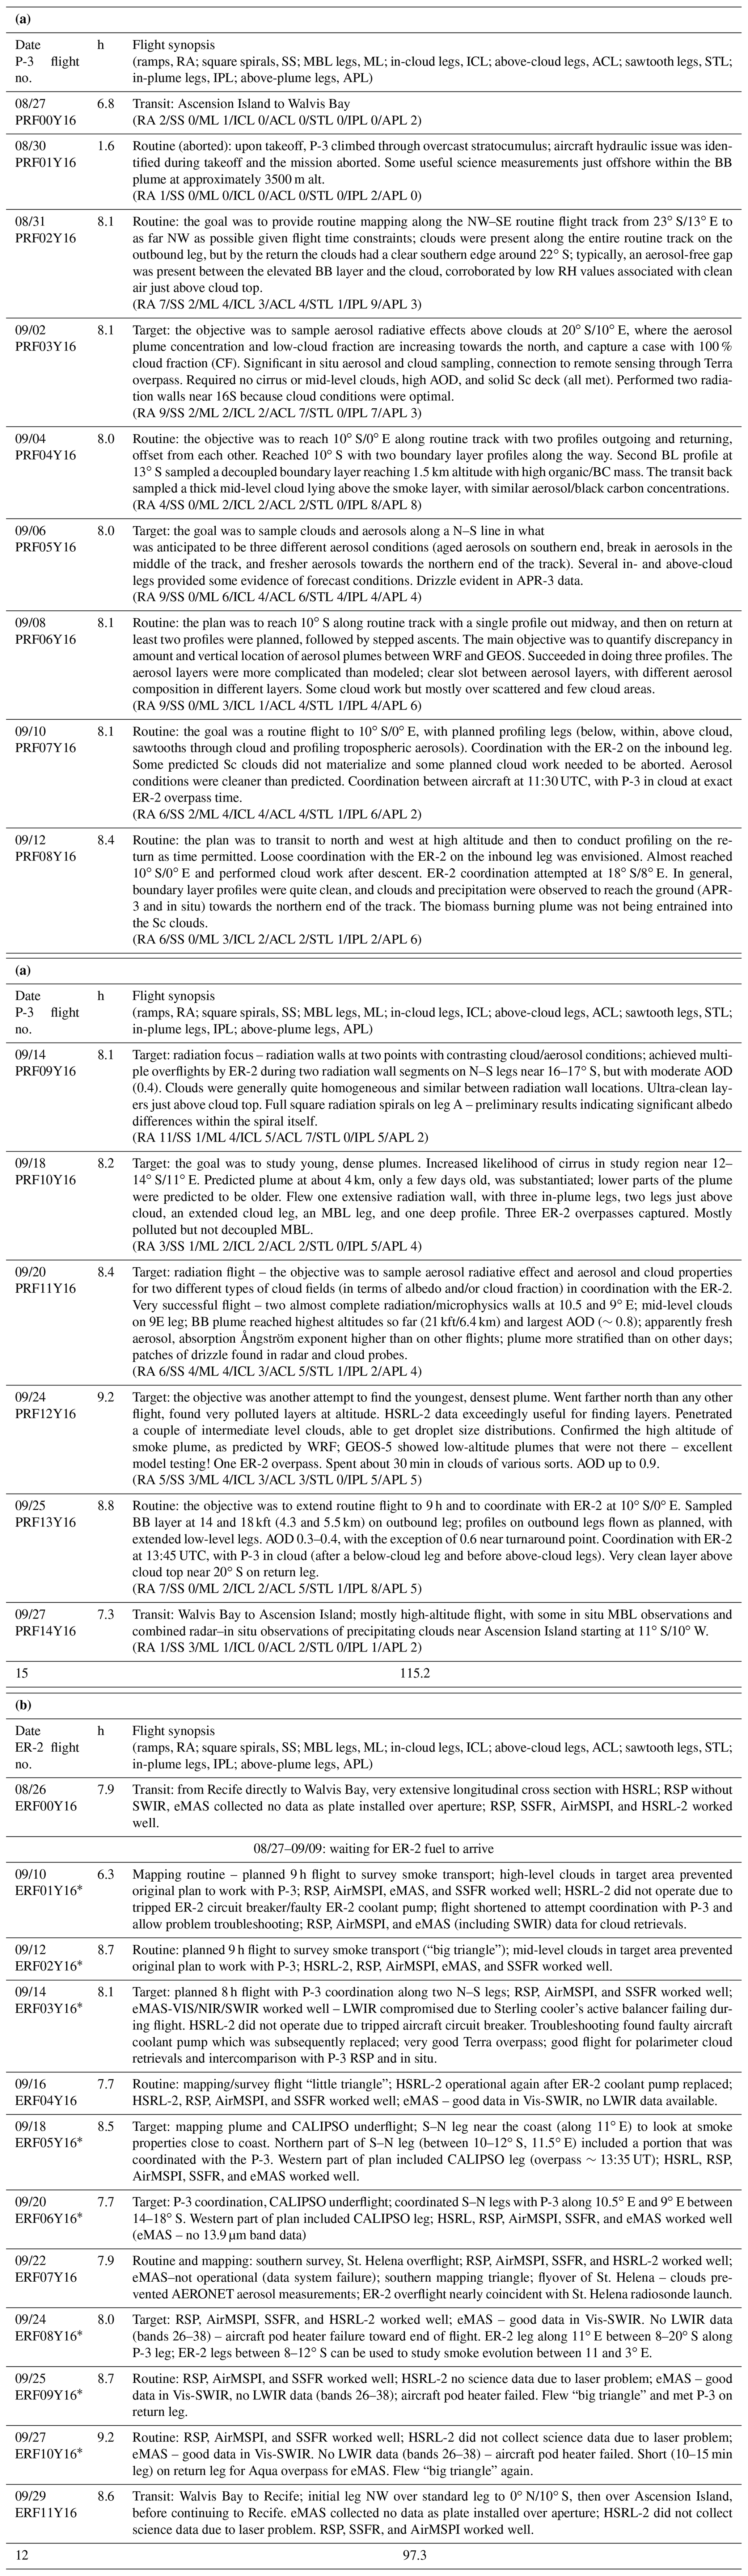
∗ ER-2 flights that were closely coordinated with P-3 aircraft operations.
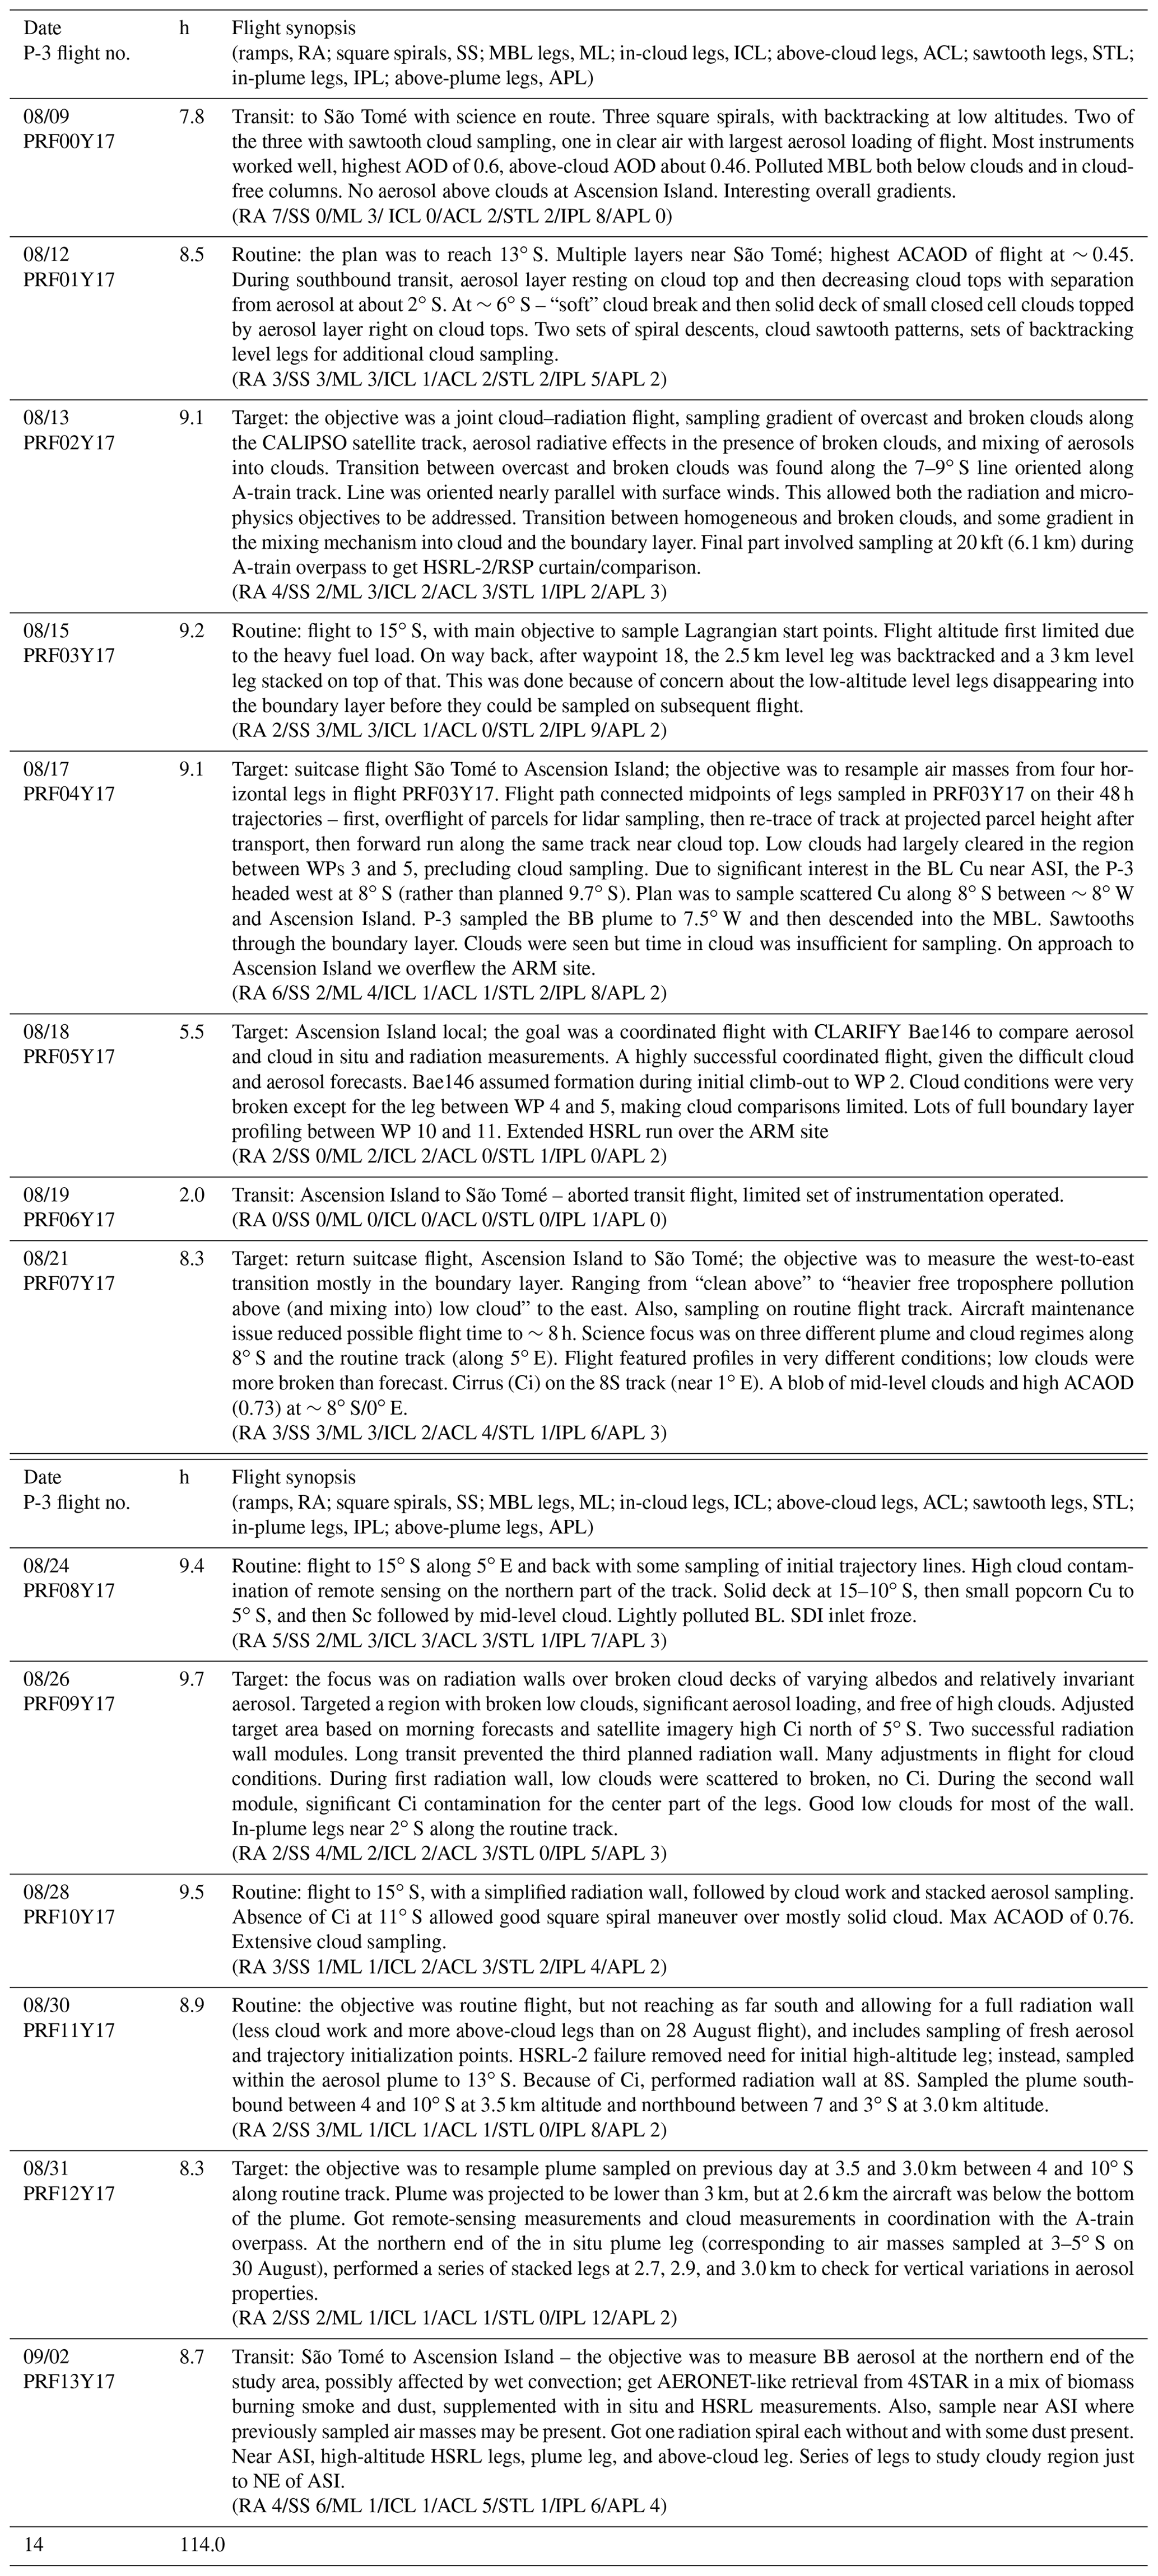
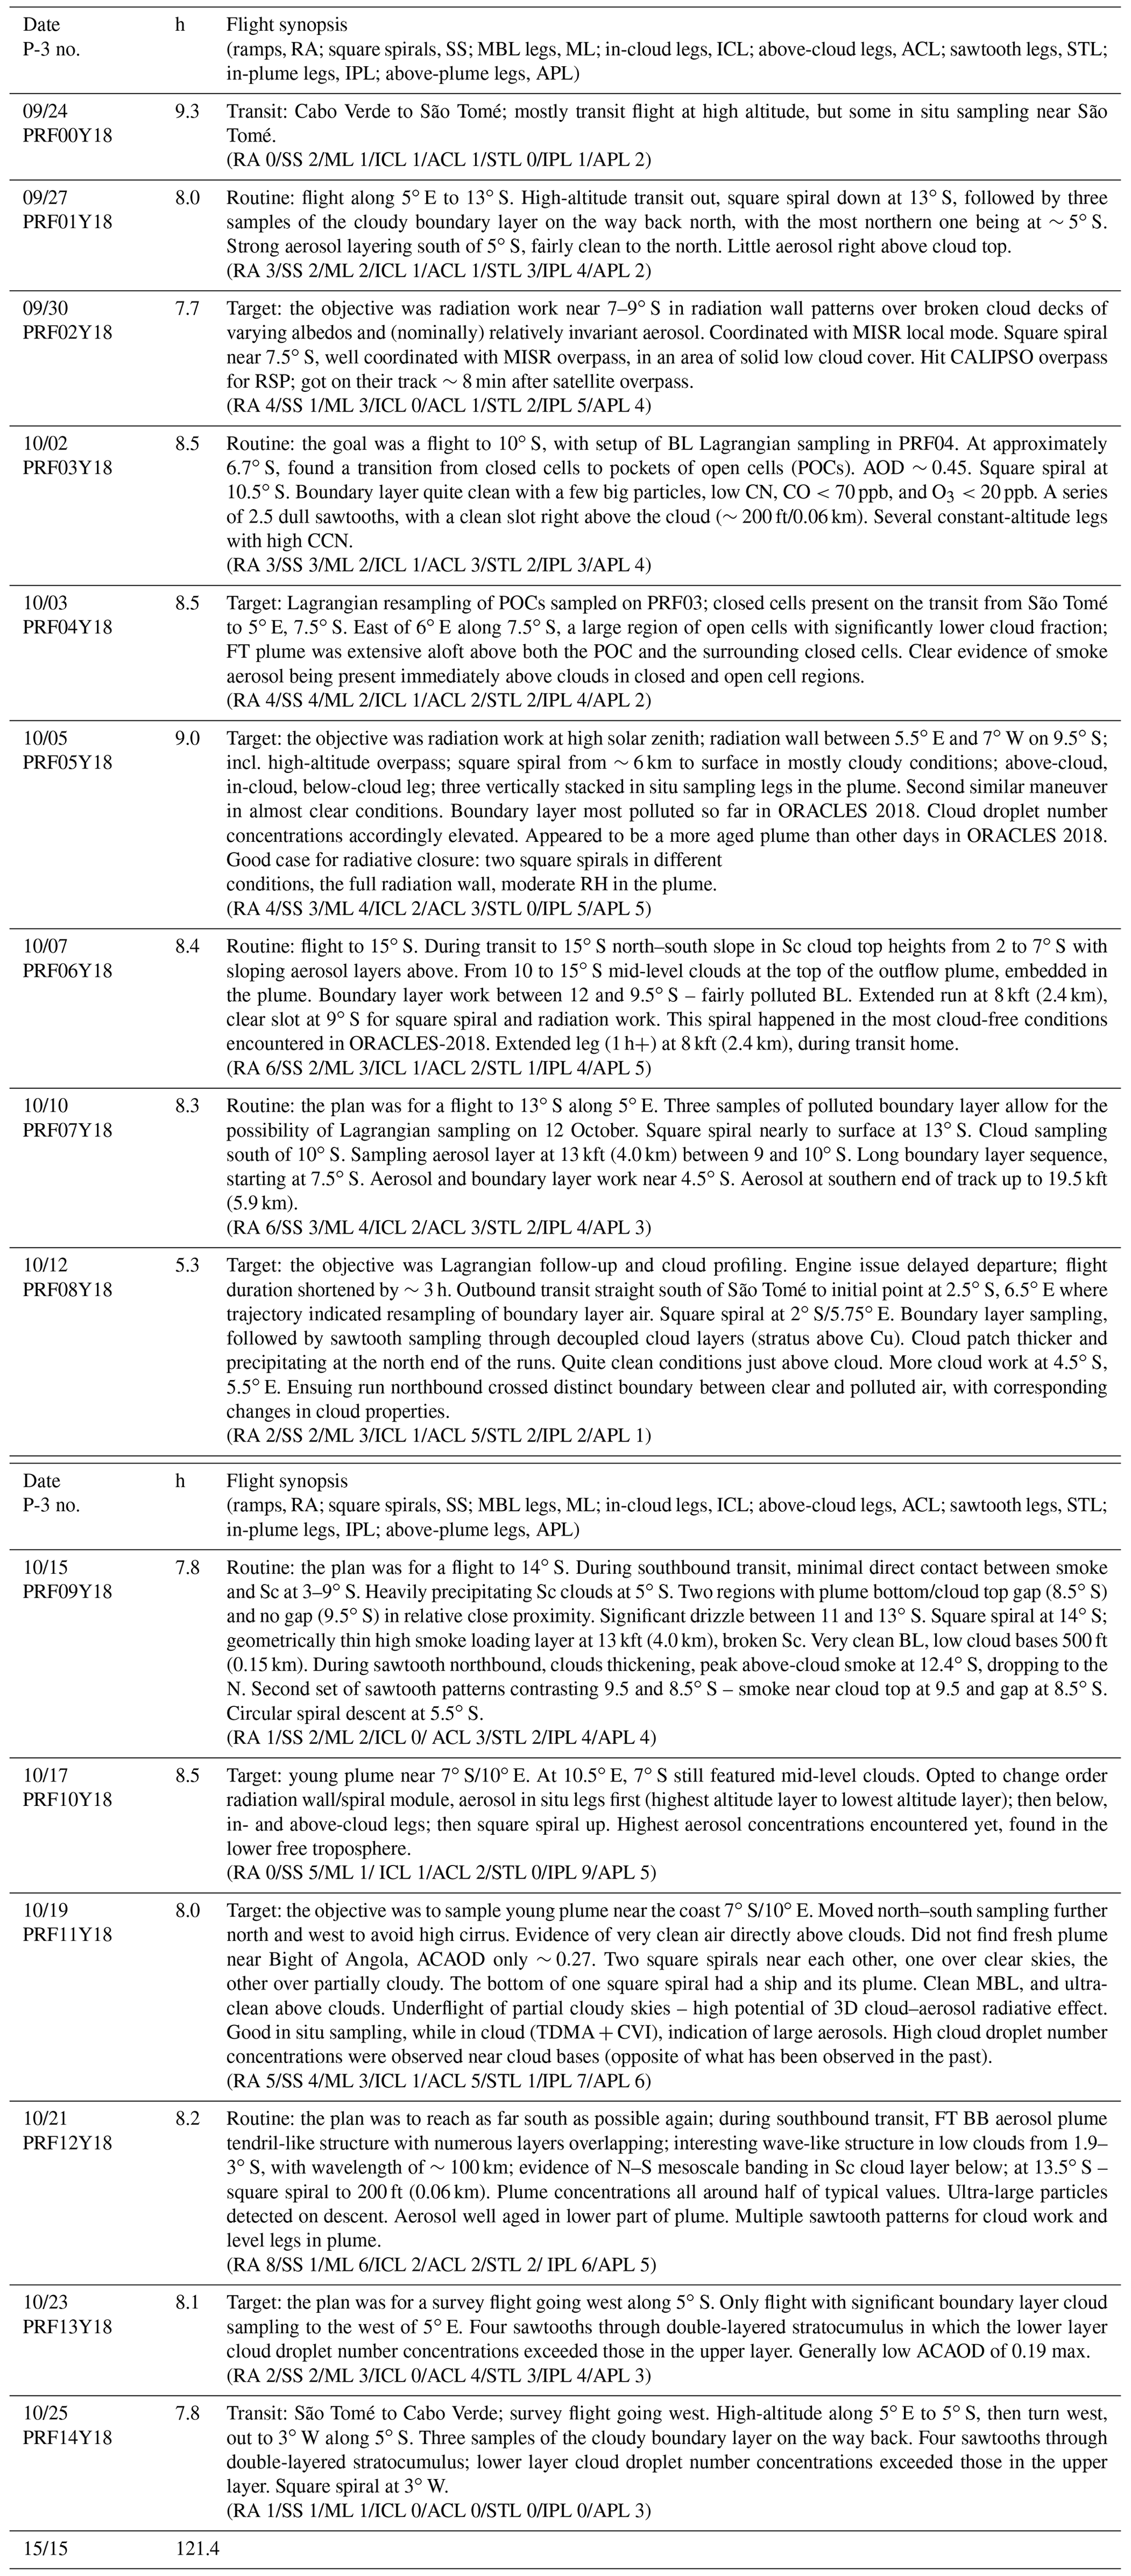
Figure A1 shows the distribution of flight times dedicated to the various flight maneuvers described in Table 5 in each of the three ORACLES deployments. While broadly similar, there are a few notable distinctions: 2017 and 2018 featured significantly fewer ramp descents, relatively less time just above cloud top, and more time dedicated to square spiral descents. Also, 2017 and 2018 entailed more sawtooth profiling through clouds than time spent in level legs within clouds. These changes represent an evolution in the thinking regarding the best flight maneuvers to address various cloud- and radiation-related science objectives from the first to the second and third deployment.

Figure A1Distribution of flight time between flight maneuvers for each ORACLES deployment year.
Table B1P-3 instrumentation in ORACLES (bold entries indicate quantities submitted to the ORACLES archive; see ORACLES Science Team, 2020a–d, in the list of references).
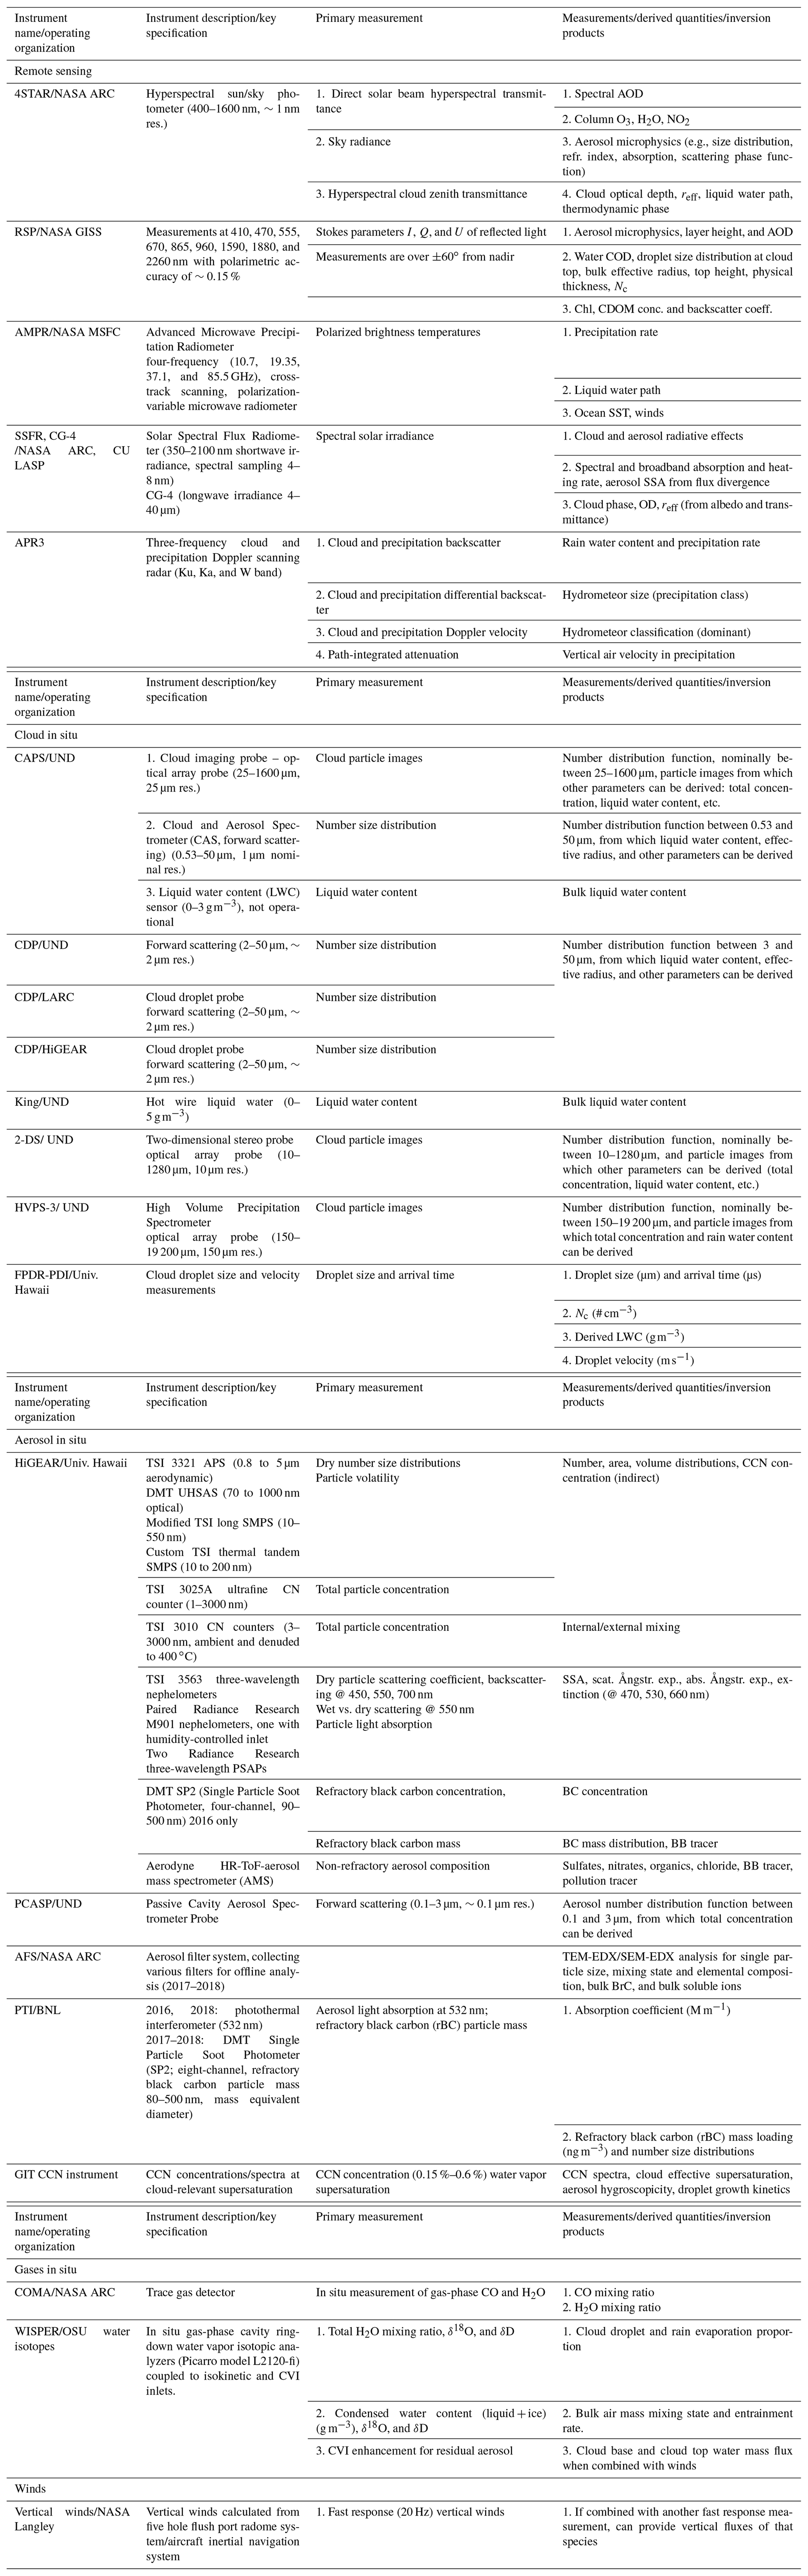
Table B2ER-2 instruments in ORACLES 2016.
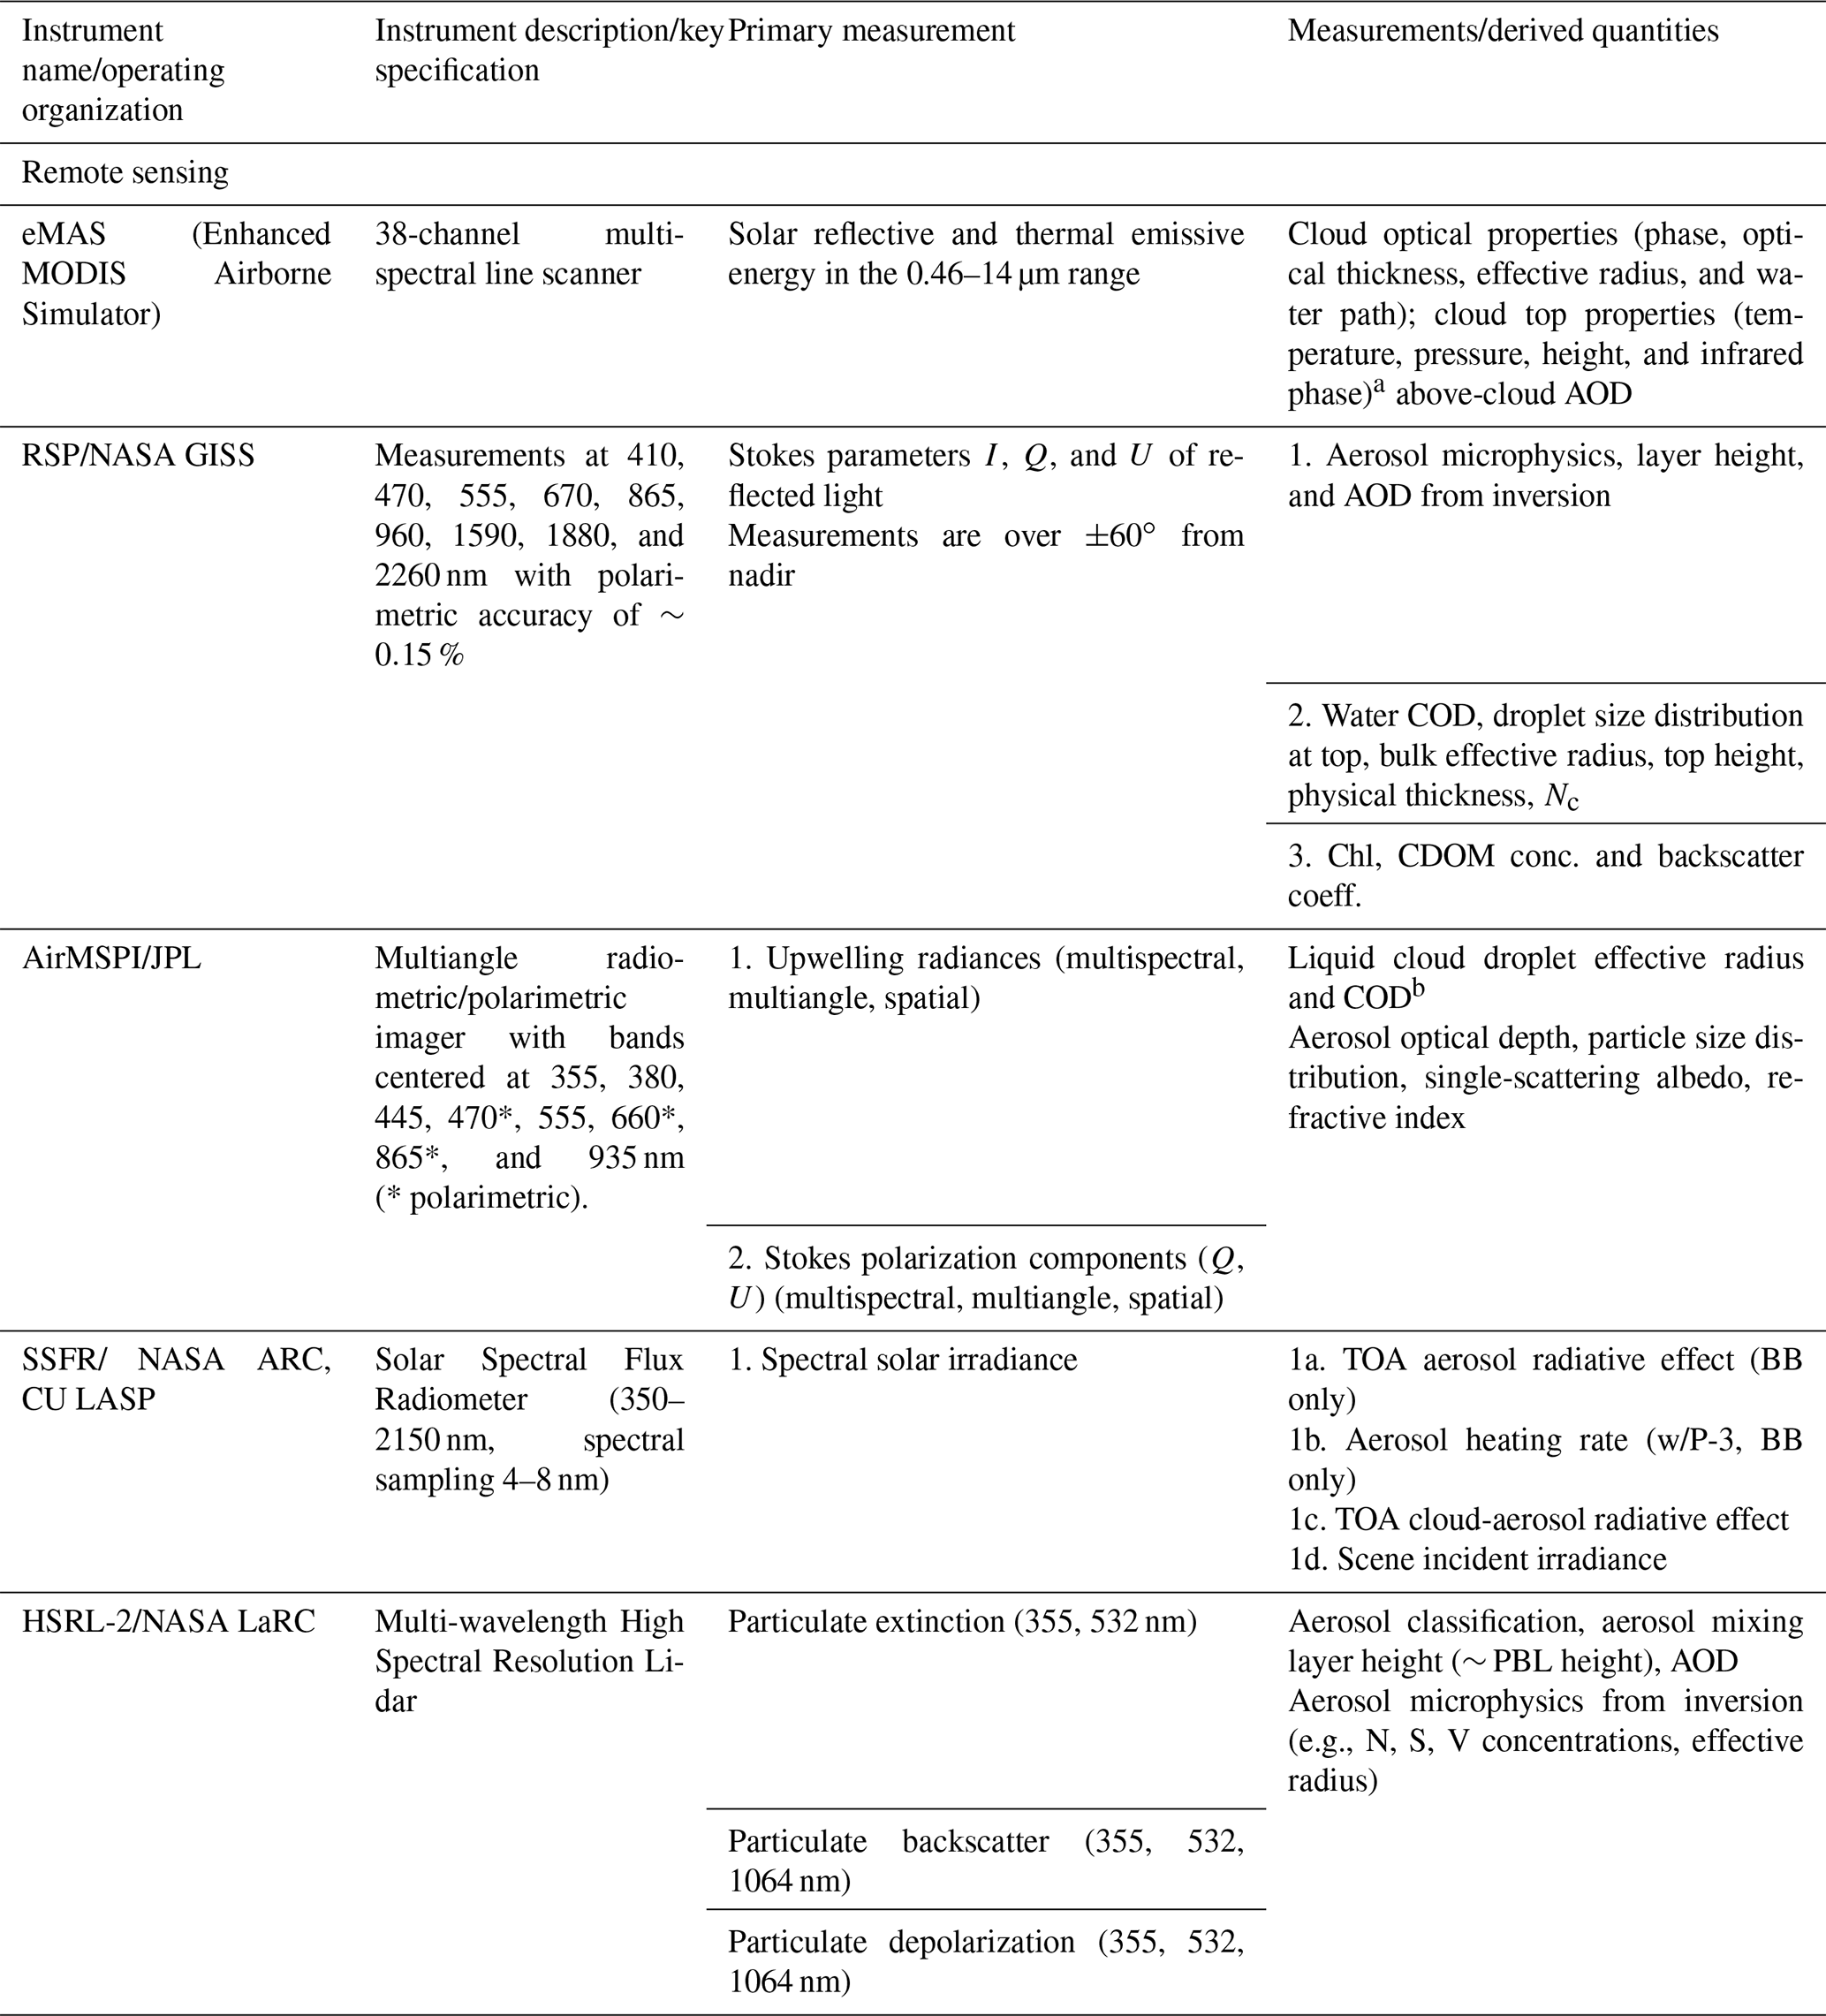
a eMAS-derived quantities, along with L1B data, are archived and
publicly available at the LAADS DAAC (https://ladsweb.modaps.eosdis.nasa.gov/, last access: December 2020), not the ORACLES archive.
b RSP-derived quantities are publicly available at
https://asdc.larc.nasa.gov (last access: December 2020).
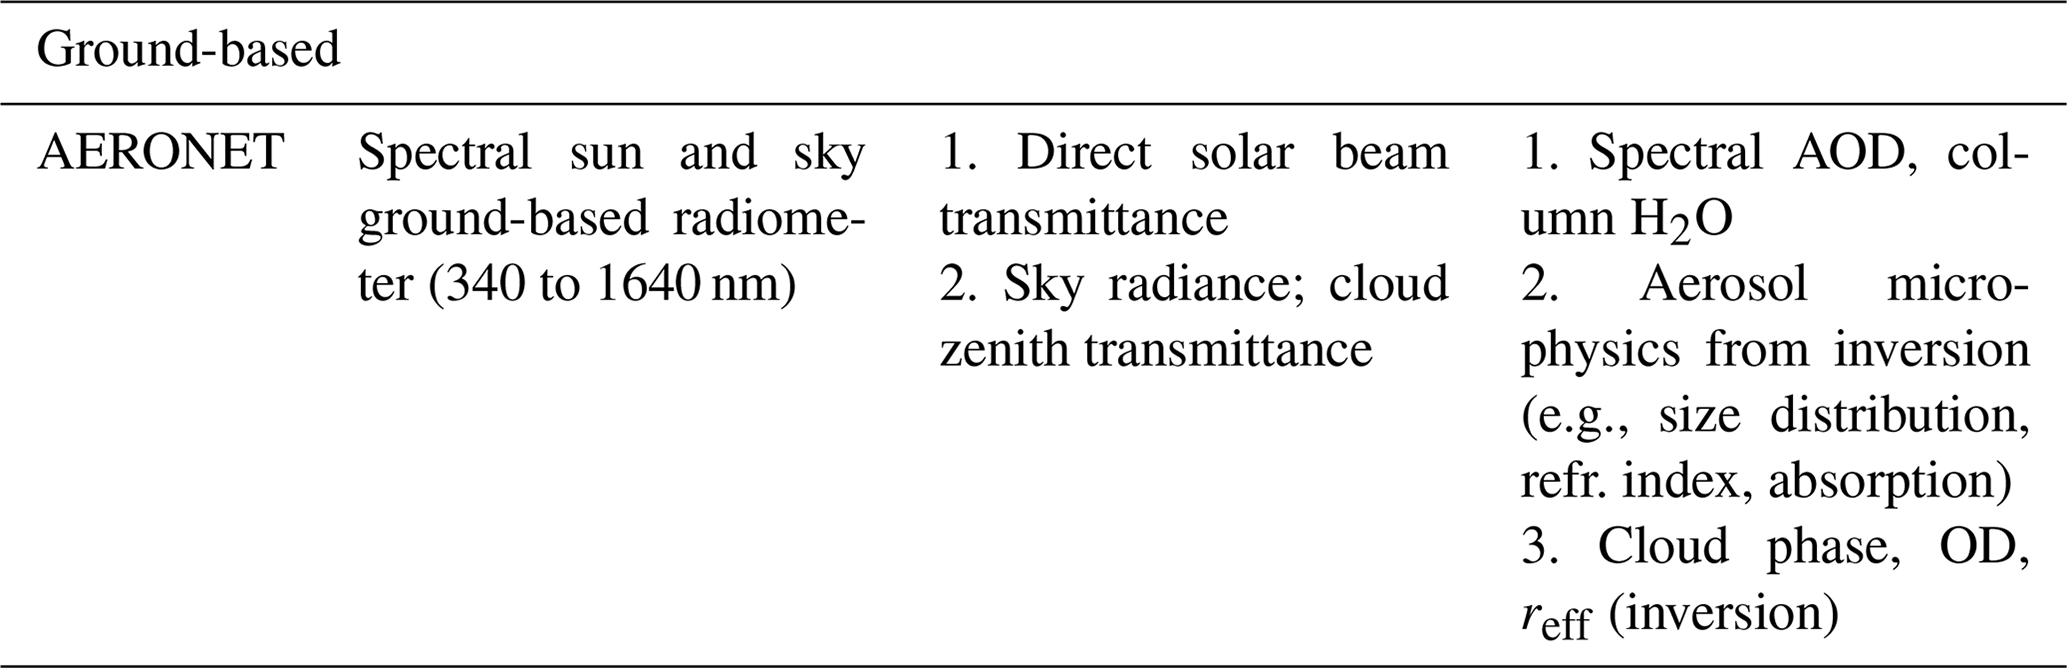
All ORACLES data are accessible via the digital object identifiers (DOIs) provided under ORACLES Science Team (2020a–d) references: https://doi.org/10.5067/Suborbital/ORACLES/P3/2018_V2 (ORACLES Science Team, 2020a), https://doi.org/10.5067/Suborbital/ORACLES/P3/2017_V2 (ORACLES Science Team, 2020b), https://doi.org/10.5067/Suborbital/ORACLES/P3/2016_V2 (ORACLES Science Team, 2020c), and https://doi.org/10.5067/Suborbital/ORACLES/ER2/2016_V2 (ORACLES Science Team, 2020d). The only exceptions are noted as footnotes to Table B2.
JR, RW, and PZ, designed the original ORACLES observational concept and co-led the 5-year investigation. SJD was instrumental in conducting the ORACLES investigation. BL coordinated all project management. JMH and PF led the CLARIFY and AEROCLO-sA field experiments, respectively, and their coordination with ORACLES deployments. SEL, MSD, YS, RU, JMR, AND, AMdS, KML, MSK, CJF, KP, ASA, SEB, AMF, GRC, PES, GAF, SF, BC, BNH, KDK, ST, TSL, AMD, OOS, GMM, MRP, SG, JRO, AN, MK, JPSW, JDSG, KLT, DN, JRP, KSS, PP, HC, SPC, AJS, TJL, ES, MSR, RAF, SPB, CAH, DJD, FCS, SEP, JSM, KGM, and DAS made critical contributions to the field deployments and post-campaign data analyses. SGH made vital contributions to the experimental design and execution. MM and PS led formal modeling analyses in the post-campaign stage. NMK and SJP coordinated the outreach and scientific efforts by Namibian and South African partner institutions. IYC and LG created and visualized results for portions of this paper. HM provided crucial administrative support to enable ORACLES field operations.
Paquita Zuidema, Paola Formenti, and James M. Haywood are guest editors for the ACP Special Issue “New observations and related modeling studies of the aerosol–cloud–climate system in the Southeast Atlantic and southern Africa regions”, to which this paper has been submitted. The remaining authors declare that they have no conflicts of interest.
This article is part of the special issue “New observations and related modeling studies of the aerosol–cloud–climate system in the Southeast Atlantic and southern Africa regions (ACP/AMT inter-journal SI)”. It is not associated with a conference.
ORACLES is a NASA Earth Venture Suborbital-2 investigation managed through the Earth System Science Pathfinder Office. The team is equally grateful for the tireless contributions by the NASA Wallops and NASA Johnson P-3 and NASA Armstrong ER-2 pilots, flight crews, and their management, as well as air traffic control at Walvis Bay airport (Namibia) and the airport in São Tomé. Local authorities in Namibia and São Tomé beyond the ones mentioned in Sect. 3.3.7 and 3.5 played important roles as well, for which the project would like to express their gratitude. Philip Stier acknowledges funding from the UK NERC project CLARIFY (NE/L013479/1) and the European Research Council (ERC) project RECAP under the European Union's Horizon 2020 research and innovation program with grant agreement 724602. Part of this work was performed at the Jet Propulsion Laboratory, California Institute of Technology, under a contract with the National Aeronautics and Space Administration (80NM0018D0004).
The ORACLES project, in spirit and execution, was very much a collaborative effort. It entailed contributions small and large, with many of the smaller and short-term contributions equally crucial to the execution of the project. In Table C1 in Appendix C we list all participants in the ORACLES project that are not co-authors of this paper. The ORACLES leadership, and indeed NASA as a whole, owe sincere gratitude to any and all of the participants listed there.
This research has been supported by NASA through the Earth Venture Suborbital-2 (EVS-2) program (grant no. 13-EVS2-13-0028).
This paper was edited by Frank Eckardt and reviewed by Armin Sorooshian and one anonymous referee.
Ackerman, A. S., Toon, O. B., Stevens, D. E., Heymsfield, A. J., Ramanathan, V., and Welton, E. J.: Reduction of tropical cloudiness by soot, Science, 288, 1042–1047, 2000.
Ackerman, A. S., Kirkpatrick, M. P., Stevens, D. E., and Toon, O. B.: The impact of humidity above stratiform clouds on indirect aerosol climate forcing, Nature, 432, 1014–1017, https://doi.org/10.1038/nature03174, 2004.
Adebiyi, A. and Zuidema, P.: The Role of the Southern African Easterly Jet in Modifying the Southeast Atlantic Aerosol and Cloud Environments, Q. J. Roy. Meteor. Soc., 697, 1574–89, https://doi.org/10.1002/qj.2765, 2016.
Adebiyi, A. A. and Zuidema, P.: Low Cloud Cover Sensitivity to Biomass-Burning Aerosols and Meteorology over the Southeast Atlantic, J. Climate, 31, 4329–4346, 2018.
Adebiyi, A., Zuidema, P., and Abel, S.: The convolution of dynamics and moisture with the presence of shortwave absorbing aerosols over the southeast Atlantic, J. Climate, 28, 1997–2024, https://doi.org/10.1175/JCLI-D-14-00352.1, 2015.
Adebiyi, A. A., Zuidema, P., Chang, I., Burton, S. P., and Cairns, B.: Mid-level clouds are frequent above the southeast Atlantic stratocumulus clouds, Atmos. Chem. Phys., 20, 11025–11043, https://doi.org/10.5194/acp-20-11025-2020, 2020.
Albrecht, B. A.: Aerosols, cloud microphysics, and fractional cloudiness, Science, 245, 1227–1230, 1989.
Andela, N., Morton, D. C., Giglio, L., Chen, Y., van der Werf, G. R., Kasibhatla, P. S., DeFries, R. S., Collatz, G. L., Hantson, S., Kloster, S., Bachelet, D., Forrest, M., Lasslop, G., Li, F., Mangeon, S., Melton, J. R., Yue, C., and Randerson, J. T.: A human-driven decline in global burned area, Science, 356, 1356–1362, 2017.
Annegarn, H. J. and Swap, R. J.: SAFARI 2000: A Southern African Example of Science Diplomacy, Science and Diplomacy, 1, 4, 2012.
Bennartz, R. and Rausch, J.: Global and regional estimates of warm cloud droplet number concentration based on 13 years of AQUA-MODIS observations, Atmos. Chem. Phys., 17, 9815–9836, https://doi.org/10.5194/acp-17-9815-2017, 2017.
Betts, A. K. and Ridgway, W.: Coupling of the Radiative, Convective, and Surface Fluxes over the Equatorial Pacific, J. Atmos. Sci., 45, 522–36, https://doi.org/10.1175/1520-0469(1988)045%3C0522:COTRCA%3E2.0.CO;2, 1988.
Bond, T. C., Doherty, S. J., Fahey, D. W., Forster, P. M. Berntsen, T., DeAngelo, B. J., Flanner, M. G., Ghan, S., Kärcher, B., Koch, D., Kinne, S., Kondo, Y., Quinn, P. K., Sarofim, M. C., Schultz, M. G., Schulz, M., Venkataraman, C., Zhang, H., Zhang S., Bellouin, N., Guttikunda, S. K., Hopke, P. K., Jacobson, M. Z., Kaiser, J. W., Klimont, Z., Lohmann, U., Schwarz, J. P., Shindell, D., Storelvmo, T., Warren, S. G., and Zender, C. S.: Bounding the role of black carbon in the climate system: A scientific assessment, J. Geophys. Res.-Atmos., 118, 5380–5552, https://doi.org/10.1002/jgrd.50171, 2013.
Bony, S. and Dufresne, J. L.: Marine boundary layer clouds at the heart of tropical cloud feedback uncertainties in climate models, Geophys. Res. Lett., 32, L20806, https://doi.org/10.1029/2005GL023851, 2005.
Burton, S., Hostetler, C., Cook, A., Hair, J., Seaman, S., Scola, S., Harper, D., Smith, J., Fenn, M., Ferrare, R., Saide, P. E., Chemyakin, E. V., and Müller, D.: Calibration of a high spectral resolution lidar using a Michelson interferometer, with data examples from ORACLES, Appl. Optics, 57, 6061, https://doi.org/10.1364/AO.57.006061, 2018.
Chand, D., Wood, R., Anderson, T., Satheesh, S. K., and Charlson, R. J.: Satellite-derived direct radiative effect of aerosols dependent on cloud cover, Nat. Geosci., 2, 181–184, 2009.
Chatfield, R. B., Guo, Z., Sachse, G. W., Blake, D. R., and Blake, N. J.: The subtropical global plume in the Pacific Exploratory Mission-Tropics A (PEM-Tropics A), PEM-Tropics B, and the Global Atmospheric Sampling Program (GASP): How tropical emissions affect the remote Pacific, J. Geophys. Res., 107, 4278, https://doi.org/10.1029/2001JD000497, 2002.
Coakley, J. and Chylek, P.: The two-stream approximation in radiative transfer including the angle of the incident radiation, J. Atmos. Sci., 32, 409–418, 1975.
Cochrane, S. P., Schmidt, K. S., Chen, H., Pilewskie, P., Kittelman, S., Redemann, J., LeBlanc, S., Pistone, K., Kacenelenbogen, M., Segal Rozenhaimer, M., Shinozuka, Y., Flynn, C., Platnick, S., Meyer, K., Ferrare, R., Burton, S., Hostetler, C., Howell, S., Freitag, S., Dobracki, A., and Doherty, S.: Above-cloud aerosol radiative effects based on ORACLES 2016 and ORACLES 2017 aircraft experiments, Atmos. Meas. Tech., 12, 6505–6528, https://doi.org/10.5194/amt-12-6505-2019, 2019.
Coddington, O. M., Pilewskie, P., Redemann, J., Platnick, S., Russell, S. P. B., Schmidt, K. S., Gore, W. J., Livingston, J., Wind, G., and Vukicevic, T.: Examining the impact of overlying aerosols on the retrieval of cloud optical properties from passive remote sensing, J. Geophys. Res., 115, D10211, https://doi.org/10.1029/2009JD012829, 2010.
Costantino, L. and Bréon, F.-M.: Satellite-based estimate of aerosol direct radiative effect over the South-East Atlantic, Atmos. Chem. Phys. Discuss., 13, 23295–23324, https://doi.org/10.5194/acpd-13-23295-2013, 2013.
Das, S., Harshvardhan, H., Bian, H., Chin, M., Curci, G., Protonotariou, A. P. T., Mielonen, K., Zhang, H., Wang, H., and Liu, X.: Biomass burning aerosol transport and vertical distribution over the South African-Atlantic region, J. Geophys. Res.-Atmos., 122, 6391–6415, https://doi.org/10.1002/2016JD026421, 2017.
Davies, N. W., Fox, C., Szpek, K., Cotterell, M. I., Taylor, J. W., Allan, J. D., Williams, P. I., Trembath, J., Haywood, J. M., and Langridge, J. M.: Evaluating biases in filter-based aerosol absorption measurements using photoacoustic spectroscopy, Atmos. Meas. Tech., 12, 3417–3434, https://doi.org/10.5194/amt-12-3417-2019, 2019.
Deaconu, L. T., Waquet, F., Josset, D., Ferlay, N., Peers, F., Thieuleux, F., Ducos, F., Pascal, N., Tanré, D., Pelon, J., and Goloub, P.: Consistency of aerosols above clouds characterization from A-Train active and passive measurements, Atmos. Meas. Tech., 10, 3499–3523, https://doi.org/10.5194/amt-10-3499-2017, 2017.
Deaconu, L. T., Ferlay, N., Waquet, F., Peers, F., Thieuleux, F., and Goloub, P.: Satellite inference of water vapour and above-cloud aerosol combined effect on radiative budget and cloud-top processes in the southeastern Atlantic Ocean, Atmos. Chem. Phys., 19, 11613–11634, https://doi.org/10.5194/acp-19-11613-2019, 2019.
De Graaf, M., Bellouin, N., Tilstra, L. G., Haywood, J., and Stammes, P.: Aerosol direct radiative effect of smoke over clouds over the southeast Atlantic Ocean from 2006 to 2009, Geophys. Res. Lett., 41, 7723–7730, https://doi.org/10.1002/2014GL061103, 2014.
Diamond, M. S., Dobracki, A., Freitag, S., Small Griswold, J. D., Heikkila, A., Howell, S. G., Kacarab, M. E., Podolske, J. R., Saide, P. E., and Wood, R.: Time-dependent entrainment of smoke presents an observational challenge for assessing aerosol–cloud interactions over the southeast Atlantic Ocean, Atmos. Chem. Phys., 18, 14623–14636, https://doi.org/10.5194/acp-18-14623-2018, 2018.
Doherty, S. J., Saide, P., Zuidema, P., Shinozuka, Y., Ferrada, G., Mallet, M., Meyer, K., Painemal, D., Howell, S. G., Freitag, S., Smirnow, N.,Dobracki, A., Podolske, J., Ferrare, R., Burton, S., Nabat, P., Wood, R., and Redemann, J.: Modeled and observed vertically-resolved aerosol and cloud properties related to the direct aerosol radiative effect in the Southeast Atlantic, in preparation, 2021.
Dubovik, O. and King, M. D.: A flexible inversion algorithm for retrieval of aerosol optical properties from sun and sky radiance measurements, J. Geophys. Res., 105, 20673–20696, 2000.
Dzambo, A. M., L'Ecuyer, T., Sy, O. O., and Tanelli, S.: The Observed Structure and Precipitation Characteristics of Southeast Atlantic Stratocumulus from Airborne Radar During ORACLES 2016-17, J. Appl. Meteorol. Clim., 58, 2197–2215, https://doi.org/10.1175/jamc-d-19-0032.1, 2019.
Dzambo, A. M., L'Ecuyer, T., Sinclair, K., van Diedenhoven, B., Gupta, S., McFarquhar, G., O'Brien, J. R., Cairns, B., Wasilewski, A. P., and Alexandrov, M.: Joint Cloud Water Path and Rain Water Path Retrievals from ORACLES Observations, Atmos. Chem. Phys. Discuss., https://doi.org/10.5194/acp-2020-849, in review, 2020.
Eastman, R. and Wood, R. K. T. O: The subtropical stratocumulus-topped planetary boundary layer: A climatology and the Lagrangian evolution, J. Atmos. Sci., 74, 2633–2656, https://doi.org/10.1175/JAS-D-16-0336.1, 2017.
Eck, T. F., Holben, B. N., Reid, J. S., Mukelabai, M. M., Piketh, S. J., Torres, O., Jethva, H. T., Hyer, E. J., Ward, D. E., Dubovik, O., Sinyuk, A., Schafer, J. S., Giles, D. M., Sorokin, M., Smirnov, A., and Slutsker, I.: A seasonal trend of single scattering albedo in southern African biomass-burning particles: Implications for satellite products and estimates of emissions for the world's largest biomass-burning source, J. Geophys. Res. Atmos., 118, 6414–6432, https://doi.org/10.1002/jgrd.50500, 2013.
ECMWF: Describing ECMWF's forecasts and forecasting system, Newsletter Feature Article, ECMWF, availabel at: https://www.ecmwf.int/sites/default/files/elibrary/2012/17412-describing-ecmwfs-forecasts-and-forecasting-system.pdf (last access: December 2013), 2012.
Fishman, J., Hoell, J. M., Bendura, R. D., McNeal, R. J., and Kirchhoff, V. W. J. H.: NASA GTE TRACE-A Experiment (September–October 1992), Overview, J. Geophys. Res., 101, 23865–23880, 1996.
Formenti, P., D'Anna, B., Flamant, C., Mallet, M., Piketh, S. J., Schepanski, K., Waquet, F., Auriol, F., Brogniez, G., Burnet, F., Chaboureau, J., Chauvigné, A., Chazette, P., Denjean, C., Desboeufs, K., Doussin, J., Elguindi, N., Feuerstein, S., Gaetani, M., Giorio, C., Klopper, D., Mallet, M. D., Nabat, P., Monod, A., Solmon, F., Namwoonde, A., Chikwililwa, C., Mushi, R., Welton, E. J., and Holben, B.: The Aerosols, Radiation and Clouds in Southern Africa Field Campaign in Namibia: Overview, illustrative observations, and way forward, B. Am. Meteor. Soc., 100, 1277–1298, https://doi.org/10.1175/BAMS-D-17-0278.1, 2019.
Grell, G. A., Peckham, S. E., Schmitz, R., McKeen, S. A., Frost, G., Skamarock, W. C., and Eder, B.: Fully coupled “online” chemistry within the WRF model, Atmos. Environ., 39, 6957–6975, https://doi.org/10.1016/j.atmosenv.2005.04.027, 2005.
Gupta, S., McFarquhar, G. M., O'Brien, J. R., Delene, D. J., Poellot, M. R., Dobracki, A., Podolske, J. R., Redemann, J., LeBlanc, S. E., Segal-Rozenhaimer, M., and Pistone, K.: Impact of the Variability in Vertical Separation between Biomass-Burning Aerosols and Marine Stratocumulus on Cloud Microphysical Properties over the Southeast Atlantic, Atmos. Chem. Phys. Discuss. [preprint], https://doi.org/10.5194/acp-2020-1039, in review, 2020.
Haynes, J. M., L'Ecuyer, T. S., Stephens, G. L., Miller, S. D., Mitrescu, C., Wood, N. B., and Tanelli, S.: Rainfall retrieval over the ocean with spaceborne W‐band radar, J. Geophys. Res., 114, D00A22, https://doi.org/10.1029/2008JD009973, 2009.
Haywood, J., Francis, P., Dubovik, O., Glew, M., and Holben, B.: Comparison of aerosol size distributions, radiative properties, and optical depths determined by aircraft observations and Sun photometers during SAFARI 2000, J. Geophys. Res., 108, 8471, https://doi.org/10.1029/2002JD002250, 2003.
Haywood, J. M., Osborne, S. R., and Abel, S. J.: The effect of overlying absorbing aerosol layers on remote sensing retrievals of cloud effective radius and cloud optical depth, Q. J. Roy. Meteor. Soc., 130, 779–800, 2004.
Haywood, J. M., Abel, S. J., Barrett, P. A., Bellouin, N., Blyth, A., Bower, K. N., Brooks, M., Carslaw, K., Che, H., Coe, H., Cotterell, M. I., Crawford, I., Cui, Z., Davies, N., Dingley, B., Field, P., Formenti, P., Gordon, H., de Graaf, M., Herbert, R., Johnson, B., Jones, A. C., Langridge, J. M., Malavelle, F., Partridge, D. G., Peers, F., Redemann, J., Stier, P., Szpek, K., Taylor, J. W., Watson-Parris, D., Wood, R., Wu, H., and Zuidema, P.: Overview: The CLoud-Aerosol-Radiation Interaction and Forcing: Year-2017 (CLARIFY-2017) measurement campaign, Atmos. Chem. Phys. Discuss., https://doi.org/10.5194/acp-2020-729, in review, 2020.
Herman, J., Cede, A., Spinei, E., Mount, G., Tzortziou, M., and Abuhassan, N.: NO2 column amounts from ground-based Pandora and MFDOAS spectrometers using the direct-sun DOAS technique: Intercomparisons and application to OMIvalidation, J. Geophys. Res., 114, D13307, https://doi.org/10.1029/2009JD011848, 2009.
Herman, J., Evans, R., Cede, A., Abuhassan, N., Petropavlovskikh, I., and McConville, G.: Comparison of ozone retrievals from the Pandora spectrometer system and Dobson spectrophotometer in Boulder, Colorado, Atmos. Meas. Tech., 8, 3407–3418, https://doi.org/10.5194/amt-8-3407-2015, 2015.
Holben, B. N., Eck, T. F., Slutsker, I., Tanre, D., Buis, J. P., Setzer, A., Vermote, E., Reagan, J. A., Kaufman, Y., Nakajima, T., Lavenu, F., Jankowiak, I., and Smirnov, A.: AERONET – A federated instrument network and data archive for aerosol characterization, Remote Sens. Environ., 66, 1–16, 1998.
Holben, B. N., Kim, J., Sano, I., Mukai, S., Eck, T. F., Giles, D. M., Schafer, J. S., Sinyuk, A., Slutsker, I., Smirnov, A., Sorokin, M., Anderson, B. E., Che, H., Choi, M., Crawford, J. H., Ferrare, R. A., Garay, M. J., Jeong, U., Kim, M., Kim, W., Knox, N., Li, Z., Lim, H. S., Liu, Y., Maring, H., Nakata, M., Pickering, K. E., Piketh, S., Redemann, J., Reid, J. S., Salinas, S., Seo, S., Tan, F., Tripathi, S. N., Toon, O. B., and Xiao, Q.: An overview of mesoscale aerosol processes, comparisons, and validation studies from DRAGON networks, Atmos. Chem. Phys., 18, 655–671, https://doi.org/10.5194/acp-18-655-2018, 2018.
Huffman, G. J., Adler, R. F., Bolvin, D. T., Gu, G., Nelkin, E. J., Bowman, K. P., Hong, Y., Stocker, E. F., Wolff, D. B.: The TRMM Multi-satellite Precipitation Analysis: Quasi-Global, Multi-Year, Combined-Sensor Precipitation Estimates at Fine Scale, J.Hydrometeor., 8, 38–55, 2007.
IPCC: Climate Change 2013: The Physical Science Basis. Contribution of Working Group I to the Fifth Assessment Report of the Intergovernmental Panel on Climate Change, edited by: Stocker, T. F., Qin, D., Plattner, G.-K., Tignor, M., Allen, S. K., Boschung, J., Nauels, A., Xia, Y., Bex, V. and Midgley, P. M., Cambridge University Press, Cambridge, UK and New York, USA, 2013.
Jethva, H., Torres, O., Waquet, F., Chand, D., and Hu, Y.: How do A-train sensors intercompare in the retrieval of above-cloud aerosol optical depth? A case study-based assessment, Geophys. Res. Lett., 41, 186–192, https://doi.org/10.1002/2013GL058405, 2014.
Jethva, H., Torres, O., Remer, L., Redemann, J., Livingston, J., Dunagan, S., Shinozuka, Y., Kacenelenbogen, M., Rosenheimer, M. S., and Spurr, R.: Validating MODIS above-cloud aerosol optical depth retrieved from “color ratio” algorithm using direct measurements made by NASA's airborne AATS and 4STAR sensors, Atmos. Meas. Tech., 9, 5053–5062, https://doi.org/10.5194/amt-9-5053-2016, 2016.
Jethva, H., Torres, O., and Ahn, C.: A 12-year long global record of optical depth of absorbing aerosols above the clouds derived from the OMI/OMACA algorithm, Atmos. Meas. Tech., 11, 5837–5864, https://doi.org/10.5194/amt-11-5837-2018, 2018.
Kacarab, M., Thornhill, K. L., Dobracki, A., Howell, S. G., O'Brien, J. R., Freitag, S., Poellot, M. R., Wood, R., Zuidema, P., Redemann, J., and Nenes, A.: Biomass burning aerosol as a modulator of the droplet number in the southeast Atlantic region, Atmos. Chem. Phys., 20, 3029–3040, https://doi.org/10.5194/acp-20-3029-2020, 2020.
Kacenelenbogen, M. S., Vaughan, M. A., Redemann, J., Young, S. A., Liu, Z., Hu, Y., Omar, A. H., LeBlanc, S., Shinozuka, Y., Livingston, J., Zhang, Q., and Powell, K. A.: Estimations of global shortwave direct aerosol radiative effects above opaque water clouds using a combination of A-Train satellite sensors, Atmos. Chem. Phys., 19, 4933–4962, https://doi.org/10.5194/acp-19-4933-2019, 2019.
Katich, J. M., Samset, B. H., Bui, T. P., Dollner, M., Froyd, K. D., Campuzano-Jost, P., Nault, B. A., Schroder, J. C., Weinzierl, B., and Schwarz, J. P.: Strong contrast in remote black carbon aerosol loadings between the Atlantic and Pacific basins, J. Geophys. Res.-Atmos.,123, 13386–13395, https://doi.org/10.1029/2018JD029206, 2018.
Keil, A. and Haywood, J. M.: Solar radiative forcing by BB aerosol particles during SAFARI 2000: A case study based on measured aerosol and cloud properties, J. Geophys. Res., 108, 8467, https://doi.org/10.1029/2002JD002315, 2003.
Knobelspiesse, K., Cairns, B., Jethva, H., Kacenelenbogen, M., Segal-Rosenheimer, M., and Torres, O.: Remote sensing of above cloud aerosols, in: Light Scattering Reviews 9, edited by: Kokhanovsky, A., Springer Praxis Books, Springer, Berlin, Heidelberg, https://doi.org/10.1007/978-3-642-37985-7_5, 2015.
Koch, D. and Del Genio, A. D.: Black carbon semi-direct effects on cloud cover: review and synthesis, Atmos. Chem. Phys., 10, 7685–7696, https://doi.org/10.5194/acp-10-7685-2010, 2010.
Koffi, B., Schulz, M., Bréon, F., Griesfeller, J., Winker, D., Balkanski, Y., Bauer, S., Berntsen, T., Chin, M., Collins, W. D., Dentener, F., Diehl, T., Easter, R., Ghan, S., Ginoux, P., Gong, S., Horowitz, L. W., Iversen, T., Kirkevåg, A., Koch, D., Krol, M., Myhre, G., Stier, P., and Takemura, T.: Application of the CALIOP layer product to evaluate the vertical distribution of aerosols estimated by global models: AeroCom phase I results, J. Geophys. Res., 117, D10201, https://doi.org/10.1029/2011JD016858, 2012.
LeBlanc, S.: Moving Lines: NASA airborne research flight planning tool release (Version v1.21), Zenodo, https://doi.org/10.5281/zenodo.1478126, 2018.
LeBlanc, S. E., Redemann, J., Flynn, C., Pistone, K., Kacenelenbogen, M., Segal-Rosenheimer, M., Shinozuka, Y., Dunagan, S., Dahlgren, R. P., Meyer, K., Podolske, J., Howell, S. G., Freitag, S., Small-Griswold, J., Holben, B., Diamond, M., Wood, R., Formenti, P., Piketh, S., Maggs-Kölling, G., Gerber, M., and Namwoonde, A.: Above-cloud aerosol optical depth from airborne observations in the southeast Atlantic, Atmos. Chem. Phys., 20, 1565–1590, https://doi.org/10.5194/acp-20-1565-2020, 2020.
Ma, P.-L., Rasch, P. J., Fast, J. D., Easter, R. C., Gustafson Jr., W. I., Liu, X., Ghan, S. J., and Singh, B.: Assessing the CAM5 physics suite in the WRF-Chem model: implementation, resolution sensitivity, and a first evaluation for a regional case study, Geosci. Model Dev., 7, 755–778, https://doi.org/10.5194/gmd-7-755-2014, 2014.
Mallet, M., Nabat, P., Zuidema, P., Redemann, J., Sayer, A. M., Stengel, M., Schmidt, S., Cochrane, S., Burton, S., Ferrare, R., Meyer, K., Saide, P., Jethva, H., Torres, O., Wood, R., Saint Martin, D., Roehrig, R., Hsu, C., and Formenti, P.: Simulation of the transport, vertical distribution, optical properties and radiative impact of smoke aerosols with the ALADIN regional climate model during the ORACLES-2016 and LASIC experiments, Atmos. Chem. Phys., 19, 4963–4990, https://doi.org/10.5194/acp-19-4963-2019, 2019.
Mallet, M., Solmon, F., Nabat, P., Elguindi, N., Waquet, F., Bouniol, D., Sayer, A. M., Meyer, K., Roehrig, R., Michou, M., Zuidema, P., Flamant, C., Redemann, J., and Formenti, P.: Direct and semi-direct radiative forcing of biomass-burning aerosols over the southeast Atlantic (SEA) and its sensitivity to absorbing properties: a regional climate modeling study, Atmos. Chem. Phys., 20, 13191–13216, https://doi.org/10.5194/acp-20-13191-2020, 2020.
Martin, G. M., Johnson, D. W., and Spice, A.: The measurement and parameterization of effective radius of droplets in warm stratiform clouds, J. Atmos. Sci., 51, 1823–1842, 1994.
Mauger, G. and Norris, J.: Meteorological bias in satellite estimates of aerosol-cloud relationships, Geophys. Res. Lett., 34, https://doi.org/10.1029/2007GL029952, 2007.
Meyer, K., Platnick, S., Oreopoulos, L., and Lee, D.: Estimating the direct radiative effect of absorbing aerosols overlying marine boundary layer clouds in the southeast Atlantic using MODIS and CALIOP, J. Geophys. Res.-Atmos., 118, 4801–4815, https://doi.org/10.1002/jgrd.50449, 2013.
Meyer, K., Platnick, S., and Zhang, Z.: Simultaneously inferring above-cloud absorbing aerosol optical thickness and underlying liquid phase cloud optical and microphysical properties using MODIS, J. Geophys. Res.-Atmos., 120, 2015JD023128, https://doi.org/10.1002/2015JD023128, 2015.
Miles, N. L., Verlinde, J., and Clothiaux, E. E.: Cloud droplet size distributions in low-level stratiform clouds, J. Atmos. Sci., 57, 295–311, 2000.
Miller, D. J., Segal-Rozenhaimer, M., Knobelspiesse, K., Redemann, J., Cairns, B., Alexandrov, M., van Diedenhoven, B., and Wasilewski, A.: Low-level liquid cloud properties during ORACLES retrieved using airborne polarimetric measurements and a neural network algorithm, Atmos. Meas. Tech., 13, 3447–3470, https://doi.org/10.5194/amt-13-3447-2020, 2020.
Minnis, P., Nguyen, L., Palikonda, R., Heck, P. W., Spangenberg, D. A., Doelling, D. R., Ayers, J. K., Smith Jr., W. L., Khaiyer, M. M., Trepte, Q. Z., Avey, L. A., Chang, F.-L., Yost, C. R., Chee, T. L., and Sun-Mack, S.: Near-real time cloud retrievals from operational and research meteorological satellites, Proceedings of the SPIE Europe Remote Sens., Cardiff, UK, 15–18 September 2008, 7107-2, 2008.
Minnis, P., Sun-Mack, S., Chen, Y., Chang, F.-L., Yost, C. R., Smith Jr., W. L., Heck, P. W., Arduini, R. F., Bedka, S. T., Yi, Y., Hong, G., Jin, Z., Painemal, D., Palikonda, R., Scarino, B., Spangenberg, D. A., Smith, R. A., Trepte, Q. Z., Yang, P., and Xie, Y.: CERES MODIS cloud product retrievals for Edition 4, Part I: Algorithm changes, IEEE Trans. Geosci. Remote Sens., https://doi.org/10.1109/TGRS.2020.3008866, 2020.
Molod, A., Takacs, L., Suarez, M., Bacmeister, J., Song, I.-S., and Eichmann, A.: The GEOS-5 Atmospheric General Circulation Model: Mean Climate and Development from MERRA to Fortuna, Technical Report Series on Global Modeling and Data Assimilation, NASA, Washington, D.C., USA, 28, 124 pp., 2012.
Myhre, G., Samset, B. H., Schulz, M., Balkanski, Y., Bauer, S., Berntsen, T. K., Bian, H., Bellouin, N., Chin, M., Diehl, T., Easter, R. C., Feichter, J., Ghan, S. J., Hauglustaine, D., Iversen, T., Kinne, S., Kirkevåg, A., Lamarque, J.-F., Lin, G., Liu, X., Lund, M. T., Luo, G., Ma, X., van Noije, T., Penner, J. E., Rasch, P. J., Ruiz, A., Seland, Ø., Skeie, R. B., Stier, P., Takemura, T., Tsigaridis, K., Wang, P., Wang, Z., Xu, L., Yu, H., Yu, F., Yoon, J.-H., Zhang, K., Zhang, H., and Zhou, C.: Radiative forcing of the direct aerosol effect from AeroCom Phase II simulations, Atmos. Chem. Phys., 13, 1853–1877, https://doi.org/10.5194/acp-13-1853-2013, 2013.
National Academies of Sciences, Engineering, and Medicine: Thriving on Our Changing Planet: A Decadal Strategy for Earth Observation from Space, The National Academies Press, Washington, DC, USA, https://doi.org/10.17226/24938, 2018.
Nicholls, S. and Leighton, J.: An observational study of the structure of stratiform cloud sheets, Part I: Structure, Q. J. Roy. Meteor. Soc., 112, 431–460, 1986.
ORACLES Science Team: Suite of Aerosol, Cloud, and Related Data Acquired Aboard P3 During ORACLES 2018, Version 2, NASA Ames Earth Science Project Office, https://doi.org/10.5067/Suborbital/ORACLES/P3/2018_V2, 2020a.
ORACLES Science Team: Suite of Aerosol, Cloud, and Related Data Acquired Aboard P3 During ORACLES 2017, Version 2, NASA Ames Earth Science Project Office, https://doi.org/10.5067/Suborbital/ORACLES/P3/2017_V2, 2020b.
ORACLES Science Team: Suite of Aerosol, Cloud, and Related Data Acquired Aboard P3 During ORACLES 2016, Version 2, NASA Ames Earth Science Project Office, https://doi.org/10.5067/Suborbital/ORACLES/P3/2016_V2, 2020c.
ORACLES Science Team: Suite of Aerosol, Cloud, and Related Data Acquired Aboard ER2 During ORACLES 2016, Version 2, NASA Ames Earth Science Project Office, https://doi.org/10.5067/Suborbital/ORACLES/ER2/2016_V2, 2020d.
Painemal, D. and Zuidema, P.: Microphysical variability in southeast Pacific Stratocumulus clouds: synoptic conditions and radiative response, Atmos. Chem. Phys., 10, 6255–6269, https://doi.org/10.5194/acp-10-6255-2010, 2010.
Painemal, D. and Zuidema, P.: Assessment of MODIS cloud effective radius and optical thickness retrievals over the Southeast Pacific with VOCALS-REx in situ measurements, J. Geophys. Res., 116, D24206, https://doi.org/10.1029/2011JD016155, 2011.
Pappenberger, F., Scipal, K., and Buizza, R.: Hydrological aspects of meteorological verification, Atmospheric Sci. Lett., 9, 43–52, 2008.
Peers, F., Francis, P., Fox, C., Abel, S. J., Szpek, K., Cotterell, M. I., Davies, N. W., Langridge, J. M., Meyer, K. G., Platnick, S. E., and Haywood, J. M.: Observation of absorbing aerosols above clouds over the south-east Atlantic Ocean from the geostationary satellite SEVIRI – Part 1: Method description and sensitivity, Atmos. Chem. Phys., 19, 9595–9611, https://doi.org/10.5194/acp-19-9595-2019, 2019.
Pistone, K., Redemann, J., Doherty, S., Zuidema, P., Burton, S., Cairns, B., Cochrane, S., Ferrare, R., Flynn, C., Freitag, S., Howell, S. G., Kacenelenbogen, M., LeBlanc, S., Liu, X., Schmidt, K. S., Sedlacek III, A. J., Segal-Rozenhaimer, M., Shinozuka, Y., Stamnes, S., van Diedenhoven, B., Van Harten, G., and Xu, F.: Intercomparison of biomass burning aerosol optical properties from in situ and remote-sensing instruments in ORACLES-2016, Atmos. Chem. Phys., 19, 9181–9208, https://doi.org/10.5194/acp-19-9181-2019, 2019.
Rajapakshe, C., Zhang, Z., Yorks, J. E., Yu, H., Tan, Q., Meyer, K., Platnick, S., and Winker, D. M.: Seasonally transported aerosol layers over southeast Atlantic are closer to underlying clouds than previously reported, Geophys. Res. Lett., 44, 5818–5825, https://doi.org/10.1002/2017GL073559, 2017.
Ran, Q., Fu, W., Liu, Y., Li, T. Shi, K., and Sivakumar, B.: Evaluation of Quantitative Precipitation Predictions by ECMWF, CMA, and UKMO for Flood Forecasting: Application to Two Basins in China, Nat. Hazards Rev., 19, 05018003, https://doi.org/10.1061/(ASCE)NH.1527-6996.0000282, 2018.
Rouault, M.: Bi-annual intrusion of tropical water in the northern Benguela upwelling, Geophys. Res. Lett., 39, L12606, https://doi.org/10.1029/GL052099, 2012.
Saide, P. E., Thompson, G., Eidhammer, T., da Silva, A. M., Pierce, R. B., and Carmichael, G. R.: Assessment of biomass burning smoke influence on environmental conditions for multi-year tornado outbreaks by combining aerosol-aware microphysics and fire emission constraints, J. Geophys. Res.-Atmos., 121, 10294–10311, https://doi.org/10.1002/2016JD025056, 2016.
Sakaeda, N., Wood, R., and Rasch, P. J.: Direct and semidirect aerosol effects of southern African biomass burning aerosol, J. Geophys. Res.-Atmos., 116, D12205, https://doi.org/10.1029/2010JD015540, 2011.
Sayer, A. M., Hsu, N. C., Bettenhausen, C., Lee, J., Redemann, J., Schmid, B., and Shinozuka, Y.: Extending “Deep Blue” aerosol retrieval coverage to cases of absorbing aerosols above clouds: Sensitivity analysis and first case studies, J. Geophys. Res.-Atmos., 121, 4830–4854, 2016.
Sayer, A. M., Hsu, N. C., Lee, J., Kim, W. V., Burton, S., Fenn, M. A., Ferrare, R. A., Kacenelenbogen, M., LeBlanc, S., Pistone, K., Redemann, J., Segal-Rozenhaimer, M., Shinozuka, Y., and Tsay, S.-C.: Two decades observing smoke above clouds in the south-eastern Atlantic Ocean: Deep Blue algorithm updates and validation with ORACLES field campaign data, Atmos. Meas. Tech., 12, 3595–3627, https://doi.org/10.5194/amt-12-3595-2019, 2019.
Schulz, M., Textor, C., Kinne, S., Balkanski, Y., Bauer, S., Berntsen, T., Berglen, T., Boucher, O., Dentener, F., Guibert, S., Isaksen, I. S. A., Iversen, T., Koch, D., Kirkevåg, A., Liu, X., Montanaro, V., Myhre, G., Penner, J. E., Pitari, G., Reddy, S., Seland, Ø., Stier, P., and Takemura, T.: Radiative forcing by aerosols as derived from the AeroCom present-day and pre-industrial simulations, Atmos. Chem. Phys., 6, 5225–5246, https://doi.org/10.5194/acp-6-5225-2006, 2006.
Segal-Rozenhaimer, M., Miller, D., Knobelspiesse, K., Redemann, J., Cairns, B., and Alexandrov, M.: Development of neural network retrievals of liquid cloud properties from multi-angle polarimetric observations, J. Quant. Spectrosc. Ra., 220, 39–51, 2018.
Shinozuka, Y. and Redemann, J.: Horizontal variability of aerosol optical depth observed during the ARCTAS airborne experiment, Atmos. Chem. Phys., 11, 8489–8495, https://doi.org/10.5194/acp-11-8489-2011, 2011.
Shinozuka, Y., Saide, P. E., Ferrada, G. A., Burton, S. P., Ferrare, R., Doherty, S. J., Gordon, H., Longo, K., Mallet, M., Feng, Y., Wang, Q., Cheng, Y., Dobracki, A., Freitag, S., Howell, S. G., LeBlanc, S., Flynn, C., Segal-Rosenhaimer, M., Pistone, K., Podolske, J. R., Stith, E. J., Bennett, J. R., Carmichael, G. R., da Silva, A., Govindaraju, R., Leung, R., Zhang, Y., Pfister, L., Ryoo, J.-M., Redemann, J., Wood, R., and Zuidema, P.: Modeling the smoky troposphere of the southeast Atlantic: a comparison to ORACLES airborne observations from September of 2016, Atmos. Chem. Phys., 20, 11491–11526, https://doi.org/10.5194/acp-20-11491-2020, 2020.
Simpson, J. and Wiggert, V.: Models of precipitating cumulus towers, Mon. Weather Rev., 97, 471–489, 1969.
Skamarock, W. C., Klemp, J., Dudhia, J., Gill, D. O., Barker, D., Wang, W., and Powers, J. G.: A Description of the Advanced Research, WRF, Version 3.27.3-27, NCAR Technical Notes, NCAR/TN-4751STR, available at: https://opensky.ucar.edu/islandora/object/technotes:500/datastream/PDF/view (last access: December 2020), 2008.
Sorooshian, A., Feingold, G., Lebsock, M. D., Jiang, H., and Stephens, G. L.: On the Precipitation Susceptibility of Clouds to Aerosol Perturbations, Geophys. Res. Lett., 36, 13, https://doi.org/10.1029/2009GL038993, 2009.
Stier, P., Schutgens, N. A. J., Bellouin, N., Bian, H., Boucher, O., Chin, M., Ghan, S., Huneeus, N., Kinne, S., Lin, G., Ma, X., Myhre, G., Penner, J. E., Randles, C. A., Samset, B., Schulz, M., Takemura, T., Yu, F., Yu, H., and Zhou, C.: Host model uncertainties in aerosol radiative forcing estimates: results from the AeroCom Prescribed intercomparison study, Atmos. Chem. Phys., 13, 3245–3270, https://doi.org/10.5194/acp-13-3245-2013, 2013.
Swap, R. J., Annegarn, H. J., Suttles, J. T., King, M. D., Platnick, S., Privette, J. L., and Scholes, R. J.: Africa burning: A thematic analysis of the Southern African Regional Science Initiative (SAFARI 2000), J. Geophys. Res., 108, 8465, https://doi.org/10.1029/2003JD003747, 2003.
Szczodrak, M., Austin, P. H., and Krummel, P. B.: Variability of Optical Depth and Effective Radius in Marine Stratocumulus Clouds, J. Atmos. Sci., 58, 2912–2926, https://doi.org/10.1175/1520-0469(2001)058<2912:VOODAE>2.0.CO;2, 2001.
Twomey, S.: Pollution and the planetary albedo, Atmos. Environ., 8, 1251–1256, 1974.
Tzortziou, M., Herman, J. R., Cede, A., and Abuhassan, N.: High precision, absolute total column ozone measurements from the Pandora spectrometer system: Comparisons with data from a Brewer double monochromator and AuraOMI, J. Geophys. Res., 117, D16303, https://doi.org/10.1029/2012JD017814, 2012.
van der Werf, G. R., Randerson, J. T., Giglio, L., Collatz, G. J., Mu, M., Kasibhatla, P. S., Morton, D. C., DeFries, R. S., Jin, Y., and van Leeuwen, T. T.: Global fire emissions and the contribution of deforestation, savanna, forest, agricultural, and peat fires (1997–2009), Atmos. Chem. Phys., 10, 11707–11735, https://doi.org/10.5194/acp-10-11707-2010, 2010.
Watson-Parris, D., Schutgens, N., Winker, D., Burton, S., Ferrare, R., Stier, P.: On the Limits of CALIOP for Constraining Modeled Free Tropospheric Aerosol, Geophys. Res. Lett., 45, 9260–9266, 2018.
Werdell, P. J., Behrenfeld, M. J., Bontempi, P. S., Boss, E., Cairns, B., Davis, G. T., Franz, B. A., Gliese, U. B., Gorman, E. T., Hasekamp, O., Knobelspiesse, K. D., Mannino, A., Martins, J. V., McClain, C. R., Meister, G., and Remer, L. A.: The Plankton, Aerosol, Cloud, ocean Ecosystem (PACE) mission: Status, science, advances, B. Am. Meteorol. Soc., 100, 1775–1794 https://doi.org/10.1175/bams-d-18-0056.1, 2019.
Wilcox, E. M.: Direct and semi-direct radiative forcing of smoke aerosols over clouds, Atmos. Chem. Phys., 12, 139–149, https://doi.org/10.5194/acp-12-139-2012, 2012.
Wood, R.: Cancellation of aerosol indirect effects in marine stratocumulus through cloud thinning, J. Atmos. Sci., 64, 2657–2669, 2007.
Wood, R.: Stratocumulus clouds, Mon. Weather Rev., 140, 2373–2423, https://doi.org/10.1175/MWR-D-11-00121.1, 2012.
Wood, R., Leon, D., Lebsock, M., Snider, J., and Clarke, A. D.: Precipitation Driving of Droplet Concentration Variability in Marine Low Clouds: PRECIPITATION DRIVING OF DROP CONC, J. Geophys. Res.-Atmos., 117, D19, https://doi.org/10.1029/2012JD018305, 2012.
Wu, H., Taylor, J. W., Szpek, K., Langridge, J. M., Williams, P. I., Flynn, M., Allan, J. D., Abel, S. J., Pitt, J., Cotterell, M. I., Fox, C., Davies, N. W., Haywood, J., and Coe, H.: Vertical variability of the properties of highly aged biomass burning aerosol transported over the southeast Atlantic during CLARIFY-2017, Atmos. Chem. Phys., 20, 12697–12719, https://doi.org/10.5194/acp-20-12697-2020, 2020.
Xu, F., van Harten, G., Diner, D., Davis, A., Seidel, F., Rheingans, B., Tosca, M., Alexandrov, M., Cairns, B., Ferrare, R., Burton, S., Fenn, M. A., Hostetler, C. A., Wood, R., and Redemann, J.: Coupled Retrieval of Liquid Water Cloud and Above-Cloud Aerosol Properties using the Airborne Multiangle SpectroPolarimetric Imager (AirMSPI), J. Geophys. Res.-Atmos., 123, 3175–3204, 2018.
Ye, J., He, Y., Pappenberger, F., Cloke, H. L., Manful, D. Y., and Li, Z.: Evaluation of ECMWF medium-range ensemble forecasts of precipitation for river basins, Q. J. R. Meteor. Soc., 140, 1615–1628, 2014.
Yu, H. and Zhang, Z.: New Directions: Emerging satellite observations of above-cloud aerosols and direct radiative forcing, Atmos. Environ., 72, 36–40, 2013.
Yu, H., Zhang, Y., Chin, M., Liu, Z., Omar, A., Remer, L. A., Yang, Y., Yuan, T., and Zhang, J.: An Integrated Analysis of Aerosol above Clouds from A-Train Multi-sensor Measurements, Rem. Sens. Environ., 121, 125–131, https://doi.org/10.1016/j.rse.2012.01.011, 2012.
Zhang, J. and Zuidema, P.: The diurnal cycle of the smoky marine boundary layer observed during August in the remote southeast Atlantic, Atmos. Chem. Phys., 19, 14493–14516, https://doi.org/10.5194/acp-19-14493-2019, 2019.
Zhang, Z., Meyer, K., Yu, H., Platnick, S., Colarco, P., Liu, Z., and Oreopoulos, L.: Shortwave direct radiative effects of above-cloud aerosols over global oceans derived from 8 years of CALIOP and MODIS observations, Atmos. Chem. Phys., 16, 2877–2900, https://doi.org/10.5194/acp-16-2877-2016, 2016.
Zuidema, P., Painemal, D., deSzoeke, S., and Fairall, C.: Stratocumulus cloud top height estimates and their climatic implications, J. Climate, 22, 4652–4666, https://doi.org/10.1175/2009JCLI2708.1, 2009.
Zuidema, P., Chiu, C., Fairall, C. W., Ghan, S. J., Kollias, P., McFarguhar, G. M., Mechem, D. B., Romps, D. M., Wong, H., Yuter, S. E., Alvarado, M. J., DeSzoeke, S. P., Feingold, G., Haywood, J. M., Lewis, E. R., McComiskey, A., Redemann, J., Turner, D. D., Wood, R., and Zhu, P.: Layered Atlantic Smoke Interactions with Clouds (LASIC) Science Plan, DOE/SC-ARM-14-037, availabe at: http://www.osti.gov/scitech/servlets/purl/1232658 (last access: December 2018), 2015.
Zuidema, P., Redemann, J., Haywood, J., Wood, R., Piketh, S., Hipondoka, M., and Formenti, P.: Smoke and Clouds above the Southeast Atlantic: Upcoming Field Campaigns Probe Absorbing Aerosol's Impact on Climate, B. Am. Meteorol. Soc., 97, 1131–1135, https://doi.org/10.1175/BAMS-D-15-00082.1, 2016.
Zuidema, P., Sedlacek III, A. J., Flynn, C., Springston, S., Delgadillo, R., Zhang, J., Aiken, A. C., Koontz, A., and Muradyan, P.: The Ascension Island boundary layer in the remote southeast Atlantic is often smoky, Geophys. Res. Lett., 45, 4456–4465, https://doi.org/10.1002/2017GL076926, 2018.
- Abstract
- Introduction
- Project background
- Description of deployments
- Preliminary science findings and implications
- Discussion
- Conclusions and future work
- Appendix A: Description of flights
- Appendix B: Choice of instrumentation
- Appendix C: Acknowledgement of all participants
- Data availability
- Author contributions
- Competing interests
- Special issue statement
- Acknowledgements
- Financial support
- Review statement
- References
The requested paper has a corresponding corrigendum published. Please read the corrigendum first before downloading the article.
- Article
(36054 KB) - Full-text XML
- Abstract
- Introduction
- Project background
- Description of deployments
- Preliminary science findings and implications
- Discussion
- Conclusions and future work
- Appendix A: Description of flights
- Appendix B: Choice of instrumentation
- Appendix C: Acknowledgement of all participants
- Data availability
- Author contributions
- Competing interests
- Special issue statement
- Acknowledgements
- Financial support
- Review statement
- References