the Creative Commons Attribution 4.0 License.
the Creative Commons Attribution 4.0 License.
 | 05 Oct 2021
Ice-nucleating particle concentration measurements from Ny-Ålesund during the Arctic spring–summer in 2018
Naruki Hiranuma
Gianni Santachiara
Mauro Mazzola
Karam Mansour
Marco Paglione
Cheyanne A. Rodriguez
Rita Traversi
Silvia Becagli
David Cappelletti
Franco Belosi
In this study, we present atmospheric ice-nucleating particle (INP) concentrations from the Gruvebadet (GVB) observatory in Ny-Ålesund (Svalbard). All aerosol particle sampling activities were conducted in April–August 2018. Ambient INP concentrations (nINP) were measured for aerosol particles collected on filter samples by means of two offline instruments: the Dynamic Filter Processing Chamber (DFPC) and the West Texas Cryogenic Refrigerator Applied to Freezing Test system (WT-CRAFT) to assess condensation and immersion freezing, respectively. DFPC measured nINPs for a set of filters collected through two size-segregated inlets: one for transmitting particulate matter of less than 1 µm (PM1), the other for particles with an aerodynamic diameter of less than 10 µm aerodynamic diameter (PM10). Overall, nINP measured by DFPC at a water saturation ratio of 1.02 ranged from 3 to 185 m−3 at temperatures (Ts) of −15 to −22 ∘C. On average, the super-micrometer INP (nINPINP) accounted for approximately 20 %–30 % of nINP in spring, increasing in summer to 45 % at −22 ∘C and 65 % at −15 ∘C. This increase in super-micrometer INP fraction towards summer suggests that super-micrometer aerosol particles play an important role as the source of INPs in the Arctic. For the same T range, WT-CRAFT measured 1 to 199 m−3. Although the two nINP datasets were in general agreement, a notable nINP offset was observed, particularly at −15 ∘C. Interestingly, the results of both DFPC and WT-CRAFT measurements did not show a sharp increase in nINP from spring to summer. While an increase was observed in a subset of our data (WT-CRAFT, between −18 and −21 ∘C), the spring-to-summer nINP enhancement ratios never exceeded a factor of 3. More evident seasonal variability was found, however, in our activated fraction (AF) data, calculated by scaling the measured nINP to the total aerosol particle concentration. In 2018, AF increased from spring to summer. This seasonal AF trend corresponds to the overall decrease in aerosol concentration towards summer and a concomitant increase in the contribution of super-micrometer particles. Indeed, the AF of coarse particles resulted markedly higher than that of sub-micrometer ones (2 orders of magnitude). Analysis of low-traveling back-trajectories and meteorological conditions at GVB matched to our INP data suggests that the summertime INP population is influenced by both terrestrial (snow-free land) and marine sources. Our spatiotemporal analyses of satellite-retrieved chlorophyll a, as well as spatial source attribution, indicate that the maritime INPs at GVB may come from the seawaters surrounding the Svalbard archipelago and/or in proximity to Greenland and Iceland during the observation period. Nevertheless, further analyses, performed on larger datasets, would be necessary to reach firmer and more general conclusions.
- Article
(4834 KB) - Full-text XML
-
Supplement
(5572 KB) - BibTeX
- EndNote


A climate-change-sensitive region, the Arctic is experiencing a higher temperature (T) increase as compared to mid-latitudes due to a phenomenon called Arctic amplification (Serreze and Barry, 2011). While sea ice-albedo feedback appears to be a clear factor, the roles of other processes are difficult to quantify (Schmale et al., 2021). The contributions of forcing and feedback mechanisms associated with aerosol particles able to trigger heterogeneous ice nucleation, as well as Arctic mixed-phase cloud formation, remain especially uncertain and unpredictable (Murray et al., 2021).
Arctic mixed-phase clouds are composed of both ice and supercooled liquid water and structured in persistent stratiform layers (Shupe et al., 2006, 2011). In mixed-phase clouds, the hydrometeor phase formed through aerosol–cloud interactions plays an important role in determining cloud albedo and lifetime (de Boer et al., 2014). The strong sensitivity of stratiform mixed-phase cloud lifetime to the number of ice crystals was reported by Harrington and Olsson (2001) and Jiang et al. (2000). This effect was attributed in part to the Wegener–Bergeron–Findeisen mechanism (Bergeron, 1935; Findeisen, 1938; Wegener, 1911), whereby ice grows at the expense of liquid water due to its lower saturation vapor pressure. The resultant microphysical instability can glaciate clouds within a few hours or less (Jiang et al., 2000; Pinto, 1998; Rangno and Hobbs, 2001; Harrington et al., 1999). It follows that the presence of aerosol particles triggering heterogeneous ice nucleation (ice-nucleating particles, INPs) in the Arctic atmosphere can potentially have a substantial impact on precipitation formation, cloud radiative properties and climate (Solomon et al., 2018; Murray et al., 2021).
Atmospheric heterogeneous ice nucleation generally occurs by means of four major pathways: deposition, condensation, immersion and contact freezing (Vali et al., 2015). Ice formation by deposition occurs when the ambient is supersaturated with respect to ice in water-subsaturated conditions so that ice forms on an INP without prior formation of liquid. In condensation freezing, ice forms as water vapors condense on an INP at subzero Ts, while nuclei immersed in a water droplet freeze via immersion freezing at sub-zero Ts. In contact freezing, an INP promotes freezing when it comes into contact with a supercooled droplet from the outside. The distinction between condensation freezing and immersion freezing is still a matter of debate (Dymarska et al., 2006). The recent results of Wex et al. (2014) and Hiranuma et al. (2015) suggest that they might be the same process. However, the recent inter-comparison study with two different organic fiber samples shows a difference between condensation freezing and immersion freezing measurements, i.e., ice nucleation efficiency of the former is higher than the latter (Hiranuma et al., 2019). Further laboratory and field assessments are therefore necessary to understand the similarity of ice nucleation modes and processes.
In general, INPs can be of abiotic (e.g., mineral dust, volcanic ashes and soil dust) or biotic (e.g., bacteria, fungi, microalgae and pollen) origin (Hoose and Möhler, 2012; Murray et al., 2012). Seawater has been identified as a source of ice nucleation active organic molecules (Knopf et al., 2011; Wang et al., 2015; Wilson et al., 2015) transferable to the atmosphere as a component of sea spray particles (e.g., McCluskey et al., 2017). According to Hoose and Möhler (2012), mineral particles are typically dominant immersion- and condensation-mode INPs below −20 ∘C, with the exceptions of K-feldspar and quartz, which can facilitate ice nucleation at much higher Ts compared to other mineral compositions (Atkinson et al., 2013; Harrison et al., 2019). In addition, biogenic INPs tend to favor the formation of ice at relatively higher Ts than abiotic INPs (Murray et al., 2012), even though the ice nucleation efficiency of biotic INPs varies widely (Kanji et al., 2017).
Table 1Compilation of previous ground-level measurements of nINP in the Arctic.
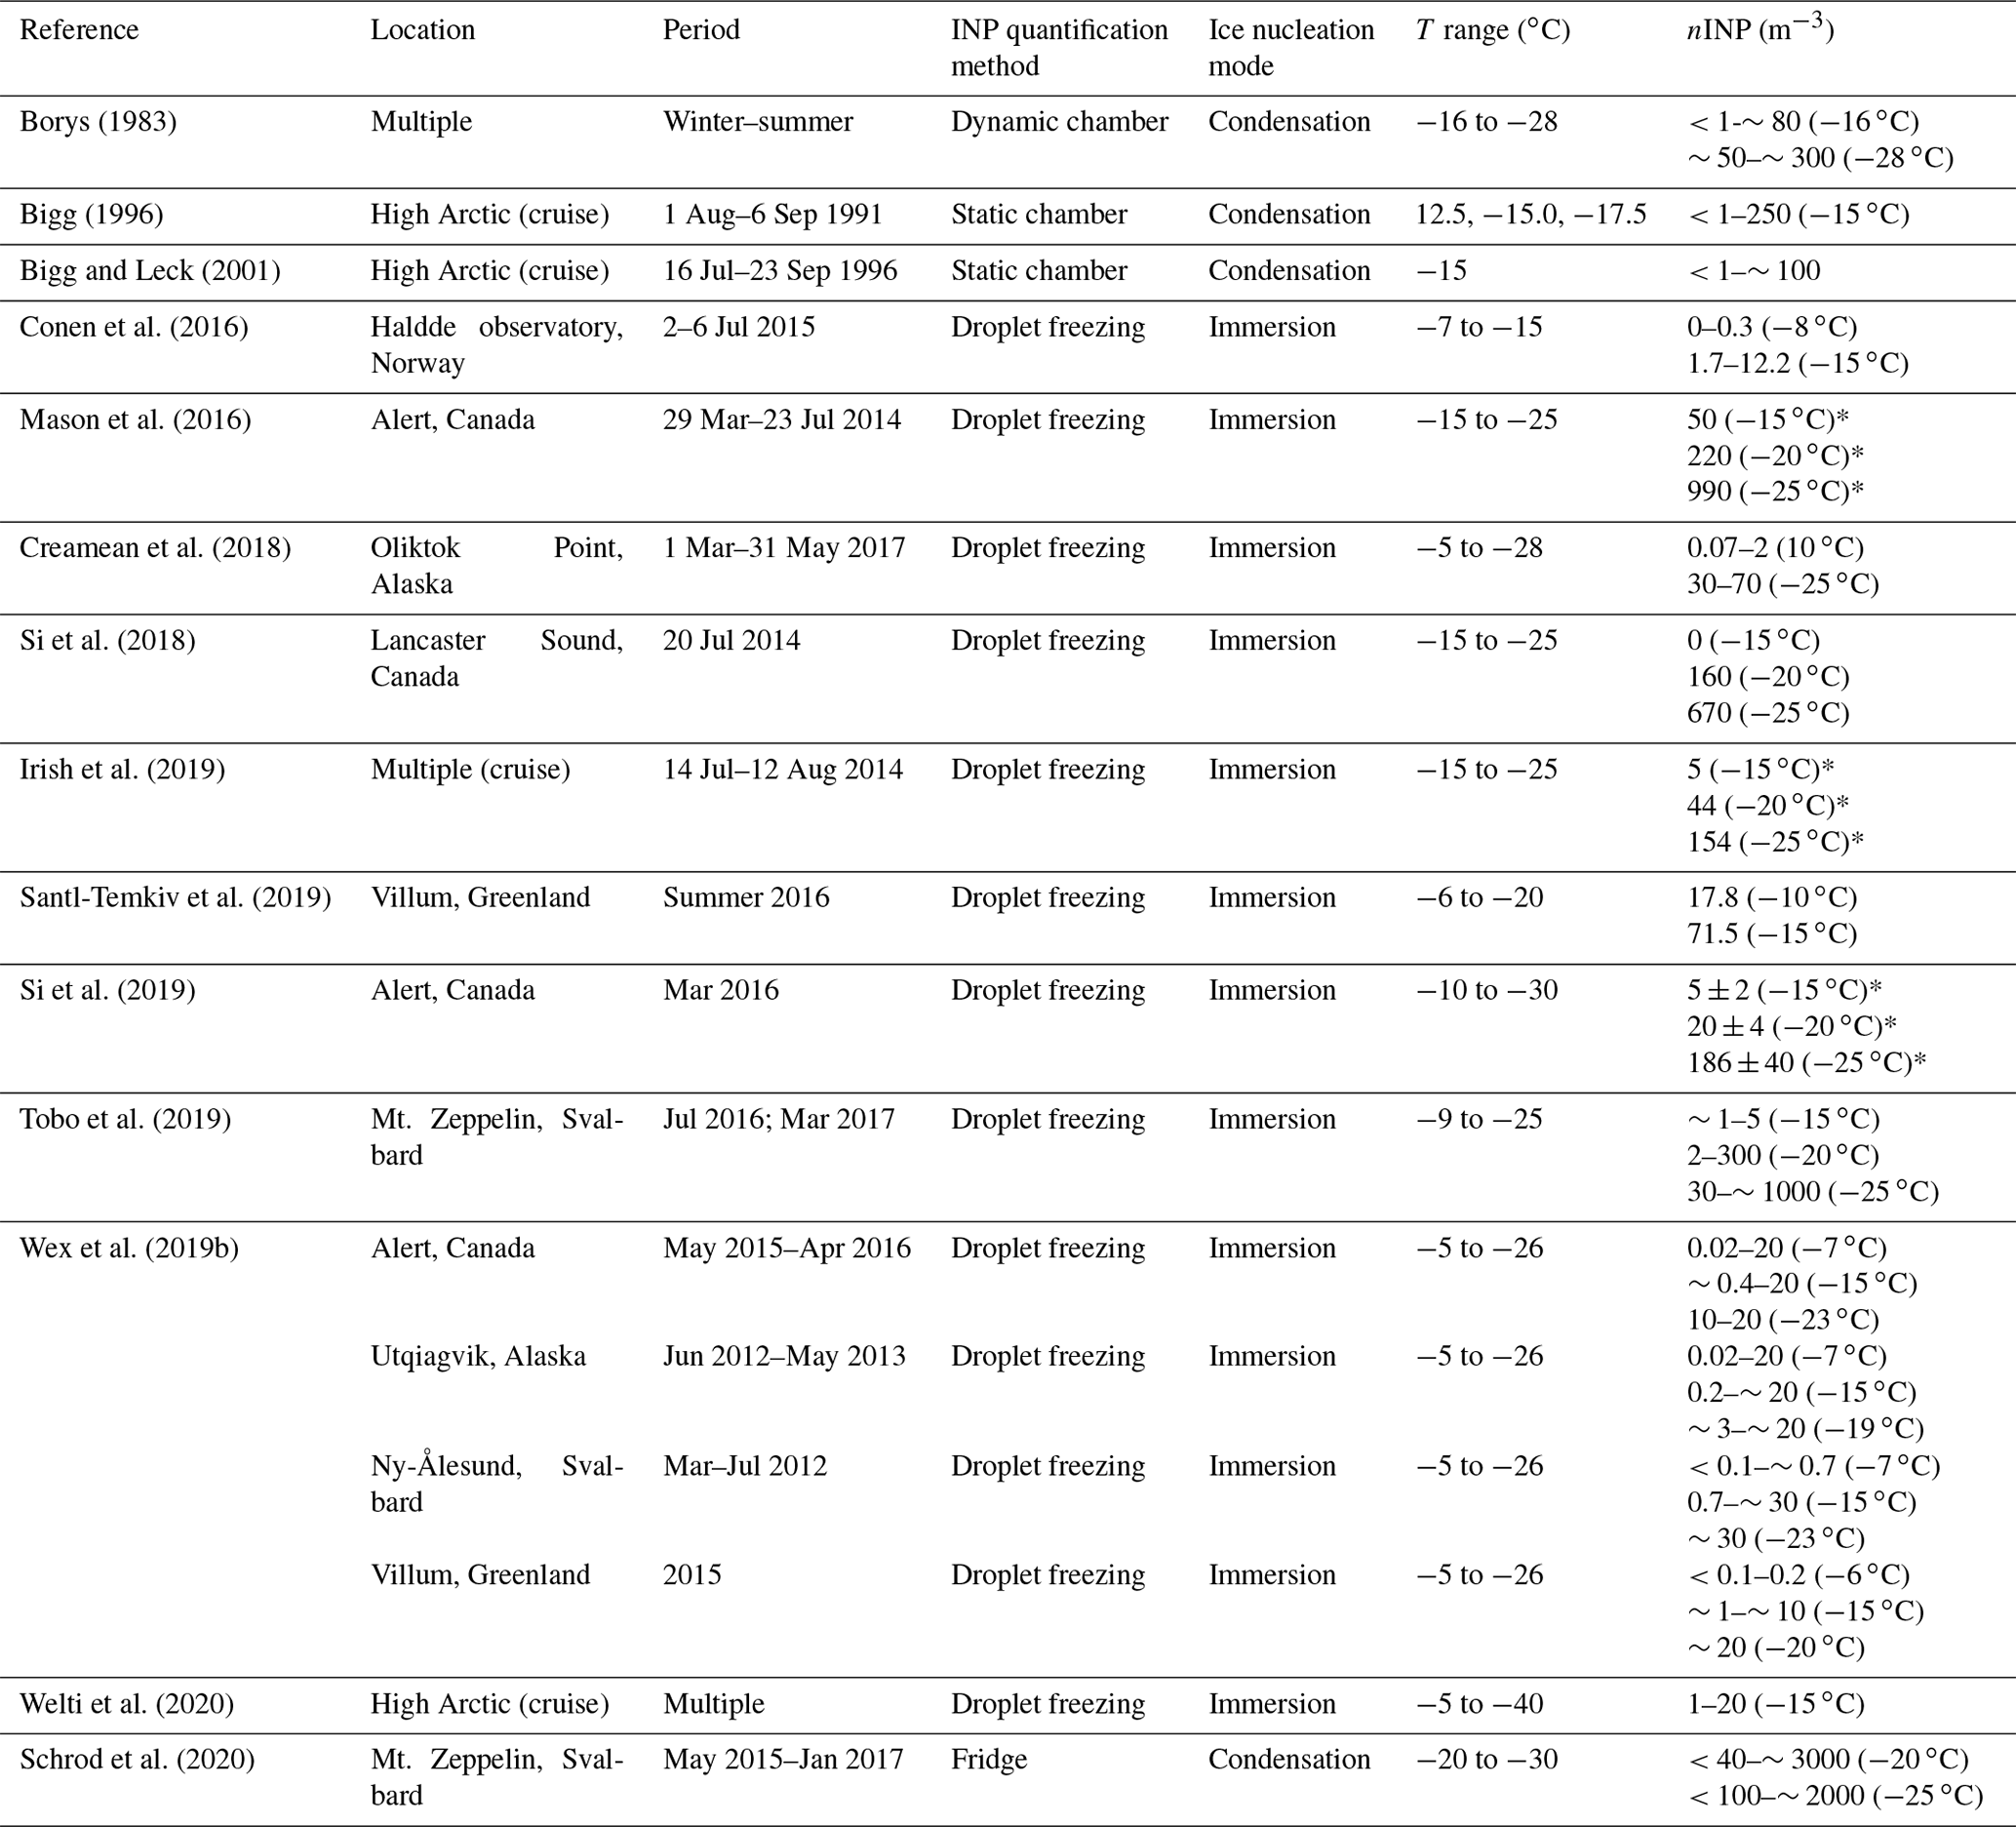
* Average values.
Only a few multi-season measurements of the Arctic INP concentration (nINP) are currently available. A summary of previously reported ground-based nINP measurements and T ranges can be found in Table 1. The first ground-level nINP data from the Arctic region were reported by Borys (1983). Measurements were performed with an offline dynamic condensation chamber at Ts between −28 and −16 ∘C in water saturation conditions. It was observed that pollution from lower latitudes contributed insignificantly to the Arctic INP burden as low nINP values coincided with the Arctic haze period. Bigg (1996) measured INPs active at −15 ∘C in a static chamber and at a relative humidity (RH) of just above 100 % during an icebreaker cruise to the North Pole. The ocean was identified as a major source of INPs since nINP fell as a function of the length of time that had elapsed since the air masses had left the open sea. Similar measurements were performed by Bigg and Leck (2001) in the central Arctic Ocean (20 July–18 September 1996). The authors identified bacteria and fragments of marine organisms in the samples, suggesting biotic material to be the source of INPs in the Arctic.
More recent measurements of Arctic INPs were mostly performed in the immersion freezing mode. Conen et al. (2016) measured nINP at a coastal mountain observatory in Northern Norway. During the summer, the authors observed that nINP (T of −15 ∘C) in air masses from the ocean increased 3-fold after about 1 d of passage over land. Both marine and terrestrial INP sources were identified by Creamean et al. (2018) in the northern Alaskan Arctic during spring. Irish et al. (2019) measured nINP in the Canadian Arctic marine boundary layer during summer 2014 onboard the research ship Amundsen. nINP values correlated positively with total residence time over land and negatively with total residence time over sea ice and open water, suggesting a higher contribution of mineral dust particles than sea-spray-related sources. Similar conclusions were found by Si et al. (2018) from measurements performed in the Canadian Arctic. Mason et al. (2016) found a large fraction of the INPs observed at the Alert station in spring and summer to belong to the coarse size range. Likewise, a size-dependent ice nucleation efficiency, with larger particles being more ice active, was reported by Creamean et al. (2018) and Si et al. (2018). Recently, some studies have reported marked nINP seasonal variability in the Atlantic sector of the Arctic (Wex et al., 2019b; Tobo et al., 2019; Santl-Temkiv et al., 2019). In particular, Wex et al. (2019b) observed an nINP increase of more than 1 order of magnitude from spring to summer (e.g., ∼14 times at ∘C) at the Gruvebadet (GVB) observatory in 2012. Following two field campaigns at the Mt. Zeppelin station in July 2016 and March 2017, Tobo et al. (2019) reported nINPs at −20 ∘C of about 0.01 L−1 in spring and about 0.1 L−1 in summer. This substantial increase was interpreted as the effect of local INP sources active when land and sea are free from snow and ice (Santl-Temkiv et al., 2019; Wex et al., 2019b; Tobo et al., 2019). Conversely, the results of multi-year (May 2015–January 2017) INP observations at Mt. Zeppelin (Svalbard) by Schrod et al. (2020) showed no significant seasonal trend in nINP.
Our study aims to add to the still scant INP observations in the Arctic environment, investigating nINP and potential INP sources during spring and summertime at the ground-level site of GVB. In particular, we extend the INP observations at GVB, previously only 13 samples (Wex et al., 2019b), presenting the results of 61 samples investigated with two offline INP measurement techniques. We also analyze the ice nucleation efficiency of Arctic aerosol particles by calculating their activated fraction (AF). To date, only a limited number of studies have provided information on INP trends scaled to the total aerosol concentration over the Arctic (Si et al., 2018). AF estimation can be understood as a simple metric indicating the ice-nucleating efficiency of particles within a specific aerosol sample (Schrod et al., 2020). In our specific case, it provides further insight, over and above the nINP data, into INP characteristics over the Atlantic sector of the Arctic.
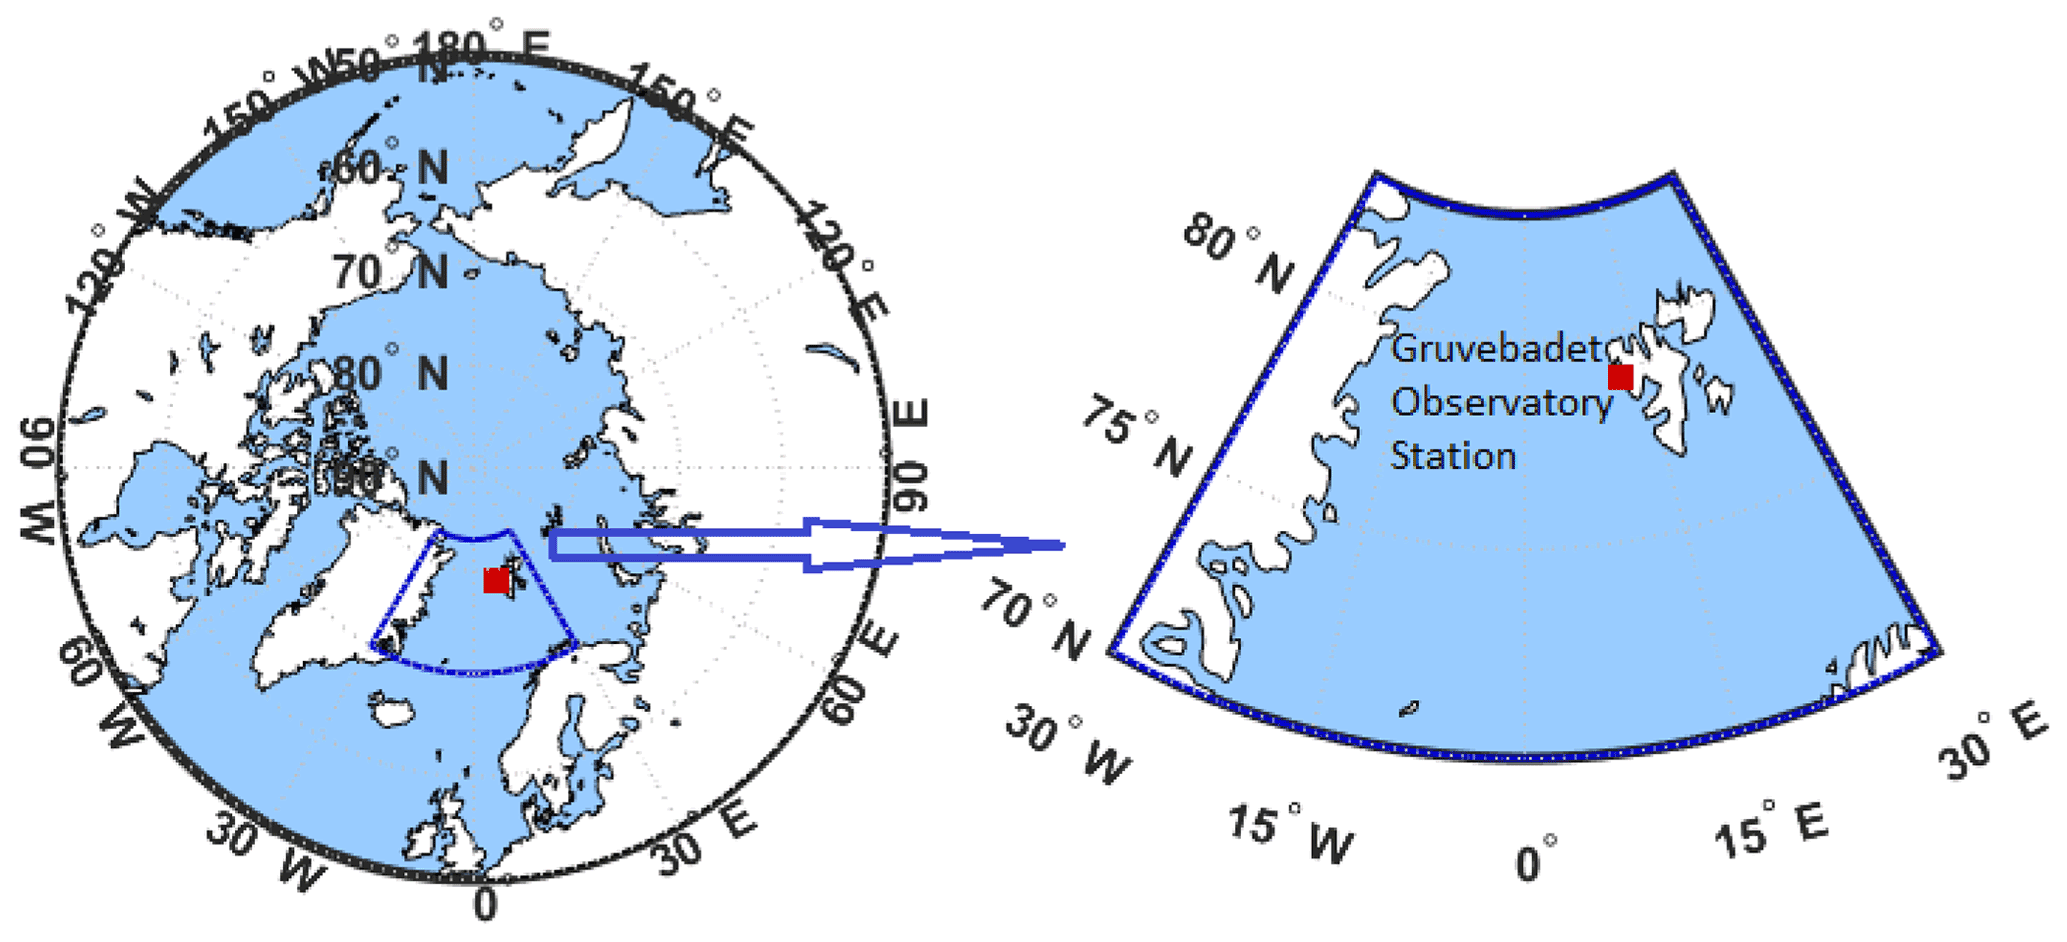
Figure 1Geographic location of the sampling station, Gruvebadet observatory at Ny-Ålesund, Svalbard islands.
2.1 Sampling
Aerosol particle sampling was performed at the GVB observatory located in proximity to the village of Ny-Ålesund (78∘55′ N, 11∘56′ E) on Spitsbergen, Svalbard (Fig. 1). The observatory is located about 40 m above sea level and about 1 km southwest of the village, a location that guarantees minimal influence by local pollution sources given the prevailing southerly winds (Udisti et al., 2016). Aerosol particle sampling activities for offline nINP analyses were arranged independently for the two methods (see Sect. 2.2) with different sampling time intervals through different inlets. All inlet heights were set about 5 m above ground level.
Aerosol particle samples for the Dynamic Filter Processing Chamber (DFPC) application were collected on nitrocellulose membrane filters (Millipore HABG04700, nominal porosity 0.45 µm). We deployed two parallel sampling inlet systems, one with a PM1 cut size, the other for PM10 (cut-point-Standard EN 12341, TCR Tecora). Operative flow of 38.3 (±2.0) LPM in each sampling line was generated by two independent pumps (Bravo H Plus, TCR Tecora). Sampling for DFPC was carried out over two meteorological seasons: from 17 April to 2 May 2018 in spring and from 11 to 27 July 2018 in summer. A pair of samples (duration of 3 to 4 h) was collected each day from the two inlet systems. Our short sampling span was employed to avoid aerosol particle overloading on the filters. To coordinate with other scheduled activities at GVB, sampling generally started in the morning during the spring campaign and typically in the afternoon during the summer campaign. A total of 33 PM1–PM10 pairs of samples were collected, 16 in spring and 17 in summer. Samples were stored at room T until analysis.
For the West Texas Cryogenic Refrigerator Applied to Freezing Test system (WT-CRAFT) analysis, a total of 28 samples were collected from 16 April to 15 August 2018. Aerosol particles were collected using 47 mm membrane filters (Whatman, Track-Etched Membranes, 0.2 µm pore). Aerosol particle-laden air was drawn from a central total suspended particulate (TSP) inlet with a constant average inlet flow of 5.4 LPM (±0.2 LPM standard deviation). The TSP inlet was custom made and designed to operate with isokinetic and laminar flow at 150 LPM. From the central inlet, an 8 mm outside diameter stainless steel tube was directly connected to the filter sampler to intake a subset of airflow. An excess flow in the TSP inlet was drawn through other instruments connected to the inlet or a central inlet pump. More detailed conditions of our filter sampling, including sampling time stamps, air volume sampled through the filter cross section, and the resulting HPLC water volume used to suspend aerosol particles for WT-CRAFT analysis, are summarized in Table S1. Below the filter sampler, the filtered air was constantly pumped through a diaphragm pump (KnF, IP20-T). A critical orifice was installed upstream of the pump to ensure a constant volume flow rate and control the mass flow rate through the sampling line. A typical sampling interval was approximately 4 d, with only one exception (i.e., 8 d for the sample collected starting 26 May 2018).
2.2 Ice nucleation measurements
2.2.1 DFPC
All DFPC measurements were carried out in the laboratory on completion of the campaigns using the membrane filter technique presented in Santachiara et al. (2010) and Rinaldi et al. (2017). All measurements were completed within ca. 6 months from sampling. A replica of the Langer dynamic filter processing chamber (Langer and Rodgers, 1975) housed in a refrigerator was used to determine nINP at different Ts. Before the analysis, each filter was placed on a metal plate (5.5 cm diameter, 0.5 mm thick) previously coated with a smooth paraffin layer to ensure good thermal contact between filter and supporting substrate. The paraffin was then flash heated at 70 ∘C for less than 5 s and rapidly cooled in order to fill the filter pores. Particle-free air entered the DFPC chamber through a perforated plate, spreading to an ice bed to become saturated with respect to ice but undersaturated with respect to water. The air then proceeded to the filter, cooled by a Peltier device in contact with the supporting metal plate. Only at this point did the air become supersaturated with respect to water. By controlling the Ts of the filter and surrounding air, the samples could be exposed to different Ts while keeping the water saturation ratio (Sw) above 1. The supersaturation ratio was calculated theoretically from vapor pressures of ice and water at the Ts considered (Buck, 1981). More details of the DFPC working principle can be found in the Supplement of deMott et al. (2018).
Ice nucleation was visually evaluated by counting the number of ice crystals growing on individual aerosol particles on the sampled filter illuminated by a visible light source. Measurements were performed at activation Ts of −15, −18 and −22 ∘C and at Sw=1.02. Uncertainties for air T, filter T and Sw are about 0.2, 0.1 and 0.02 ∘C, respectively. The overall uncertainty in the DFPC-based INP assessment was estimated by considering the effect of Sw variations on nINP extrapolated from the laboratory results by Belosi et al. (2018) and found to be around ±30 %. The filter background INP contribution was evaluated by analyzing blank filters at the same evaluation conditions as the samples. Measurements were corrected for the filter background.
2.2.2 WT-CRAFT
To complement the DFPC results, we also used the WT-CRAFT offline droplet-freezing assay instrument to measure T-resolved nINP at ∘C, with a detection capability of >1 INP per cubic meter of air. All measurements were completed within 1 year from the collection of the samples, and the samples were stored in a fridge (4 ∘C) before analysis. Although WT-CRAFT was originally a replica of NIPR-CRAFT (Tobo, 2016), the two CRAFT systems exhibit different sensitivities to artifact and detectable T ranges as described by Hiranuma et al. (2019) and Vepuri et al. (2021). The reason for the different detectable T ranges is not known. Hiranuma et al. (2019, i.e., Table S2) report the uncertainties of T and ice nucleation efficiency in WT-CRAFT as ±0.5 ∘C and ±23.5 %, respectively. The T uncertainty reported was derived based on an observed systematic difference between the thermal sensor (TGK, SN-170N) measurements and set-point Ts of a cryo-cooling system (Scinics Corporation, model CS-80CP) at ∘C. The uncertainty of ice nucleation efficiency estimation in WT-CRAFT was previously estimated based on the average standard deviation at Ts ∘C for a known composition (microcrystalline cellulose). Alternatively, as demonstrated in Vepuri et al. (2021) and Schiebel (2017), our experimental uncertainty in estimated nINP can be evaluated using the 95 % confidence interval method.
While there are no major systematic differences between the two CRAFT instruments, WT-CRAFT employs different image recording systems, stage and clean housing compared to NIPR-CRAFT. For imaging, WT-CRAFT uses a combination of an Opti-Tekscope OT-M HDMI microscope camera and a Logitech c270 camera. This combination is used to correctly capture the transition of droplet brightness/contrast to opaque ice with 30 frame-per-second time resolution, with reasonable pixel resolution and magnification (if needed). As for a cold stage, we used a thin (<5 mm) polished aluminum plate to ensure efficient thermal cooling and that the cryo-cooling system T was equivalent, within known uncertainties, to the T measured at the plate surface. Finally, WT-CRAFT was operated in a vertical clean bench (LABCONCO, Purifier®). All droplet preparations were conducted in the clean bench to minimize possible contamination with the laboratory air.
For each experiment, 70 solution droplets (3 µL each) placed on a hydrophobic Vaseline layer were analyzed. At a cooling rate of 1 ∘C min−1, we manually counted a cumulative number of frozen droplets based on the color contrast shift in the off-the-shelf video recording camera. nINP of 3 µL-sized droplets containing aerosol particles from the samples were then estimated as a function of T for every 0.5 ∘C (Sect. 2.2.3).
Prior to each WT-CRAFT experiment, we suspended particles on an individual filter sample in a known volume of ultrapure high-performance liquid chromatography (HPLC) grade water, in which the first frozen droplet corresponded to ≈1 INP m−3 (in the range of 0.93–1.02 m−3; Table S1). The HPLC water volume was determined according to Eqs. (1)–(2) in Sect. 2.2.3. Half of each filter was used for each WT-CRAFT experiment, and the other half was saved for other and future uses. Our suspension-generating protocol entailed (1) cutting the filter in two and soaking one filter half in ultrapure water in a sterilized falcon tube, (2) vortex mixing the suspension tube to scrub particles on the filter in suspension, (3) applying an idle time of 5 min to have the quasi-steady state suspension and (4) preparing droplets out of the suspension by micro-pipetting in the clean bench. If necessary, the suspension sample was diluted until we observe their freezing spectrum collapsing onto the water background curve. Our diluted spectra and original freezing spectrum reasonably agreed in their overlapped T region (within a factor of 3 at most) without any notable artifacts at T above −25 ∘C. Having no failures, we simply stitched all spectra so that the data point with the best (smallest) 95 % confidence interval represented nINP(T) for the overlapping T region if observed. Due to negligible background contribution of water freezing at −25 ∘C (i.e., <3 %), we did not apply any background corrections to our nINP data.
2.2.3 Derivation of INP atmospheric concentrations
For DFPC samples, nINP, expressed hereafter in units of m−3, was calculated by dividing the number of ice crystals quantified on each filter by the sampled volume of air passed through the filter. For the WT-CRAFT analysis, we first computed the CINP(T) value, which is the freezing nucleus concentration in HPLC suspension (L−1 water) at a given T as described by Vali (1971). This CINP(T) value was calculated as a function of the unfrozen fraction, funfrozen(T) (i.e., the ratio of the number of droplets unfrozen to the total number of droplets), as
where Vd is the volume of individual droplets (3 µL). Next, we converted CINP(T) to nINP(T). The cumulative nINP per unit volume of sample air, described in deMott et al. (2017), was estimated as
where DF is a serial dilution factor (e.g., DF = 1 or 10 or 100 and so on). The sampled air volume (Vair) and the suspension volume (Vl) are provided in Table S1.
To estimate the efficiency of the sampled aerosol particles in nucleating ice, we calculated AF by scaling nINP to the aerosol particle number concentration measured on-site in parallel (see Sect. 2.3.1). For the AF estimation we considered aerosol particles in the 0.1–10 µm size range that were considered since this size range is reasonably accountable for heterogeneous ice nucleation in the atmosphere (Kanji et al., 2017).
2.3 Complementary analyses
2.3.1 Particle size distribution measurements
The aerosol particle number size distribution was continuously monitored at the GVB station using a Scanning Mobility Particle Sizer (SMPS), model TSI 3034, for the diameter range between 10 and 500 nm (54 channels). An Aerodynamic Particle Sizer (APS), model TSI 3321, was used for measuring the aerodynamic aerosol particle diameters between 0.5 and 20 µm in parallel with the SMPS. Both instruments were connected to a common stack inlet, where the WT-CRAFT filter sampler was deployed, and recorded data averaged over 10 min (Giardi et al., 2016; Lupi et al., 2016). The aerodynamic diameters measured by the APS were corrected to the volume-equivalent diameters using an average particle mass density of 1.95 g cm−3, assuming a mixture of different substances based on the findings of Lisok et al. (2016) and a dynamic shape factor of 1. The number concentration in the resulting overlapping range was taken from the SMPS data. Finally, commutative aerosol particle counts of SMPS and APS were considered as a total aerosol particle number concentration. In order to compare with nINP and to calculate the AF, the particle number concentrations at 10 min time resolution were averaged over each filter sampling period. AF was calculated using the size range 0.1–10 µm for DFPC and WT-CRAFT data, 0.1–1 µm for DFPC data and 1–10 µm for DFPC data in the super-micrometer regime. The SMPS–APS underwent maintenance during August 2018 and was therefore not operational.
2.3.2 Meteorology
Meteorological parameters (T; pressure, P; RH; wind speed, WS) were provided by the Amundsen-Nobile Climate Change Tower positioned less than 1 km N–E of GVB (Mazzola et al., 2016), while precipitation data (type and amount) were taken from the eKlima database, provided by the Norwegian Meteorological Institute (https://seklima.met.no/observations/, last access: 20 March 2020).
2.3.3 Offline chemical analysis
The chemical analysis of major and trace ion species, used in this work as aerosol particle source tracers, was accomplished on Teflon filters (PALL Gelman) collected at GVB with a TECORA Skypost sequential sampler equipped with a PM10 sampling head at an operating flow rate of 2.3 m3 h−1 (EN 12341) for 24 h. Throughout the sampling and offline analysis at the University of Florence, the filters were handled with care by personnel working under a class 100 laminar flow hood and wearing powder-free latex gloves to minimize potential contamination. After sampling, the filters were shipped at −20 ∘C and stored at the same T. Measurements were carried out by a triple Dionex ThermoFisher ion chromatography system equipped with electrochemical-suppressed conductivity detectors. In particular, a Dionex AS4A-4 mm analytical column with a 1.8 mM Na2CO mM NaHCO3 eluent was used to determine most of the inorganic anions (Cl−, NO, SO, C2O, while a Dionex AS11 separation column with gradient elution (0.075–2.5 mM Na2B4O7 eluent) was used to measure F− and some organic anions (acetate, glycolate, formate and methanesulfonate). Cationic species (Na+, NH, K+, Mg2+, Ca2+) were determined by a Dionex CS12A-4 mm analytical column with 20 mM H2SO4 as eluent. Further analytical details can be found in Udisti et al. (2016) and Becagli et al. (2011).
2.3.4 Back-trajectories and satellite ground-type maps
To investigate the sources that contributed to INPs (i.e., maritime vs. terrestrial), we performed 5 d back-trajectory analysis according to Wex et al. (2019b); 5 d back-trajectory air masses (HYSPLIT4 with GDAS data: https://ready.arl.noaa.gov/, last access: 28 February 2019) from the National Oceanic and Atmospheric Administration (NOAA) HYSPLIT model (Rolph et al., 2017; Stein et al., 2015) were simulated for an altitude of 100 m above mean sea level (a.m.s.l.) over the GVB station. For DFPC samples, back-trajectory arrival time was considered simultaneous to INP samples, while for WT-CRAFT, the trajectories were calculated twice a day (at 06:00 and 18:00 UTC) for the INP sampling period from April to August. Only back-trajectories traveling up to an altitude of 500 m a.m.s.l. were considered for this analysis, which is a reasonable assumption for air masses passing within the marine boundary layer (Dai et al., 2011).
Ground condition maps were obtained from the National Ice Center's Interactive Multisensor Snow and Ice Mapping System (IMS) (Helfrich et al., 2007; National Ice Center, 2008), National Snow & Ice Data Center (NISDC; https://nsidc.org/, last access: 8 March 2019). We used the daily Northern Hemisphere maps with a resolution of 4 km. The ground types considered were “seawater”, “sea ice”, “land”, and “snow”. Seawater indicates passage of the air mass over open seawaters, while sea ice indicates passage over ice-covered seawaters. “Land” and “snow” categories indicate the passage of air mass over land without and with snow cover, respectively. For each back-trajectory endpoint, we applied nearest-neighbor interpolation in space and time to find the closest pixels on the satellite map and associated the endpoint with the corresponding ground type. Combining the information obtained along the whole back-trajectory (or group of back-trajectories for WT-CRAFT samples) allowed estimation of the contribution of each ground type to each INP sample.
2.3.5 Satellite chlorophyll a data and correlation analysis
Satellite-retrieved chlorophyll a fields were used to track the evolution of oceanic biological activity in the Arctic Ocean during the study period. The best estimate “cloud-free” (Level-4) daily sea surface chlorophyll a concentration (CHL; mg m−3) data were downloaded from the EU Copernicus Marine Environment Monitoring Service (CMEMS; http://marine.copernicus.eu/, last access: 22 October 2018) based on a multi-sensor approach (i.e., SeaWiFS, MODIS-Aqua, MERIS, VIIRS and OLCI-S3A). The Level-4 product is available globally at ∼4 km spatial and daily time resolution. From this global dataset, CHL fields were extracted in the Arctic Ocean during summer 2018 to be merged with INP data.
Recent literature (Wilson et al., 2015; Knopf et al., 2011; Wang et al., 2015) has shown that sea spray organic aerosols can act as INPs in the clean marine atmosphere. Mansour et al. (2020b) showed that nINP over the North Atlantic Ocean follows the patterns of marine biological activity as traced by surface CHL concentration. The relationship between INPs and phytoplankton biomass, traced by CHL concentration, was investigated. Samples clearly influenced by land inputs were excluded so as to focus only on INPs potentially originating from the sea. The DFPC dataset was chosen for this analysis since it provides a higher time resolution than the WT-CRAFT one and allows differentiation between fine and coarse INPs. Assuming that each set of daily DFPC samples represents a day enabled us to compare to the daily CHL time series. The Pearson correlation coefficients between INPs and satellite-derived ocean color data, obtained by standard least squares regression, were computed at each grid point of the Arctic domain for different time lags to obtain the correlation maps presented in the Results section.
2.3.6 Concentration-weighted trajectory
The allocation of regional source areas potentially affecting nINPs sampled at GVB was achieved by applying the concentration-weighted trajectory (CWT) model (Hsu et al., 2003; Jeong et al., 2011). In this procedure, each grid cell within the studied domain is associated with a weighted concentration, which is a measure of the source strength of a grid cell with respect to concentrations observed at the sampling site. The average weighted concentration in the grid cell (ij) is determined by Eq. (3).
where t is the index of the trajectory, L is the total number of trajectories (5 d – hourly time step), nINPt is the concentration observed at sampling location (receptor site) on arrival of trajectory t, and Dijt is the residence time (time spent) of trajectory t in the grid cell (ij). Given nINPt, Dijt can be determined by counting the number of hourly trajectory segment endpoints in each grid cell for each trajectory. This was repeated for all the back-trajectories L. A high value for CWTij means that air parcels traveling over the grid cell (ij) would on average be associated with elevated concentrations at the receptor site.
In this study, 5 d low (<500 m) air mass back-trajectories were used to produce the CWT spatial distribution corresponding to the DFPC summer campaign. The DFPC summer dataset was selected for consistency with the correlation analysis presented in the previous section. Two trajectories per day were associated with the corresponding nINP of the day. Similarly to the correlation analysis, the INP samples clearly influenced by passage over land were excluded to focus on marine sources. The selected domain extends up to the limits of the area covered by the above-mentioned low back-trajectories (48–85∘ N and 75∘ W–42∘ E) and was divided into 1∘ × 3∘ latitude–longitude grid cells (1443 cells, 308 cells with at least one trajectory endpoint). To reduce the impact of grid cells containing a low number of endpoints, making CWT calculation statistically less robust, the CWT values were multiplied by a weighting factor (Wij) according to Eq. (4).
and
The introduction of the weighing factor reduces the number of cells considered to 203.
2.4 Statistical data treatment
In this study, linear relationships between measured ambient variables were tested by the Pearson correlation method. Regressions with correlation coefficients® overpassing the critical threshold for a confidence interval of 95 % (p<0.05) were considered statistically significant. The tables detailing the correlation analyses also report non-statistically significant R values but exclude the R values with a confidence interval lower than 80 %. The results of the correlation analyses are presented along with the confidence level (p<) and the number of data points (n). The statistical significance of differences between datasets was tested using the standard t test. Since a subset of our measured data was not normally distributed, we complemented each t test by also performing the non-parametric Wilcoxon–Mann–Whitney test, which does not require normally distributed data. Outcomes were considered statistically significant only if the two tests provided consistent results.
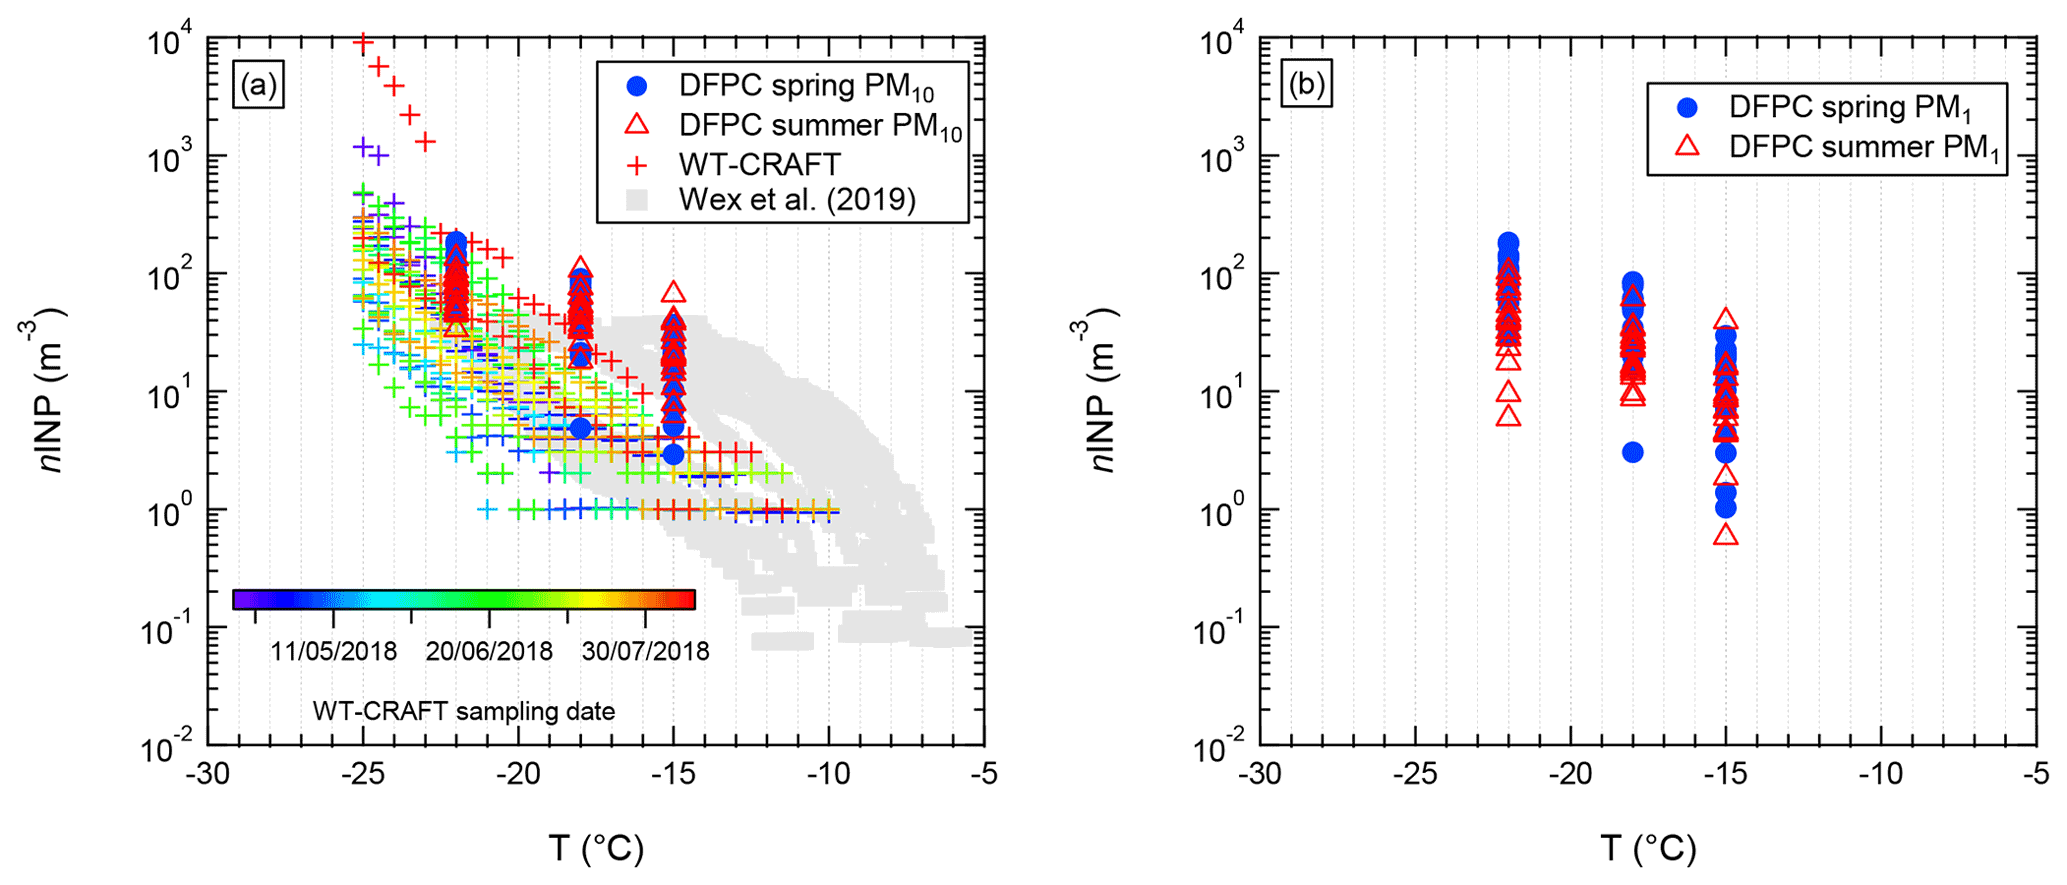
Figure 2Ambient nINP as a function of the activation T assessed for samples from GVB during 2018 by DFPC and WT-CRAFT. DFPC data are divided into spring (blue) and summer (red) samples, while WT-CRAFT data are color-coded according to the sampling date. (a) PM10 (DFPC) and TSP (WT-CRAFT) data. (b) PM1 data (available only for DFPC). For comparison purposes, the data from Wex et al. (2019b), which refer to PM10 samples, are also reported in panel (a) (Wex et al. (2019a).
3.1 INP atmospheric concentration
Figure 2 shows the overall nINP range measured for aerosol particle samples from the GBV station in spring–summer 2018. While both datasets show reasonable agreement for nINP at −22 ∘C, a notable offset was observed between the two techniques in other activation temperatures. Specifically, nINP measured in condensation mode (DFPC) was generally higher than that measured in immersion mode (WT-CRAFT), the deviation becoming even more apparent at higher T. On average, nINPDFPC was 3 times higher than nINPWT-CRAFT at −22 ∘C and 8 times higher at −15 ∘C. Thus, the WT-CRAFT ice nucleation spectra presented a steeper ΔnINP/ΔT slope than DFPC.
DFPC-measured nINP values (PM10 size range) from GVB during the spring campaign ranged 55–185 (median 115), 5–90 (53) and 3–37 (20) m−3 for T of −22, −18 and −15 ∘C, respectively. During the summer campaign, nINP ranges were 33–135 (median 77), 18–107 (45) and 6–66 (20) m−3 for the same Ts (Fig. 2). The WT-CRAFT analysis found no ice nucleation activity above −9 ∘C in our GVB samples. In the T range between −9 and −14 ∘C, a subset of the samples (1 sample at T of −9 ∘C and 13 at T of −13.5 ∘C, over 28 total samples) presented nINP above the detection limit (>3 m−3). In the rest of the T spectrum, nINP ranged from 1 to 3 (median 2) m−3 at −14 ∘C and from 24 to 9082 (166) m−3 at −25 ∘C.
A compilation of nINP values from previous ground-level observations at various Arctic stations can be found in Table 1. The range of nINP from Table 1 is roughly between 10−2 and 103 m−3 in the T range between −9 and −25 ∘C, in which we detected ice nucleation activity in our samples. This nINP range covers the majority of our measurements. It should be noted that comparison with these past studies is only qualitative given the great variability of parameters that may influence nINP (e.g., different instruments, locations, season, weather conditions, aerosol particle size distribution, ice nucleation mode). Nonetheless, both the DFPC and WT-CRAFT datasets overlap fairly consistently with the nINP results reported by Wex et al. (2019b) for samples taken at the same station in 2012 (Fig. 2). While the comparison between our datasets and those of Wex et al. (2019b) is also qualitative, since the two studies examined different aerosol particles collected in different years, we found several interesting agreements and discrepancies. First, while Wex et al. (2019b) report a very narrow concentration range (27–33 m−3) at −22 ∘C, having only three samples, our 61 DFPC plus WT-CRAFT data points span a much wider range (ca. 3–200 m−3). The upper limit of observable nINP in Wex et al. (2019b) was roughly 40 m−3, depending on the volume of air sampled on the filters analyzed. Conversely, the data ranges are in good agreement for Ts over −18 to −15 ∘C. Finally, the data from Wex et al. (2019b) span a wider range (ca. 10−1–10 m−3) than those of WT-CRAFT (1–3 m−3) for ∘C. The difference in nINP towards a lower bound is due to different sensitivities and detection limits of the two methods: WT-CRAFT (ca. 1 m−3) and the immersion freezing measurement technique used by Wex et al. (2019b, ca. 10−1 m−3).
Table 2Average (± standard error) and median (in parentheses) nINP measured at GVB during 2018. The min–max range is also reported besides the median value. “dl” indicates nINP below the detection limit. The reported statistics refer to 16, 17, 11 and 17 samples for DFPC in spring, DFPC in summer, WT-CRAFT in spring and WT-CRAFT in summer, respectively.
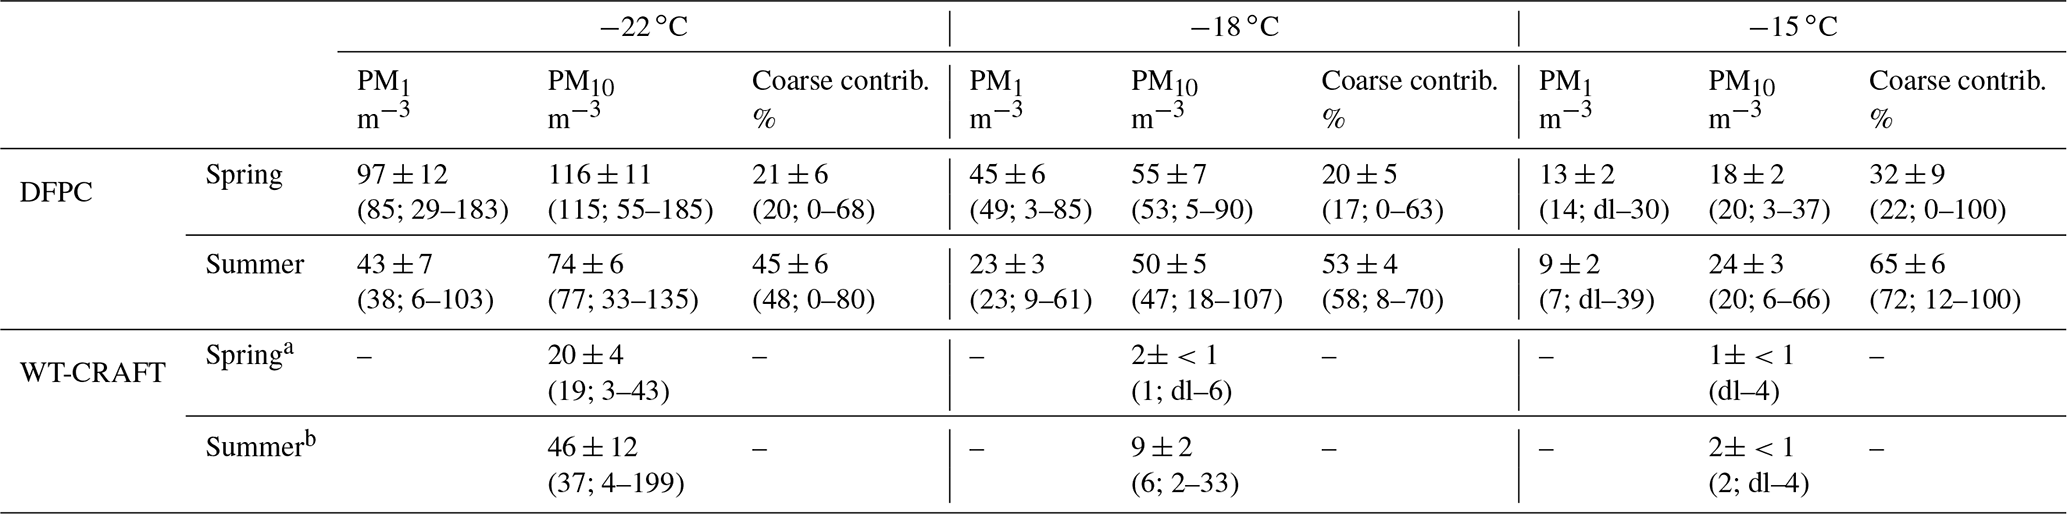
a 16 April–3 June 2018; b 3 June–15 August 2018.
3.2 Contribution of fine and coarse INPs
The sampling strategy applied for DFPC measurements allowed us to investigate fine (<1 µm) and coarse (> 1 µm) INPs. Table 2 reports the number concentrations of INPs measured in the two different size ranges, together with the average contribution of super-micrometer (coarse) INPs, derived by difference. The scatterplots of nINP vs. nINP are given in Fig. S1. Our spring campaign data are characterized by scant coarse INPs (∼20 %), suggesting that most INPs may be fine-mode aerosol particles transported for long distances, with consequent depletion of the largest particles during transport due to their higher gravitational deposition velocities (Shaw, 1995; Heidam et al., 1999; Stohl, 2006). During the summer campaign, a statistically significant increase in the contribution of coarse INPs was observed (i.e., 65 % at ∘C; p<0.05), potentially resulting from the contribution of locally emitted aerosol particles (see Sect. 3.6), in part from the surface exposed to the air once snow and ice had melted. The same trend is inferred by the particle size distribution measurements, which show a significant enhancement of coarse particle contribution in summer compared to springtime (Fig. S2; p<0.05, n1>103; n2>103). The increase in the coarse INP contribution, from spring to summertime, is progressively more pronounced with increasing activation T. An INP population similar to summer values at GVB, with a significant coarse fraction contribution, was reported by Mason et al. (2016) from the Alert Arctic station. The authors conducted INP measurements from 29 March to 23 July 2014 and observed an increasing contribution of coarse INPs as a function of the activation T. It is important to note that our results are unique compared to past studies as our measurements and data support the increase in coarse INP contribution during the meteorological season transition from spring to summer with increasing activation T.
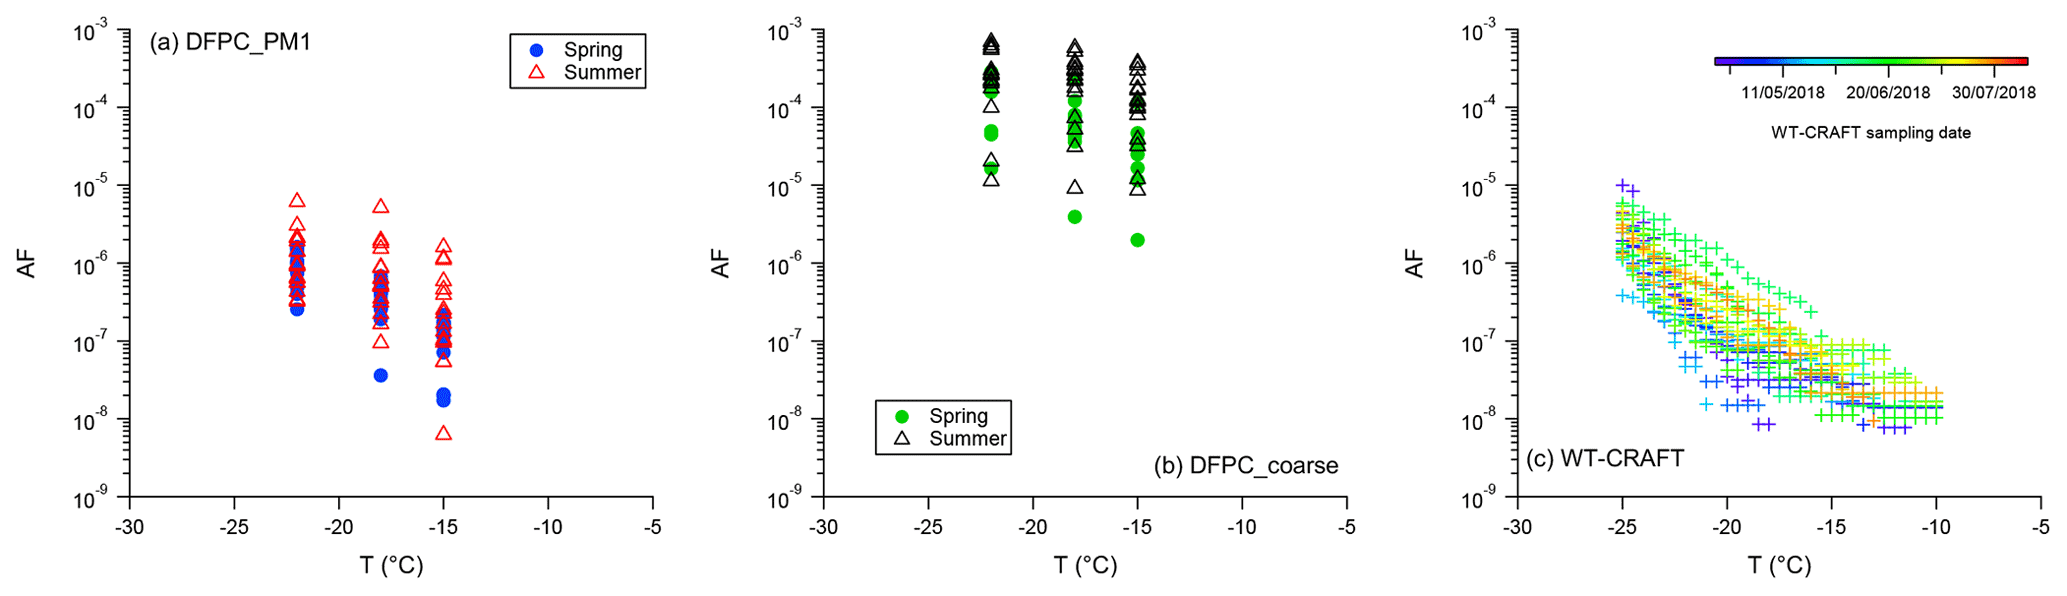
Figure 3AF as a function of T assessed for samples from GVB during 2018 by DFPC in the sub-micrometer (a) and coarse (b) size ranges and by WT-CRAFT (c). Particle size ranges used to calculate AF are 0.1–1, 0.1–10 and 0.1–10 µm for the DFPC PM1, DFPC PM10 and WT-CRAFT samples, respectively.
3.3 Aerosol particle AF
Figure 3 presents aerosol particles AF as a function of T derived from DFPC and WT-CRAFT data. For DFPC (PM10 size range), AF ranged from to in the T range examined. Likewise, the AF range of WT-CRAFT was from (minimum value observed at T of −10 ∘C) to (maximum value observed at T of −25 ∘C). The seasonal evolution of the aerosol particle AF is discussed in detail in the following section (Sect. 3.4).
Examining the size-segregated DFPC data (Fig. 3a and b), substantially higher ice nucleation efficiencies were found in coarse compared to sub-micrometer particles. The enhanced AF of coarse particles is due to the significantly lower number of particles in the 1–10 µm compared to 0.1–1 µm size ranges (about 2 orders of magnitude), coupled with the comparable nINP observed in both size ranges (see Sect. 3.2). As a result, the AF of coarse particles was more than 2 orders of magnitude greater than that of fine particles. In other words, the AF for coarse particles was estimated to be on the order of 10−6 to 10−3 at Ts between −18 and −22 ∘C, while the AF of sub-micrometer particles was on the order of 10−8 to 10−5 at the same Ts.
Si et al. (2018) and Creamean et al. (2018) also reported a higher ice nucleation efficiency for super-micrometer particles sampled at Arctic stations compared to the sub-micrometer range. Their papers cover the INP data collected in both summertime (Si et al., 2018) and springtime (Creamean et al., 2018). In particular, Si et al. (2018) reported average AF at −25 ∘C of , and for the 0.56–1.0, 3.2–5.6 and 5.6–10 µm size ranges, respectively.
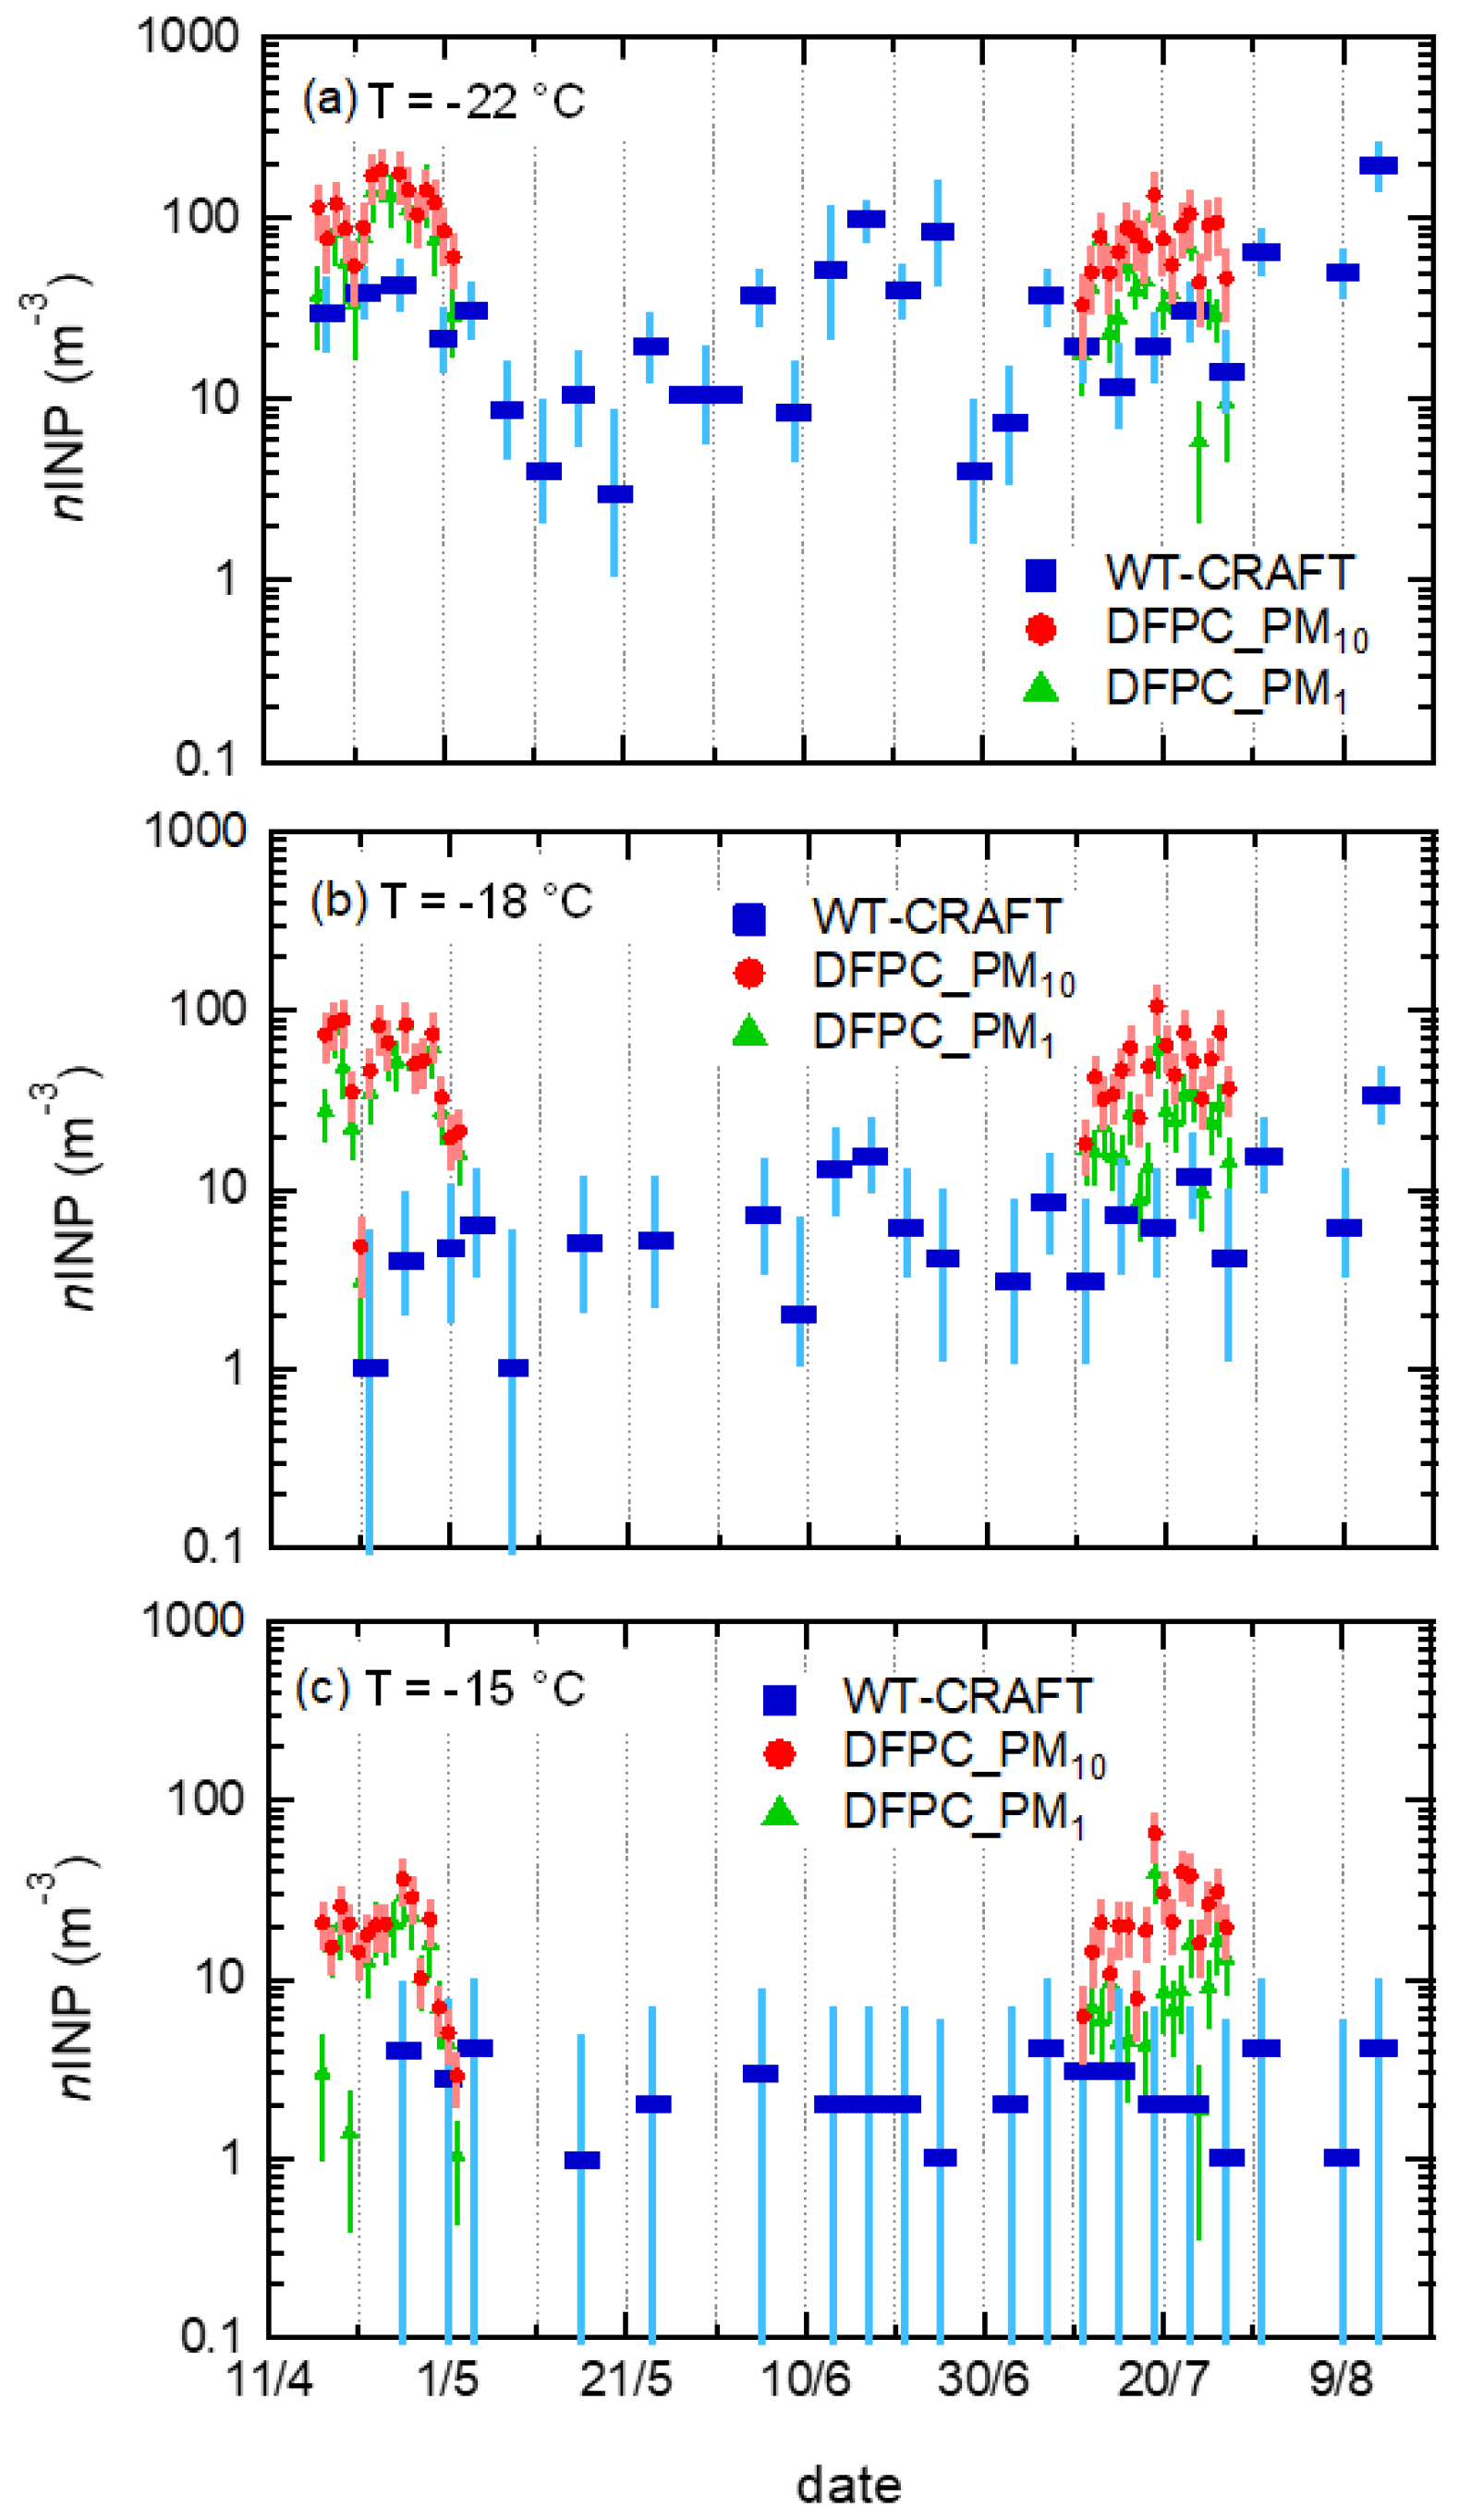
Figure 4Time series of nINP at GVB during 2018 measured by DFPC (PM10 and PM1) and WT-CRAFT. Horizontal bars indicate the time span of WT-CRAFT samples (ca. 4 d for the majority of samples). Vertical bars indicate the overall measurement uncertainty as indicated in Sect. 2.2.1 (DFPC) and 2.2.2 (WT-CRAFT).
3.4 Seasonal variation in nINP and AF
The time series data in Fig. 4 do not indicate a clear seasonal increase in ambient nINP from spring to summer. For the DFPC data (PM10), a statistically significant nINP reduction (by a factor of 1.5) was found at T of −22 ∘C in the transition from the spring to the summer campaign (p<0.05; n1=16, n2=17), while no significant difference was observed for Ts of −15 and −18 ∘C.
The nINP time series measured by WT-CRAFT agrees with that of DFPC if we consider only the periods in which the two sampling activities were run in parallel: a statistically significant reduction by a factor of 1.6 is observed at −22 ∘C (p<0.05; n1=4, n2=5). On the other hand, considering the whole WT-CRAFT data, a statistically significant nINP increase in summer compared to spring was observed only for Ts between −18 and −21 ∘C (p<0.05; n1=11, n2=17). However, even in these cases, the nINP seasonal enhancement ratios (i.e., nINPINPspring) were limited to a factor of 3 at the most. Moreover, the seasonal variations observed were smaller than the range of nINP data deviations for each season. Thus, the seasonal variation in nINP from the WT-CRAFT analysis is not conclusive and should be cautiously interpreted.
A peak in nINP was observed by WT-CRAFT during June at Ts lower than ∘C (Fig. 4a and b). Of the seven samples collected in June, more than 50 % (57 %–71 %) were higher than the whole campaign median at this T range. In addition, the average nINP during June was up to ∼3 ( ∘C) times higher than the average for the rest of the observation period. As can be seen in Fig. 4a and b, the second peak of nINP was observed at the end of the WT-CRAFT measurement period, the last sample representing the highest concentrations across the Ts measured. Further discussion of the nINP–AF relationship during these specific periods is provided below.
Recent studies have reported a marked seasonal trend for nINP in the Arctic environment, with atmospheric loadings increasing from spring to summertime (Santl-Temkiv et al., 2019; Wex et al., 2019b; Tobo et al., 2019), as detailed in the Introduction. A comparison between the seasonal trends observed in this study and those reported by Wex et al. (2019b) at the same sampling location can be found in Fig. S3. The comparison supports the lower magnitude of the spring-to-summer nINP increase observed in 2018 (this study) compared to the 2012 observations (Wex et al., 2019b).

Figure 5Time series of the activated fraction at GVB during 2018 measured by DFPC (PM10 and PM1) and WT-CRAFT. Horizontal bars indicate the period of WT-CRAFT samples (ca. 4 d for the majority of samples). Vertical bars indicate the overall AF uncertainty as indicated in Sect. 2.2.1 (DFPC) and 2.2.2 (WT-CRAFT).
Both the DFPC and WT-CRAFT datasets showed a general increase in the aerosol particle AF from spring to summer as shown in Fig. 5. This increase in the AF is mainly due to a significant reduction of the particle number concentration in the 0.1–10 µm range (p<0.05; n1>103; n2>103; Fig. S4) combined with similar or slightly higher nINP (depending on the T). DFPC showed a statistically significant AF increase (p<0.05; n1=16, n2=17) going from the spring campaign to the summer period for all the probed activation Ts. The seasonal increase in the AF was more evident at higher Ts: the summer-to-spring mean ratio was 6.2 at T of −15 ∘C and 2.5 at T of −22 ∘C. Fairly consistent results can be observed in the WT-CRAFT dataset. Comparing the samples collected before 3 June with those collected after that date, an AF enhancement (from 1.1- to 3.7-fold) can be estimated for all the activation Ts. This difference was statistically significant (p<0.05, n1=11, n2=15) for all the activation Ts between −17 and −22.5 ∘C. Unlike the DFPC data, the spring-to-summer AF increase from WT-CRAFT data peaked at ∘C (3.7; Fig. S5).
The AF time series by WT-CRAFT reported in Fig. 5 reflects the increase in nINP for the month of June, as described above. This demonstrates that the nINP enhancement observed in June is due, at least in part, to enhanced ice nucleation activity of the particle population (more INP per particle number) rather than only to an increase in aerosol particle concentration. We note that AF data with WT-CRAFT are not available for August as the SMPS was down for maintenance. Thus, whether the increase in nINP detected by WT-CRAFT in August (i.e., the last two data points in Fig. 4a and b) corresponds to the enhancement of ice nucleation efficiency or an increase in the overall aerosol particle concentration remains uncertain.
3.5 Relation of nINP to meteorological parameters and particle number concentration
No clear relationship was found between nINP and the major meteorological parameters (T, pressure, RH and WS). The only exception was precipitation, which was often associated with a reduction of nINP (Fig. S6). Although nINP tends to covariate during the spring campaign, with particle number concentration in the range 0.5–10 µm, considered for consistency with deMott et al. (2010) (Pearson's R of 0.18 for INP at ∘C and 0.22 for INP at ∘C), a significant correlation (R=0.56; p<0.05, n=16) was observed only for INP at ∘C in the DFPC dataset from this season. During summer, no correlation at all was observed between nINP and particle number (R between −0.13 and −0.25). For WT-CRAFT, significant correlations were observed only for ∘C (p<0.05, n=28; R between 0.42 and 0.52). It is, however, important to note that previous studies from different regions report discrepant correlations between INP and particle number concentration. For example, a correlation is often reported with the number concentration of aerosol particles larger than 0.5 µm (deMott et al., 2010, 2015; Mason et al., 2015; Schwikowski et al., 1995). In other cases, no correlation whatsoever was found (Richardson et al., 2007; Rogers et al., 1998), which is not surprising considering that INPs are only a small fraction of total particles. Bigg (1996) reported a good correlation between nINP and accumulation-mode particles for 1 d of measurements over the high Arctic, while a modest but significant correlation (R=0.25–0.30) between nINP and particle number concentration in the 50–120 nm range was reported by Bigg and Leck (2001) close to the North Pole. To the best of our knowledge, no other paper has addressed this relation in the Arctic environment.
Table 3(a) Correlations of nINP, in PM1 and PM10 samples by DFPC, with chemical tracers during the spring campaign. Coefficients reported in italics are statistically significant at p<0.10, while those in bold are statistically significant at p<0.05. Coefficients associated with p>0.2 have not been reported. (b) Correlations of nINP, in PM1 and PM10 samples by DFPC, with chemical tracers during the summer campaign. Coefficients reported in italics are statistically significant at p<0.10, while those in bold are statistically significant at p<0.05. Coefficients associated with p>0.2 have not been reported.

3.6 INP sources in the Arctic
3.6.1 Correlation with chemical tracers
To investigate the potential sources of the INPs at GVB, a correlation analysis was performed between both nINP datasets and the atmospheric concentration of chemical tracers routinely measured at the station. During the spring campaign, nINP correlated with tracers of long-range transported anthropogenic aerosol particles such as nitrates, non-sea-salt sulfate and non-sea-salt potassium (Table 3; Figs. S7–S10). Indeed, Udisti et al. (2016) associated springtime non-sea-salt sulfate at GVB with long-range transported anthropogenic sources. The authors also showed that the production of biogenic non-sea-salt sulfate from the sea is relevant only in summertime. The springtime peak of anthropogenic aerosol transport from lower latitudes is often referred to as the Arctic haze (Shaw, 1995). A general tendency to anticorrelation with sodium and chlorine was also observed in both the size classes, though only PM1 was statistically significant (p<0.05). The only significant relations observed for the summer DFPC data were at ∘C: an anticorrelation was observed between nINP and particulate mass, sea spray tracers (sodium and chlorine) plus calcium, magnesium and lithium.
Table 4(a) Correlations of nINP by WT-CRAFT with chemical tracers during spring (April–May) 2018. Coefficients reported in italics are statistically significant at p<0.10, while those in bold are statistically significant at p<0.05. Coefficients associated with p>0.2 have not been reported. (b) Correlations of nINP by WT-CRAFT with chemical tracers during summer (June–August) 2018. Coefficients reported in italics are statistically significant at p<0.10, while those in bold are statistically significant at p<0.05. Coefficients associated with p>0.2 have not been reported.
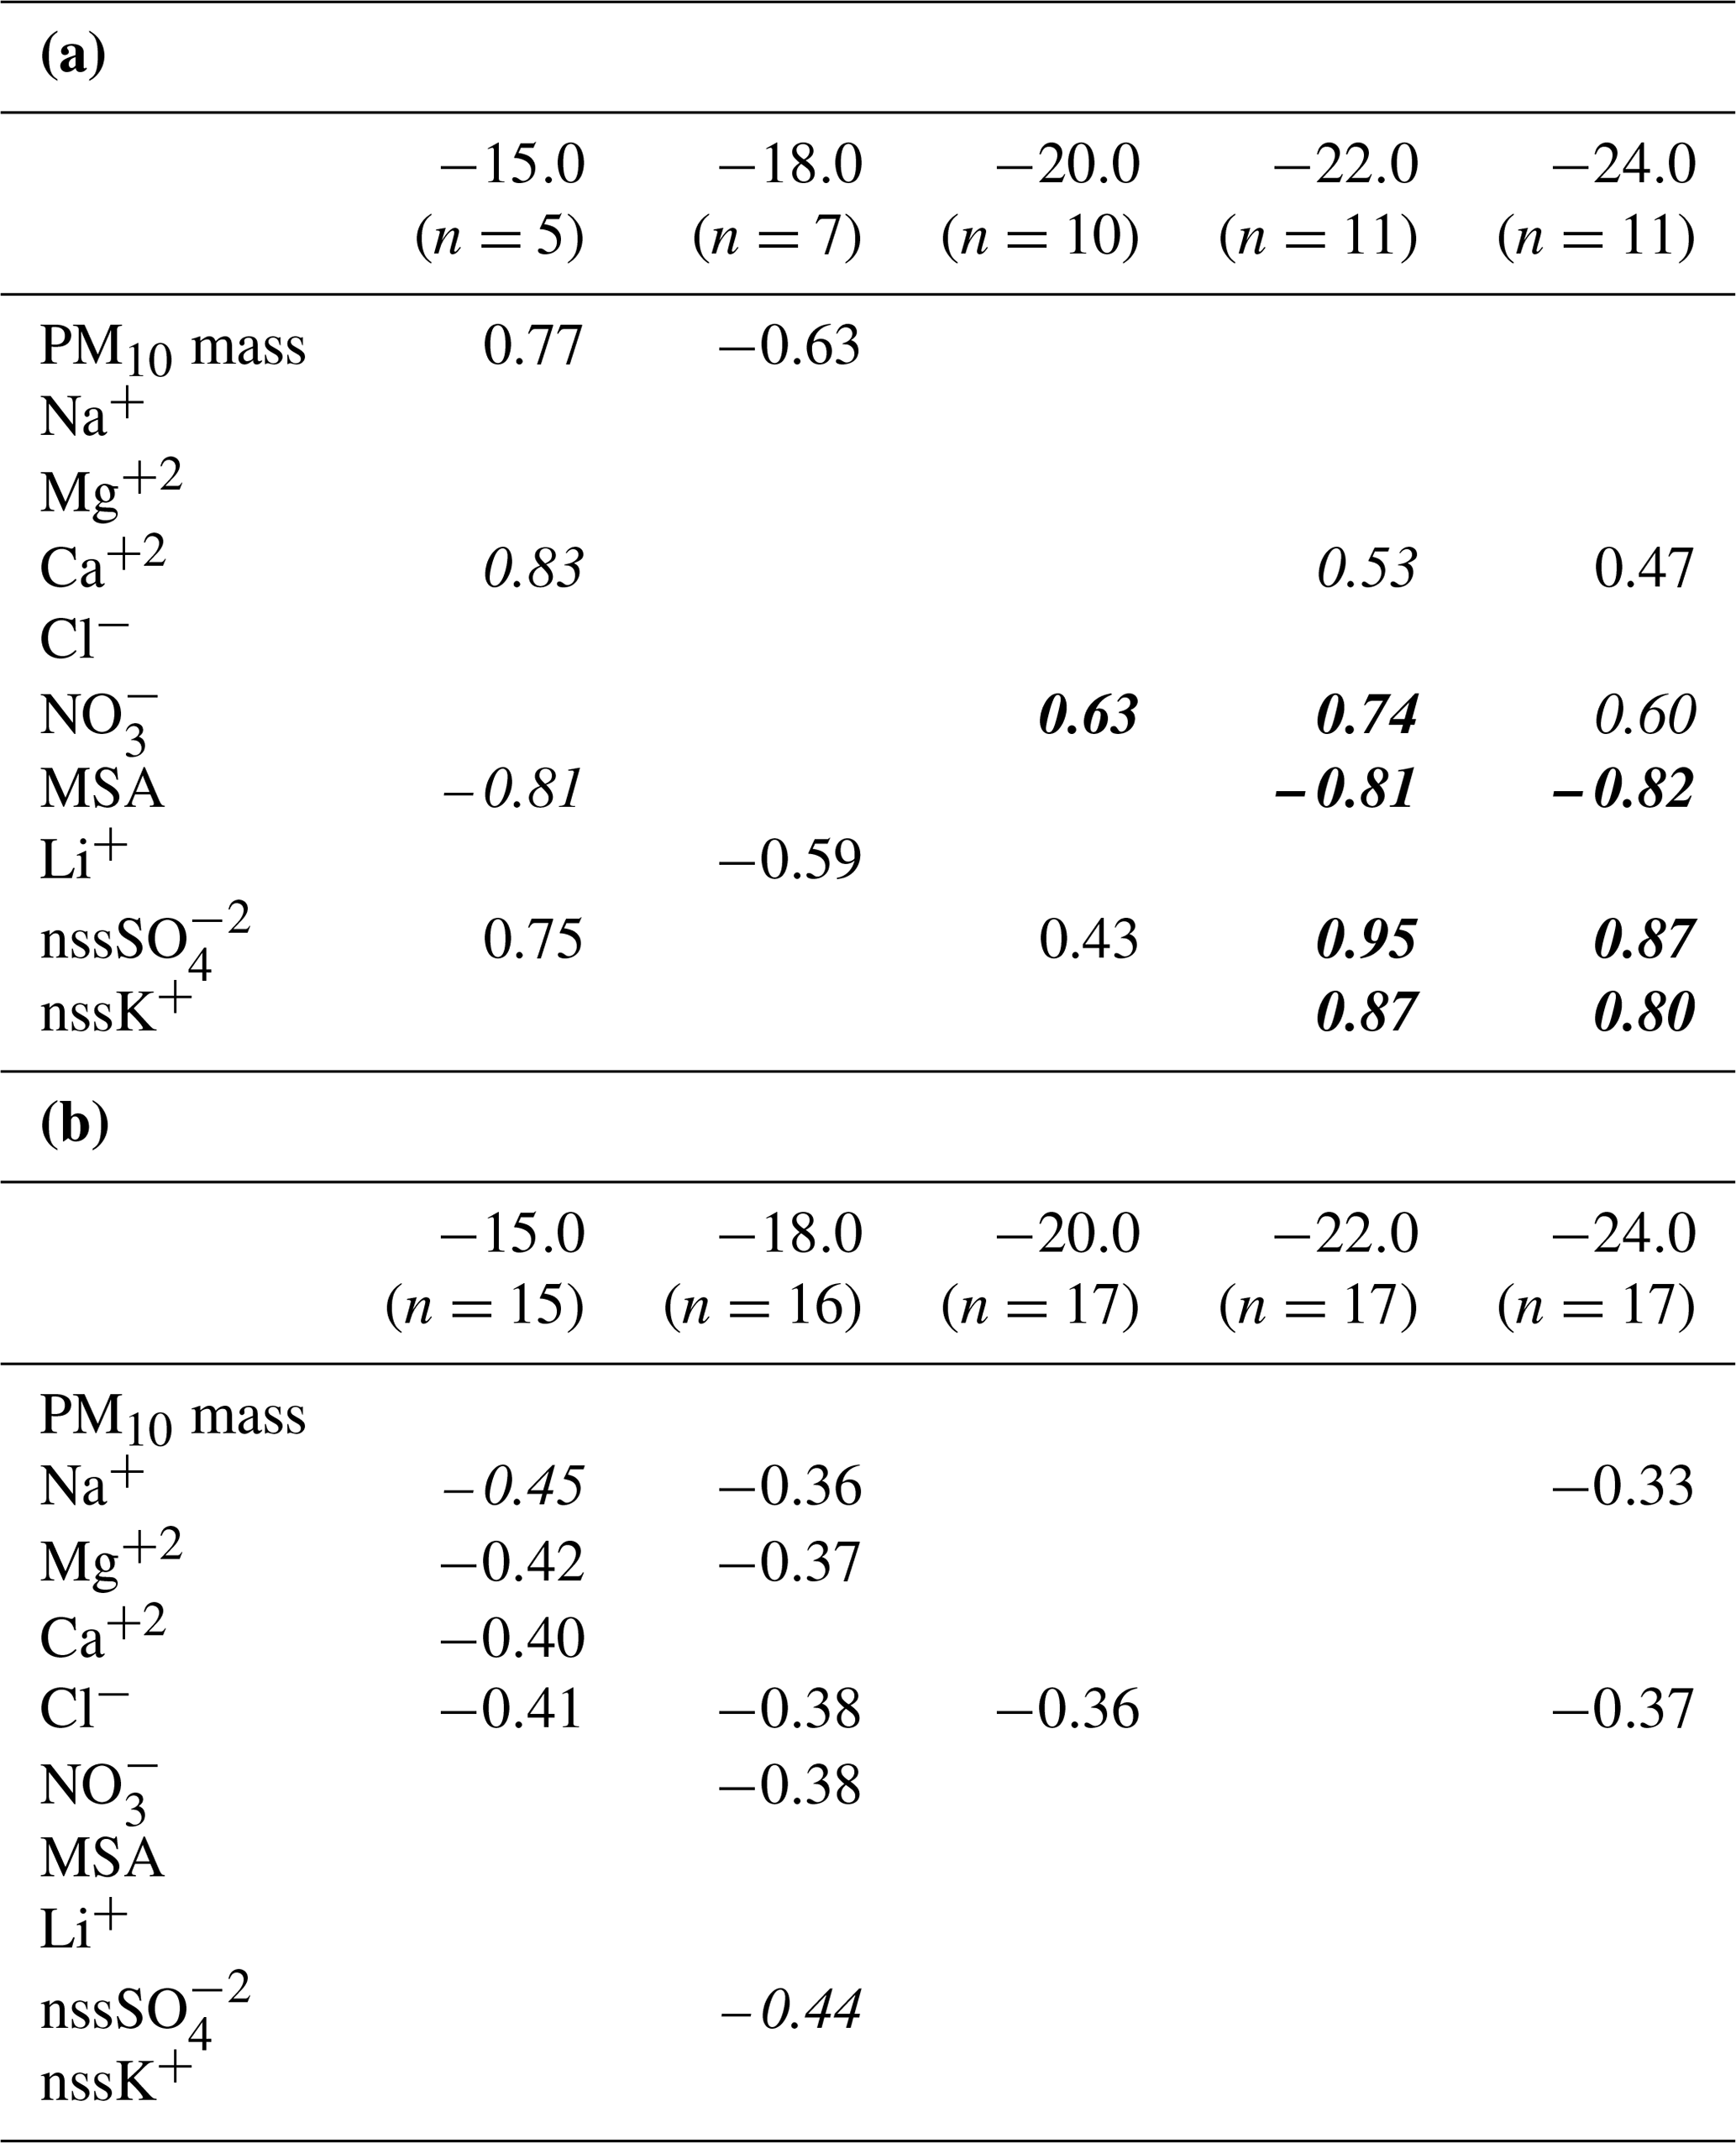
No clear source indications were derived from the correlation analysis of the WT-CRAFT data to the chemical tracers. However, analysis of seasonally categorized nINPWT-CRAFT (3 June being the demarcation date between spring and summer) provided a similar result to the DFPC data (Table 4). In short, in the spring season, nINPWT-CRAFT correlated with tracers of anthropogenic long-range transported aerosols (non-sea-salt sulfate, nitrate, non-sea-salt potassium), particularly at low activation Ts. Additionally, calcium concentration exhibited some tendency to correlate with nINP (both datasets). Our analysis was unable to determine whether this was from natural dust or other anthropogenic sources, and it is not conclusive whether it has any impact on nINP. In the summer season, no significant correlation was observed. It should be noted, however, that our tracer analysis only infers the aerosol properties, with the result that further analysis of INP identities and properties (e.g., ice crystal residual analysis) would be necessary to reveal the sources of INPs.
Table 5Correlation coefficient (R) resulting from the linear regression between nINP (at , −18 and −22 ∘C) and the contribution of the four considered ground types. Values reported in bold are statistically significant (p<0.05).

3.6.2 Influence of ground conditions
The influence of ground conditions (sea ice, snow, seawater and land) on the low-traveling back-trajectories examined (<500 m) was evaluated by merging back-trajectories and satellite ground-type data (Wex et al., 2019b). Figure 6 shows that the contribution of the four ground types considered varies with the seasons. In spring, the majority of contacts occurred with sea ice or snow-covered land, while in summer low air masses were more influenced by ice-free seawaters. The (snow-free) land contribution was the lowest in every season. Nevertheless, the influence of land sources on nINP emerges clearly from Table 5 and Fig. S11: air masses with a higher terrestrial influence have always been associated with nINP peaks. This is probably due to the higher ice nucleation efficiency of mineral dust and soil particles compared to marine biological particles (Wilson et al., 2015; McCluskey et al., 2018a, b). In summer, contacts with snow-free land occurred mainly over the Svalbard archipelago (local sources) or over Greenland and Iceland (regional sources), as shown in Fig. 6.
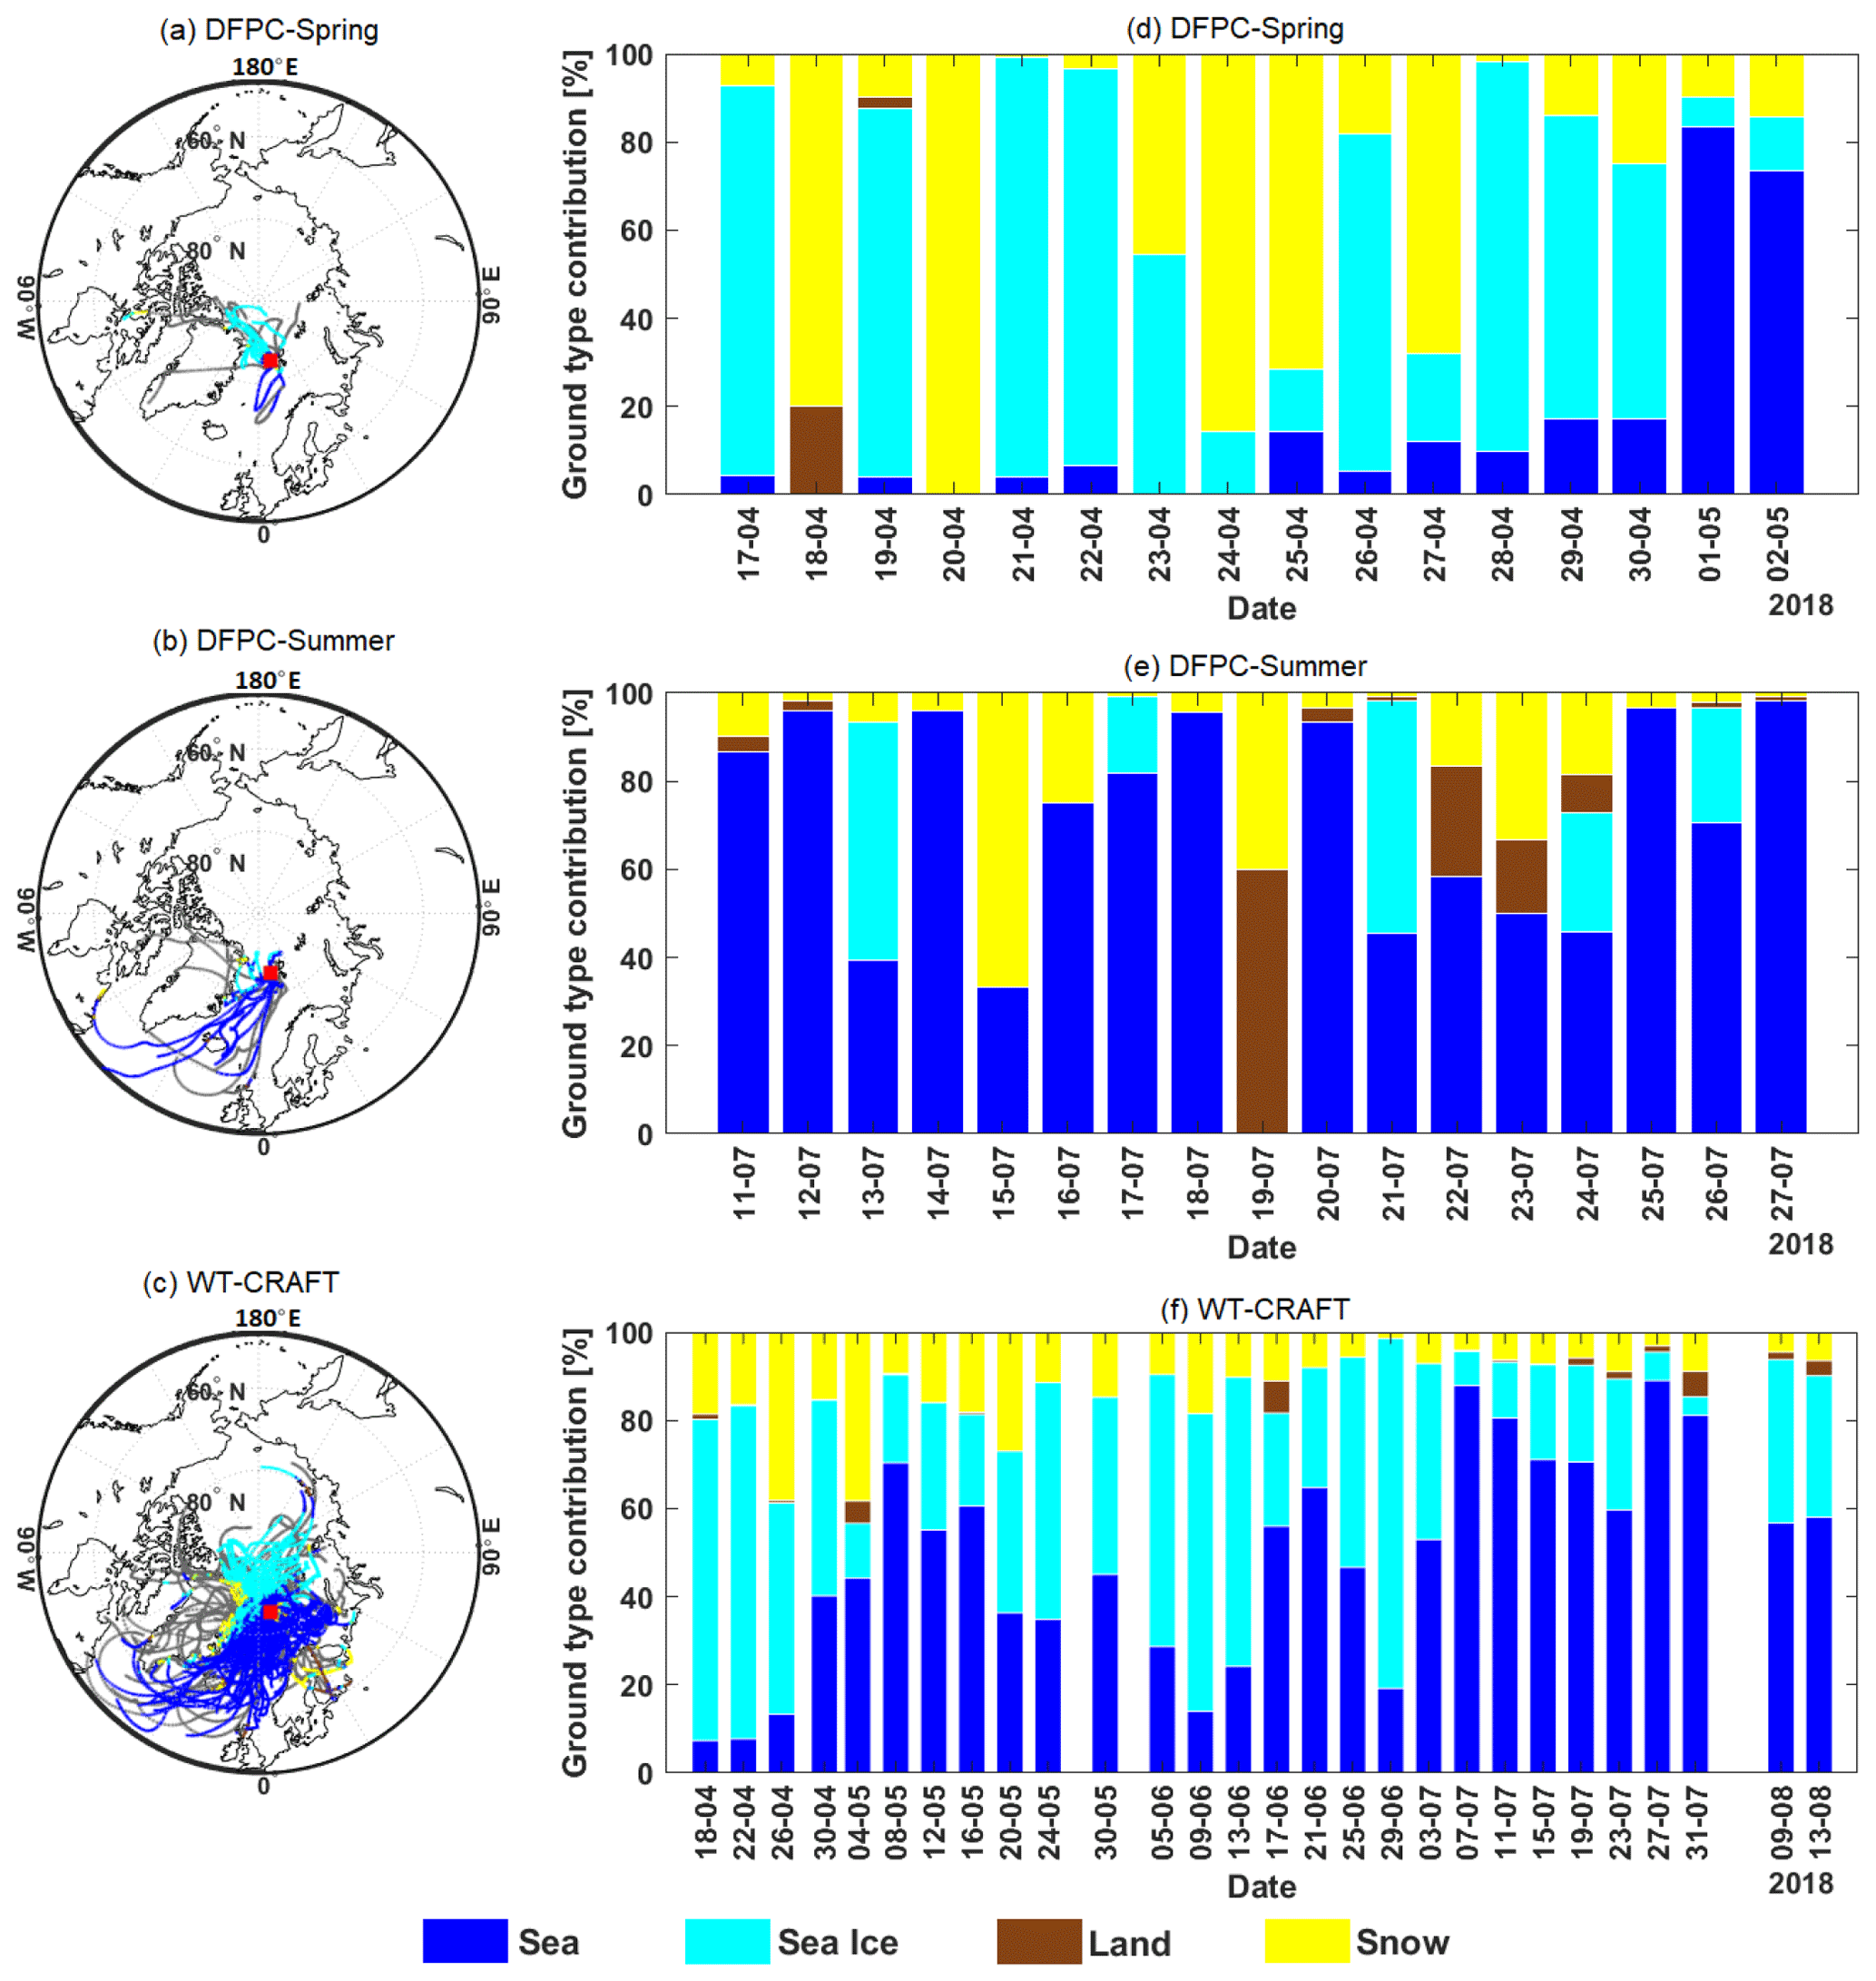
Figure 6Air mass back-trajectories and ground-type influence on low-traveling (<500 m) air masses for DFPC in spring (a), DFPC in summer (b) and WT-CRAFT (c) measurements. Back-trajectories reported in grey in the maps passed above 500 m a.m.s.l. and were therefore excluded from the analysis. The ground-type categories are described in Sect. 2.3.4.
3.6.3 Contribution of marine biological INP sources
Considering that the sampled air masses had ground contacts mainly over seawater during summer, one may surmise that marine biological sources dominate nINP at GVB in this season, outside the occasional periods of elevated terrestrial influence. To check this hypothesis, we investigated the spatiotemporal correlation of the INP datasets with satellite-retrieved surface CHL, used as a tracer for marine biological activity, following the time-lag approach first introduced by Rinaldi et al. (2013). The DFPC dataset was selected for this analysis because it provides a higher time resolution than the WT-CRAFT data and, most of all, because it allows a distinction between fine and coarse INPs. In fact, both McCluskey et al. (2018b) and Mansour et al. (2020b) have shown that fine INPs tend to correlate better with CHL in clean marine air masses. To exclude interferences from land sources, we screened the samples corresponding to back-trajectories that had been in contact with land for more than 10 % of the time (three samples) from the entire dataset. Furthermore, we focused on INP PM1 data obtained at T of −15 ∘C, which were expected to be the most representative of ice nucleation by biological particles and less influenced by mineral particles (Kanji et al., 2017).

Figure 7Correlation maps for nINP at ∘C with (left) 6, (center) 14 and (right) 16 d time lags. The color scale indicates the correlation coefficient; not significant (p>0.05) pixels are reported in grey. The green, purple and orange boxes highlight sea regions characterized by high correlation at 6, 14 and 16 d, respectively.
The results of the correlation analysis are reported in Fig. 7 in the form of correlation maps. Here, the color of each pixel represents the correlation coefficient (R) resulting from the linear regression between the CHL concentration in that pixel and nINP measured at GVB. Different maps were obtained by considering different time lags between the two correlated time series, i.e., by considering CHL concentration values shifted back 1 to 27 d with respect to the INP filter sampling times (the maps are shown in Fig. S12). The time-lag approach has been demonstrated to maximize the correlation between in situ coastal measurements of aerosol properties and CHL concentration fields (Rinaldi et al., 2013; Mansour et al., 2020a, b); it reflects the timescale of the biochemical processes responsible for the production of transferable organic matter in the seawater after the phytoplankton growing phase tracked by CHL patterns. Sea regions characterized by high correlation (red dots in the maps) are potentially related to the emission of biological particles acting as INPs in our samples. Figure 7 reports three examples of correlation maps, with time lags of 6, 14 and 16 d. The maps in Fig. 7 were selected as they clearly show high correlation regions in the seawaters surrounding the Svalbard archipelago (time lag 6 d), close to the Greenland coast (time lags 14 and 16 d) and to the northeast of Iceland (time lag 16 d). These regions were all consistently located upwind of GVB during the sampling period (Fig. 6). All the maps obtained are available in the Supplement, including those obtained with PM10 INP data, which as expected do not show any significant correlation with CHL (Fig. S13). Considerations on the robustness of the correlation maps can be found in the Supplement (Sect. S1 and Figs. S14–S16). In our interpretation, the lack of a correlation between surface CHL concentration and coarse INPs does exclude the potential of the ocean surface to be a source of super-micrometer INPs. Rather, it simply shows that CHL is not the appropriate proxy to track the emission of large biological INPs from the oceans. Indeed, while CHL has previously been observed to correlate with the enrichment of organic matter in sub-micrometer sea spray (Rinaldi et al., 2013; O'Dowd et al., 2015), no investigation has ever been attempted with super-micrometer particles. In a laboratory-controlled setting, McCluskey et al. (2017) showed the production of both sub- and super-micrometer INPs (active at −22 ∘C) from controlled algal blooms, pointing out that different particle types and production mechanisms are involved. However, the possible relationship and time lag between chlorophyll production and sea spray aerosol generation in the atmosphere and subsequent ambient INP identification from the chlorophyll source are still under debate since the question involves complex processes over an ocean–atmospheric interface on a wide spatiotemporal scale (Crocker et al., 2020; Wolf et al., 2020; Mansour et al., 2020b).
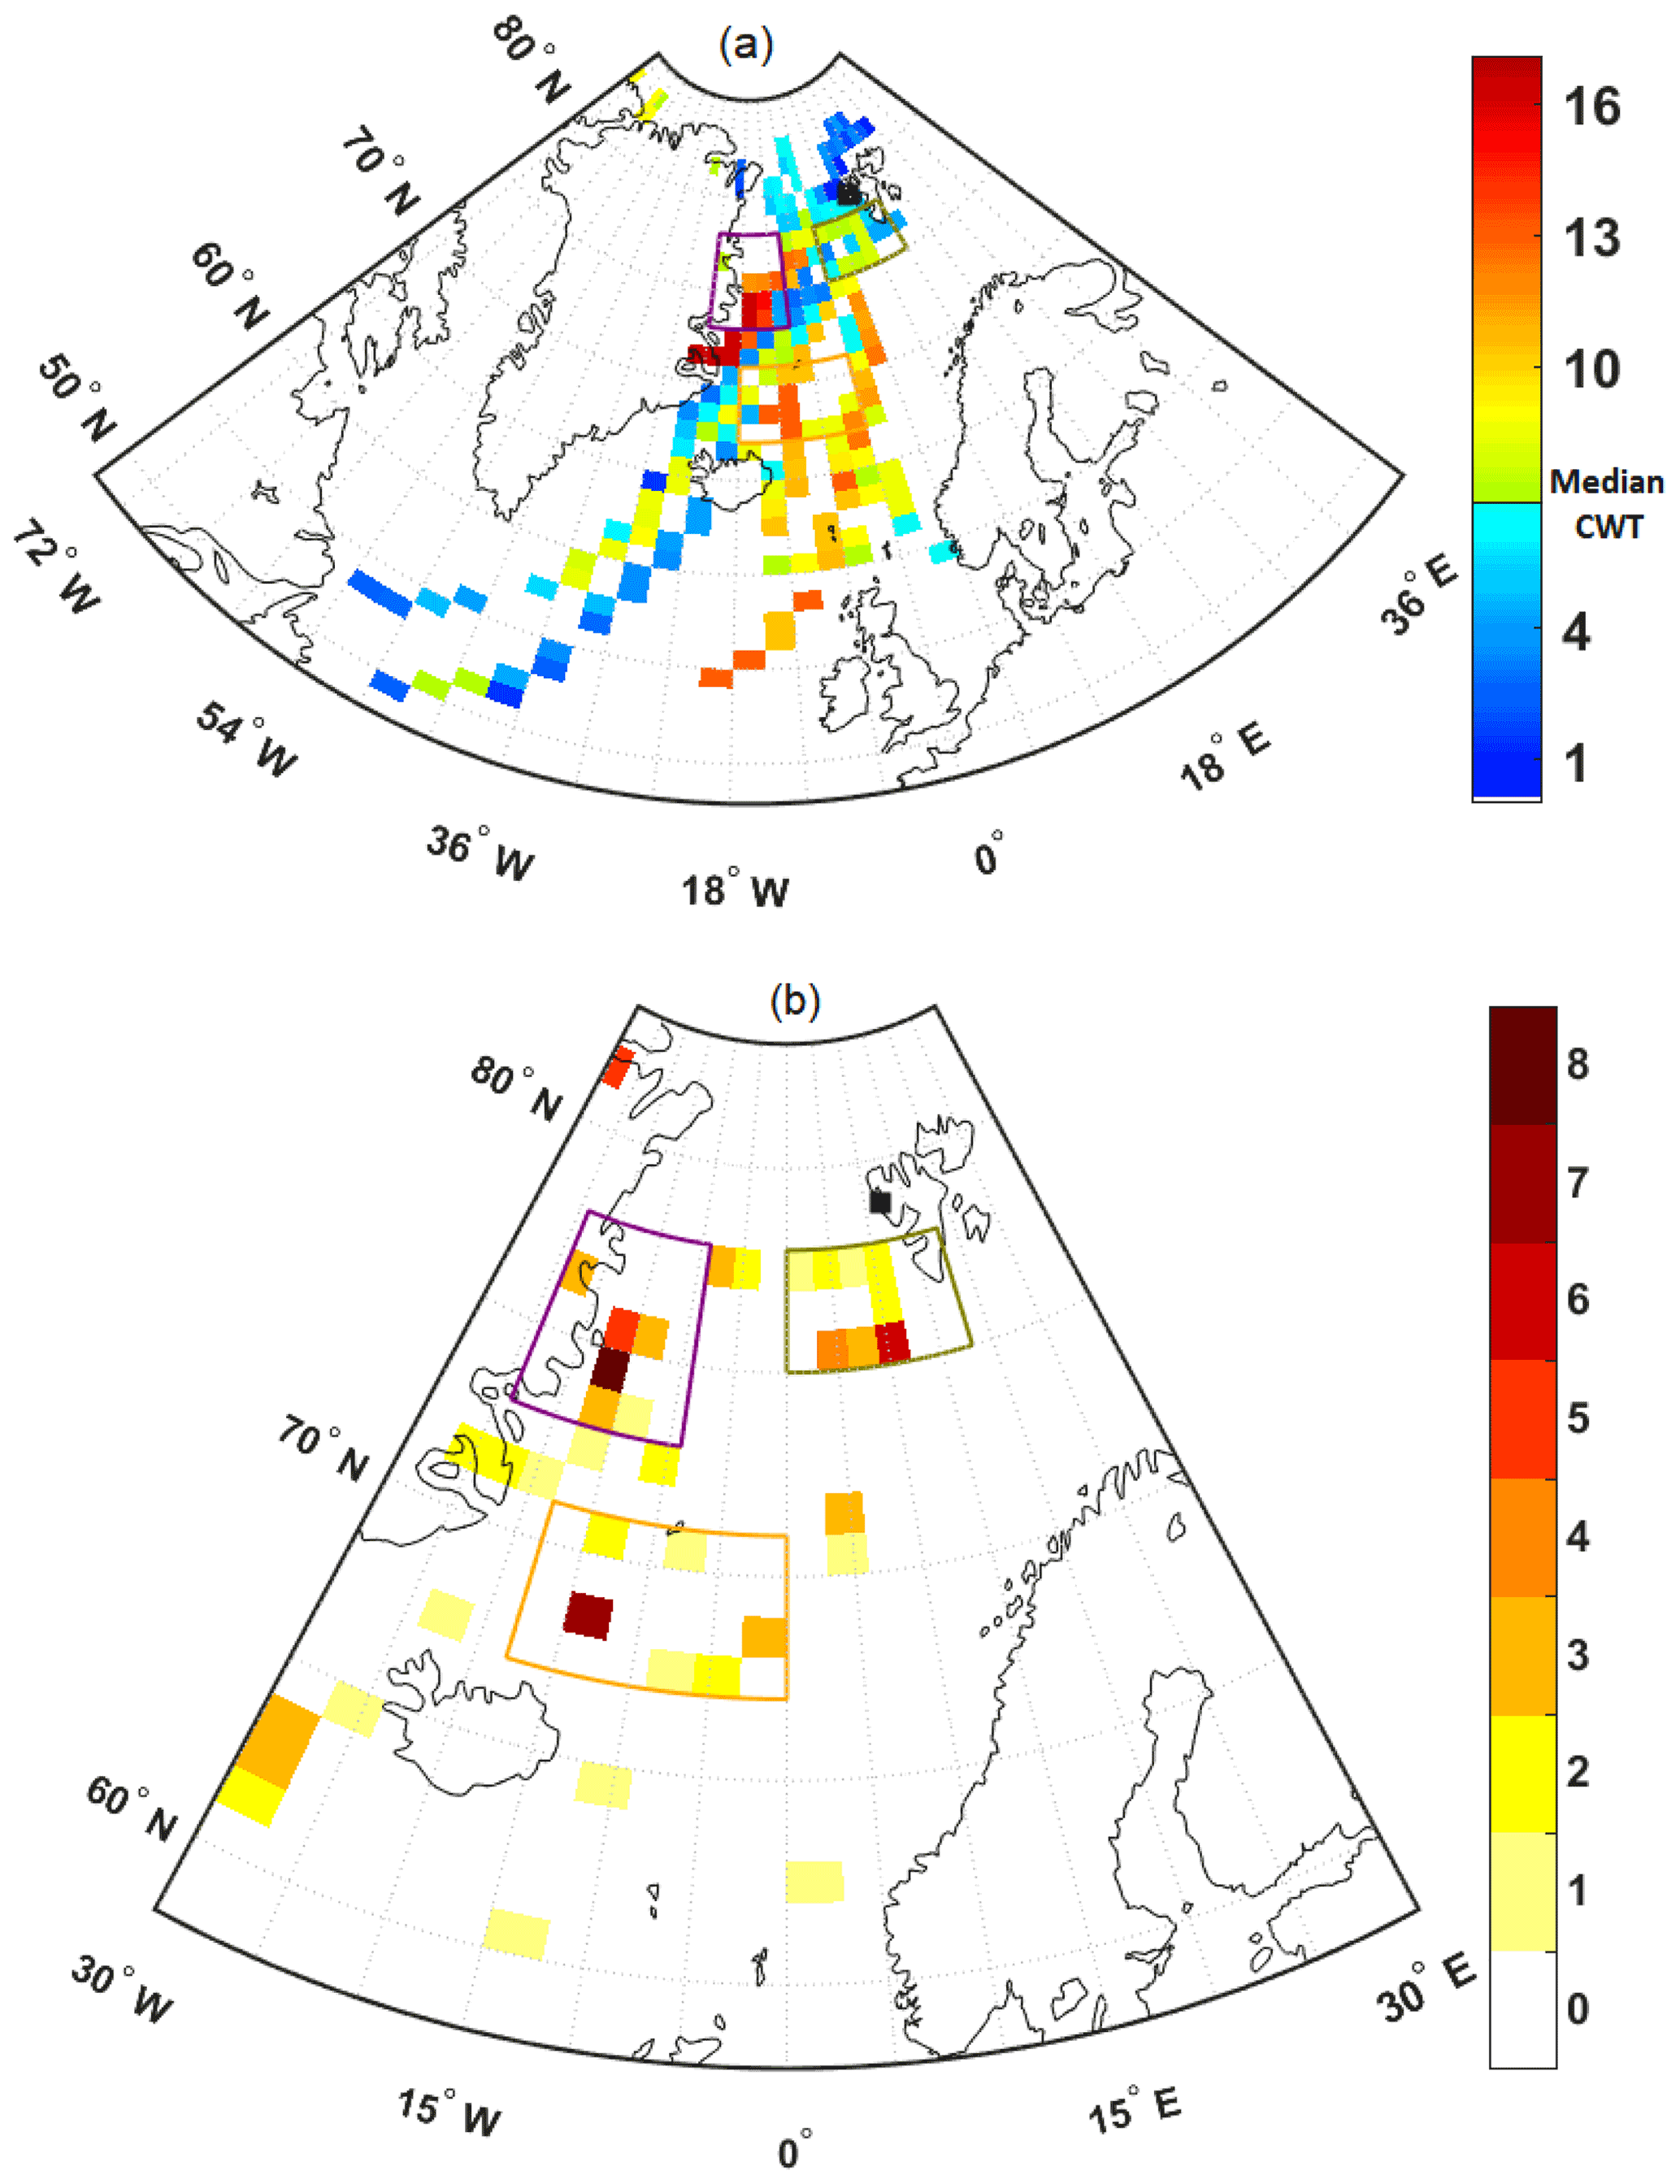
Figure 8(a) CWT source map for the nINP at ∘C dataset. The color scale indicates the CWT value. (b) Spatial distribution of fine INP sources identified by merging the results of the spatiotemporal correlation analysis and of the CWT algorithm. The color scale reflects how many times a given pixel has a CWT ≥ median and significant correlation coefficient by running time lags from 5 to 20 d. The same purple, green and orange boxes of Fig. 7 are reported to facilitate the comparison.
Since our correlations alone could not ascertain a cause–effect relation, we also ran the CWT spatial source attribution model on the same INP dataset (DFPC; PM1; ∘C; no land-influenced samples). The resulting map (Fig. 8a), composed of 203 cells over the selected domain, shows that potential sub-micrometer INP sources at GVB during the summer period were broadly located in the same sea regions previously highlighted by the spatiotemporal correlation with CHL. To facilitate the comparison between spatiotemporal correlation maps and the CWT results, we showed every pixel with both a CWT value above the median and a significant positive correlation between nINP and surface CHL, considering every delay time between 5 and 20 d (Fig. 8b). The analysis showed the sea regions close to Svalbard and immediately east of Greenland. Our results suggest that they may have been involved in the emission of biogenic INPs sampled at GVB, outside the major episodes of terrestrial influence. The combined analysis also suggests that the region in the northeast of Iceland may also be a potential INP source area even though the spatial distribution of the pixels shown is more scattered and, therefore, less convincing.
4.1 Interpretation of the discrepancy between nINPDFPC and nINPWT-CRAFT
Several factors may be responsible for the discrepancy observed between the DFPC and WT-CRAFT data. These factors include (1) measurement uncertainties, (2) sampling apparatus, (3) sample storage protocols, (4) substrate types, (5) sampling durations and (6) ice nucleation paths (condensation vs. immersion freezing). The difference (nINPDFPC>nINPWT-CRAFT) reported in Sect. 3.1 may therefore derive from a combination of these factors.
The uncertainties of individual ice nucleation measurements cannot entirely explain the discrepancy observed. Even considering the largest error contribution, uncertainties can on average explain up to 50 %, 66 % and 76 % of the observed nINP offset at −18, −22 and −15 ∘C, respectively. These percentages were calculated by assuming that the measurement uncertainties combined with each other to determine the maximum possible reduction of nINP difference (i.e., assuming the maximum possible underestimation of nINPDFPC and the maximum overestimation of nINPWT-CRAFT) and considering only periods of parallel sampling (to minimize sources of discrepancy unrelated to measurement uncertainty).
A difference in the size-dependent collection efficiency of the two aerosol particle samplers may have contributed to some extent to the nINP offset. The PM1 and PM10 sampling inlet systems used for DFPC are certified with 100 % collection efficiency at the flow rates employed. Similarly, the collection efficiency of sub-micrometer aerosol particles (tested using 200–300 nm mode test mineral dust particles) through the 47 mm filter sampler for WT-CRAFT is virtually 100 %. For super-micrometer population, sampling efficiency falls to ∼70 % (tested with 2–3 µm test fibrous particles), presumably because the test particles stack inside the sampler inlet and/or a filter holder wall. Based on these considerations, we cannot rule out the impact of particle losses on nINPWT-CRAFT and the resultant deviation from nINPDFPC, especially under the conditions where super-micrometer INPs prevail (i.e., up to 32 % and 65 % at −15 ∘C in spring and summer, respectively, as shown in Table 2). If this collection size difference were a dominant factor, the expected gap would be different in the summer season, when super-micrometer aerosol particles are more abundant than in spring. However, Figs. 2–4 show no systematic spring-to-summer increase in the deviation between nINPWT-CRAFT and nINPDFPC.
Another factor could be the difference in the substrates used and their pore sizes (nitrocellulose and track-etched membranes with 0.45 and 0.2 µm pore sizes, respectively; see Sects. 2.1). While we cannot rule out the possibility that DFPC misses ice nucleation active aerosol particles in the size range between 0.2 and 0.45 µm, this difference might not substantially contribute to the gap as nINPDFPC is generally higher than nINPWT-CRAFT.
The difference in sampling durations (∼4 h for the DFPC and ∼4 d for WT-CRAFT) is another concern. Although we cannot exclude the possibility that short episodes of high INP-containing air masses increased nINPDFPC, it is unlikely that this factor can explain the systematic difference we are discussing here. This would presume a strong nINP daily trend with the peak values coinciding with the DFPC sampling time. We excluded this by analyzing the daily evolution of the particle number concentration, which presents no evident diurnal trend either in spring or summer (not shown). Similarly, the difference in sample storing methods cannot be the sole factor to explain the discrepancy. Beall et al. (2020) recently reported a decrease in nINP of precipitation samples up to approximately 42 % at −17 ∘C ∘C due to different sample storing methods. As we kept the samples for DFPC at room air T (and the WT-CRAFT samples at 4 ∘C except during transportation), INP suppression should have been more pronounced for DFPC than for WT-CRAFT. This is not supported by our observations, which showed nINPDFPC>nINPWT-CRAFT.
Different sensitivity of Arctic INPs to different ice nucleation modes may be a plausible reason to explain the different results. Indeed, in condensation-mode measurements, water vapors condense on the surface of sampled aerosol particles, possibly triggering pore condensation freezing (David et al., 2019; Wagner et al., 2016). In the case of immersion freezing measurements, pore condensation freezing is not assessable because all particles are scrubbed in the bulk suspension water and physicochemical properties of particles suspended in water may not be the same as the particles assessed by the condensation freezing method (e.g., soluble components are washed in the droplet water). The literature offers diverse results and data interpretations, showing both increase and suppression of the ice nucleation ability by soluble aerosol components (Reischel and Vali, 1975; Boose et al., 2016; Paramonov et al., 2018; Kumar et al., 2018; Whale et al., 2018). In fact, our past attempts to intercompare DFPC and WT-CRAFT measurements with different aerosol types yielded differing results. For instance, the analyses of microcrystalline and fibrous cellulose samples showed that DFPC tended to form more ice crystals than WT-CRAFT (Hiranuma et al., 2019), while the analyses of ambient continental aerosol particles collected in the Po Valley with identical sampling systems resulted in equivalent or higher ice crystal numbers in WT-CRAFT (not shown as the data are unpublished). The variations observed in measured nINP at least suggest some sensitivity of the aerosol particle type to the different ice activation modes (and vice versa). Nevertheless, more robust evidence is necessary to be conclusive regarding the influence of ice nucleation modes, which should be addressed in future studies given its scientific relevance.
Finally, we consider that our INP detection techniques are within reasonable agreement, according to the overall uncertainty of a subset of existing INP measurement techniques in a recent intercomparison study (deMott et al., 2017) and that, given the consistency of the time trends of nINPDFPC and nINPWT-CRAFT, the discrepancy observed does not affect the conclusions presented in this study.
4.2 Interpretation of seasonal variability of nINP
In 2018, we observed limited INP seasonal variation depending on the activation T. In short, only within a limited range of Ts (−18 to −21 ∘C), our nINPWT-CRAFT exhibited statistically significant yet small variations (Sect. 3.4). A similar observation of insignificant seasonal nINP trends from Ny-Ålesund has been reported by Schrod et al. (2020). The discrepancy between this current and previous studies demonstrating seasonal variations in nINP may be due to the inter-annual variability of meteorological conditions and aerosol particle sources influencing the ambient abundance of INPs. However, studies of nINP in the Arctic and their temporal coverage are too limited to derive any conclusive interpretation of seasonal nINP trends at this stage. Future application of long-term online INP measurements (e.g., Möhler et al., 2021) may shed light on the seasonal evolution of nINP at GVB and over the Arctic in general.
The analysis of the AF shows more notable seasonal trends than nINP. Both techniques showed a statistically significant increase in the ice nucleation efficiency of atmospheric aerosol particles going from spring to summer (Sect. 3.4). The chemical tracer correlation analysis, the ground contribution analysis and the above-mentioned considerations on the different contributions of sub- and super-micrometer INPs in spring and summertime all suggest that the main sources of springtime INPs at GVB may be located outside the Arctic. They are deemed to derive from the lower-latitude regions together with anthropogenic aerosols during the Arctic haze (Heidam et al., 1999; Stohl, 2006). Conversely, the summertime aerosol particle population is more related to local (Arctic) sources. Our AF estimates support the hypothesis that long-range transported aerosol particles from lower latitudes nucleate ice less efficiently than local-origin aerosol particles. This is in agreement with the findings of Hartmann et al. (2019), which showed a low impact of anthropogenic emissions on Arctic nINP by comparing present-day and pre-industrial nINP values through the analysis of ice core records. We note, however, that although the correlation with chemical tracers suggests a common spatial origin for springtime INPs and anthropogenic aerosol particles, we were not able to assess to what extent anthropogenic aerosol particles contributed to the springtime INP loads observed.
The higher AF of summertime (local) aerosol particles may be related to the enhanced contribution of super-micrometer aerosol particles, which we have shown to be markedly more ice active than sub-micrometer particles. Nevertheless, we cannot exclude or quantify the contribution of other physicochemical properties of aerosol particles, which may vary between spring and summer (e.g., chemical composition).
It is worth considering that changes in the estimated AF are influenced not only by variations of nINP, but also by variations of the concentration of non-ice-active aerosol particles, including secondary aerosols formed through new particle formation (NPF) mechanisms. Secondary aerosol particles may not contribute to INPs (Kanji et al., 2017), but they can lower the estimated AF. Recently, Beck et al. (2021) showed that different mechanisms, precursors and formation rates characterize spring and summertime NPF events at GVB. Dall'Osto et al. (2019) showed that the production of fresh particles is frequent during the period from May to August at GVB, while April is characterized by the presence of aged, accumulation-mode particles. These aspects may influence the seasonal variation of the estimated AF. Dall'Osto et al. (2017, 2018, 2019) linked NPF frequency in the Arctic atmosphere to the quickly decreasing sea ice extent, probably via increased phytoplankton productivity. This leads to the hypothesis of increasing NFP impact in the future. By the same token, the predicted shrinking of snow and sea-ice coverage in the Arctic is likely to increase the ambient nINP from sea spray and terrestrial sources, such as mineral and soil dust particles (Tobo et al., 2019). Predicting future nINP and aerosol particle AF over the Arctic in such a rapidly changing scenario is challenging. It, however, provides the motivation for further investigation of INP processes in the Arctic region.
4.3 Sources of INPs at GVB
Our analysis points out that both marine and terrestrial sources may contribute to the INP population in the study area. Land sources may be potentially important given the higher ice activity of mineral dust and soil particles in comparison to marine particles (McCluskey et al., 2018b). By contrast, marine sources may be significant on account of the extension of ice-free seawaters during the Arctic summer. This would also have implications for the future balance of terrestrial and marine INP sources in the Arctic, which is becoming increasingly warmer (Murray et al., 2021). The major limitation of our spatiotemporal correlation analysis and of the INP spatial source attribution approach (CWT) is the small number of samples available. This limits the time representativeness of the dataset and increases output uncertainty. Nevertheless, the consistency of the two independent approaches (spatiotemporal correlation analysis and CWT source location) provides a certain measure of credibility to the results presented. In particular, the approach adopted highlights the seawaters to the southwest of Svalbard and those immediately to the east of Greenland and to the northeast of Iceland as potential INP hotspots during our summer campaign. For this reason, we believe our results suggest that the marine biota may be a source of INPs in the Arctic. Nevertheless, further studies, based on more robust datasets, are necessary to confirm this result and achieve a more quantitative understanding of the relative importance of marine vs. terrestrial INP sources over the Arctic. In particular, online INP quantification methods have the potential to provide more suitable data for this kind of statistical approach and thereby help to clarify INP sources over the Arctic in the future.
This work presents the ambient concentration of INPs from the GVB observatory, near Ny-Ålesund, during spring–summer 2018. Aerosol particle samples were assessed for their ice nucleation ability and efficiency using offline immersion and condensation freezing techniques. The nINP values measured by DFPC ranged from 33 to 185, from 5 to 107 and from 3 to 66 m−3 for Ts of −22, −18 and −15 ∘C, respectively. At the same activation Ts, WT-CRAFT measured 3–199, 1–34 and 1–4 m−3. Although the two sets of data present a fair agreement in terms of nINP trends, a notable offset is evident, with the DFPC generally presenting higher nINPs than WT-CRAFT. This offset appears to be a factor of 8 at T of −15 ∘C. We considered many factors that could potentially explain the discrepancy observed (Sect. 4). While differences in the sampling approach and overall measurement uncertainties have certainly contributed to the offset, a different response of aerosol particles to the ice nucleation mode could be also considered a potential contributing factor. All future investigations into Arctic INP compositions and the ice nucleation process employing both the condensation and immersion freezing approach will provide further understanding of this issue.
This study also examined the seasonality of INPs in the Arctic with respect to nINP and AF. Neither the condensation nor the immersion INP datasets indicate any marked nINP seasonal trend. We report a statistically significant spring-to-summer enhancement in nINP only for a narrow range of Ts (−18 to −21 ∘C) in WT-CRAFT observations, with the associated nINP enhancement never, however, exceeding a factor of 3. On the other hand, the AF of atmospheric aerosol particles from GVB presents a statistically significant spring-to-summer increase for all the Ts probed by DFPC and between −17 and −22.5 ∘C for WT-CRAFT. The AF increased up to ∼6 times (−15 ∘C) for DFPC and ∼4 times (−20 ∘C) for WT-CRAFT. A clear seasonal evolution of the super-micrometer INP contribution was observed by DFPC. This contribution was around 20 % in spring (a maximum of 32 % at −15 ∘C), increasing markedly in summer and at high Ts (45 % at T of −22 ∘C and 65 % at T of −15 ∘C). Our calculations also show a markedly higher AF of coarse, compared to sub-micrometer, particles, with at least 2 orders of magnitude difference between the two size regimes. This implies that super-micrometer aerosol particles play an important role as the source of summertime INPs at GVB. Additionally, our chemical tracer and back-trajectory analyses show the dominance of local aerosol particle sources during summer. In short, summer season ground conditions influenced the sampled air masses, suggesting that the summertime INP population is influenced by terrestrial and marine sources. Our summer-season analysis also suggests a relationship between the biological activity in specific seawater regions and nINP at the sampling point. Nevertheless, we show that this result was achieved with a limited number of observations and that further studies, based on larger datasets, would be desirable for a better understanding of marine sources of INPs over the Arctic.
In contrast, the springtime INP population at GVB is mostly influenced by long-range transport of aerosol particles from lower latitudes. Spring-season air masses are characterized by markers of anthropogenic aerosol particles. Determining whether such anthropogenic particles contribute to the INP loads observed is beyond the scope of the current study. However, future investigation study of anthropogenic vs. natural INPs in the Arctic region with detailed assessment of INP composition will be an important step toward a comprehensive understanding of the impact of INPs in the Arctic cloud formation, precipitation and climate.
The data discussed in this work are available at https://doi.org/10.17632/zf4wdcc3bw.1 (Rinaldi et al., 2021). Data in Fig. 2a are available at https://doi.org/10.1594/PANGAEA.899696 (Wex et al., 2019a). Satellite chlorophyll data are available for download at http://marine.copernicus.eu/ (last access: 22 October 2018; product identifier: OCEANCOLOUR_GLO_CHL_L4_REP_OBSERVATIONS_009_082).
The supplement related to this article is available online at: https://doi.org/10.5194/acp-21-14725-2021-supplement.
MR, NH, and FB designed the concept of this collaborative research. MR led the writing of the manuscript with the support of all the authors. The methodology was developed by GS, FB, and NH, and measurements were conducted by GS, FB, CAR, MM, DC, SB, RT, and MP. Formal data analyses were carried out by MR, NH, FB, and KM. The revision effort was led by MR and NH with support of all the authors.
The contact author has declared that neither they nor their co-authors have any competing interests.
Publisher's note: Copernicus Publications remains neutral with regard to jurisdictional claims in published maps and institutional affiliations.
The authors thank DSSTTA-CNR and its staff for the logistical support that allowed the realization of the experimental activity. This activity was funded by H2020 EU Project FORCeS (Constrained aerosol forcing for improved climate projections; grant agreement ID: 821205). Francescopiero Calzolari is thanked for his support of the maintenance of the DFPC.
Naruki Hiranuma and Cheyanne A. Rodriguez are thankful for the contributions of Hemanth S. K. Vepuri, Yidi Hou and Zachary Salcido for their technical support on WT-CRAFT measurements. Naruki Hiranuma is thankful for the funding support from the Killgore Faculty Research Grant and the WTAMU's IoT and Research Computing program. Naruki Hiranuma is also thankful for partial financial support from Higher Education Assistance Fund (HEAF). This material is based upon work supported by the National Science Foundation under grant no. 1941317 (CAREER: The Role of Ice-Nucleating Particles and Their Feedback on Clouds in Warming Arctic Climate). The authors thank the NySMAC, Ny-Ålesund Atmosphere Research Flagship Programme for allowing the organization of a collaborative workshop meeting held in Bologna, Italy, in 2017. The workshop provided a venue for the authors to come together that fostered this collaboration.
This research has been supported by the European Commission, H2020 Research Infrastructures (FORCeS (grant no. 821205)), the National Science Foundation (grant no. 1941317), the Killgore Faculty Research Grant (grant no. WT19-002) and the NySMAC (Atmosphere Flagship Guest Visit Program 2017-002).
This paper was edited by Allan Bertram and reviewed by two anonymous referees.
Atkinson, J. D., Murray, B. J., Woodhouse, M. T., Whale, T. F., Baustian, K. J., Carslaw, K. S., Dobbie, S., O'Sullivan, D., and Malkin, T. L.: The importance of feldspar for ice nucleation by mineral dust in mixed-phase clouds, Nature, 498, 355–358, https://doi.org/10.1038/nature12278, 2013.
Beall, C. M., Lucero, D., Hill, T. C., DeMott, P. J., Stokes, M. D., and Prather, K. A.: Best practices for precipitation sample storage for offline studies of ice nucleation in marine and coastal environments, Atmos. Meas. Tech., 13, 6473–6486, https://doi.org/10.5194/amt-13-6473-2020, 2020.
Becagli, S., Ghedini, C., Peeters, S., Rottiers, A., Traversi, R., Udisti, R., Chiari, M., Jalba, A., Despiau, S., Dayan, U., and Temara, A.: MBAS (Methylene Blue Active Substances) and LAS (Linear Alkylbenzene Sulphonates) in Mediterranean coastal aerosols: Sources and transport processes, Atmos. Environ., 45, 6788–6801, https://doi.org/10.1016/j.atmosenv.2011.04.041, 2011.
Beck, L. J., Sarnela, N., Junninen, H., Hoppe, C. J. M., Garmash, O., Bianchi, F., Riva, M., Rose, C., Perakyla, O., Wimmer, D., Kausiala, O., Jokinen, T., Ahonen, L., Mikkila, J., Hakala, J., He, X. C., Kontkanen, J., Wolf, K. K. E., Cappelletti, D., Mazzola, M., Traversi, R., Petroselli, C., Viola, A. P., Vitale, V., Lange, R., Massling, A., Nojgaard, J. K., Krejci, R., Karlsson, L., Zieger, P., Jang, S., Lee, K., Vakkari, V., Lampilahti, J., Thakur, R. C., Leino, K., Kangasluoma, J., Duplissy, E. M., Siivola, E., Marbouti, M., Tham, Y. J., Saiz-Lopez, A., Petaja, T., Ehn, M., Worsnop, D. R., Skov, H., Kulmala, M., Kerminen, V. M., and Sipila, M.: Differing Mechanisms of New Particle Formation at Two Arctic Sites, Geophys. Res. Lett., 48, e2020GL091334, https://doi.org/10.1029/2020gl091334, 2021.
Belosi, F., Piazza, M., Nicosia, A., and Santachiara, G.: Influence of supersaturation on the concentration of ice nucleating particles, Tellus B, 70, 1–10, https://doi.org/10.1080/16000889.2018.1454809, 2018.
Bergeron, T.: On the Physics of clouds and precipitation, in: Proces Verbaux de l'Association de Meteorologie, Imprimerie Paul Dupont, Paris, France, 156–178, 1935.
Bigg, E. K.: Ice forming nuclei in the high Arctic, Tellus B, 48, 223–233, https://doi.org/10.1034/j.1600-0889.1996.t01-1-00007.x, 1996.
Bigg, E. K. and Leck, C.: Cloud-active particles over the central Arctic Ocean, J. Geophys. Res.-Atmos., 106, 32155–32166, https://doi.org/10.1029/1999jd901152, 2001.
Boose, Y., Sierau, B., García, M. I., Rodríguez, S., Alastuey, A., Linke, C., Schnaiter, M., Kupiszewski, P., Kanji, Z. A., and Lohmann, U.: Ice nucleating particles in the Saharan Air Layer, Atmos. Chem. Phys., 16, 9067–9087, https://doi.org/10.5194/acp-16-9067-2016, 2016.
Borys, R. D.: The effects of long-range transport of air pollutants on Arctic cloud-active aerosol, Atmospheric Science, Colorado State University, Fort Collins, Colorado, USA, 367 pp., 1983.
Buck, A. L.: New Equations for Computing Vapor Pressure and Enhancement Factor, J. Appl. Meteorol., 20, 1527–1532, https://doi.org/10.1175/1520-0450(1981)020<1527:nefcvp>2.0.co;2, 1981.
Conen, F., Stopelli, E., and Zimmermann, L.: Clues that decaying leaves enrich Arctic air with ice nucleating particles, Atmos. Environ., 129, 91–94, https://doi.org/10.1016/j.atmosenv.2016.01.027, 2016.
Creamean, J. M., Kirpes, R. M., Pratt, K. A., Spada, N. J., Maahn, M., de Boer, G., Schnell, R. C., and China, S.: Marine and terrestrial influences on ice nucleating particles during continuous springtime measurements in an Arctic oilfield location, Atmos. Chem. Phys., 18, 18023–18042, https://doi.org/10.5194/acp-18-18023-2018, 2018.
Crocker, D. R., Hernandez, R. E., Huang, H. D., Pendergraft, M. A., Cao, R. C., Dai, J. Y., Morris, C. K., Deane, G. B., Prather, K. A., and Thiemens, M. H.: Biological Influence on delta C-13 and Organic Composition of Nascent Sea Spray Aerosol, Earth Space Chem., 4, 1686–1699, https://doi.org/10.1021/acsearthspacechem.0c00072, 2020.
Dai, C. Y., Gao, Z. Q., Wang, Q., and Cheng, G.: Analysis of Atmospheric Boundary Layer Height Characteristics over the Arctic Ocean Using the Aircraft and GPS Soundings, Atmos. Ocean. Sci. Lett., 4, 124–130, https://doi.org/10.1080/16742834.2011.11446916, 2011.
Dall'Osto, M., Beddows, D. C. S., Tunved, P., Krejci, R., Strom, J., Hansson, H. C., Yoon, Y. J., Park, K. T., Becagli, S., Udisti, R., Onasch, T., O'Dowd, C. D., Simo, R., and Harrison, R. M.: Arctic sea ice melt leads to atmospheric new particle formation, Sci. Rep.-UK, 7, 3318, https://doi.org/10.1038/s41598-017-03328-1, 2017.
Dall'Osto, M., Geels, C., Beddows, D. C. S., Boertmann, D., Lange, R., Nojgaard, J. K., Harrison, R. M., Simo, R., Skov, H., and Massling, A.: Regions of open water and melting sea ice drive new particle formation in North East Greenland, Sci. Rep.-UK, 8, 6109, https://doi.org/10.1038/s41598-018-24426-8, 2018.
Dall'Osto, M., Beddows, D. C. S., Tunved, P., Harrison, R. M., Lupi, A., Vitale, V., Becagli, S., Traversi, R., Park, K.-T., Yoon, Y. J., Massling, A., Skov, H., Lange, R., Strom, J., and Krejci, R.: Simultaneous measurements of aerosol size distributions at three sites in the European high Arctic, Atmos. Chem. Phys., 19, 7377–7395, https://doi.org/10.5194/acp-19-7377-2019, 2019.
David, R. O., Marcolli, C., Fahrni, J., Qiu, Y. Q., Sirkin, Y. A. P., Molinero, V., Mahrt, F., Bruhwiler, D., Lohmann, U., and Kanji, Z. A.: Pore condensation and freezing is responsible for ice formation below water saturation for porous particles, P. Natl. Acad. Sci. USA, 116, 8184–8189, https://doi.org/10.1073/pnas.1813647116, 2019.
de Boer, G., Shupe, M. D., Caldwell, P. M., Bauer, S. E., Persson, O., Boyle, J. S., Kelley, M., Klein, S. A., and Tjernström, M.: Near-surface meteorology during the Arctic Summer Cloud Ocean Study (ASCOS): evaluation of reanalyses and global climate models, Atmos. Chem. Phys., 14, 427–445, https://doi.org/10.5194/acp-14-427-2014, 2014.
deMott, P. J., Prenni, A. J., Liu, X., Kreidenweis, S. M., Petters, M. D., Twohy, C. H., Richardson, M. S., Eidhammer, T., and Rogers, D. C.: Predicting global atmospheric ice nuclei distributions and their impacts on climate, P. Natl. Acad. Sci. USA, 107, 11217–11222, https://doi.org/10.1073/pnas.0910818107, 2010.
DeMott, P. J., Prenni, A. J., McMeeking, G. R., Sullivan, R. C., Petters, M. D., Tobo, Y., Niemand, M., Möhler, O., Snider, J. R., Wang, Z., and Kreidenweis, S. M.: Integrating laboratory and field data to quantify the immersion freezing ice nucleation activity of mineral dust particles, Atmos. Chem. Phys., 15, 393–409, https://doi.org/10.5194/acp-15-393-2015, 2015.
DeMott, P. J., Hill, T. C. J., Petters, M. D., Bertram, A. K., Tobo, Y., Mason, R. H., Suski, K. J., McCluskey, C. S., Levin, E. J. T., Schill, G. P., Boose, Y., Rauker, A. M., Miller, A. J., Zaragoza, J., Rocci, K., Rothfuss, N. E., Taylor, H. P., Hader, J. D., Chou, C., Huffman, J. A., Pöschl, U., Prenni, A. J., and Kreidenweis, S. M.: Comparative measurements of ambient atmospheric concentrations of ice nucleating particles using multiple immersion freezing methods and a continuous flow diffusion chamber, Atmos. Chem. Phys., 17, 11227–11245, https://doi.org/10.5194/acp-17-11227-2017, 2017.
DeMott, P. J., Möhler, O., Cziczo, D. J., Hiranuma, N., Petters, M. D., Petters, S. S., Belosi, F., Bingemer, H. G., Brooks, S. D., Budke, C., Burkert-Kohn, M., Collier, K. N., Danielczok, A., Eppers, O., Felgitsch, L., Garimella, S., Grothe, H., Herenz, P., Hill, T. C. J., Höhler, K., Kanji, Z. A., Kiselev, A., Koop, T., Kristensen, T. B., Krüger, K., Kulkarni, G., Levin, E. J. T., Murray, B. J., Nicosia, A., O'Sullivan, D., Peckhaus, A., Polen, M. J., Price, H. C., Reicher, N., Rothenberg, D. A., Rudich, Y., Santachiara, G., Schiebel, T., Schrod, J., Seifried, T. M., Stratmann, F., Sullivan, R. C., Suski, K. J., Szakáll, M., Taylor, H. P., Ullrich, R., Vergara-Temprado, J., Wagner, R., Whale, T. F., Weber, D., Welti, A., Wilson, T. W., Wolf, M. J., and Zenker, J.: The Fifth International Workshop on Ice Nucleation phase 2 (FIN-02): laboratory intercomparison of ice nucleation measurements, Atmos. Meas. Tech., 11, 6231–6257, https://doi.org/10.5194/amt-11-6231-2018, 2018.
Dymarska, M., Murray, B. J., Sun, L. M., Eastwood, M. L., Knopf, D. A., and Bertram, A. K.: Deposition ice nucleation on soot at temperatures relevant for the lower troposphere, J. Geophys. Res.-Atmos., 111, D04204, https://doi.org/10.1029/2005jd006627, 2006.
Findeisen, W.: Kolloid-Meteorologische, 2nd edn., American Meteorological Society, Boston, Massachusetts, USA, 1938.
Giardi, F., Becagli, S., Traversi, R., Frosini, D., Severi, M., Caiazzo, L., Ancillotti, C., Cappelletti, D., Moroni, B., Grotti, M., Bazzano, A., Lupi, A., Mazzola, M., Vitale, V., Abollino, O., Ferrero, L., Bolzacchini, E., Viola, A., and Udisti, R.: Size distribution and ion composition of aerosol collected at Ny-lesund in the spring-summer field campaign 2013, Rendiconti Lincei-Scienze Fisiche E Naturali, 27, 47–58, https://doi.org/10.1007/s12210-016-0529-3, 2016.
Harrington, J. Y. and Olsson, P. Q.: On the potential influence of ice nuclei on surface-forced marine stratocumulus cloud dynamics, J. Geophys. Res.-Atmos., 106, 27473–27484, https://doi.org/10.1029/2000jd000236, 2001.
Harrington, J. Y., Reisin, T., Cotton, W. R., and Kreidenweis, S. M.: Cloud resolving simulations of Arctic stratus – Part II: Transition-season clouds, Atmos. Res., 51, 45–75, https://doi.org/10.1016/s0169-8095(98)00098-2, 1999.
Harrison, A. D., Lever, K., Sanchez-Marroquin, A., Holden, M. A., Whale, T. F., Tarn, M. D., McQuaid, J. B., and Murray, B. J.: The ice-nucleating ability of quartz immersed in water and its atmospheric importance compared to K-feldspar, Atmos. Chem. Phys., 19, 11343–11361, https://doi.org/10.5194/acp-19-11343-2019, 2019.
Hartmann, M., Blunier, T., Brugger, S. O., Schmale, J., Schwikowski, M., Vogel, A., Wex, H., and Stratmann, F.: Variation of Ice Nucleating Particles in the European Arctic Over the Last Centuries, Geophys. Res. Lett., 46, 4007–4016, https://doi.org/10.1029/2019gl082311, 2019.
Heidam, N. Z., Wahlin, P., and Christensen, J. H.: Tropospheric gases and aerosols in northeast Greenland, J. Atmos. Sci., 56, 261–278, https://doi.org/10.1175/1520-0469(1999)056<0261:tgaain>2.0.co;2, 1999.
Helfrich, S. R., McNamara, D., Ramsay, B. H., Baldwin, T., and Kasheta, T.: Enhancements to, and forthcoming developments in the Interactive Multisensor Snow and Ice Mapping System (IMS), Hydrol. Process., 21, 1576–1586, https://doi.org/10.1002/hyp.6720, 2007.
Hiranuma, N., Mohler, O., Yamashita, K., Tajiri, T., Saito, A., Kiselev, A., Hoffmann, N., Hoose, C., Jantsch, E., Koop, T., and Murakami, M.: Ice nucleation by cellulose and its potential contribution to ice formation in clouds, Nat. Geosci., 8, 273–277, https://doi.org/10.1038/ngeo2374, 2015.
Hiranuma, N., Adachi, K., Bell, D. M., Belosi, F., Beydoun, H., Bhaduri, B., Bingemer, H., Budke, C., Clemen, H.-C., Conen, F., Cory, K. M., Curtius, J., DeMott, P. J., Eppers, O., Grawe, S., Hartmann, S., Hoffmann, N., Höhler, K., Jantsch, E., Kiselev, A., Koop, T., Kulkarni, G., Mayer, A., Murakami, M., Murray, B. J., Nicosia, A., Petters, M. D., Piazza, M., Polen, M., Reicher, N., Rudich, Y., Saito, A., Santachiara, G., Schiebel, T., Schill, G. P., Schneider, J., Segev, L., Stopelli, E., Sullivan, R. C., Suski, K., Szakáll, M., Tajiri, T., Taylor, H., Tobo, Y., Ullrich, R., Weber, D., Wex, H., Whale, T. F., Whiteside, C. L., Yamashita, K., Zelenyuk, A., and Möhler, O.: A comprehensive characterization of ice nucleation by three different types of cellulose particles immersed in water, Atmos. Chem. Phys., 19, 4823–4849, https://doi.org/10.5194/acp-19-4823-2019, 2019.
Hoose, C. and Möhler, O.: Heterogeneous ice nucleation on atmospheric aerosols: a review of results from laboratory experiments, Atmos. Chem. Phys., 12, 9817–9854, https://doi.org/10.5194/acp-12-9817-2012, 2012.
Hsu, Y. K., Holsen, T. M., and Hopke, P. K.: Comparison of hybrid receptor models to locate PCB sources in Chicago, Atmos. Environ., 37, 545–562, https://doi.org/10.1016/s1352-2310(02)00886-5, 2003.
Irish, V. E., Hanna, S. J., Willis, M. D., China, S., Thomas, J. L., Wentzell, J. J. B., Cirisan, A., Si, M., Leaitch, W. R., Murphy, J. G., Abbatt, J. P. D., Laskin, A., Girard, E., and Bertram, A. K.: Ice nucleating particles in the marine boundary layer in the Canadian Arctic during summer 2014, Atmos. Chem. Phys., 19, 1027–1039, https://doi.org/10.5194/acp-19-1027-2019, 2019.
Jeong, U., Kim, J., Lee, H., Jung, J., Kim, Y. J., Song, C. H., and Koo, J. H.: Estimation of the contributions of long range transported aerosol in East Asia to carbonaceous aerosol and PM concentrations in Seoul, Korea using highly time resolved measurements: a PSCF model approach, J. Environ. Monitor., 13, 1905–1918, https://doi.org/10.1039/c0em00659a, 2011.
Jiang, H. L., Cotton, W. R., Pinto, J. O., Curry, J. A., and Weissbluth, M. J.: Cloud resolving simulations of mixed-phase Arctic stratus observed during BASE: Sensitivity to concentration of ice crystals and large-scale heat and moisture advection, J. Atmos. Sci., 57, 2105–2117, https://doi.org/10.1175/1520-0469(2000)057<2105:crsomp>2.0.co;2, 2000.
Kanji, Z. A., Ladino, L. A., Wex, H., Boose, Y., Burkert-Kohn, M., Cziczo, D. J., and Kramer, M.: Overview of Ice Nucleating Particles, Ice Formation and Evolution in Clouds and Precipitation: Measurement and Modeling Challenges, Meteorol. Monogr., 58, 1.1–1.33, https://doi.org/10.1175/amsmonographs-d-16-0006.1, 2017.
Knopf, D. A., Alpert, P. A., Wang, B., and Aller, J. Y.: Stimulation of ice nucleation by marine diatoms, Nat. Geosci., 4, 88–90, https://doi.org/10.1038/ngeo1037, 2011.
Kumar, A., Marcolli, C., Luo, B., and Peter, T.: Ice nucleation activity of silicates and aluminosilicates in pure water and aqueous solutions – Part 1: The K-feldspar microcline, Atmos. Chem. Phys., 18, 7057–7079, https://doi.org/10.5194/acp-18-7057-2018, 2018.
Langer, G. and Rodgers, J.: An Experimental Study of the Detection of Ice Nuclei on Membrane Filters and Other Substrata, J. Appl. Meteorol. Climatol., 14, 560–570, 1975.
Lisok, J., Markowicz, K. M., Ritter, C., Makuch, P., Petelski, T., Chilinski, M., Kaminski, J. W., Becagli, S., Traversi, R., Udisti, R., Rozwadowska, A., Jefimow, M., Markuszewski, P., Neuber, R., Pakszys, P., Stachlewska, I. S., Struzewska, J., and Zielinski, T.: 2014 iAREA campaign on aerosol in Spitsbergen – Part 1: Study of physical and chemical properties, Atmos. Environ., 140, 150–166, https://doi.org/10.1016/j.atmosenv.2016.05.051, 2016.
Lupi, A., Busetto, M., Becagli, S., Giardi, F., Lanconelli, C., Mazzola, M., Udisti, R., Hansson, H. C., Henning, T., Petkov, B., Strom, J., Krejci, R., Tunved, P., Viola, A. P., and Vitale, V.: Multi-seasonal ultrafine aerosol particle number concentration measurements at the Gruvebadet observatory, Ny-lesund, Svalbard Islands, Rendiconti Lincei-Scienze Fisiche E Naturali, 27, 59–71, https://doi.org/10.1007/s12210-016-0532-8, 2016.
Mansour, K., Decesari, S., Bellacicco, M., Marullo, S., Santoleri, R., Bonasoni, P., Facchini, M. C., Ovadnevaite, J., Ceburnis, D., O'Dowd, C., and Rinaldi, M.: Particulate methanesulfonic acid over the central Mediterranean Sea: Source region identification and relationship with phytoplankton activity, Atmos. Res., 237, 104837, https://doi.org/10.1016/j.atmosres.2019.104837, 2020a.
Mansour, K., Decesari, S., Facchini, M. C., Belosi, F., Paglione, M., Sandrini, S., Bellacicco, M., Marullo, S., Santoleri, R., Ovadnevaite, J., Ceburnis, D., O'Dowd, C., Roberts, G., Sanchez, K., and Rinaldi, M.: Linking Marine Biological Activity to Aerosol Chemical Composition and Cloud-Relevant Properties Over the North Atlantic Ocean, J. Geophys. Res.-Atmos., 125, e2019JD032246, https://doi.org/10.1029/2019jd032246, 2020b.
Mason, R. H., Si, M., Li, J., Chou, C., Dickie, R., Toom-Sauntry, D., Pöhlker, C., Yakobi-Hancock, J. D., Ladino, L. A., Jones, K., Leaitch, W. R., Schiller, C. L., Abbatt, J. P. D., Huffman, J. A., and Bertram, A. K.: Ice nucleating particles at a coastal marine boundary layer site: correlations with aerosol type and meteorological conditions, Atmos. Chem. Phys., 15, 12547–12566, https://doi.org/10.5194/acp-15-12547-2015, 2015.
Mason, R. H., Si, M., Chou, C., Irish, V. E., Dickie, R., Elizondo, P., Wong, R., Brintnell, M., Elsasser, M., Lassar, W. M., Pierce, K. M., Leaitch, W. R., MacDonald, A. M., Platt, A., Toom-Sauntry, D., Sarda-Estève, R., Schiller, C. L., Suski, K. J., Hill, T. C. J., Abbatt, J. P. D., Huffman, J. A., DeMott, P. J., and Bertram, A. K.: Size-resolved measurements of ice-nucleating particles at six locations in North America and one in Europe, Atmos. Chem. Phys., 16, 1637–1651, https://doi.org/10.5194/acp-16-1637-2016, 2016.
Mazzola, M., Viola, A. P., Lanconelli, C., and Vitale, V.: Atmospheric observations at the Amundsen-Nobile Climate Change Tower in Ny-Ålesund, Svalbard, Rendiconti Lincei-Scienze Fisiche E Naturali, 27, 7–18, https://doi.org/10.1007/s12210-016-0540-8, 2016.
McCluskey, C. S., Hill, T. C. J., Malfatti, F., Sultana, C. M., Lee, C., Santander, M. V., Beall, C. M., Moore, K. A., Cornwell, G. C., Collins, D. B., Prather, K. A., Jayarathne, T., Stone, E. A., Azam, F., Kreidenweis, S. M., and deMott, P. J.: A Dynamic Link between Ice Nucleating Particles Released in Nascent Sea Spray Aerosol and Oceanic Biological Activity during Two Mesocosm Experiments, J. Atmos. Sci., 74, 151–166, https://doi.org/10.1175/jas-d-16-0087.1, 2017.
McCluskey, C. S., Hill, T. C. J., Sultana, C. M., Laskina, O., Trueblood, J., Santander, M. V., Beall, C. M., Michaud, J. M., Kreidenweis, S. M., Prather, K. A., Grassian, V., and deMott, P. J.: A Mesocosm Double Feature: Insights into the Chemical Makeup of Marine Ice Nucleating Particles, J. Atmos. Sci., 75, 2405–2423, https://doi.org/10.1175/jas-d-17-0155.1, 2018a.
McCluskey, C. S., Ovadnevaite, J., Rinaldi, M., Atkinson, J., Belosi, F., Ceburnis, D., Marullo, S., Hill, T. C. J., Lohmann, U., Kanji, Z. A., O'Dowd, C., Kreidenweis, S. M., and deMott, P. J.: Marine and Terrestrial Organic Ice-Nucleating Particles in Pristine Marine to Continentally Influenced Northeast Atlantic Air Masses, J. Geophys. Res.-Atmos., 123, 6196–6212, https://doi.org/10.1029/2017jd028033, 2018b.
Murray, B. J., O'Sullivan, D., Atkinson, J. D., and Webb, M. E.: Ice nucleation by particles immersed in supercooled cloud droplets, Chem. Soc. Rev., 41, 6519–6554, https://doi.org/10.1039/c2cs35200a, 2012.
Murray, B. J., Carslaw, K. S., and Field, P. R.: Opinion: Cloud-phase climate feedback and the importance of ice-nucleating particles, Atmos. Chem. Phys., 21, 665–679, https://doi.org/10.5194/acp-21-665-2021, 2021.
Möhler, O., Adams, M., Lacher, L., Vogel, F., Nadolny, J., Ullrich, R., Boffo, C., Pfeuffer, T., Hobl, A., Weiß, M., Vepuri, H. S. K., Hiranuma, N., and Murray, B. J.: The Portable Ice Nucleation Experiment (PINE): a new online instrument for laboratory studies and automated long-term field observations of ice-nucleating particles, Atmos. Meas. Tech., 14, 1143–1166, https://doi.org/10.5194/amt-14-1143-2021, 2021.
National Ice-Center, U. S.: IMS Daily Northern Hemisphere Snow and Ice Analysis at 1 km, 4 km, and 24 km Resolutions, Version 1, Boulder, Colorado USA, NSIDC: National Snow and Ice Data Center [data set], https://doi.org/10.7265/N52R3PMC, 2008.
O'Dowd, C., Ceburnis, D., Ovadnevaite, J., Bialek, J., Stengel, D. B., Zacharias, M., Nitschke, U., Connan, S., Rinaldi, M., Fuzzi, S., Decesari, S., Facchini, M. C., Marullo, S., Santoleri, R., Dell'Anno, A., Corinaldesi, C., Tangherlini, M., and Danovaro, R.: Connecting marine productivity to sea-spray via nanoscale biological processes: Phytoplankton Dance or Death Disco?, Sci. Rep.-UK, 5, 14883, https://doi.org/10.1038/srep14883, 2015.
Paramonov, M., David, R. O., Kretzschmar, R., and Kanji, Z. A.: A laboratory investigation of the ice nucleation efficiency of three types of mineral and soil dust, Atmos. Chem. Phys., 18, 16515–16536, https://doi.org/10.5194/acp-18-16515-2018, 2018.
Pinto, J. O.: Autumnal mixed-phase cloudy boundary layers in the Arctic, J. Atmos. Sci., 55, 2016–2038, https://doi.org/10.1175/1520-0469(1998)055<2016:ampcbl>2.0.co;2, 1998.
Rangno, A. L. and Hobbs, P. V.: Ice particles in stratiform clouds in the Arctic and possible mechanisms for the production of high ice concentrations, J. Geophys. Res.-Atmos., 106, 15065–15075, https://doi.org/10.1029/2000jd900286, 2001.
Reischel, M. T. and Vali, G.: Freezing nucleation in aqueous electrolytes, Tellus, 27, 414–427, 1975.
Richardson, M. S., deMott, P. J., Kreidenweis, S. M., Cziczo, D. J., Dunlea, E. J., Jimenez, J. L., Thomson, D. S., Ashbaugh, L. L., Borys, R. D., Westphal, D. L., Casuccio, G. S., and Lersch, T. L.: Measurements of heterogeneous ice nuclei in the western United States in springtime and their relation to aerosol characteristics, J. Geophys. Res.-Atmos., 112, D02209, https://doi.org/10.1029/2006jd007500, 2007.
Rinaldi, M., Fuzzi, S., Decesari, S., Marullo, S., Santoleri, R., Provenzale, A., von Hardenberg, J., Ceburnis, D., Vaishya, A., O'Dowd, C. D., and Facchini, M. C.: Is chlorophyll-a the best surrogate for organic matter enrichment in submicron primary marine aerosol?, J. Geophys. Res.-Atmos., 118, 4964–4973, https://doi.org/10.1002/jgrd.50417, 2013.
Rinaldi, M., Santachiara, G., Nicosia, A., Piazza, M., Decesari, S., Gilardoni, S., Paglione, M., Cristofanelli, P., Marinoni, A., Bonasoni, P., and Belosi, F.: Atmospheric Ice Nucleating Particle measurements at the high mountain observatory Mt. Cimone (2165 m a.s.l., Italy), Atmos. Environ., 171, 173–180, https://doi.org/10.1016/j.atmosenv.2017.10.027, 2017.
Rinaldi, M., Hiranuma, N., Santachiara, G., Mazzola, M., and Belosi, F.: Offline INP measurements at Ny-Ålesund (Svalbard) in 2018, Mendeley Data, V1 [data set], https://doi.org/10.17632/zf4wdcc3bw.1, 2020.
Rogers, D. C., deMott, P. J., Kreidenweis, S. M., and Chen, Y. L.: Measurements of ice nucleating aerosols during SUCCESS, Geophys. Res. Lett., 25, 1383–1386, https://doi.org/10.1029/97gl03478, 1998.
Rolph, G., Stein, A., and Stunder, B.: Real-time Environmental Applications and Display sYstem: READY, Environ. Model. Softw., 95, 210–228, https://doi.org/10.1016/j.envsoft.2017.06.025, 2017.
Santachiara, G., Di Matteo, L., Prodi, F., and Belosi, F.: Atmospheric particles acting as Ice Forming Nuclei in different size ranges, Atmos. Res., 96, 266–272, https://doi.org/10.1016/j.atmosres.2009.08.004, 2010.
Santl-Temkiv, T., Lange, R., Beddows, D., Rauter, U., Pilgaard, S., Dall'Osto, M., Gunde-Cimerman, N., Massling, A., and Wex, H.: Biogenic Sources of Ice Nucleating Particles at the High Arctic Site Villum Research Station, Environ. Sci. Technol., 53, 10580–10590, https://doi.org/10.1021/acs.est.9b00991, 2019.
Schiebel, T.: Ice nucleation activity of soil dust aerosols, Karlsruhe Institute of Technology, https://doi.org/10.5445/IR/1000076327, 2017.
Schmale, J., Zieger, P., and Ekman, A. M. L.: Aerosols in current and future Arctic climate, Nat. Clim. Change, 11, 95–105, https://doi.org/10.1038/s41558-020-00969-5, 2021.
Schrod, J., Thomson, E. S., Weber, D., Kossmann, J., Pöhlker, C., Saturno, J., Ditas, F., Artaxo, P., Clouard, V., Saurel, J.-M., Ebert, M., Curtius, J., and Bingemer, H. G.: Long-term deposition and condensation ice-nucleating particle measurements from four stations across the globe, Atmos. Chem. Phys., 20, 15983–16006, https://doi.org/10.5194/acp-20-15983-2020, 2020.
Schwikowski, M., Seibert, P., Baltensperger, U., and Gaggeler, H. W.: A study of an outstanding Saharan dust event at the high-alpine site Jungfraujoch, Switzerland, Atmos. Environ., 29, 1829–1842, https://doi.org/10.1016/1352-2310(95)00060-c, 1995.
Serreze, M. C. and Barry, R. G.: Processes and impacts of Arctic amplification: A research synthesis, Global Planet. Change, 77, 85–96, https://doi.org/10.1016/j.gloplacha.2011.03.004, 2011.
Shaw, G. E.: The arctic haze phenomenon, B. Am. Meteorol. Soc., 76, 2403–2413, https://doi.org/10.1175/1520-0477(1995)076<2403:tahp>2.0.co;2, 1995.
Shupe, M. D., Matrosov, S. Y., and Uttal, T.: Arctic mixed-phase cloud properties derived from surface-based sensors at SHEBA, J. Atmos. Sci., 63, 697–711, https://doi.org/10.1175/jas3659.1, 2006.
Shupe, M. D., Walden, V. P., Eloranta, E., Uttal, T., Campbell, J. R., Starkweather, S. M., and Shiobara, M.: Clouds at Arctic Atmospheric Observatories. Part I: Occurrence and Macrophysical Properties, J. Appl. Meteorol. Climatol., 50, 626–644, https://doi.org/10.1175/2010jamc2467.1, 2011.
Si, M., Irish, V. E., Mason, R. H., Vergara-Temprado, J., Hanna, S. J., Ladino, L. A., Yakobi-Hancock, J. D., Schiller, C. L., Wentzell, J. J. B., Abbatt, J. P. D., Carslaw, K. S., Murray, B. J., and Bertram, A. K.: Ice-nucleating ability of aerosol particles and possible sources at three coastal marine sites, Atmos. Chem. Phys., 18, 15669–15685, https://doi.org/10.5194/acp-18-15669-2018, 2018.
Si, M., Evoy, E., Yun, J., Xi, Y., Hanna, S. J., Chivulescu, A., Rawlings, K., Veber, D., Platt, A., Kunkel, D., Hoor, P., Sharma, S., Leaitch, W. R., and Bertram, A. K.: Concentrations, composition, and sources of ice-nucleating particles in the Canadian High Arctic during spring 2016, Atmos. Chem. Phys., 19, 3007–3024, https://doi.org/10.5194/acp-19-3007-2019, 2019.
Solomon, A., de Boer, G., Creamean, J. M., McComiskey, A., Shupe, M. D., Maahn, M., and Cox, C.: The relative impact of cloud condensation nuclei and ice nucleating particle concentrations on phase partitioning in Arctic mixed-phase stratocumulus clouds, Atmos. Chem. Phys., 18, 17047–17059, https://doi.org/10.5194/acp-18-17047-2018, 2018.
Stein, A. F., Draxler, R. R., Rolph, G. D., Stunder, B. J. B., Cohen, M. D., and Ngan, F.: NOAA's HYSPLIT Atmospheric Transport and Dispersion Modeling System, B. Am. Meteorol. Soc., 96, 2059–2077, https://doi.org/10.1175/bams-d-14-00110.1, 2015.
Stohl, A.: Characteristics of atmospheric transport into the Arctic troposphere, J. Geophys. Res.-Atmos., 111, D11306, https://doi.org/10.1029/2005jd006888, 2006.
Tobo, Y.: An improved approach for measuring immersion freezing in large droplets over a wide temperature range, Sci. Rep.-UK, 6, 32930, https://doi.org/10.1038/srep32930, 2016.
Tobo, Y., Adachi, K., deMott, P. J., Hill, T. C. J., Hamilton, D. S., Mahowald, N. M., Nagatsuka, N., Ohata, S., Uetake, J., Kondo, Y., and Koike, M.: Glacially sourced dust as a potentially significant source of ice nucleating particles, Nat. Geosci., 12, 253, https://doi.org/10.1038/s41561-019-0314-x, 2019.
Udisti, R., Bazzano, A., Becagli, S., Bolzacchini, E., Caiazzo, L., Cappelletti, D., Ferrero, L., Frosini, D., Giardi, F., Grotti, M., Lupi, A., Malandrino, M., Mazzola, M., Moroni, B., Severi, M., Traversi, R., Viola, A., and Vitale, V.: Sulfate source apportionment in the Ny-Alesund (Svalbard Islands) Arctic aerosol, Rendiconti Lincei-Scienze Fisiche E Naturali, 27, 85–94, https://doi.org/10.1007/s12210-016-0517-7, 2016.
Vali, G.: Quantitative evaluation of experimental results on the heterogeneous freezing nucleation of supercooled liquids, J. Atmos. Sci., 28, 402–409, 1971.
Vali, G., DeMott, P. J., Möhler, O., and Whale, T. F.: Technical Note: A proposal for ice nucleation terminology, Atmos. Chem. Phys., 15, 10263–10270, https://doi.org/10.5194/acp-15-10263-2015, 2015.
Vepuri, H. S. K., Rodriguez, C. A., Georgakopoulos, D. G., Hume, D., Webb, J., Mayer, G. D., and Hiranuma, N.: Ice-nucleating particles in precipitation samples from the Texas Panhandle, Atmos. Chem. Phys., 21, 4503–4520, https://doi.org/10.5194/acp-21-4503-2021, 2021.
Wagner, R., Kiselev, A., Möhler, O., Saathoff, H., and Steinke, I.: Pre-activation of ice-nucleating particles by the pore condensation and freezing mechanism, Atmos. Chem. Phys., 16, 2025–2042, https://doi.org/10.5194/acp-16-2025-2016, 2016.
Wang, X. F., Sultana, C. M., Trueblood, J., Hill, T. C. J., Malfatti, F., Lee, C., Laskina, O., Moore, K. A., Beall, C. M., McCluskey, C. S., Cornwell, G. C., Zhou, Y. Y., Cox, J. L., Pendergraft, M. A., Santander, M. V., Bertram, T. H., Cappa, C. D., Azam, F., deMott, P. J., Grassian, V. H., and Prather, K. A.: Microbial Control of Sea Spray Aerosol Composition: A Tale of Two Blooms, Acs Central Science, 1, 124–131, https://doi.org/10.1021/acscentsci.5b00148, 2015.
Wegener, A.: Thermodynamik der Atmosphäre, J. A. Barth, Leipzig, Germany, 1911.
Welti, A., Bigg, E. K., DeMott, P. J., Gong, X., Hartmann, M., Harvey, M., Henning, S., Herenz, P., Hill, T. C. J., Hornblow, B., Leck, C., Löffler, M., McCluskey, C. S., Rauker, A. M., Schmale, J., Tatzelt, C., van Pinxteren, M., and Stratmann, F.: Ship-based measurements of ice nuclei concentrations over the Arctic, Atlantic, Pacific and Southern oceans, Atmos. Chem. Phys., 20, 15191–15206, https://doi.org/10.5194/acp-20-15191-2020, 2020.
Wex, H., DeMott, P. J., Tobo, Y., Hartmann, S., Rösch, M., Clauss, T., Tomsche, L., Niedermeier, D., and Stratmann, F.: Kaolinite particles as ice nuclei: learning from the use of different kaolinite samples and different coatings, Atmos. Chem. Phys., 14, 5529–5546, https://doi.org/10.5194/acp-14-5529-2014, 2014.
Wex, H., Huang, L., Sheesley, R., Bossi, R., and Traversi, R.: Annual concentrations of ice nucleating particles at Arctic station Ny-Ålesund, PANGAEA [data set], https://doi.org/10.1594/PANGAEA.899696, 2019a.
Wex, H., Huang, L., Zhang, W., Hung, H., Traversi, R., Becagli, S., Sheesley, R. J., Moffett, C. E., Barrett, T. E., Bossi, R., Skov, H., Hünerbein, A., Lubitz, J., Löffler, M., Linke, O., Hartmann, M., Herenz, P., and Stratmann, F.: Annual variability of ice-nucleating particle concentrations at different Arctic locations, Atmos. Chem. Phys., 19, 5293–5311, https://doi.org/10.5194/acp-19-5293-2019, 2019b.
Whale, T. F., Holden, M. A., Wilson, T. W., O'Sullivan, D., and Murray, B. J.: The enhancement and suppression of immersion mode heterogeneous ice-nucleation by solutes, Chem. Sci., 9, 4142–4151, https://doi.org/10.1039/c7sc05421a, 2018.
Wilson, T. W., Ladino, L. A., Alpert, P. A., Breckels, M. N., Brooks, I. M., Browse, J., Burrows, S. M., Carslaw, K. S., Huffman, J. A., Judd, C., Kilthau, W. P., Mason, R. H., McFiggans, G., Miller, L. A., Najera, J. J., Polishchuk, E., Rae, S., Schiller, C. L., Si, M., Temprado, J. V., Whale, T. F., Wong, J. P. S., Wurl, O., Yakobi-Hancock, J. D., Abbatt, J. P. D., Aller, J. Y., Bertram, A. K., Knopf, D. A., and Murray, B. J.: A marine biogenic source of atmospheric ice-nucleating particles, Nature, 525, 234, https://doi.org/10.1038/nature14986, 2015.
Wolf, M. J., Goodell, M., Dong, E., Dove, L. A., Zhang, C., Franco, L. J., Shen, C., Rutkowski, E. G., Narducci, D. N., Mullen, S., Babbin, A. R., and Cziczo, D. J.: A link between the ice nucleation activity and the biogeochemistry of seawater, Atmos. Chem. Phys., 20, 15341–15356, https://doi.org/10.5194/acp-20-15341-2020, 2020.