the Creative Commons Attribution 4.0 License.
the Creative Commons Attribution 4.0 License.
 | 01 Oct 2021
Origins and characterization of CO and O3 in the African upper troposphere
Bastien Sauvage
Brice Barret
Hannah Clark
Gilles Athier
Damien Boulanger
Jean-Pierre Cammas
Jean-Marc Cousin
Alain Fontaine
Eric Le Flochmoën
Philippe Nédélec
Hervé Petetin
Isabelle Pfaffenzeller
Susanne Rohs
Herman G. J. Smit
Pawel Wolff
Valérie Thouret
Between December 2005 and 2013, the In-service Aircraft for a Global Observing System (IAGOS) program produced almost daily in situ measurements of CO and O3 between Europe and southern Africa. IAGOS data combined with measurements from the Infrared Atmospheric Sounding Interferometer (IASI) instrument aboard the Metop-A satellite (2008–2013) are used to characterize meridional distributions and seasonality of CO and O3 in the African upper troposphere (UT). The FLEXPART particle dispersion model and the SOFT-IO model which combines the FLEXPART model with CO emission inventories are used to explore the sources and origins of the observed transects of CO and O3.
We focus our analysis on two main seasons: December to March (DJFM) and June to October (JJASO). These seasons have been defined according to the position of Intertropical Convergence Zone (ITCZ), determined using in situ measurements from IAGOS. During both seasons, the UT CO meridional transects are characterized by maximum mixing ratios located 10∘ from the position of the ITCZ above the dry regions inside the hemisphere of the strongest Hadley cell (132 to 165 ppb at 0–5∘ N in DJFM and 128 to 149 ppb at 3–7∘ S in JJASO) and decreasing values southward and northward. The O3 meridional transects are characterized by mixing ratio minima of ∼42–54 ppb at the ITCZ (10–16∘ S in DJFM and 5–8∘ N in JJASO) framed by local maxima (∼53–71 ppb) coincident with the wind shear zones north and south of the ITCZ. O3 gradients are strongest in the hemisphere of the strongest Hadley cell. IASI UT O3 distributions in DJFM have revealed that the maxima are a part of a crescent-shaped O3 plume above the Atlantic Ocean around the Gulf of Guinea.
CO emitted at the surface is transported towards the ITCZ by the trade winds and then convectively uplifted. Once in the upper troposphere, CO-enriched air masses are transported away from the ITCZ by the upper branches of the Hadley cells and accumulate within the zonal wind shear zones where the maximum CO mixing ratios are found. Anthropogenic and fires both contribute, by the same order of magnitude, to the CO budget of the African upper troposphere.
Local fires have the highest contribution and drive the location of the observed UT CO maxima. Anthropogenic CO contribution is mostly from Africa during the entire year, with a low seasonal variability. There is also a large contribution from Asia in JJASO related to the fast convective uplift of polluted air masses in the Asian monsoon region which are further westward transported by the tropical easterly jet (TEJ) and the Asian monsoon anticyclone (AMA).
O3 minima correspond to air masses that were recently uplifted from the surface where mixing ratios are low at the ITCZ. The O3 maxima correspond to old high-altitude air masses uplifted from either local or long-distance area of high O3 precursor emissions (Africa and South America during all the year, South Asia mainly in JJASO) and must be created during transport by photochemistry.
- Article
(7275 KB) - Full-text XML
- BibTeX
- EndNote


Tropospheric ozone (O3) has a significant impact on the oxidative capacity of the troposphere by being a major source of hydroxyl radicals (OH) (e.g., Lelieveld et al., 2016; Logan et al., 1981) and also on climate by being a powerful greenhouse gas (e.g., Myhre et al., 2013). The first source of tropospheric ozone is photolysis of NO2, mainly formed by photochemical cycles involving NOx, HOx, and volatile organic compounds (VOCs) or carbon monoxide (CO) (e.g., Seinfeld and Pandis, 2016). O3 is a secondary compound with a shorter average lifetime (19 d, Murray et al., 2014) whose contributions are difficult to identify. Indeed, O3 concentrations in the free to upper troposphere (UT) are influenced by (i) transport from the stratosphere (e.g., Hsu and Prather, 2009; Stevenson et al., 2013); (ii) tropospheric transport (e.g., Barret et al., 2016; Sauvage et al., 2005, 2007b; Zhang et al., 2016); (iii) emissions of precursors (VOCs, CO, HO2); (iv) NOx emissions by surface combustions but also by free-tropospheric lightning (e.g., Barret et al., 2010; Sauvage et al., 2007c); or by (v) the elimination of O3 by reaction with HO2, OH or photolysis in particular (e.g., Crutzen et al., 1999). Due to its 2-month lifetime (e.g., Edwards et al., 2004), CO is a good tracer of combustion processes (Granier et al., 2011) which emit O3 precursors (i.e., NOx, VOCs, CO). CO impacts the oxidative capacity of the troposphere by being a major sink of OH radicals in non-polluted atmosphere (e.g., Lelieveld et al., 2016) and therefore the climate through enhancement of the lifetime of CH4, the second most important greenhouse gas (GHG). Oxidation of CO produces CO2 and ozone, which are also GHGs (e.g., Myhre et al., 2013). If it is partly primary (directly emitted into the atmosphere from anthropogenic combustion or forest fires), CO can also be secondary by being formed during the oxidation of VOCs.
The intertropical troposphere is a region of great interest regarding the photochemistry and energy budget of the atmosphere. It indeed combines (i) strong photochemical activity due to intense solar radiation; (ii) high emissions by biomass fires, vegetation and lightning; and (iii) dynamic processes that allow the redistribution of chemical species at regional and global scales. It is therefore an area favorable to the formation of O3. It is also one of the areas of the world where the increase in O3 mixing ratio has been most pronounced since 1980 (Zhang et al., 2016). Africa has the largest continental surface of the intertropical zone and is also a region where high CO mixing ratios (locally above 150 ppb around 250 hPa, e.g., Barret et al., 2010; Cohen et al., 2018; Fu et al., 2016; Sauvage et al., 2007d) are found in the UT. Circulation patterns above intertropical Africa impact the distribution of chemical compounds in the area (e.g., Sauvage et al., 2005, 2007a, c). One of the main circulation patterns is formed by winds from subtropical latitudes to the Equator. They converge at the Intertropical Convergence Zone (ITCZ) before being redistributed vertically, thus forming the Hadley cells. The meridional position of the ITCZ has a strong seasonal variability over Africa (e.g., Suzuki, 2011), causing the alternation of dry and wet seasons. This meteorology particularly impacts the O3 and CO distributions in the African UT (e.g., Sauvage et al., 2007d) but also their propagation in the global atmosphere (e.g., Zhang et al., 2016).
Despite the importance of this area, few observations have been carried out and Africa remains little documented in comparison with the northern mid-latitudes. The specific meteorology of the zone makes it difficult for the models to reproduce the concentrations of O3 and CO, notably at high altitude (e.g., Barret et al., 2010; Sauvage et al., 2007a). Satellite observations have been used to document the composition of the African UT, but they have a rather coarse vertical resolution (Barret et al., 2008, 2010).
Since 1994, in the framework of the In-service Aircraft for a Global Observing System program (IAGOS, previously named MOZAIC; Marenco et al., 1998; Petzold et al., 2015; http://www.iagos.org, last access: 20 September 2020), airborne measurements of chemical compounds have been made over Africa. Using upper-tropospheric measurements of O3 and relative humidity (RH) from 1994 to 2004, Sauvage et al. (2007d) showed an ozone minimum collocated with a RH maximum at the ITCZ. Both vertical transport in the ITCZ followed by photochemical production in the upper branches of the Hadley cells were found to contribute to meridional O3 gradient creation. Few CO measurements were available at this time and none south of the ITCZ.
Between December 2005 and 2013 (2006–2013 hereafter), there were almost daily flights by Air Namibia equipped with IAGOS instruments between Europe and southern Africa, thus providing a unique and highly representative dataset of in situ O3 and CO on both sides of the ITCZ. The SOFT-IO model (Sauvage et al., 2017b) has been developed to complement the IAGOS database to estimate anthropogenic and fire contributions to CO for each IAGOS measurement. These measurements, together with the SOFT-IO model outputs, allow us to trace the distributions, variability, and origins of O3 and CO in the African UT. Since 2008, the Infrared Atmospheric Sounding Interferometer (IASI) instrument aboard the Metop-A satellite has also documented UT CO and O3 global distributions (Barret et al., 2016; Tocquer et al., 2015) and therefore complements the African transects provided by IAGOS.
The objectives of this study are to (i) analyze the meridional distribution of O3 and CO mixing ratios observed by IAGOS between 2006 and 2013, (ii) explore sources and geographical origins of observed CO anomalies (calculated with the SOFT-IO model), and (iii) give first track on which transport processes drive the CO and O3 meridional transects observed especially using retro plumes (calculated with the Lagrangian particle dispersion model FLEXPART) of air masses measured by IAGOS. Observational (IAGOS, IASI) and model-based (SOFT-IO) datasets and methods are introduced in Sect. 2. In Sect. 3, the method to locate the ITCZ and establish the seasonality with IAGOS observations is described and validated. In Sect. 4, O3 and CO seasonal meridional transects observed by IAGOS are analyzed and compared to IASI observations. In Sect. 5, origins and sources of observed CO are explored with SOFT-IO, and, finally, characterization of O3 transects is discussed in Sect. 6.
2.1 IAGOS-MOZAIC observations
This study is based on the observations made in the framework of the Measurements of ozone, water vapor, carbon monoxide and nitrogen oxides by Airbus in-service aircraft (MOZAIC) program (Marenco et al., 1998), now integrated into its successor program: IAGOS (https://www.iagos.org, last access: 28 April 2020) (Petzold et al., 2015). In MOZAIC, O3 and RH has been measured since 1994 and CO since 2002 by airliners of several companies.
In MOZAIC and IAGOS, a dual-beam UV absorption monitor is used to measure O3 with a time resolution of 4 s and accuracy estimated at ±2 ppbv/±2 % (Thouret et al., 1998). An improved infrared filter correlation instrument measures CO with a time resolution of 30 s and accuracy estimated at ±5 ppbv/±5 % (Nédélec et al., 2003). Since the setting up of the IAGOS program, a single analyzer integrates O3 and CO measurements (Nédélec et al., 2015). In MOZAIC, capacitive relative humidity sensors were used to measure RH (MOZAIC Capacitive Hygrometer MCH) (Helten et al., 1998; Neis et al., 2015a, b; Smit et al., 2014). For the IAGOS program, MCHs were slightly modified and RH is measured by the IAGOS Capacitive Hygrometer (ICH) (Neis et al., 2015b). Both MCH and ICH instruments measure RH with a time resolution from 1 s at 300 K to 120 s at 200 K and accuracy estimated at ±5 % (Helten et al., 1998; Neis et al., 2015b). During the 2011–2012 overlapping years of the MOZAIC and IAGOS programs, systematic inter-comparisons were performed and have demonstrated a good consistency in the both dataset (Nédélec et al., 2015). For convenience and as the IAGOS program database integrates MOZAIC program data, the MOZAIC and IAGOS programs are hereafter commonly referred to as the IAGOS program.
Between December 2005 and November 2013, one Air Namibia aircraft equipped with IAGOS instruments (except in 2010 for technical reasons) operated daily flights between Europe (London or Frankfurt) and Windhoek in Namibia. It represents approximately 2200 flights in the African upper troposphere (between 9 and 12 km altitude) with observations of O3, CO and RH but also measurements of instant winds (zonal and meridional components, speeds and directions) from the aircraft navigation instruments. Given its large spatial and temporal coverage, this dataset is unique and offers outstanding opportunities for studying the O3 and CO budget in this region.
Flight trajectories span a wide range of latitudes (between 22∘ S and 51∘ N) for a limited variation of longitude (between 17 and 0∘ E), which allows investigating the meridional distribution of both trace gases.
2.2 Complementary data
2.2.1 Model-calculated parameters for the IAGOS data points: potential vorticity and SOFT-IO CO contributions
In order to explore origins and sources of CO mixing ratios observed by IAGOS and to characterize the meridional transects, we use the SOFT-IO v1.0 model (Sauvage et al., 2017a, https://doi.org/10.25326/2). SOFT-IO v1.0 development and operation are described in detail in the reference paper by Sauvage et al. (2017b), and SOFT-IO data are freely available in the IAGOS database (https://doi.org/10.25326/3). Briefly, SOFT-IO is a scientific tool which couples FLEXPART 20 d backward plumes of air masses for all the aircraft tracks with global anthropogenic and fire emission inventories for CO and has been used in various studies (e.g., Cussac et al., 2020; Petetin et al., 2018) to investigate and quantify anthropogenic and biomass burning origin in CO measurements. For the entire IAGOS flight track, SOFT-IO v1.0 estimates the CO contribution (in ppb) of recent (≤20 d before) worldwide emissions. Estimated contributions are discriminated on the one hand between anthropogenic and fire origins and on the other hand between the 14 different world regions of emissions as defined in Global Fire Emissions Database (GFED; see Fig. 1).
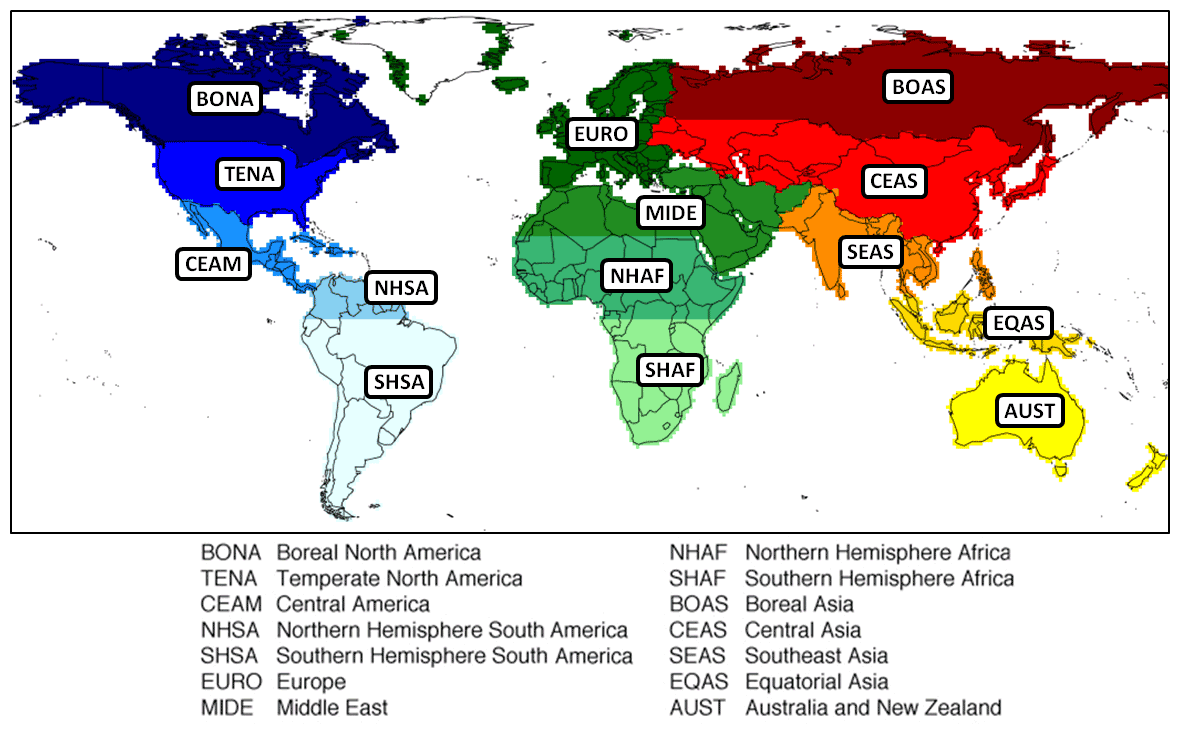
Figure 1Global Fire Emissions Database (GFED) world regions of emission as used in the SOFT-IO v1.0 model.
In SOFT-IO v1.0, the version of FLEXPART (Seibert and Frank, 2004; Stohl et al., 2005) is the v9.1 used in backward mode. The estimations of worldwide ground emission contributions to upper-tropospheric measurements depend strongly on the representation adopted for the atmospheric transport and especially for the vertical transport. In our version of FLEXPART, vertical convection is represented using the convective parameterization scheme by Emanuel and Živković-Rothman (1999) as described by Forster et al. (2007). The global meteorological data for FLEXPART operation are taken from the European Centre for Medium-Range Weather Forecast (ECMWF) analyses (6 hourly) and forecasts (3 hourly), gridded with a horizontal resolution and 91 vertical levels (137 for year 2013) (Forster et al., 2007; Sauvage et al., 2017b; Stohl et al., 2005).
In this study, the monthly Monitoring Atmospheric Composition and Climate (MACC)/CityZEN EU projects (MACCity) inventory is used for anthropogenic emissions (Diehl et al., 2012; Granier et al., 2011; Lamarque et al., 2010; Van Der Werf et al., 2006) with a longitude–latitude resolution of and emissions injected in the first altitude level (0–1 km). For fire emissions, the daily Global Fire Assimilation System (GFAS) in its 1.2 version is used (Kaiser et al., 2012) with a longitude–latitude resolution. As vegetation fires are usually associated with fast updraft, emissions need to be injected at altitude. GFAS inventory integrates injection height data estimated with the Integrated Monitoring and Modeling System for wildland fire parameterization (IS4FIRES, Sofiev et al., 2012) and the Plume Rise Model (PRM, Freitas et al., 2007; Rémy et al., 2017). Default injection heights provided in GFAS are used in this study, as described by Sauvage et al. (2017b).
SOFT-IO v1.0 only estimates contributions for anomalies in CO mixing ratios, i.e., primary CO recently emitted (≤20 d before). Background CO, i.e., primary CO emitted for more than 20 d and secondary CO formed by volatile organic compound oxidation, is not calculated.
Recently IAGOS database also provides additional ECMWF analysis parameters interpolated along each flight track (http://iagos-data.fr/#CMSConsultPlace:ANCILLARY_DATA, last access: 20 September 2020; http://www.iagos-data.fr/#L4Place, last access: 20 September 2020). In this study we use potential vorticity to determine stratospheric observations (see Sect. 2.3). The potential vorticity (PV) values are calculated with the FLEXPART Lagrangian model using meteorological fields from ECMWF (European Centre for Medium-Range Weather Forecasts) operational analysis, with a resolution, and interpolated along the aircraft flight path.
2.2.2 IASI-SOFRID O3 and CO retrievals
IASI satellite data are used to complement IAGOS observations to document the African UT composition. Indeed, IASI provides daily 2D distributions of UT CO and O3 that put the 1D IAGOS transects into a broader regional context and help document the transport processes that control these distributions. The IASI instrument is flying aboard the Metop-A, B and C satellites launched in 2006, 2012 and 2018 respectively. IASI is a nadir-viewing Fourier transform spectrometer observing the Earth's atmosphere thermal infrared radiation in the 645–2760 cm−1 wavenumber region with a spectral resolution of 0.5 cm−1 after apodization (e.g., Clerbaux et al., 2009). Metop-A/IASI provides a global coverage twice a day with an overpass time at and local solar time and a pixel size on the ground of 12 km at nadir. The IASI sensors monitor the tropospheric content of atmospheric trace gases such as O3 (Barret et al., 2011; Eremenko et al., 2008) and CO (George et al., 2009; De Wachter et al., 2012). In the present study, we use data retrievals performed by the Software for a Fast Retrieval of IASI Data (SOFRID) (Barret et al., 2011; De Wachter et al., 2012).
Vertical profiles are retrieved from IASI cloud-free spectra on 43 fixed pressure levels from the surface to 0.1 hPa. Barret et al. (2011) have shown that IASI enabled the independent retrieval of O3 in the lower–middle troposphere (surface-225 hPa) and in the upper troposphere–lower stratosphere (UTLS, 225–70 hPa). The agreement with O3 sonde data is especially good for the UTLS column with correlation coefficients of 0.8 (respectively 0.95) and biases of 17.5±20 % (respectively 10±10 %) in Dufour et al. (2012) (respectively Barret et al., 2011). According to De Wachter et al. (2012) SOFRID-CO retrievals also provide two independent pieces of information, one in the lower and the other one in the upper troposphere. The SOFRID-CO data have been validated against IAGOS-MOZAIC airborne in situ data (De Wachter et al., 2012). SOFRID-CO retrievals are able to capture the seasonal variability of CO at mid-latitudes (Frankfurt) as well as at tropical latitudes (Windhoek) in the lower (upper) troposphere with correlation coefficients of 0.85 (0.70). At Windhoek, in the lower (upper) troposphere, SOFRID-CO data are biased low with 13±20 % (4±12 %). SOFRID-CO and O3 data have been used to document the composition of the UTLS Asian monsoon anticyclone (AMA) in Barret et al. (2016). In the present study, we use monthly averaged SOFRID-CO and O3 retrievals on a grid. IASI data used span the 2008–2013 period.
2.2.3 NCEP/NCAR reanalysis data
In order to discuss and validate the methodology applied to locate the ITCZ from IAGOS meteorological data, NCEP reanalysis data of RH, winds and outgoing longwave radiation (OLR) were used (Kalnay et al., 1996; https://www.esrl.noaa.gov/psd/cgi-bin/data/composites/printpage.pl, last access: 28 April 2020). NCEP reanalysis data are a global analysis of atmospheric fields combining measurements (land surface, ship, rawinsonde, aircraft, satellite, etc.) with modeling data, using a data assimilation system covering a large period from 1957 to today.
2.3 IAGOS and SOFT-IO data treatment
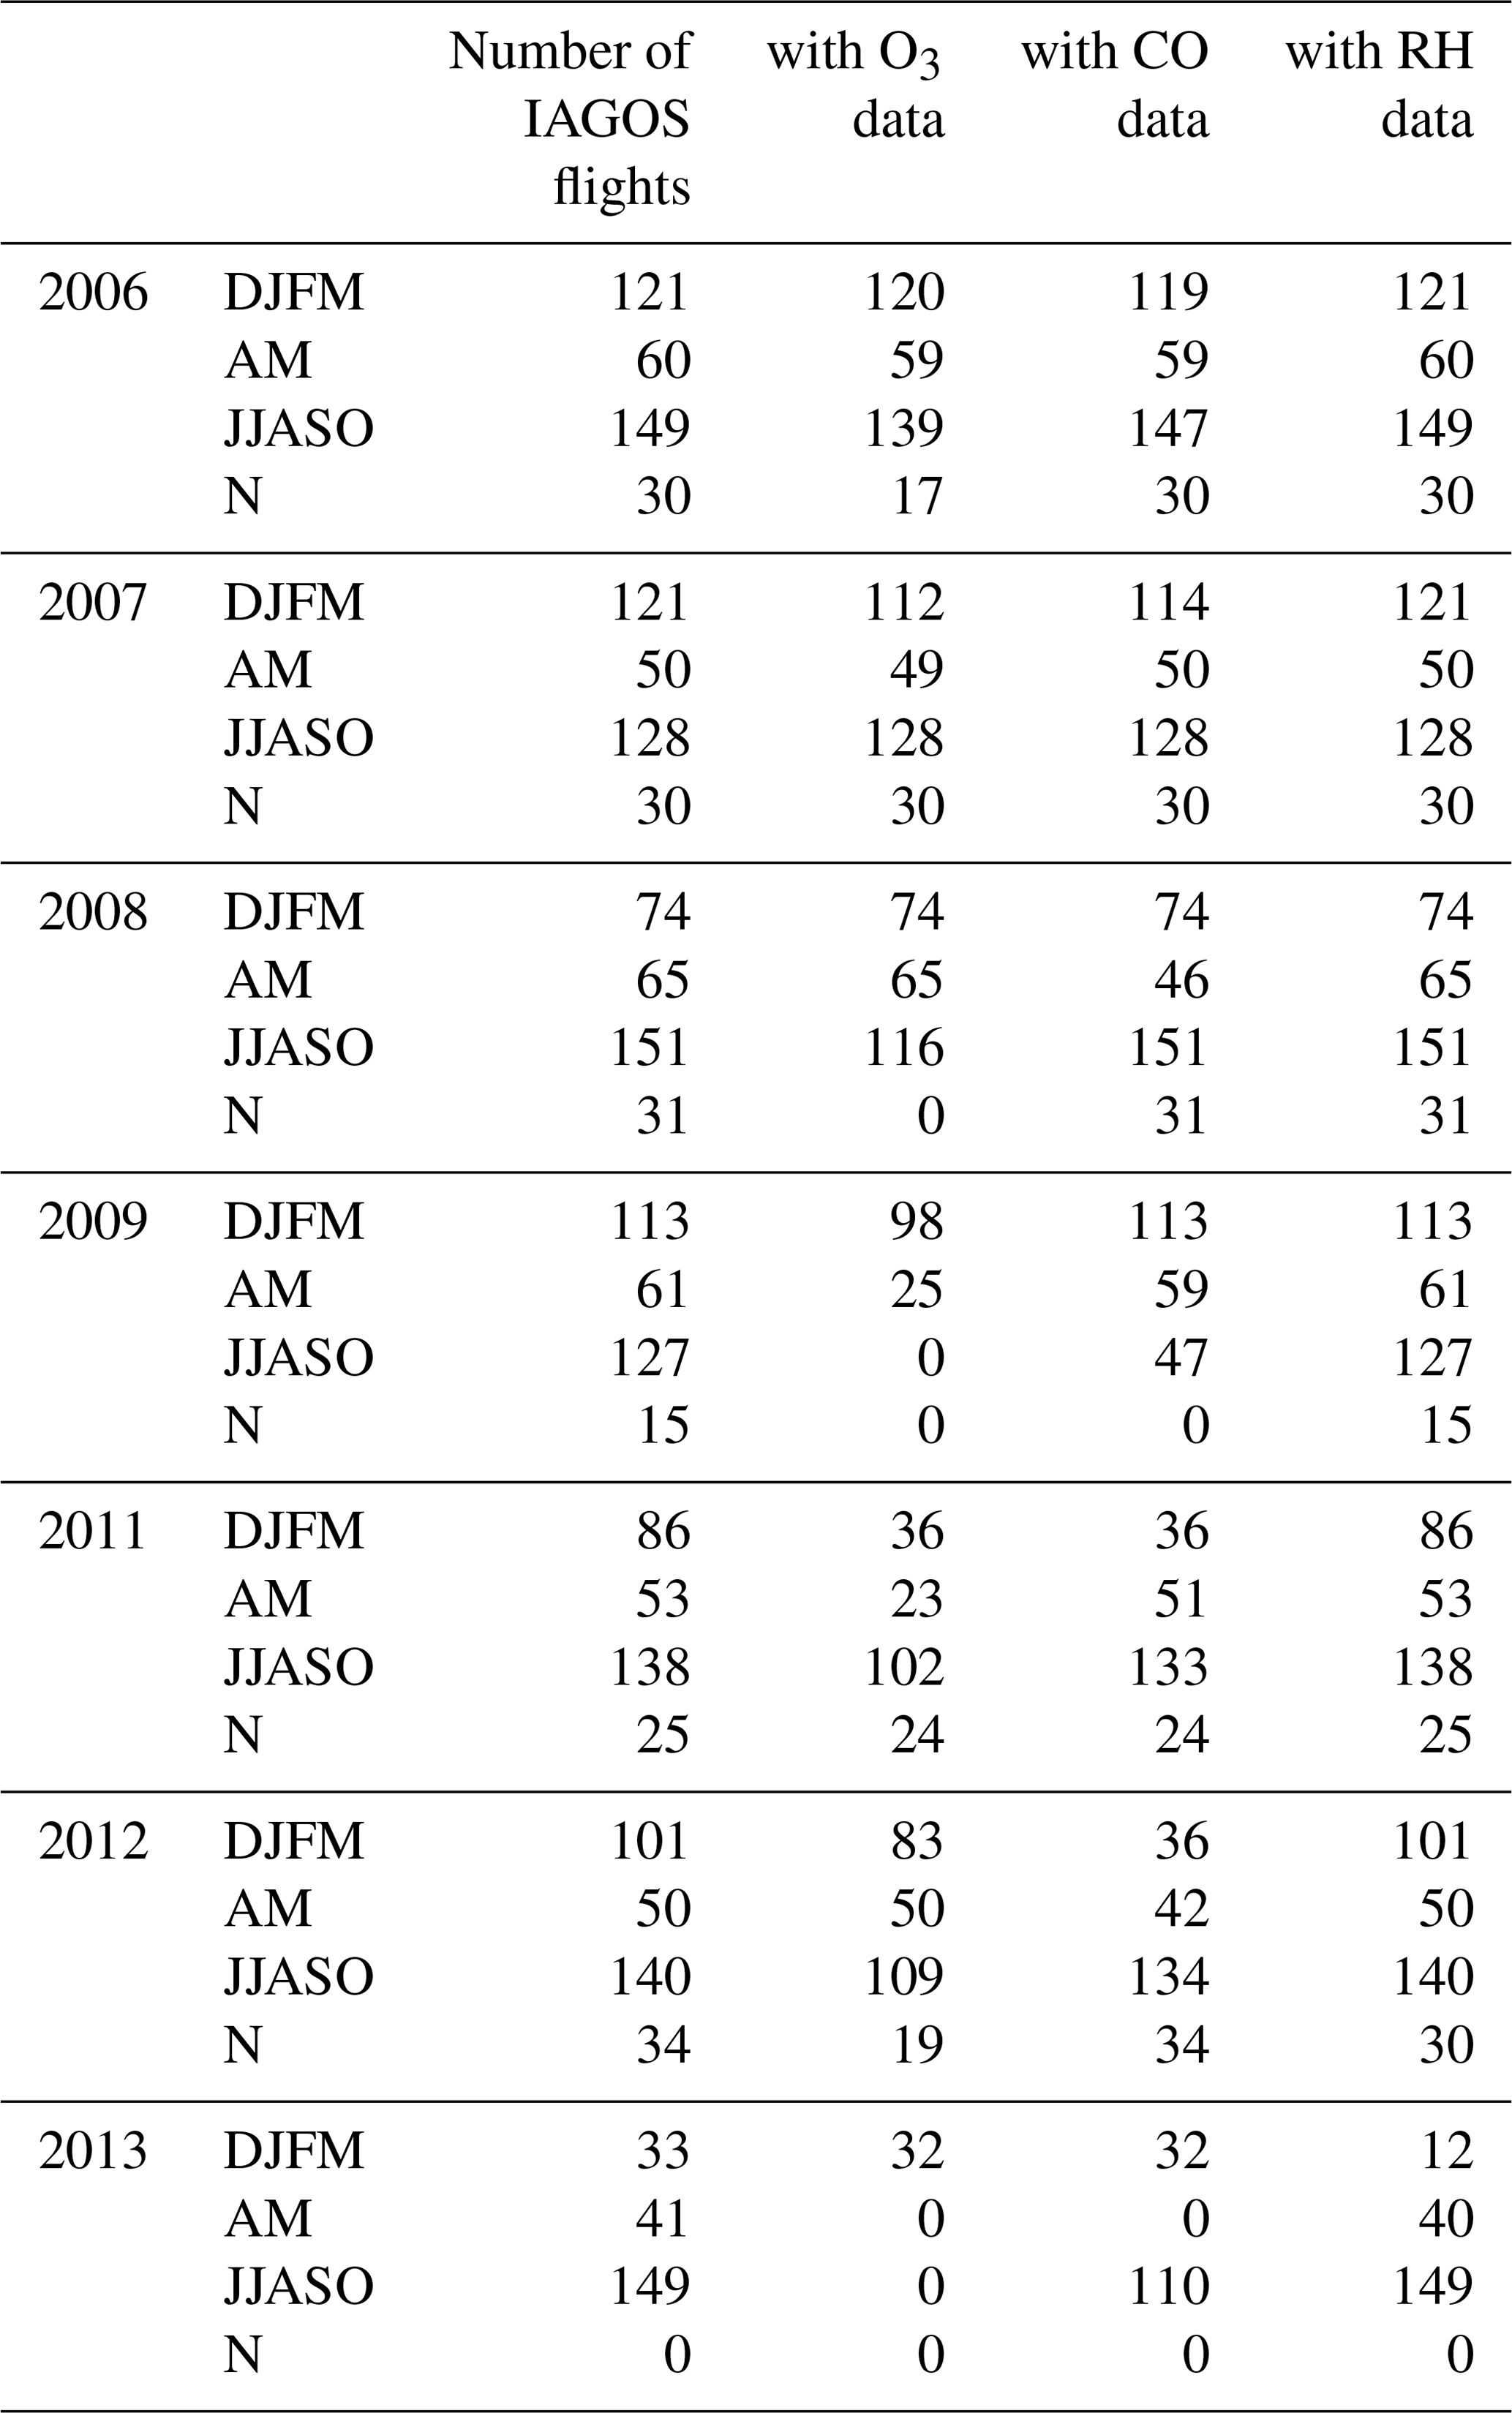
This study focuses on the African UT. To eliminate lower-tropospheric data, only high-altitude observations recorded above 300 hPa are selected (thus removing observations collected during takeoffs and landings). In the intertropical latitudes, only tropospheric air masses are encountered due to the high altitude of the tropopause, but in the extratropical latitudes, both tropospheric and stratospheric air masses can be encountered. To discriminate upper-tropospheric and lower-stratospheric data we use the dynamical tropopause defined as the isosurface of 2 PVU (potential vorticity unit) as in Thouret et al. (2006) and recently used in Cohen et al. (2018). The tropopause is actually considered as a 30 hPa thick layer, centered on the 2 PVU isosurface. To consider only upper-tropospheric data, observations obtained at a pressure greater than the 2 PVU pressure +15 hPa are eliminated. Finally, data are aggregated and averaged by degree of latitude on the entire meridional transect. Data are also averaged for different time periods as described in detail in the following subsection. Table 1 presents the number of IAGOS flights with O3, CO or RH data available for each season of the studied period (see Sect. 3 for precisions on the season's delimitation methodology).
Table 1List of available IAGOS data per season (see Sect. 2.4 for more details on season definition).
Ozone precursors are emitted in large quantities across the African continent (Liousse et al., 2014; Sauvage et al., 2007b), but our understanding of the transport and effects of these precursors is limited by a lack of in situ data in the African UT. The climate of southern and northern Africa is characterized by alternating wet and dry periods which are modified by the position of the ITCZ. Within the ITCZ warm and humid surface air masses converge and are convectively uplifted into the upper troposphere. The position of the convergence zone gives rise to the “wet” seasons. The uplifted air masses are then advected polewards in the upper branches of the Hadley cells. In the upper troposphere, the air masses are zonally transported by (i) the northern and southern subtropical jets, (ii) the flow from the South Atlantic anticyclone, and (iii) the easterly winds of the tropical easterly jet (TEJ) and Asian monsoon Anticyclone (AMA) (in boreal summer) (e.g Krishnamurti et al., 2013). The dry air in the descending branches of these cells creates the conditions for wildfires and the resulting emission of ozone precursors. Seasonality in Africa is thus closely related to the geographical shift of the ITCZ from the Northern Hemisphere during the boreal summer to the Southern Hemisphere during the boreal winter. The classic four seasons of 3 months are therefore not adapted to our vast area of study centered on the African inter-tropical zone, and it was therefore necessary to establish a new definition of seasons.
3.1 Seasonality of the position of the ITCZ according to IAGOS data
In the UT the ITCZ is characterized by (i) high levels of RH, (ii) the predominance of easterly zonal winds, and (iii) the divergence of meridional winds. We use the meteorological fields (RH and zonal winds) measured by the IAGOS aircraft along with NCEP reanalysis (Sect. 3.2) to locate the position of the ITCZ and to identify seasonal regimes which we will use in later sections. The meridional monthly transects of winds and RH were analyzed to locate the latitude of the ITCZ during each month of the studied years. Seasons were then defined by grouping monthly data presenting an internal consistency for each parameter: zonal and meridional winds and RH. This analysis allowed us to define two main seasons:
-
from December to March (DJFM), during which the position of the ITCZ along the trajectory of IAGOS flights is relatively stable between 14.5 and 4.5∘ S;
-
from June to October (JJASO), during which the position of the ITCZ is relatively stable between 4.5 and 9.5∘ N.
And we also defined two so-called transition periods:
-
from April to May (noted AM in tables and figures), during which the ITCZ position shifts to the north;
-
the month of November (noted N in tables and figures), during which the ITCZ position shifts to the south.

Figure 2IAGOS meridional and seasonal transects of zonal winds (a–d), meridional winds (e–h) and relative humidity (m–p). Panels (i)–(l) are schematic representations of average easterly winds zone latitudes (colored rectangles), average latitude of meridional wind divergence (black lines), and average latitude of the intersection between flight trajectories and the tropopause (northern limit of tropospheric measurements). The vertical blue shaded areas represent the deduced ITCZ position. The grey areas represent the NCEP data range at 250 hPa for the winds and 300 hPa for relative humidity on the flight trajectories for the 2006 to 2013 period.
We use these definitions in the following sections. Figure 2 shows the IAGOS inter-tropical seasonal mean transects of zonal winds (Fig. 2a–d), meridional winds (Fig. 2d–g) and RH (Fig. 2m–p). Inter-tropical transect boundaries are fixed as (i) 20∘ S in the Southern Hemisphere (latitude of the first measurements at high altitude in the south) and (ii) the average latitude at which the flights cross the tropopause in the Northern Hemisphere (blue lines in Fig. 2i–l). This latest limit ranges between 34 and 38∘ N in JJASO and between 26 and 28∘ N in DJFM.
The zonal wind transects display a low interannual variability which allows us to clearly locate the zone of easterly wind (zonal winds <0 m s−1) framing the ITCZ at each season (colored rectangles in Fig. 2i–l). Easterly winds are found from 18∘ N and 8∘ S in JJASO and between 7∘ N and 18∘ S in DJFM. With lower intensity, meridional winds are used to locate the divergence latitude of meridional winds in the easterly wind zone of the ITCZ: at ∼8∘ N in JJASO and ∼7∘ S in DJFM (black lines in Fig. 2i–l). The Hadley cells are known to be non-symmetric about the ITCZ, with the winter cell stronger and broader than the summer cell (Tanaka et al., 2004). Here, observations are in agreement with this statement, with stronger meridional winds north of the ITCZ in DJFM (∼2 versus 6 m s−1 respectively 10∘ S and N of the meridional wind divergence latitude) and south of the ITCZ in JJASO (∼4.5 versus 2.5 m s−1 respectively 10∘ S and N). For the transition periods, the location of the mean divergence does not really make sense because of the shift of the ITCZ during these periods. However, we can observe the thinning of the easterly wind band and the decrease in wind intensity inside of the band during April–May (easterly wind band ranging from 8∘ N at 7∘ S with mean zonal wind intensities <5 m s−1, Fig. 2b).
The transects of average RH with respect to liquid water show low interannual variability for the three DJFM, April–May and JJASO periods. For the period of November a large variability is observed and can be explained in part by the limited number of data and the transitory nature of the period (i.e., with fast variation in meteorology). The transects of the main seasons show maxima of RH located at the ITCZ as well as a new increase at the northern latitudes of the studied area. The RH maxima and therefore the ITCZ are located between 14.5 and 4.5∘ S in DJFM and between 4.5 and 9.5∘ N in JJASO. For the April–May transition period, two mean RH peaks are observable due to the northward displacement of the ITCZ during this period. The location of the ITCZ for the two main seasons is shown in Fig. 2. In the next section, the IAGOS data along linear flight tracks are compared with NCEP reanalysis to offer a broader meteorological context.
3.2 Consistency with NCEP/NCAR reanalysis data
Figure 3e–h shows the mean RH at 300 hPa above Africa for the four seasons, as defined above, between 2006 and 2013 from NCEP reanalysis data along with the all the individual IAGOS flight tracks during the same period. In complement, NCEP data range is also presented in Fig. 2 by grey areas. The NCEP reanalysis shows a zone of high RH (RH>60 %) framed by two areas where the RH<22.5 % and whose positions change during the year. In JJASO (Fig. 3g), the humid area is located on the northern edge of the Gulf of Guinea (∼10∘ N to 2∘ S on the flight trajectories). In DJFM (Fig. 3e), the humid area is located on the southeastern edge of the Gulf of Guinea (∼0 to 15∘ S). These locations of the high RH, associated with the ITCZ, are in agreement with IAGOS observations (Fig. 2m and o). The seasonal evolution of the RH amplitude on the flight trajectories is also in agreement with IAGOS, with higher amplitude in JJASO than in DJFM due to the shifting of the low-RH areas east and west from the flight tracks (Fig. 3e).
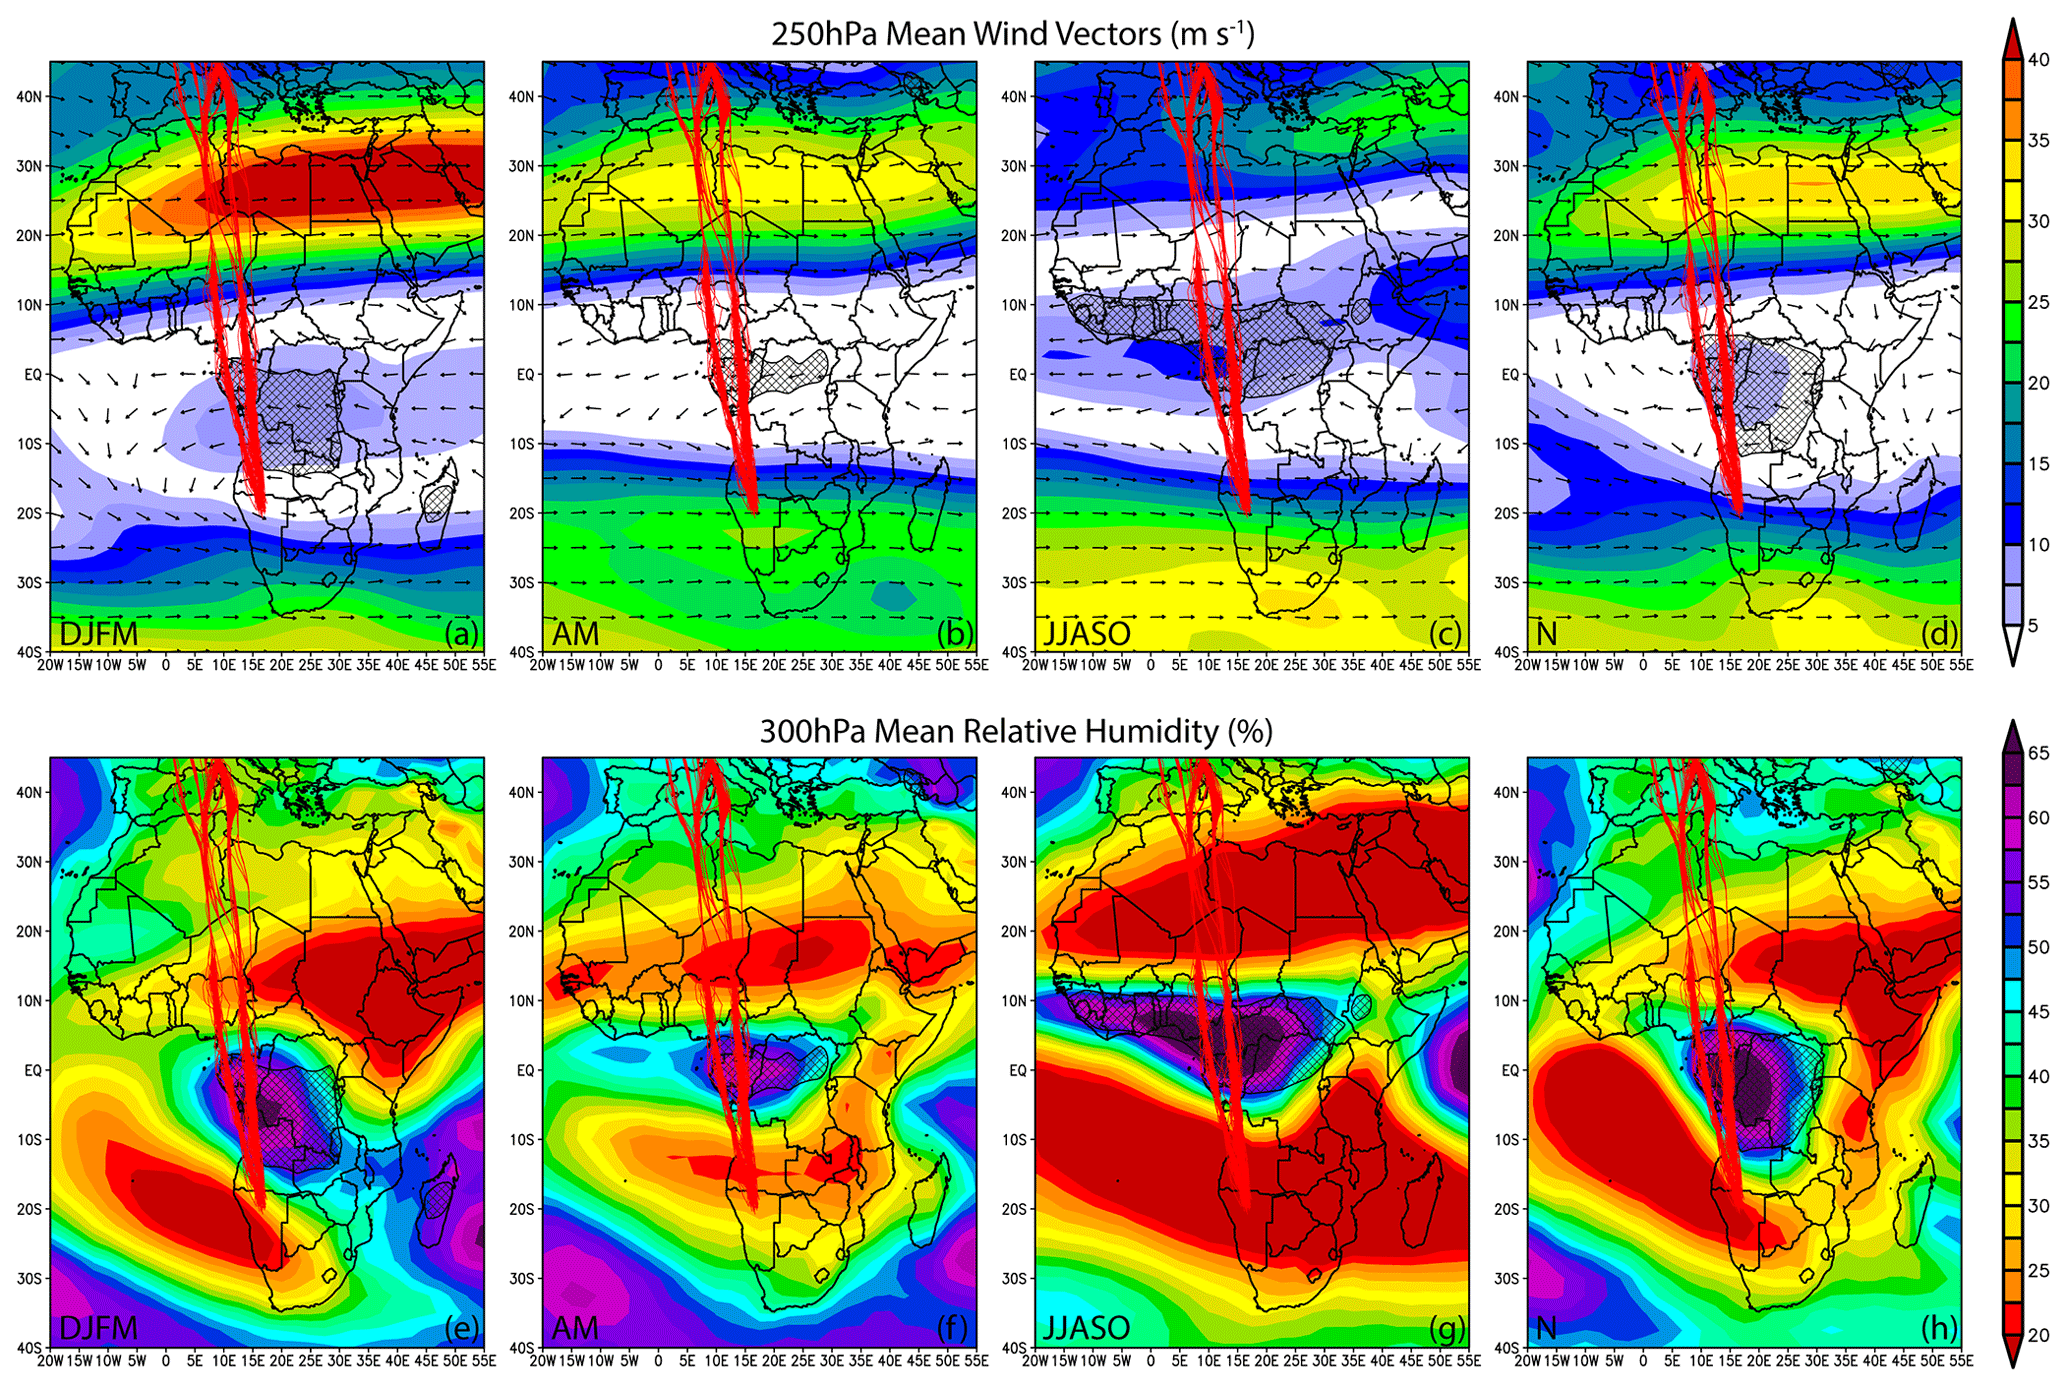
Figure 3Seasonal mean wind circulation at 250 hPa (a–d) and mean relative humidity at 300 hPa (e–h) above Africa between 2006 and 2013 from NCEP reanalysis. Red lines represent the IAGOS flight trajectories. Black hatched contours represent areas with OLR <220 W m−2.
Between these two seasons, in April–May (Fig. 3f) and November (Fig. 3h), the position of the different humid and dry zones in the upper troposphere correspond to intermediate situations. In April–May, it is interesting to note that the RH range appears to be lower than the rest of the year ( %), with fewer marked and extensive dry areas and a small humid area. This is partly explained by the rapidly changing meteorological conditions over this period (e.g., Suzuki, 2011) and its 2-month average in Fig. 3f.
Figure 3a–d shows the mean circulation at 250 hPa above Africa for the four seasons (2006–2013) from NCEP reanalysis. In JJASO (Fig. 3c), the zone of easterly winds is at its northernmost position with zonal wind inversion latitudes around 17∘ N and 7∘ S on the trajectory of IAGOS flights, and the inversion of the meridional winds is observed around 10∘ N, locating the ITCZ at the same latitude as with IAGOS data. In DJFM (Fig. 3a), the easterly wind zone is at its southernmost position with zonal wind inversion latitudes around 5∘ N and 17∘ S, and the inversion of the meridional winds is observed around 5∘ S, in agreement with in situ measurements.
Between these two seasons, in April–May (Fig. 3b), we observe that the position of the easterly wind zone lies, as expected, between that of DJFM and that of JJASO. This band of easterly winds is thinner (15∘ compared with 24∘ in JJASO and 22∘ in DJFM) and has a lower average wind speed (<5 m s−1) compared with main seasons as observed with IAGOS (Fig. 2b).
Finally, the OLR is also a good indicator of the position of the ITCZ. Deep convective clouds present at the ITCZ are associated with OLR below 220 W m−2 (e.g., Park et al., 2007). These areas are represented in Fig. 3 by black hatched contours. We observe that these areas above Africa correspond to high-RH zones and latitudes dominated by easterly winds where the meridional component is close to 0. All these NCEP reanalysis data corroborate IAGOS observations and validate previous methodology developed to locate the ITCZ with IAGOS in situ measurements.
4.1 IAGOS observations
Figure 4 shows IAGOS average meridional transects of O3 (Fig. 4a, b, e and f) and CO (Fig 4c, d, g and h) for the four seasons defined in Sect. 3.1. The study focuses on DJFM and JJASO seasons. Indeed, the analysis and interpretation of the transects for the two transition periods (noticed AM and N) is difficult because of the important meteorological variations that occur during these transition periods. Table 2 summarizes the locations and extremum levels of the meridional O3 and CO transects seen by IAGOS.
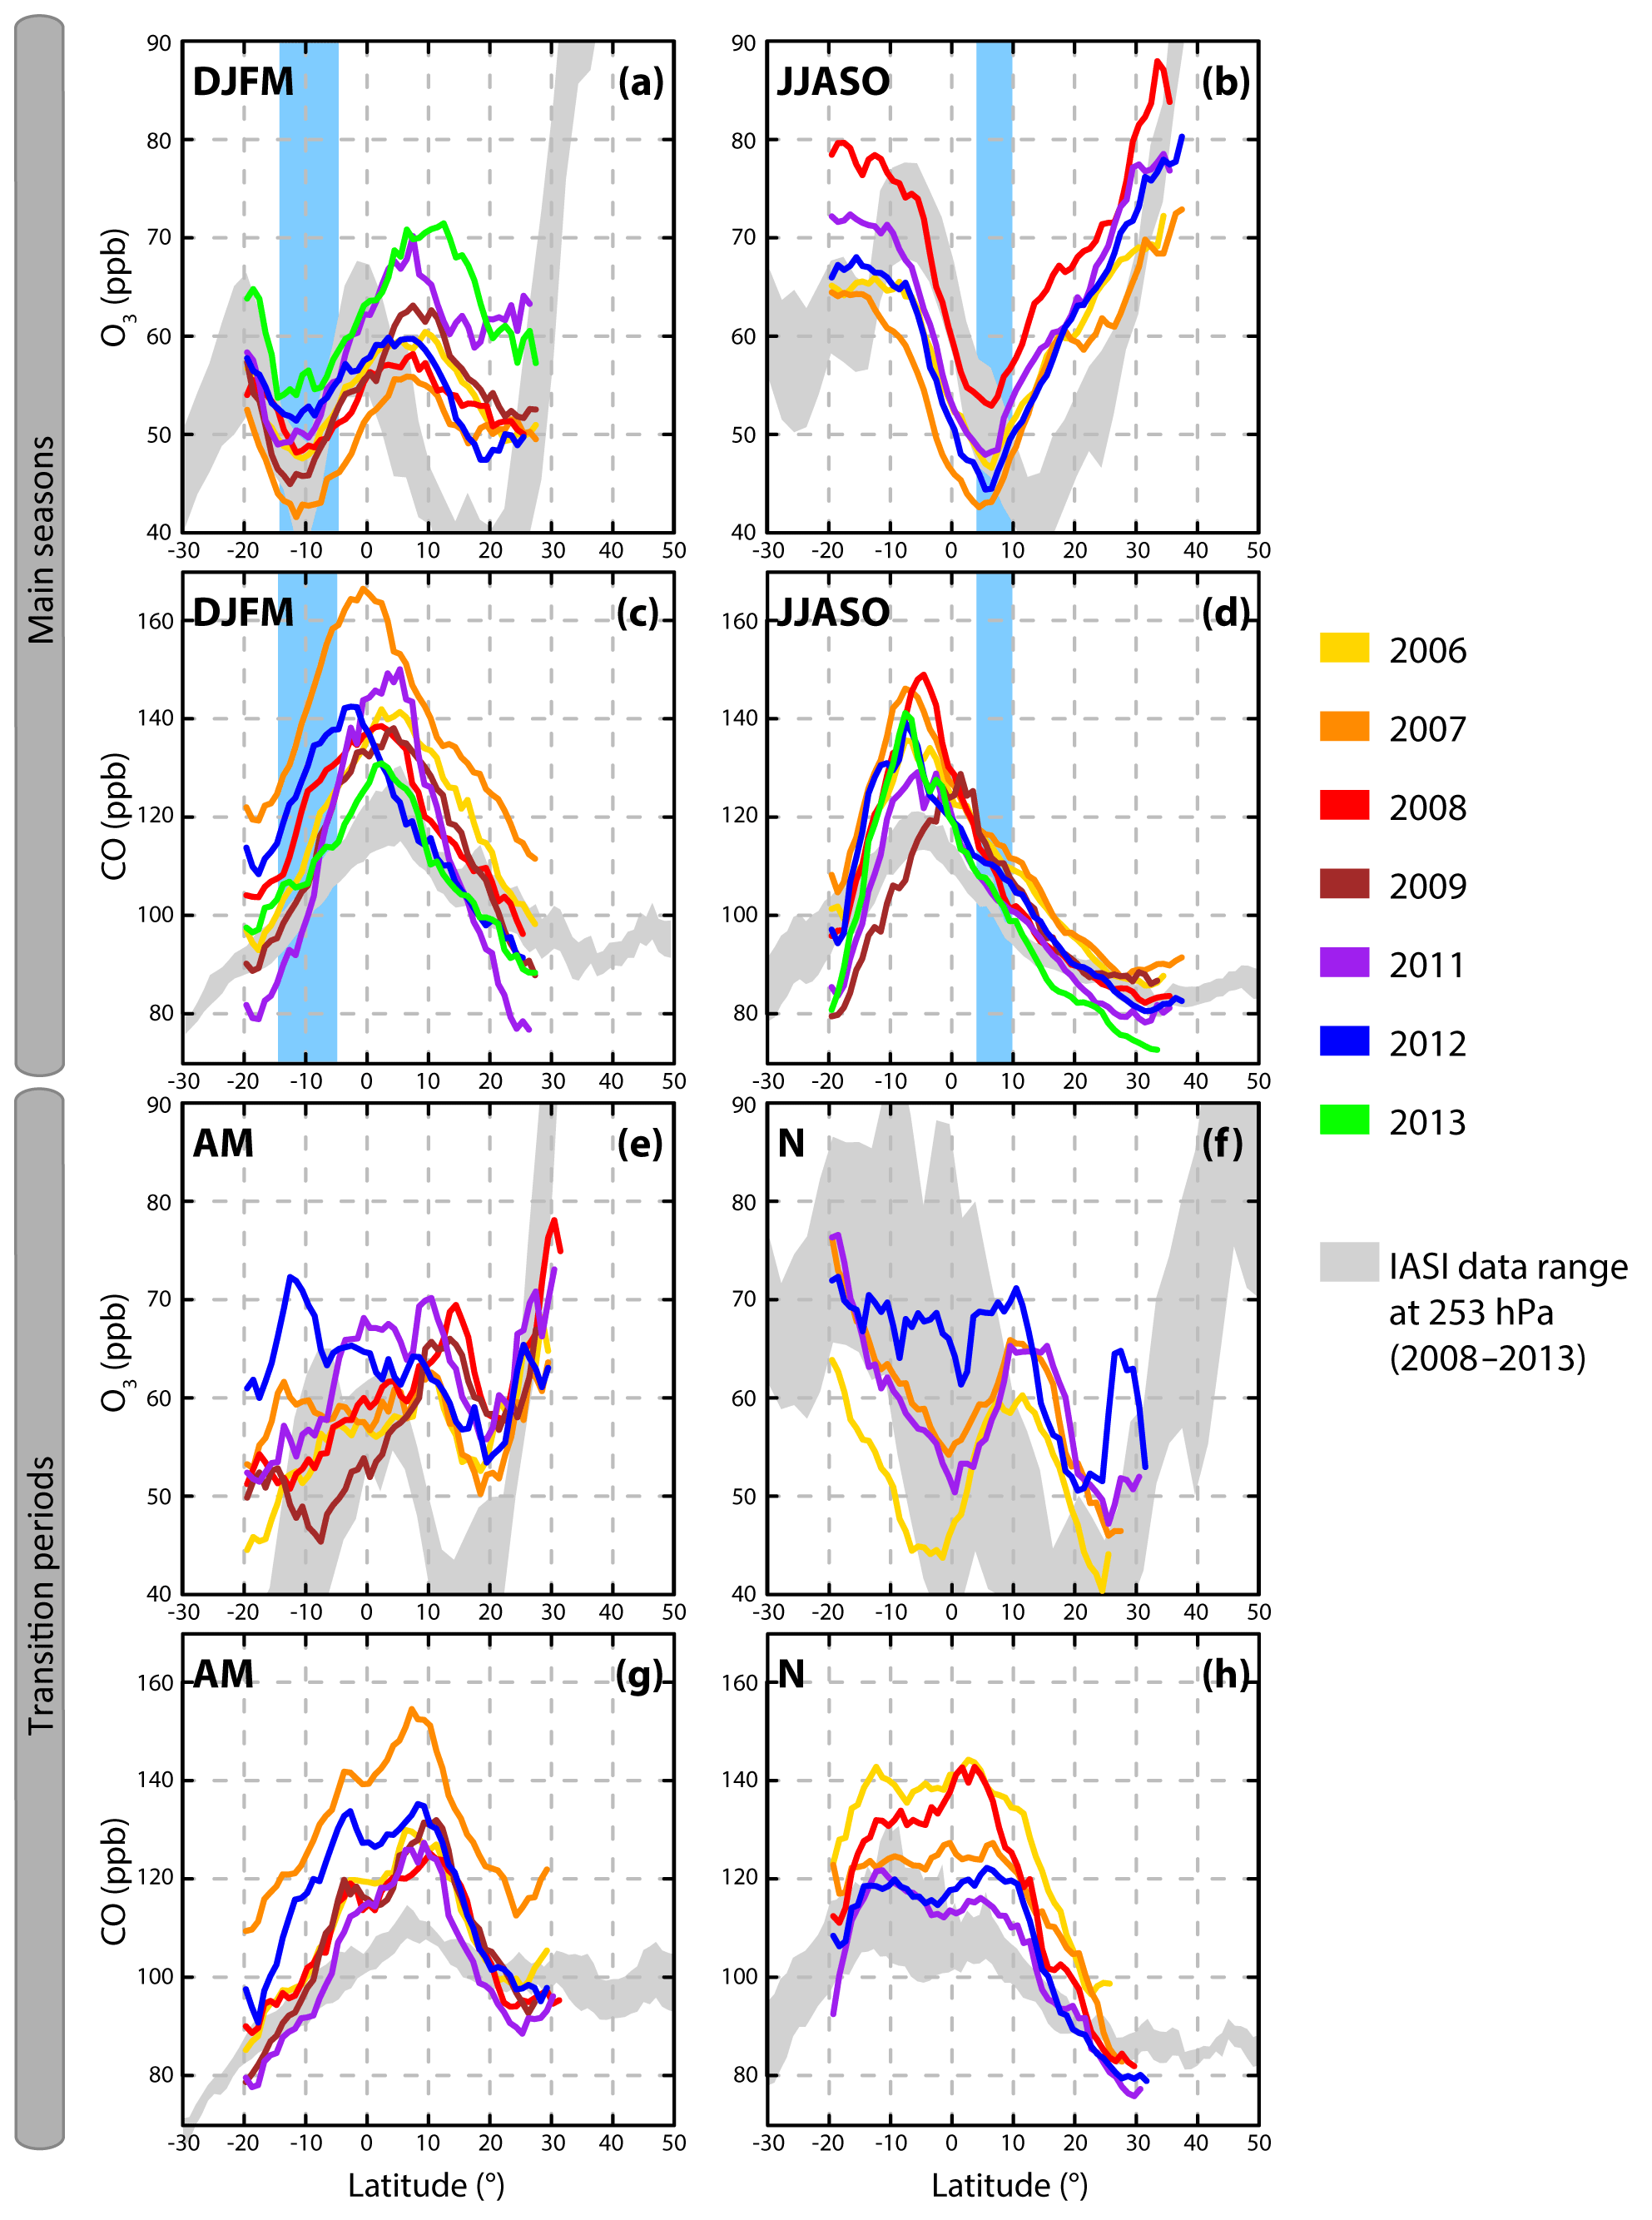
Figure 4IAGOS meridional and seasonal transects of ozone (a, b, e, f) and carbon monoxide (c, d, g, h). The vertical blue rectangles represent the deduced ITCZ position. The grey areas represent the IASI data range at 253 hPa on the flight trajectories for the 2008 to 2013 period (no data available before 2008).
Table 2Synthesis of the characteristics of meridional distributions of CO and O3 in the African upper troposphere as seen by IAGOS.
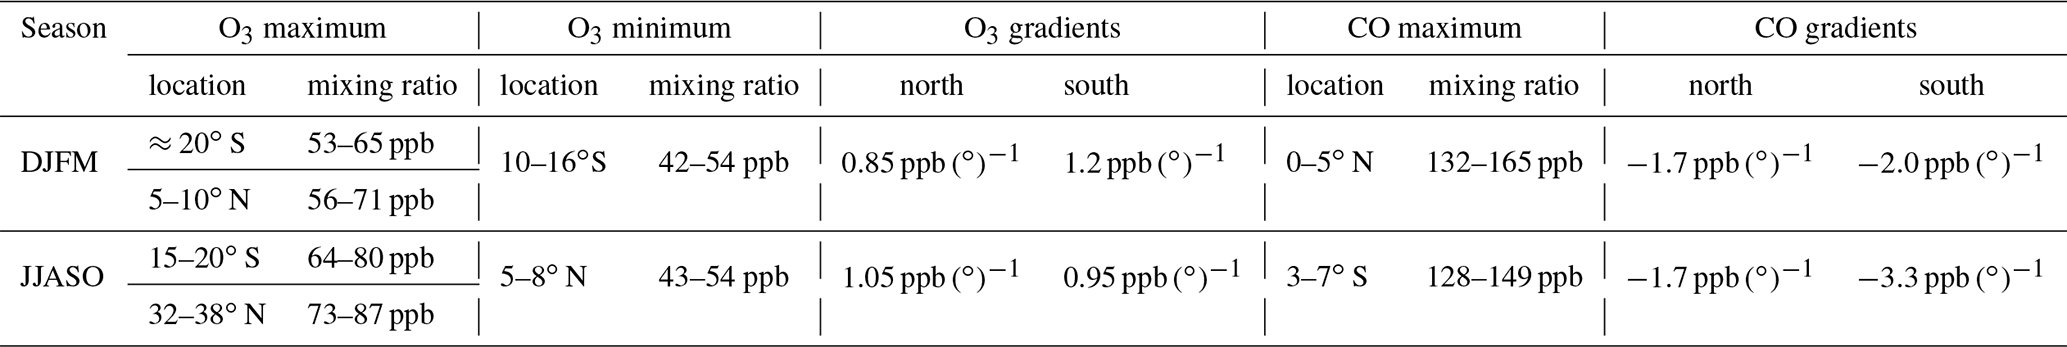
For DJFM and JJASO, O3 meridional transects are characterized by a minimum above the ITCZ and positive gradients directly north and south of the ITCZ in agreement with Sauvage et al. (2007d), who used a different definition for the seasons and less frequent measurements. The transects show (i) no clear interannual variability in terms of gradients and location of the extrema but (ii) an important mixing ratio variability with about 15 ppb difference between years with the highest O3 level (2013 for DJFM and 2008 for JJASO) and years with the lowest ones (2007 for DJFM and JJASO). In this section, we calculate a gradient in ozone between the observed minimum and the northern or southern maximum. The calculation of the gradients gives an indication of ozone build-up along meridional (Hadley cells) and zonal transport.
In DJFM, we observe a sinusoidal pattern. For each year, the minimum is found between 10–16∘ S co-located with the ITCZ. There is an interannual variability of about 15 ppb between the year with the lowest mixing ratio (2007) and the year with the highest mixing ratio (2013) at the ITCZ. The maximum ozone mixing ratios are found (i) north of the ITCZ between 5–10∘ N, leading to a gradient north of the Equator of ≈0.85 starting from the ITCZ minima, and (ii) south of the ITCZ around 20∘ S, leading to a gradient south of the Equator of ≈1.2 . The maximum around 20∘ S at the limit of our domain is confirmed by the IASI data, which show a decrease in O3 south of this latitude (see Fig. 4a). The gradients north of the Equator are much higher than that observed in Sauvage et al. (2007d) (0.34±0.07 north of the ITCZ during boreal winter. There were no data south of the Equator reported in Sauvage et al. (2007d).
In JJASO (Fig. 4b), ozone minima are observed around 5–8∘ N (ITCZ position). Mixing ratios increase with increasing distance from ITCZ, leading to 0.95 (1.05) gradients in the Southern (Northern) Hemisphere, compared with lower values in JJA in the Sauvage et al. (2007d) study of 0.62 (0.94) in the Southern (Northern) Hemisphere.
CO meridional transects are characterized by a maximum above the dry region 10∘ N (S) away from the ITCZ in DJFM (JJASO) and negative gradients directly north and south of the maxima. Similarly to O3, CO transects show no clear interannual variability of the steepness of the gradient and locations of the extrema but an important variability of the average mixing ratios with up to 30 ppb difference between years with the highest CO level (2007 for DJFM and 2008 for JJASO) and years with the lowest one (2013 for DJFM and 2011 for JJASO). In this section, CO gradients are calculated between the observed maximum and the northern or southern limit. They are thus both negative and are called “south CO gradient” and “north CO gradient” respectively.
In DJFM, maximum CO mixing ratios are reached around 0–5∘ N. CO mixing ratios decrease south (north) of the ITCZ with a gradient of (−1.7) (2011, 2012 and 2013 are not considered because of the few CO data).
In JJASO, the highest CO mixing ratios are located around 3–7∘ S. The south (north) CO gradient is (−1.7) (2009 is not considered in this gradient calculation because of the few CO data for this year at JJASO). During the two transition periods in April–May and November, the presence of two peaks on the CO transects highlights the transition phase of the position of the ITCZ.
During the two seasons, CO maxima are located in the hemisphere of the strongest Hadley cell, which seems to have a strong impact on CO distributions in the African upper troposphere.
4.2 IASI–IAGOS transect comparison
In a similar way to the previous section where we used the NCEP reanalysis of wind and humidity to put the IAGOS flight tracks in a meteorological context, here we use IASI satellite observations of O3 and CO to help put the IAGOS observations in a chemical context. We compare O3 and CO transects obtained with IAGOS with the two-dimensional fields of O3 and CO from IASI, which give a wider view over Africa and the adjacent oceans, allowing us to see the influence of regional circulation patterns on the distribution of CO and O3.The IASI data were processed to take into account only a linear corridor of 5∘ width (longitude) at a pressure level of 253 hPa, including all the trajectories of IAGOS flights (the central trajectory of this corridor follow the equation: to include all flights). IASI data used span on the 2008–2013 period. The IASI data also represent a vertical thickness of ∼30 hPa due to the vertical sensitivity of the satellite. This leads to some important difference compared with the IAGOS data as described below.
The grey shaded areas in Fig. 4 represent the IASI data range at 253 hPa on the flight trajectories between 2008 and 2013, i.e., the range between the lowest and the highest seasonal mean mixing ratio observed by IASI during the 2008/2013 period for each latitude degree. North of the intertropical zone, O3 mixing ratios rise sharply because of the lower tropopause and the sampling of stratospheric air by the satellite sensor. The IASI O3 data for the two main seasons are in good agreement with IAGOS. They correctly capture (i) the wave profile in DJFM, (ii) the minimum and the two positive gradients in JJASO, and (iii) the orders of magnitude of the mixing ratios. However, the meridional location of some extrema is not in phase with IAGOS. In DJFM, the minimum of O3 at the ITCZ and the southern maximum are consistent with IAGOS. The northern O3 maximum is shifted 8–10∘ southwards relative to IAGOS with O3 mixing ratios similar to IAGOS measurements (≈55–67 ppb). South of the study domain, IASI retrievals complete the IAGOS observations documenting a −1.35 decrease in O3 mixing ratio. In JJASO, the IASI O3 minimum is shifted by 10∘ northwards relative to IAGOS with consistent mixing ratios and gradients. South of the local maximum at ∼8∘ S, IASI O3 decreases. The extrema discrepancies between IASI and IAGOS in DJFM and JJASO mostly result from an underestimation of IASI O3 relative to IAGOS between 5–10∘ N and the northern boundary of the tropics at ∼25–30∘ N. This underestimation is most probably related to the poor representation of the surface emissivity by the climatology used by the Radiative Transfer for TOVS (RTTOV) fast radiative transfer model over arid and desert surfaces in the 10 µm region. Such a retrieval problem over desert regions has been documented by Boynard et al. (2018) for FORLI-O3.
IASI CO is highly consistent with IAGOS, with maxima located at similar latitudes for the four seasons. However, the maximum mixing ratios observed with IASI are systematically biased low relative to those measured by IAGOS by 20 ppb on average (up to 40 ppb in DJFM). This results in lower CO gradients with IASI. For the four seasons, IASI observations beyond the IAGOS domain indicate that (i) CO decreases uniformly between 20 and 30∘ S and (ii) CO remains almost constant between 30 and 50∘ N.
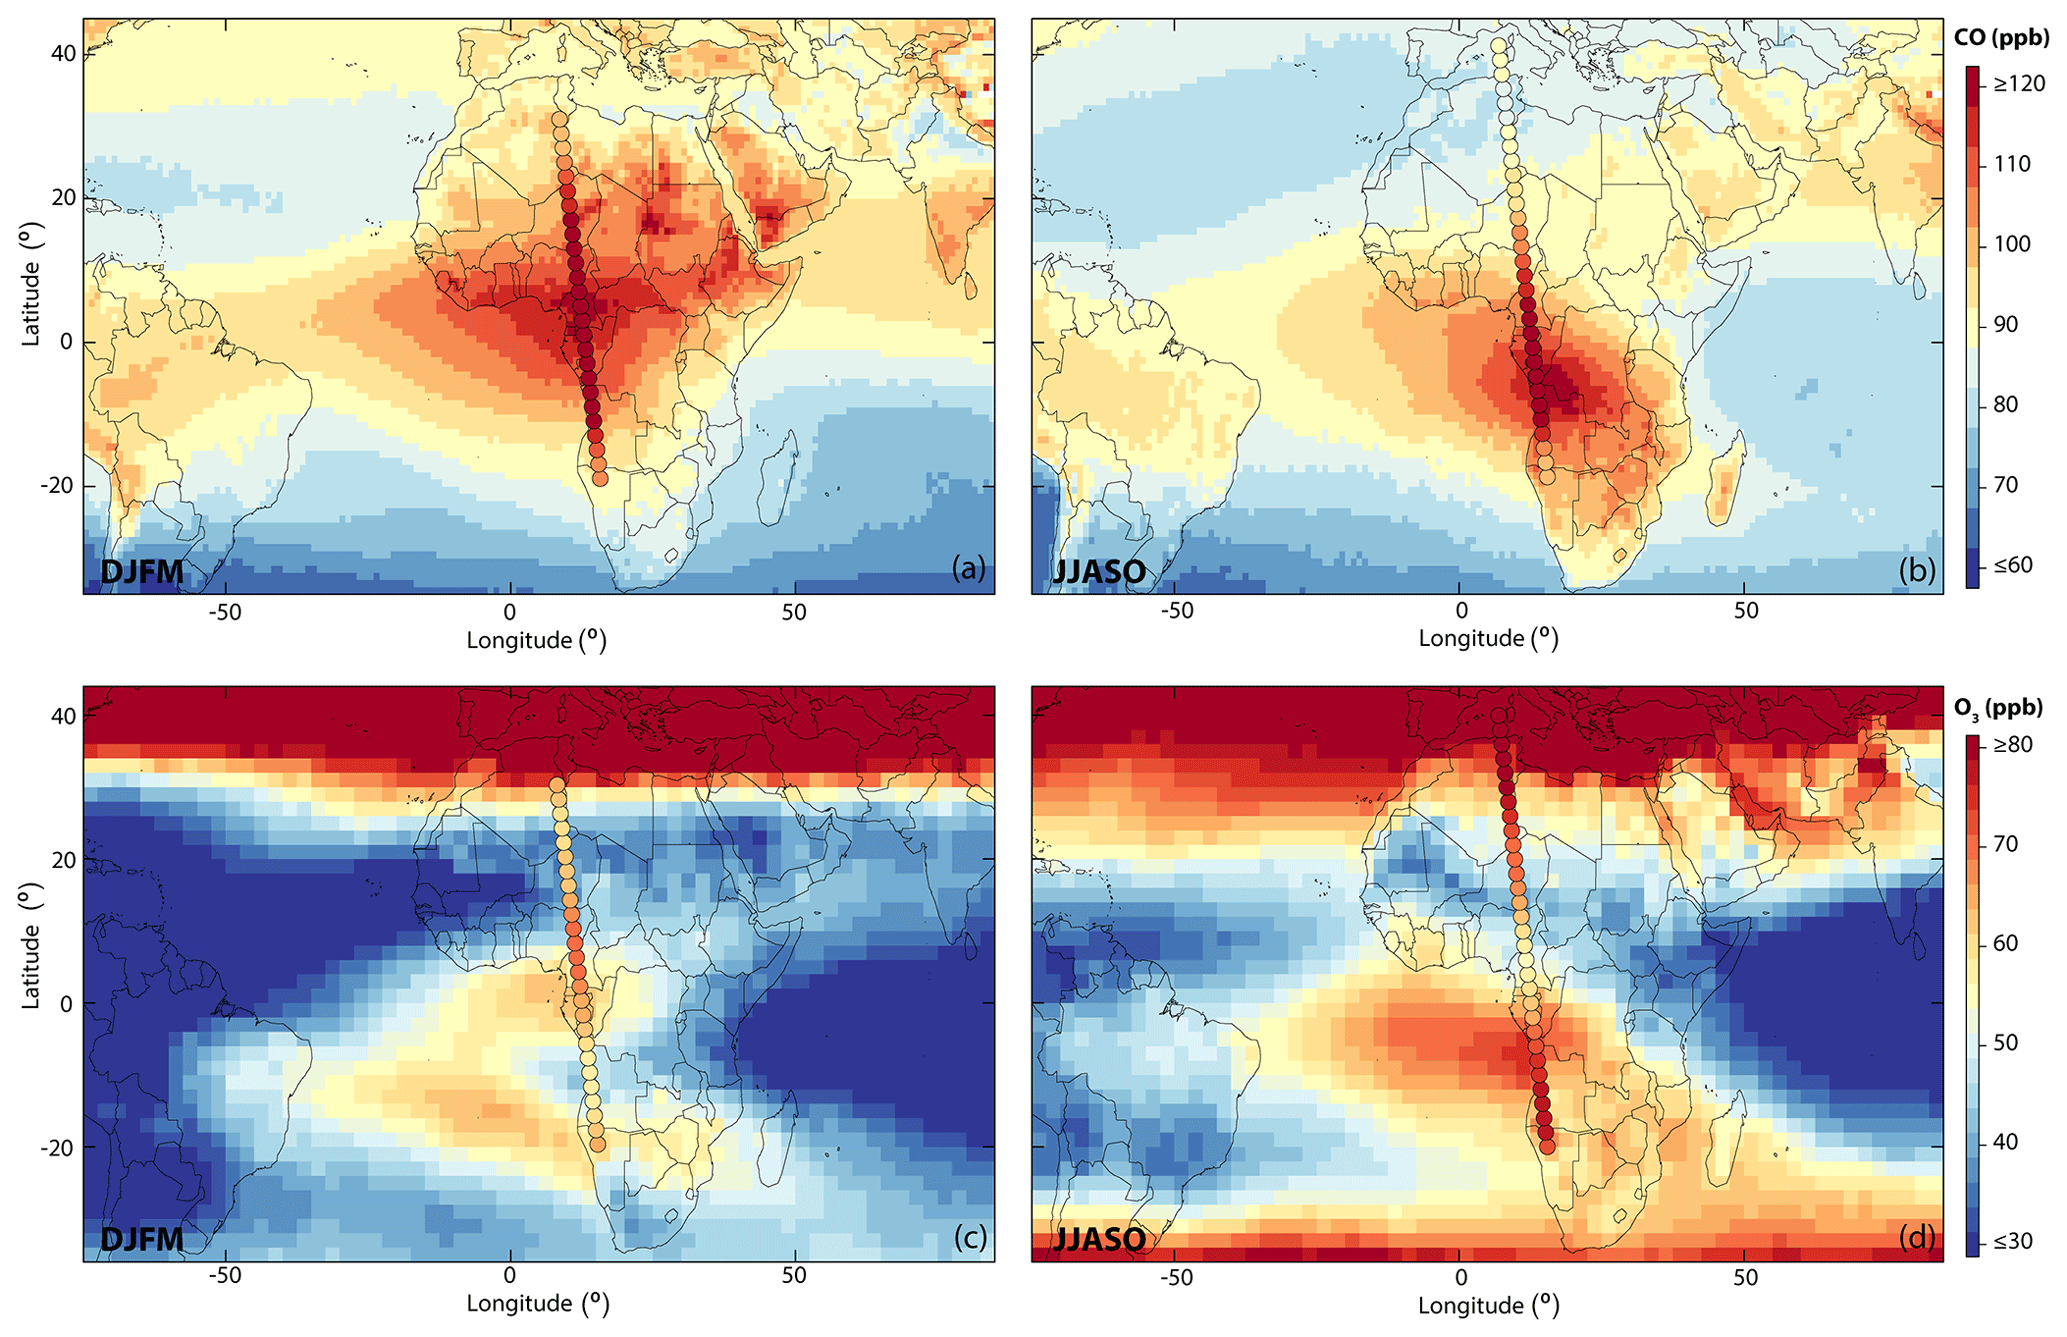
Figure 5Seasonal mean IASI CO (a, b) and O3 (c, d) mixing ratios at 253 hPa between 2008 and 2013. The points represent IAGOS measurements averaged over all studied years.
IASI O3 and CO retrievals have been shown to be sensitive to the UT but with a coarse vertical resolution of about 6 km (see Barret et al., 2011, for O3 and De Wachter et al., 2012, for CO). Some of the discrepancies and observed biases are related to the very different nature of both types of observations. Indeed, with a coarse resolution of about 6 km (De Wachter et al., 2012) SOFRID-CO at 253 hPa is a weighted average of the profile over ±3 km around this level. The most significant underestimation of SOFRID-CO occurs around the latitudinal maxima (Fig. 4), which are caused by the advection of the convective outflow loaded with fire products. SOFRID at 253 hPa therefore results from the smoothing of the maximum with lower values from above and below 253 hPa. However, the O3 and CO African UT latitudinal transects documented by IASI and IAGOS are overall reasonably consistent, highlighting that IASI can successfully complement IAGOS to obtain horizontal distributions.
Figure 5 shows the mean 2008–2013 seasonal CO (a, b) and O3 (c, d) distributions observed by IASI at 253 hPa for the two main seasons. These maps complement the latitudinal information given by IAGOS about the regional CO and O3 distributions.
For CO, we observe the highest mixing ratios above west and central Africa in DJFM (Fig. 5a) and over central and southern Africa in JJASO (Fig. 5b). In both seasons, there is a strong outflow of CO over the Gulf of Guinea. The comparison of the IASI CO distributions (Fig. 5a and b) with the wind distributions (Fig. 3a and c) highlights the accumulation of CO within the zonal wind shear zones north and south of the ITCZ in DJFM and JJASO respectively.
As noted above (Fig. 4) the IASI CO maxima are consistent with those observed by IAGOS along the latitudinal transects. In addition, in DJFM, more localized and less important hotspots of CO concentrations are also detected throughout the northeast quarter of Africa and the south of the Arabian Peninsula.
For O3, in JJASO, we observe a maximum over southwestern Africa, spreading westwards over the Gulf of Guinea and the Atlantic and eastwards over the southwestern Indian Ocean. In DJFM, the two O3 maxima observed by IAGOS correspond to the two branches of a crescent-shaped high O3 plume located above the Atlantic. The O3 minimum at the center of the crescent coincides with the RH minimum at the ITCZ (Fig. 3). The two branches of the O3 maxima are located within the wind shear zones with wind minima on both sides of the ITCZ (see winds on Fig. 3).
Figure 6 represents, averaged between 2006 and 2013, IAGOS CO for the four seasons (Fig. 6a–d) and the contributions to these CO mixing ratios from anthropogenic and wildfire sources (Fig. 6e–h) as estimated with SOFT-IO. These anthropogenic and wildfire sources are further decomposed by region in Fig. 6i–l and m–p respectively. The different regions are denoted by their GFED acronym (see Fig. 1). It is worth recalling that the background is not simulated by SOFT-IO (see Sect. 2.2.1).
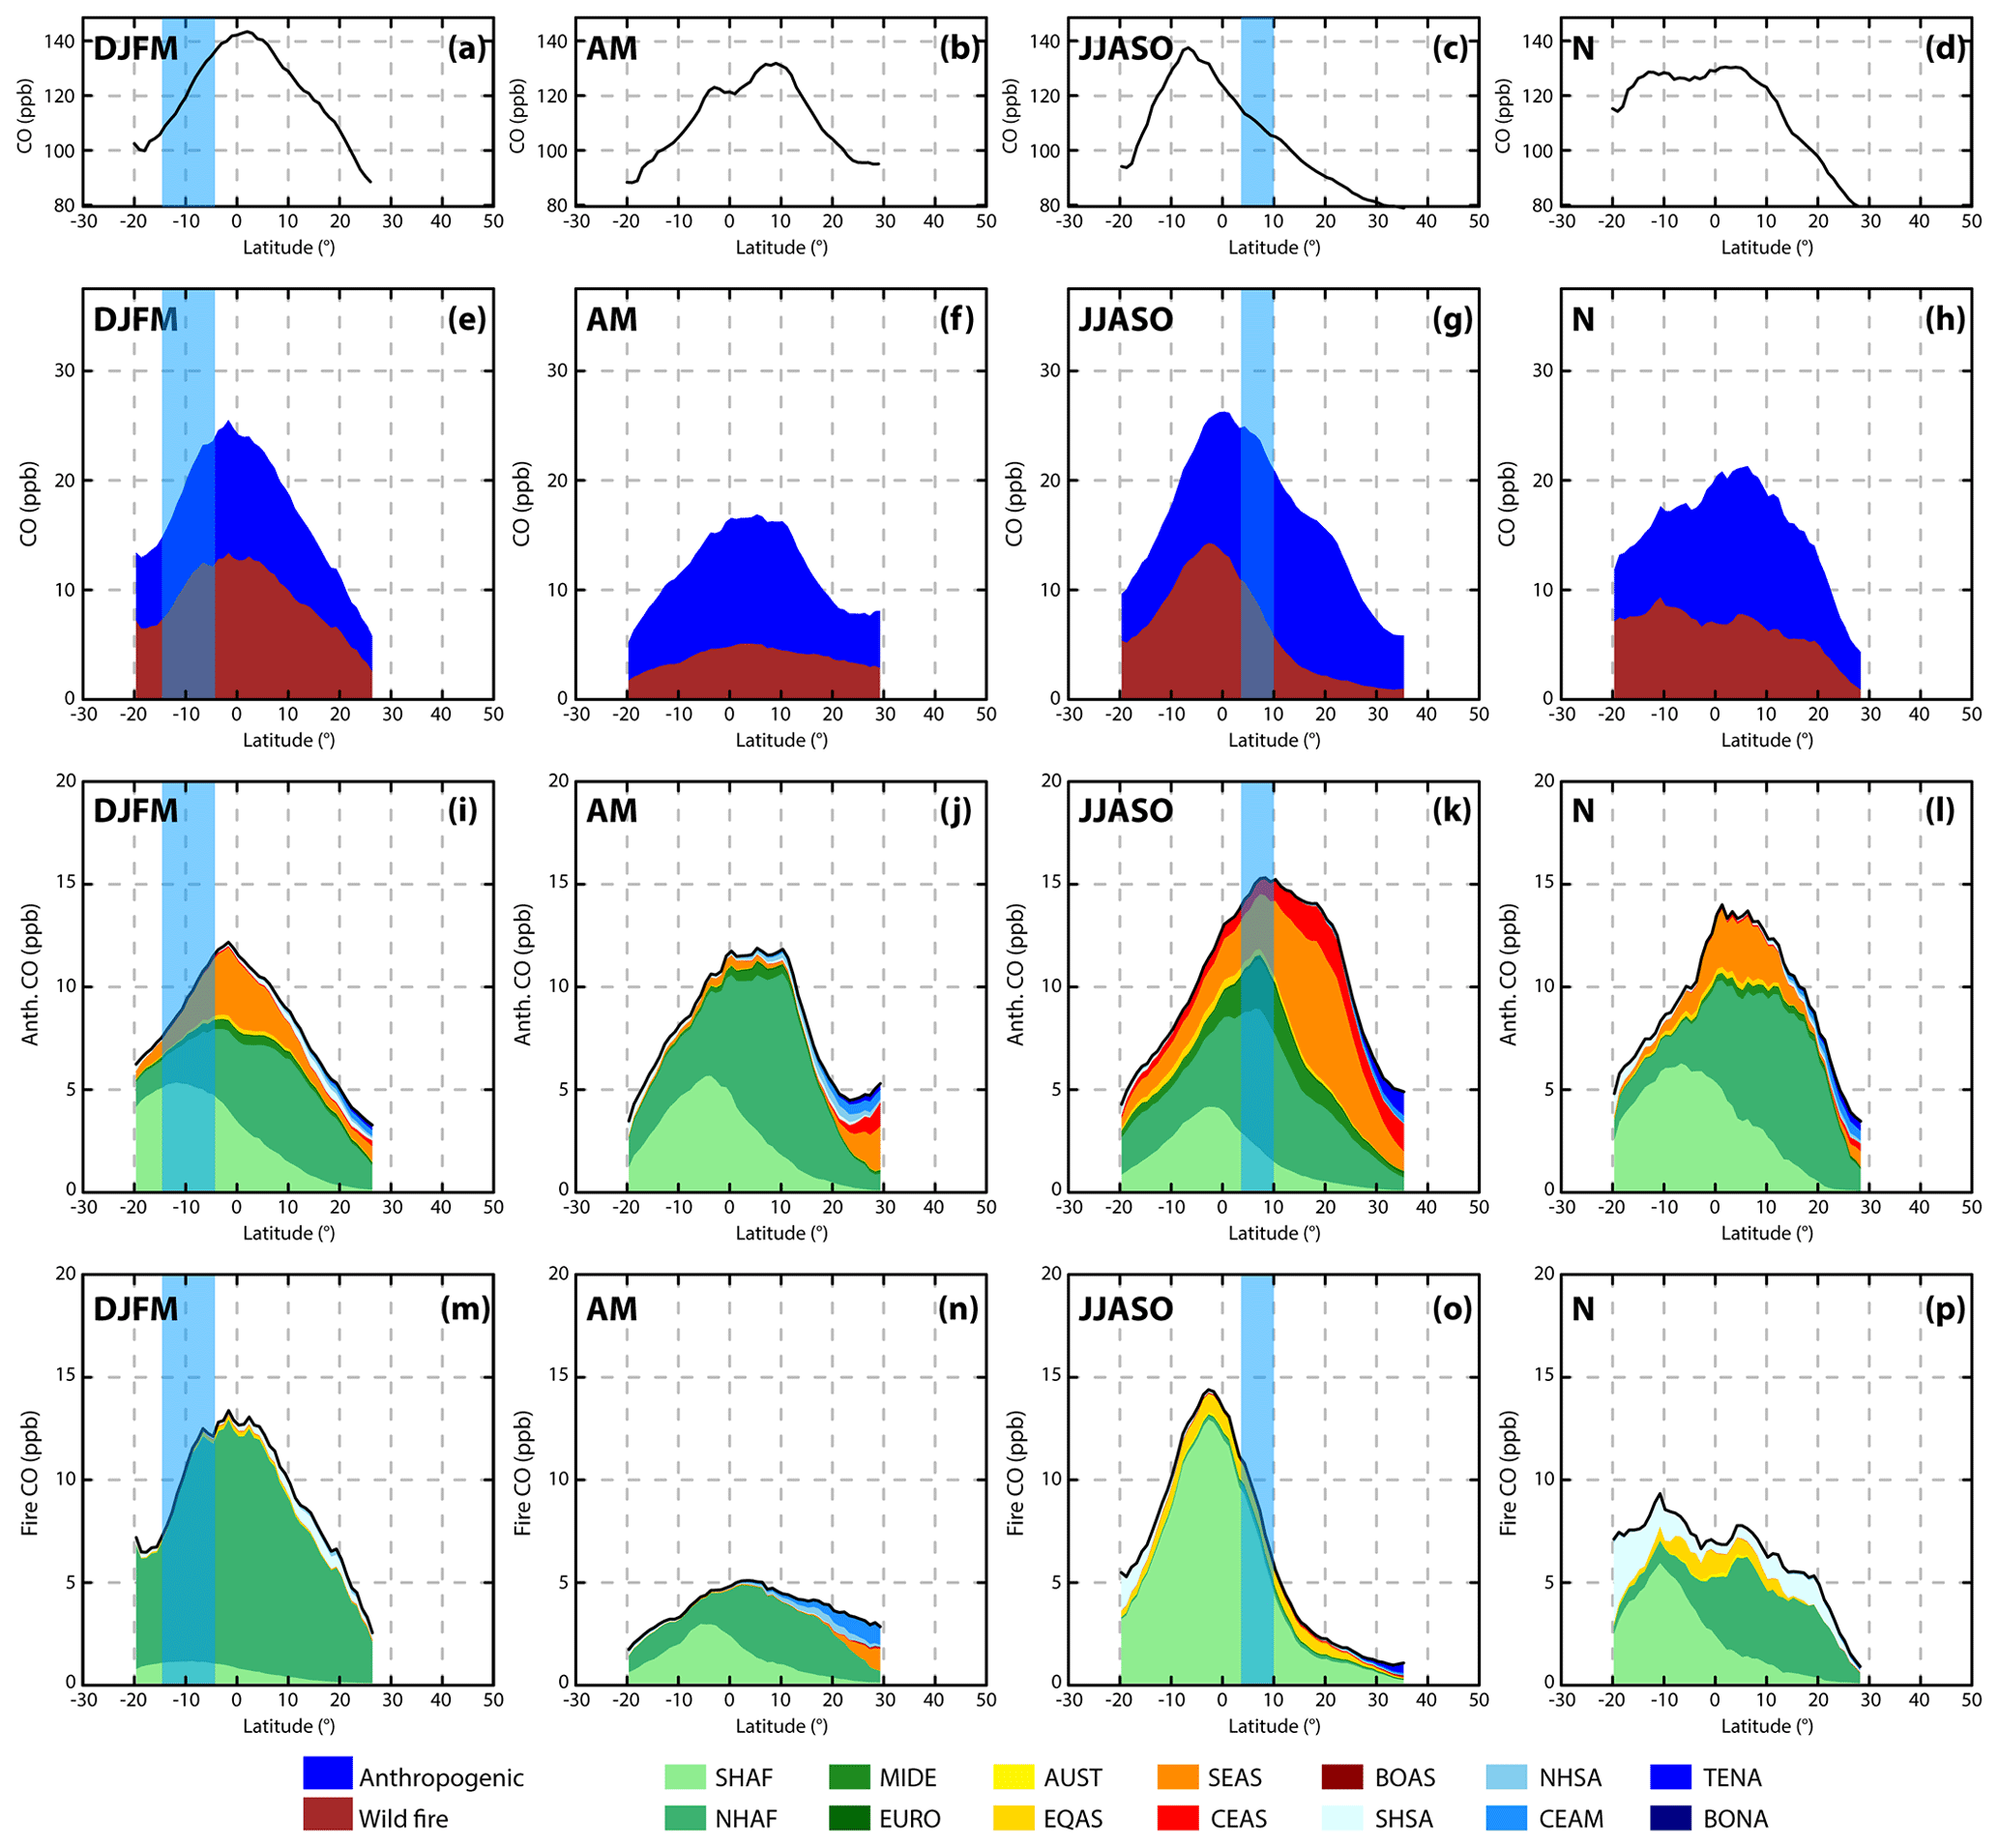
Figure 6Meridional and seasonal transects of CO measured by IAGOS (a–d), CO total anthropogenic and fire contributions calculated by SOFT-IO (e–h), anthropogenic CO regional origins estimated with SOFT-IO (i–l), and fire CO regional origins estimated with SOFT-IO (m–p). The vertical blue rectangles represent the deduced ITCZ position. IAGOS and SOFT-IO data shown are averaged over all studied years (end 2005–2013).
The meridional transects of total CO anomalies from SOFT-IO exhibit similar behavior to the IAGOS data with CO mixing ratios characterized by a clear maximum shifting from the north of the ITCZ in DJFM to the south of the ITCZ in JJASO. In DJFM, the fire and anthropogenic contributions shown by SOFT-IO are in phase, with the maximum CO, as with the IAGOS observations, found at the Equator. In JJASO, the maximum contribution from fires and the maximum observed CO both occur at 5∘ S, while the maximum contribution from anthropogenic sources is located at 12∘ N. The resulting total contribution has therefore shifted north (∼Equator) relative to the observed one. This may indicate an underestimation of SHAF fire and/or anthropogenic contributions or an overestimation of the anthropogenic contribution from the southeast and central Asia (SEAS and CEAS) regions which are responsible of the high CO north of the Equator (see Fig. 6k).
The absolute quantitative CO mixing ratios estimated with SOFT-IO are subject to biases and uncertainties especially due to uncertainties in emission inventories and difficulties in representing tropical deep convection either by the ECMWF analyses or by the FLEXPART model. However, the comparisons between the different estimated contributions remain consistent. The anthropogenic and fire CO sources are of the same order of magnitude during the main seasons, while the anthropogenic source dominates during the transition seasons due to a decrease in fire contributions. Overall, the contribution of fires is not the dominant contribution to CO in the African upper troposphere, consistent with the observed and continuous increase in anthropogenic emissions (e.g., Liousse et al., 2014) and the slight decrease in fire emissions (GFAS, Kaiser et al., 2012).
The anthropogenic contributions are mainly local, with Northern Hemisphere and Southern Hemisphere Africa regions of GFED (NHAF and SHAF; see Fig. 1) representing about 66 % to 90 % of the estimated anthropogenic contributions at the location of the CO maxima. The local contributions have rather low seasonal variabilities. As expected SHAF contributes mostly south of the Equator (maximum between 5 and 10∘ S) and NHAF north of the Equator (maximum around 10∘ N). The CO emitted locally at the surface is transported in the lower troposphere by the trade winds towards the ITCZ and then uplifted to UT (Edwards et al., 2003; Sauvage et al., 2006). Thus, in DJFM (JJASO), the maximum contribution of SHAF (NHAF) is co-located with the position of the ITCZ. In addition to local influence, anthropogenic CO in the African UT is influenced by long-range transport from Asia. The contribution from southeast and central Asia (SEAS and CEAS) has an important seasonal variability. The SEAS anthropogenic CO contribution is negligible in the period April–May but represents up to 30 % of total CO anthropogenic contribution in DJFM and 21 % in November at the maximum located at the Equator. The Asian contribution is the strongest in JJASO in the Northern Hemisphere, representing up to 66 % of estimated anthropogenic contributions at 20∘ N. Barret et al. (2008) have shown that this strong Asian contribution results from South Asian emissions uplifted to the UT by the deep convection associated with the monsoon and then transported westward by the tropical easterly jet. We also observe an important contribution from the Middle East (MIDE) in JJASO, centered at the ITCZ. This MIDE contribution corresponds to surface air masses from North Africa and Arabia, which followed the same circulation as local surface air masses to UT ITCZ. In the Northern Hemisphere, a small contribution from temperate and central America regions (TENA and CEAM) is observable during all the seasons, transported via upper-level westerly winds close to the subtropical jet.
The fire contributions are predominantly local (NHAF and SHAF) for all the seasons with an important seasonal variability. The geographical origin of CO from fires follows the dry and wet seasons of the two hemispheres. During the dry season of the Northern (Southern) Hemisphere, NHAF (SHAF) fires contribute more than 90 % to the meridional CO transects. The maximum contributions (≈13–14 ppb, i.e., in addition to the background) are shifted by approximately 10∘ towards the dry zone relative to the ITCZ. This is explained by the location of the emission zones (i.e., dry zones), which are shifted relative to the ITCZ. CO emitted at the surface is transported at low altitudes towards the ITCZ by the northeast trade winds and the Harmattan in DJFM and by the southeast trade winds and the South Atlantic anticyclone in JJASO (Edwards et al., 2003; Sauvage et al., 2006). The air masses are then uplifted by deep convection and move away from the ITCZ in the upper branches of the Hadley cells (e.g., Barret et al., 2010; Sauvage et al., 2007c). The contribution to the CO from fires in the transition periods (maxima ≈5 ppb in April–May and ≈9 ppb in November above background levels) is mostly from SHAF in the Southern Hemisphere and from NHAF in the Northern Hemisphere. The contributions from fires are lower during these transition periods due to the moisture retained from the previous wet season or the increasing humidification going into the next wet season. Small contributions from Indonesia (EQAS) are observed in JJASO (maximum relative contribution ≈10 % at 20∘ N) and in November (≈20 % at 0∘ N). They correspond to air masses advected by the TEJ and diffused north and south during the transport. South American (SHSA) contributions are also observed in JJASO in the Southern Hemisphere (maximum relative contribution ≈30 % at 20∘ S) and in November on the entire transect (maximum relative contribution ≈50 % at 20∘ S). The polluted air masses are transported in the UT by the westerly winds of the South Atlantic anticyclone in the Southern Hemisphere and by the subtropical jet in the Northern Hemisphere.
It is interesting to note that, in both DJFM and JJASO, the CO plumes are transported over the Gulf of Guinea by the easterly winds that dominate within the ITCZ (see Fig. 3) as documented by IASI (Fig. 5). The IASI distributions also highlight that during JJASO the strong TEJ (Fig. 3c) transports the CO plume westwards while during DJFM the transport is north-westward due to a northwards wind component over Africa (Fig. 3a).
In the previous section, we used the SOFT-IO tool to attribute high concentrations of CO to anthropogenic and wildfire sources across different regions. As tropospheric O3 is a secondary pollutant, the source attribution is more complex, as the ozone may be lost or produced along its trajectory from the surface. There may be local sources in the upper troposphere such as intrusions of ozone-rich air from the stratosphere and photochemical production from NOx generated by lightning (LiNOX), or even via NOx emitted by aircraft. The analysis of the meridional transects of ozone is more complex. It is possible to determine the origin of air masses and the spatial variability of ozone and give the associated transport pathways, independently of the CO mixing ratio. Therefore, in this section we do not use the SOFT-IO as we did for CO, but we look at the FLEXPART backward plumes initiated at the IAGOS data points. Based on previous modeling studies (Sauvage et al., 2007a–c), we hypothesize that O3 is produced during the transport of air masses impacted by precursors emitted at the surface (such as CO as described in the previous section) and sources at altitude such as lightning as inferred in the Sauvage et al. (2007b) study with a chemistry and transport model.

Figure 7FLEXPART backward plume of air masses where IAGOS flights have recorded maxima (between 6.5 and 11.5∘ N: a, b, c) and minima (between 13.5 and 8.5∘ S: d, e, f) of ozone in DJFM. Plumes are represented in terms of the residence time of particles in each individual output box in seconds, summed on the 20 d backward, on 5∘ lat of flight and on total column (latitude column for a, d, altitude column for b, e, and longitude column for c, f), and averaged over all studied years. Note that the color scale is different for longitude–altitude profiles (a, d), longitude–latitude maps (b, e) and latitude–altitude profiles (c, f).

Figure 8FLEXPART backward plume of air masses where IAGOS flights have recorded maxima (between 17.5 and 12.5∘ S: a, b, c) and minima (between 4.5 and 9.5∘ N: d, e, f) of ozone in JJASO. Plumes are represented in terms of the residence time of particles in each individual output box in seconds, summed on the 20 d backward, on 5∘ lat of flight and on total column (latitude column for a, d, altitude column for b, e, and longitude column for c, f), and averaged over all studied years. Note that the color scale is different for longitude–altitude profiles (a, d), longitude–latitude maps (b, e) and latitude–altitude profiles (c, f).
Figures 7 and 8 represent the FLEXPART backward plumes corresponding to air masses characterized by O3 maxima and minima as observed by IAGOS in DJFM (Fig. 7) and JJASO (Fig. 8). The backward plumes are displayed as the integration of 20 d residence times (equivalent to the origin probability density; see Stohl et al., 2005) summed vertically and averaged over the whole period (end 2005–2013). For each case, backward plumes are computed for sections of 5∘ of latitude from the corresponding IAGOS flights. The highest altitude level corresponds to an 11 km and above level which can include both UT and LS. Determining the altitude of the intertropical tropopause with the potential vorticity to distinguish tropospheric or stratospheric origins is complicated. As the contributions in this layer do not extend beyond the tropics (±25∘ approximately) where stratospheric incursions are negligible, the approximation of a predominantly UT origin of these contributions is made.
In DJFM, the O3 minimum is observed at the ITCZ (≈11∘ S; see Fig. 4) and corresponds to African air masses (Fig. 7e) rising from the surface (Fig. 7d and f). O3 mixing ratios are globally lower in surface air masses due to either clean maritime air masses or O3 titration in fresh polluted air masses. The area of origin of the air masses (Fig. 7.e) corresponds to the convergence zone delimited by the high RH and the OLR below 220 W m−2 in Fig. 3e. We note that the ascension of the surface air masses takes place to the southeast of IAGOS aircraft, i.e., in the center of this convergence zone, where the Hadley cell vertical wind speed is the strongest.
The maximum of O3 observed by IAGOS in DJFM (≈10∘ N; see Fig. 4) corresponds to high-altitude air masses transported during the previous 20 d (Fig. 7a–c). These are
- (i)
air masses uplifted at the ITCZ and transported away from the ITCZ by the Hadley cell upper branches – chemical processing during transport allowed O3 production from African LiNOX emitted in the UT at the ITCZ and from uplifted African surface emissions (CO maxima at ≈2∘ N);
- (ii)
air masses uplifted in South America and transported by the high-altitude westerly winds located north of the ITCZ with similar chemical processing from precursors emitted by fires and by lightning.
As already discussed (Sect. 4.2), in DJFM there are two O3 maxima documented by IASI on each side of the ITCZ which stem from the same crescent-shaped plume (Fig. 5c). The northern African O3 maximum is located a bit to the south relative to the CO maximum according to IASI (Figs. 5a and c and 4a and c) and a bit further north according to IAGOS (Fig. 4a and c). Nevertheless, in both cases they are located on the same side of the ITCZ. The FLEXPART run indicates that at the location of the northern O3 maximum seen by IAGOS, air masses are mostly coming from the West African fire region explaining the coincidence between the O3 and CO plumes. The air masses observed by IAGOS at 20∘ S (local maximum of O3) may have been thus transported in the UT from the Gulf of Guinea to the South Atlantic Ocean and then to the south of Africa where they have been sampled by IAGOS. Mixing with surrounding O3-poorer air masses during this transportation is probably compensated for by the input and photochemistry of precursors from South America and lightning.
In JJASO, the minimum of ozone observed by IAGOS at the latitude of the ITCZ (≈6∘ N; see Fig. 4) corresponds mainly to O3-poor African air masses (Fig. 8e) convectively uplifted from the surface (Fig. 8d and f) and transported westward during the convection. Clean air masses from the Indian Ocean region convectively uplifted and transported by the TEJ also contribute to the O3 minimum. During this season the O3 maximum (≈15∘ S; see Fig. 4) corresponds to air masses which have been uplifted at the ITCZ in Africa (northeast of the aircraft position) or in South America more than 20 d before the observations. (Fig. 8a and c). The coincidence between the CO and O3 plumes from IASI (Fig. 5b and d) indicates that the O3 production is directly impacted by African emissions.
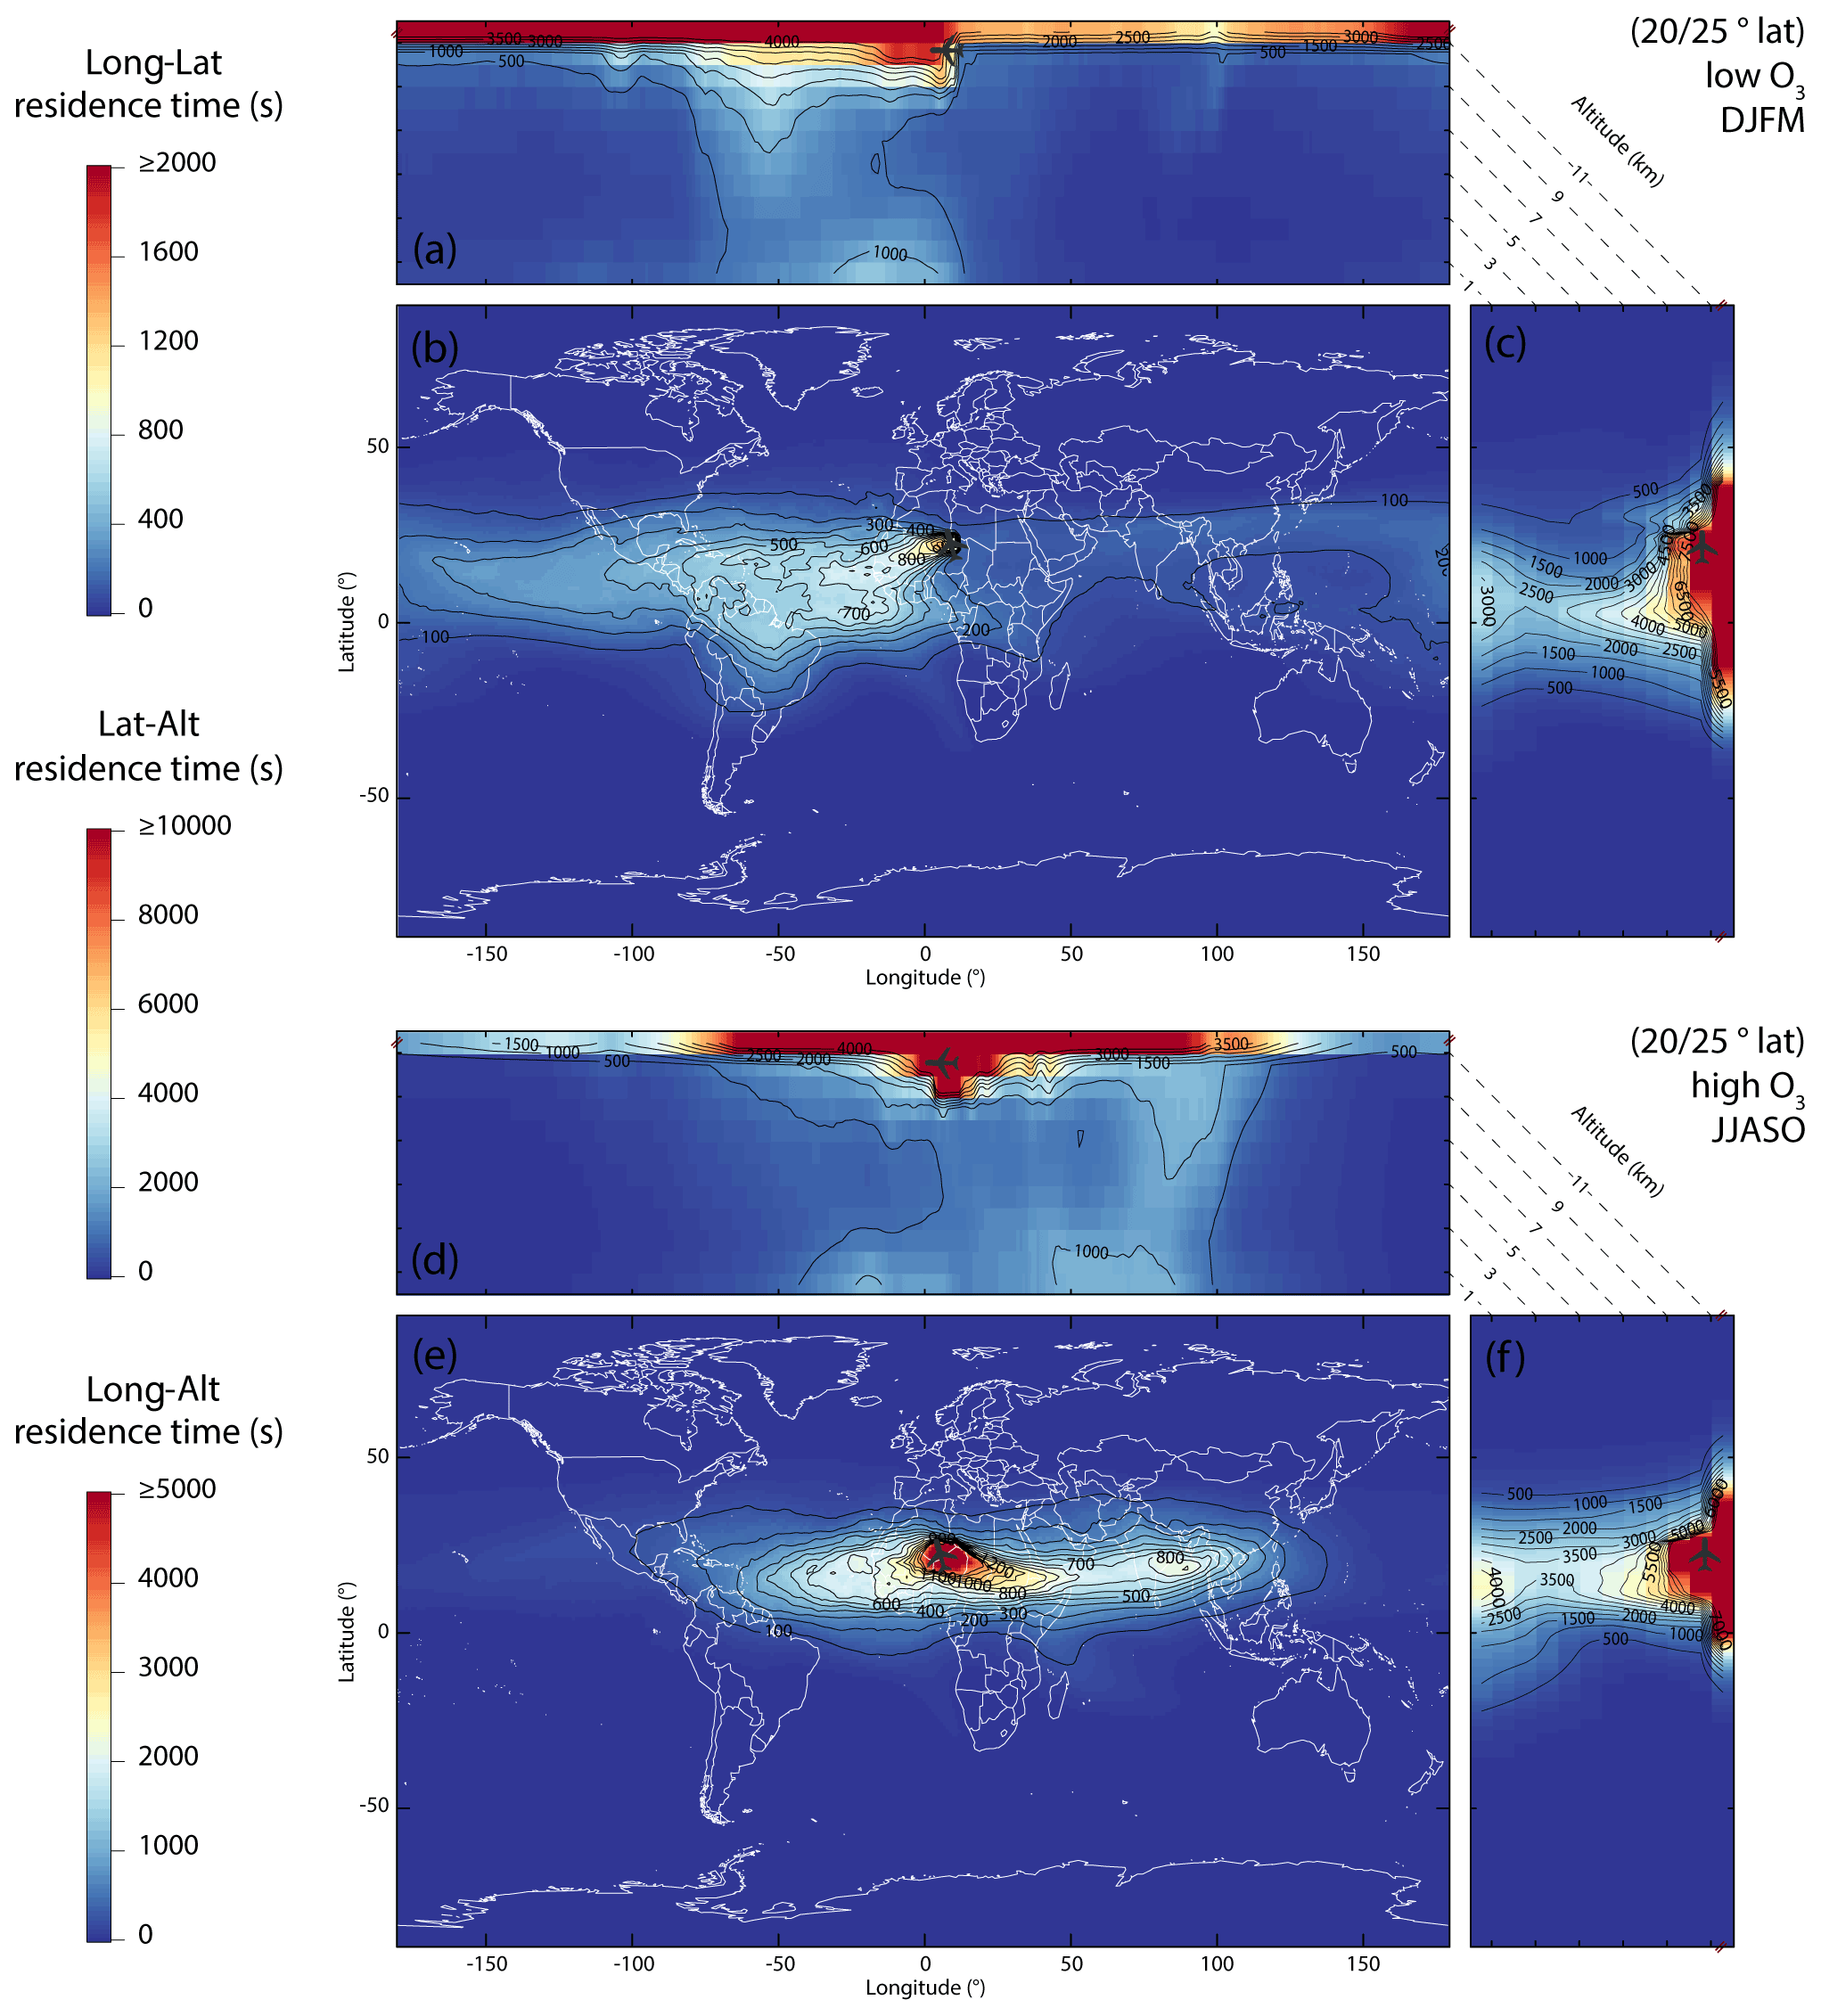
Figure 9FLEXPART backward plume of air masses recorded by IAGOS flights between 20 and 25∘ N in DJFM (a, b, c) and JJASO (d, e, f). Plumes are represented in terms of the residence time of particles in each individual output box in seconds, summed on the 20 d backward, on 5∘ lat of flight and on total column (latitude column for a, d, altitude column for b, e, and longitude column for c, f), and averaged over all studied years. Note that the color scale is different for longitude–altitude profiles (a, d), longitude–latitude maps (b, e) and latitude–altitude profiles (c, f).
North of 20∘ N, a decrease in O3 mixing ratios in DJFM is observed, which is not observed in JJASO (see Fig. 4). To understand this difference, the FLEXPART backward plumes corresponding to IAGOS flights between 20 and 25∘ N for the two seasons are presented in Fig. 9. In the two cases, the air masses mainly resided above 9000 m in the 20 d preceding the measurements. In DJFM (Fig. 9a–c), the low O3 mixing ratios correspond to high-altitude old and clean air masses transported by the subtropical jet up to 20 d before the measurements. Some of the air masses come from the Atlantic lower troposphere north of the ITCZ between the Equator and 10∘ N more than 20 d before the measurements. Therefore, these air masses have a clean origin, which explains their low O3 content. In contrast, in JJASO (Fig. 9d–f), the air masses measured at around 25∘ N come from both east and west. Part of the air masses have been convectively uplifted from the South and South East Asian highly polluted boundary layer before being transported over northern Africa at the southern flank of the AMA (Barret et al., 2008). The difference resulting from the uplift of these polluted air masses and from the uplift of cleaner air masses from the Indian Ocean more to the south is highlighted by the IASI CO UT distribution characterized by a clear latitudinal gradient over the Arabian Sea and India (Fig. 5b). The chemical aging of these polluted air masses during their transport results in high O3 levels in the North African UT than in DJFM. This important contribution of precursors from Asian anthropogenic sources in JJASO is also highlighted by the SOFT-IO data presented in Fig. 5k.
It is also interesting to note that the ozone maxima observed beyond the dry zones (by ≈10∘ N in DJFM and by ≈15∘ S in JJASO) are higher in JJASO than in DJFM, while CO levels are quite similar (see Fig. 4). This probably indicates other sources of precursors not correlated with CO in the southern part. Indeed, previous studies have highlighted a zone of high O3 mixing ratios over the southern Atlantic during the boreal summer: the zonal wave one (Sauvage et al., 2006; Thompson et al., 2003) which results from (i) high precursor emissions in Africa and South America, (ii) strong solar radiations, (iii) the high thunderstorm activity and LiNOx production at the ITCZ, (iv) stratospheric O3 incursions, and (v) wind currents from the South Atlantic anticyclone.
Near-daily IAGOS airborne measurements carried out from the end 2005 to 2013 between Europe and Namibia were used to analyze and characterize meridional CO and O3 transects in the African upper troposphere and their seasonal variability. First, we developed a methodology to localize the ITCZ with IAGOS meteorological data (wind and over-water RH data) which allowed us to delimit empirically two periods of the year of strongest interest in this region, namely June to October (JJASO) and December to March (DJFM), with the intermediate months corresponding to transitional periods. The ITCZ was found to extend over 14.5–4.5∘ S during JJASO and 4.5–9.5∘ N during DJFM, in good agreement with NCEP/NCAR reanalysis.
For the two main seasons the CO transects are characterized by peak distributions with maximum mixing ratios located 10∘ from the position of the ITCZ above the dry regions (132 to 165 ppb at 0–5∘ N in DJFM and 128 to 149 ppb at 3–7∘ S in JJASO). Maximum CO mixing ratios display strong interannual variability with up to 30 ppb between years over the end of the 2005–2013 period. The O3 transects are characterized by mixing ratio minima of ∼42–54 ppb at the ITCZ (10–16∘ S in DJFM and 5–8∘ N in JJASO) framed by local maxima (∼53–71 ppb) coincident with the wind shear zones north and south of the ITCZ. The O3 transects display no clear interannual variability in terms of gradients and location of the extrema but large mixing ratio variability (∼15 ppb).
CO and O3 UT African transects are also computed from IASI 2008–2013 retrievals. Comparisons show that IASI is able to capture the main features of the CO and O3 distributions in the African UT. The CO maxima are coincident with IAGOS but the average CO mixing ratios from IASI are biased low by about 20 ppb. Concerning O3, the IASI mixing ratios are in good agreement with IAGOS, but the latitudes of the extrema can be shifted by up to 10∘ relative to IAGOS. The IASI 2D CO and O3 distributions have therefore been very useful to complement the 1D IAGOS meridional transects. IASI UT O3 distributions in DJFM have in particular revealed a crescent-shaped O3 plume above the Atlantic Ocean around the Gulf of Guinea.
SOFT-IO simulations first showed that anthropogenic and fire sources of CO have an impact of the same order of magnitude in the African UT. In DJFM both contributions are coincident and both sources drive the maximum of the CO mixing ratio. In JJASO, the observed CO maximum is coincident with the fire contribution. The important Asian anthropogenic contribution leads to a northward-shifted total contribution maximum not coincident with the observed one. This tends to indicate either an overestimation of the Asian anthropogenic contribution or an underestimation of uplifted local contributions to the African UT CO maximum in JJASO.
The anthropogenic CO contribution is mostly local (northern and southern Africa) with a low seasonal variability. CO emitted locally at the surface is advected by the trade winds towards the ITCZ where it is convectively uplifted. The large Asian contribution is related to the fast convective uplift of polluted air masses in the Asian monsoon region which are further westward transported by TEJ and AMA. The fire contribution is almost entirely local, with a significant seasonal variability following the alternation of dry and wet seasons.
For the two main seasons, the CO African UT transects characterized by maxima over the dry regions result from the following processes. CO emitted by fires in the dry region is transported towards the ITCZ by the trade winds and further convectively uplifted. In the UT the CO-enriched air masses are transported away from the ITCZ by the upper branches of the Hadley cells and accumulate within the zonal wind shear zones where the maxima are located.
The FLEXPART backward plumes revealed that (i) the O3 minima correspond to air masses that were recently uplifted (i.e., for less than 20 d) from the surface where mixing ratios are low at the ITCZ, (ii) the O3 maxima correspond to old high-altitude air masses (i.e., uplifted from the surface for more than 20 d before the IAGOS measurement) either locally transported from Africa in the upper branches of the Hadley cells or transported over long distances from South America by the west winds of the South Atlantic anticyclone and subtropical jets, and (iii) the high O3 concentrations in JJASO over North Africa around 25∘ N are related to pollution recently uplifted in the Asian monsoon region and transported south of the AMA.
All these air masses came from areas where O3 precursor emissions are high (Africa, South America and South Asia). We thus do the hypothesis of the O3 formation in these air masses during the transport in the UT due to the combination of high concentrations of precursors (from lightning at ITCZ and surface emissions) with strong radiations enhancing the photochemistry. The more time the air mass spends in the UT, the more O3 is formed (through photochemical production). The comparison of the origin of the air masses recorded by IAGOS flights in the Northern Hemisphere shows that, in DJFM, without the Asian contribution, the O3 mixing ratios start to decrease. It highlights the importance of the precursor load of air masses to fuel the photochemistry in the UT. In the Southern Hemisphere, the IAGOS O3 data allow us to further characterize the zonal wave one phenomenon with similar CO concentrations in DJFM and JJASO but higher O3 concentration in JJASO.
This analysis of meridional transects contributes to a better understanding of distributions of CO and O3 in the intertropical African upper troposphere and the processes which drive these distributions. Therefore, it provides a solid basis for comparison and improvement of models and satellite products in order to get the good O3 for the good reasons.
However, the study only covers the 2005–2013 period, and the conclusions could evolve notably according to the projections of future emissions of precursors. Indeed, the analysis of data from the emission inventory MACCity indicates that African anthropogenic emissions of CO have increased by +283 % for NHAF and +256 % for SHAF between 1960 and 2020 (against +63 % for the entire world). CO emissions from these two African regions accounted for 7.87 % of global emissions in 1960 compared to 17.96 % in 2020. On a smaller timescale (end 2005–2013) this represents a +12 % increase in CO emissions for NHAF and +16 % for SHAF (+1.6 % for the entire world). During the same period the part of both regions in anthropogenic global CO emissions goes from 15 % to 16.8 %. If African anthropogenic emissions continue to increase as fast as estimated, they could modify the typical distribution of CO and thus of O3 with first higher concentrations of CO to fuel O3 formation during all seasons.
The IAGOS data (Bundke et al., 2018, https://doi.org/10.25326/06) are available on the IAGOS data portal (Boulanger et al., 2019, https://doi.org/10.25326/20). The SOFT-IO v1.0 products will be made available through the IAGOS central database and are part of the ancillary products (Sauvage et al., 2017a, https://doi.org/10.25326/2; Sauvage et al., 2018, https://doi.org/10.25326/3; Sauvage et al., 2017b, https://doi.org/10.5194/acp-17-15271-2017).
VL, BS and VT designed the research. All the co-authors contributed to acquisition of data. VL, BS, VT and BB analyzed and interpreted the data. VL drafted the article. VL, BS, VT, HC and BB revised the article.
The authors declare that they have no conflict of interest.
Publisher's note: Copernicus Publications remains neutral with regard to jurisdictional claims in published maps and institutional affiliations.
The authors acknowledge the strong support of the European Commission, Airbus and the airlines (Lufthansa, Air France, Austrian, Air Namibia, Cathay Pacific, Iberia and China Airlines, so far) who have carried the MOZAIC or IAGOS equipment and performed the maintenance since 1994. In its last 10 years of operation, MOZAIC has been funded by INSU-CNRS (France), Météo-France, Université Paul Sabatier (Toulouse, France) and the Jülich Research Center (FZJ, Jülich, Germany). IAGOS has been additionally funded by the EU projects IAGOS-DS and IAGOS-ERI. The MOZAIC-IAGOS database is supported by AERIS, the French portal for data and service for the atmosphere (see http://aeris-data.fr, last access: 20 September 2021).
This research has been supported by the European Union's Horizon 2020 research and innovation program under Marie Skłodowska-Curie grant agreement H2020-MSCA-COFUND-2016-754433.
This paper was edited by Eduardo Landulfo and reviewed by three anonymous referees.
Barret, B., Ricaud, P., Mari, C., Attié, J.-L., Bousserez, N., Josse, B., Le Flochmoën, E., Livesey, N. J., Massart, S., Peuch, V.-H., Piacentini, A., Sauvage, B., Thouret, V., and Cammas, J.-P.: Transport pathways of CO in the African upper troposphere during the monsoon season: a study based upon the assimilation of spaceborne observations, Atmos. Chem. Phys., 8, 3231–3246, https://doi.org/10.5194/acp-8-3231-2008, 2008.
Barret, B., Williams, J. E., Bouarar, I., Yang, X., Josse, B., Law, K., Pham, M., Le Flochmoën, E., Liousse, C., Peuch, V. H., Carver, G. D., Pyle, J. A., Sauvage, B., van Velthoven, P., Schlager, H., Mari, C., and Cammas, J.-P.: Impact of West African Monsoon convective transport and lightning NOx production upon the upper tropospheric composition: a multi-model study, Atmos. Chem. Phys., 10, 5719–5738, https://doi.org/10.5194/acp-10-5719-2010, 2010.
Barret, B., Le Flochmoen, E., Sauvage, B., Pavelin, E., Matricardi, M., and Cammas, J. P.: The detection of post-monsoon tropospheric ozone variability over south Asia using IASI data, Atmos. Chem. Phys., 11, 9533–9548, https://doi.org/10.5194/acp-11-9533-2011, 2011.
Barret, B., Sauvage, B., Bennouna, Y., and Le Flochmoen, E.: Upper-tropospheric CO and O3 budget during the Asian summer monsoon, Atmos. Chem. Phys., 16, 9129–9147, https://doi.org/10.5194/acp-16-9129-2016, 2016.
Boulanger, D., Thouret, V., and Petzold, A.: IAGOS Data Portal, AERIS, https://doi.org/10.25326/20, 2019.
Boynard, A., Hurtmans, D., Garane, K., Goutail, F., Hadji-Lazaro, J., Koukouli, M. E., Wespes, C., Vigouroux, C., Keppens, A., Pommereau, J.-P., Pazmino, A., Balis, D., Loyola, D., Valks, P., Sussmann, R., Smale, D., Coheur, P.-F., and Clerbaux, C.: Validation of the IASI FORLI/EUMETSAT ozone products using satellite (GOME-2), ground-based (Brewer–Dobson, SAOZ, FTIR) and ozonesonde measurements, Atmos. Meas. Tech., 11, 5125–5152, https://doi.org/10.5194/amt-11-5125-2018, 2018.
Bundke, U., Smit, H., Sauvage, B., Gerbig, C., Hermann, M., Nédélec, P., Gallagher, M., Ziereis, H., Boulanger, D., Thouret, V., and Petzold, A.: IAGOS Time series, AERIS [data set], https://doi.org/10.25326/06, 2018.
Clerbaux, C., Boynard, A., Clarisse, L., George, M., Hadji-Lazaro, J., Herbin, H., Hurtmans, D., Pommier, M., Razavi, A., Turquety, S., Wespes, C., and Coheur, P.-F.: Monitoring of atmospheric composition using the thermal infrared IASI/MetOp sounder, Atmos. Chem. Phys., 9, 6041–6054, https://doi.org/10.5194/acp-9-6041-2009, 2009.
Cohen, Y., Petetin, H., Thouret, V., Marécal, V., Josse, B., Clark, H., Sauvage, B., Fontaine, A., Athier, G., Blot, R., Boulanger, D., Cousin, J.-M., and Nédélec, P.: Climatology and long-term evolution of ozone and carbon monoxide in the upper troposphere–lower stratosphere (UTLS) at northern midlatitudes, as seen by IAGOS from 1995 to 2013, Atmos. Chem. Phys., 18, 5415–5453, https://doi.org/10.5194/acp-18-5415-2018, 2018.
Crutzen, P. J., Lawrence, M. G., and Pöschl, U.: On the background photochemistry of tropospheric ozone, Tellus A, 51, 123–146, https://doi.org/10.1034/j.1600-0870.1999.t01-1-00010.x, 1999.
Cussac, M., Marécal, V., Thouret, V., Josse, B., and Sauvage, B.: The impact of biomass burning on upper tropospheric carbon monoxide: a study using MOCAGE global model and IAGOS airborne data, Atmos. Chem. Phys., 20, 9393–9417, https://doi.org/10.5194/acp-20-9393-2020, 2020.
De Wachter, E., Barret, B., Le Flochmoën, E., Pavelin, E., Matricardi, M., Clerbaux, C., Hadji-Lazaro, J., George, M., Hurtmans, D., Coheur, P.-F., Nedelec, P., and Cammas, J. P.: Retrieval of MetOp-A/IASI CO profiles and validation with MOZAIC data, Atmos. Meas. Tech., 5, 2843–2857, https://doi.org/10.5194/amt-5-2843-2012, 2012.
Diehl, T., Heil, A., Chin, M., Pan, X., Streets, D., Schultz, M., and Kinne, S.: Anthropogenic, biomass burning, and volcanic emissions of black carbon, organic carbon, and SO2 from 1980 to 2010 for hindcast model experiments, Atmos. Chem. Phys. Discuss., 12, 24895–24954, https://doi.org/10.5194/acpd-12-24895-2012, 2012.
Dufour, G., Eremenko, M., Griesfeller, A., Barret, B., LeFlochmoën, E., Clerbaux, C., Hadji-Lazaro, J., Coheur, P.-F., and Hurtmans, D.: Validation of three different scientific ozone products retrieved from IASI spectra using ozonesondes, Atmos. Meas. Tech., 5, 611–630, https://doi.org/10.5194/amt-5-611-2012, 2012.
Edwards, D. P., Lamarque, J. F., Attié, J. L., Emmons, L. K., Richter, A., Cammas, J. P., Gille, J. C., Francis, G. L., Deeter, M. N., Warner, J., Ziskin, D. C., Lyjak, L. V., Drummond, J. R., and Burrows, J. P.: Tropospheric ozone over the tropical Atlantic: A satellite perspective, J. Geophys. Res., 108, 4237, https://doi.org/10.1029/2002jd002927, 2003.
Edwards, D. P., Emmons, L. K., Hauglustaine, D. A., Chu, D. A., Gille, J. C., Kaufman, Y. J., Pétron, G., Yurganov, L. N., Giglio, L., Deeter, M. N., Yudin, V., Ziskin, D. C., Warner, J., Lamarque, J. F., Francis, G. L., Ho, S. P., Mao, D., Chen, J., Grechko, E. I., and Drummond, J. R.: Observations of carbon monoxide and aerosols from the Terra satellite: Northern Hemisphere variability, J. Geophys. Res., 109, 1–17, https://doi.org/10.1029/2004JD004727, 2004.
Emanuel, K. A. and Živković-Rothman, M.: Development and evaluation of a convection scheme for use in climate models, J. Atmos. Sci., 56, 1766–1782, https://doi.org/10.1175/1520-0469(1999)056<1766:DAEOAC>2.0.CO;2, 1999.
Eremenko, M., Dufour, G., Foret, G., Keim, C., Orphal, J., Beekmann, M., Bergametti, G., and Flaud, J. M.: Tropospheric ozone distributions over Europe during the heat wave in July 2007 observed from infrared nadir spectra recorded by IASI, Geophys. Res. Lett., 35, L18805, https://doi.org/10.1029/2008GL034803, 2008.
Forster, C., Stohl, A., and Seibert, P.: Parameterization of convective transport in a Lagrangian particle dispersion model and its evaluation, J. Appl. Meteorol. Climatol., 46, 403–422, https://doi.org/10.1175/JAM2470.1, 2007.
Freitas, S. R., Longo, K. M., Chatfield, R., Latham, D., Silva Dias, M. A. F., Andreae, M. O., Prins, E., Santos, J. C., Gielow, R., and Carvalho Jr., J. A.: Including the sub-grid scale plume rise of vegetation fires in low resolution atmospheric transport models, Atmos. Chem. Phys., 7, 3385–3398, https://doi.org/10.5194/acp-7-3385-2007, 2007.
Fu, D., Bowman, K. W., Worden, H. M., Natraj, V., Worden, J. R., Yu, S., Veefkind, P., Aben, I., Landgraf, J., Strow, L., and Han, Y.: High-resolution tropospheric carbon monoxide profiles retrieved from CrIS and TROPOMI, Atmos. Meas. Tech., 9, 2567–2579, https://doi.org/10.5194/amt-9-2567-2016, 2016.
George, M., Clerbaux, C., Hurtmans, D., Turquety, S., Coheur, P.-F., Pommier, M., Hadji-Lazaro, J., Edwards, D. P., Worden, H., Luo, M., Rinsland, C., and McMillan, W.: Carbon monoxide distributions from the IASI/METOP mission: evaluation with other space-borne remote sensors, Atmos. Chem. Phys., 9, 8317–8330, https://doi.org/10.5194/acp-9-8317-2009, 2009.
Granier, C., Bessagnet, B., Bond, T., D'Angiola, A., Denier van der Gon, H., Frost, G. J., Heil, A., Kaiser, J. W., Kinne, S., Klimont, Z., Kloster, S., Lamarque, J.-F., Liousse, C., Masui, T., Meleux, F., Mieville, A., Ohara, T., Raut, J.-C., Riahi, K., Schultz, M. G., Smith, S. J., Thompson, A., van Aardenne, J., van der Werf, G. R., and van Vuuren, D. P.: Evolution of anthropogenic and biomass burning emissions of air pollutants at global and regional scales during the 1980–2010 period, Climate Change, 109, 163–190, https://doi.org/10.1007/s10584-011-0154-1, 2011.
Helten, M., Smit, H. G. J., Sträter, W., Kley, D., Nedelec, P., Zöger, M., and Busen, R.: Calibration and performance of automatic compact instrumentation for the measurement of relative humidity from passenger aircraft, J. Geophys. Res., 103, 25643–25652, https://doi.org/10.1029/98JD00536, 1998.
Hsu, J. and Prather, M. J.: Stratospheric variability and tropospheric ozone, J. Geophys. Res., 114, D06102, https://doi.org/10.1029/2008JD010942, 2009.
Kaiser, J. W., Heil, A., Andreae, M. O., Benedetti, A., Chubarova, N., Jones, L., Morcrette, J.-J., Razinger, M., Schultz, M. G., Suttie, M., and van der Werf, G. R.: Biomass burning emissions estimated with a global fire assimilation system based on observed fire radiative power, Biogeosciences, 9, 527–554, https://doi.org/10.5194/bg-9-527-2012, 2012.
Kalnay, E., Kanamitsu, M., Kistler, R., Collins, W., Deaven, D., Gandin, L., Iredell, M., Saha, S., White, G., Woollen, J., Zhu, Y., Leetmaa, A., Reynolds, R., Chelliah, M., Ebisuzaki, W., Higgins, W., Janowiak, J., Mo, K. C., Ropelewski, C., Wang, J., Jenne, R., and Joseph, D.: The NCEP/NCAR 40-Year Reanalysis Project, B. Am. Meteorol. Soc., 77, 437–471, https://doi.org/10.1175/1520-0477(1996)077<0437:TNYRP>2.0.CO;2, 1996.
Krishnamurti, T. N., Stefanova, L., and Misra, V.: Tropical Meteorology, An Introduction, 1st ed., Springer New York, New York, NY, 2013.
Lamarque, J.-F., Bond, T. C., Eyring, V., Granier, C., Heil, A., Klimont, Z., Lee, D., Liousse, C., Mieville, A., Owen, B., Schultz, M. G., Shindell, D., Smith, S. J., Stehfest, E., Van Aardenne, J., Cooper, O. R., Kainuma, M., Mahowald, N., McConnell, J. R., Naik, V., Riahi, K., and van Vuuren, D. P.: Historical (1850–2000) gridded anthropogenic and biomass burning emissions of reactive gases and aerosols: methodology and application, Atmos. Chem. Phys., 10, 7017–7039, https://doi.org/10.5194/acp-10-7017-2010, 2010.
Lelieveld, J., Gromov, S., Pozzer, A., and Taraborrelli, D.: Global tropospheric hydroxyl distribution, budget and reactivity, Atmos. Chem. Phys., 16, 12477–12493, https://doi.org/10.5194/acp-16-12477-2016, 2016.
Liousse, C., Assamoi, E., Criqui, P., Granier, C., and Rosset, R.: Explosive growth in African combustion emissions from 2005 to 2030, Environ. Res. Lett., 9, 035003, https://doi.org/10.1088/1748-9326/9/3/035003, 2014.
Logan, J. A., Prather, M. J., Wofsy, S. C., and McElroy, M. B.: Tropospheric chemistry: A global perspective, J. Geophys. Res., 86, 7210, https://doi.org/10.1029/JC086iC08p07210, 1981.
Marenco, A., Thouret, V., Nédélec, P., Smit, H., Helten, M., Kley, D., Karcher, F., Simon, P., Law, K., Pyle, J., Poschmann, G., Von Wrede, R., Hume, C., and Cook, T.: Measurement of ozone and water vapor by Airbus in-service aircraft: The MOZAIC airborne program, An overview, J. Geophys. Res., 103, 25631–25642, https://doi.org/10.1029/98JD00977, 1998.
Murray, L. T., Mickley, L. J., Kaplan, J. O., Sofen, E. D., Pfeiffer, M., and Alexander, B.: Factors controlling variability in the oxidative capacity of the troposphere since the Last Glacial Maximum, Atmos. Chem. Phys., 14, 3589–3622, https://doi.org/10.5194/acp-14-3589-2014, 2014.
Myhre, G., Shindell, D., Bréon, F.-M., Collins, W., Fuglestvedt, J., Huang, J., Koch, D., Lamarque, J.-F., Lee, B., Mendoza, B., Nakajima, T., Robock, A., Stephens, G., Takemura, T., and Zhang, H.: Anthropogenic and Natural Radiative Forcing, in: Climate Change 2013 – The Physical Science Basis. Contribution of Working Group I to the Fifth Assessment Report of the Intergovernmental Panel on Climate Change, edited by: Stocker, T. F., Qin, D., Plattner, G.-K., Tignor, M., Allen, S. K., Boschung, J., Nauels, A., Xia, Y., Bex, V., and Midgley, P. M., Cambridge University Press, Cambridge, United Kingdom and New York, NY, USA, 659–740, 2013.
Nedelec, P., Cammas, J.-P., Thouret, V., Athier, G., Cousin, J.-M., Legrand, C., Abonnel, C., Lecoeur, F., Cayez, G., and Marizy, C.: An improved infrared carbon monoxide analyser for routine measurements aboard commercial Airbus aircraft: technical validation and first scientific results of the MOZAIC III programme, Atmos. Chem. Phys., 3, 1551–1564, https://doi.org/10.5194/acp-3-1551-2003, 2003.
Nédélec, P., Blot, R., Boulanger, D., Athier, G., Cousin, J. M., Gautron, B., Petzold, A., Volz-Thomas, A., and Thouret, V.: Instrumentation on commercial aircraft for monitoring the atmospheric composition on a global scale: The IAGOS system, technical overview of ozone and carbon monoxide measurements, Tellus B, 6, 27791, https://doi.org/10.3402/tellusb.v67.27791, 2015.
Neis, P., Smit, H. G. J., Krämer, M., Spelten, N., and Petzold, A.: Evaluation of the MOZAIC Capacitive Hygrometer during the airborne field study CIRRUS-III, Atmos. Meas. Tech., 8, 1233–1243, https://doi.org/10.5194/amt-8-1233-2015, 2015a.
Neis, P., Smit, H. G. J., Rohs, S., Bundke, U., Krämer, M., Spelten, N., Ebert, V., Buchholz, B., Thomas, K., and Petzold, A.: Quality assessment of MOZAIC and IAGOS capacitive hygrometers: insights from airborne field studies, Tellus B, 67, 28320, https://doi.org/10.3402/tellusb.v67.28320, 2015b.
Park, M., Randel, W. J., Gettelman, A., Massie, S. T., and Jiang, J. H.: Transport above the Asian summer monsoon anticyclone inferred from Aura Microwave Limb Sounder tracers, J. Geophys. Res., 112, D16309, https://doi.org/10.1029/2006JD008294, 2007.
Petetin, H., Sauvage, B., Parrington, M., Clark, H., Fontaine, A., Athier, G., Blot, R., Boulanger, D., Cousin, J.-M., Nédélec, P., and Thouret, V.: The role of biomass burning as derived from the tropospheric CO vertical profiles measured by IAGOS aircraft in 2002–2017, Atmos. Chem. Phys., 18, 17277–17306, https://doi.org/10.5194/acp-18-17277-2018, 2018.
Petzold, A., Thouret, V., Gerbig, C., Zahn, A., Brenninkmeijer, C. A. M., Gallagher, M., Hermann, M., Pontaud, M., Ziereis, H., Boulanger, D., Marshall, J., NéDélec, P., Smit, H. G. J., Friess, U., Flaud, J. M., Wahner, A., Cammas, J. P., Volz-Thomas, A., and IAGOS TEAM: Global-scale atmosphere monitoring by in-service aircraft – current achievements and future prospects of the European Research Infrastructure IAGOS, Tellus B, 6, 1–24, https://doi.org/10.3402/tellusb.v67.28452, 2015.
Rémy, S., Veira, A., Paugam, R., Sofiev, M., Kaiser, J. W., Marenco, F., Burton, S. P., Benedetti, A., Engelen, R. J., Ferrare, R., and Hair, J. W.: Two global data sets of daily fire emission injection heights since 2003, Atmos. Chem. Phys., 17, 2921–2942, https://doi.org/10.5194/acp-17-2921-2017, 2017.
Sauvage, B., Thouret, V., Cammas, J.-P., Gheusi, F., Athier, G., and Nédélec, P.: Tropospheric ozone over Equatorial Africa: regional aspects from the MOZAIC data, Atmos. Chem. Phys., 5, 311–335, https://doi.org/10.5194/acp-5-311-2005, 2005.
Sauvage, B., Thouret, V., Thompson, A. M., Witte, J. C., Cammas, J. P., Nédéléc, P., and Athier, G.: Enhanced view of the “tropical Atlantic ozone paradox” and “zonal wave one” from the in situ MOZAIC and SHADOZ data, J. Geophys., 111, D01301, https://doi.org/10.1029/2005JD006241, 2006.
Sauvage, B., Gheusi, F., Thouret, V., Cammas, J.-P., Duron, J., Escobar, J., Mari, C., Mascart, P., and Pont, V.: Medium-range mid-tropospheric transport of ozone and precursors over Africa: two numerical case studies in dry and wet seasons, Atmos. Chem. Phys., 7, 5357–5370, https://doi.org/10.5194/acp-7-5357-2007, 2007a.
Sauvage, B., Martin, R. V., van Donkelaar, A., Liu, X., Chance, K., Jaeglé, L., Palmer, P. I., Wu, S., and Fu, T.-M.: Remote sensed and in situ constraints on processes affecting tropical tropospheric ozone, Atmos. Chem. Phys., 7, 815–838, https://doi.org/10.5194/acp-7-815-2007, 2007b.
Sauvage, B., Martin, R. V., van Donkelaar, A., and Ziemke, J. R.: Quantification of the factors controlling tropical tropospheric ozone and the South Atlantic maximum, J. Geophys. Res., 112, 1–14, https://doi.org/10.1029/2006JD008008, 2007c.
Sauvage, B., Thouret, V., Cammas, J. P., Brioude, J., Nédélec, P., and Mari, C.: Meridional ozone gradients in the African upper troposphere, Geophys. Res. Lett., 34, L03817, https://doi.org/10.1029/2006GL028542, 2007d.
Sauvage, B., Auby, A., and Fontaine, A.: Source attribution using FLEXPART and carbon monoxide emission inventories: SOFT-IO version 1.0, AERIS, https://doi.org/10.25326/2, 2017a.
Sauvage, B., Fontaine, A., Eckhardt, S., Auby, A., Boulanger, D., Petetin, H., Paugam, R., Athier, G., Cousin, J.-M., Darras, S., Nédélec, P., Stohl, A., Turquety, S., Cammas, J.-P., and Thouret, V.: Source attribution using FLEXPART and carbon monoxide emission inventories: SOFT-IO version 1.0, Atmos. Chem. Phys., 17, 15271–15292, https://doi.org/10.5194/acp-17-15271-2017, 2017b.
Sauvage, B., Nédélec, P., and Boulanger, D.: IAGOS ancillary data (L4) – CO contributions to the aircraft measurements, AERIS [data set], https://doi.org/10.25326/3, 2018.
Seibert, P. and Frank, A.: Source-receptor matrix calculation with a Lagrangian particle dispersion model in backward mode, Atmos. Chem. Phys., 4, 51–63, https://doi.org/10.5194/acp-4-51-2004, 2004.
Seinfeld, J. H. and Pandis, S. N.: Atmospheric chemistry and physics: from air pollution to climate change, 3rd edn., John Wiley & Sons, Hoboken, NJ, 2016.
Smit, H. G. J., Rohs, S., Neis, P., Boulanger, D., Krämer, M., Wahner, A., and Petzold, A.: Technical Note: Reanalysis of upper troposphere humidity data from the MOZAIC programme for the period 1994 to 2009, Atmos. Chem. Phys., 14, 13241–13255, https://doi.org/10.5194/acp-14-13241-2014, 2014.
Sofiev, M., Ermakova, T., and Vankevich, R.: Evaluation of the smoke-injection height from wild-land fires using remote-sensing data, Atmos. Chem. Phys., 12, 1995–2006, https://doi.org/10.5194/acp-12-1995-2012, 2012.
Stevenson, D. S., Young, P. J., Naik, V., Lamarque, J.-F., Shindell, D. T., Voulgarakis, A., Skeie, R. B., Dalsoren, S. B., Myhre, G., Berntsen, T. K., Folberth, G. A., Rumbold, S. T., Collins, W. J., MacKenzie, I. A., Doherty, R. M., Zeng, G., van Noije, T. P. C., Strunk, A., Bergmann, D., Cameron-Smith, P., Plummer, D. A., Strode, S. A., Horowitz, L., Lee, Y. H., Szopa, S., Sudo, K., Nagashima, T., Josse, B., Cionni, I., Righi, M., Eyring, V., Conley, A., Bowman, K. W., Wild, O., and Archibald, A.: Tropospheric ozone changes, radiative forcing and attribution to emissions in the Atmospheric Chemistry and Climate Model Intercomparison Project (ACCMIP), Atmos. Chem. Phys., 13, 3063–3085, https://doi.org/10.5194/acp-13-3063-2013, 2013.
Stohl, A., Forster, C., Frank, A., Seibert, P., and Wotawa, G.: Technical note: The Lagrangian particle dispersion model FLEXPART version 6.2, Atmos. Chem. Phys., 5, 2461–2474, https://doi.org/10.5194/acp-5-2461-2005, 2005.
Suzuki, T.: Seasonal variation of the ITCZ and its characteristics over central Africa, Theor. Appl. Climatol., 103, 39–60, https://doi.org/10.1007/s00704-010-0276-9, 2011.
Tanaka, H. L., Ishizaki, N., and Kitoh, A.: Trend and interannual variability of Walker, monsoon and Hadley circulations defined by velocity potential in the upper troposphere, Tellus A, 56, 250–269, https://doi.org/10.1111/j.1600-0870.2004.00049.x, 2004.
Thompson, A. M., Witte, J. C., Oltmans, S. J., Schmidlin, F. J., Logan, J. A., Fujiwara, M., Kirchhoff, V. W. J. H., Posny, F., Coetzee, G. J. R., Hoegger, B., Kawakami, S., Ogawa, T., Fortuin, J. P. F., and Kelder, H. M.: Southern Hemisphere Additional Ozonesondes (SHADOZ) 1998–2000 tropical ozone climatology 2. Troposheric variability and the zonal wave-one, J. Geophys. Res., 108, 8241, https://doi.org/10.1029/2002jd002241, 2003.
Thouret, V., Marenco, A., Logan, J. A., Nédélec, P., and Grouhel, C.: Comparisons of ozone measurements from the MOZAIC airborne program and the ozone sounding network at eight locations, J. Geophys. Res. Atmos., 103, 25695–25720, https://doi.org/10.1029/98JD02243, 1998.
Thouret, V., Cammas, J.-P., Sauvage, B., Athier, G., Zbinden, R., Nédélec, P., Simon, P., and Karcher, F.: Tropopause referenced ozone climatology and inter-annual variability (1994–2003) from the MOZAIC programme, Atmos. Chem. Phys., 6, 1033–1051, https://doi.org/10.5194/acp-6-1033-2006, 2006.
Tocquer, F., Barret, B., Mari, C., Flochmoën, E. L. E., Cammas, J. P., and Sauvage, B.: An upper tropospheric “ozone river” from Africa to India during the 2008 Asian post-monsoon season, Tellus B, 67, https://doi.org/10.3402/tellusb.v67.25350, 2015.
van der Werf, G. R., Randerson, J. T., Giglio, L., Collatz, G. J., Kasibhatla, P. S., and Arellano Jr., A. F.: Interannual variability in global biomass burning emissions from 1997 to 2004, Atmos. Chem. Phys., 6, 3423–3441, https://doi.org/10.5194/acp-6-3423-2006, 2006.
Zhang, Y., Cooper, O. R., Gaudel, A., Thompson, A. M., Nédélec, P., Ogino, S.-Y., and West, J. J.: Tropospheric ozone change from 1980 to 2010 dominated by equatorward redistribution of emissions, Nat. Geosci., 9, 875–879, https://doi.org/10.1038/ngeo2827, 2016.
- Abstract
- Introduction
- Data and methods
- Seasonality of the African upper-tropospheric circulation
- O3 and CO meridional transects in the African upper troposphere
- Origin and sources of CO
- Origins of O3 and associated transport pathways
- Conclusions and perspectives
- Data availability
- Author contributions
- Competing interests
- Disclaimer
- Acknowledgements
- Financial support
- Review statement
- References