the Creative Commons Attribution 4.0 License.
the Creative Commons Attribution 4.0 License.
 | 24 Sep 2021
Laboratory and field studies of ice-nucleating particles from open-lot livestock facilities in Texas
Brent W. Auvermann
Franco Belosi
Jack Bush
Kimberly M. Cory
Dimitrios G. Georgakopoulos
Kristina Höhler
Yidi Hou
Larissa Lacher
Harald Saathoff
Gianni Santachiara
Xiaoli Shen
Isabelle Steinke
Romy Ullrich
Nsikanabasi S. Umo
Hemanth S. K. Vepuri
Franziska Vogel
Ottmar Möhler
In this work, an abundance of ice-nucleating particles (INPs) from livestock facilities was studied through laboratory measurements from cloud-simulation chamber experiments and field investigation in the Texas Panhandle. Surface materials from two livestock facilities, one in the Texas Panhandle and another from McGregor, Texas, were selected as dust proxies for laboratory analyses. These two samples possessed different chemical and biological properties. A combination of aerosol interaction and dynamics in the atmosphere (AIDA) measurements and offline ice spectrometry was used to assess the immersion freezing mode ice nucleation ability and efficiency of these proxy samples at temperatures above −29 ∘C. A dynamic filter processing chamber was also used to complement the freezing efficiencies of submicron and supermicron particles collected from the AIDA chamber. For the field survey, periodic ambient particle sampling took place at four commercial livestock facilities from July 2017 to July 2019. INP concentrations of collected particles were measured using an offline freezing test system, and the data were acquired for temperatures between −5 and −25 ∘C.
Our AIDA laboratory results showed that the freezing spectra of two livestock dust proxies exhibited higher freezing efficiency than previously studied soil dust samples at temperatures below −25 ∘C. Despite their differences in composition, the freezing efficiencies of both proxy livestock dust samples were comparable to each other. Our dynamic filter processing chamber results showed on average approximately 50 % supermicron size dominance in the INPs of both dust proxies. Thus, our laboratory findings suggest the importance of particle size in immersion freezing for these samples and that the size might be a more important factor for immersion freezing of livestock dust than the composition. From a 3-year field survey, we measured a high concentration of ambient INPs of 1171.6 ± 691.6 L−1 (average ± standard error) at −25 ∘C for aerosol particles collected at the downwind edges of livestock facilities. An obvious seasonal variation in INP concentration, peaking in summer, was observed, with the maximum at the same temperature exceeding 10 000 L−1 on 23 July 2018. The observed high INP concentrations suggest that a livestock facility is a substantial source of INPs. The INP concentration values from our field survey showed a strong correlation with measured particulate matter mass concentration, which supports the importance of size in ice nucleation of particles from livestock facilities.
- Article
(2066 KB) - Full-text XML
-
Supplement
(1466 KB) - BibTeX
- EndNote


Atmospheric ice-nucleating particles (INPs) are a small subset of aerosol particles that initiate ice crystal formation in supercooled clouds (Vali, 1968; Pruppacher and Klett, 2010). While their importance, relevance, and perturbations to cloud and precipitation properties have been revealed by numerous past studies (e.g., Kanji et al., 2017, and references therein), the potential climatic impact of INPs and their representation in numerical models remain under debate (Boucher et al., 2013; Storelvmo, 2017; Zelinka et al., 2020). One of the greatest challenges in the INP research field is the fact that we do not yet understand all INP sources worldwide, in part due to the ongoing global climate change (Murray et al., 2021). Thus, it is crucial to identify and characterize any perturbation sources that alter INP abundance and cloud-phase feedback.
Recently, a resurgence of “fertile-and-agricultural soil dust” (soil dust hereafter) INP research has been underway, in part because of emerging concerns regarding hydrological cycle alteration contributed by modern agricultural practices (Alter et al., 2015; Overpeck and Udall, 2020). Moreover, since agricultural practices represent a substantial dust emission source, accounting for up to 25 % of total global dust emissions (Ginoux et al., 2012), a large number of INPs are globally anticipated from agricultural activities. Motivated by these reasons as well as by earlier studies on ice nucleation (IN) of surface soil organic and biological samples (Schnell and Vali, 1972, 1973), more recent studies utilized various online and offline instruments. In turn, scientists now have a better understanding of ambient INP concentrations (nINP, per unit volume of air), especially through immersion freezing (i.e., the freezing of aerosol particle(s) immersed in a supercooled droplet), from different agricultural sources (Conen et al., 2011; Hill et al., 2016; Steinke et al., 2016; Suski et al., 2018). These efforts allow for first-order estimates of immersion-mode nINP from soil dust that is relevant to mixed-phase clouds (O'Sullivan et al., 2014; Tobo et al., 2014; Steinke et al., 2020). For instance, by compiling the data from the Colorado State University continuous flow diffusion chamber and an ice spectrometer, the range of measured soil dust nINP at −20 ∘C produced by the harvesting of several crops in the High Plains region of the United States from Suski et al. (2018) spanned from ∼0.3 to 10 L−1. Based on global mean aerosol particle concentrations and immersion-mode IN parameterization, O'Sullivan et al. (2014) estimated the simulated nINP at −20 ∘C and 600 mb to range from ∼0.01 to 8 L−1. Similarly, Steinke et al. (2020) estimated that soil dust nINP can be as high as approximately 40 L−1 at −20 ∘C based on their laboratory-derived IN parameterization for soil dust from northwestern Germany and Wyoming, USA. Overall, these measurements and approximations represent the upper bound of general field-studied nINP from different geographical areas as summarized in Kanji et al. (2017; Fig. 1–10) in the same temperature range, i.e., 0.002 to 60 L−1 (see Sect. 3.2.3 for a more detailed comparison discussion).
Agricultural land use accounts for more than 50 % of total US land use according to the U.S. Department of Agriculture (Bigelow and Borchers, 2017), and there are >26 000 “open-lot livestock facilities” (OLLFs) in the US (Drouillard, 2018). The term OLLF is adapted to denote a particular type of animal-feeding operation, in which cattle livestock is raised in outdoor confinement, as distinct from partially or totally enclosed housing and also as distinct from pasture or free-range production systems (Auvermann et al., 2004). OLLFs are common in semi-arid and arid climates. Contrasted with the alternative production systems typical of wetter and more temperate climates, they (1) are an intensified form of livestock production, generating more marketable product per unit land area with less built infrastructure, (2) make use of the elevated evaporative demand to reduce or eliminate precipitation-generated wastewater that must be controlled under water-quality regulations, and (3) capitalize on the nocturnal cooling characteristic of semi-arid and desert climates to avoid major investments in (and operating costs associated with) ventilation systems while still reducing the incidence and duration of livestock heat stress under most conditions (Auverman, 2001; Pastoor et al., 2012).
In particular, the Texas Panhandle (northernmost counties of Texas, also known as West Texas) is a major contributor to US cattle production, accounting for 42 % of fed beef cattle in the US and 30 % of the total cattle population in Texas (>11 million head, Annamalai et al., 2012; USDA, 2021). Annually, these cattle produce >5 million tons of manure, which represents a complex microbial habitat containing bacteria and other microorganisms, on an as-collected basis (Von Essen and Auvermann, 2005). In general, cattle manure hosts a wide variety of bovine rumen bacteria (e.g., Prevotellaceae, Clostridiales), lipoprotein components of certain bacterial cell walls, and non-bacterial fauna of the rumen, such as fungal spores, lichens, fungi, Plantae, Protista, Protozoa, Chromalveolata, and Archaea (Nagaraja, 2016). Mainly by cattle movements, dried manure became airborne (Bush et al., 2014). Agricultural dust particles observed at OLLFs have long been known to affect regional air quality because the dust emission flux and 24 h-averaged ground-level dust concentration can be as high as 23.5 µg m−2 s−1 and 1,200 µg m−3 (Bush et al., 2014; Hiranuma et al., 2011). While there has been no study on the vertical profiles of OLLF dust, our previous study revealed the presence of OLLF-derived particles at 3.5 km downwind of the facility, suggesting their ability to be transported regionally (Hiranuma et al., 2011). Moreover, some recent studies suggest that aerosol particles emitted from agricultural activities might reach cloud heights due to wind erosion, scouring, and other relevant mechanisms (Duniway et al., 2019; Katra, 2020; Steinke et al., 2020, and references therein). Convection and updraft systems may also help the vertical transport of aerosol particles in the Southern High Plains region (Li et al., 2017).
Due to the potential to act as a prevalent point source of microbiome-enriched dust particles, we hypothesized that an OLLF could be a source of soil dust INPs. To verify this hypothesis, IN efficiencies of OLLF proxies, their physicochemical and biological properties, and IN propensities of ambient particles from OLLFs were studied in both laboratory and field settings. Specifically, we examined the immersion-mode IN ability of surface-derived material samples aerosolized in a cloud-simulation chamber and ambient OLLF dust sampled in the field through offline lab analysis. We focused on the immersion-mode freezing because recent modeling simulation and remote sensing studies suggest that immersion freezing is the most prominent heterogeneous IN mechanism, through which ice crystals are formed in mixed-phase clouds, accounting for 85 % to 99 % of ice crystal formation (Hande and Hoose, 2017; Westbrook and Illingworth, 2011). To complement the immersion freezing results, we also attempted to investigate the presence of any known biological INPs by taxonomic identification of the microbiome.
2.1 Laboratory study
2.1.1 Samples
Two types of OLLF surface-derived materials, Texas-Dust-01 (TXD01) and Texas-Dust-05 (TXD05), were used for our laboratory study at the Aerosol Interaction and Dynamics in the Atmosphere (AIDA) facility. TXD01 is a composite sample of surface soils from several OLLFs located in the Texas Panhandle. The other sample (TXD05) originates from a research feedlot in McGregor, Texas. Both samples represent a raw surface material composite from feedlot pens, where cattle are fed without antibiotics or probiotics. Soil samples were collected on 20 September 2017. All samples were scooped from the loose dry surface layer of the pens (<5 cm). Typically, the pen surface layer only extends to a depth of about 5 cm, which represents the depth of hoof penetration into the pen surface (Guo et al., 2011). This surface layer is rich in loose manure, which is a major source of ambient OLLF dust (Bush et al., 2014; von Holdt et al., 2021). All samples were ground and sieved for grain size <75 µm. They were kept in chemically inert containers at room temperature until analyzed.
The physical properties of our samples were characterized by several offline analyses. Bulk density values of both samples were measured using a gas displacement pycnometer (Quantachrome, 1200e Ultrapyc). Nitrogen adsorption-based specific surface area (SSA) values, Brunauer–Emmett–Teller (BET) SSAs, for all samples were also carried out. The Autosorb iQ model 7 gas sorption system (Anton Paar, formerly Quantachrome Instruments) was used to measure BET SSAs in this study. A summary of the physical properties of our samples is provided in Sect. 3.1.1. In addition, we used a single-particle mass spectrometer to characterize the aerosol particle chemical compositions of our surface samples in the size range between 200 and 2500 nm presented in Supplement Sect. S1.
2.1.2 Cloud-simulation chamber experiments
We used the AIDA expansion cloud-simulation chamber (e.g., Möhler et al., 2003) and a set of analytical instruments at the Karlsruhe Institute of Technology to conduct a laboratory campaign named TXDUST01 in 2018. The AIDA chamber generates artificial clouds and activates particles in a simulated atmospheric cloud parcel via expansion cooling. The air volume adjacent to the chamber wall in the 84 m3 vessel is much smaller than the actively mixed volume of the vessel. Hence, we neglect the so-called wall effect (e.g., particle wall deposition) in the AIDA. The AIDA measurement uncertainties for temperature, relative humidity (RH), and freezing efficiency are ±0.3 ∘C (Möhler et al., 2003), ±5 % (Fahey et al., 2014), and ±35 % (Steinke et al., 2011). Note that the AIDA results provided a validation of the other INP spectrometers employed in this study.
An overall AIDA experimental schematic is shown in Fig. 1. Our OLLF dust proxy sample was injected into the AIDA chamber in an aerosolized form by a rotating brush disperser (PALAS, RBG1000). A series of inertial cyclone impactor stages (50 % cut-size diameters ∼1 and 5 µm) was deployed between the disperser and the AIDA vessel to limit particle size to <10 µm in volume-equivalent diameter, Dve. Physically pulverizing the surface samples simulates the primary emission mechanism, which justifies the use of a brush disperser and characterization of aerosolized OLLF samples in the AIDA chamber (von Holdt et al., 2021; Razote et al., 2006).
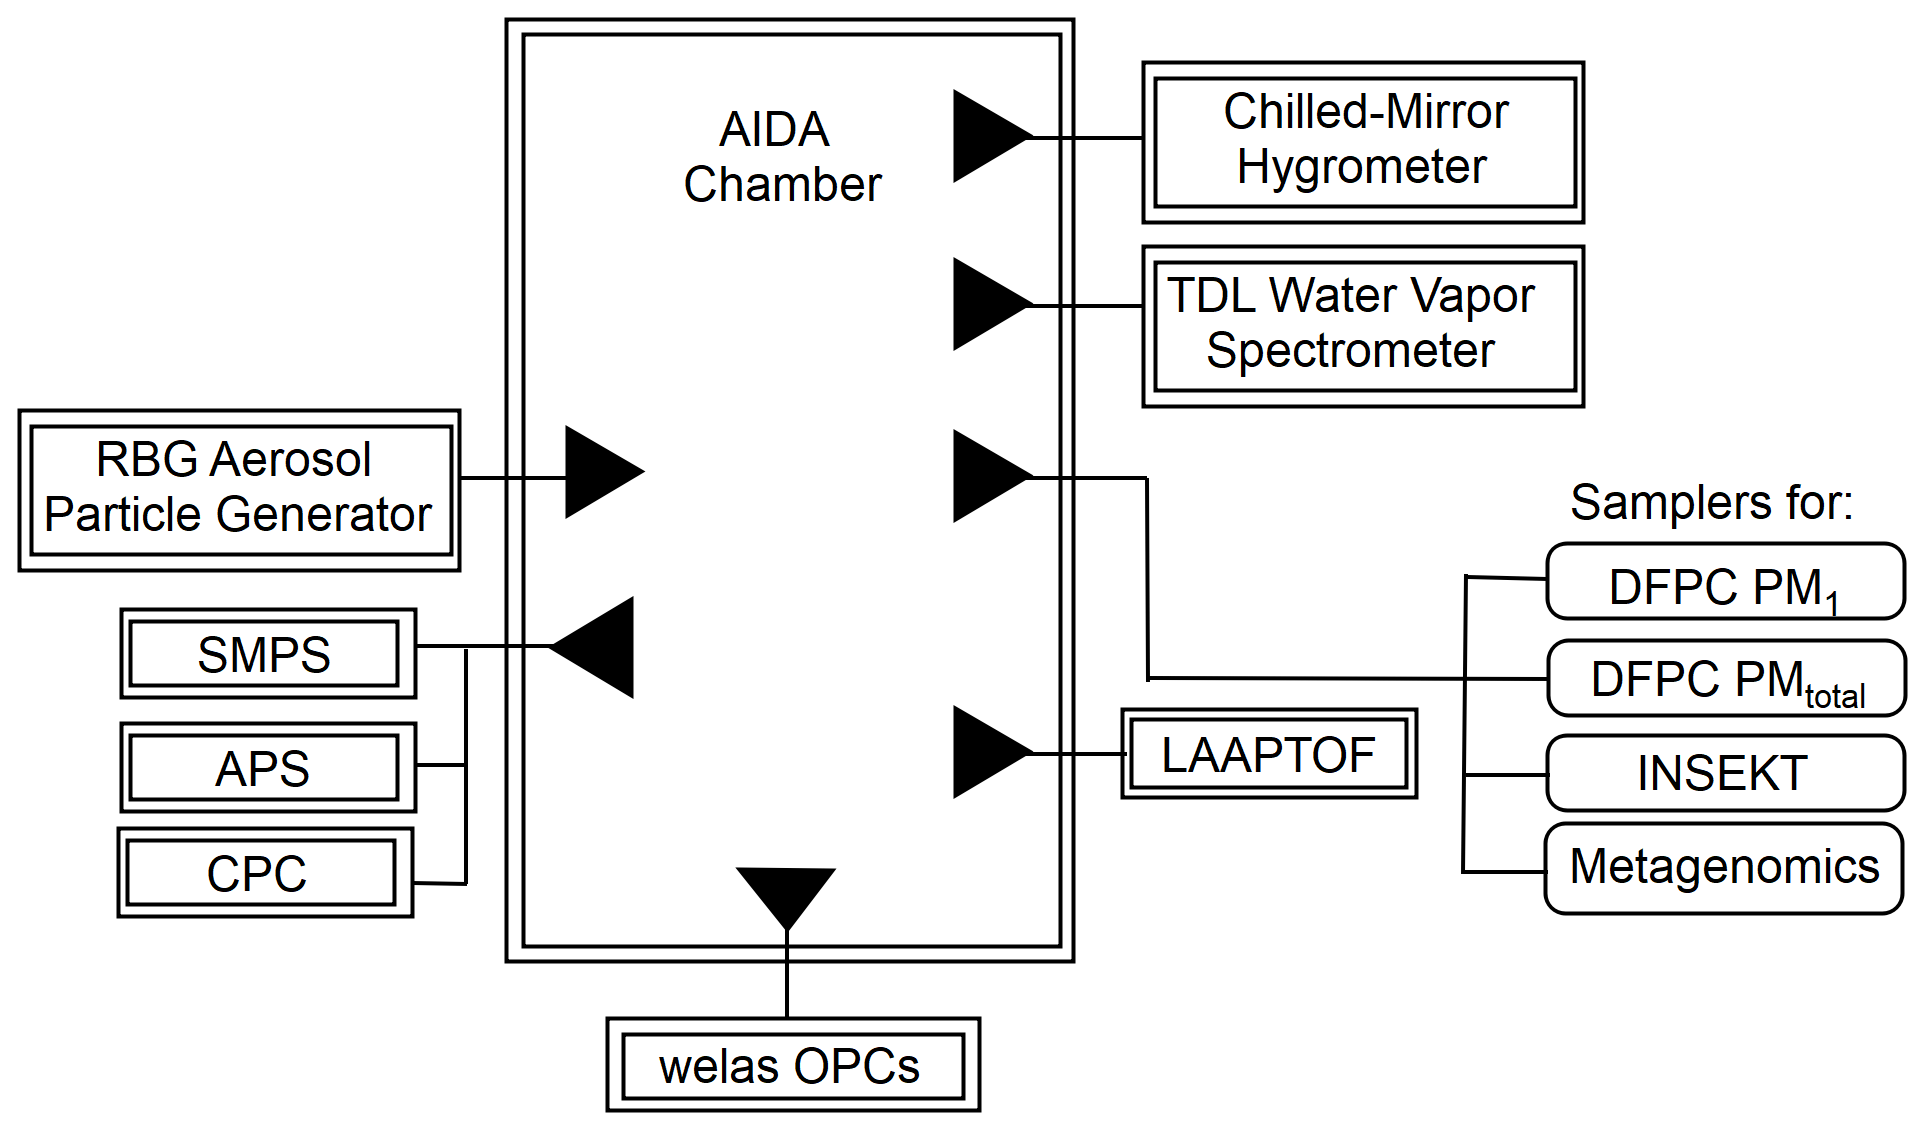
Figure 1Lab experimental schematic of the AIDA facility. All samples were injected using a rotating brush generator (RBG) for aerosol particle generation. Multiple extramural instruments, welas optical particle counters (OPCs), a hygrometer, a tunable diode laser (TDL) spectrometer, a laser ablation aerosol particle time-of-flight mass spectrometer (LAAPTOF; see Supplement), and aerosol particle counters/sizers (SMPS, APS, CPCs) are connected to the AIDA chamber. Downstream filters and impactors collected aerosol particles for multiple offline analyses.
The OLLF particle number concentration and size distribution in the AIDA chamber were measured prior to each simulated adiabatic expansion experiment. Specifically, a combination of a scanning mobility particle sizer (SMPS, TSI Inc., Model 3080 differential mobility analyzer and Model 3010 condensation particle counter), an aerosol particle sizer (APS, TSI Inc., Model 3321), and a condensation particle counter (CPC; TSI Inc., Model 3076) measured the aerosol particles at a horizontally extended outlet of the AIDA chamber (Möhler et al., 2006). Table 1 summarizes estimated particle properties from individual AIDA expansion experiments. All lab data associated with this study were archived according to the AIDA experiment number (i.e., TXDUST01_number), and we share these IDs with other associated measurements. In addition, as seen in Fig. 1, aerosol particles were sampled on several filter substrates directly from the AIDA chamber before expansion experiments. These filter samples were used for three complementary offline analyses.
Table 1Characterization of particle properties: assessed prior to AIDA expansion experiments.
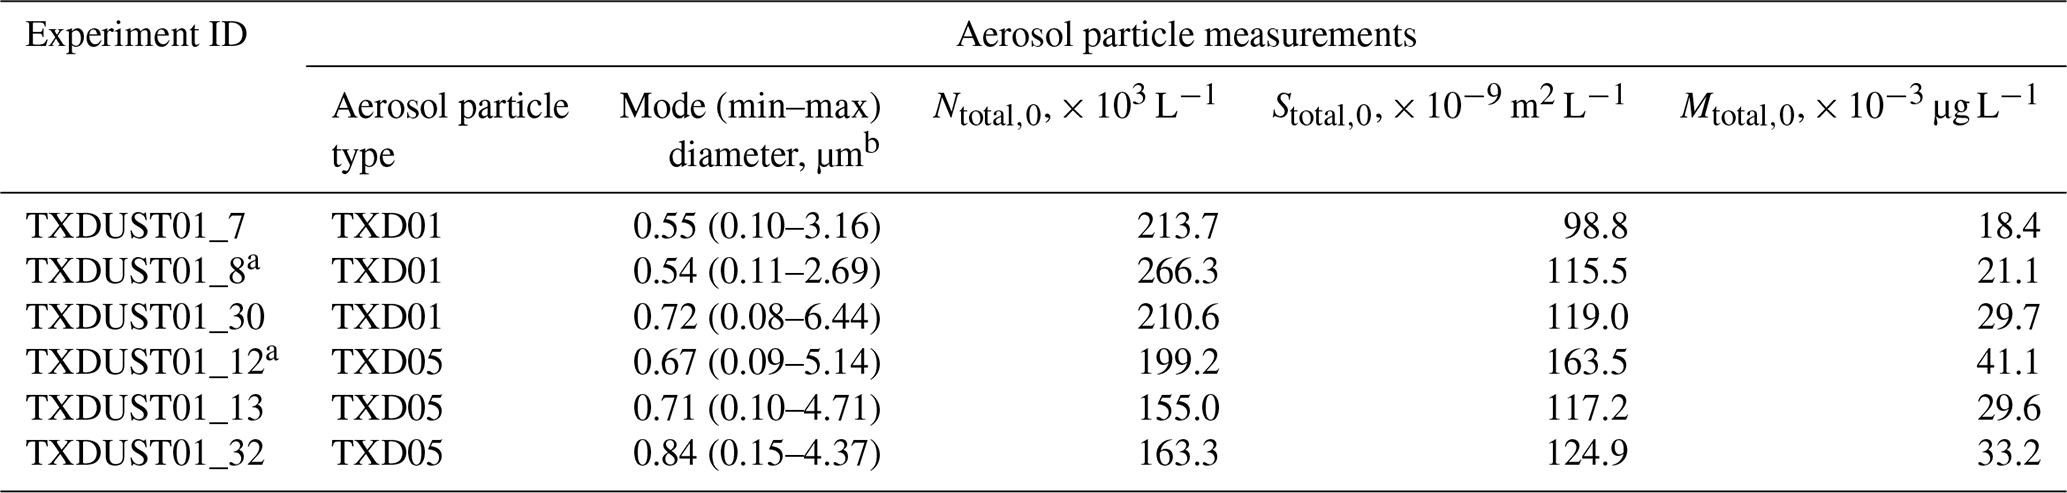
a Samples for offline analyses (Sect. 2.1.3–2.1.5) were collected. b Based on the fit; min–max values are estimated at 0.1 × 10⁻⁹ m2 L−1; Ntotal,0 = total number concentration of particles at the initial stage (t=0) prior to expansion; Stotal,0 = total surface concentration of particles at the initial stage (t=0) prior to expansion; Mtotal,0 = total mass concentration of particles at the initial stage (t=0) prior to expansion; Dve = volume-equivalent diameter.
2.1.3 The ice nucleation spectrometer of the Karlsruhe Institute of Technology (INSEKT)
The IN spectrometer of the Karlsruhe Institute of Technology (INSEKT) system is an offline immersion freezing technique, and its design and concept are based on the Colorado State University ice spectrometer (Hill et al., 2014 and 2016) as described in Schiebel (2017) and Schneider et al. (2021). In this study, INSEKT was used to assess the IN ability of surface OLLF samples collected on 47 mm polycarbonate Nuclepore filters (Whatman, Track-Etched Membranes, 0.2 µm pore) at the AIDA facility. The INSEKT data are especially useful for complementing the AIDA chamber immersion results at temperatures above −25 ∘C. All filter samples were collected with a sampling flow rate of 10 L min−1, and a total of ≈600 L of air was sampled through a cross-section of each filter (see Table 1 for corresponding AIDA experiments).
Filter-collected aerosol particles were suspended in 8 mL filtered nano-pure water, which has a negligible contribution to background freezing (Schneider et al., 2021). The washing water volume was optimized based on the total amount of air sampled through the cross-section of the filter, so that the resulting suspension contained at least 0.015 INP L−1 at the upper temperature detection limit of INSEKT. For the INSEKT analysis, the resulting suspension was divided into volumes of 50 µL, which were placed in wells of a sterile PCR tray. It was then placed in an aluminum block thermostated with an ethanol cooling bath (LAUDA RP 890; Lauda), which was cooled down at a rate of 0.33 ∘C min−1. If a well froze upon the presence of an INP, a camera detected the associated brightness change based on an optimized greyscale threshold value set on the LabView software.
The freezing data were analyzed with a 0.5 ∘C temperature resolution. The temperature uncertainty of INSEKT was ±0.5 ∘C, and the nINP error was estimated as the 95 % binomial confidence intervals (CI95%) for each sample.
A series of diluted suspensions (×15 to ×225) was consistently analyzed for each sample to acquire INP spectra covering a wide range of heterogeneous freezing temperatures (above −25 ∘C), which complemented the AIDA results at higher temperatures than AIDA could examine. For the overlapping temperatures, we chose the data exhibiting the minimum CI95% as representative nINP for a given temperature.
We now describe the derivations of nINP based on Vali (1971) as well as immersion freezing efficiencies. Initially, we computed the CINP(T) value, which is the nucleus concentration in ultrapure water suspension (L−1 water) at a given temperature. This CINP(T) value was calculated as a function of the unfrozen fraction, funfrozen(T) (i.e., the ratio of the number of droplets unfrozen to the total number of droplets), as
in which Vd is the volume of the sample in a well (50 µL) for INSEKT. Next, we converted CINP(T) to nINP(T), INP in the unit volume of atmospheric air at standard temperature and pressure (STP), which are 273.15 K and 1013 mb, respectively. The cumulative nINP per unit volume of sample air, described in the previous study DeMott et al. (2017), was then estimated as
where DF is a serial dilution factor, Vair is the sampled air volume, and Vl is the suspension volume. Finally, based on Eq. (3) of Hiranuma et al. (2015), the INP concentration per unit aerosol particle mass, nm(T), and INP concentration per unit geometric aerosol particle surface as a function of T, ns,geo(T), were derived as
where Mve is the mass of a spherical particle of volume-equivalent diameter (g), and is a geometric specific surface area. The value used for this study was derived from particle size distribution measurements from the AIDA chamber (presented in Table 1). Niemand et al. (2012) infer that the application of ns,geo is valid for small percentages of an IN-active fraction (≤1 %). From the numbers of Ntotal,0 given in Table 1 (total number concentration of particles at the initial stage prior to expansion), we examined on average ∼200 000 L−1 aerosol particles in the immersion freezing mode in AIDA. INSEKT typically measures INP counts up to several hundred. Even assuming we evaluate INP up to 2000 L−1, our INP fraction is 1 %. We, therefore, conclude that our ns parameterization introduced in Sect. 3.1 is reasonable.
2.1.4 The dynamic filter processing chamber
Condensation-/immersion-mode nINP was also measured at the National Research Council in Bologna by means of a dynamic filter processing chamber (DFPC, Santachiara et al., 2010). The DFPC system is a replica of the Langer dynamic developing chamber (Langer and Rodgers, 1975). The systematic temperature uncertainty in DFPC is within ±0.1 ∘C (Table S1 in Hiranuma et al., 2019). With a water saturation error of ±0.01, an ice detection error of ±33 %, and the experimental standard deviation, the overall IN efficiency uncertainties of DFPC are estimated to be less than ±62 % for this study. The application of DFPC for immersion freezing has been verified in previous inter-comparison studies (DeMott et al., 2018; Hiranuma et al., 2019).
For the DFPC analyses, aerosol particles were collected on nitrocellulose black gridded membrane filters (Millipore HABG04700, nominal porosity 0.45 µm) from the AIDA chamber prior to each expansion experiment (Table 1). Two parallel samplers employed in this study had an identical sampling flow rate of 2 L min−1, and a total of 100 L of air was sampled for each system. One sampling system collected the total aerosol particles, while another was equipped with a cyclone impactor (MesaLabs, SCC0732, S/N 13864) to collect only submicron-sized aerosol particles. This impactor was characterized by a cut-off size around 1 µm in aerodynamic diameter (50 % cut-off diameter at 0.9 µm) at a 2 L min−1 flow rate (Kenny et al., 2000). Therefore, the latter line selectively collected particles smaller than 1 µm aerodynamic diameter.
The cut-size efficiency of this cyclone impactor was tested in the lab against NaCl particles. Particle transmission efficiency along the total sampling line was taken into account by estimating gravitational losses in the horizontal tract of the sampling tube and inertial losses in the bend. At a particle size of 10 µm (larger than what was measured in the AIDA chamber), the overall particle transmission efficiency was higher than 86 %. For a particle size of 2 µm, the particle loss is estimated to be ≈2.5 %. Due to the small loss, we neglected any corrections for aerosol particle counts. After collection, the filters were safely kept in Petri dishes at room temperature until the freezing experiments were initiated.
Prior to the DFPC measurement, the sampled filter was inserted onto a metal plate and covered with a smooth surface of paraffin in order to ensure good thermal contact between the filter and the supporting substrate. Subsequently, the paraffin was slightly heated and rapidly cooled to fill the filter pores. DFPC controlled the temperatures of the filter and the air, saturated with respect to finely minced ice, with the flow continuously grazing the filter. IN measurements of total aerosol particles, nINP,total, as well as measurements of PM1 (PMx = particulate matter smaller than x µm), , were performed at a water supersaturation of 2 % and temperatures of −18 and −22 ∘C. The supersaturation was calculated theoretically from vapor pressures over ice and water. The exposure time of the filter was 20 min to grow visible ice crystals on INPs at the considered RH and temperature conditions. The nINP value was calculated by scaling the total counts of ice crystals detected on each filter by the sampled air volume.
2.1.5 Analysis of sample microbiomes
The microbiome of our samples was characterized by metagenomic analysis. With this approach, total DNA is extracted from environmental samples; this DNA is a mix from all microorganisms and macroorganisms present in a sample. The qualitative and quantitative identification of microorganisms is carried out by amplifying (by polymerase chain reaction) and sequencing (several methods are in use) specific DNA segments of phylogenetic markers (genes that are used for identifying an organism) from the extracted and purified total DNA. Bioinformatics analysis of sequences obtained determines the nature and abundance of microorganisms in this sample.
To sample aerosolized dust from the AIDA cloud chambers, stainless steel filter holders containing 47 mm Nuclepore filters (0.2 µm pore size) were used. These filters were previously sterilized in a standard vapor autoclave and fitted onto the AIDA cloud chamber for aerosol particle sampling prior to the expansion IN experiment. After the conclusion of the experiments, the holders were removed from the chamber to extract total DNA directly from the Nuclepore filters. DNA extractions were performed using the FastDNA® Spin Kit for Soil (MP Biomedicals) as described in the manufacturer's protocol. Filters were aseptically removed from holders and placed in the Lysing Matrix E tube for mechanical cell disruption, which was carried out with the FastPrep® instrument (MP Biomedicals). The concentration and purity of the extracted DNA were measured by using the Qubit™ 3.0 (Thermo Fisher Scientific). The volume of each sample was 50–100 µL.
The amplification of phylogenetic marker genes and the metagenomic analysis and sequence processing of amplicons from each dust sample were performed by Eurofins Genomics Germany GmbH using the INVIEW Microbiome Profiling 3.0 protocol in order to identify and classify the microbial population (Fungi, Bacteria, and Archaea) of each sample. To achieve this, the hypervariable regions V1–V3 and V3–V5 of the bacterial 16SrRNA gene, the fungal internal transcribed spacer (ITS2) gene, and part of the archaeal 16SrRNA gene were amplified by polymerase chain reactions from each sample using in-house primers. Amplicons were sequenced with the MiSeq next-generation sequencing system with the 2 × 300 bp paired-end read module.
2.2 Field investigation
2.2.1 Locations
Four commercial OLLFs, ranging from 0.5 to 2.6 km2 (maximum 45 000 head capacity), located in the Texas Panhandle region were used as the ambient aerosol particle sampling sites. All four sites are located within a 53 km radius of West Texas A&M University in Canyon, Texas. Our experimental layouts at each site, denoted as OLLF-1 to OLLF-4, are shown in Fig. 2 (no further specification is provided to protect location privacy). All the sites have a capacity greater than 1000 head, which is categorized as a large concentrated animal-feeding operation facility for cattle under the U.S. Environmental Protection Agency's definition (https://www3.epa.gov/npdes/pubs/sector_table.pdf, U.S. Environmental Protection Agency, 2021). These OLLFs were selected primarily for the east–west orientation of their feeding and working alleys, which were nearly orthogonal to prevailing southerly to southwesterly winds, allowing for downwind and upwind sampling. When southerly wind prevailed (90∘ < wind direction < 270∘), we used the northern site as the downwind site. Likewise, the southern site was used as the downwind site while the northerly wind was dominant (270∘ < wind direction < 90∘). Our sampling sites represent typical OLLFs, as more than 75 % of cattle are produced in large concentrated animal-feeding operation facilities in the US (Drouillard, 2018).
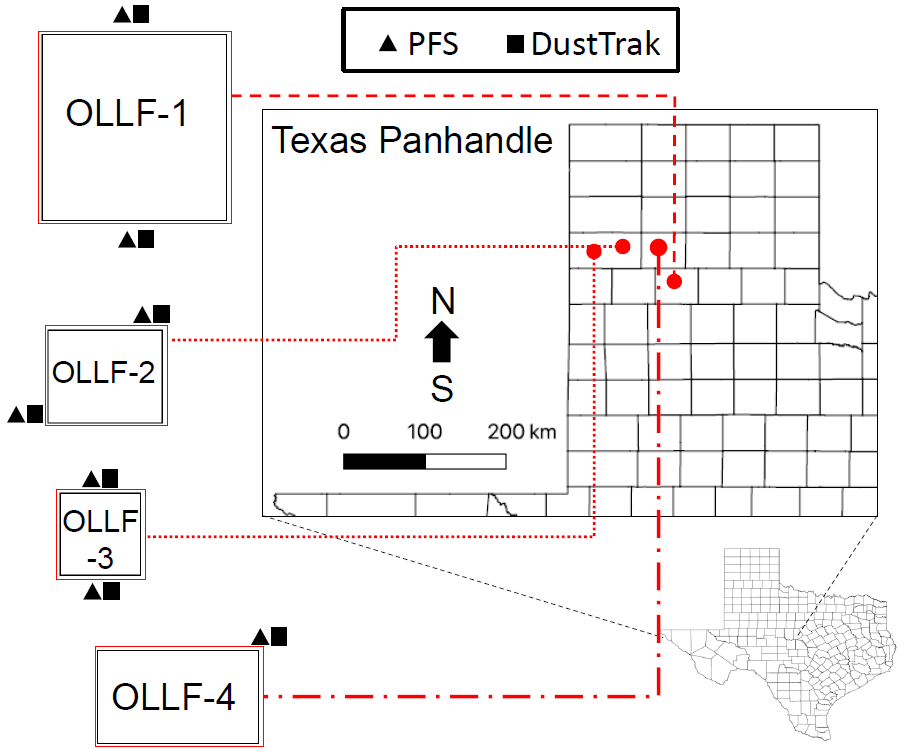
Figure 2Schematic of the field sampling activity at individual sites (only the counties are shown). The dimension of each facility (east–west × north–south) is (1) 1.6 × 1.6 km, (2) 1.0 × 0.8 km, (3) 0.7 × 0.7 km, and (4) 1.4 × 0.8 km. A combination of polycarbonate filter samplers (PFSs) and DustTrak instruments was used at the nominally upwind and downwind edges of OLLF-1 to OLLF-3.
2.2.2 Field sampling
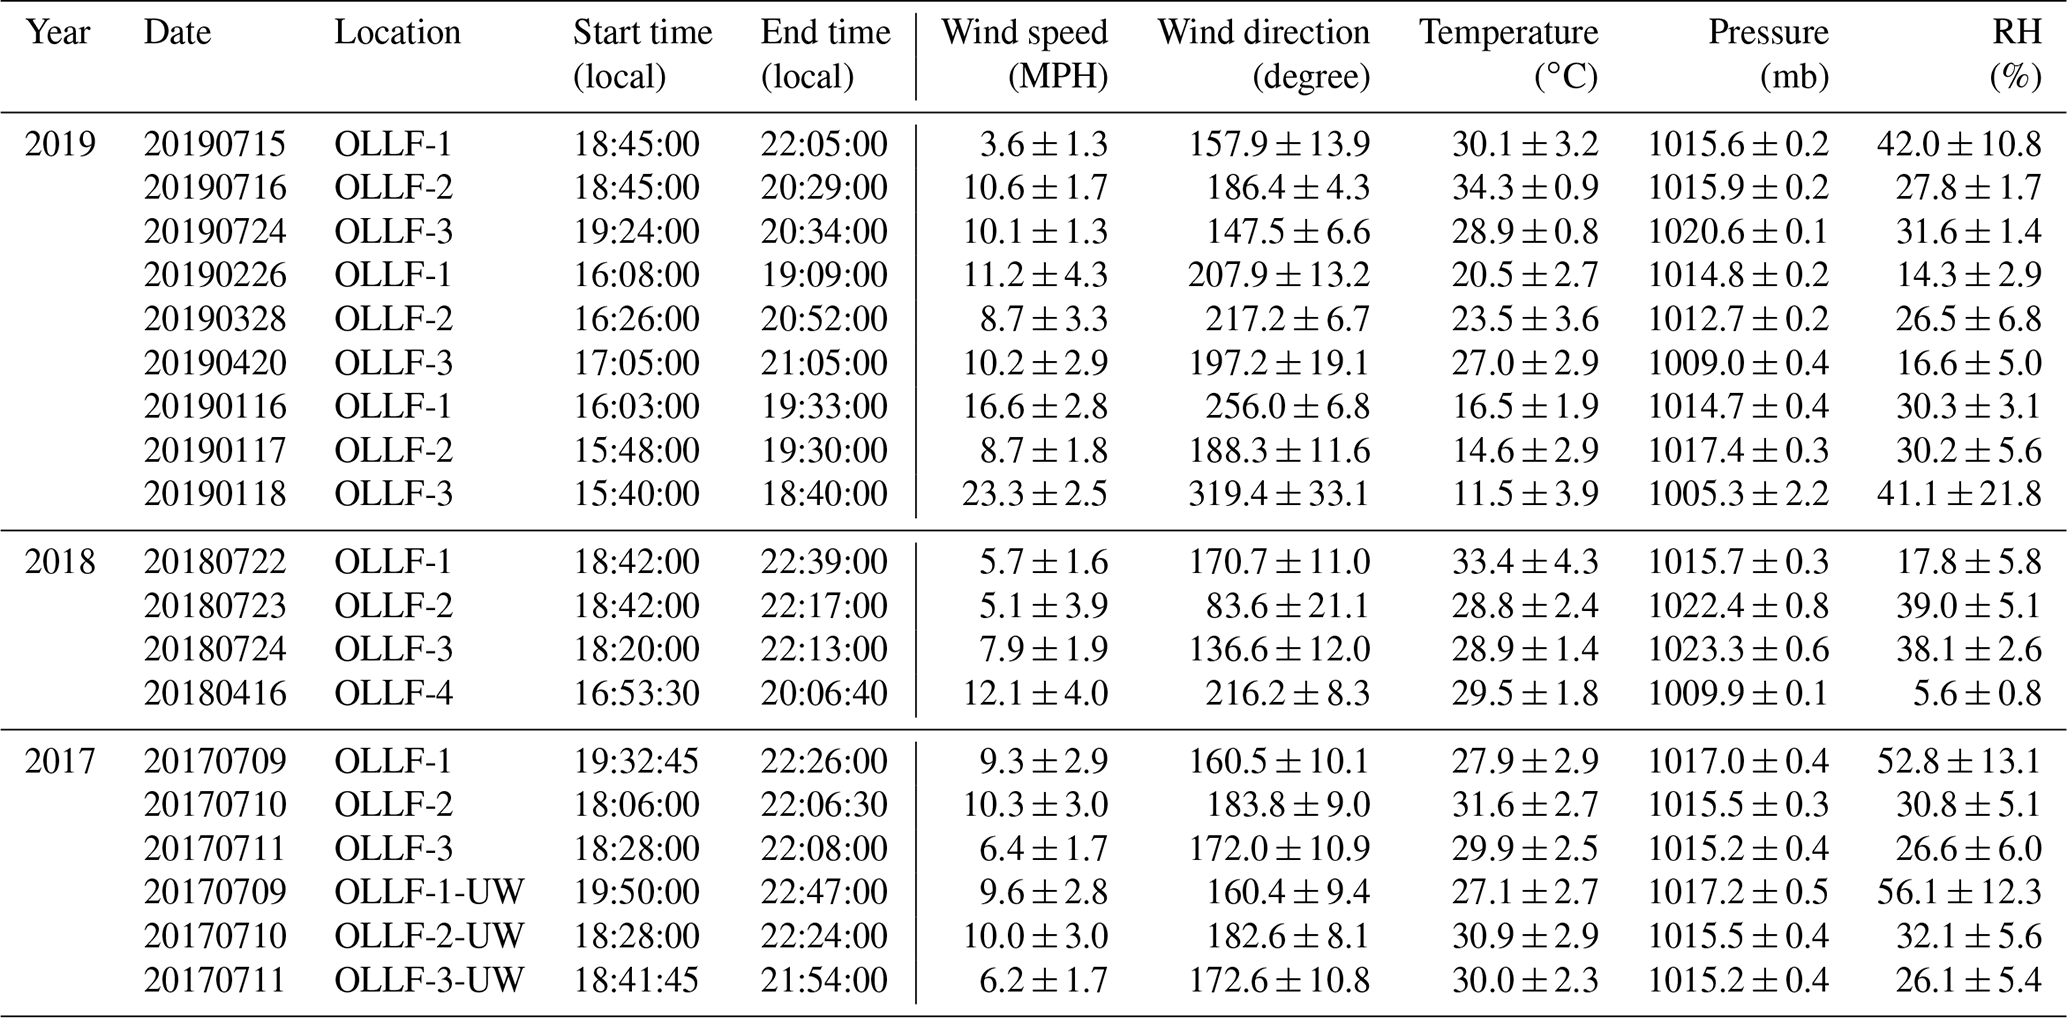
All field samples were collected using 47 mm Nuclepore filters (0.2 µm pore). A filter holder was deployed at ∼1.5 m above the ground. The filter sampling conditions measured locally (during individual sampling activities) are summarized in Table 2. For the given conditions, the estimated 50 % particle transmission of a 1.5 m conductive tube (0.5-inch opening diameter) employed for aerosol samplings was ∼5 µm (von der Weiden et al., 2009). Our samples were collected in different meteorological seasons, including summers in 2017–2019, springs in 2018 and 2019, and winter in 2019, in order to examine the seasonal variation in nINP. All samples were collected when the OLLF pen surface was dry. In 2017, polycarbonate filter samplers were used at both upwind and downwind edges (<80 m away from OLLF pens) of OLLF-1, -2, and -3 to understand the spatial variation in nINP within facilities (Fig. 2). Our sampling durations varied but were up to ∼4.5 h, and our final IN propensity results were scaled to the sampled volume of air and suspended water afterward (Table 2). All filter samples were kept in sterilized tubes refrigerated at 4 ∘C until the immersion freezing measurements commenced (typically within 24 h after sampling).
Table 2Summary of the ambient aerosol particle filter sampling conditions: UW denotes upwind.
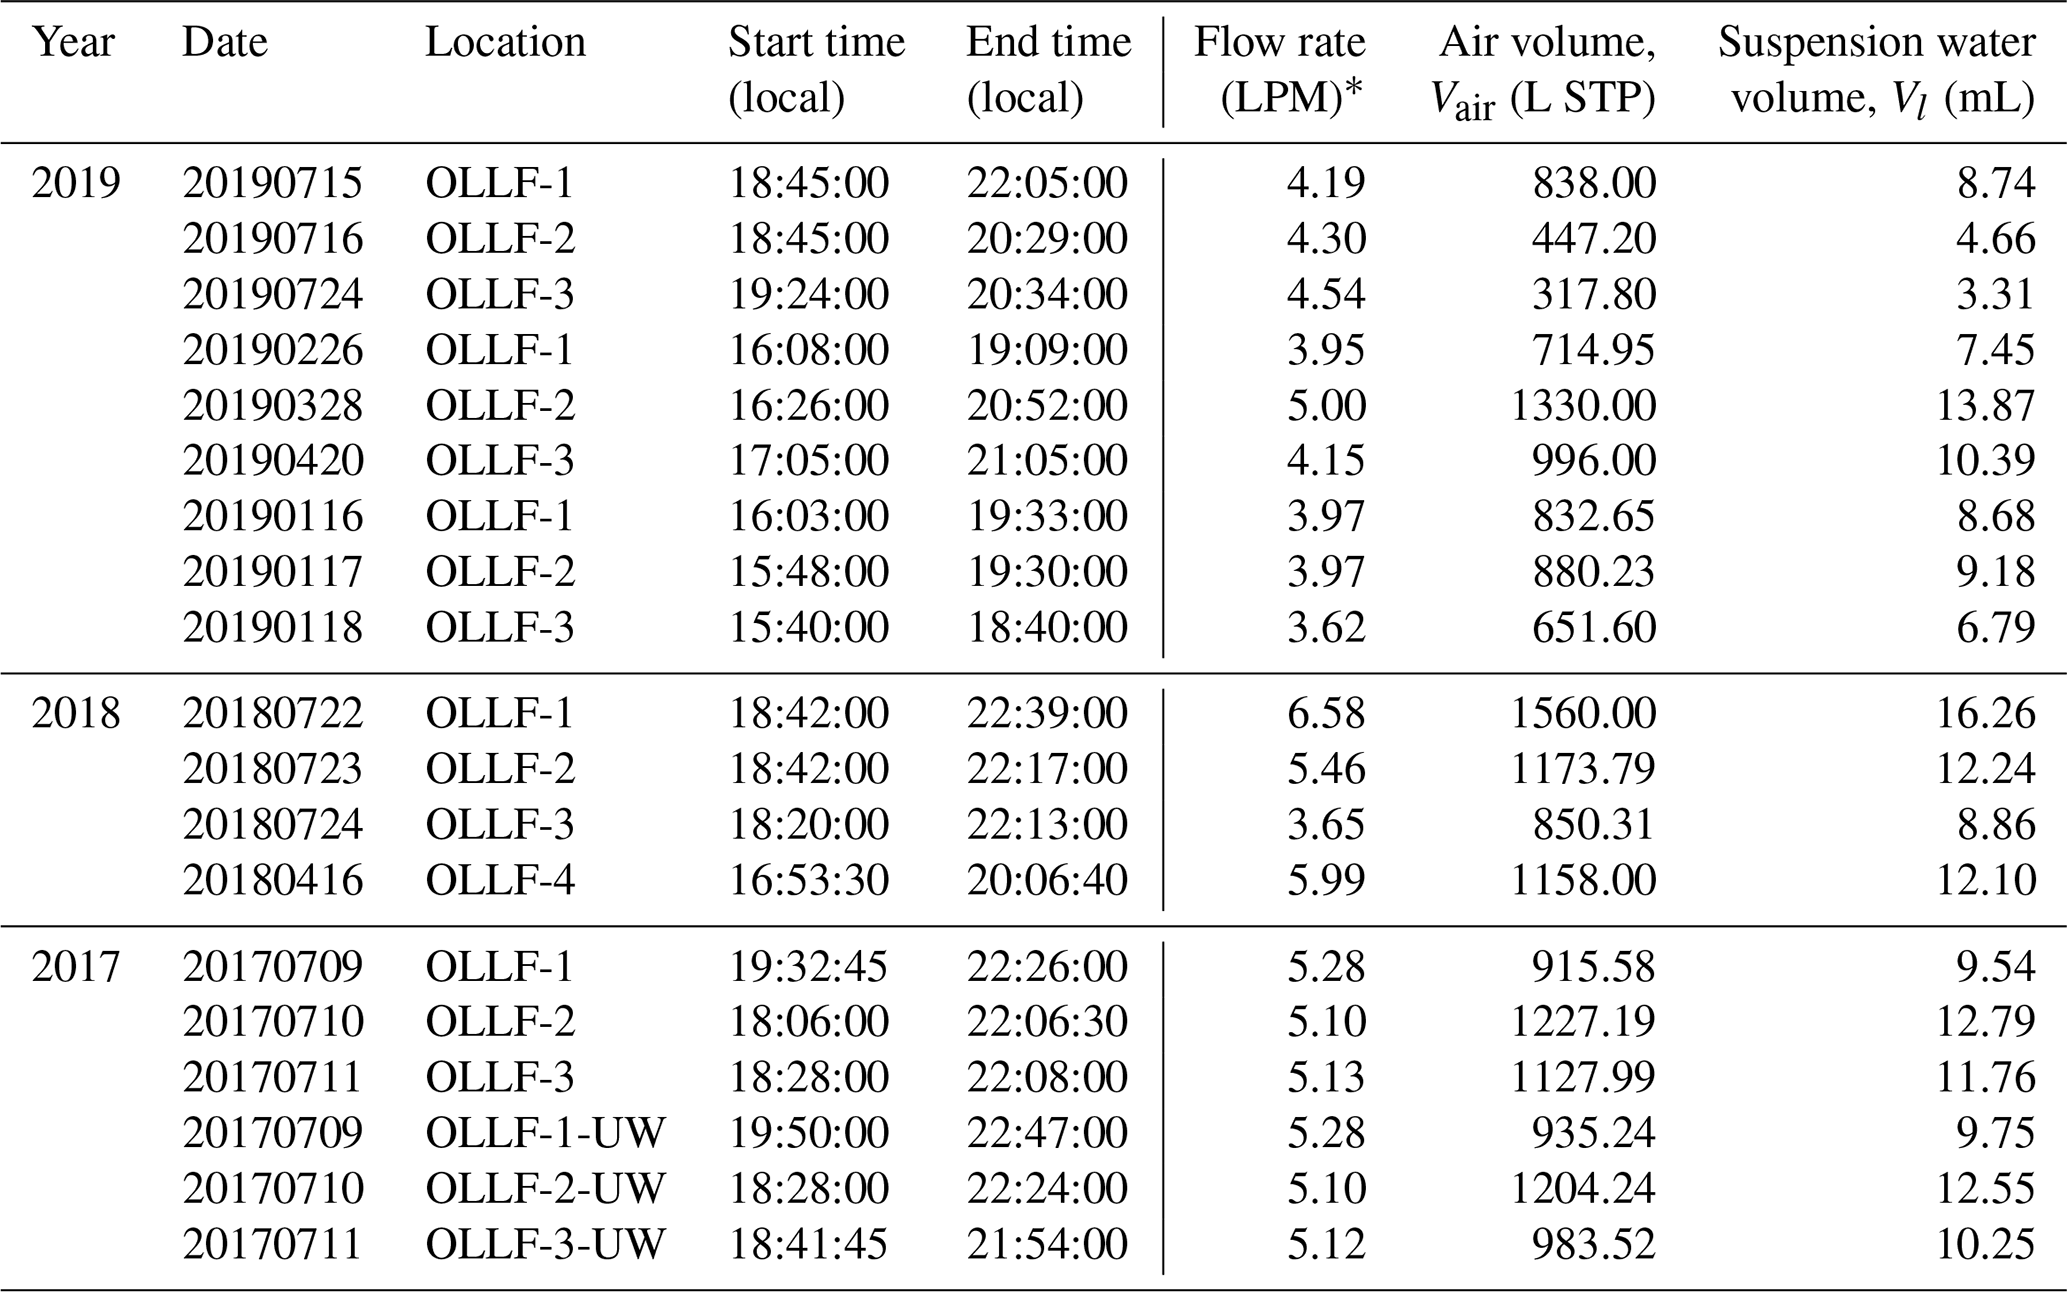
* A mass flow controller or a critical orifice was used to ensure a constant flow throughout each sampling activity. An airflow rate was measured with a flowmeter (TSI Inc., model 4140).
To complement the polycarbonate filter samplers, simultaneous 1 min time-resolved mass concentration measurements of PM10 during individual sampling intervals were also carried out using DustTrak particulate monitors (TSI Inc., Model 8520) equipped with a PM10 inlet. The inlets of DustTrak were maintained at ∼1.5 m above the ground to be consistent with our polycarbonate filter samplers.
2.2.3 The West Texas Cryogenic Refrigerator Applied to Freezing Test system
To assess the ambient nINP through samples collected in the field, we used an offline droplet-freezing assay instrument, the West Texas Cryogenic Refrigerator Applied to Freezing Test system (WT-CRAFT; Vepuri et al., 2021). Briefly, WT-CRAFT enables a simulation of atmospheric immersion freezing using supercooled droplets containing aerosol particles at temperatures >−25 ∘C. WT-CRAFT was a replica of NIPR-CRAFT (Tobo, 2016), but the two systems currently possess different sensitivities to artifacts and detectable temperature ranges as described in Vepuri et al. (2021).
In this study, for each ambient sample, we evaluated 70 solution droplets (3 µL each) placed on a hydrophobic vaseline layer with a cooling rate of 1 ∘C min−1. All droplets were prepared using filter rinse suspensions with high-performance liquid chromatography (HPLC)-grade water. The amount of HPLC water volume (i.e., Vl) was determined based on the total amount of air sampled through the cross-section of the filter, which limits the detection capability to 0.05 INP per liter of air (STP). Each freezing event was determined optically based on the change in droplet brightness when the initially transparent liquid droplets became opaque upon freezing. If the freezing temperature was not obvious for any droplets, the 8-bit greyscale images were assessed using ImageJ software to determine the temperature of phase change.
After the measurement, we calculated the frozen fraction and estimated the nINP per volume of air as a function of temperature, nINP(T), for every 0.5 ∘C using Eqs. (1)–(2) (Vd=3 µL; Vair and Vl are provided in Table 2). The temperature uncertainty and immersion freezing efficiency in WT-CRAFT are ±0.5 ∘C and ±23.5 %, respectively (Vepuri et al., 2021). The experimental uncertainty is typically represented by CI95%. While the background freezing contribution of the field blank filter was negligible (<3 % activation) at −25 ∘C, we purposely limited our WT-CRAFT data analysis to the temperature range between 0 and −25 ∘C to eliminate any possible artifacts in our WT-CRAFT data. In addition, Supplement Sect. S3 provides a comparison of our two immersion freezing techniques and the nINP(T) results, which are reasonably comparable.
To evaluate the immersion freezing efficiency of ambient aerosol particles collected at OLLFs, we converted our WT-CRAFT-based nINP measurements to ice-nucleating efficiency metrics, such as nINP, nm, and ns,geo (Eq. 3). The value used for this study, ∼0.4 m2 g−1, is derived from particle size distribution measurements presented in Fig. 3 of Hiranuma et al. (2011).

Figure 3Temporal profiles of the AIDA immersion freezing experiment: TXDUST01_07 (i), _08 (ii), _30 (iii), _12 (iv), _13 (v), and _32 (vi). Arrays of alphabetical panels represent the chamber gas temperature (solid line) and the chamber wall temperature (dashed line) (a), pressure in the AIDA chamber vessel (b), RH with respect to water (green line) and ice (blue line) (c), and aerosol particle concentration measured by the CPC (red solid line) as well as number concentration of >20 µm Dve AIDA particles measured by a welas optical particle counter (blue line) (d). Horizontal numerical panels represent different sample types and AIDA experiments, including TXD01 (i)–(iii) and TXD05 (iv)–(vi). RHs were determined with an accuracy of ±5 %, represented as the green shaded area in (c), using the mean gas temperature and the mean water vapor concentration.
3.1 Laboratory results
3.1.1 Physical properties of samples
Table 3 summarizes the physical properties of surrogate samples from OLLFs. Additionally, geometric SSA values were computed based on aerosol particle size distribution measurements in the AIDA chamber (i.e., a fraction of total surface area concentration to total mass concentration estimated from the size distribution data). The summary of geometric SSA values for aerosol particles in each AIDA experiment is given in Table 4.
Table 3Properties of OLLF samples: TXD01 and TXD05.
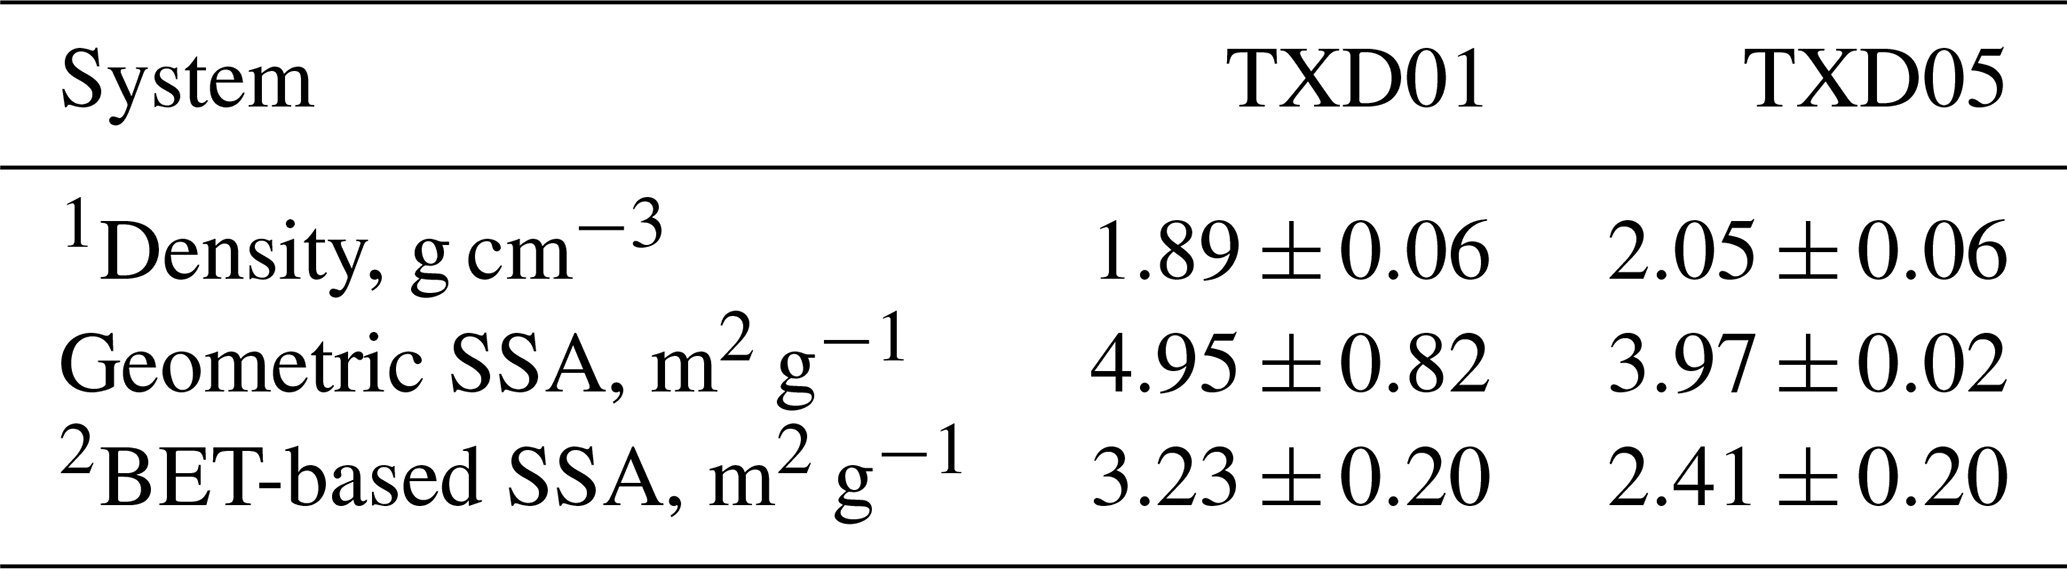
1 With a measurement standard deviation of ± 0.06, our system is capable of measuring densities of other powder samples, such as illite NX (2.91 g cm−3) and fibrous cellulose (1.62 g cm−3). Note that these values are similar to the density values reported by manufacturers for illite NX (2.65 g cm−3) and fibrous cellulose (1.5 g cm−3). 2 Brunauer et al. (1938).
Table 4Geometric SSA values for individual AIDA expansion experiments.

As seen in Table 3, the measured densities of both sample types are slightly higher than typical grain dust densities (<1.69 g cm−3; Parnell et al., 1986). The action of cattle hooves on the pen can cause compaction of the surface layer, which may result in the higher densities of our samples (Guo et al., 2011). The measured BET SSA values of OLLF samples are slightly higher compared to previously measured agricultural soil dust samples (0.74–2.31 m2 g−1; O'Sullivan et al., 2014), which suggests that TXD01 and TXD05 are more porous than these previous soil samples, leading to higher BET SSA. Our geometric SSA values are higher than the BET SSA values. In general, a small SSA value is often consistent with the presence of a large aerosol particle population. Hence, the predominance of larger particles in bulk powders assessed in BET is presumably responsible for the observed differences in these two SSA values. Indeed, the particles observed in AIDA were all ⪅6.5 µm volume-equivalent diameter, Dve (Table 1), presumably due to the use of cyclone impactor stages after a rotating brush generator, whereas the particles evaluated by BET were up to 75 µm. Therefore, in association with the large grain size involved in the BET analysis, bulk samples might have exhibited smaller SSA than dry dispersed ones. As seen in Table 1, the mode diameters of TXD01 samples in AIDA were in general smaller than that of TXD05 samples, which is consistent with our SSA measurements (see Tables 3 and 4).
As demonstrated in our previous study, the surface area distribution of ambient OLLF dust peaks in mode diameter at ≤10 µm (Hiranuma et al., 2011). This mode diameter is larger than surface-derived samples aerosolized and examined in the AIDA chamber. However, it is cautiously noted that the ambient OLLF dust size distribution is not spatially uniform, and the emitting mechanism itself is not controllable as it highly depends on a unit of mobile livestock. Granting the primacy of hoof action as the decisive emission mechanism of OLLF dust as described in Bush et al. (2014), a more controlled laboratory experiment has been needed to characterize IN ability of OLLF soil dust.
3.1.2 AIDA measurements and freezing efficiencies of surface materials
Shown in Fig. 3 are expansion experiment profiles of all six AIDA expansion experiments. These profiles represent data points measured in the chamber over a series of time, such as temperature (a), pressure (b), RH (c), and aerosol particle and hydrometeor concentration (d) for each AIDA experiment. For each cloud formation experiment, the pressure within the chamber was reduced (ΔPressure ∼180–290 hPa), causing the temperature to drop and a simulated adiabatic “expansion” to occur. As can be seen, measurements were made at water saturation (RH with respect to liquid water around 100 %). A droplet–ice threshold typically coincided with ≥20 µm Dve. Thus, the number concentration of >20 µm Dve particles measured by a welas optical particle counter (Benz et al., 2005) primarily represents pristine ice crystals formed during the expansion (Fig. 3d). In almost all cases, the RH dropped during some expansions at low temperatures. At these temperatures, ice crystals grow rather quickly at the expense of available water vapor in the AIDA chamber, which causes the observed RH drop. Nevertheless, droplets were fully activated within ≈100 s of each expansion while reaching the peak RH, where we see the steep slope of in Fig. 3. Further, as seen in Fig. 3d, particles of >20 µm Dve are not increasing, and the total aerosol concentration measured by CPC also does not change after the RH peak. Thus, all predominant ice formation occurs at or before the RH peak through immersion freezing. Lastly, we made sure to only report our IN efficiency at temperatures higher than ∘C, corresponding to a saturated condition in the AIDA vessel.
Figure 4 summarizes our ns,geo spectra of our surface material samples from the AIDA, INSEKT, and DFPC (total aerosol) experiments. For each sample, we compared our experimental dust ns,geo spectra to six reference soil dust ns,geo curves, O14 (England), S16 (Mongolia, Argentina, and Germany), S20 (northwestern Germany and Wyoming), T14 (Wyoming), T14 (China), and U17 (desert dust samples from Asia, the Canary Islands, Israel, and the Sahara), available in previously published studies (O'Sullivan et al., 2014; Steinke et al., 2016; 2020; Tobo et al., 2014; Ullrich et al., 2017), as well as our field data (see Sect. 3.2.3). As seen in Fig. 4, our OLLF spectra are comparable to the previous soil dust ns,geo parameterization at relatively low temperatures (e.g., the ns,geo value range in orders of magnitude from 109 to 1010 m−2 at around −25 ∘C). The immersion spectra of both surface materials are located towards the minimum boundaries of our field ns,geo spectra for temperatures >−25 ∘C. While the variability of ns,geo at a single temperature could vary by several orders of magnitude for our field data, smaller variations are found for both lab results, implying different properties of our lab and field samples. The difference between our laboratory results and field data is discussed in Sect. 3.3.1 in more detail. Additionally, the similarity of our lab results between TXD01 and TXD05 suggests that different physicochemical properties found for our samples may not impact their INP propensities.
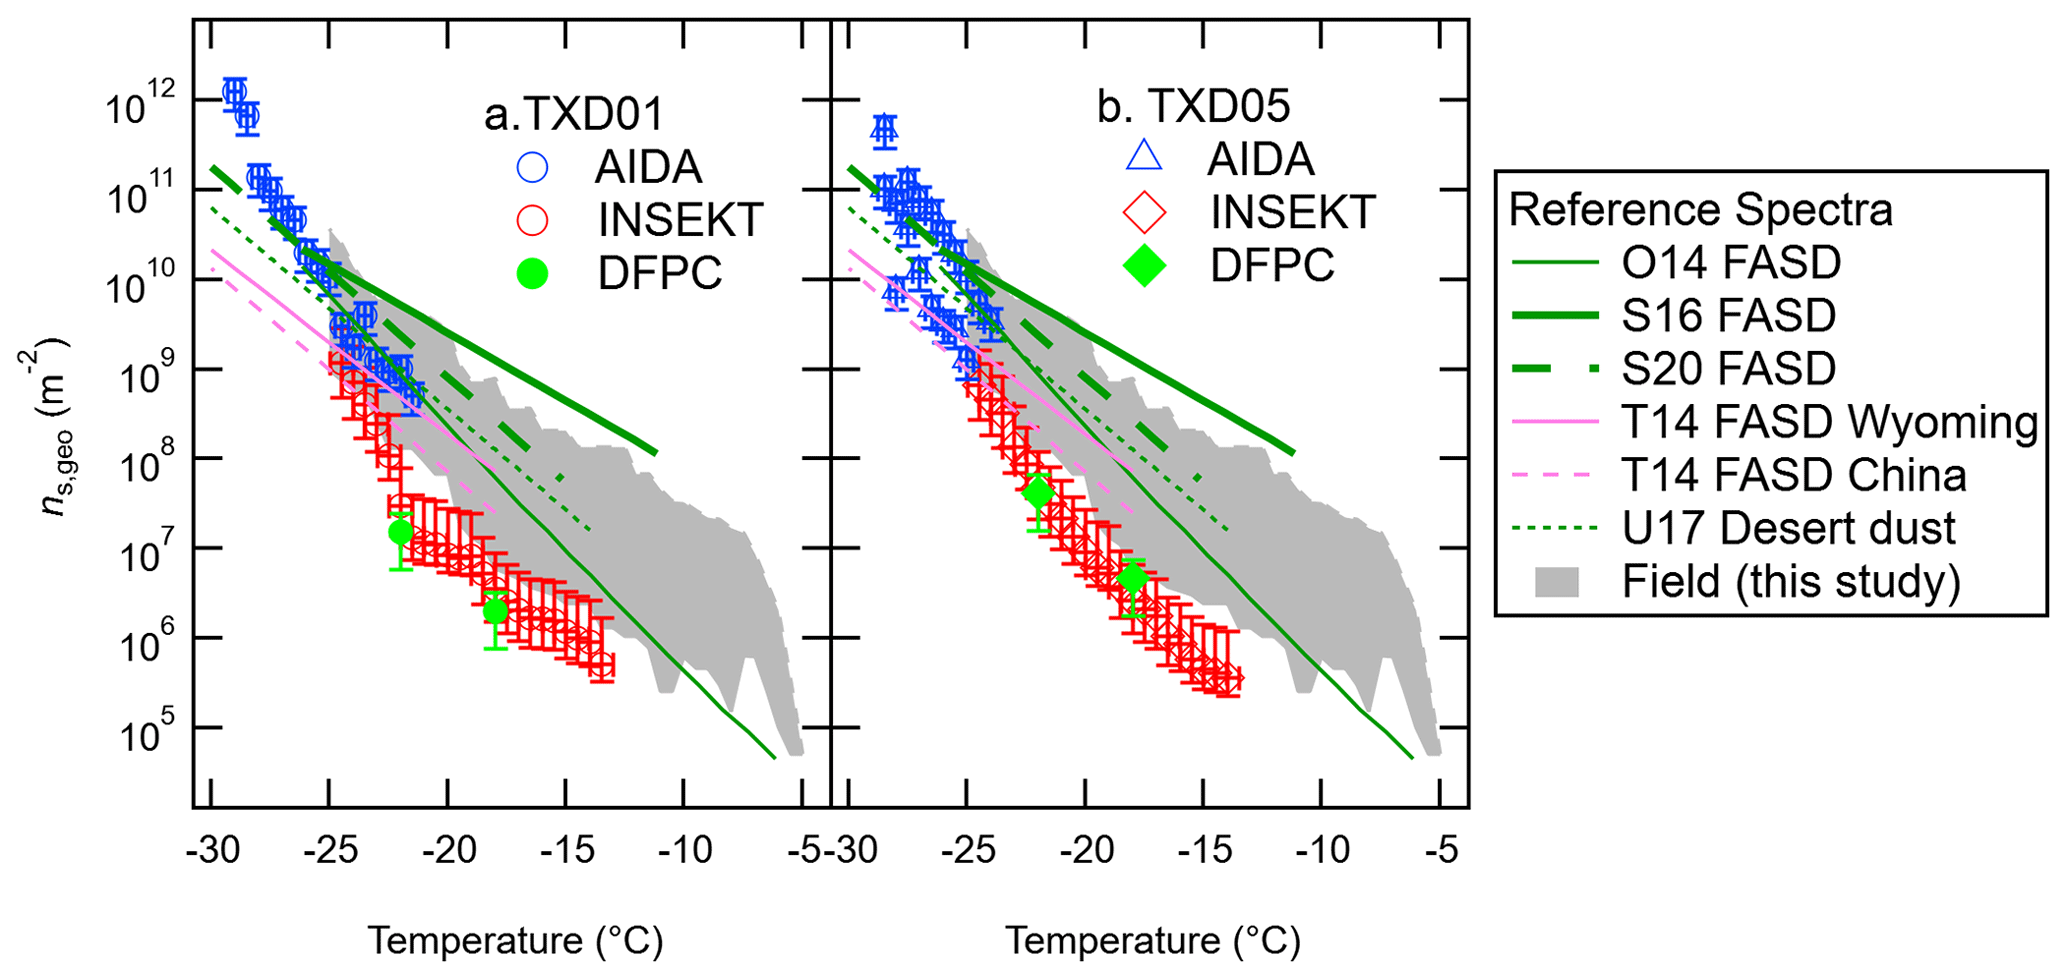
Figure 4IN-active surface-site density, ns,geo, of surface materials, TXD01 (a) and TXD05 (b), was assessed by AIDA, INSEKT, and DFPC (total aerosol particles) as a function of temperature. Six reference ns,geo curves for fertile and agricultural soil dust (FASD) and desert dust are adapted from O'Sullivan et al. (2014; O14), Steinke et al. (2016; S16), Steinke et al. (2020; S20), Ullrich et al. (2017; U17), and Tobo et al. (2014; T14). The grey-shaded area represents the range of our field ns,geo values at a 0.5 ∘C interval for −5 ∘C > temperature > −25 ∘C (Fig. 8).
3.1.3 Size-segregated analysis
Our DFPC-derived ns,geo values in Fig. 4 agreed reasonably well with the INSEKT results at the measured temperatures within our error ranges. This comparability suggests that freezing ability is similar for condensation and immersion for our surface samples. Besides, several unique characteristics of OLLF INPs were disclosed. For instance, comparability of results from our condensation freezing instrument (DFPC) and immersion freezing assay (INSEKT) was found for both sample types at the overlapped temperatures (18 and −22 ∘C). A similar observation was previously made for kaolinite particles in Wex et al. (2014). However, as the examined temperatures in our study are limited, the observed equivalence between immersion and condensation freezing for our surface OLLF samples should be cautiously interpreted and may not be conclusive.
More importantly, Table 5 summarizes the comparison of the submicron vs. supermicron INPs for a set of four samples measured at −18 ∘C and −22 ∘C by DFPC. On average, the supermicron INP fraction, given by × 100, shows that this fraction contributed 45.0 % ± 6.7 % (average ± standard error) of the total INP for TXD01 and TXD05 samples at the measured temperatures. This highlights the importance of the large particles, which might dominate the particle surface and mass, in the INP population. Note that we also compared the submicron vs. supermicron ns,geo values. Our PM1 ns,geo and supermicron ns,geo were virtually identical, implying non-size-dependent IN ability across the sizes evaluated in this study (not shown).
Table 5DFPC-estimated nINP for TXD01 and TXD05 samples. The subscripts of Tot and PM1 represent INP obtained from total aerosol particles and that from PM1 size-segregated aerosol particles, respectively. Standard deviations were derived based on multiple measurements for each sample.
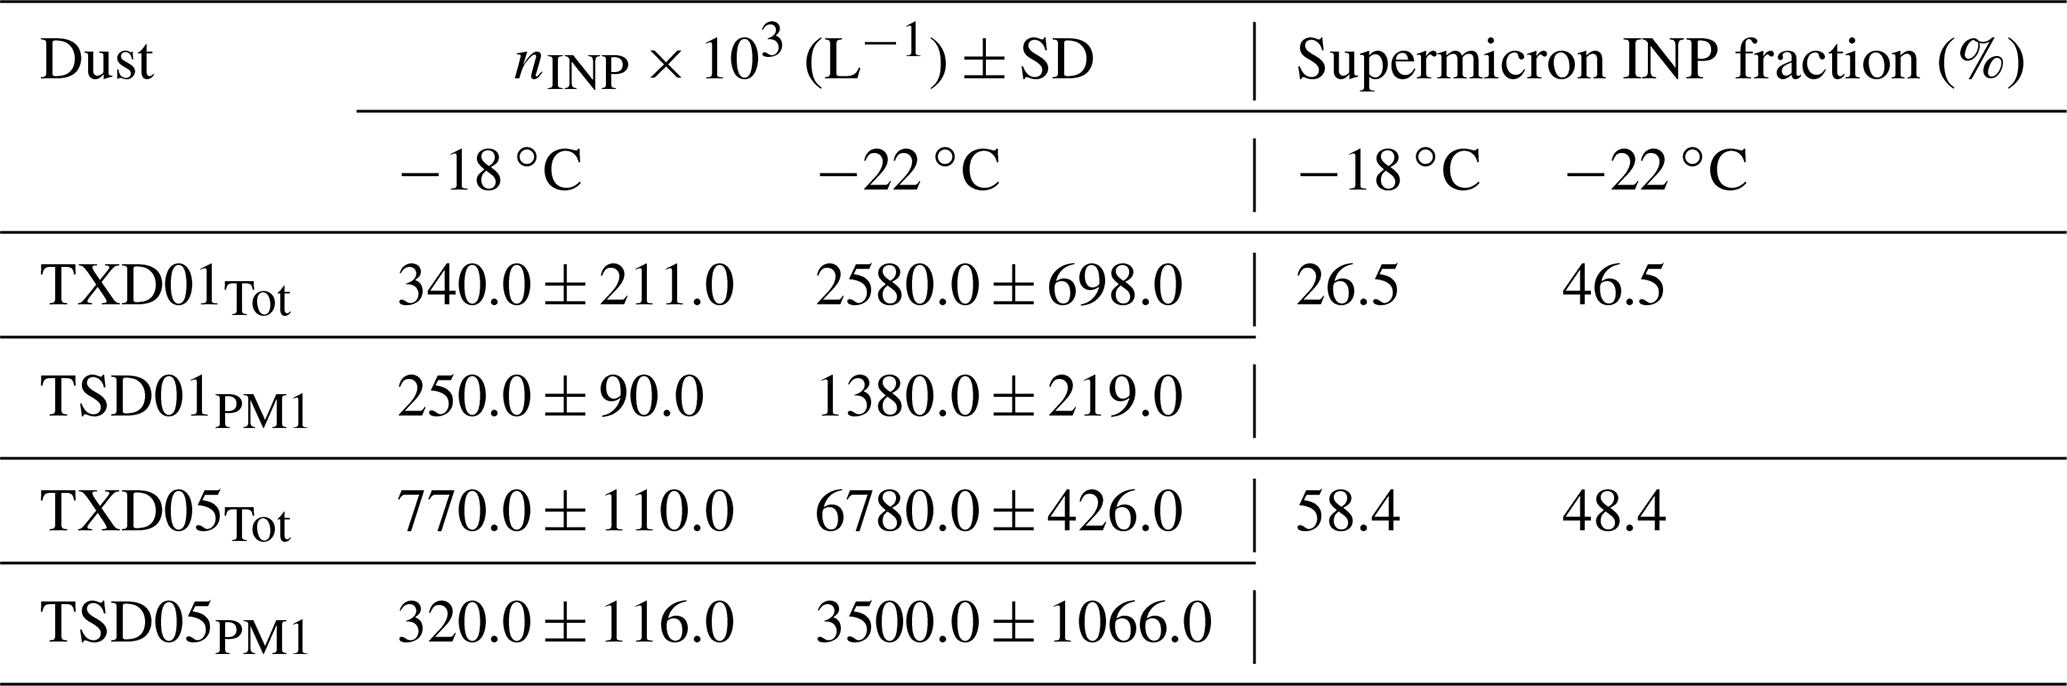
Several studies have shown evidence that coarse aerosol particles dominate INPs across the world. DeMott et al. (2010) successfully demonstrated the correlation between immersion-mode nINP and the number concentration of aerosol particles larger than 0.5 µm diameter based on the compilation of field data for more than a decade. Mason et al. (2016) reported a substantial fraction of supermicron INPs through immersion freezing at a relatively high temperature (>78 % at −15 ∘C) measured at seven different sites over North America and Europe. Even at −20 ∘C, the authors reported a fraction of supermicron INPs larger than 50 %. Compared to these numbers, our laboratory data show lower fractions, but the INP sources are presumably different. Based on findings from recent studies of size-resolved INPs vs. fluorescent biological particles, these INPs activated at −15 ∘C are typically thought to be biological (e.g., Huffman et al., 2013; Huang et al., 2021). While there is evidence that terrestrial and marine biological particles play an important role in immersion freezing of supermicron-sized particles (e.g., Ladino et al., 2019; Si et al., 2018; Creamean et al., 2018), the atmospheric implications of such rare aerosol species and their overall impact on aerosol–cloud interactions are still under debate. More recently, high IN efficiency by supermicron INPs derived from quartz-rich atmospheric mineral dust has been reported from different locations, including East Asia (Chen et al., 2021) and the eastern Mediterranean (Reicher et al., 2019). These mineral components usually contribute to IN at low temperatures. However, there has not been much discussion of large soil dust particles, especially organics, and their contribution to atmospheric IN in previous studies. Hence, direct implications of which components contribute to IN at different temperatures to the observed freezing properties of OLLF particles are still missing. Lastly, while we did not see a systematic increase in supermicron INP fraction as a function of temperature as shown in Mason et al. (2016; i.e., supermicron INP fraction at −15 ∘C larger than at −20 ∘C), our results in Table 5 show that nINP,total is always higher than for samples used in this study.
3.1.4 Metagenomic analysis
We examined the diversity of Archaea, Bacteria, and Fungi in TXD01 and TXD05. We analyzed aerosolized particles collected on Nuclepore filters. The results and data of metagenomic analysis are summarized in Supplement Table S1. Useful data for Bacteria were generated from the amplification and sequencing of the V3–V5 region of the 16S rDNA phylogenetic marker down to the genus and species level. Data on Archaea were generated from TXD05 only. The predominant phyla of Archaea consisted of methanogens, colonizers of the bovine rumen, as expected (Fouts et al., 2012) (Table S1a). The bacterial fraction of the microbiome was dominated by Actinobacteria (the most abundant phylum, common soil inhabitants), Proteobacteria, Firmicutes (diverse bacterial phyla with species living in the soil as well as in the bovine rumen), and Bacteroidetes (common members of the bovine rumen microflora) (Fouts et al., 2012; Chaucheyras-Durand and Ossa, 2014). No known IN-active bacterial species were identified in either sample (Després et al., 2012), although the genus Pseudomonas (containing IN-active species) was detected in low numbers (Table S1b). The predominant fungal taxa in our samples belong to Pezizomycetes (Ascomycota), common soil inhabitants. In this taxon, the coprophilic genus Ascobolus was detected in high numbers, as expected (Sarrocco, 2016). The genera Fusarium (Ascomycota-Hypocreales) and Mortierella (Mucuromycota-Mortierellales) were also detected in low numbers. These genera contain species with IN activity; however, the phylogenetic analysis did not detect any known IN-active species of these genera (Table S1c). Thus, we did not identify any known IN-active microorganisms in our samples. This insignificance of the IN-active microbiome and relatively high importance of non-biological supermicron particles as OLLF-INPs are deemed robust if these particles are emitted as individual, externally mixed particles. Otherwise, the observed strong mass dependency of OLLF-nINP (discussed in Sect. 3.2 below) cannot be explained as microorganisms typically contain small mass (Hoose et al., 2010).
3.2 Field results
3.2.1 Downwind vs. upwind
Individual PM10 mass (derived from DustTrak measurements), nINP, and nm for each sampling date are provided in Table 6. On average, an extremely high cumulative nINP at −25 ∘C of 1171.6 ± 691.6 L−1 (standard error) L−1 was found at the downwind site.
Table 6Summary of the ambient aerosol particle mass and immersion freezing properties of all field samples used in this study: UW denotes upwind.
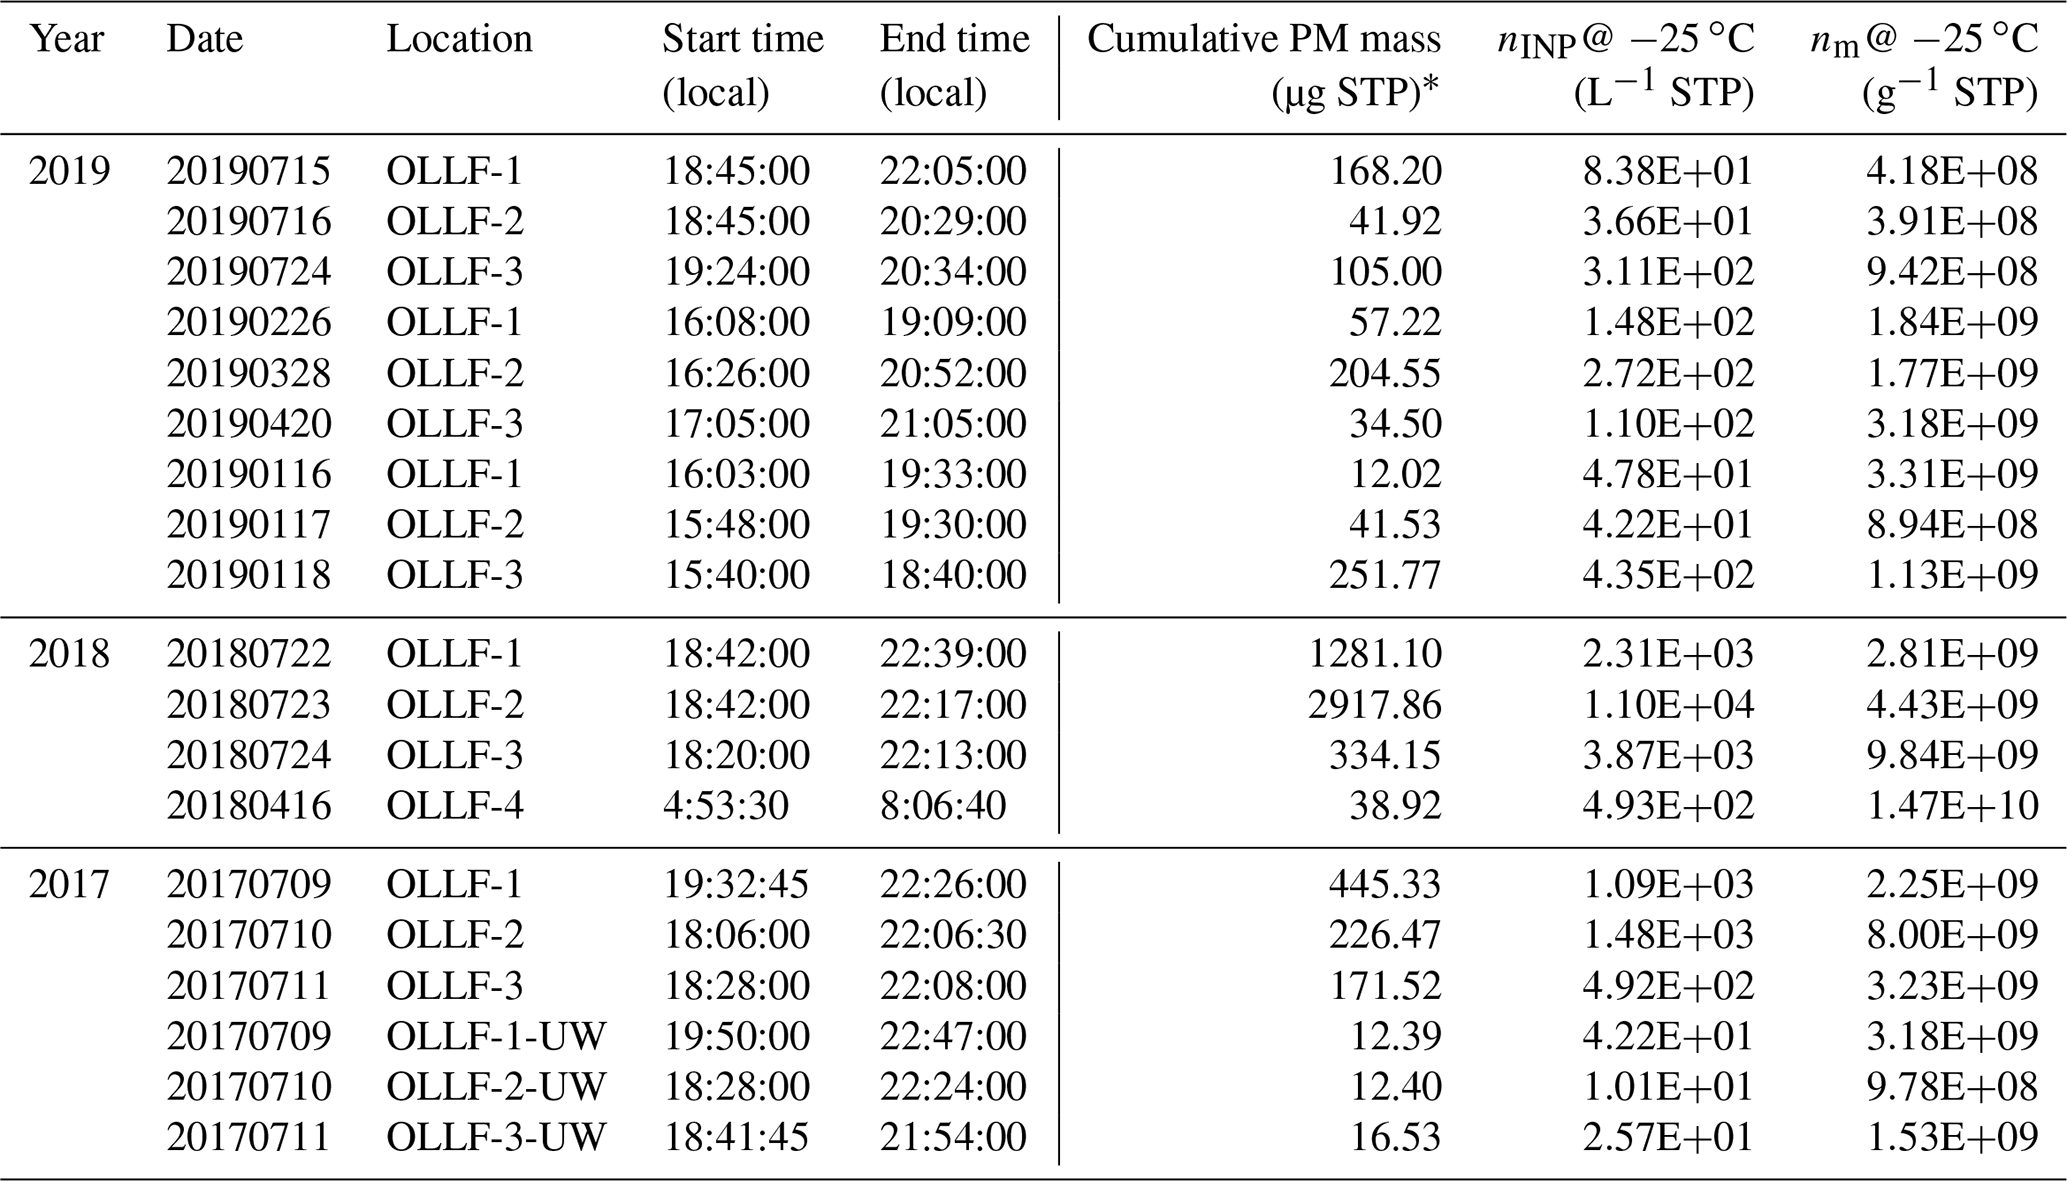
* Cumulative values of the mass collected on a filter were estimated by integrating DustTrak mass data, sampling time, and flow rate.
Figure 5 shows the nINP comparison between downwind samples and upwind samples collected simultaneously at OLLF-1, -2, and -3 in 2017. Figure 5a displays individual nINP spectra from each OLLF site. Additionally, Fig. 5b summarizes the nINP diversity between downwind and upwind in , which represents the log-scaled ratio of individual measurements at given temperatures. These nINP ratios are shown only for the temperature range covered by both downwind and upwind data. As can be seen in these two panels, none of the upwind spectra show nINP above −14 ∘C, whereas we detected nINP,downwind at temperatures above −10.5 ∘C, suggesting that the INPs that are detectable in WT-CRAFT at temperatures above −14 ∘C originate in OLLFs. In fact, across the examined freezing temperatures, the downwind spectra from all OLLFs exhibit higher nINP than the upwind spectra; therefore, the values are above zero at temperatures below −14 ∘C.
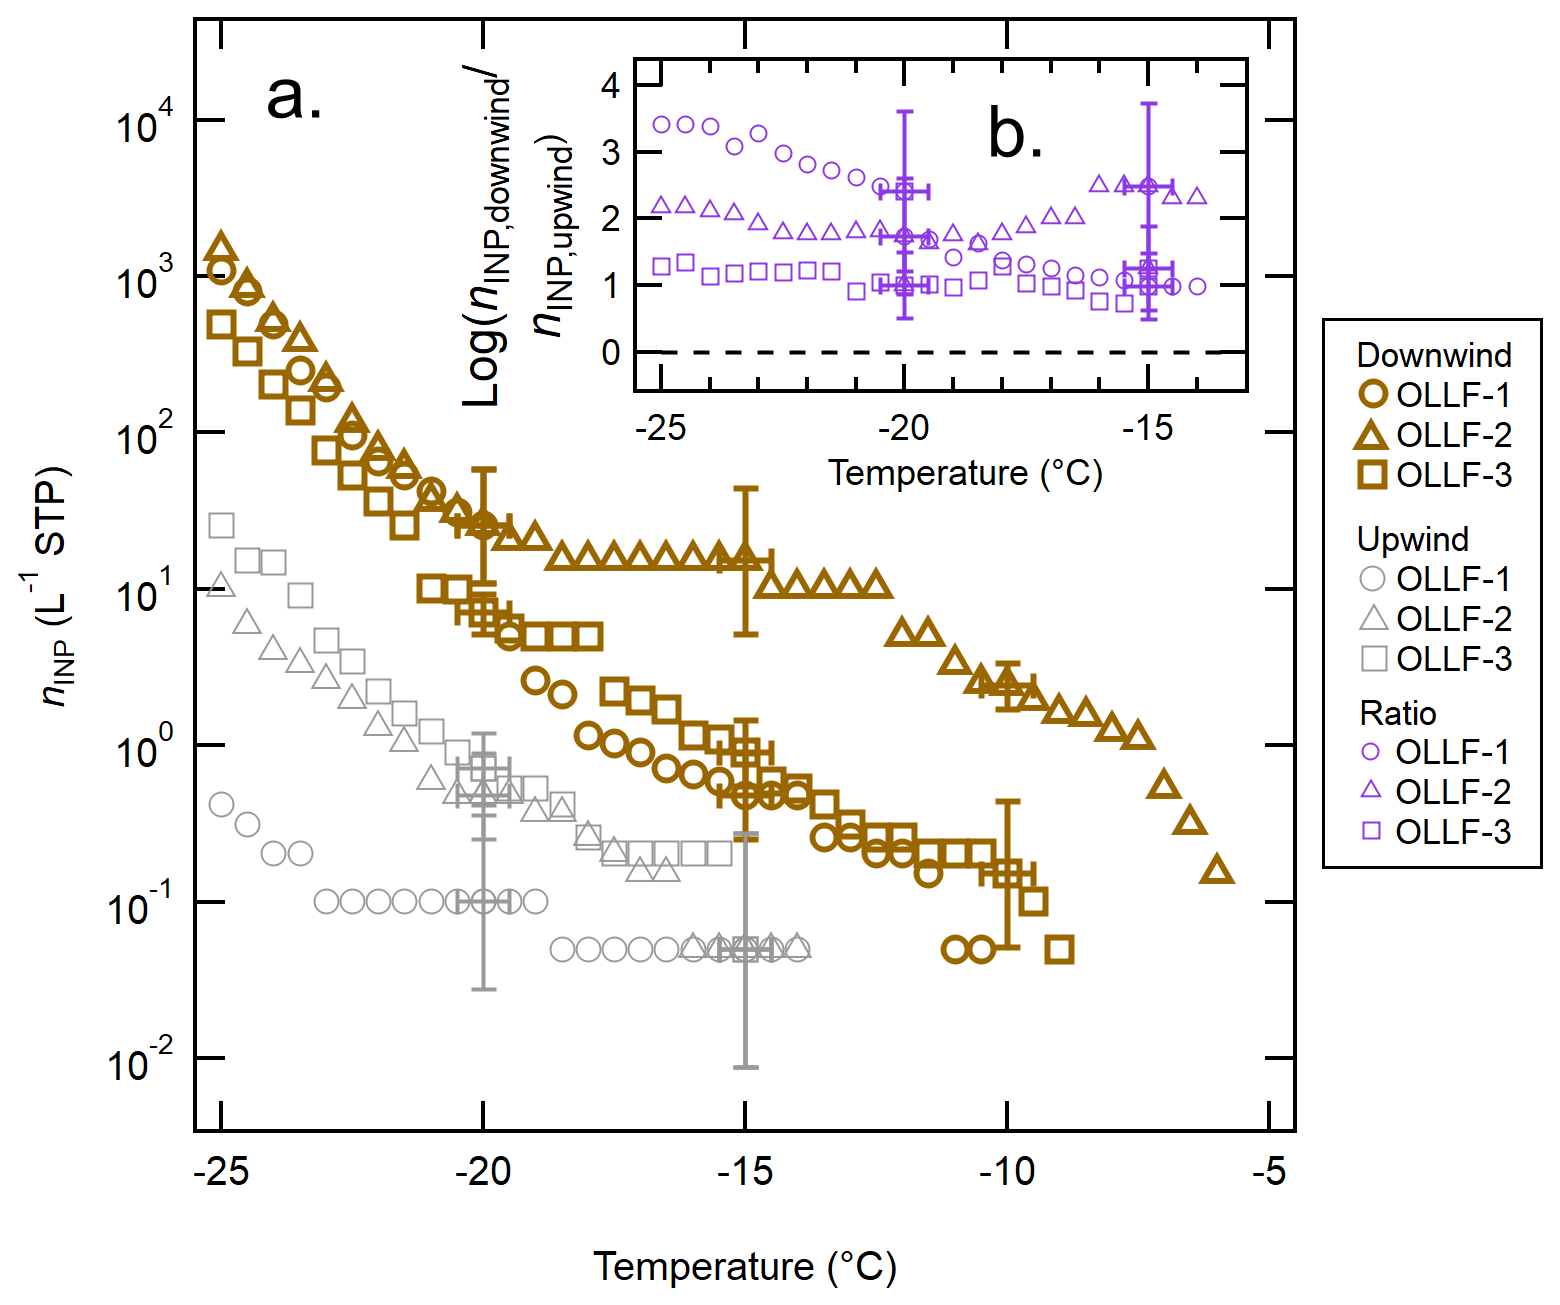
Figure 5The nINP spectra of OLLF aerosol particles from field ambient samples: a comparison of the downwind nINP (brown) to the upwind nINP (grey) from summer 2017 is shown in (a). Different symbol shapes correspond to individual OLLF sites as indicated in the legend. The uncertainties in temperature and nINP are ±0.5 ∘C and ± CI95%, respectively. Error bars are shown at selected temperatures to make all data points visible. The log-scaled downwind-to-upwind nINP ratios, , for the overlapping temperature ranges are shown in (b). Note that the uncertainty in this ratio is >50 % due to large CI95% errors for measured nINP. The black dashed line represents the ratio of zero (i.e., no difference between nINP,downwind and nINP,upwind).
The source of upwind INPs is unknown. Since our polycarbonate filter samplers were deployed in the close proximity of livestock pens (<80 m away as discussed in Sect. 2.2.2), the influence of soil dust even at an upwind site could not be ruled out depending on local livestock activities. Thus, it may be possible that resuspended OLLF soil dust results in high nINP at a specific temperature range for the upwind sample. The influence of soil dust from OLLFs on nINP,upwind spectra may be seen around −15 ∘C (Fig. 5a). At this temperature, the nINP,upwind (CI95%) error in a log-scale spectrum is relatively large as compared to the lower temperature region, and the difference between nINP,downwind and nINP,upwind is not conclusive beyond the uncertainty around −15 ∘C. Nonetheless, the downwind nINP values are indeed higher than nINP,upwind (beyond uncertainties) at temperatures below −20 ∘C. At −25 ∘C, all nINP,downwind values appear to be an order of magnitude higher than the upwind ones without any exceptions, indicating that an OLLF is a source of a notable amount of INPs across the examined temperature range.
3.2.2 Seasonal variation
Shown in Fig. 6 is a compilation of nINP,downwind sorted based on the sampling season (i.e., winter, spring, and summer). Overall, we detected INPs at temperatures lower than −5 ∘C, and the range of nINP,downwind at −20 ∘C varied in different seasons in 2017–2019: winter (0.9–20.4 L−1), spring (4.2–31.2 L−1), and summer (5.0–421.7 L−1). As inferred from Fig. 6, this seasonality holds true for all investigated temperatures. To complement our measurements and observations, more discussion on estimated INPs from an OLLF and their seasonal variability is provided in Supplement Sect. S5 and Table S2.
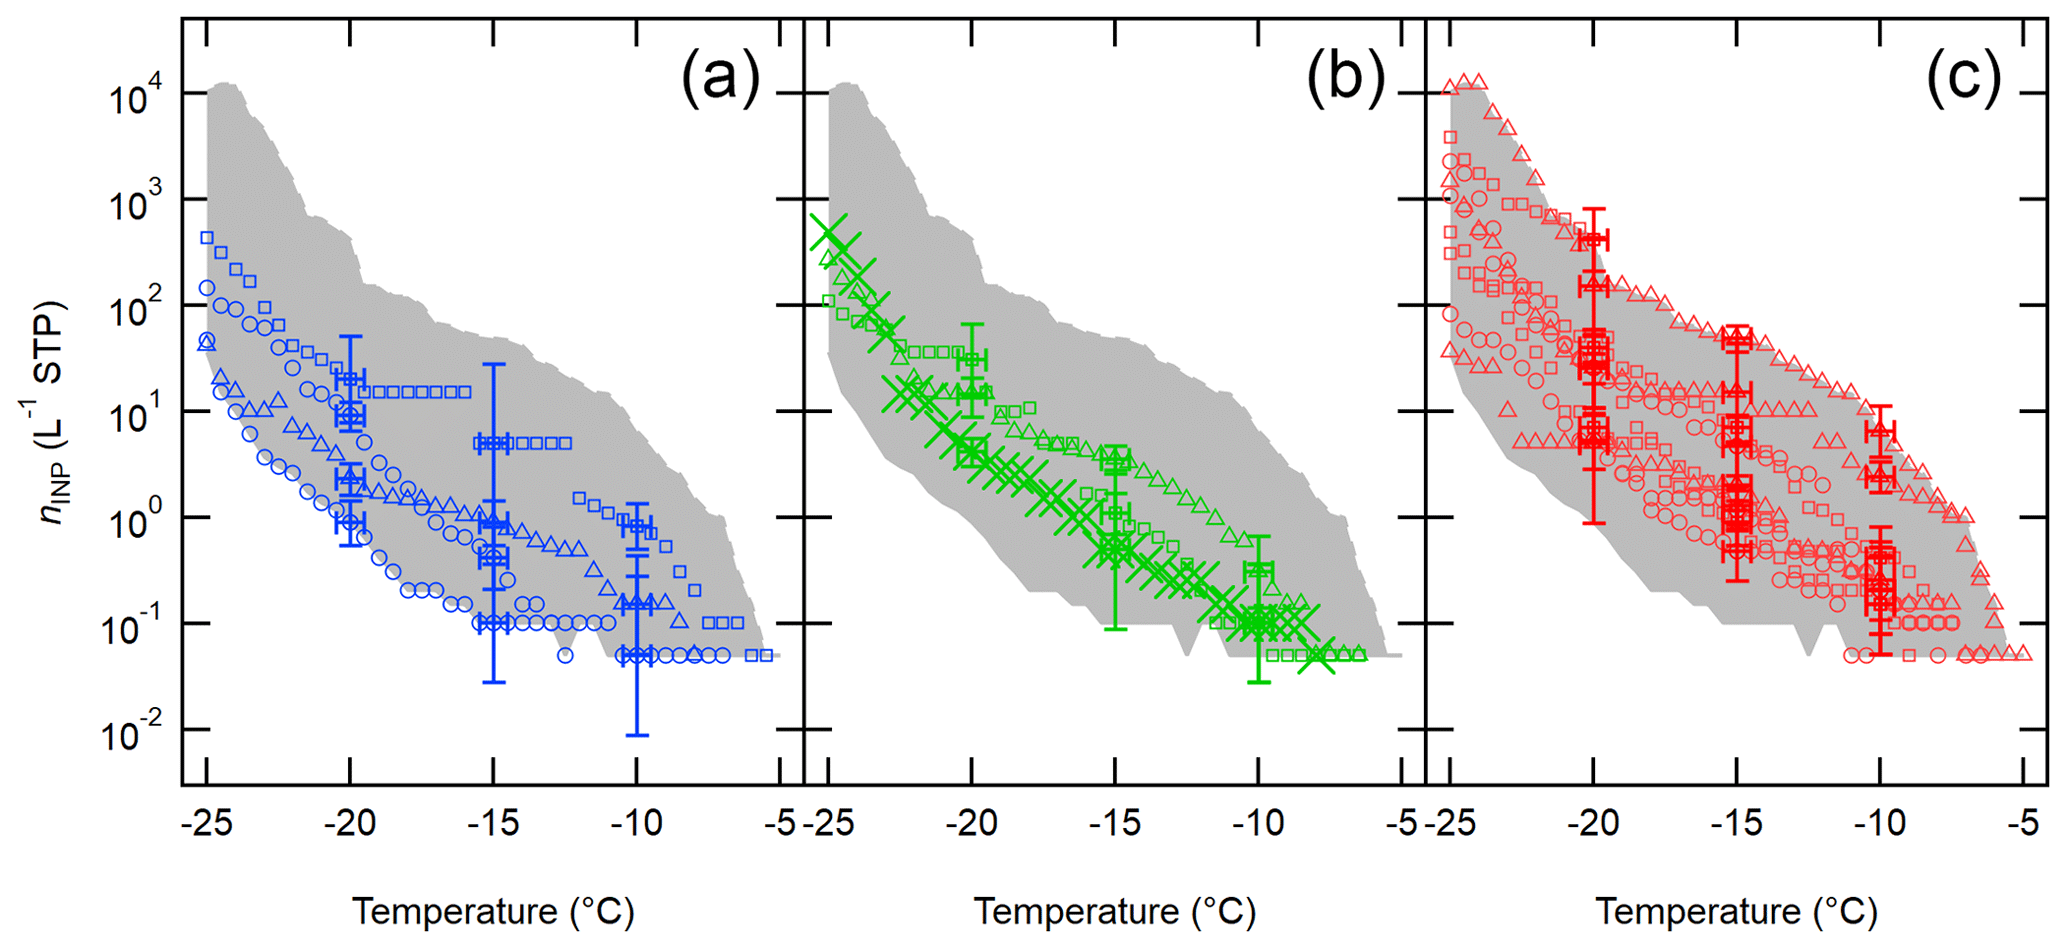
Figure 6Downwind OLLF nINP spectra from 2017 to 2019 sorted based on meteorological seasons are shown: winter (a), spring (b), and summer (c). The uncertainties in temperature and ns,geo are ±0.5 ∘C and ± CI95%, respectively, and error bars are shown at −5, −10, and −15 ∘C. The shaded area represents minimum − maximum nINP.
The observed seasonal variation in nINP corresponds to the variation in cumulative PM mass (Table 6). In fact, we observed a prominent linear relationship between aerosol particle mass and INP number concentration (at −25 ∘C: Fig. 7a). Furthermore, the nm values (Fig. 7b) show a nearly constant value (≈3 × 10⁹ g−1) at −25 ∘C (independent of particle mass concentration).
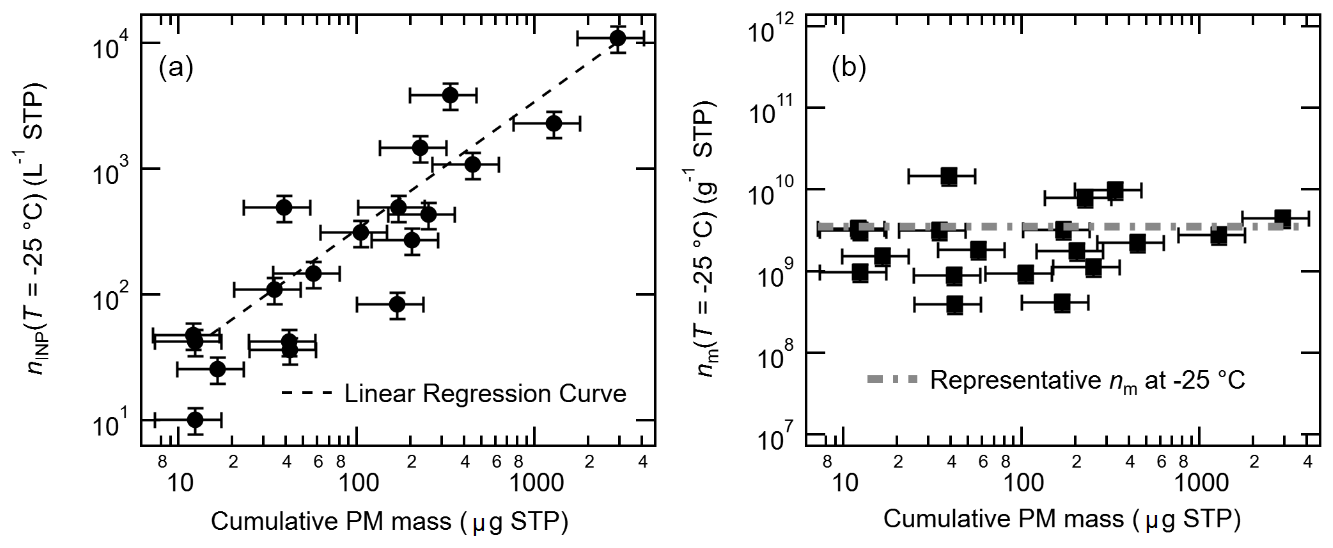
Figure 7Correlation between cumulative PM mass vs. nINP (a) and vs. nm (b) at −25 ∘C; a linear regression curve in log scale (nINP = 3.51 × cumulative PM mass − 2.41; r=0.94) is shown in (a), and the constant value of representative nm at the given temperature (3.55 × 10⁹ g−1), which is a median nm value of minimum − maximum, is shown in (b). Note that the errors in cumulative PM mass are ±40.4 %. The uncertainty in nINP and nm is ±23.5 %.
Figure 8 depicts the ns,geo spectra of aerosol particles from OLLF downwind ambient samples, color-coded with different sampling seasons. As seen in the figure, the seasonal diversity of is less apparent as compared to that of nINP,downwind (Fig. 6). There is no systematic difference in the range of nINP,downwind in different seasons in 2017–2019 at −20 ∘C: winter (1.2 × 10⁸–2.9×10⁸ m−2), spring (2.4 × 10⁸–2.3×10⁹ m−2), and summer (6.7 × 10⁷–2.7×10⁹ m−2). This observation is consistent with the ascribed dominance and importance of large particles as soil dust INPs.
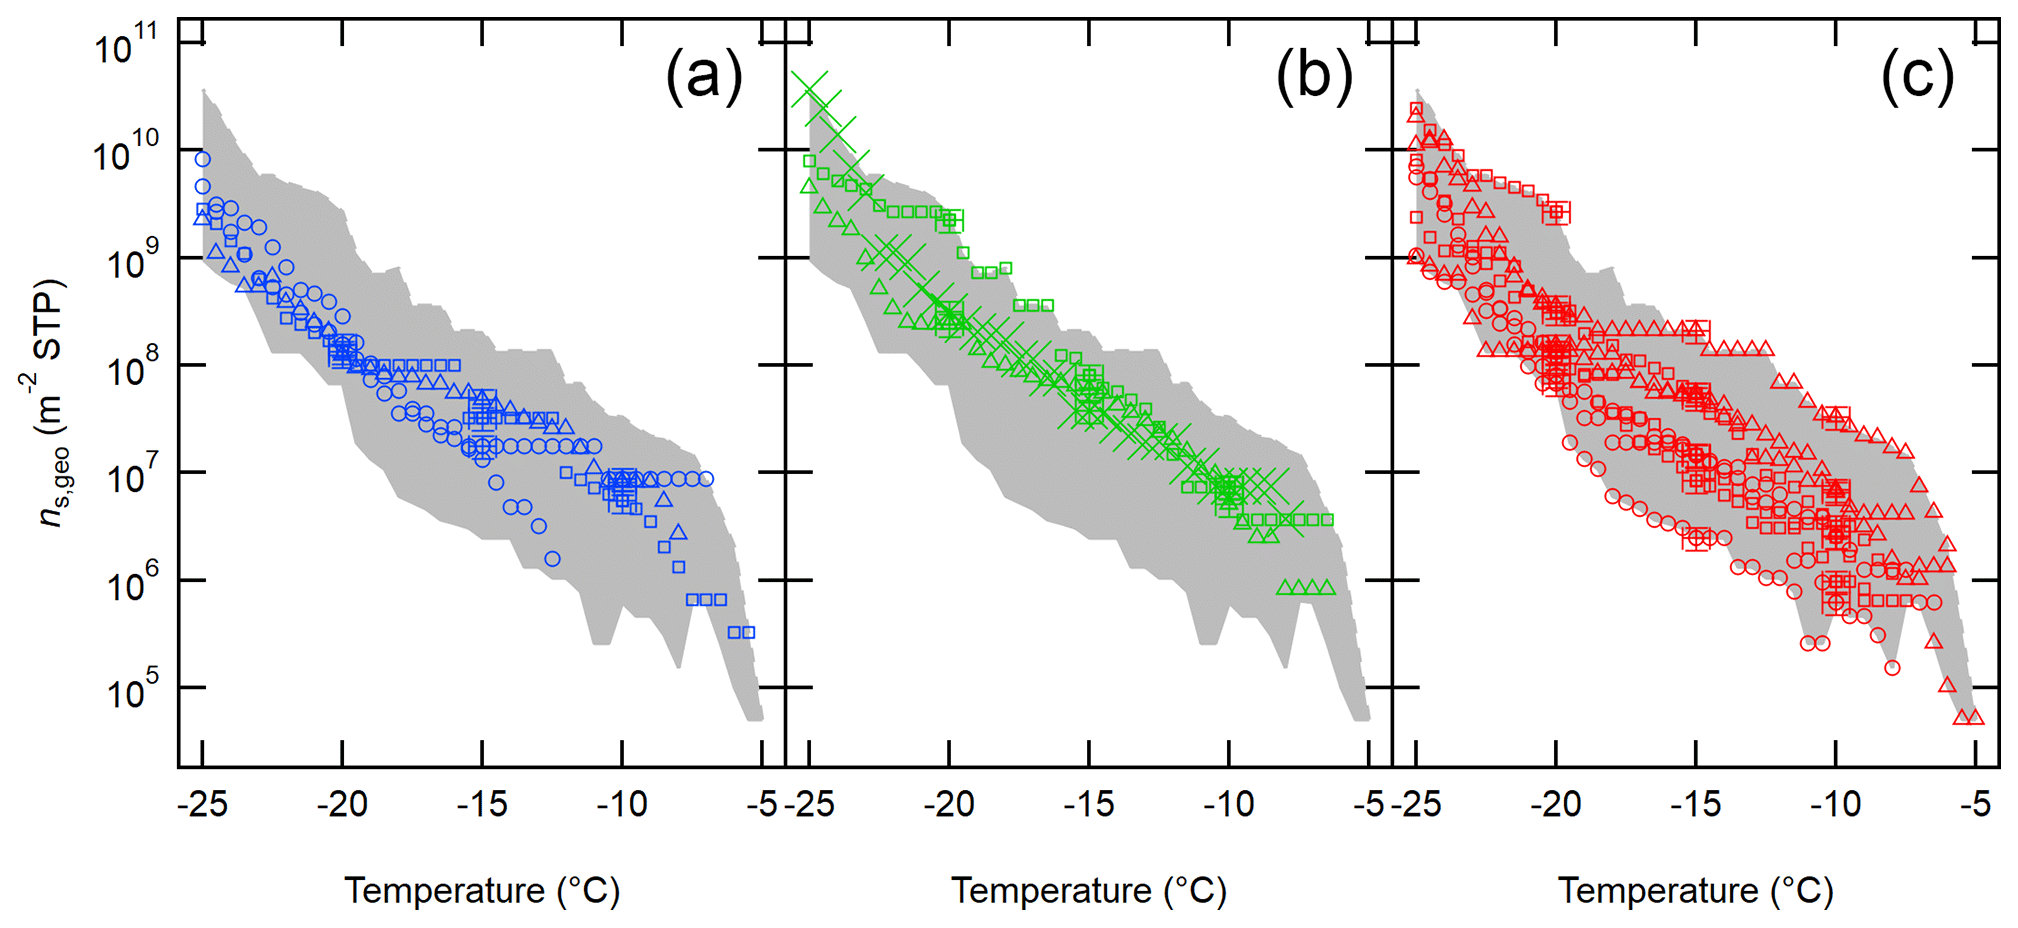
Figure 8The ns,geo spectra of OLLF aerosol particles from field ambient samples collected in 2017–2019. All downwind ns,geo spectra from winter (a), spring (b), and summer (c) are shown. Different symbol shapes correspond to individual OLLF sites as indicated in the legend. The uncertainties in temperature and ns,geo are ±0.5 ∘C and ±23.5 %, respectively, and representative error bars are shown at −5, −10, and −15 ∘C. The shaded area represents minimum − maximum ns,geo.
Ambient meteorological conditions during the field sampling activities are summarized in Table 7. Resuspension of feedlot surface materials is not mainly wind-driven. As mentioned in Sect. 3.1.1, cattle movement and hoof action trigger feedlot dust when the air is dry and hot. We performed linear regression analysis for wind speed vs. PM10 concentration, and the resulting Pearson correlation coefficient (r) was −0.32. Concerning the high variability of PM10 concentrations while sampling, we also examined the relationship between wind speed and cumulative PM mass, and the resulting r was −0.35. In addition, we could not find any relevant statistical correlations between other meteorological parameters (temperature, pressure, and RH) and PM10. We note that precipitation was not considered in this study because we made sure to sample aerosol particles when the pen surface was dry (at least several days after precipitation). These results imply the following. (1) Ambient meteorological conditions, as summarized in Table 7, might not be determining factors for nINP for our study sites. (2) There are abundant supermicron INPs from the feedlot (Sect. 3.1.3), which potentially dominates particle mass and OLLF INPs (Fig. 7). Overall, our offline measurements of ambient nINP using field filter samples collected in OLLFs show more than several hundred INPs L−1 below −20 ∘C. More interestingly, there is a notable correlation between INP and PM10 based on our 2017–2019 field study, which indicates the importance of large supermicron aerosol particles as INPs. This result supports the DFPC characterization of our OLLF samples in a controlled lab setting (i.e., supermicron nINP > submicron nINP).
Table 7Summary of the ambient conditions during field sampling activities: UW denotes upwind.
3.2.3 Comparison to previous soil dust IN studies
Figure 9 summarizes our field-measured nINP (Fig. 6) in the temperature range between −5 ∘C and −25 ∘C in comparison to the previously reported ambient nINP of soil dust and a compilation of other field-measured nINP from across the world. We chose to display our estimated nINP with standard deviations and global reference field nINP data from Kanji et al. (2017) at their temperature points (i.e., −15, −20, and −25 ∘C) to make all comparisons visible in this figure. It is apparent that the OLLF nINP spectra are consistently located above or overlapping with the upper bound of soil dust nINP spectra from previous studies across the temperature range we examined in our field study. Although our INP detection limit of 0.05 L−1 in this study is higher than Suski et al. (2018; ≈0.002 L−1), our data exceed their data from crop fields (soybean, sorghum, wheat, and corn) or are at least positioned towards the higher bound of the S18 data points. The observed consistent gap between our OLLF data and previous data holds true even when compared to the globally compiled nINP from multiple field campaigns at −15, −20, and −25 ∘C (Kanji et al., 2017), indicating that absolute INPs per unit volume at OLLFs are much higher than previously investigated field INP sources.
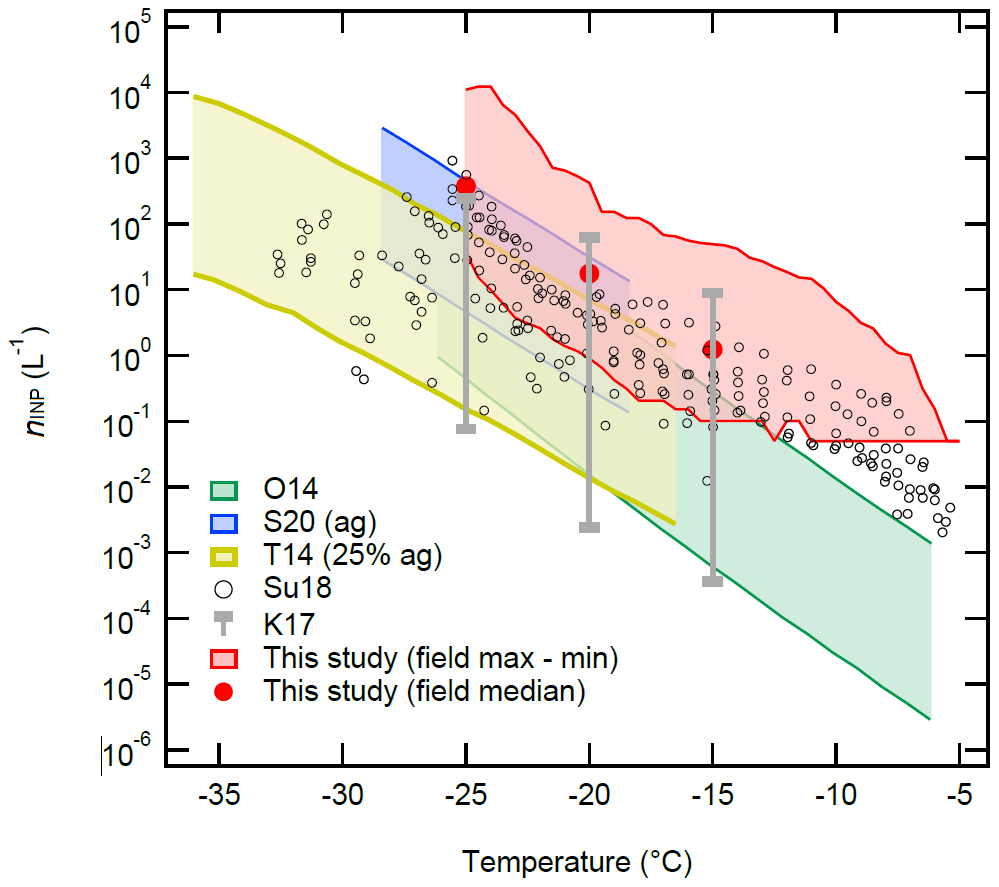
Figure 9The nINP(T) spectra of soil dust and aerosol particles as a function of temperature. The red-shaded area represents the range of our field nINP values at 0.5 ∘C intervals for −5 ∘C > temperature > −25 ∘C from this study (Fig. 6). The red solid symbols are our medians at −15, −20, and −25 ∘C. Five reference data are adapted from O'Sullivan et al. (2014 Fig. 9; O14), Steinke et al. (2020 Fig. 3; S20), Tobo et al. (2014 Fig. 6b; T14), Suski et al. (2018 Fig. 1a–d; Su18), and Kanji et al. (2017 Figs. 1–10; K17). Note that we display the maximum and minimum at −15, −20, and −25 ∘C of K17 in comparison to our estimation.
3.3 Laboratory vs. field results
3.3.1 Potential source of discrepancy
Our laboratory- and field-derived ns,geo values for our OFFL samples are comparable to other reference soil and desert dust ns,geo (Fig. 4). Taken together, the observed comparability suggests that OLLF soil dust is an important point source of atmospheric INPs. However, there is a deviation between laboratory ns,geo and that from field investigation beyond uncertainties at temperatures above −22 ∘C. It is not clear which factors contribute to the observed deviation.
An application of different immersion freezing techniques (i.e., INSEKT and WT-CRAFT for laboratory and field study, respectively) cannot explain the discrepancy. As demonstrated in Sect. S3, the immersion freezing results of 50:50 splits of our field-collected filter sample were reproducible via the two techniques. Thus, the system difference can be ruled out of the potential factors triggering the deviation.
Different protocols to preserve laboratory and field samples (i.e., Sect. 2.1.1 and 2.2.2) may have impacted our sample properties and INPs. Beall et al. (2020) recently reported that different storage protocols in terms of time and temperature can alter nINP in precipitation samples at relatively high freezing temperatures (i.e., >−19 ∘C). The authors also noted that “non-heat-labile INPs are generally less sensitive to storage”. This statement is important because our field airborne sample shows heat-stable characteristics (Supplement Sect. S4). However, in part because we have studied a limited number of samples in this study, it is not conclusive whether the difference in storage methods is fully responsible for the suppression of IN efficiency in our surface-collected proxies compared to the airborne sample.
The comparison between the immersion-mode freezing ability of ambient OLLF dust sampled in the field and that of surface material samples aerosolized in the cloud-simulation chamber shed light on the representativeness of dried, pulverized surface materials as surrogates for ambient dust particles in immersion freezing tests. Previously, Boose et al. (2016) studied immersion freezing abilities of diverse natural dust from nine desert regions around the globe (4 airborne and 11 sieved/milled surface samples) and found that the surface-collected samples tend to contain more efficient INPs than the airborne samples. The authors suggested that mineralogy may play a significant role in explaining the observed difference. On the other hand, Kaufmann et al. (2016) found a similar freezing behavior of multiple surface dust samples despite the variation in mineralogy. Both studies noted the necessity of investigating non-mineral compositions. While our laboratory and field samples are different in nature, our organic-predominant samples show a reduction in IN efficiency for surface-collected samples compared to airborne field samples. The observed offset motivates further research in organic INPs.
Microbiomes identified in the OLLF dust proxies from this study (Sect. 3.1.4) exhibited different microbiome diversity from our field samples collected on 28 March 2019 and 22, 23, and 24 July 2018 and were previously reported in Vepuri et al. (2021). Dust samples TXD01 and TXD05 in this study were collected in September 2017; TXD01 is a composite sample from many locations of the Texas Panhandle, and TXD05 is from a location in central Texas. Although they are of the same type, open cattle feedlot samples, a multitude of factors, including sampling time, sampling methodology, location, cattle races raised in these areas, different feeding strategies, as well as the different total DNA extraction protocols, very likely explain the observed differences in microbiome composition. Nevertheless, they do share some common bacterial taxa, such as the presence of bacteria from the orders Actinobacteriales, Caulobacterales, and Burkholderiales as well as the genus Marinoscillum, albeit in low numbers in this study. An important caveat, however, is that we could not find any notable inclusions of known IN-active microbiomes in both sample subsets. While we cannot rule out the possibility of IN from TXD01 and TXD05 samples triggered by biological INPs, our current results do not support it. In the future, we need to carry out an identical metagenomic analysis for ice crystal residual (ICR) samples collected at various temperatures. Extracting enough DNA out of ICR samples would be challenging and is currently not feasible at the AIDA facility. Facilitating a dynamic cooling expansion chamber and collecting ICRs for a prolonged expansion experiment period would be a potential resolution. Future work should include metatranscriptomics (analysis of RNA) to estimate the population size and diversity of live microorganisms as well as gene expression in the microbial population. More interdisciplinary strategy integrating dietary and health-related actions with cattle (e.g., how the diet of cattle, inclusion of antibiotics, and probiotics influence INP abundance in samples of feedlot surface materials) would also be useful.
Identifying heat-stable organic compounds and studying their physicochemical properties may be key to understanding the properties of OLLF INPs. Our chemical composition analysis of laboratory samples (Supplement Sect. S1) indicates that they are exclusively organic in nature in terms of aerosol composition. Further, airborne particles collected in OLLFs are generally known to include substantial amounts of organic materials. For example, our previous work using Raman micro-spectroscopy revealed that ≈96 % of ambient aerosol particles sampled at the downwind edge of an OLLF contain brown or black carbon, hydrophobic humic acid, water-soluble organics, less soluble fatty acids, and carbonaceous materials mixed with salts and minerals (Hiranuma et al., 2011). Recently, organic acids (i.e., long-chain fatty acids) and heat-stable organics were found to act as efficient INPs (DeMott et al., 2018; Perkins et al., 2020). However, our knowledge regarding which particular organics from OLLFs trigger immersion freezing at heterogeneous freezing temperatures is still lacking. This deficit is another motivation to investigate OLLF-derived ICR samples in the laboratory.
3.3.2 Immersion freezing efficiency and parameterizations
The exponential fits for temperature-binned ns,geo data (i.e., moving averages of every 0.5 ∘C) of lab and field measurements are summarized in Supplement Table S3. This parameterization offers a simple representation of supermicron-dominant INPs from OLLFs, which can act as an important point source of agricultural INPs in a very simple manner. Fit parameters are computationally optimized for the best r value, and the resulting parameters for each category are provided in this table. The ns,geo(T) spectral slopes, , from this study were also computed. Individual parameterizations are useful for analyzing spectra by comparing values. Overall, the range of spectral slope deviations (0.41–0.52) is higher than what we previously studied in soil dust samples in Fig. 4 (0.15–0.27; S16–O14), indicating a unique feature of the OLLF dust. We note that offering a universal single parameterization for soil dust-derived INPs is not the scope of this study. As OLLF represents a point source of fresh livestock-generated dust, we expect that it would have different IN efficiency than aged and weathered dust samples.
This study aimed at investigating the immersion-mode ice-nucleating properties of soil dust from OLLFs in Texas. Our investigations were composed of two parts: (1) an AIDA laboratory campaign to investigate the INP propensity and properties of two OLLF soil dust proxies; (2) a multi-year field investigation of immersion-mode INPs from four commercial OLLFs in the Texas Panhandle in 2017–2019. Our laboratory and field findings show that OLLFs are a substantial source of supermicron-sized particles and organic-rich soil dust INPs. Overall, the estimated nINP exceeds several hundred and several thousand INPs L−1 at −20 and −25 ∘C, respectively, in proximity to the OLLF emission sources.
Our AIDA immersion freezing results for OLLF proxies reasonably agree with the range of previous soil dust ns,geo values, at least at temperatures around −25 ∘C and lower, validating the comparability of our results. However, the INSEKT immersion spectra of both surface materials measured for temperatures >−25 ∘C are lower than previous soil dust outcomes. This difference indicates different properties of our feedlot dust proxies compared to other soil dust samples. Moreover, the importance of large aerosol particles for immersion freezing was verified in our AIDA-based laboratory study. The DFPC offline freezing instrument assessed IN abilities of OLLF dust surrogates with PM1 and total (> PM1) size fractions. Our assessment revealed that on average ≈50 % of OLLF nINP was derived from a supermicron aerosol particle population in the assessed temperature range between −18 and −22 ∘C. Thus, our laboratory study showed the potential importance of supermicron aerosol particles from OLLFs as INPs. While our metagenomic analysis does not support the presence of known IN-active microbiomes, more research should be directed to reveal the compositional identities and associated IN abilities of various other animal-feeding facility samples.
From the first year of our field work, we found that OLLF is a source of INPs that can be active at temperatures below ∘C. In short, the INP abundance at the downwind site of each OLLF is an order of magnitude higher than at the nominal upwind edge across the examined temperature range ( ∘C). This difference between downwind and upwind INPs clearly indicates that a vast majority of INPs found in our field sites (as high as 11 000 INP L−1 cumulatively at −25 ∘C) are from OLLFs. Over the 3 years of our field OLLF investigation, there was a clear seasonal variation in nINP. Summer nINP at −20 ∘C from the downwind edge of OLLFs (up to ≈400 L−1) was notably higher than that of spring (up to ≈30 L−1) and winter (up to ≈20 L−1). The observed seasonal trend persisted for all heterogeneous freezing temperatures investigated in this study (temperature ∘C). Interestingly, the observed nINP seasonality strongly correlated with that of PM10 mass (r=0.94). This relationship implies the importance of large particles, which dominate aerosol surface area and mass, for IN of OLLF dust. By scaling our nINP to the aerosol particle surface area, we are no longer able to see any clear seasonal variation in ns,geo; thereby, we conclude that the abundance of INP from OLLFs depends on dust quantity at ground level at a given time, but its IN efficiency is consistent throughout the seasons at least for 2017–2019. These findings also suggest that future studies of soil dust INP might need to focus on statistically validating the link between the properties of large supermicron particles and INPs with longer observations from a multitude of regions. The on-site measurements of size-segregated INPs with a combination of a size-selecting impactor inlet and an online INP monitor will indeed be meaningful to add insights into the importance of large INPs.
Original data created for the study will be available in the Supplement.
The supplement related to this article is available online at: https://doi.org/10.5194/acp-21-14215-2021-supplement.
NH, NSU, BWA, and OM designed the research; NH, BWA, FB, JB, KMC, DGG, KH, YH, HS, XS, IS, NSU, FV, LL, and OM performed research; NH, FB, DGG, KH, YH, GS, XS, IS, RU, NSU, HSKV, FV, LL, and OM analyzed data; NH, FB, DGG, and XS wrote the paper. NH led the revision effort with the support of all the authors.
The authors declare that they have no conflict of interest.
Publisher’s note: Copernicus Publications remains neutral with regard to jurisdictional claims in published maps and institutional affiliations.
The authors wish to thank the IMK-AAF engineering and infrastructure group (Georg Scheurig, Rainer Buschbacher, Tomasz Chudy, Olga Dombrowski, Jens Nadolny, Frank Schwarz, and Steffen Vogt) for their continued support throughout the TxDUST01 campaign. We also thank Thomas Schwartz and Johannes Alexander, Department of Microbiology and Molecular Biology/Institute of Functional Interfaces/Karlsruhe Institute of Technology, for valuable technical assistance. The authors thank Hanover Research, Elise K. Wilbourn, and Gourihar Kulkarni for the language and technical edition.
This project has received funding from the European Union's Horizon 2020 research and innovation program through the EUROCHAMP-2020 Infrastructure Activity (grant no. 730997), the U.S. Department of Energy, Office of Science, Office of Biological and Environmental Research (grant no. number DE-SC-0018979), the Killgore Faculty Research and President's Undergraduate Student Research Grants (grant no. WT20-034), and the Alexander von Humboldt Foundation (grant no. 1188375) through a postdoctoral fellowship for Nsikanabasi S. Umo.
This paper was edited by James Allan and reviewed by four anonymous referees.
Alter, R. E., Fan, Y., Lintner, B. R., and Weaver, C. P.: Observational evidence that Great Plains irrigation has enhanced summer precipitation intensity and totals in the Midwestern United States, J. Hydrometeorol., 16, 1717–1735, 2015.
Annamalai, K., Sweeten, J. M., Auvermann, B. W., Mukhtar, S., Caperada, S., Engler, C. R., Harman, W., Jn, R., and Deotte, R.: Renewable energy and environmental sustainability using biomass from dairy and beef animal production, U.S. Department of Energy Office of Scientific and Technical Information, 1039414, https://doi.org/10.2172/1039414, 2012.
Auverman, B. W.: Controlling Dust and Odor from Open Lot Livestock Facilities, in: Koelsch et al., Livestock and poultry environmental stewardship (LPES) national curriculum, Midwest Plan Service, Ames, IA, USA, available at: https://lpelc.org/wp-content/uploads/2019/03/LES_42.pdf (last access: 3 July 2021), 2001.
Auvermann, B. W., Hiranuma, N., Heflin, K., and Marek, G.: Open-path transmissometry for measurement of visibility impairment by fugitive emissions from livestock facilities, American Society of Agricultural Engineers, 044010, https://doi.org/10.13031/2013.17090, 2004.
Beall, C. M., Lucero, D., Hill, T. C., DeMott, P. J., Stokes, M. D., and Prather, K. A.: Best practices for precipitation sample storage for offline studies of ice nucleation in marine and coastal environments, Atmos. Meas. Tech., 13, 6473–6486, https://doi.org/10.5194/amt-13-6473-2020, 2020.
Benz, S., Megahed, K., Möhler, O., Saathoff, H., Wagner, R., and Schurath, U.: T-dependent rate measurements of homogeneousice nucleation in cloud droplets using a large atmospheric simulation chamber, J. Photoch. Photobio. A, 176, 208–217, 2005.
Bigelow, D. P. and Borchers, A.: Major uses of land in the United States, 2012, EIB-178, U.S. Department of Agriculture, Economic Research Service, USDA, available at: https://www.ers.usda.gov/webdocs/publications/84880/eib-178.pdf?v=1485.8, (last access: 3 July 2021), 2017.
Boose, Y., Welti, A., Atkinson, J., Ramelli, F., Danielczok, A., Bingemer, H. G., Plötze, M., Sierau, B., Kanji, Z. A., and Lohmann, U.: Heterogeneous ice nucleation on dust particles sourced from nine deserts worldwide – Part 1: Immersion freezing, Atmos. Chem. Phys., 16, 15075–15095, https://doi.org/10.5194/acp-16-15075-2016, 2016.
Boucher, O., Randall, D., Artaxo, P., Bretherton, C., Feingold, G., Forster, P., Kerminen, V.-M., Kondo, Y., Liao, H., Lohmann, U., Rasch, P., Satheesh, S. K., Sherwood, S., Stevens, B., and Zhang, X. Y.: Clouds and Aerosols, in: Climate Change 2013: The Physical Science Basis. Contribution of Working Group I to the Fifth Assessment Report of the Intergovernmental Panel on Climate Change, edited by: Stocker, T. F., Qin, D., Plattner, G.-K., Tignor, M., Allen, S. K., Boschung, J., Nauels, A., Xia, Y., Bex, V., and Midgley, P. M., Cambridge University Press, Cambridge, United Kingdom and New York, NY, USA, 571–657, 2013.
Brunauer, S., Emmett, P. H., and Teller, E.: Adsorption of gases in multimolecular layers, J. Am. Chem. Soc., 60, 309–319, 1938.
Bush, J., Heflin, K. R., Marek, G. W., Bryant, T. C., and Auvermann, B. W.: Increasing stocking density reduces emissions of fugitive dust from cattle feedyards, Appl. Eng. Agric., 30, 815–824, 2014.
Chaucheyras-Durand, F. and Ossa, F.: Review: The rumen microbiome: Composition, abundance, diversity, and new investigative tools, The Professional Animal Scientist, 30, 1–12, https://doi.org/10.15232/S1080-7446(15)30076-0, 2014.
Chen, J., Wu, Z., Chen, J., Reicher, N., Fang, X., Rudich, Y., and Hu, M.: Size-resolved atmospheric ice-nucleating particles during East Asian dust events, Atmos. Chem. Phys., 21, 3491–3506, https://doi.org/10.5194/acp-21-3491-2021, 2021.
Conen, F., Morris, C. E., Leifeld, J., Yakutin, M. V., and Alewell, C.: Biological residues define the ice nucleation properties of soil dust, Atmos. Chem. Phys., 11, 9643–9648, https://doi.org/10.5194/acp-11-9643-2011, 2011.
Creamean, J. M., Kirpes, R. M., Pratt, K. A., Spada, N. J., Maahn, M., de Boer, G., Schnell, R. C., and China, S.: Marine and terrestrial influences on ice nucleating particles during continuous springtime measurements in an Arctic oilfield location, Atmos. Chem. Phys., 18, 18023–18042, https://doi.org/10.5194/acp-18-18023-2018, 2018.
DeMott, P. J., Prenni, A. J., Liu, X., Kreidenweis, S. M., Petters, M. D., Twohy, C. H., Richardson, M. S., Eidhammer, T., and Rogers, D. C.: Predicting global atmospheric ice nuclei distributions and their impacts on climate, P. Natl. Acad. Sci. USA, 107, 11217–11222, 2010.
DeMott, P. J., Hill, T. C. J., Petters, M. D., Bertram, A. K., Tobo, Y., Mason, R. H., Suski, K. J., McCluskey, C. S., Levin, E. J. T., Schill, G. P., Boose, Y., Rauker, A. M., Miller, A. J., Zaragoza, J., Rocci, K., Rothfuss, N. E., Taylor, H. P., Hader, J. D., Chou, C., Huffman, J. A., Pöschl, U., Prenni, A. J., and Kreidenweis, S. M.: Comparative measurements of ambient atmospheric concentrations of ice nucleating particles using multiple immersion freezing methods and a continuous flow diffusion chamber, Atmos. Chem. Phys., 17, 11227–11245, https://doi.org/10.5194/acp-17-11227-2017, 2017.
DeMott, P. J., Mason, R. H., McCluskey, C. S., Hill, T. C. J., Perkins, R. J., Desyaterik, Y., Bertram, A. K., Trueblood, J. V., Grassian, V. H., Qiu, Y., Molinero, V., Tobo, Y., Sultana, C. M., Christopher, L., and Prather, K. A.: Ice nucleation by particles containing long-chain fatty acids of relevance to freezing by sea spray aerosols, Environ. Sci.-Proc. Imp., 20, 1559–1569, 2018.
Després, V. R., Huffman, J. A., Burrows, S. M., Hoose, C., Safatov, A. S., Buryak, G., Fröhlich-Nowoisky, J., Elbert, W., Andreae, M. O., Pöschl, U., and Jaenicke, R.: Primary biological aerosols in the atmosphere: A review of observations and relevance, Tellus B, 64, 15598, https://doi.org/10.3402/tellusb.v64i0.15598, 2012.
Drouillard, J. S.: Current situation and future trends for beef production in the United States of America – A review, Asian-Australas. J. Anim. Sci., 31, 1007–1016, 2018.
Duniway, M. C., Pfennigwerth, A. A., Fick, S. E., Nauman, T. W., Belnap, J., and Barger, N. N.: Wind erosion and dust from US drylands: a review of causes, consequences, and solutions in a changing world, Ecosphere, 10, e02650, https://doi.org/10.1002/ecs2.2650, 2019.
Fahey, D. W., Gao, R.-S., Möhler, O., Saathoff, H., Schiller, C., Ebert, V., Krämer, M., Peter, T., Amarouche, N., Avallone, L. M., Bauer, R., Bozóki, Z., Christensen, L. E., Davis, S. M., Durry, G., Dyroff, C., Herman, R. L., Hunsmann, S., Khaykin, S. M., Mackrodt, P., Meyer, J., Smith, J. B., Spelten, N., Troy, R. F., Vömel, H., Wagner, S., and Wienhold, F. G.: The AquaVIT-1 intercomparison of atmospheric water vapor measurement techniques, Atmos. Meas. Tech., 7, 3177–3213, https://doi.org/10.5194/amt-7-3177-2014, 2014.
Fouts, D. E., Szpakowski, S., Purushe, J., Torralba, M., Waterman, R. C., MacNeil, M. D., Alexander, L. J., and Nelson, K. E.: Next generation sequencing to define prokaryotic and fungal diversity in the bovine rumen, PLoS One, 7, e48289, https://doi.org/10.1371/journal.pone.0048289, 2012.
Ginoux, P., Prospero, J. M., Gill, T. E., Hsu, N. C., and Zhao, M.: Global scale attribution of anthropogenic and natural dust sources and their emission rates based on modis deep blue aerosol products, Rev. Geophys., 50, RG3005, https://doi.org/10.1029/2012RG000388, 2012.
Guo, L., Maghirang, R. G., Razote, E. B., and Auvermann, B. W.: Laboratory evaluation of dust-control effectiveness of pen surface treatments for cattle feedlots, J. Environ. Qual., 40, 1503–1509, 2011.
Hande, L. B. and Hoose, C.: Partitioning the primary ice formation modes in large eddy simulations of mixed-phase clouds, Atmos. Chem. Phys., 17, 14105–14118, https://doi.org/10.5194/acp-17-14105-2017, 2017.
Hill, T. C., Moffett, B. F., DeMott, P. J., Georgakopoulos, D. G., Stump, W. L., and Franc, G. D.: Measurement of ice nucleation-active bacteria on plants and in precipitation by quantitative pcr, Appl. Environ. Microbiol., 80, 1256–1267, 2014.
Hill, T. C. J., DeMott, P. J., Tobo, Y., Fröhlich-Nowoisky, J., Moffett, B. F., Franc, G. D., and Kreidenweis, S. M.: Sources of organic ice nucleating particles in soils, Atmos. Chem. Phys., 16, 7195–7211, https://doi.org/10.5194/acp-16-7195-2016, 2016.
Hiranuma, N., Brooks, S. D., Gramann, J., and Auvermann, B. W.: High concentrations of coarse particles emitted from a cattle feeding operation, Atmos. Chem. Phys., 11, 8809–8823, https://doi.org/10.5194/acp-11-8809-2011, 2011.
Hiranuma, N., Augustin-Bauditz, S., Bingemer, H., Budke, C., Curtius, J., Danielczok, A., Diehl, K., Dreischmeier, K., Ebert, M., Frank, F., Hoffmann, N., Kandler, K., Kiselev, A., Koop, T., Leisner, T., Möhler, O., Nillius, B., Peckhaus, A., Rose, D., Weinbruch, S., Wex, H., Boose, Y., DeMott, P. J., Hader, J. D., Hill, T. C. J., Kanji, Z. A., Kulkarni, G., Levin, E. J. T., McCluskey, C. S., Murakami, M., Murray, B. J., Niedermeier, D., Petters, M. D., O'Sullivan, D., Saito, A., Schill, G. P., Tajiri, T., Tolbert, M. A., Welti, A., Whale, T. F., Wright, T. P., and Yamashita, K.: A comprehensive laboratory study on the immersion freezing behavior of illite NX particles: a comparison of 17 ice nucleation measurement techniques, Atmos. Chem. Phys., 15, 2489–2518, https://doi.org/10.5194/acp-15-2489-2015, 2015.
Hiranuma, N., Adachi, K., Bell, D. M., Belosi, F., Beydoun, H., Bhaduri, B., Bingemer, H., Budke, C., Clemen, H.-C., Conen, F., Cory, K. M., Curtius, J., DeMott, P. J., Eppers, O., Grawe, S., Hartmann, S., Hoffmann, N., Höhler, K., Jantsch, E., Kiselev, A., Koop, T., Kulkarni, G., Mayer, A., Murakami, M., Murray, B. J., Nicosia, A., Petters, M. D., Piazza, M., Polen, M., Reicher, N., Rudich, Y., Saito, A., Santachiara, G., Schiebel, T., Schill, G. P., Schneider, J., Segev, L., Stopelli, E., Sullivan, R. C., Suski, K., Szakáll, M., Tajiri, T., Taylor, H., Tobo, Y., Ullrich, R., Weber, D., Wex, H., Whale, T. F., Whiteside, C. L., Yamashita, K., Zelenyuk, A., and Möhler, O.: A comprehensive characterization of ice nucleation by three different types of cellulose particles immersed in water, Atmos. Chem. Phys., 19, 4823–4849, https://doi.org/10.5194/acp-19-4823-2019, 2019.
Hoose, C., Kristjánsson, J. E., and Burrows, S. M.: How important is biological ice nucleation in clouds on a global scale?, Environ. Res. Lett., 5, 024009, https://doi.org/10.1088/1748-9326/5/2/024009, 2010.
Huang, S., Hu, W., Chen, J., Wu, Z., Zhang, D., and Fu, P.: Overview of biological ice nucleating particles in the atmosphere, Environ. Int., 146, 106197, https://doi.org/10.1016/j.envint.2020.106197, 2021.
Huffman, J. A., Prenni, A. J., DeMott, P. J., Pöhlker, C., Mason, R. H., Robinson, N. H., Fröhlich-Nowoisky, J., Tobo, Y., Després, V. R., Garcia, E., Gochis, D. J., Harris, E., Müller-Germann, I., Ruzene, C., Schmer, B., Sinha, B., Day, D. A., Andreae, M. O., Jimenez, J. L., Gallagher, M., Kreidenweis, S. M., Bertram, A. K., and Pöschl, U.: High concentrations of biological aerosol particles and ice nuclei during and after rain, Atmos. Chem. Phys., 13, 6151–6164, https://doi.org/10.5194/acp-13-6151-2013, 2013.
Kanji, Z. A., Ladino, L. A., Wex, H., Boose, Y., Burkert-Kohn, M., Cziczo, D. J., and Krämer, M.: Overview of ice nucleating particles, Meteor. Mon., 58, 1.1–1.33, 2017.
Kaufmann, L., Marcolli, C., Hofer, J., Pinti, V., Hoyle, C. R., and Peter, T.: Ice nucleation efficiency of natural dust samples in the immersion mode, Atmos. Chem. Phys., 16, 11177–11206, https://doi.org/10.5194/acp-16-11177-2016, 2016.
Katra, I.: Soil erosion by wind and dust emission in semi-arid soils due to agricultural activities, Agronomy, 10, 89, https://doi.org/10.3390/agronomy10010089, 2020.
Kenny, L. C., Gussman, R., and Meyer, M.: Development of a sharp-cut cyclone for ambient aerosol monitoring applications, Aerosol. Sci. Technol., 32, 338–358, 2000.
Ladino, L. A., Raga, G. B., Alvarez-Ospina, H., Andino-Enríquez, M. A., Rosas, I., Martínez, L., Salinas, E., Miranda, J., Ramírez-Díaz, Z., Figueroa, B., Chou, C., Bertram, A. K., Quintana, E. T., Maldonado, L. A., García-Reynoso, A., Si, M., and Irish, V. E.: Ice-nucleating particles in a coastal tropical site, Atmos. Chem. Phys., 19, 6147–6165, https://doi.org/10.5194/acp-19-6147-2019, 2019.
Langer, G. and Rodgers, J.: An experimental study of ice nuclei on membrane filters and other substrata, J. Appl. Meteorol., 14, 560–571, 1975.
Li, R., Dong, X., Guo, J., Fu, Y., Zhao, C., Wang, Y., and Min, Q.: The implications of dust ice nuclei effect on cloud top temperature in a complex mesoscale convective system, Sci. Rep., 7, 13826, https://doi.org/10.1038/s41598-017-12681-0, 2017.
Mason, R. H., Si, M., Chou, C., Irish, V. E., Dickie, R., Elizondo, P., Wong, R., Brintnell, M., Elsasser, M., Lassar, W. M., Pierce, K. M., Leaitch, W. R., MacDonald, A. M., Platt, A., Toom-Sauntry, D., Sarda-Estève, R., Schiller, C. L., Suski, K. J., Hill, T. C. J., Abbatt, J. P. D., Huffman, J. A., DeMott, P. J., and Bertram, A. K.: Size-resolved measurements of ice-nucleating particles at six locations in North America and one in Europe, Atmos. Chem. Phys., 16, 1637–1651, https://doi.org/10.5194/acp-16-1637-2016, 2016.
Möhler, O., Stetzer, O., Schaefers, S., Linke, C., Schnaiter, M., Tiede, R., Saathoff, H., Krämer, M., Mangold, A., Budz, P., Zink, P., Schreiner, J., Mauersberger, K., Haag, W., Kärcher, B., and Schurath, U.: Experimental investigation of homogeneous freezing of sulphuric acid particles in the aerosol chamber AIDA, Atmos. Chem. Phys., 3, 211–223, https://doi.org/10.5194/acp-3-211-2003, 2003.
Möhler, O., Field, P. R., Connolly, P., Benz, S., Saathoff, H., Schnaiter, M., Wagner, R., Cotton, R., Krämer, M., Mangold, A., and Heymsfield, A. J.: Efficiency of the deposition mode ice nucleation on mineral dust particles, Atmos. Chem. Phys., 6, 3007–3021, https://doi.org/10.5194/acp-6-3007-2006, 2006.
Murray, B. J., Carslaw, K. S., and Field, P. R.: Opinion: Cloud-phase climate feedback and the importance of ice-nucleating particles, Atmos. Chem. Phys., 21, 665–679, https://doi.org/10.5194/acp-21-665-2021, 2021.
Nagaraja, T. G.: Microbiology of the rumen, in: Rumenology, edited by: Millen, D., De Beni Arrigoni, M., and Lauritano Pacheco, R., Springer Nature, Cham, Switzerland, pp. 39–61, 2016.
Niemand, M., Moehler, O., Vogel, B., Vogel, H., Hoose, C., Connolly, P., Klein, H., Bingemer, H., DeMott, P., Skrotzki, J., and Leisner, T.: Parameterization of immersion freezing on mineral dust particles: An application in a regional scale model, J. Atmos. Sci., 69, 3077–3092, 2012.
O'Sullivan, D., Murray, B. J., Malkin, T. L., Whale, T. F., Umo, N. S., Atkinson, J. D., Price, H. C., Baustian, K. J., Browse, J., and Webb, M. E.: Ice nucleation by fertile soil dusts: relative importance of mineral and biogenic components, Atmos. Chem. Phys., 14, 1853–1867, https://doi.org/10.5194/acp-14-1853-2014, 2014.
Overpeck, J. T. and Udall, B.: Climate change and the aridification of North America, P. Natl. Acad. Sci. USA, 117, 11856–11858, 2020.
Parnell, C. B., Jones, D. D., Rutherford, R. D., and Goforth, K. J.: Physical properties of five grain dust types, Environ, Health Perspect., 66, 183–188, 1986.
Pastoor, J. W., Loy, D. D., Trenkle, A., and Lawrence, J. D.: Comparing fed cattle performance in open lot and bedded confinement feedlot facilities, The Professional Animal Scientist, 28, 410–416, 2012.
Perkins, R. J., Gillette, S. M., Hill, T. C. J., and Demott, P. J.: The labile nature of ice nucleation by Arizona Test Dust, ACS Earth Space Chem., 4, 133–141, 2020.
Pruppacher, H. R. and Klett, J. D.: Heterogeneous Nucleation, in: Microphysics of Clouds and Precipitation, Kluwer Academic Publishers, Dordrecht, the Netherlands, pp. 287–360, 2010.
Razote, E. B., Maghirang, R. G., Predicala, B. Z., Murphy, J. P., Auvermann, B. W., Harner III, J. P., and Hargrove, W. L.: Laboratory evaluation of the dust emission potential of cattle feedlot surfaces, T. ASABE, 49, 1117–1124, https://doi.org/10.13031/2013.21729, 2006.
Reicher, N., Budke, C., Eickhoff, L., Raveh-Rubin, S., Kaplan-Ashiri, I., Koop, T., and Rudich, Y.: Size-dependent ice nucleation by airborne particles during dust events in the eastern Mediterranean, Atmos. Chem. Phys., 19, 11143–11158, https://doi.org/10.5194/acp-19-11143-2019, 2019.
Santachiara, G., Di Matteo, L., Prodi, F., and Belosi, F.: Atmospheric particles acting as ice forming nuclei in different size ranges, Atmos. Res., 96, 266–272, 2010.
Sarrocco, S.: Dung-inhabiting fungi: a potential reservoir of novel secondary metabolites for the control of plant pathogens, Pest. Manag. Sci., 72, 643–652, 2016.
Schiebel, T.: Ice nucleation activity of soil dust aerosols, PhD thesis, Karlsruhe Institute of Technology, Karlsruhe, Germany, 131 pp., https://doi.org/10.5445/IR/1000076327, 2017.
Schneider, J., Höhler, K., Heikkilä, P., Keskinen, J., Bertozzi, B., Bogert, P., Schorr, T., Umo, N. S., Vogel, F., Brasseur, Z., Wu, Y., Hakala, S., Duplissy, J., Moisseev, D., Kulmala, M., Adams, M. P., Murray, B. J., Korhonen, K., Hao, L., Thomson, E. S., Castarède, D., Leisner, T., Petäjä, T., and Möhler, O.: The seasonal cycle of ice-nucleating particles linked to the abundance of biogenic aerosol in boreal forests, Atmos. Chem. Phys., 21, 3899–3918, https://doi.org/10.5194/acp-21-3899-2021, 2021.
Schnell, R. C. and Vali, G.: Atmospheric Ice Nuclei from Decomposing Vegetation, Nature, 236, 163–165, 1972.
Schnell, R. C. and Vali, G.: World-wide Source of Leaf-derived Freezing Nuclei, Nature, 246, 212–213, 1973.
Si, M., Irish, V. E., Mason, R. H., Vergara-Temprado, J., Hanna, S. J., Ladino, L. A., Yakobi-Hancock, J. D., Schiller, C. L., Wentzell, J. J. B., Abbatt, J. P. D., Carslaw, K. S., Murray, B. J., and Bertram, A. K.: Ice-nucleating ability of aerosol particles and possible sources at three coastal marine sites, Atmos. Chem. Phys., 18, 15669–15685, https://doi.org/10.5194/acp-18-15669-2018, 2018.
Steinke, I., Möhler, O., Kiselev, A., Niemand, M., Saathoff, H., Schnaiter, M., Skrotzki, J., Hoose, C., and Leisner, T.: Ice nucleation properties of fine ash particles from the Eyjafjallajökull eruption in April 2010, Atmos. Chem. Phys., 11, 12945–12958, https://doi.org/10.5194/acp-11-12945-2011, 2011.
Steinke, I., Funk, R., Busse, J., Iturri, A., Kirchen, S., Leue, M., Möhler, O., Schwartz, T., Schnaiter, M., Sierau, B., Toprak, E., Ullrich, R., Ulrich, A., Hoose, C., and Leisner, T.: Ice nucleation activity of agricultural soil dust aerosols from Mongolia, Argentina, and Germany, J. Geophys. Res.-Atmos., 121, 13559–13576, 2016.
Steinke, I., Hiranuma, N., Funk, R., Höhler, K., Tüllmann, N., Umo, N. S., Weidler, P. G., Möhler, O., and Leisner, T.: Complex plant-derived organic aerosol as ice-nucleating particles – more than the sums of their parts?, Atmos. Chem. Phys., 20, 11387–11397, https://doi.org/10.5194/acp-20-11387-2020, 2020.
Storelvmo, T.: Aerosol effects on climate via mixed-phase and ice clouds, Annu. Rev. Earth Planet. Sci., 45, 199–222, 2017.
Suski, K. J., Hill, T. C. J., Levin, E. J. T., Miller, A., DeMott, P. J., and Kreidenweis, S. M.: Agricultural harvesting emissions of ice-nucleating particles, Atmos. Chem. Phys., 18, 13755–13771, https://doi.org/10.5194/acp-18-13755-2018, 2018.
Tobo, Y., DeMott, P. J., Hill, T. C. J., Prenni, A. J., Swoboda-Colberg, N. G., Franc, G. D., and Kreidenweis, S. M.: Organic matter matters for ice nuclei of agricultural soil origin, Atmos. Chem. Phys., 14, 8521–8531, https://doi.org/10.5194/acp-14-8521-2014, 2014.
Tobo, Y.: An improved approach for measuring immersion freezing in large droplets over a wide temperature range, Sci. Rep., 6, 32930, https://doi.org/10.1038/srep32930, 2016.
Ullrich, R., Hoose, C., Möhler, O., Niemand, M., Wagner, R., Höhler, K., Hiranuma, N., Saathoff, H., and Leisner, T.: A new icenucleation active site parameterization for desert dust and soot, J. Atmos. Sci., 74, 699–717, 2017.
U.S. Environmental Protection Agency: Regulatory definitions of large CAFOs, medium CAFO, and small CAFOs, available at: https://www3.epa.gov/npdes/pubs/sector_table.pdf, last access: 3 July 2021.
U.S. Department of Agriculture (USDA): Cattle on feed, the National Agricultural Statistics Service, Agricultural Statistics Board, USDA, available at: https://usda.library.cornell.edu/concern/publications/m326m174z?locale=en#release-items, last access: 3 July 2021.
Vali, G.: Ice nucleation relevant to formation of hail, Stormy Weather Group, PhD thesis, McGill University, Montreal, Quebec, Canada, available at: https://central.bac-lac.gc.ca/.item?id=TC-QMM-73746&op=pdf&app=Library&oclc_number=894992919 (last access: 21 December 2020), 1968.
Vali, G.: Quantitative evaluation of experimental results on the heterogeneous freezing nucleation of supercooled liquids, J. Atmos. Sci., 28, 402–409, 1971.
Vepuri, H. S. K., Rodriguez, C. A., Georgakopoulos, D. G., Hume, D., Webb, J., Mayer, G. D., and Hiranuma, N.: Ice-nucleating particles in precipitation samples from the Texas Panhandle, Atmos. Chem. Phys., 21, 4503–4520, https://doi.org/10.5194/acp-21-4503-2021, 2021.
von der Weiden, S.-L., Drewnick, F., and Borrmann, S.: Particle Loss Calculator – a new software tool for the assessment of the performance of aerosol inlet systems, Atmos. Meas. Tech., 2, 479–494, https://doi.org/10.5194/amt-2-479-2009, 2009.
Von Essen, S. G. and Auvermann, B. W.: Health effects from breathing air near CAFOs for feeder cattle or hogs, J. Agromedicine, 10, 55–64, 2005.
von Holdt, J. R. C., Eckardt, F. D., Baddock, M. C., Hipondoka, M. H. T., and Wiggs, G. F. S.: Influence of sampling approaches on physical and geochemical analysis of aeolian dust in source regions, Aeolian Res., 50, 100684, https://doi.org/10.1016/j.aeolia.2021.100684, 2021.
Westbrook, C. D. and Illingworth, A. J.: Evidence that ice forms primarily in supercooled liquid clouds at temperatures >−27 ∘C, Geophys. Res. Lett., 38, L14808, https://doi.org/10.1029/2011GL048021, 2011.
Wex, H., DeMott, P. J., Tobo, Y., Hartmann, S., Rösch, M., Clauss, T., Tomsche, L., Niedermeier, D., and Stratmann, F.: Kaolinite particles as ice nuclei: learning from the use of different kaolinite samples and different coatings, Atmos. Chem. Phys., 14, 5529–5546, https://doi.org/10.5194/acp-14-5529-2014, 2014.
Zelinka, M. D., Myers, T. A., McCoy, D. T., Po-Chedley, S., Caldwell, P. M., Ceppi, P., Klein, S. A., and Taylor, K. E.: Causes of higher climate sensitivity in CMIP6 models, Geophys. Res. Lett., 47, e2019GL085782, https://doi.org/10.1029/2019gl085782, 2020.