the Creative Commons Attribution 4.0 License.
the Creative Commons Attribution 4.0 License.
 | 24 Sep 2021
Measurement report: The chemical composition of and temporal variability in aerosol particles at Tuktoyaktuk, Canada, during the Year of Polar Prediction Second Special Observing Period
John MacInnis
Jai Prakash Chaubey
Crystal Weagle
David Atkinson
Rachel Ying-Wen Chang
The chemical composition, sources, and concentrations of aerosol particles vary on a seasonal basis in the Arctic. While existing research has focused on understanding the occurrence of aerosol particles during the Arctic winter and spring, less is known of their occurrence during the Arctic summer. In this study, atmospheric aerosol particle chemical composition and concentration were determined during July–September 2018 at Tuktoyaktuk, NT, Canada (69.4∘ N, 133.0∘ W), to coincide with the Year of Polar Prediction's Second Special Observing Period in the Arctic. The chemical composition of fine (PM2.5) and coarse (PM10–2.5) aerosol filter samples suggests the ocean, mineral and/or road dust, and combustion were sources of the sampled aerosol particles. Mass concentrations of PM2 and PM10, estimated from optical particle counter measurements, remained within a similar range during the study. However, elevated mass concentrations coincided with a festival in the community of Tuktoyaktuk, suggesting local human activity was an important source of aerosol particles. Mass concentrations of PM2, which promote negative health effects in humans, were significantly lower at Tuktoyaktuk than the national air quality standard recommended by the government of Canada. These measurements provide an important baseline to compare with future measurements associated with the assessment of aerosol chemistry and air quality in the Arctic.
- Article
(11226 KB) - Full-text XML
-
Supplement
(952 KB) - BibTeX
- EndNote


Aerosols are suspensions of liquid and solid particles in the atmosphere resulting from direct emissions from natural and anthropogenic sources and physical transformations, such as condensation and nucleation (Finlayson-Pitts and Pitts, 2000; Seinfeld and Pandis, 2016). The concentration, size distribution, and chemical composition of aerosol particles vary significantly in the atmosphere because their sources are diverse and ephemeral in nature (Finlayson-Pitts and Pitts, 2000; Seinfeld and Pandis, 2016). The role of aerosol particles in the atmosphere is complex: they serve as short-lived climate forcers (Willis et al., 2018); provide reactive surfaces for heterogeneous chemistry (Newberg et al., 2005); and are vectors for the atmospheric transport (Wong et al., 2018) and post-depositional fate (MacInnis et al., 2019) of anthropogenic contaminants to and within remote Arctic environments, respectively.
In recent years, efforts have focused on understanding the source and chemical composition of aerosol particles in the Arctic, particularly within the context of climate change (Willis et al., 2018; Boy et al., 2019). Aerosol particle profiles vary on a seasonal basis near the surface in the Arctic. For example, the winter–spring period is characterized by high mass concentrations of accumulation mode aerosol particles primarily from anthropogenic sources (i.e., Arctic haze), with a chemical composition dominated by sulfate (SO) and black carbon (Sharma et al., 2017, 2019). However, natural sources of aerosol particles, such as mineral dust, have been identified in the Arctic during the winter–spring period (Dagsson-Waldhauserova et al., 2014, 2019; Bullard et al., 2016; Mackay and Burn, 2005). The summer is a period characterized by low mass concentrations of aerosol particles primarily associated with the Aitken mode and natural sources (Chang et al., 2011; Willis et al., 2018). Indeed, aerosol particles emitted from natural sources are important during the Arctic summer; however, it is anticipated that emissions from anthropogenic sources will increase as the Arctic responds to climate warming (Willis et al., 2018). An important consequence of climate warming is decreasing sea ice coverage, which promotes local warming through positive-feedback albedo interactions, cloud and fog formation, the ocean–atmosphere exchange of aerosol particles and nucleation gases, and anthropogenic activities related to shipping and the exploration of minerals and fossil fuels (Willis et al., 2018; Abbatt et al., 2019; Boy et al., 2019). Enhancements in summertime pollution promoted by anthropogenic activity may have an effect on the role of aerosol particles as climate forcers in the Arctic. For example, while it has been suggested that cooling is an ultimate effect of aerosol particles in the Arctic atmosphere, increasing emissions of black carbon from anthropogenic activities may contribute to Arctic warming through aerosol–radiation interactions (Willis et al., 2018). Changes in the chemical composition of aerosol particles may also affect their hygroscopicity and atmospheric fate as cloud condensation nuclei, contributing to heating and cooling effects through aerosol–cloud interactions (Willis et al., 2018). The overall net impact of aerosol particles as short-lived climate forcers in the Arctic is unknown; however, increasing aerosol particle emissions are expected to have an impact on local air quality in the Arctic.
The size and chemical composition of aerosol particles have important implications for human health. In particular, aerosol particles with diameters less than or equal to 2.5 µm (referred to as PM2.5) can accumulate in human lungs. These particles have been associated with a number of diseases in humans, such as bronchitis, asthma, and cardiovascular disease (Dominici et al., 2006; Wu et al., 2018). In response to these concerns, the World Health Organization established a guideline for PM2.5 of 25 µg m−3 (24 h average), which is suggested to be a level that minimizes risks to human health (World Health Organization, 2018). A similar guideline was established for PM2.5 by the federal government of Canada (Canadian Ambient Air Quality Standard of 27 µg m−3) (Environment and Climate Change Canada, 2018), although current research is exploring the effects of aerosol particle exposure at lower concentrations (Brauer et al., 2019; Christidis et al., 2019; Pappin et al., 2019). For instance, several studies have noted that lower PM2.5 mass concentrations (5 µg m−3) have been associated with non-accidental death (Brauer et al., 2019; Pappin et al., 2019). Furthermore, the chemical components associated with PM2.5 may be deleterious to human health, as it has been suggested that long-term exposure to various ions and metals in PM2.5, including SO, nitrate (NO), potassium (K), iron (Fe), zinc (Zn), and silicon (Si), is associated with annual ischemic heart disease mortality in humans (Ostro et al., 2010).
Currently, the Arctic atmosphere is characterized by low concentrations of aerosol particles in the summer (Willis et al., 2018); however, it has been predicted that the chemical composition and magnitude of aerosol particle concentrations will change in the future as a result of climate change (Browse et al., 2013; Gilgen et al., 2018; Willis et al., 2018; Abbatt et al., 2019), which may have important implications for aerosol–radiation and aerosol–cloud interactions in the Arctic (Croft et al., 2019; Murray et al., 2021; Sanchez-Marroquin et al., 2020). In this study, the chemical composition and concentration of aerosol particles were determined in the western Canadian Arctic during the Year of Polar Prediction (YOPP) Second Special Observing Period in 2018. The YOPP was an international collaboration led by the World Meteorological Organization designed to improve weather and sea ice forecasting and environmental prediction through the implementation of intensive and modeling campaigns in polar regions (https://www.polarprediction.net/, last access: 21 September 2021). This work is a contribution to the YOPP, as the measurement of aerosol properties in the Canadian Arctic provides a baseline for future predictions of aerosol particle concentration and composition in this region.
2.1 Study area and sample collection
Tuktoyaktuk, NT, Canada (69.45∘ N, 133.04∘ W), located at 5 m above sea level, is a hamlet bordering the Amundsen Gulf region of the eastern Beaufort Sea, and the latter is generally ice-covered during October–June (Herenz et al., 2018). The hamlet has a population of 982 (2018) and is accessible primarily via Inuvik–Tuktoyaktuk Highway (an unpaved, gravel road) or the local airport (Fig. 1). Tuktoyaktuk experiences a subarctic climate (Köppen climate classification) characterized by long, cold winters and brief, mild summers. The average annual temperature and total annual precipitation are less than 0 ∘C and 300 mm, respectively (Herenz et al., 2018).

Figure 1Location of the sampling site at the Aurora College Community Centre and the local airport in Tuktoyaktuk. Inset map shows the locations of Tuktoyaktuk and potential regional sources of aerosol particles, including the Smoking Hills and Banks Island in Canada, Prudhoe Bay Oil Field in Alaska, and the Arctic and Pacific oceans. Map source: Toporama (Natural Resources Canada). Note the geographic assignment of locations shown in the inset map is approximate.
Fine (PM2.5) and coarse (PM10–2.5) aerosol filter samples were collected from Tuktoyaktuk using an AirPhoton SS4i air sampler (AirPhoton, Baltimore, USA, https://www.airphoton.com/, last access: 21 September 2021), as described previously (Snider et al., 2015), from 18 July to 12 September 2018. Briefly, air is drawn into the inlet of this assembly system by a vacuum pump, and large particles (i.e., greater than 10 µm) are collected on a greased impaction plate. The sampled air then passes through a porous membrane (Nuclepore®, Whatman, 8 µm pore size) for the collection of PM10–2.5, followed by a polytetrafluoroethylene (2 µm pore size) filter for the collection of PM2.5. This assembly can accommodate eight filter units, which were gravimetrically weighed before and after the sampling period using a Sartorius ultramicro balance in a cleanroom with controlled relative humidity (32±12 %) and temperature (20.9–21.0 ∘C) at Dalhousie University. Due to a file-writing error during the study, the sample volume could not be determined, and only the absolute mass collected on the filters is provided. We acknowledge this is a limitation of our study; however, the chemical composition of these samples remains of interest, as it is relevant to our understanding of the atmospheric fate of aerosol particles, particularly during the Arctic summer in which existing measurements are scarce (Chang et al., 2011; Sierau et al., 2014; Tremblay et al., 2019).
Aerosol particles were sampled in situ using a GT-526S Handheld Particle Counter (Met One Instruments, Inc., Oregon, USA) from 24 July to 13 September 2018. The instrument was calibrated by the manufacturer before the study and sampled ambient air through an inlet line that was less than 1 m in length. This unit contains six channels that simultaneously measure aerosol particles binned by diameter with lower limits of 0.3, 0.5, 1, 2, 5, and 10 µm, allowing the aerosol mass distribution to be characterized. Sample collection was performed every 10 min at a flow rate of 2.8 L min−1 during the study period.
The instruments in this study were collocated and mounted approximately 3.5 m above ground level (m a.g.l.) at the Aurora College Community Centre (ACCC) in Tuktoyaktuk. The ACCC is located near residential and institutional buildings, a beach, and an unpaved road (all < 100 m from the site). Potential local sources of aerosol particles at the site may include dust (e.g., beach sand, road and mineral particles), as well as marine and combustion aerosol particles resulting from natural and anthropogenic activities (e.g., sea spray and vehicle traffic). The ACCC could also be influenced by regional sources in northern Canada and the United States. For example, emissions from the ignition of lignite in the Smoking Hills and a migratory bird colony on Banks Island are possible sources of natural aerosol particles and gases, whereas emissions from the Prudhoe Bay Oil Field could be an anthropogenic source of aerosol particles and gases (Fig. 1). This site was selected for this study to represent a northern coastal community that was undergoing increased human activities (due to recent road access via the Trans-Canada Highway).
2.2 Laboratory analysis
Aerosol filter samples were extracted and analyzed for ions and metals (Snider et al., 2015) at Dalhousie University in 2019. Before extraction, a ceramic blade was used to cut filters in half. One-half of the filter was used for the analysis of water-soluble ions, including fluoride (F−), chloride (Cl−), bromide (Br−), nitrite (NO), NO, SO, phosphate (PO), lithium (Li+), sodium (Na+), K+, ammonium (NH), calcium (Ca2+), and magnesium (Mg2+), which were extracted using 3 mL of distilled water/isopropyl alcohol (4 %) and ultrasonication. Water-soluble ions were separated by a Dionex ICS-1000 ion chromatograph and analyzed by conductivity detection. The other half of the filter was subjected to acid digestion using 3 mL of 10 % nitric acid (HNO3) to extract metals, including Li, Mg, aluminum (Al), Fe, uranium (U), silver (Ag), barium (Ba), arsenic (As), Si, vanadium (V), chromium (Cr), manganese (Mn), cadmium (Cd), nickel (Ni), copper (Cu), Zn, antimony (Sb), cerium (Ce), lead (Pb), cobalt (Co), titanium (Ti), phosphorous (P), and selenium (Se). Metals were analyzed by inductively coupled plasma mass spectrometry (ICP-MS, Thermo Scientific X-Series 2). Further details related to the extraction and analysis of filters can be found elsewhere (Snider et al., 2015).
2.3 Quality assurance and quality control
Field blanks were used to investigate contamination introduced during the sampling and transport of filters in this study. Field blanks in this study were filters that were transported to the field site but were not deployed and were returned to the laboratory for analysis concurrently with samples. Procedural blanks were used to investigate contamination introduced during extraction. These blanks consisted of the same analytical reagents used to extract filter samples but without the aerosol filter matrix. Due to the brief sampling period in this study (i.e., estimated at 3 h for each filter), the chemical mass of ions and metals in aerosol particle filter sample extracts was low and often estimated through extrapolation. We fully acknowledge that this practice introduces uncertainty into the quantitative assessment of ions in metals in aerosol particle filter samples and related analyses (Sect. 3.2). However, all reported masses are above the instrument detection limit (IDL). In addition, the chemical masses of ions and metals reported in this study were subjected to screening to account for their presence in procedural and field blanks (United States Environmental Protection Agency, 2016), pursuant to protocols implemented by the US Environmental Protection Agency (EPA): (1) if the analyte is detected in all field and procedural blanks (i.e., at masses equal to or greater than the IDL), then the detection limit is defined as the mean mass of analyte in blanks plus 3 times the standard deviation (SD) of masses in the blanks; (2) if some, but not all, blanks contain analyte, then the detection limit is assigned to the highest mass observed in the blanks; or (3) if the analyte is not detected in the blanks, then the detection limit is assigned to the IDL. The reported mass of ions and metals in filter samples is not blank subtracted (Supplement, Table S1). Although the magnitude of chemical mass reported in this study may carry uncertainty, the intention of this dataset is to provide a first assessment of the summertime chemical composition of aerosol particles in a relatively underreported region of the Canadian Arctic.
2.4 Data analysis
The absolute mass of ions and metals on filters was calculated by multiplying extract concentrations (µg mL−1 or n mL−1) by the extraction volume (3 mL) and a factor of 2 to determine the mass of ions and metals on the entire filter. A mass reconstruction analysis was performed to estimate contributions by ions, metals, and particle-bound water to the total gravimetric mass, as described in the Supplement (Table S2). It was assumed that NO and SO were neutralized by NH; however, we recognize that it is possible NO and SO were associated with other species, depending on their source and atmospheric fate (e.g., NaNO3 produced from the acid displacement reaction with NaCl and HNO3). Similarly, there is uncertainty related to the hypothesis that the source of Cl− in aerosol filter samples is limited to the ocean (i.e., NaCl component in Table S2), particularly due to the analytical challenges associated with the quantification of Na+ in our samples. Nevertheless, we assumed that all Cl− in aerosol filter samples originated from marine aerosol particles for the purpose of this mass reconstruction estimate. Data from 27 August were not included in the calculation determining the average mass reconstruction profile for PM2.5 because the chemical mass sampled was larger than the gravimetric mass. Discrepancies between the total gravimetric mass and measured chemical mass of aerosol filter samples could be attributed to untargeted species (e.g., organics, other ions and metals), analytical uncertainties, and/or losses of volatile species from filters during transport and laboratory analysis.
Air mass back trajectories were calculated using HYSPLIT (National Oceanic and Atmospheric Administration, https://www.ready.noaa.gov/HYSPLIT_traj.php, last access: 21 September 2021) to understand the source of ions and metals in aerosol filter samples. Air mass back trajectories were calculated over 120 h using Global Data Assimilation System (GDAS) meteorology, setting the heights at the same location (end of parcel trajectory) to be 50, 200, and 400 m a.g.l. (Figs. S1 and S2). Available instrument log files suggest that sampling occurred once every 8 d from 06:00 to 09:00 local time. Therefore, 09:00 was used as an end point for air mass back trajectory analysis.
Aerosol particle mass concentrations were estimated from measured aerosol particle number concentrations according to Eq. (1):
where CMass is aerosol particle mass concentration (µg m−3); CNum is the aerosol particle number concentration measured by the particle counter (cm−3); dp is the geometric mean diameter of aerosol particles in a given size bin (cm); and ρp is aerosol particle density, which was assumed to be 1.8 g cm−3 (Sharma et al., 2017). PM2 and PM10 mass concentrations were calculated as the sum of mass concentrations in 0.3–2 and 0.3–10 µm size bins, respectively.
Meteorological data, including temperature, wind speed and direction, atmospheric pressure, and relative humidity, were retrieved from historical climate archives (Environment and Climate Change Canada, 2020) for the Tuktoyaktuk airport during the study (Fig. S3).
3.1 Aerosol filter masses
The fine (PM2.5, mean ± SD 15 ± 9 µg, median 15 µg), coarse only (PM10–2.5, 14 ± 4 µg, median 14 µg), and total coarse (PM10, 29 ± 10 µg, median 26 µg) aerosol filter masses were similar during the study period, with notable variability (Fig. 2). For instance, the masses range from 2.6–31, 7.3–22, and 17–44 µg in PM2.5, PM10–2.5, and PM10, respectively. Snider et al. (2016) also reported that masses of PM2.5 (median 72 µg, lower–upper quintiles 42–131 µg) and PM10–2.5 (median 90 µg, lower–upper quintiles 44–154 µg) were comparable in filter samples collected across a global network of sites (i.e., Surface Particulate Matter Network, SPARTAN) using an AirPhoton sampler, although the exact distribution is site-specific. For instance, comparable masses of PM2.5 and PM10–2.5 are not unexpected, considering coarse aerosol particle emissions are likely transient in nature (i.e., from local sources), and they may not have been sampled during the brief sampling period in this study. This is further supported by the mass distribution of fine and coarse aerosol particles measured by the particle counter, where the mass fraction of fine aerosol particles was occasionally higher than the mass fraction of coarse aerosol particles (Fig. S4). However, PM10 masses in this study were always greater than PM2.5 masses, as expected.
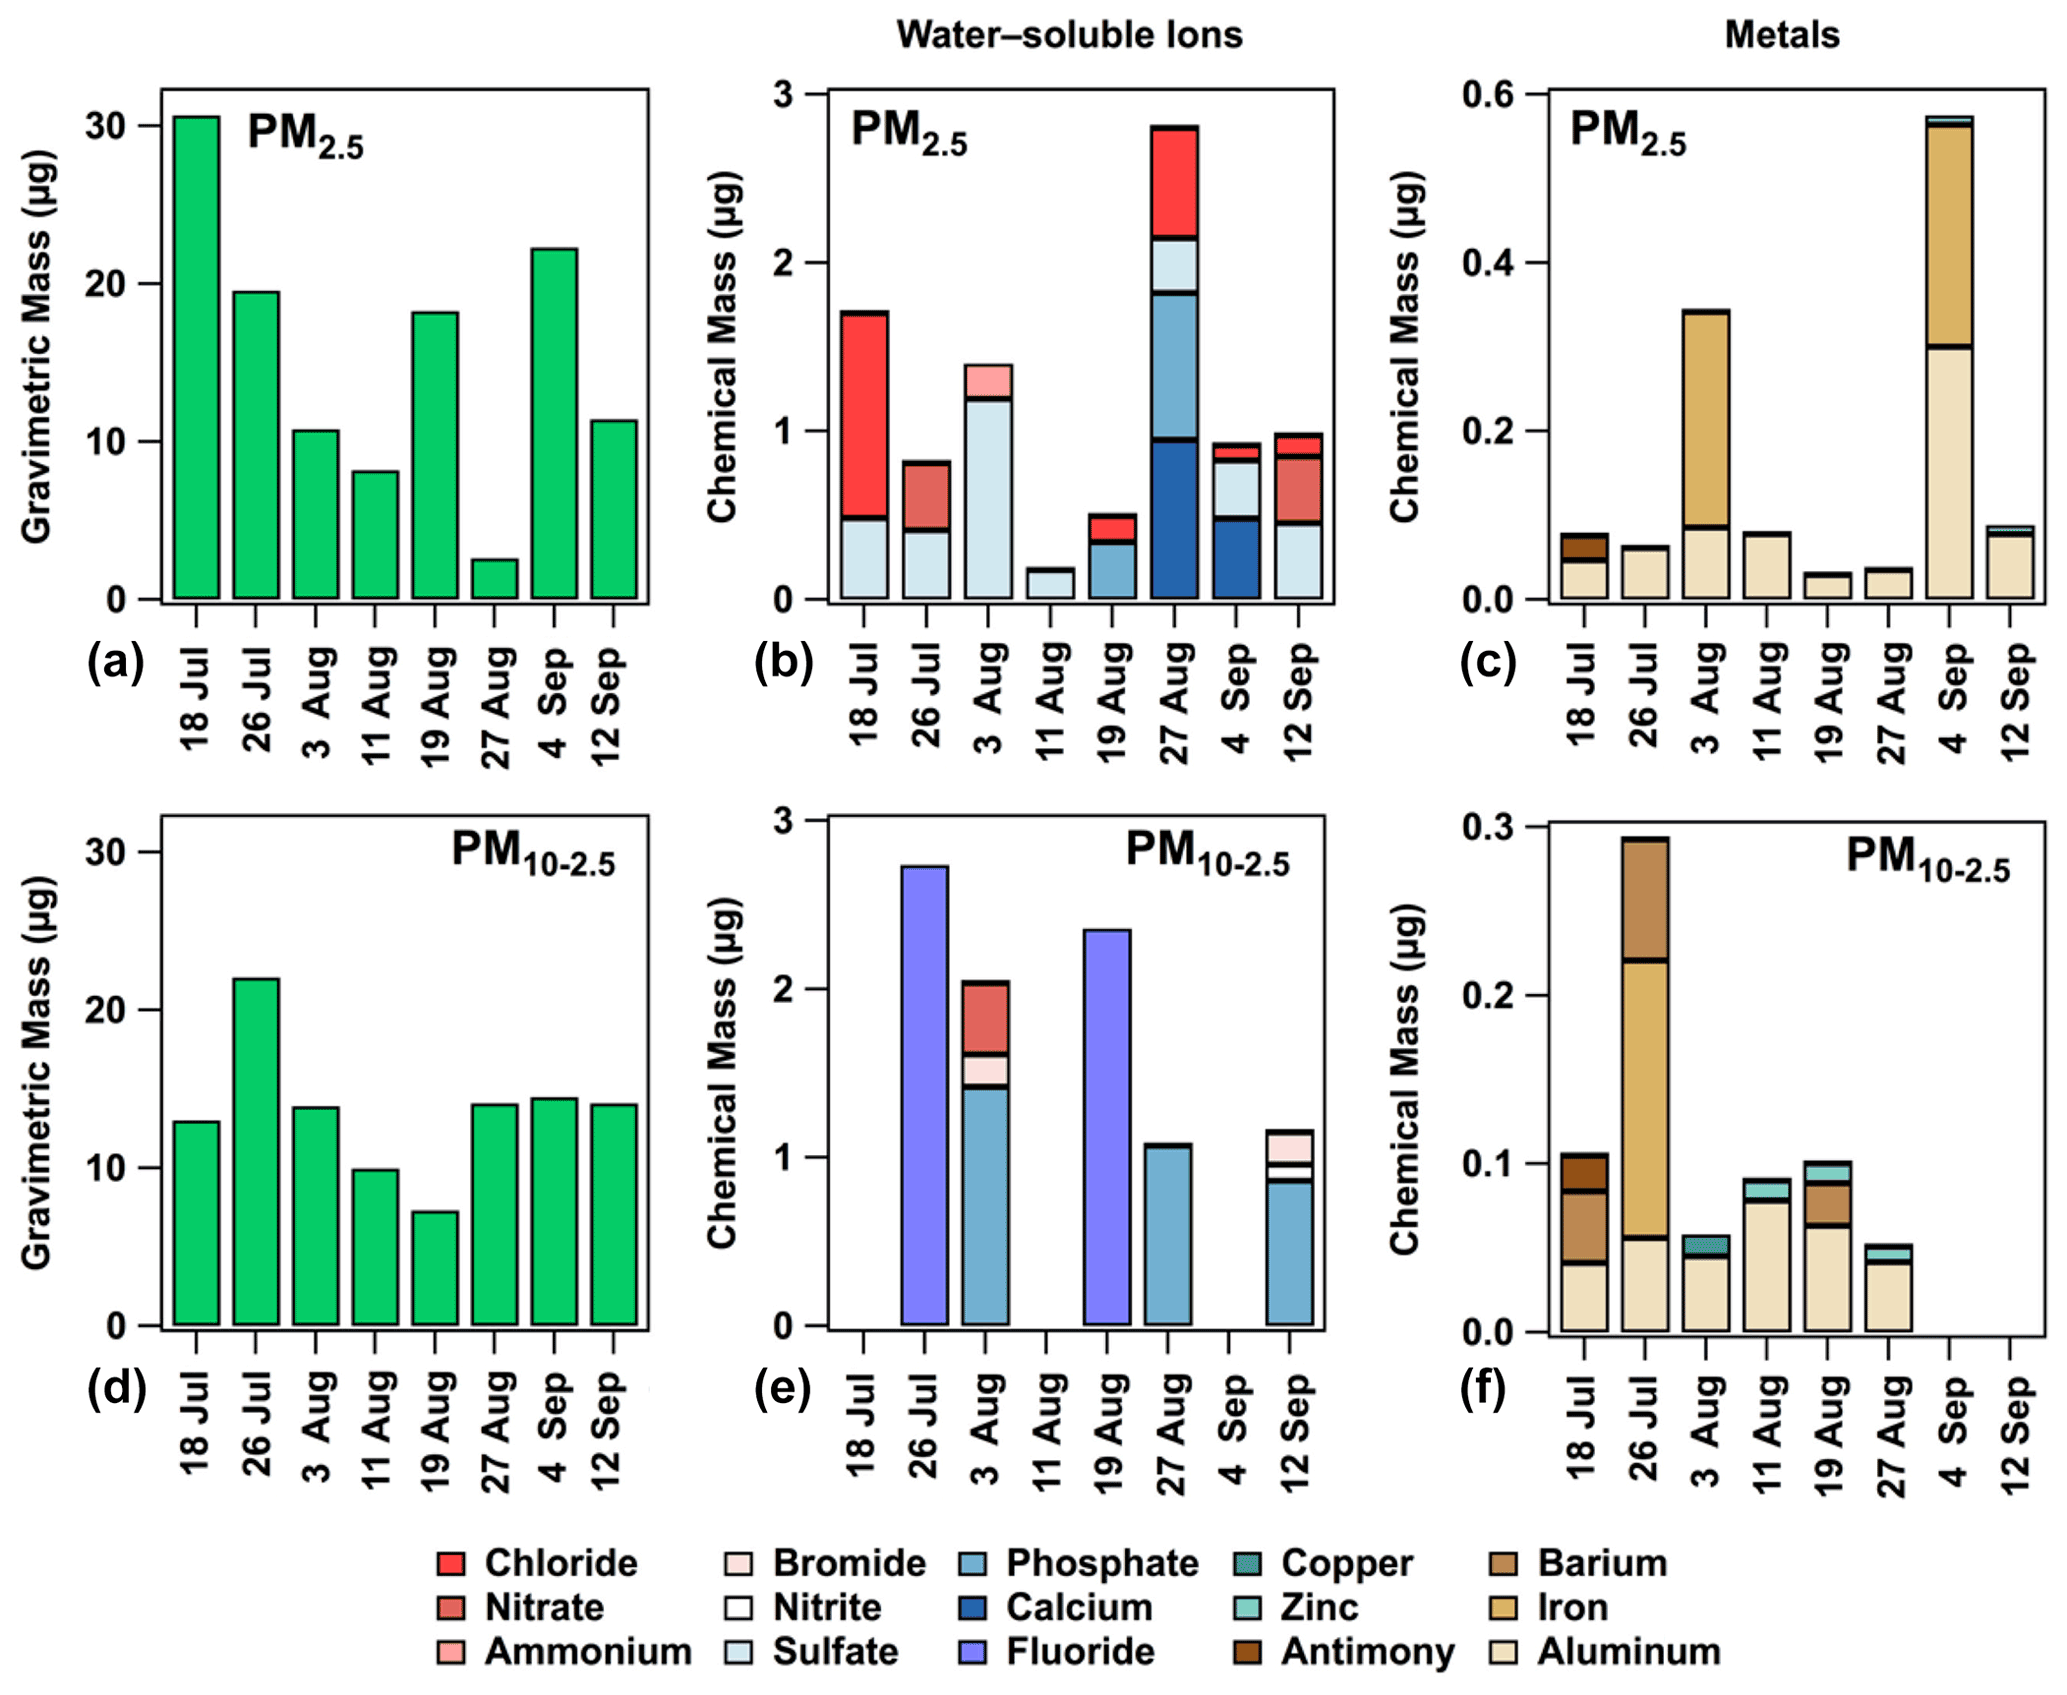
Figure 2A summary of the gravimetric mass (a, d) and chemical mass of ions (b, e) and metals (c, f) in fine (PM2.5) and coarse (PM10–2.5) aerosol filter samples (a–c and d–f, respectively) from Tuktoyaktuk during July–September 2018.
It was expected that the size distribution of aerosol particles (e.g., coarse mineral dust vs. fine combustion aerosol particles) and local meteorology could have affected the magnitude of filter masses during the study. For example, it is possible that warmer temperatures on 26 July (Fig. S3) may have enhanced local emissions of coarse aerosol particles through heating and convection, contributing to a high PM10–2.5 mass, while precipitation (i.e., drizzle, rain, and snow), which was observed at the airport before and during sampling events (Fig. S5), could have reduced atmospheric loads through the action of scavenging aerosol particles and gases.
3.2 Chemical composition of aerosol filters
The detection frequencies for metals in aerosol filter samples were often low and/or variable, such as those observed for Ag, Ba, Cu, Sb, Ti, and Zn (Table S1). In contrast, Al was detected in 100 % and 75 % of PM2.5 and PM10–2.5 samples, respectively. Interestingly, some metals were detected only in PM2.5, while others were detected only in PM10–2.5. For example, Ti was detected only in PM2.5, whereas Cu, Ag, and Ba were detected only in PM10–2.5, suggesting the latter metals may have been from local sources given their shorter atmospheric lifetime due to gravitational settling. Al and Fe were the metals measured in the highest quantities in aerosol filter samples (Fig. 2).
The detection frequencies for water-soluble ions in aerosol filter samples were generally low and variable (Fig. 2). SO and Cl− were found in most PM2.5 samples, with detection frequencies of 87 % and 62 %, respectively, whereas NO was detected only in 25 % of PM2.5 samples. Similarly to metals, several water-soluble ions were detected only in select aerosol filter samples. For example, F−, NO, and Br− were detected only in PM10–2.5, suggesting a local source, whereas Cl−, SO, NH, and Ca2+ were detected only in PM2.5. The highest quantities of water-soluble ions in aerosol filter samples were observed for F−, Ca2+, PO, and Cl− (Fig. 2).
Similarly to other Arctic regions (Fig. 3), Al and Fe, which have been linked to mineral dust emissions (Liberda et al., 2015; Ferrero et al., 2019), dominated aerosol filter samples at Tuktoyaktuk. In contrast, contributions from Ba and Sb to the total quantity of metals at Tuktoyaktuk were greater than in other Arctic regions, whereas Ti contributions from other Arctic regions were greater than those at Tuktoyaktuk (Landsberger et al., 1990; Kadko et al., 2016; Conca et al., 2019). It is important to note that metal profiles in Landsberger et al. (1990) and Conca et al. (2019) are based on data collected during winter–spring periods; therefore seasonal differences in aerosol particle sources in those studies may account for differences in composition profiles in comparison to Tuktoyaktuk (e.g., Arctic haze versus summertime sources). In addition, the studies compared in Fig. 3 do not always target the same ions and metals and/or face analytical challenges, preventing accurate reporting of data, which collectively could also contribute to chemical composition differences across sites. Ion composition profiles for aerosol filter samples at Tuktoyaktuk were notably different than in other Arctic regions (Leaitch et al., 2018; Ferrero et al., 2019), with the exception of the SO in PM2.5 at Tuktoyaktuk, whose composition profile was comparable to those found in aerosol particles from the Arctic Ocean and Ny-Ålesund (Fig. 3) (Ferrero et al., 2019). The ion composition profiles were dominated by Na+ and Cl− at Ny-Ålesund and the Arctic Ocean and by SO at Alert (Leaitch et al., 2018; Ferrero et al., 2019). Na+ and Cl− have been linked to marine aerosol particle emissions, while SO has been linked to anthropogenic combustion and natural sources (Leaitch et al., 2018; Ferrero et al., 2019).

Figure 3Composition profiles of ions (a) and metals (b) in aerosol filter samples at Tuktoyaktuk and other Arctic regions. Average composition profiles are shown for aerosol filter samples at Tuktoyaktuk. Only ions and metals that are equal to or greater than the detection limit in this study are included in this figure. Several elements in Landsberger et al. (1990, denoted with superscript 3 in the figure) (Ca, Cl, Na), Conca et al. (2019, superscript 4) (Mg, K, Na, Ca), and Kadko et al. (2016, superscript 5) (Na, Mg) were detected in aerosol particles; however, they are not included in this figure to enable comparisons with trace metal composition profiles. Data shown for Leaitch et al. (2018, superscript 7), Kadko et al. (2016, superscript 5), Ferrero et al. (2019, superscript 6), Landsberger et al. (1990, superscript 3), and Conca et al. (2019, superscript 4) correspond to sampling periods during 8 August 2014, 14 August 2011, 20 June to 12 August 2011–2012, 7–18 March 1985, and March to September 2010–2013, respectively.
High detection frequencies of Al in PM2.5 and PM10–2.5 filter samples suggest that mineral dust was a consistent source of aerosol particles at Tuktoyaktuk. It is possible that local mineral and/or road dust emissions were sources of aerosol particles in this region, although the mass of Al was comparable in PM2.5 and PM10–2.5 filter samples, which may not be an outcome expected from local dust emissions if the size distribution of precursor particles (beach sand, soil, road dust) is coarse (i.e., higher mass expected in PM10–2.5). Furthermore, it has been suggested that giant mode (dp > 40 µm) and saltation mode (3 ≤ dp≤6 µm) mineral dust aerosol particles are primarily produced from soils (Saltzman, 2009). This could suggest that in addition to local sources, the presence of Al in filter samples was attributable to mineral dust emissions and atmospheric transport from other, high-latitude regions within the Arctic (Crocchianti et al., 2021; Mackay and Burn, 2005). For example, it is possible that aerosol filter samples on 18 and 26 July (Fig. S1) were influenced by active dust sources near the North Slope of Alaska (https://maps.unccd.int/sds/, last access: 21 September 2021).
It is noteworthy that other metals characteristic of mineral dust, such as Fe and Ti, were detected less frequently in filter samples (Table S1), suggesting they had different sources. Interestingly, the highest mass of Al, Ti, Fe, and Zn in PM2.5 filter samples was observed on 4 September, and air masses during this period originated from the north and traveled in northwesterly directions, over the ocean. Other air mass trajectories originating from west and northwesterly directions (i.e., Alaska and Russia) were observed on 18 and 26 July and 19 August (Figs. S1 and S2), and filter samples during these periods contained Ba, Ag, and Sb. It is possible that these air masses were influenced by emissions from the Prudhoe Bay Oil Field and mining activities in Alaska, Russia, and Canada during these periods (Alaska Miners Association, 2020; Government of Canada, 2018; European Environment Agency, 2017). However, local emissions from combustion and natural or anthropogenic dust (e.g., road dust containing tire wear and mineral and/or soil particles) (Snider et al., 2016; Crocchianti et al., 2021; Mackay and Burn, 2005) cannot be precluded as sources of Al, Fe, Ti, Zn, Ba, Ag, and Sb in filter samples.
It is interesting that Cl− was detected only in PM2.5 while Br− was detected only in PM10–2.5 filter samples since Cl− and Br− have been measured in seawater from the Canadian Arctic Archipelago (Xu et al., 2016). Although the ACCC is a coastal site, surface meteorology records from the airport (Fig. S3) indicated that local wind speeds were often below 4 m s−1 (e.g., 26 July, 19 and 27 August, 12 September), which has been suggested as a threshold wind speed for whitecap formation (O'Dowd and de Leeuw, 2007). However, a marine influence was expected on 3 and 11 August and 4 September, since wind speeds were greater than 4 m s−1 and originated from northwesterly and easterly directions (Fig. S3). If the presence of Br− in PM10–2.5 filter samples was attributed to marine aerosol particles, then Cl− should have also been present based on the molar composition of Cl− and Br− in seawater from the Canadian Arctic Archipelago (Xu et al., 2016). On the other hand, it is important to consider that the absence of Br− in PM2.5 filter samples could be related to analytical challenges because the mass of Br− expected in PM2.5 filter samples, based on the molar composition of Cl− and Br− in seawater from the Canadian Arctic Archipelago (Xu et al., 2016), is below the detection limit in this study. It is unlikely that the absence of Cl− in PM10–2.5 filter samples can be explained by acid displacement reactions, considering it has been suggested that Cl− depletion decreases with increasing aerosol particle size (Yao et al., 2003). Thus, these observations suggest that Cl− and Br− were from different sources. In addition to marine sources, Cl− and Br− can originate from biomass burning. Keene et al. (2006) identified hydrochloric acid (HCl), chlorine (Cl2), hypochlorous acid (HOCl), bromine (Br2), and hypobromous acid (HOBr) as products of biomass burning, which could have been the source of either Cl− measured in the fine mode or Br− measured in the coarse mode at Tuktoyaktuk. While we are unable to confirm this source in our study, it is conceivable that biomass burning in northern Canada was a possible source of aerosol particles at Tuktoyaktuk (e.g., 27 August, Fig. S2).
It is challenging to identify sources of ions and metals in aerosol filter samples, especially when they are emitted from various sources in the environment (Jayarathne et al., 2014; Leaitch et al., 2018; Willis et al., 2018). For instance, it is likely that ions and metals originated from continental and marine sources in this study, pursuant to air mass back trajectory analysis during the study period (Figs. S1 and S2). One strategy that can be used to better constrain continental and marine sources is to compare known ratios of ions and metals in soils and seawater to those found in aerosol filter samples. As an example, the molar ratios of Fe Al and Cl− SO in PM2.5 from Tuktoyaktuk are compared to those found in Icelandic soils (Đorđević et al., 2019) and seawater from the Canadian Arctic Archipelago (Xu et al., 2016), respectively. The molar ratio of Fe Al in Icelandic soils is 0.9, and this ratio is within the range of those observed in aerosol filter samples from Tuktoyaktuk (0.4–1.4). This result further supports the hypothesis that Fe and Al could originate from mineral dust. In contrast, the molar ratio of Cl− SO in Arctic seawater is 27, which is higher than those in PM2.5 from Tuktoyaktuk (0.7–6.8). Lower molar ratios of Cl− SO in aerosol filter samples could be attributed to non-oceanic sources of SO (i.e., natural and anthropogenic combustion sources). For example, SO in PM2.5 at Tuktoyaktuk may have originated from natural sources, such as the biogenic emission and subsequent oxidation of dimethyl sulfide from the ocean (Bates et al., 1987). In addition, sulfur emissions from the Prudhoe Bay Oil Field and the ignition of lignite in the Smoking Hills (Radke and Hobbs, 1989) were likely sources of SO in PM2.5 at Tuktoyaktuk, according to air mass back trajectories (Figs. S1 and S2). Another source of SO in PM2.5 at Tuktoyaktuk may include anthropogenic emissions from the combustion of fossil fuels (e.g., vehicles, aircraft, boats) (Leaitch et al., 2018; Willis et al., 2018). Other ions characteristic of combustion were also identified in aerosol filter samples from Tuktoyaktuk, such as NO and NH, possibly from the emission and oxidation of nitrogen oxides (NOx) and emissions of ammonia during fossil fuel combustion from local, regional (e.g., Prudhoe Bay Oil Field), and long-range sources. However, ammonia emissions in the Arctic have also been associated with natural sources, such as soil (Wentworth et al., 2016) and guano (Croft et al., 2016a; Wentworth et al., 2016), which could account for NH in aerosol filter samples at Tuktoyaktuk, particularly on 3 August because NH was detected in air masses that traveled near a bird colony on Banks Island before arriving at the ACCC (Fig. S1). It is important to consider that lower molar ratios of Cl− SO in PM2.5 filter samples from Tuktoyaktuk could also be attributed to Cl− depletion from marine aerosols via acid displacement (Newberg et al., 2005). For example, it is possible that HNO3 and sulfuric acid (H2SO4) displaced Cl− in PM2.5 from Tuktoyaktuk (Laskin et al., 2012), particularly since NO and SO were detected in aerosol filter samples that were devoid of Cl− (i.e., 26 July–11 August). Although the organic composition of aerosol filter samples was not characterized in this work, it is important to consider that organic acids (Laskin et al., 2012) may have also contributed to Cl− depletion in aerosol filter samples.
A mass reconstruction analysis was conducted to estimate contributions from ions and metals to the total gravimetric mass (Bari and Kindzierski, 2017). The average mass reconstruction profile for PM2.5 indicates that contributions from marine and mineral dust sources collectively accounted for 43 % of the total known chemical mass (i.e., NaCl and mineral dust components), while contributions from (NH4)2SO4 and NH4NO3 collectively accounted for 31 % of the known chemical mass (Fig. 4). Lower contributions were observed for metals and particle-bound water, collectively accounting for 6 % of the total known mass in PM2.5 filter samples. In contrast, the average mass reconstruction profile for PM10–2.5 was dominated by NH4NO3 and unclassified inorganic ions (i.e., combined masses of F−, Br−, PO, and NO; Table S2), which collectively accounted for 93 % of the total chemical mass. This analysis suggests that marine, mineral dust, and combustion sources were important in this region; however, the source of PO and F−, which were major components of the unclassified inorganic fraction of aerosol particle filter samples, could not be identified. The sources of these ions are interesting because PO and F− have not been previously identified in aerosol particles from the Arctic (Fig. 3). We acknowledge that it is possible that the detection of F− could be related to laboratory contamination; however, the reported masses in this study are equal to or greater than the detection limit (i.e., mean + 3 SD of blank masses). It is challenging to assign sources to PO and F− because they are released from multiple sources in the environment, such as emissions from volcanos, mineral dust, combustion, and marine aerosol particles (Jayarathne et al., 2014; Vet et al., 2014). It is also challenging to assign sources to F− because one of its gas-phase precursors (i.e., hydrofluoric acid, HF), emitted during smelting activity, coal combustion, and volcanic activity (Jayarathne et al., 2014), may partition into aerosol particles in the Arctic atmosphere. While there is uncertainty associated with the source of PO and F− in aerosol filter samples, the back trajectories suggest that air masses containing PO traveled primarily over the ocean, whereas air masses containing F− traveled over the ocean and land (Figs. S1 and S2). These observations suggest that marine, mineral, and combustion aerosol particles are possible sources of PO and F− at Tuktoyaktuk.

Figure 4Average mass reconstruction profiles of fine and coarse aerosol filter samples at Tuktoyaktuk during July–September 2018. Several ions measured in this study (F−, Br−, PO, NO) are collectively included here as unclassified inorganic components due to uncertainties associated with their sources in the environment.
In addition to uncertainties associated with the unclassified inorganic fraction, a substantial fraction of mass on aerosol filter samples could not be identified. For instance, the average chemical mass accounted for only 10 % and 12 % of the total gravimetric mass in PM2.5 and PM10–2.5 filter samples, respectively (Fig. S6). Discrepancies between the total gravimetric mass and chemical mass of aerosol filter samples could be attributed to analytical uncertainties, the loss or gain of volatile species from filters after sampling (Saltzman, 2009), and/or contributions from untargeted chemical components. For example, it is possible that other inorganic ions and metals, organic material, and black carbon were components of aerosol particles at Tuktoyaktuk, pursuant to the chemical composition of aerosol particles in other Arctic regions (Kadko et al., 2016; Leaitch et al., 2018; Conca et al., 2019; Ferrero et al., 2019; Sharma et al., 2019). Despite these uncertainties, our results indicate that there are substantial, uncharacterized chemical components that could not be identified in aerosol filter samples at Tuktoyaktuk.
The summertime composition profiles at Tuktoyaktuk may provide insights into the future chemical composition of aerosol particles in the Arctic. Our analysis indicates that mineral dust, marine, and combustion sources are important during the Arctic summer, particularly in the absence of snow cover and sea ice coverage. It is expected that emissions of these aerosol particles will increase as the Arctic responds to climate warming in the future. For example, it is expected that climate warming will enhance the melting of snowpacks and sea ice within the Arctic, promoting exposed landscapes and oceans and ship traffic (Willis et al., 2018). Our analysis also indicates that there are significant, unknown components of aerosol filter samples during the summer of 2018 at Tuktoyaktuk, which may influence the chemical properties of aerosol particles and their role in the Arctic troposphere (e.g., cloud condensation nuclei, radiative properties) (Martin et al., 2011; Herenz et al., 2018; Willis et al., 2018; Abbatt et al., 2019). For example, the unidentified components (e.g., organic components) are likely less hygroscopic than the soluble inorganics identified and would reduce the cloud condensation nuclei activity of the aerosol particles. This highlights the importance of improving understanding of the chemical composition of aerosol particles in the Arctic. It is important to emphasize that these results provide only a snapshot of the aerosol particles at Tuktoyaktuk and their representativeness is unknown.
3.3 Size distribution, temporal variability, and health implications of aerosol particles
The average number size distributions of particles larger than 0.3 µm were similar throughout the study, with particle number concentrations highest in the 0.3–0.5 µm bin (Fig. S7). The mass size distributions also remained similar throughout the study, with mass concentrations dominated by the 2–5 µm aerosol particles (Fig. S7).
Table 1An overview of mass concentrations for PM2, PM2.5, and PM10 at Tuktoyaktuk and other regions in Canada (Canadian Council of Ministers of the Environment, 2019) from 26 July to 13 September 2018. Population data for 2018 were retrieved from the Northwest Territories Bureau of Statistics (NWT Bureau of Statistics, 2020), the government of Nunavut (Government of Nunavut, 2019), and the Yukon Bureau of Statistics (Yukon Bureau of Statistics, 2019).
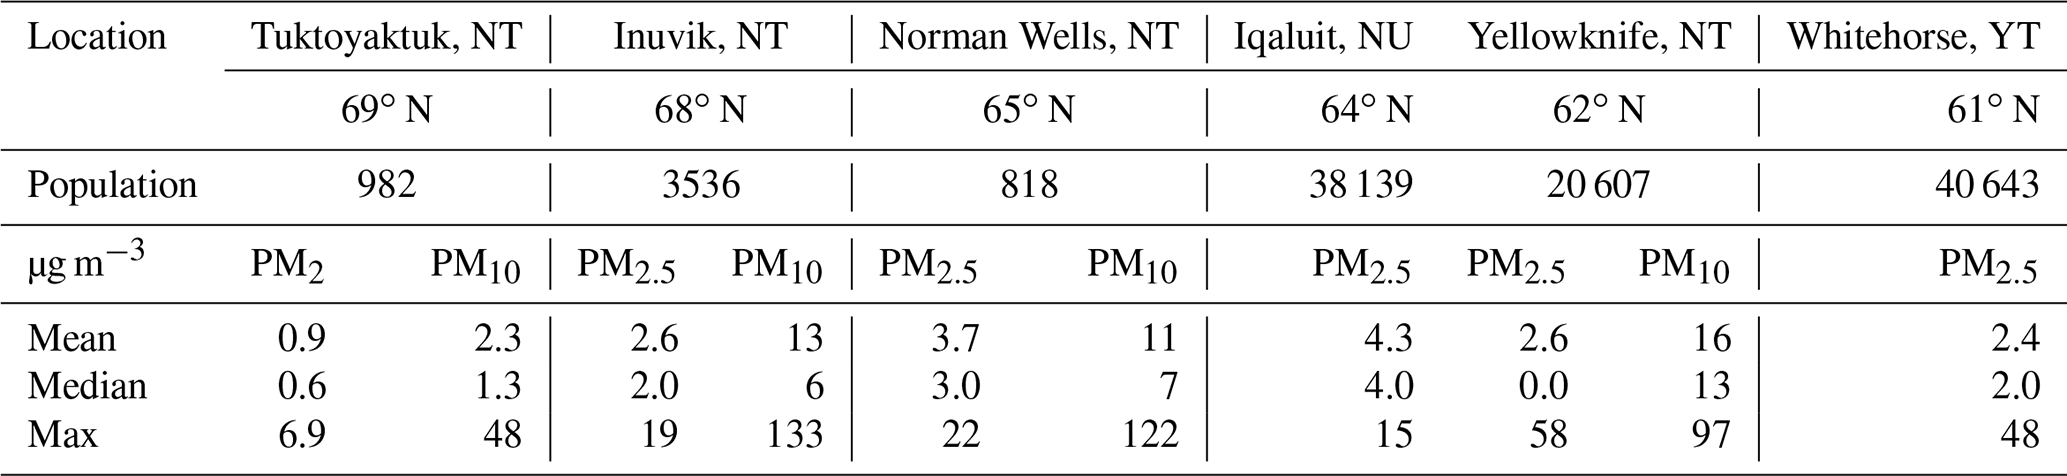
Total aerosol particle number concentrations of particles larger than 0.3 µm (Nd) in this study were low (1 h average, mean ± SD 6 ± 8 cm−3, median 3 cm−3). These relatively low concentrations are consistent with other observations during the Arctic summer (Willis et al., 2018) and may have been attributable to enhanced aerosol particle and nucleation gas scavenging by precipitation (Croft et al., 2016b). Aerosol particle mass concentrations for PM2.5 and PM10 were similar in regions of the Northwest Territories, Yukon Territory, and Nunavut (Canadian Council of Ministers of the Environment, 2019) but were higher than those observed for PM2 and PM10 at Tuktoyaktuk during July–September 2018 (Table 1). Although some measurements at Tuktoyaktuk are not directly comparable to those of other regions in Canada (i.e., PM2 vs. PM2.5), it is possible that the difference in the magnitude of aerosol particle mass concentrations could be attributed to differences in regional climate (i.e., precipitation) and aerosol particle sources. For instance, it is likely that Tuktoyaktuk is influenced by marine air masses to a greater extent than other sites listed in Table 1, which are generally located inland. Differences in regional populations/human activities could further promote differences in aerosol particle concentrations (e.g., enhanced vehicle traffic). It is interesting to note in Table 1 that relatively high aerosol particle mass concentrations were observed at Norman Wells despite its low population; however, this may be attributed to major crude oil and natural gas production in that region (Canada Energy Sector, 2020). The difference in the magnitude of aerosol particle mass concentrations may also be related to differences in sampling techniques. For example, one method used by the National Air Pollution Surveillance program to determine mass concentrations is filtration and beta attenuation (Canadian Council of Ministers of the Environment, 2019), whereas the method used here relies on aerosol particle number concentrations and estimations of aerosol particle density (Eq. 1). Despite these differences, these data indicate that aerosol particle concentrations were lower during the summer of 2018 at Tuktoyaktuk than in other regions in northern Canada.
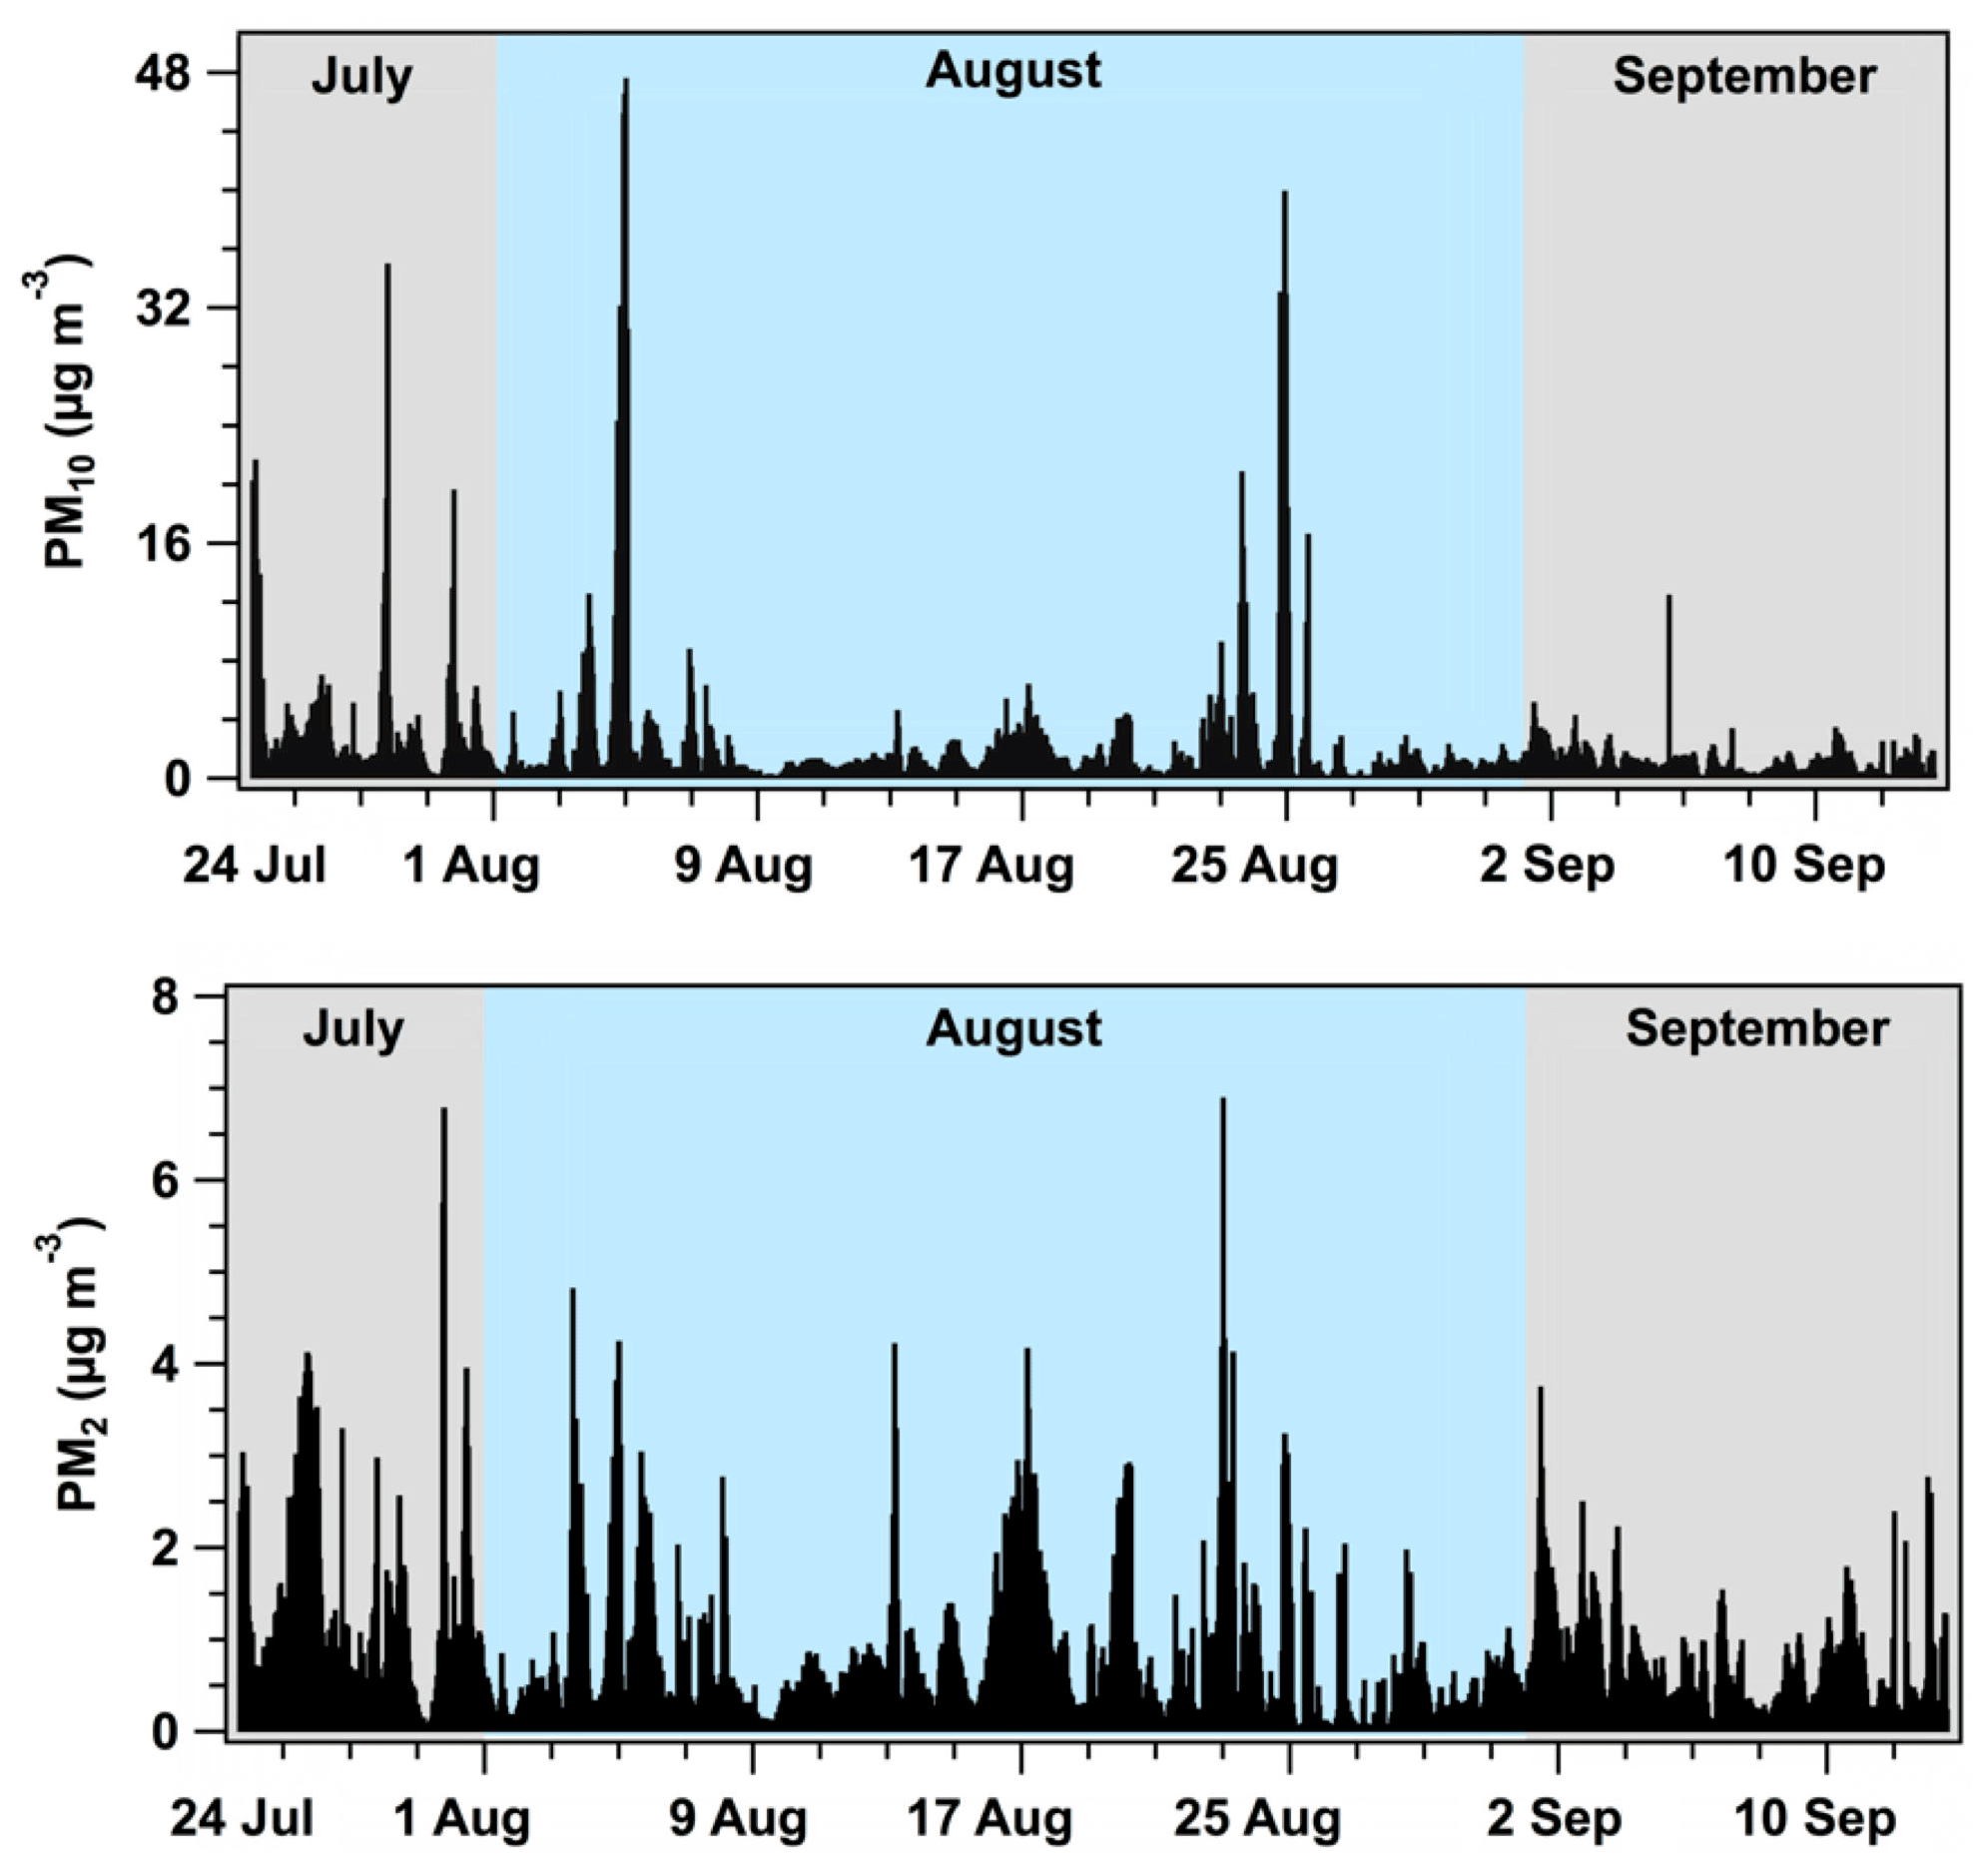
Figure 5Mass concentration profiles for PM2 and PM10 at Tuktoyaktuk during July–September 2018. The data are presented as 1 h averages (mountain daylight time), and each monthly period is demarcated by color.

Figure 6Box plot of diurnal aerosol particle mass concentrations (µg m−3) at Tuktoyaktuk during 24 July to 13 September 2018 (mountain daylight time). Average concentrations are denoted by red markers; median concentrations correspond to black lines within each box; and the lower and upper bounds of each box are the 25th and 75th percentiles, respectively.
A summary of the continuous aerosol particle mass concentrations during July–September 2018, calculated from the particle counter, is presented in Figs. 5 and 6. In general, the magnitude of mass concentrations remained within a similar range during July–September 2018, although there were notable increases in mass concentrations during 28–30 July, 3–6 August, and 22–24 August (Fig. 5). For example, the average PM10 concentration was 2.3 µg m−3 over the study period, whereas higher PM10 concentrations occurred on 28 July (35 µg m−3), 4 August (48 µg m−3), and 24 August (40 µg m−3). Although we are unable to confirm the source of aerosol particle emissions during these periods, it is conceivable that elevated mass concentrations could be attributed to local aerosol particle emissions from human activities at Tuktoyaktuk. For instance, elevated PM10 concentrations on 28 July may have been related to human activities that proceeded during the annual Land of the Pingos Musical Festival (e.g., barbecuing, increased vehicle traffic), which occurred during 27–29 July at Tuktoyaktuk. Similar human activities could also provide an explanation for elevated mass concentrations on 3–6 August, considering this period coincided with an extended civic holiday weekend.
Aerosol particle mass concentrations did not exhibit notable diurnality during the study (Fig. 6). Average mass concentrations were typically higher than median mass concentrations and exhibited notable variability in the 2–5 and 5–10 µm size bins, which was likely driven by enhanced aerosol particle emissions from local human activities at Tuktoyaktuk, as discussed previously (i.e., festival and weekend activities).
To assess the impact of fine aerosol particle emissions on local air quality, the mass concentration of PM2 at Tuktoyaktuk was compared to the Canadian Ambient Air Quality Standard. The concentration of PM2 was low at Tuktoyaktuk during July–September 2018, with 24 h average concentrations ranging from 0.2–3 µg m−3. These mass concentrations were very low in Tuktoyaktuk compared to the national PM2.5 standard (27 µg m−3).
The chemical composition of aerosol filter samples and concentration of aerosol particles from Tuktoyaktuk were determined during July–September 2018. Although our analysis could not identify distinct sources, the results suggest that this moderately sized community in the Canadian north was influenced by a wide range of aerosol particle sources with complex processes. The observed aerosol particles were likely derived from local natural sources like marine and mineral dust and anthropogenic sources like the combustion of fossil fuels and road dust, while emissions from the Prudhoe Bay Oil Field; the Smoking Hills; bird colonies on Banks Island; mining activities in northern Canada, Russia, and Alaska; and mineral dust from active source regions in the Arctic are possible regional sources of aerosol particles, pursuant to air mass back trajectory analysis (Figs. S1 and S2). We hypothesize that precipitation reduced atmospheric loads of aerosol particles and gases during the study, which is expected to have affected the magnitude of the gravimetric mass and chemical composition of aerosol filters at Tuktoyaktuk, and air temperature may have enhanced local emissions of coarse aerosol particles through daytime heating and convection. Our analysis indicates that there were significant, unknown components identified in aerosol filter samples during the summer of 2018 at Tuktoyaktuk, which may have influenced the atmospheric fate of aerosol particles in the Arctic troposphere. While the mass concentrations of PM2 were found to be significantly lower at Tuktoyaktuk compared to the Canadian Ambient Air Quality Standard, it is likely that their concentrations will increase in the future due to climate change, which is expected to promote increases in ship and air traffic in the Arctic as well as the number of ice-free days and natural emissions from open waters. Although these measurements represent only a snapshot of the aerosol particles at Tuktoyaktuk, they can nevertheless provide insights into the chemistry and concentration of aerosol particle samples, which can be used in the future to assess aerosol particle chemistry and air quality in the Canadian Arctic. Future work should focus on constraining possible sources of aerosol particles, such as acquiring time-resolved chemical mass spectra data and performing factor analysis (e.g., positive matrix factorization) and/or analyzing the chemical composition of local soils.
Quality-controlled aerosol filter chemistry and aerosol particle number concentrations are available through the Federated Research Data Repository (https://doi.org/10.20383/101.0269, Chang, 2021a and https://doi.org/10.20383/101.0278, Chang, 2021b).
The supplement related to this article is available online at: https://doi.org/10.5194/acp-21-14199-2021-supplement.
RCYW and DA were responsible for funding acquisition and conceptualized the research. JC and DA were responsible for data acquisition. JC and CW contributed to data curation. The formal analysis and visualization of data was performed by JM. JM and RYWC wrote the manuscript, with editorial feedback from all co-authors.
The authors declare that they have no conflict of interest.
Publisher’s note: Copernicus Publications remains neutral with regard to jurisdictional claims in published maps and institutional affiliations.
The authors thank George Hibbs for providing access to the sampling site, Nicole Chisholm for weighing filters, Brenna Walsh for helpful discussions, and Randall Martin and Jong Sung Kim for providing resources during deployment. This work was funded by the Marine Environmental Observation, Prediction and Response Network (MEOPAR); Polar Knowledge Canada; and the Canada Research Chairs Program. This is a contribution to the Year of Polar Prediction (YOPP), a flagship activity of the Polar Prediction Project (PPP), initiated by the World Weather Research Programme (WWRP) of the World Meteorological Organization (WMO). We acknowledge the WMO WWRP for its role in coordinating this international research activity.
This research has been supported by Polar Knowledge Canada (grant no. NST-1718-0001) and Canada Research Chairs (grant no. CRC-2013-00056).
This paper was edited by Drew Gentner and reviewed by Pavla Dagsson Waldhauserova and one anonymous referee.
Abbatt, J. P. D., Leaitch, W. R., Aliabadi, A. A., Bertram, A. K., Blanchet, J.-P., Boivin-Rioux, A., Bozem, H., Burkart, J., Chang, R. Y. W., Charette, J., Chaubey, J. P., Christensen, R. J., Cirisan, A., Collins, D. B., Croft, B., Dionne, J., Evans, G. J., Fletcher, C. G., Galí, M., Ghahremaninezhad, R., Girard, E., Gong, W., Gosselin, M., Gourdal, M., Hanna, S. J., Hayashida, H., Herber, A. B., Hesaraki, S., Hoor, P., Huang, L., Hussherr, R., Irish, V. E., Keita, S. A., Kodros, J. K., Köllner, F., Kolonjari, F., Kunkel, D., Ladino, L. A., Law, K., Levasseur, M., Libois, Q., Liggio, J., Lizotte, M., Macdonald, K. M., Mahmood, R., Martin, R. V., Mason, R. H., Miller, L. A., Moravek, A., Mortenson, E., Mungall, E. L., Murphy, J. G., Namazi, M., Norman, A.-L., O'Neill, N. T., Pierce, J. R., Russell, L. M., Schneider, J., Schulz, H., Sharma, S., Si, M., Staebler, R. M., Steiner, N. S., Thomas, J. L., von Salzen, K., Wentzell, J. J. B., Willis, M. D., Wentworth, G. R., Xu, J.-W., and Yakobi-Hancock, J. D.: Overview paper: New insights into aerosol and climate in the Arctic, Atmos. Chem. Phys., 19, 2527–2560, https://doi.org/10.5194/acp-19-2527-2019, 2019.
Alaska Miners Association: Major Mines in Alaska, available at: http://www.alaskaminers.org/major-mines (last access: 16 March 2021), 2020.
Bari, M. A. and Kindzierski, W. B.: Ambient fine particulate matter (PM2.5) in Canadian oil sands communities: Levels, sources and potential human health risk, Sci. Total Environ., 595, 828–838, https://doi.org/10.1016/j.scitotenv.2017.04.023, 2017.
Bates, T. S., Charlson, R. J., and Gammon, R. H.: Evidence for the climatic role of marine biogenic sulphur, Nature, 329, 319–321, https://doi.org/10.1038/329319a0, 1987.
Boy, M., Thomson, E. S., Acosta Navarro, J.-C., Arnalds, O., Batchvarova, E., Bäck, J., Berninger, F., Bilde, M., Brasseur, Z., Dagsson-Waldhauserova, P., Castarède, D., Dalirian, M., de Leeuw, G., Dragosics, M., Duplissy, E.-M., Duplissy, J., Ekman, A. M. L., Fang, K., Gallet, J.-C., Glasius, M., Gryning, S.-E., Grythe, H., Hansson, H.-C., Hansson, M., Isaksson, E., Iversen, T., Jonsdottir, I., Kasurinen, V., Kirkevåg, A., Korhola, A., Krejci, R., Kristjansson, J. E., Lappalainen, H. K., Lauri, A., Leppäranta, M., Lihavainen, H., Makkonen, R., Massling, A., Meinander, O., Nilsson, E. D., Olafsson, H., Pettersson, J. B. C., Prisle, N. L., Riipinen, I., Roldin, P., Ruppel, M., Salter, M., Sand, M., Seland, Ø., Seppä, H., Skov, H., Soares, J., Stohl, A., Ström, J., Svensson, J., Swietlicki, E., Tabakova, K., Thorsteinsson, T., Virkkula, A., Weyhenmeyer, G. A., Wu, Y., Zieger, P., and Kulmala, M.: Interactions between the atmosphere, cryosphere, and ecosystems at northern high latitudes, Atmos. Chem. Phys., 19, 2015–2061, https://doi.org/10.5194/acp-19-2015-2019, 2019.
Brauer, M., Brook, J. R., Christidis, T., Chu, Y., Crouse, D. L., Erickson, A., Hystad, P., Li, C., Martin, R. V., Meng, J., Pappin, A. J., Pinault, L. L., Tjepkema, M., Van Donkelaar, A., Weichenthal, S., and Burnett, R. T.: Mortality-Air Pollution Associations in Low-Exposure Environments (MAPLE): Phase 1, Res. Reports Heal. Eff. Inst., 203, 2019.
Browse, J., Carslaw, K. S., Schmidt, A., and Corbett, J. J.: Impact of future Arctic shipping on high-latitude black carbon deposition, Geophys. Res. Lett., 40, 4459–4463, https://doi.org/10.1002/grl.50876, 2013.
Bullard J. E., Baddock, M., Bradwell, T., Crusius, J., Darlington, E., Gaiero, D., Gassó, S., Gisladottir, G., Hodgkins, R., McCulloch, R., McKenna-Neuman, C., Mockford, T., Stewart, H., and Thorsteinsson, T.: High latitude dust in the Earth system, Rev. Geophys., 54, 447–485, https://doi.org/10.1002/2016RG000518, 2016.
Canada Energy Sector: Provincial and Territorial Energy Profiles – Northwest Territories, available at: https://www.cer-rec.gc.ca/en/data-analysis/energy-markets/provincial-territorial-energy-profiles/provincial-territorial-energy-profiles-northwest-territories.html (last access: 16 March 2021), 2020.
Canadian Council of Ministers of the Environment: Ambient Air Monitoring and Quality Assurance/Quality Control Guidelines, National Air Pollution Surveillance Program, Canadian Council of Ministers of the Environment, 117 pp., ISBN 978-1-77202-056-4, 2019.
Chang, R.: Aerosol Particle Mass and Chemical Composition Analysis Tuktoyaktuk 2018, Federated Research Data Repository [data set], https://doi.org/10.20383/101.0269, 2021a.
Chang, R.: Aerosol Particle Number Size Distributions Tuktoyaktuk, NWT 2018, Federated Research Data Repository [data set], https://doi.org/10.20383/101.0278, 2021b.
Chang, R. Y.-W., Leck, C., Graus, M., Müller, M., Paatero, J., Burkhart, J. F., Stohl, A., Orr, L. H., Hayden, K., Li, S.-M., Hansel, A., Tjernström, M., Leaitch, W. R., and Abbatt, J. P. D.: Aerosol composition and sources in the central Arctic Ocean during ASCOS, Atmos. Chem. Phys., 11, 10619–10636, https://doi.org/10.5194/acp-11-10619-2011, 2011.
Christidis, T., Erickson, A. C., Pappin, A. J., Crouse, D. L., Pinault, L. L., Weichenthal, S. A., Brook, J. R., Van Donkelaar, A., Hystad, P., Martin, R. V., Tjepkema, M., Burnett, R. T., and Brauer, M.: Low concentrations of fine particle air pollution and mortality in the Canadian Community Health Survey cohort, Environ. Health, 18, 84, https://doi.org/10.1186/s12940-019-0518-y, 2019.
Conca, E., Abollino, O., Giacomino, A., Buoso, S., Traversi, R., Becagli, S., Grotti, M., and Malandrino, M.: Source identification and temporal evolution of trace elements in PM10 collected near to Ny-Ålesund (Norwegian Arctic), Atmos. Environ., 203, 153–165, https://doi.org/10.1016/j.atmosenv.2019.02.001, 2019.
Crocchianti, S., Moroni, B., Dagsson-Waldhauserova, P., Becagli, S., Severi, M., Traversi, R., and Cappelletti, D.: Potential source contribution function analysis of high latitude dust sources over the Arctic: Preliminary results and prospects, Atmosphere, 12, 347–362, https://doi.org/10.3390/atmos12030347, 2021.
Croft, B., Wentworth, G. R., Martin, R. V., Leaitch, W. R., Murphy, J. G., Murphy, B. N., Kodros, J. K., Abbatt, J. P. D., and Pierce, J. R.: Contribution of Arctic seabird-colony ammonia to atmospheric particles and cloud-albedo radiative effect, Nat. Commun., 7, 13444, https://doi.org/10.1038/ncomms13444, 2016a.
Croft, B., Martin, R. V., Leaitch, W. R., Tunved, P., Breider, T. J., D'Andrea, S. D., and Pierce, J. R.: Processes controlling the annual cycle of Arctic aerosol number and size distributions, Atmos. Chem. Phys., 16, 3665–3682, https://doi.org/10.5194/acp-16-3665-2016, 2016b.
Croft, B., Martin, R. V., Leaitch, W. R., Burkart, J., Chang, R. Y.-W., Collins, D. B., Hayes, P. L., Hodshire, A. L., Huang, L., Kodros, J. K., Moravek, A., Mungall, E. L., Murphy, J. G., Sharma, S., Tremblay, S., Wentworth, G. R., Willis, M. D., Abbatt, J. P. D., and Pierce, J. R.: Arctic marine secondary organic aerosol contributes significantly to summertime particle size distributions in the Canadian Arctic Archipelago, Atmos. Chem. Phys., 19, 2787–2812, https://doi.org/10.5194/acp-19-2787-2019, 2019.
Dagsson-Waldhauserova, P., Arnalds, O., and Olafsson, H.: Long-term variability of dust events in Iceland (1949–2011), Atmos. Chem. Phys., 14, 13411–13422, https://doi.org/10.5194/acp-14-13411-2014, 2014.
Dagsson-Waldhauserova, P., Renard, J.-B., Olafsson, H., Vignelles, D., Berthet, G., Verdier, N., and Duverger, V.: Vertical distribution of aerosols in dust storms during the Arctic winter, Sci. Rep.-UK, 9, 16122, https://doi.org/10.1038/s41598-019-51764-y, 2019.
Dominici, F., Peng, R. D., Bell, M. L., Pham, L., McDermott, A., Zeger, S. L., and Samet, J. M.: Fine particulate air pollution and hospital admission for cardiovascular and respiratory diseases, J. Am. Med. Assoc., 295, 1127–1134, https://doi.org/10.1001/jama.295.10.1127, 2006.
Đorđević, D., Tošić, I., Sakan, S., Petrović, S., Đuričić-Milanković, J., Finger, D. C., and Dagsson-Waldhauserová, P.: Can volcanic dust suspended from surface soil and deserts of Iceland be transferred to central Balkan similarly to African dust (Sahara)?, Front. Earth Sci., 7, 142, https://doi.org/10.3389/feart.2019.00142, 2019.
Environment and Climate Change Canada: Canadian Environmental Sustainability Indicators Air Quality, available at: https://www.canada.ca/en/environment-climate-change/services/environmental-indicators/air.html (last access: 16 March 2021), 2018.
Environment and Climate Change Canada: Historical Climate Data, available at: https://climate.weather.gc.ca/historical_data/search_historic_data_e.html (last access: 7 July 2021), 2020.
European Environment Agency: Arctic Resources, available at: https://www.eea.europa.eu/data-and-maps/figures/arctic-resources (last access: 7 July 2021), 2017.
Ferrero, L., Sangiorgi, G., Perrone, M. G., Rizzi, C., Cataldi, M., Markuszewski, P., Pakszys, P., Makuch, P., Petelski, T., Becagli, S., Traversi, R., Bolzacchini, E., and Zielinski, T.: Chemical composition of aerosol over the Arctic ocean from summer Arctic expedition (AREX) 2011–2012 cruises: Ions, amines, elemental carbon, organic matter, polycyclic aromatic hydrocarbons, n-alkanes, metals, and rare earth elements, Atmosphere, 10, 54, https://doi.org/10.3390/atmos10020054, 2019.
Finlayson-Pitts, B. J. and Pitts, J. N.: Particles in the Troposphere, in Chemistry of the Upper and Lower Atmosphere, Academic Press, San Diego, California, USA, 349–420, 2000.
Gilgen, A., Huang, W. T. K., Ickes, L., Neubauer, D., and Lohmann, U.: How important are future marine and shipping aerosol emissions in a warming Arctic summer and autumn?, Atmos. Chem. Phys., 18, 10521–10555, https://doi.org/10.5194/acp-18-10521-2018, 2018.
Government of Canada: National Pollutant Release Inventory (NPRI) – Bulk Data, available at: https://open.canada.ca/data/en/dataset/40e01423-7728-429c-ac9d-2954385ccdfb (last access: 16 March 2021), 2018.
Government of Nunavut: Population Estimates, available at: https://www.gov.nu.ca/sites/default/files/population_estimates_report_july_1_2019_0.pdf (last access: 16 March 2021), 2019.
Herenz, P., Wex, H., Henning, S., Kristensen, T. B., Rubach, F., Roth, A., Borrmann, S., Bozem, H., Schulz, H., and Stratmann, F.: Measurements of aerosol and CCN properties in the Mackenzie River delta (Canadian Arctic) during spring–summer transition in May 2014, Atmos. Chem. Phys., 18, 4477–4496, https://doi.org/10.5194/acp-18-4477-2018, 2018.
Jayarathne, T., Stockwell, C. E., Yokelson, R. J., Nakao, S., and Stone, E. A.: Emissions of fine particle fluoride from biomass burning, Environ. Sci. Technol., 48, 12636–12644, https://doi.org/10.1021/es502933j, 2014.
Kadko, D., Galfond, B., Landing, W. M., and Shelley, R. U.: Determining the pathways, fate, and flux of atmospherically derived trace elements in the arctic ocean/ice system, Mar. Chem., 182, 38–50, https://doi.org/10.1016/j.marchem.2016.04.006, 2016.
Keene, W. C., Lobert, J. M., Crutzen, P. J., Maben, J. R., Scharffe, D. H., Landmann, T., Hély, C., and Brain, C.: Emissions of major gaseous and particulate species during experimental burns of southern African biomass, J. Geophys. Res.-Atmos., 111, D04301, https://doi.org/10.1029/2005JD006319, 2006.
Landsberger, S., Vermette, S. J., and Barrie, L. A.: Multielemental composition of the Arctic aerosol, J. Geophys. Res., 95, 3509–3515, https://doi.org/10.1029/JD095iD04p03509, 1990.
Laskin, A., Moffet, R. C., Gilles, M. K., Fast, J. D., Zaveri, R. A., Wang, B., Nigge, P., and Shutthanandan, J.: Tropospheric chemistry of internally mixed sea salt and organic particles: Surprising reactivity of NaCl with weak organic acids, J. Geophys. Res.-Atmos., 117, D15302, https://doi.org/10.1029/2012JD017743, 2012.
Leaitch, W. R., Russell, L. M., Liu, J., Kolonjari, F., Toom, D., Huang, L., Sharma, S., Chivulescu, A., Veber, D., and Zhang, W.: Organic functional groups in the submicron aerosol at 82.5∘ N, 62.5∘ W from 2012 to 2014, Atmos. Chem. Phys., 18, 3269–3287, https://doi.org/10.5194/acp-18-3269-2018, 2018.
Liberda, E. N., Tsuji, L. J. S., and Peltier, R. E.: Mining in subarctic Canada: Airborne PM2.5 metal concentrations in two remote First Nations communities, Chemosphere, 139, 452–460, https://doi.org/10.1016/j.chemosphere.2015.07.058, 2015.
MacInnis, J. J., Lehnherr, I., Muir, D. C. G., St. Pierre, K. A., St. Louis, V. L., Spencer, C., and De Silva, A. O.: Fate and transport of perfluoroalkyl substances from snowpacks into a lake in the high Arctic of Canada, Environ. Sci. Technol., 53, 10753–10762, https://doi.org/10.1021/acs.est.9b03372, 2019.
Mackay, J. R. and Burn, C. R.: A long-term field study (1951–2003) of ventifacts formed by katabatic winds at Paulatuk, western Arctic coast, Canada, Can. J. Earth Sci., 42, 1615–1635, https://doi.org/10.1139/E05-061, 2005.
Martin, M., Chang, R. Y.-W., Sierau, B., Sjogren, S., Swietlicki, E., Abbatt, J. P. D., Leck, C., and Lohmann, U.: Cloud condensation nuclei closure study on summer arctic aerosol, Atmos. Chem. Phys., 11, 11335–11350, https://doi.org/10.5194/acp-11-11335-2011, 2011.
Murray, B. J., Carslaw, K. S., and Field, P. R.: Opinion: Cloud-phase climate feedback and the importance of ice-nucleating particles, Atmos. Chem. Phys., 21, 665–679, https://doi.org/10.5194/acp-21-665-2021, 2021.
Newberg, J. T., Matthew, B. M., and Anastasio, C.: Chloride and bromide depletions in sea-salt particles over the northeastern Pacific Ocean, J. Geophys. Res.-Atmos., 110, D06209, https://doi.org/10.1029/2004JD005446, 2005.
NWT Bureau of Statistics: Community Data, available at: https://www.statsnwt.ca/community-data/ (last access: 16 March 2021), 2020.
O'Dowd, C. D. and de Leeuw, G.: Marine aerosol production: a review of the current knowledge, Philos. T. R. Soc. A, 365,1753–1774, https://doi.org/10.1098/rsta.2007.2043, 2007.
Ostro, B., Lipsett, M., Reynolds, P., Goldberg, D., Hertz, A., Garcia, C., Henderson, K. D., and Bernstein, L.: Long-term exposure to constituents of fine particulate air pollution and mortality: Results from the California Teachers Study, Environ. Health Persp., 118, 363–369, https://doi.org/10.1289/ehp.0901181, 2010.
Pappin, A. J., Christidis, T., Pinault, L. L., Crouse, D. L., Brook, J. R., Erickson, A., Hystad, P., Li, C., Martin, R. V., Meng, J., Weichenthal, S., Donkelaar, A. van, Tjepkema, M., Brauer, M., and Burnett, R. T.: Examining the shape of the association between low levels of fine particulate matter and mortality across three cycles of the canadian census health and environment cohort, Environ. Health Persp., 127, 107008, https://doi.org/10.1289/EHP5204, 2019.
Radke, L. F. and Hobbs, P. V.: Arctic hazes in summer over Greenland and the North American Arctic. III: A contribution from the natural burning of carbonaceous materials and pyrites, J. Atmos. Chem., 9, 161–167, https://doi.org/10.1007/BF00052830, 1989.
Saltzman, E. S.: Marine Aerosols, in: Surface Ocean-Lower Atmosphere Processes, edited by: Le Quéré, C. and Saltzman, E. S., American Geophysical Union, Washington, DC, USA, 17–35, https://doi.org/10.1029/2008GM000769, 2009.
Sanchez-Marroquin, A., Arnalds, O, Baustian-Dorsi, K., Browse, J., Dagsson-Waldhauserova, P., Harrison, A. D., Maters, E. C., Pringle, K. J., Vergara-Temprado, J., Burke, I. T., McQuaid, J. B., Carslaw, K. S., and Murray, B. J.: Iceland is an episodic source of atmospheric ice-nucleating particles relevant for mixed-phase clouds, Sci. Adv., 6, eaba8137, https://doi.org/10.1126/sciadv.aba8137, 2020.
Seinfeld, J. H. and Pandis, S. N.: Aerosols, in Atmospheric Chemistry and Physics: From Air Pollution to Climate Change, John Wiley & Sons, Inc., Hoboken, NJ, USA, 325–359, 2016.
Sharma, S., Leaitch, W. R., Huang, L., Veber, D., Kolonjari, F., Zhang, W., Hanna, S. J., Bertram, A. K., and Ogren, J. A.: An evaluation of three methods for measuring black carbon in Alert, Canada, Atmos. Chem. Phys., 17, 15225–15243, https://doi.org/10.5194/acp-17-15225-2017, 2017.
Sharma, S., Barrie, L. A., Magnusson, E., Brattström, G., Leaitch, W. R., Steffen, A., and Landsberger, S.: A factor and trends analysis of multidecadal lower tropospheric observations of Arctic aerosol composition, black carbon, ozone, and mercury at Alert, Canada, J. Geophys. Res.-Atmos., 124, 14133–14161, https://doi.org/10.1029/2019JD030844, 2019.
Sierau, B., Chang, R. Y.-W., Leck, C., Paatero, J., and Lohmann, U.: Single-particle characterization of the high-Arctic summertime aerosol, Atmos. Chem. Phys., 14, 7409–7430, https://doi.org/10.5194/acp-14-7409-2014, 2014.
Snider, G., Weagle, C. L., Martin, R. V., van Donkelaar, A., Conrad, K., Cunningham, D., Gordon, C., Zwicker, M., Akoshile, C., Artaxo, P., Anh, N. X., Brook, J., Dong, J., Garland, R. M., Greenwald, R., Griffith, D., He, K., Holben, B. N., Kahn, R., Koren, I., Lagrosas, N., Lestari, P., Ma, Z., Vanderlei Martins, J., Quel, E. J., Rudich, Y., Salam, A., Tripathi, S. N., Yu, C., Zhang, Q., Zhang, Y., Brauer, M., Cohen, A., Gibson, M. D., and Liu, Y.: SPARTAN: a global network to evaluate and enhance satellite-based estimates of ground-level particulate matter for global health applications, Atmos. Meas. Tech., 8, 505–521, https://doi.org/10.5194/amt-8-505-2015, 2015.
Snider, G., Weagle, C. L., Murdymootoo, K. K., Ring, A., Ritchie, Y., Stone, E., Walsh, A., Akoshile, C., Anh, N. X., Balasubramanian, R., Brook, J., Qonitan, F. D., Dong, J., Griffith, D., He, K., Holben, B. N., Kahn, R., Lagrosas, N., Lestari, P., Ma, Z., Misra, A., Norford, L. K., Quel, E. J., Salam, A., Schichtel, B., Segev, L., Tripathi, S., Wang, C., Yu, C., Zhang, Q., Zhang, Y., Brauer, M., Cohen, A., Gibson, M. D., Liu, Y., Martins, J. V., Rudich, Y., and Martin, R. V.: Variation in global chemical composition of PM2.5: emerging results from SPARTAN, Atmos. Chem. Phys., 16, 9629–9653, https://doi.org/10.5194/acp-16-9629-2016, 2016.
Tremblay, S., Picard, J.-C., Bachelder, J. O., Lutsch, E., Strong, K., Fogal, P., Leaitch, W. R., Sharma, S., Kolonjari, F., Cox, C. J., Chang, R. Y.-W., and Hayes, P. L.: Characterization of aerosol growth events over Ellesmere Island during the summers of 2015 and 2016, Atmos. Chem. Phys., 19, 5589–5604, https://doi.org/10.5194/acp-19-5589-2019, 2019.
United States Environmental Protection Agency: Definition and procedure for the determination of the method detection limit – Revision 2, United States Environmental Protection Agency, Washington, DC, USA, EPA 821-R-16-006, 8 pp., 2016.
Vet, R., Artz, R. S., Carou, S., Shaw, M., Ro, C. U., Aas, W., Baker, A., Bowersox, V. C., Dentener, F., Galy-Lacaux, C., Hou, A., Pienaar, J. J., Gillett, R., Forti, M. C., Gromov, S., Hara, H., Khodzher, T., Mahowald, N. M., Nickovic, S., Rao, P. S. P., and Reid, N. W.: A global assessment of precipitation chemistry and deposition of sulfur, nitrogen, sea salt, base cations, organic acids, acidity and pH, and phosphorus, Atmos. Environ., 93, 3–100, https://doi.org/10.1016/j.atmosenv.2013.10.060, 2014.
Wentworth, G. R., Murphy, J. G., Croft, B., Martin, R. V., Pierce, J. R., Côté, J.-S., Courchesne, I., Tremblay, J.-É., Gagnon, J., Thomas, J. L., Sharma, S., Toom-Sauntry, D., Chivulescu, A., Levasseur, M., and Abbatt, J. P. D.: Ammonia in the summertime Arctic marine boundary layer: sources, sinks, and implications, Atmos. Chem. Phys., 16, 1937–1953, https://doi.org/10.5194/acp-16-1937-2016, 2016.
Willis, M. D., Leaitch, W. R., and Abbatt, J. P. D.: Processes controlling the composition and abundance of Arctic aerosol, Rev. Geophys., 56, 621–671, https://doi.org/10.1029/2018RG000602, 2018.
Wong, F., Shoeib, M., Katsoyiannis, A., Eckhardt, S., Stohl, A., Bohlin-Nizzetto, P., Li, H., Fellin, P., Su, Y., and Hung, H.: Assessing temporal trends and source regions of per- and polyfluoroalkyl substances (PFASs) in air under the Arctic Monitoring and Assessment Programme (AMAP), Atmos. Environ., 172, 65–73, https://doi.org/10.1016/j.atmosenv.2017.10.028, 2018.
World Health Organization: Ambient (outdoor) air pollution, available at: https://www.who.int/news-room/fact-sheets/detail/ambient-(outdoor)-air-quality-and-health (last access: 16 March 2021), 2018.
Wu, J.-Z., Ge, D.-D., Zhou, L.-F., Hou, L.-Y., Zhou, Y., and Li, Q.-Y.: Effects of particulate matter on allergic respiratory diseases, Chronic Dis. Transl. Med., 4, 95–102, https://doi.org/10.1016/j.cdtm.2018.04.001, 2018.
Xu, W., Tenuta, M., and Wang, F.: Bromide and chloride distribution across the snow-sea ice-ocean interface: A comparative study between an Arctic coastal marine site and an experimental sea ice mesocosm, J. Geophys. Res.-Ocean., 121, 5535–5548, https://doi.org/10.1002/2015JC011409, 2016.
Yao, X., Fang, M., and Chan, C. K.: The size dependence of chloride depletion in fine and coarse sea-salt particles, Atmos. Environ., 37, 743–751, https://doi.org/10.1016/S1352-2310(02)00955-X, 2003.
Yukon Bureau of Statistics: Population Report, available at: http://yukon.ca/sites/yukon.ca/files/ybs/populationq4_2019_0_0.pdf (last access: 16 March 2021), 2019.