the Creative Commons Attribution 4.0 License.
the Creative Commons Attribution 4.0 License.
 | 10 Sep 2021
Water vapor anomaly over the tropical western Pacific in El Niño winters from radiosonde and satellite observations and ERA5 reanalysis data
Minkang Du
Kaiming Huang
Shaodong Zhang
Chunming Huang
Using radiosonde observations at five stations in the tropical western Pacific and reanalysis data for the 15 years from 2005 to 2019, we report an extremely negative anomaly in atmospheric water vapor during the super El Niño winter of 2015/16 and compare the anomaly with that in the other three El Niño winters of the period. A strong specific humidity anomaly is concentrated below 8 km of the troposphere with a peak at 2.5–3.5 km, and a column-integrated water vapor mass anomaly over the five radiosonde sites has a large negative correlation coefficient of −0.63 with the oceanic Niño3.4 index but with a lag of about 2–3 months. In general, the tropical circulation anomaly in the El Niño winter is characterized by divergence (convergence) in the lower troposphere over the tropical western (eastern) Pacific; thus, the water vapor decreases over the tropical western Pacific as upward motion is suppressed. The variability of the Hadley circulation is quite small and has little influence on the observed water vapor anomaly. The anomaly of the Walker circulation makes a considerable contribution to the total anomaly in all four El Niño winters, especially in the 2006/07 and 2015/16 eastern Pacific (EP) El Niño events. The monsoon circulation shows a remarkable change from one event to another, and its anomaly is large in the 2009/10 and 2018/19 central Pacific (CP) El Niño winters and small in the two EP El Niño winters. The observed water vapor anomaly is caused mainly by the Walker circulation anomaly in the super EP event of 2015/16 but is caused by the monsoon circulation anomaly in the strong CP event of 2009/10. The roles of the Hadley, Walker, and monsoon circulations in the EP and CP events are confirmed by the composite EP and CP El Niños based on the reanalysis data for 41 years. Owing to the anomalous decrease in upward transport of water vapor during the El Niño winter, lower cloud amounts and more outgoing longwave radiation over the five stations are clearly presented in satellite observation. In addition, a detailed comparison of water vapor in the reanalysis, radiosonde, and satellite data shows a fine confidence level for the datasets; nevertheless, the reanalysis seems to slightly underestimate the water vapor over the five stations in the 2009/10 winter.
- Article
(19957 KB) - Full-text XML
- BibTeX
- EndNote


As a dominant greenhouse gas in the atmosphere, water vapor has a profound impact on global energy budgets through not only latent heat release upon phase transitions (Held and Soden, 2000) but also cloud formation that reflects longwave radiation from below and shortwave radiation from above (Stevens et al., 2017); thus, water vapor plays a substantial role in the formation and evolution of the climate system. The tropical Pacific is a major convection center and a region with abundant water vapor. Sea surface temperature (SST) anomalies in the tropical Pacific have an important influence on water vapor transport, cloud cover, and precipitation distribution due to the tropical circulation changes caused by El Niño–Southern Oscillation (ENSO). ENSO is characterized by anomalous SST in the tropical Pacific. During ENSO, there is significant precipitation variability in the Euro-Mediterranean (López-Parages and Rodríguez-Fonseca, 2012), Middle East (Sandeep and Ajayamohan, 2018), southwest central Asia (Mariotti, 2007), western Africa (Okazaki et al., 2015), Pacific Ocean (Quartly et al., 2000), and continental USA (Lee et al., 2014). ENSO has an effect on seasonal rainfall in East Asia by inducing a weaker and later onset of the Indian monsoon circulation (Dai and Wigley, 2000; Zhao et al., 2010; Yan et al., 2018). Vertical cloud anomalies in the tropical Atlantic from Aqua Moderate-Resolution Imaging Spectroradiometer are linked to ENSO-induced shift and weakening of the Walker circulation and Hadley cell near the Equator (Madenach et al., 2019). The strong 1997/98 El Niño resulted in cloud structure anomalies and their radiative property changes over the tropical Pacific (Sun et al., 2012) and increased upper tropospheric cirrus over the mid-Pacific but decreased cirrus over Indonesia (Massie et al., 2000). Numerical investigation also indicated that warm-water volume transport and precipitation change are associated with ENSO (Ishida et al., 2008; Hill et al., 2009).
El Niño is generally classified into central Pacific (CP) El Niño, also known as El Niño Modoki, and eastern Pacific (EP) El Niño based on distinct spatial distributions of warming SST anomaly averaged over the Niño4 and Niño3 regions (Ashok et al., 2007; Yu and Kao, 2009; Yeh et al., 2009), respectively. The 2006/07 and 2015/16 events are the EP El Niño because of the stronger SST anomaly during the boreal winter (December to February, as DJF) in the Niño3 region than in the Niño4 region, while correspondingly the 2009/10 and 2018/19 events are categorized as the CP El Niño (Yeh et al., 2009). The two types of El Niño have different effects on precipitation, surface temperature, moisture transport, and carbon cycle over many parts of the world (Weng et al., 2008; Kug et al., 2009; Wang et al., 2013; Yeh et al., 2014; Gu and Adler, 2016; Wang et al., 2018). Su and Jiang (2013) and Takahashi et al. (2013) suggested that the water vapor anomaly over the tropical ocean was mainly controlled by thermodynamic process during the 2006/07 EP El Niño but by both dynamic and thermodynamic processes during the 2009/10 CP El Niño.
The EP El Niño in 2015/16 winter is one of the strongest ENSO events on record. Compared to the strong 1982/83 and 1997/98 El Niños, the 2015/16 El Niño shows distinct aspects that indicate that the largest SST anomalies are extended toward the central Pacific (Paek et al., 2017; L'Heureux et al., 2017). Due to their unusual characteristics, the global effects of the 2015/16 event have attracted much attention. Palmeiro et al. (2017) proposed that an early stratospheric final warming over the polar region and anomalous precipitation over southern Europe in 2016 were related to the 2015/16 super El Niño. Li et al. (2018) revealed that the combined effect of the 2015 ENSO warm phase and Madden-Julian Oscillation (MJO)-4 index negative phase caused a significant deficit of precipitation on the Canadian Prairies in May and June 2015. A striking freshwater anomaly was observed in the equatorial Pacific during the onset of the 2015/16 event (Gasparin and Roemmich, 2016), and rainfall δ18O in southern Papua was generally enriched by 1.6 ‰–2 ‰ during the 2015 El Niño more than during the 2013/14 ENSO-normal period (Permana et al., 2016). Owing to convection anomaly during the 2015/16 El Niño, water vapor in the tropical lower stratosphere was increased by hydration of the lower stratosphere through convectively detrained cloud ice (Avery et al., 2017), and quasi-biennial oscillation in the tropical stratospheric wind was disrupted because of dramatic relocation of deep convection (Dunkerton, 2016; Newman et al., 2016). Hence, the 2015/16 El Niño had important influences on the circulation and composition transport and the mass exchange between the troposphere and stratosphere. In this paper, we investigate the water vapor anomaly over the tropical western Pacific in the CP and EP El Niño events from radiosonde and satellite observations, particularly the extreme anomaly in the 2015/16 super El Niño winter, and explore the contributions of the tropical Hadley, Walker, and monsoon circulation changes to the observed water vapor anomalies in the different El Niño events.
The data used are briefly described in Sect. 2. In Sect. 3, water vapor anomalies in four El Niño winters are presented, and the relationship between the ENSO intensity and the water vapor anomaly at the observational stations is explored. In Sect. 4, we decompose the tropical circulation into the Hadley, Walker, and monsoon circulation components and estimate the roles of these circulations in the water vapor variation. Tropical cloud and outgoing longwave radiation (OLR) are investigated in Sect. 5. A discussion of the water vapor data quality is provided in Sect. 6. Finally, we summarize the results in Sect. 7.
In present study, we investigate the atmospheric water vapor by using radiosonde observations at five tropical stations for 15 years from January 2005 to December 2019, which are provided by the National Oceanic And Atmosphere Administration (NOAA) at the following website: https://www.ncei.noaa.gov/pub/data/igra/derived/ (last access: 6 September 2021). The five radiosonde stations are at Koror (7.33∘ N, 134.48∘ E), Yap (9.48∘ N, 138.08∘ E), Guam (13.55∘ N, 144.83∘ E), Truk (7.47∘ N, 151.85∘ E), and Ponape (6.97∘ N, 158.22∘ E), located in the western Pacific warm pool. A balloon was launched twice daily at 00:00 and 12:00 UTC, and during balloon ascent the sensing payload on the balloon can obtain many meteorological parameters, such as atmospheric pressure, temperature, relative humidity, and wind speed and direction. We plot daily temperature, relative humidity, and wind speed time series observed by radiosonde to identify potential outliers, and then the high resistant asymmetric biweight technique is applied to weed out the outliers (Lanzante, 1996). The outlier data are very few, and the outliers of temperature, wind, and relative humidity account for only 0.09 %, 0.08 %, and 0.02 % of all observational data at the five stations over 15 years, respectively. The radiosonde data are linearly interpolated to a vertical grid of 50 m, and the interpolated data below 10 km are utilized to analyze the atmospheric water vapor variation. The burst height of the balloon is usually more than 30 km; thus, the data availability below 10 km is high. In the period that we focus on, the data are missing for about 4, 2, 1, and 4 months over Yap, Guam, Truk, and Ponape, respectively, and they are almost entirely missing from the several continuous observational data rather than the balloon burst data below 10 km.
Specific humidity can be derived from the profile of meteorological parameters observed by radiosonde. The saturated vapor pressure es is calculated according to a modified version of the Magnus formula as follows (Murray, 1967):
where T is the temperature in units of K. Following this, the specific humidity q (g kg−1) is determined from the following equations:
where e is the vapor pressure, RH is the relative humidity, and p is the pressure in units of hPa.
In addition, we use the monthly specific humidity and horizontal winds from the surface to 300 hPa during the period of 2005–2019, obtained from the European Centre for Medium-Range Weather Forecasts (ECMWF) ERA5 reanalysis data, to investigate the water vapor anomaly and tropical atmospheric circulation in the region of the radiosonde stations. The reanalysis data are produced by a sequential 4D variational data assimilation scheme, with a latitudinal and longitudinal resolution of 0.25∘ × 0.25∘ at 37 pressure levels from 1000 to 1 hPa (Hersbach et al., 2020). The data are available at the website of https://cds.climate.copernicus.eu/cdsapp#!/dataset/reanalysis-era5-pressure-levels-monthly-means?tab=form (last access: 6 September 2021).
To assess the atmospheric water vapor as compared to the reanalysis data and the radiosonde observations, a further evaluation is carried out using Aqua atmospheric infrared sounder (AIRS) water vapor mass mixing ratio data from 2005–2019. AIRS is a hyperspectral infrared spectrometer orbiting on the National Aeronautics and Space Administration (NASA) Aqua spacecraft launched in May 2002, which can provide accurate measurements of temperature, moisture, and other atmospheric variables (Aumann et al., 2003). The data used here are water vapor vertical profiles from Level 3 monthly standard gridded retrieval product version 6, AIRS3STM (Susskind et al., 2014), which are available at https://disc.gsfc.nasa.gov/datasets/AIRS3STM_006/summary?keywords=AIRS3STM (last access: 6 September 2021). The water vapor data contain eight levels from 1000 and 300 hPa with a latitudinal and longitudinal grid of 1∘ × 1∘ derived from the average of two observations in two orbital overpasses per day. The ascending and descending orbits have an equatorial crossing time at 13:30 local time (LT) and 01:30 LT, respectively.
The oceanic Niño index (ONI) is applied to discuss the correlation between the ENSO and the observed water vapor anomaly. ONI is the measurement of ENSO strength, which is provided by the NOAA at https://catalog.data.gov/dataset/climate-prediction-center-cpcoceanic-nino-index (last access: 6 September 2021). The ONI is defined as a 3-month moving average of extended reconstructed sea surface temperature (ERSST) V5 sea surface temperature anomalies in the Niño3.4 region at 5∘ N–5∘ S and 120–170∘ W (Huang et al., 2017).
Cloud occurrence probability and OLR flux are also examined since they are sensitive to water vapor variation (Stevens et al., 2017; Soden et al. 2008). The OLR data are measured by the NOAA-18 satellite, which travel in sun-synchronous orbit with a 13:55 LT equatorial crossing time (Kramer, 2002). We use the monthly OLR data between 2005 and 2019 from the NOAA archives with a latitudinal and longitudinal grid of 2.5∘ × 2.5∘ (Liebmann and Smith, 1996), which can be accessed through the website of https://psl.noaa.gov/data/gridded/data.interp_OLR.html (last access: 6 September 2021). The Cloud Aerosol Lidar and Infrared Pathfinder Satellite Observation (CALIPSO) satellite is able to clearly identify cloud vertical structure (Winker et al., 2007). The satellite has a sun-synchronous orbit with an equatorial crossing time around 01:30 and 13:30 LT (Stephens et al., 2002). Here, we use the CALIPSO version 1.00 lidar level 3 cloud occurrence monthly data in a latitudinal and longitudinal grid of 2∘ × 2.5∘ with an altitude resolution of 60 m above the mean sea level, and the available data are from June 2006 to December 2016, downloaded from the website of the NASA at https://asdc.larc.nasa.gov/project/CALIPSO/CAL_LID_L3_Cloud_Occurrence-Standard-V1-00_V1-00 (last access: 6 September 2021)
3.1 Water vapor anomaly during El Niño winter
We derive the profile of specific humidity from the radiosonde observations according to Eqs. (1)–(3) and then calculate the monthly mean specific humidity. The monthly mean specific humidities in all the same months are further averaged to obtain the monthly climatic normal; thus, the monthly mean water vapor anomaly is determined from the monthly mean series by subtracting the corresponding month climatic normal. Figure 1 shows the monthly mean specific humidity anomaly based on the radiosonde observations at Koror, Yap, Guam, Truk, and Ponape from January 2005 to December 2019. Atmospheric water vapor is mainly concentrated below 8 km, and thus the large water vapor anomaly also occurs below 8 km. It can be seen from Fig. 1 that the observed water vapor anomaly is remarkably negative over the five stations in the super El Niño winter of 2015–2016. The negative anomaly in the water vapor reaches a peak value of −2.06 g kg−1 around 3 km in January at Koror, −3.2 g kg−1 around 3 km in February at Yap, −2.39 g kg−1 around 2.5 km in January at Guam, −2.29 g kg−1 around 3.5 km in February at Truk, and −2.66 g kg−1 around 2.5 km in February at Ponape. In the 2006/07, 2009/10, and 2018/19 El Niño winters, the observed water vapor also exhibits the negative anomalies in the lower and middle troposphere. We derive the monthly mean specific humidity anomaly from the reanalysis data at the radiosonde stations during the same period, which is also presented in Fig. 1. The ERA5 reanalysis shows a water vapor anomaly scenario similar to the radiosonde observation. The negative anomalies in the four El Niño winters are obvious in the reanalysis data, especially the strong anomaly in the 2015/16 event. Hence, the El Niño events can lead to the obvious reduction of water vapor in the region.
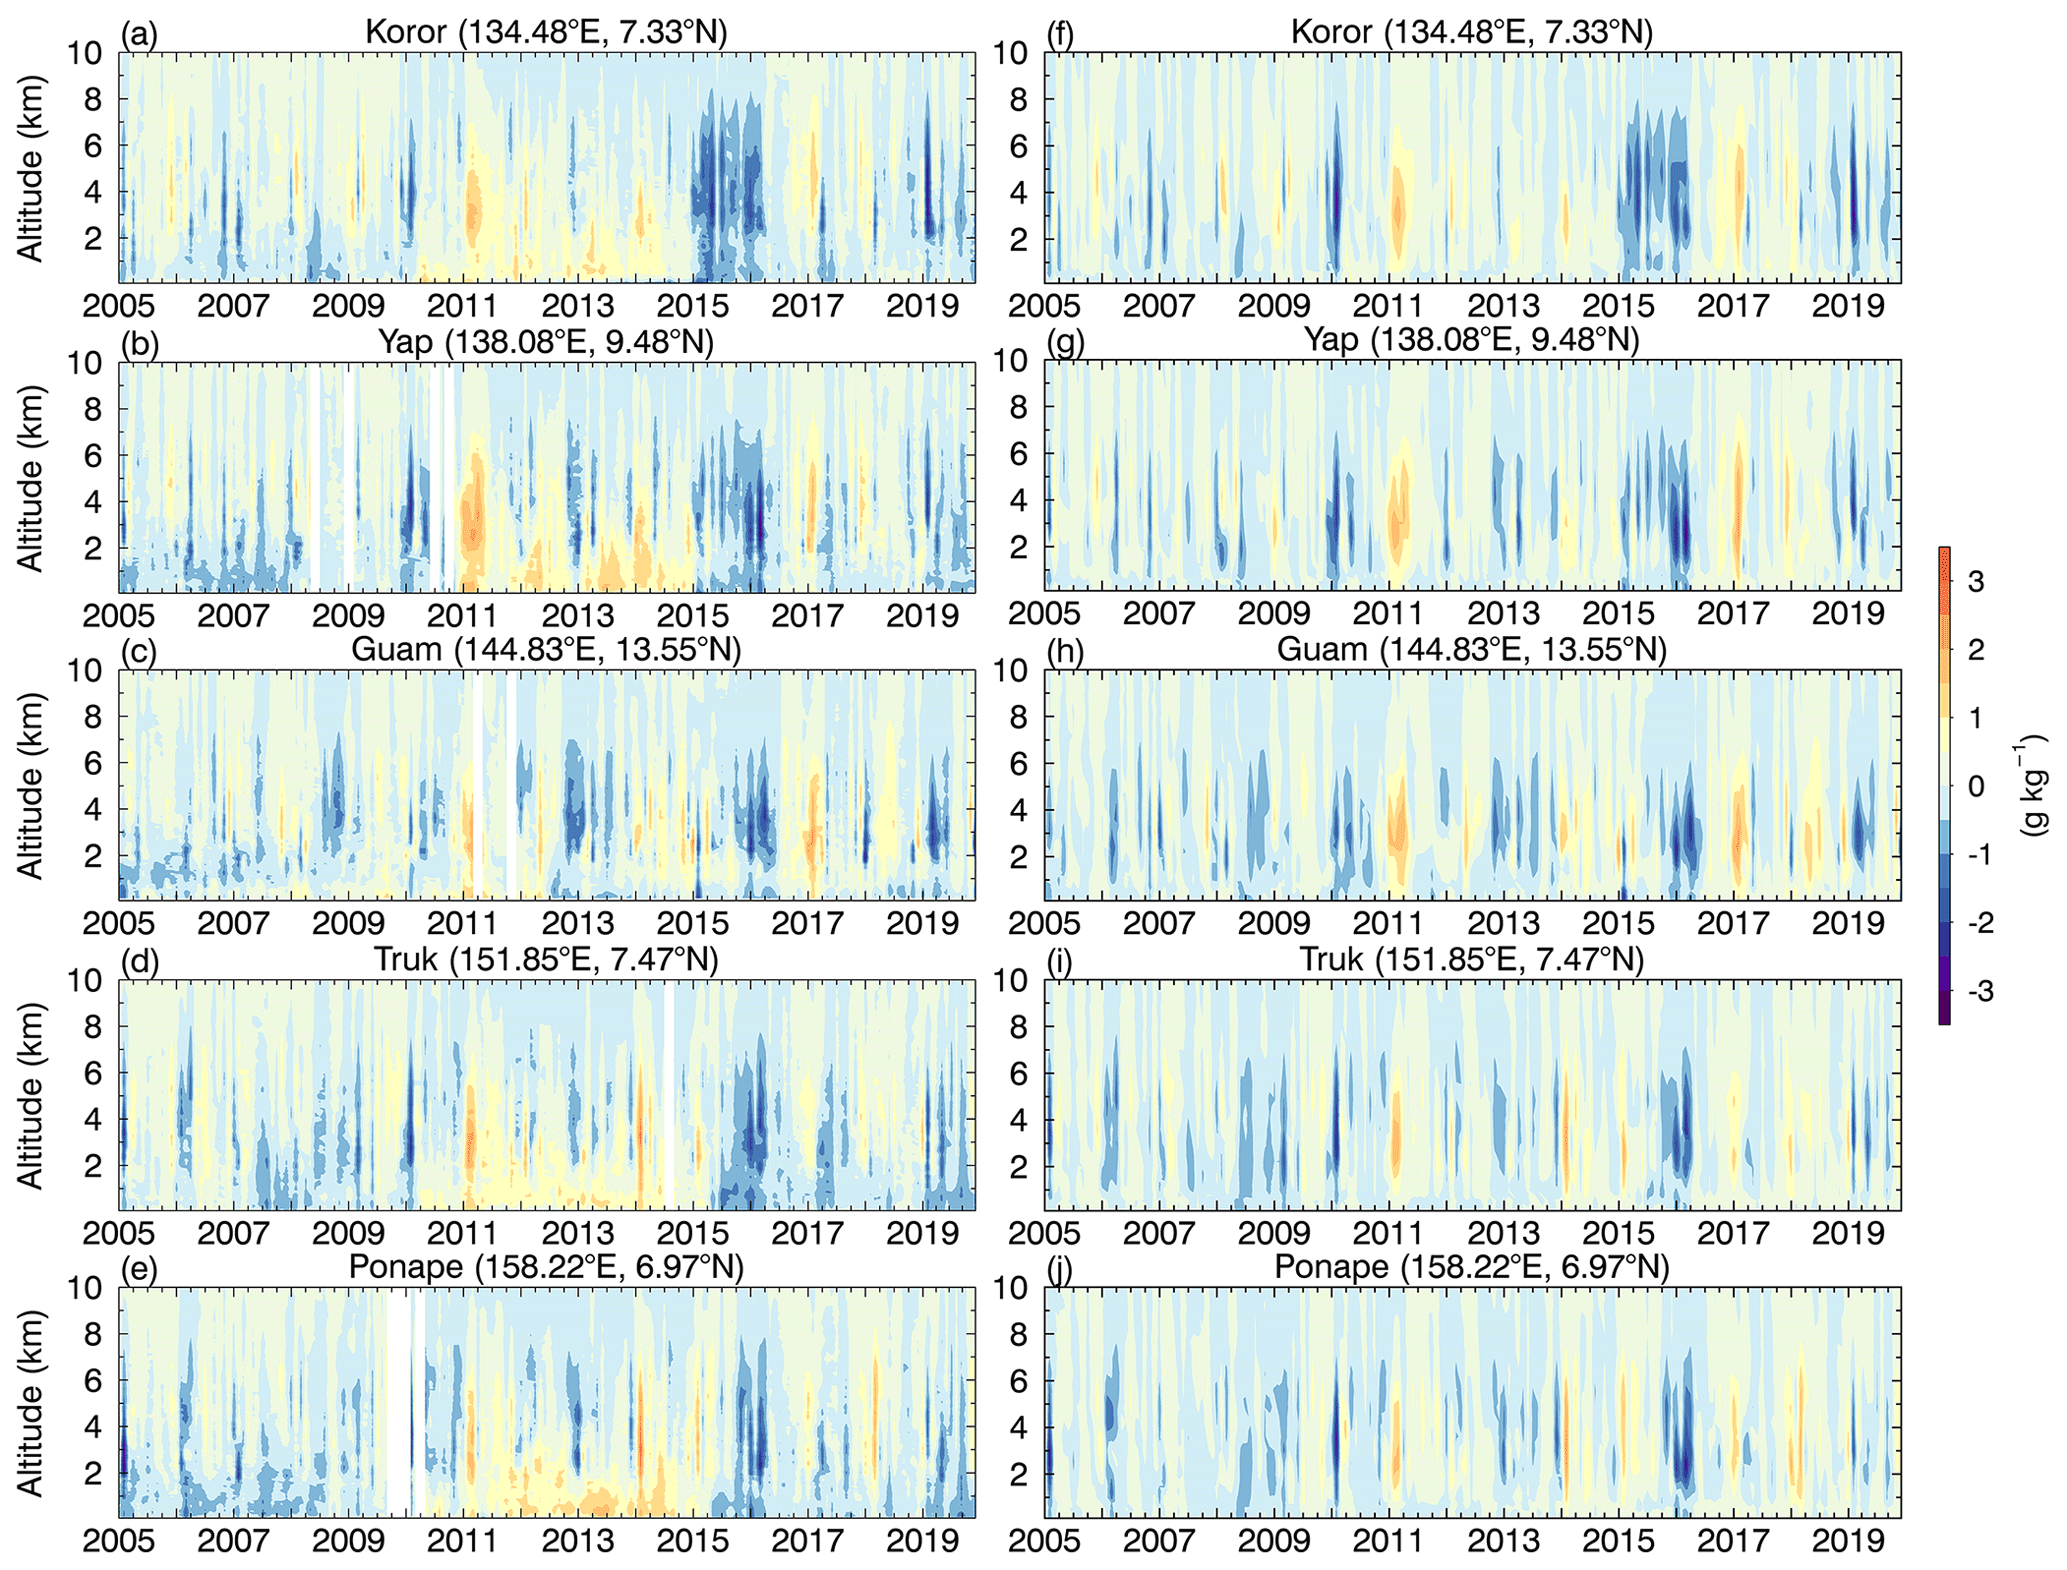
Figure 1Specific humidity anomaly between January 2005 and December 2019 derived from (left) radiosonde observations and (right) ERA5 reanalysis data at (a, f) Koror, (b, g) Yap, (c, h) Guam, (d, i) Truk, and (e, j) Ponape.
With the help of the ERA5 reanalysis data, we investigate the distribution of the abnormal water vapor during the four El Niño events. Here, we introduce an important scalar of column-integrated water vapor mass (CWV), also called precipitable water, which is expressed as (Viswanadham, 1981),
where Q is the CWV in units of kg m−2, g=9.8 m s−2 is the acceleration due to gravity, and the pressures p0 and pz denote the bounds of integration. Considering that atmospheric water vapor is mainly distributed below 8 km in the tropics due to the rapid decrease of water vapor with height (Mapes et al., 2017), we choose p0=1000 hPa on the ground and pz=300 hPa corresponding to a height of about 9 km. According to Eq. (4), we calculate the CWV between 30∘ S and 30∘ N from January 2005 to December 2019 based on the reanalysis data. Similarly, the monthly mean CWV and its anomaly can be derived from the CWV series. Figure 2 presents the mean CWV anomalies in the four El Niño winters. In the 2006/07 and 2015/16 EP El Niño events, the positive CWV anomalies appear in the equatorial central and eastern Pacific, while in 2009/10 and 2018/19 CP El Niño events, the positive anomalies concentrate in the central Pacific. This is consistent with previous studies (Kug et al., 2009; Takahashi et al., 2013; Xu et al., 2017). The negative anomalies occur in the tropical western Pacific and some tropical latitudes off the Equator in both hemispheres. In the region of the five radiosonde stations, the CWV anomaly is evidently negative and comparable between the 2009/10 and 2015/16 events, although the two events are classified into different El Niño types, whereas in the other two events, the water vapor anomaly is weak, which is in rough agreement with the radiosonde observation in Fig. 1.
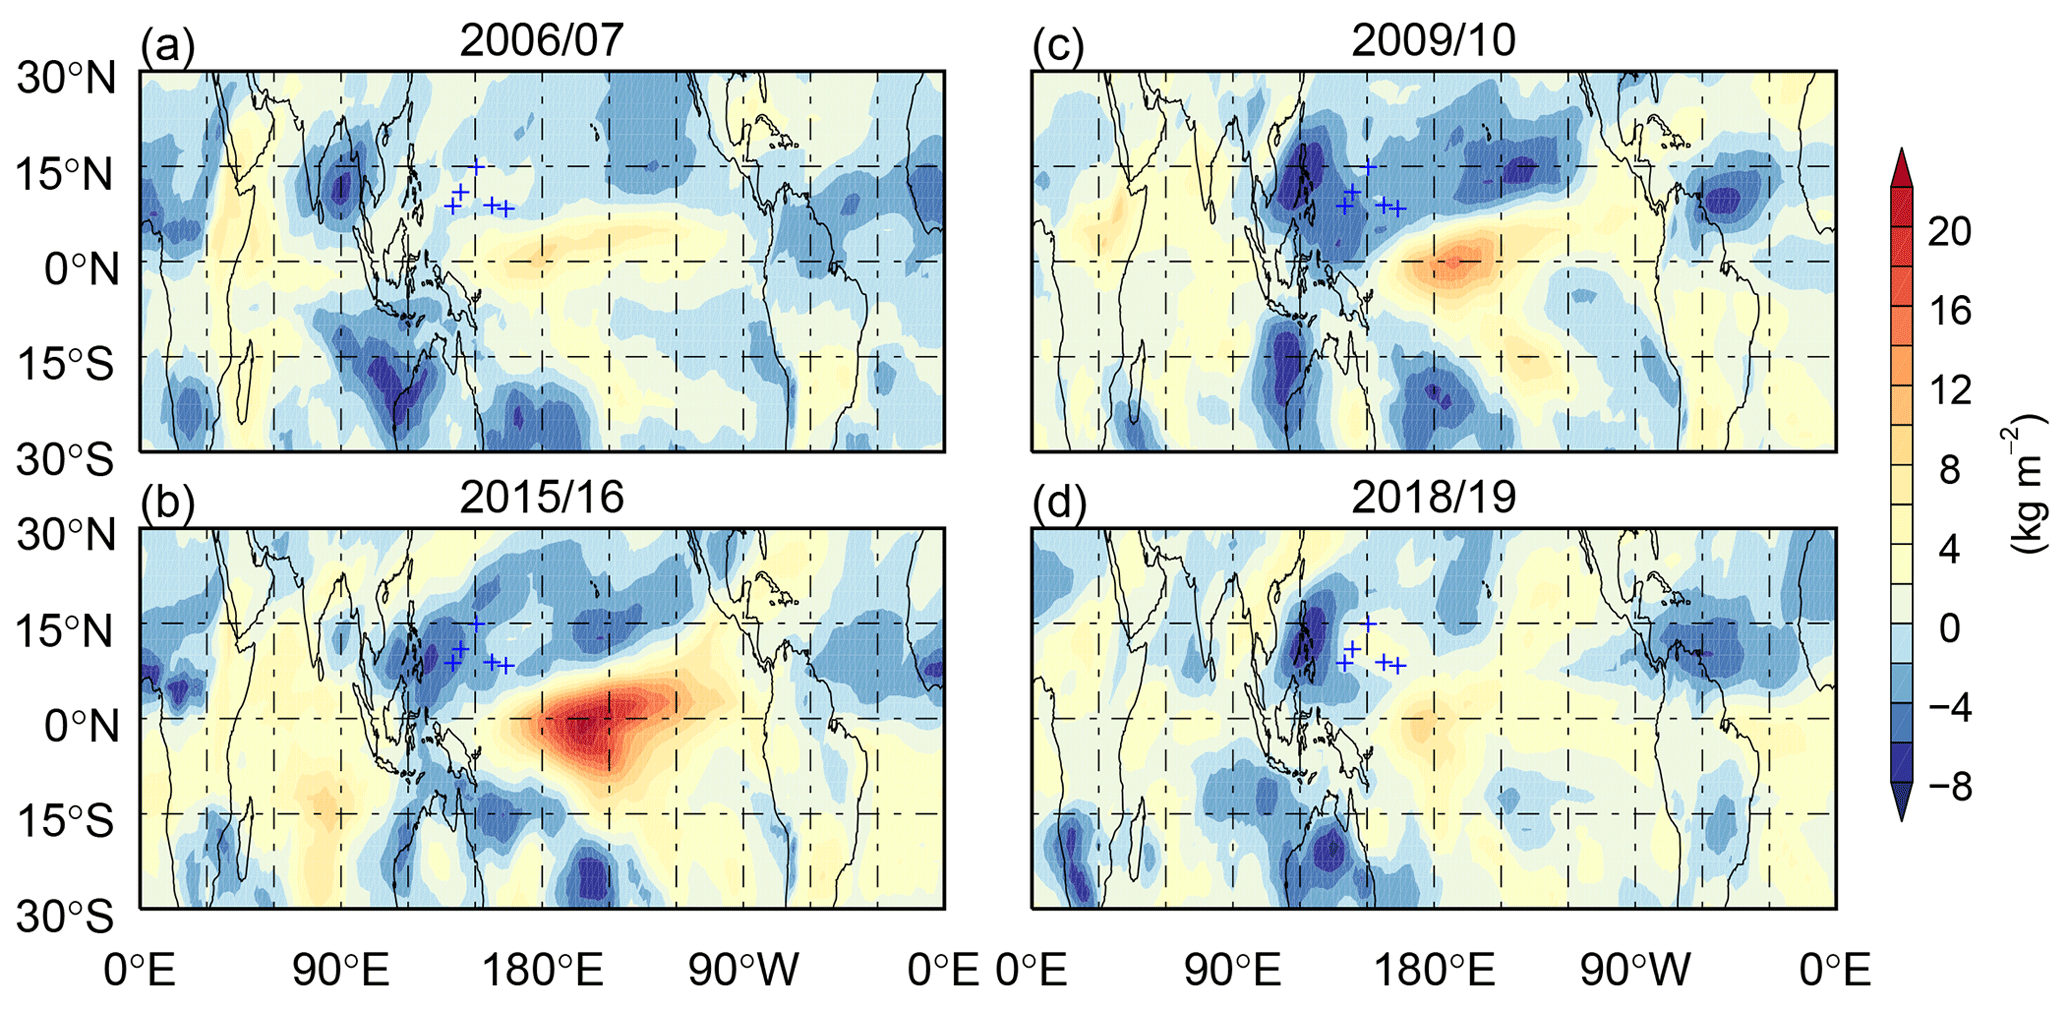
Figure 2CWV anomalies averaged over the (a) 2006/07, (b) 2015/16, (c) 2009/10, and (d) 2018/19 winters derived from ERA5 reanalysis data. The blue pluses denote the five radiosonde stations. The four El Niño events are classified into (left) EP El Niño and (right) CP El Niño.
3.2 Relation between CWV anomaly and ONI
We choose the reanalysis CWV anomalies at the five radiosonde stations to discuss the relationship between the water vapor anomaly and the ENSO. The monthly mean CWV anomaly averaged at the five stations is derived from the radiosonde and reanalysis data from January 2005 to December 2019. Considering that the ONI is a 3-month smoothed value, the monthly mean CWV anomaly is also smoothed in a 3-month moving window. Figure 3 depicts the ONI and monthly mean CWV anomalies from the radiosonde and reanalysis data. The CWV anomalies show a similar temporal evolution between the observation and the reanalysis with a significant correlation coefficient R= 0.83, but a negative correlation to the ONI with a delay of around several months. The correlation coefficient between the CWV anomaly and the ONI is calculated to be −0.63 (−0.62) with a lag of 3 (2) months. One can note from Fig. 3 that when a strong La Niña occurs with ONI = −1.64 in November 2010, the water vapor anomaly reaches the positive maximum in February and March 2011 from the observation and reanalysis data, respectively. However, for the 2015/16 super El Niño event with the peak of ONI = 2.6 in December 2015, an extremely negative anomaly appears in both the observation and reanalysis. The negative anomaly attained is as large as −5.39 and −5.75 kg m−2 in February 2016 from the radiosonde and reanalysis data, respectively. Similarly, the 2009/10 event has a large index of ONI = 1.6 in November 2009, which leads to the strong CWV anomalies of −2.45 and −3.94 kg m−2 in January 2010 from the radiosonde and reanalysis data, respectively. Hence, the ENSO or SST anomaly plays an important role in the water vapor variation in the tropical western Pacific.

Figure 3Time series of (red) ONI index and monthly mean CWV anomalies derived from (blue) radiosonde observation and (green) reanalysis data at five radiosonde stations.
4.1 Tropical atmospheric circulations
Besides the SST effect, evaporated sea water is carried to higher levels by the upward flow, and thus the water vapor variability in the troposphere is closely related to the atmospheric circulation. In the tropics, there are several well-known circulations, i.e., the Hadley, Walker, and monsoon circulations, and each circulation has its own features and driving force, although these circulations may also be highly coupled with each other. In this way, we attempt to estimate the contributions of each tropical circulation to the observed water vapor anomalies in the El Niño events. According to Helmholtz's theorem, horizontal wind velocity can be decomposed into rotational and divergent winds,
where Ψ is the stream function; Φ is the velocity potential; k is the unit vector in the vertical direction; and VH, VΨ, and VΦ are the horizontal, rotational, and divergent wind velocities, respectively. Thermal driving force resulting from differential heating and temperature contrast is essential to cause atmospheric convergence and divergence and vertical motion and then the formation of atmospheric circulation. The stream function involved in the rotation field has no contribution to the atmospheric vertical motion, while the velocity potential may be chosen as the indicator of the atmospheric circulations since it is in connection with the atmospheric convergence and divergence associated with the upward and downward motions in the tropical region (Kanamitsu and Krishnamurti, 1978; Newell et al., 1996; Wang, 2002). Because atmospheric water vapor comes mainly from the lower atmosphere through transport of ascending flow, we selected the velocity potential at 850 hPa to represent the characteristics of the tropical circulations in the lower troposphere since the pressure level was extensively used to investigate the lower atmospheric circulation (Wang, 2002; Weng et al., 2008; Zhao et al., 2010). The divergence and velocity potential fields are calculated by using the ECMWF reanalysis horizontal winds at 850 hPa according to the following equation (Krishnamurti, 1971; Tanaka et al., 2004):
where D is the divergence of horizontal wind. In Eq. (6), the negative sign means that the divergent wind flows from the large velocity potential to the small velocity potential.
Based on the different driving mechanisms and movement features, Tanaka et al. (2004) decomposed the tropical circulation in the upper troposphere (200 hPa) into the Hadley, Walker, and monsoon circulations, which had the advantage of being able to quantitatively evaluate the intensity of the three tropical circulations by means of the separation of the velocity potential into three orthogonal spatial patterns. Subsequently, Takemoto and Tanaka (2007) used these circulation definitions to analyze the Hadley, Walker, and monsoon circulations at 850 hPa in the lower troposphere and compared the three circulation components with those in the upper troposphere (200 hPa), which indicated that the velocity potential intensities could be an index of each circulation in the lower troposphere without a notable influence from the surface. Considering that atmospheric water vapor is mainly distributed below 8 km, directly relevant to the lower tropospheric circulation, we follow the definitions and methodology proposed by Tanaka et al. (2004) to obtain these tropical circulations at the 850 hPa level for investigating their contributions to the observed water vapor anomaly in the four El Niño events. The velocity potential is divided as follows (Tanaka et al., 2004):
where x, y, and t are the longitude, latitude, and time, respectively. The square brackets and asterisk denote the zonal mean and the deviation from the zonal mean, respectively, and the overbar and prime denote the annual mean and the departure from the annual mean, respectively. The first term on the right of Eq. (7) is the zonal-mean component of the velocity potential field, defined as the Hadley circulation because this circulation, driven by the large-scale meridional differential heating, may be treated as axisymmetric. The second and third terms on the right are the annual mean of the deviation from the zonal mean and the deviation from the annual mean, respectively. The third term is regarded to be the monsoon circulation since the monsoon circulation has conspicuous seasonal variability as the sea–land heat contrast changes. The second term is referred to as the Walker circulation. The separation is not perfect for the Walker circulation without seasonal variation, as pointed out by Tanaka et al. (2004). The Walker circulation is induced by the different SST along the Equator. Considering that the El Niño usually lasts for more than a year, with a maximum ONI in winter, we chose the period of June to the next May to estimate the Walker circulation and thus obtain the Walker circulation anomaly during El Niño relative to its climatic average. In this way, the problem may not be very serious. The definitions and decomposition of the tropical circulations have extensively been used to study the influences of the SST warming pattern on the interannual variation and long-term trend of the Hadley, Walker, and monsoon circulations in association with the hydrological cycle (Tanaka et al., 2005; Park and Sohn, 2008; Li and Feng, 2013; Ma and Xie, 2013).

Figure 4Climatic means of velocity potential (shading) and divergent wind fields (arrows) at 850 hPa in DJF derived from reanalysis data during 2005–2019. The red pluses denote the five radiosonde stations.
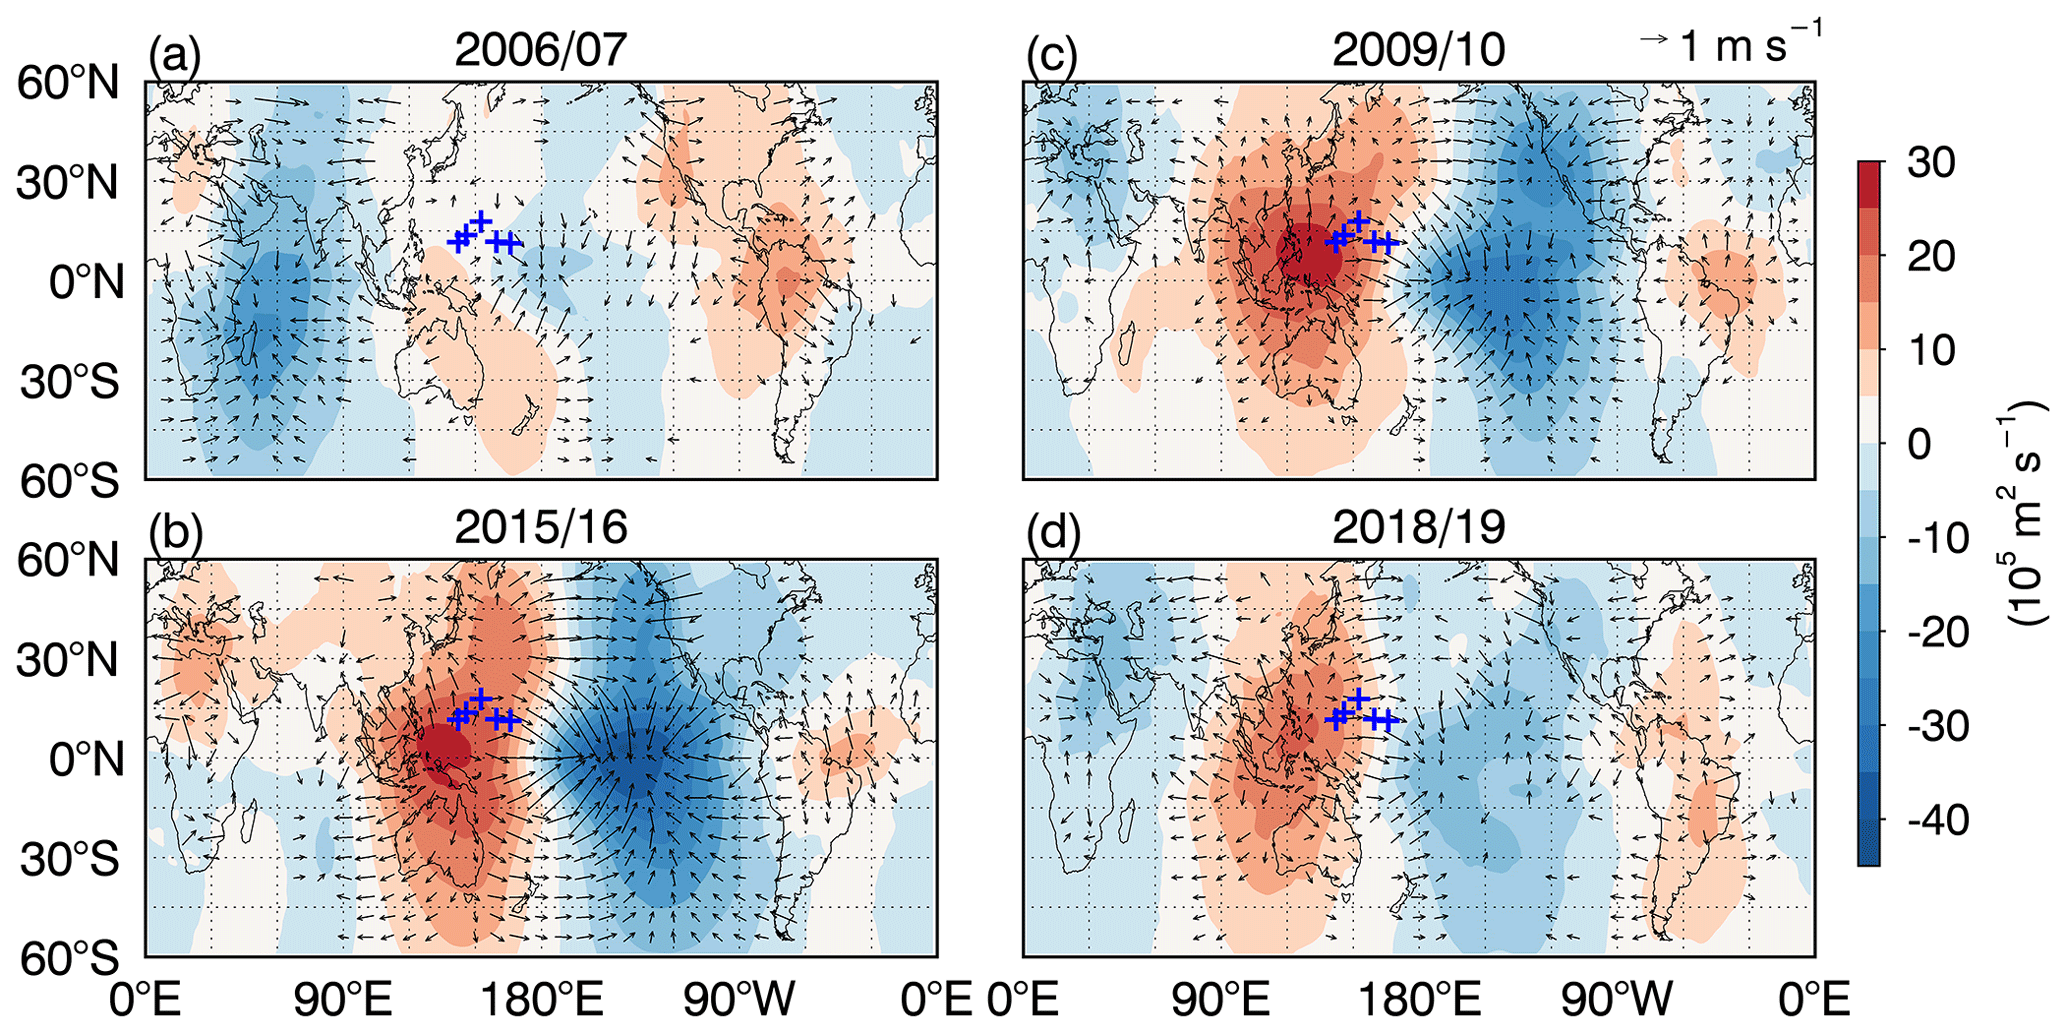
Figure 5Anomalies of velocity potential (shading) and divergent wind (arrows) at 850 hPa in the winters of (a) 2006/07, (b) 2015/16, (c) 2009/10, and (d) 2018/19. The blue pluses denote the five radiosonde stations.
We first calculate the divergence field of the horizontal wind at 850 hPa from 2005 to 2019 by using the reanalysis horizontal wind data, and then the velocity potential is deduced according to Eq. (6), which is equivalent to solving the Poisson equation. Next, following Eq. (7), the velocity potential filed is decomposed into the Hadley, Walker, and monsoon circulation components. In this way, their monthly climatic mean is derived from their time series. Figure 4 presents the climatic means of the velocity potential and divergent wind fields in DJF. We choose the velocity potential as the proxy of the circulation intensity, and thus the intensity of the tropical circulation in winter can clearly be seen from Fig. 4. The prominent negative peak of about m2 s−1 in the velocity potential is situated in the western Pacific warm pool, and thus there is the convergence center of horizontal wind field, which induces the rising motion in the lower troposphere over the region, including the five radiosonde stations. Hence, the atmospheric water vapor is abundant in this region due to the transport by the strong ascending flow. In contrast, the maximum velocity potential of 48×105 m2 s−1 appears in the northeastern Pacific Ocean and the southern part of the North American continent, meaning a downward motion associated with the divergence center in those regions, as well as less water vapor relative to the western Pacific warm pool region.
4.2 Atmospheric circulation anomalies
Next, we focus on the tropical circulation anomaly in the four El Niño events. Figure 5 illustrates the velocity potential and divergent wind anomalies at 850 hPa in the four winters. Here, we define the velocity potential value as the circulation index with the units measured by 105 m2 s−1, and the velocity potential anomaly is regarded accordingly as the index of the circulation anomaly. As a consequence, the positive index of the circulation anomaly indicates the weakened convergence and rising motion or the strengthened divergence and sinking motion and vice versa for the negative index of the circulation anomaly. Hence, the positive and negative indices mean the decrease and increase of water vapor in the troposphere due to the vertical transport change, respectively. In Fig. 5, the positive index of the circulation anomaly occurs in the western Pacific, especially in the 2009/10 and 2015/16 El Niño winters, and thus the ascending motion is suppressed in that region, and the negative water vapor anomalies are recorded in the radiosonde observation. On the contrary, there is the negative index in the equatorial eastern Pacific, which causes the descending flow to be suppressed. Correspondingly, the positive CWV anomaly over the equatorial eastern Pacific can be seen from Fig. 2.
According to Eq. (7), we calculate the velocity potential of the Hadley, Walker, and monsoon circulations and their anomaly indices at 850 hPa from the reanalysis data. Figure 6 presents the velocity potential and anomaly index of the Hadley circulation in the four El Niño winters. Now that the Hadley circulation is a tropical circulation driven by the meridional differential heating in the global radiative process (Oort and Yienger, 1996), this large-scale circulation is very similar in different winters, with the circulation index increasing from the negative peak at about 12∘ S to positive peak at 23∘ N, and is little affected by El Niño, with the anomaly index being less than 2×10⁵ m2 s−1 or 2 units. Even so, the pattern of the Hadley circulation anomaly is distinguished between the EP El Niño and CP El Niño. During the 2018/19 (2009/10) CP El Niño winters, the index of the Hadley circulation anomaly is positive over the entire tropics with the maximum of 1.74 (1.65) units at 3∘ N (2∘ N). However, in the 2006/07 and 2015/16 EP El Niño winters, the positive index is located at about 5–30∘ N, and the negative index occurs over about 30∘ S–5∘ N. Feng and Li (2013) suggested that the different patterns of the Hadley circulation anomalies between the CP and EP El Niños are associated with the contrasting underlying thermal structure changes because the maximum of the zonal-mean SST anomalies is moved northward to about 10∘ N in the CP event relative to the maximum around the Equator in the EP event. At the five radiosonde sites, the averaged anomaly index is 0.29, 1.56, 0.65, and 1.37 units in the 2006/07, 2009/10, 2015/06, and 2018/19 winters, respectively, indicating that the Hadley circulation is too stable to have a significant impact on the water vapor variation.
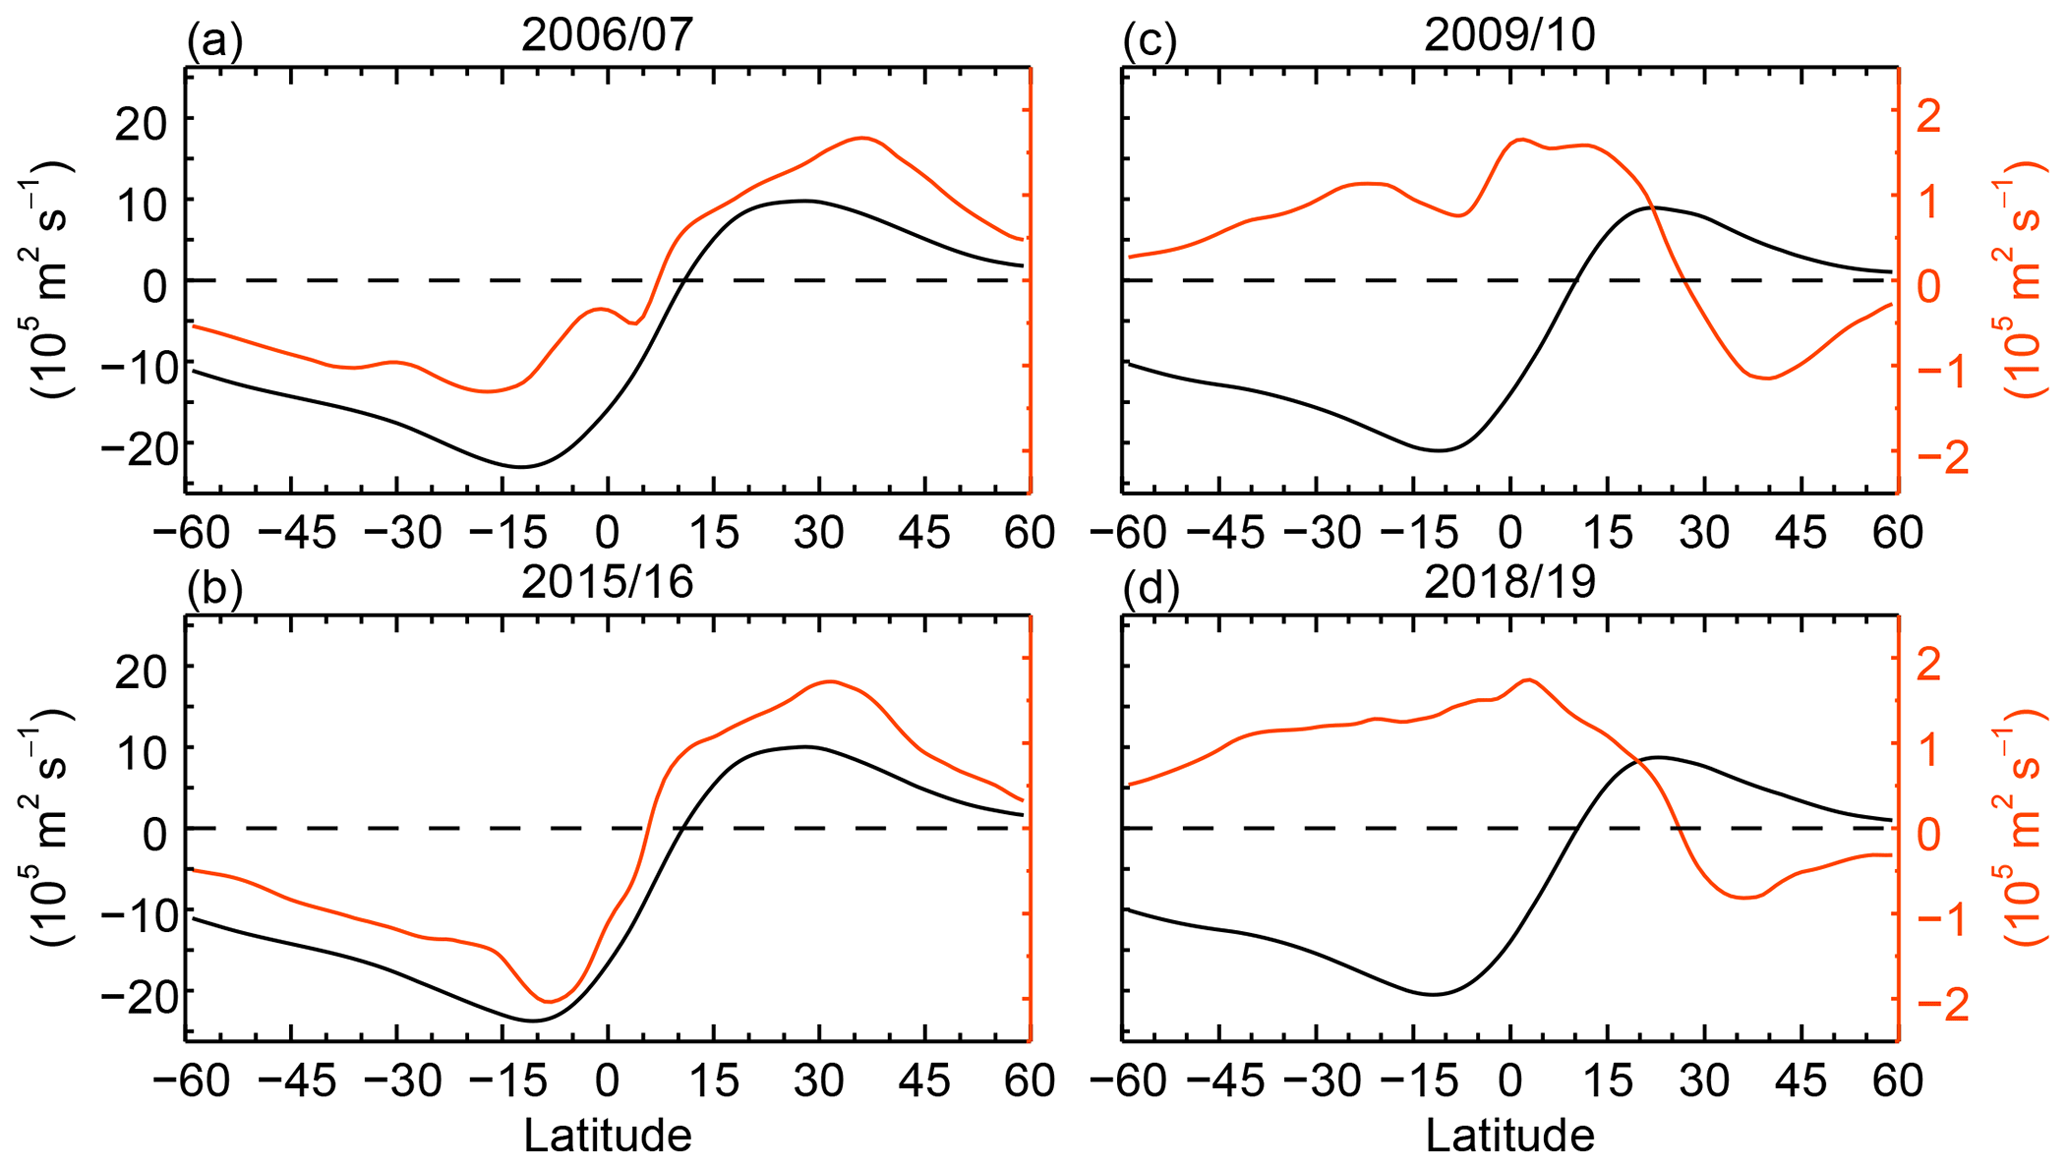
Figure 6Velocity potential (black) and anomaly index (orange) of the Hadley circulation at 850 hPa derived from reanalysis data in the (a) 2006/07, (b) 2015/16, (c) 2009/10, and (d) 2018/19 winters.

Figure 7Velocity potential(shading) and divergent wind (arrows) of the Walker circulation and their anomalies at 850 hPa in the (a, e) 2006/07, (b, f) 2015/16, (c, g) 2009/10, and (d, h) 2018/19 winters. Panels (a–d) show the velocity potential and divergent wind, and panels (e–h) show their anomalies. The red and blue pluses denote the five radiosonde stations.

Figure 8Velocity potential (shading) and divergent (arrow) wind of monsoon circulation and their anomalies at 850 hPa in (a, e) 2006/07, (b, f) 2015/16, (c, g) 2009/10 and (d, h) 2018/19 winters. Panels (a–d) denote the velocity potential and divergent wind, and (e)–(h) denote their anomalies. The blue plus denotes the five radiosonde stations.
Figure 7 depicts the velocity potential and anomaly index of the Walker circulation at 850 hPa in the El Niño winters. Relative to the Hadley circulation, the Walker circulation is the local circulation formed over the tropical Pacific with intense ascending flow in the western Pacific and descending flow in the eastern Pacific, and thus the circulation has a high variability associated with the SST anomaly caused by ocean current. As the Walker circulation is directly related to ENSO, the scenarios of the Walker circulation anomalies are roughly consistent with each other among the four El Niño events. In general, the positive and negative indices of the Walker circulation anomaly are located in the western and eastern Pacific, opposite to the circulation index, respectively, which illustrates that the Walker circulation anomaly in El Niño suppresses the strong rising in the western Pacific and sinking in the eastern Pacific. Nevertheless, the strength of the circulation anomaly is the significant difference among the four events. In the 2015/16 winter, the Walker circulation anomaly, with peak indices as large as 26.8 and −27.7 units in the equatorial Pacific, is much stronger than in the other three winters. Hence, the Walker circulation variation plays a key role in the CWV anomaly during the 2015/16 super El Niño event.
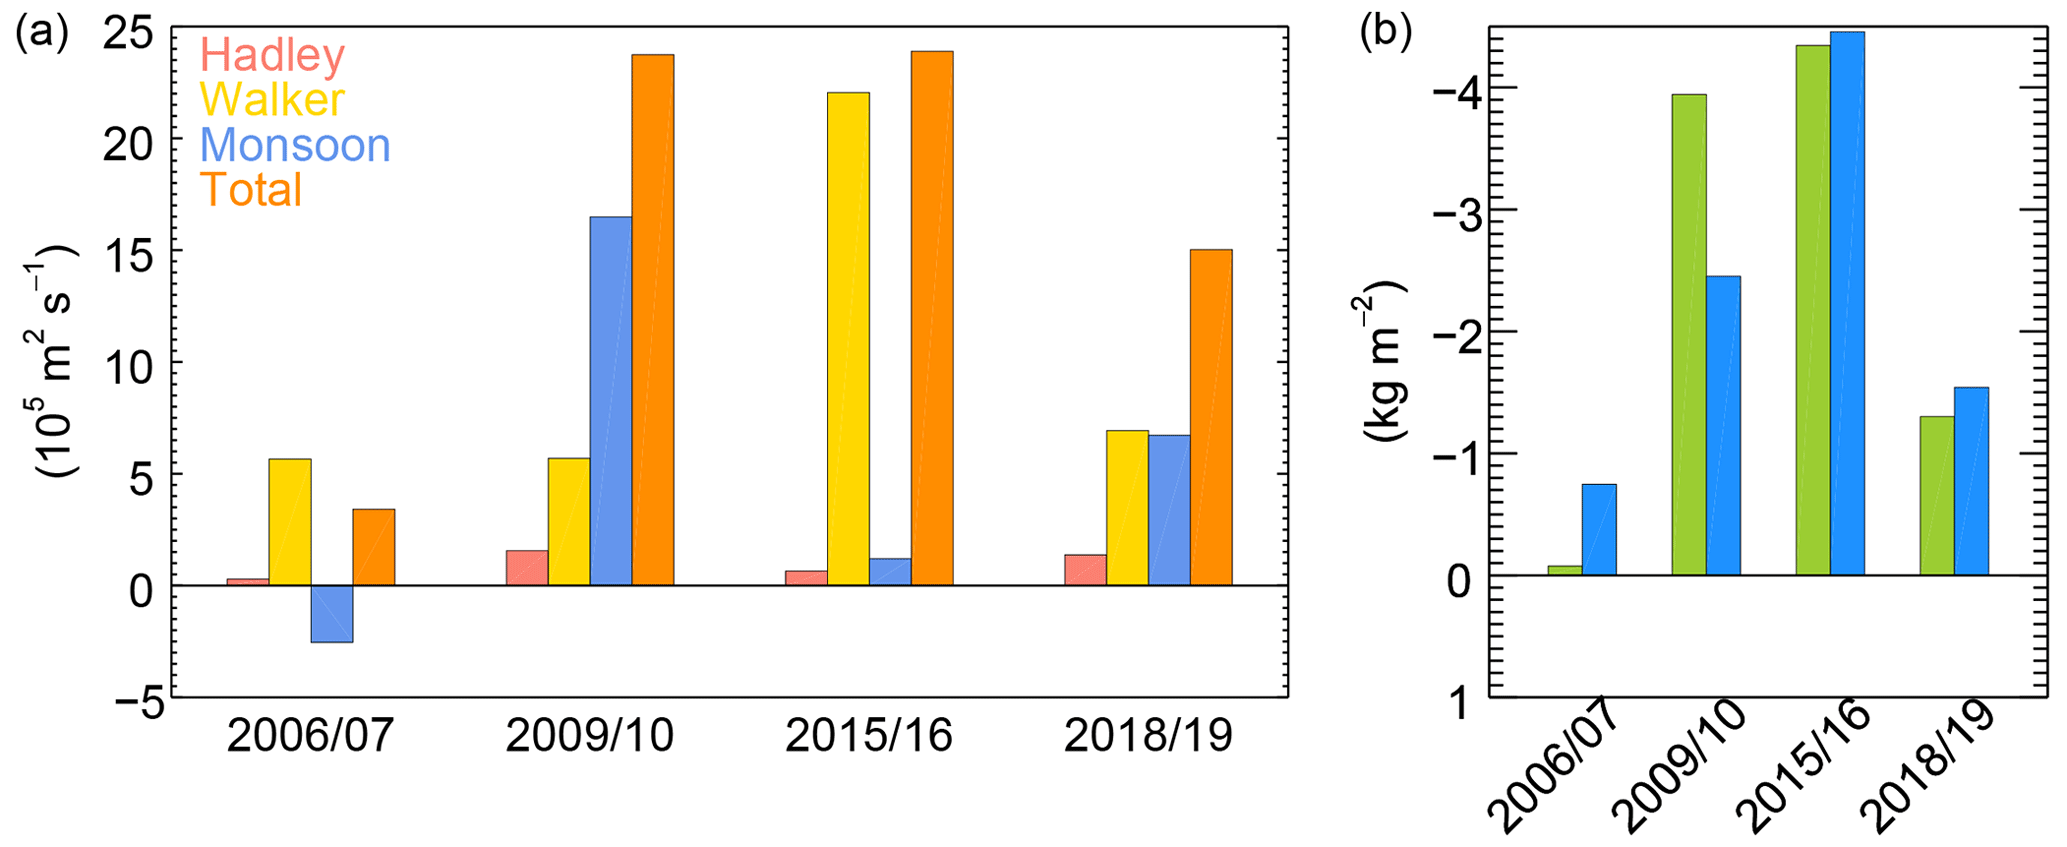
Figure 9(a) Indices of Hadley (red), Walker (yellow), monsoon (blue), and total (orange) circulation anomalies and (b) CWV anomalies derived from radiosonde (azure) and reanalysis (green) data at five radiosonde stations in four El Niño winters.
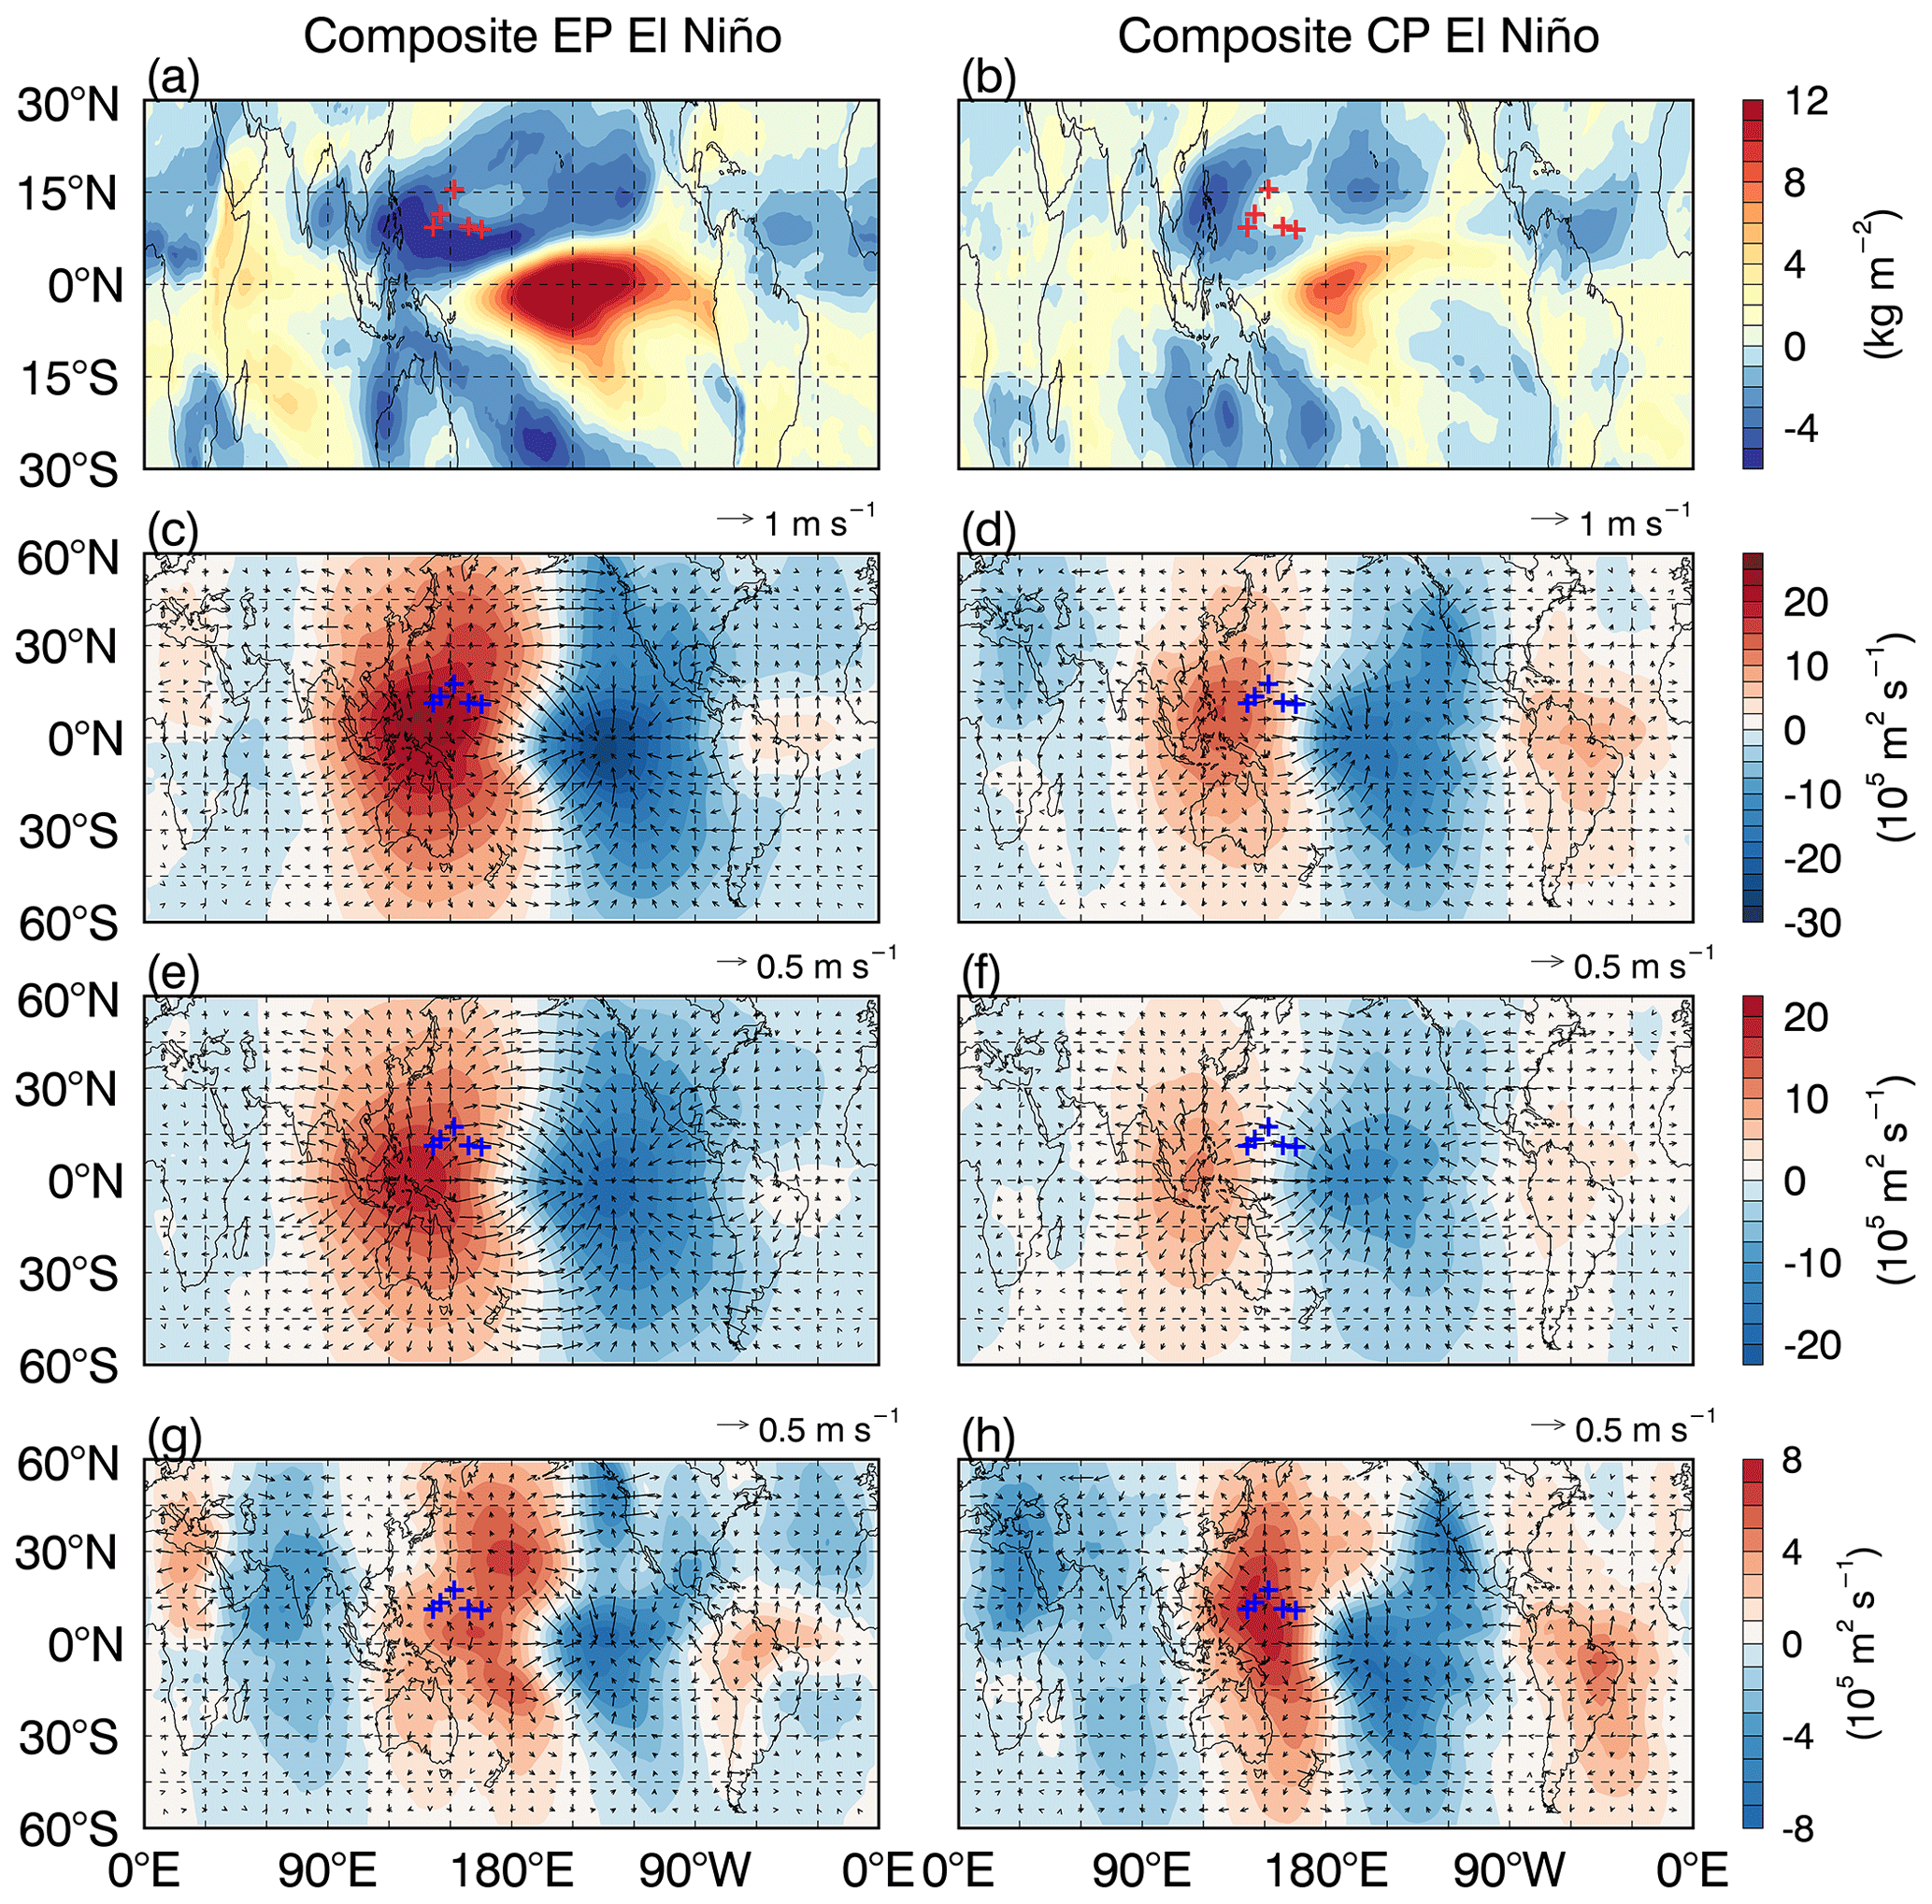
Figure 10Anomalies of (a, b) CWV and velocity potential and divergent wind at 850 hPa in the (c, d) total, (e, f) Walker, and (g, h) monsoon circulations for composite EP and CP El Niños derived from reanalysis data. The left and right columns correspond to the composite EP and CP El Niños, respectively. The shading and arrows in (c–h) denote the velocity potential and divergent wind anomalies, respectively. The red and blue pluses denote the five radiosonde stations.
The velocity potential and anomaly index of the monsoon circulation in the four El Niño winters are plotted in Fig. 8. The monsoon circulation in the lower atmosphere blows from the land to the sea in winter, and thus it can be seen from Fig. 8 that the pattern of the monsoon circulation is evidently different from that of the Walker circulation shown in Fig. 7. The anomaly of the monsoon circulation is sensitive to the type of El Niño, which is also distinguished from that of the Walker circulation. Early studies showed that the CP and EP El Niños have different effects on Indian and eastern Asian monsoon rainfall (Weng et al., 2008; Wang et al., 2013). The monsoon circulation anomaly at the radiosonde stations has an index around zero in the EP El Niño events, which is far weaker relative to the large positive index in the CP El Niño events, similar to previous investigations (Fan et al., 2017). In the 2009/10 El Niño event, the pronounced anomaly with a peak index of 17.8 units takes place in the western Pacific, which implies that the monsoon circulation anomaly has an important influence on the negative water vapor anomaly in the radiosonde observation.
4.3 Contribution to water vapor anomaly
We estimate the contributions of the Hadley, Walker, and monsoon circulation anomalies to the water vapor anomaly observed by the radiosonde in the four El Niño events by means of comparing the indices of the circulation anomalies. Figure 9 illustrates the indices of the circulation anomalies at 850 hPa and the CWV anomalies derived from the radiosonde and reanalysis data, and these circulation anomaly indices and CWV anomalies are the values averaged at the five radiosonde sites in winter. It can be seen from Fig. 9 that the CWV anomalies in the reanalysis and radiosonde data qualitatively increase with the increasing index of the total circulation anomaly. As discussed above, the contribution of the Hadley circulation anomaly is very small with a maximum of only 1.56 units in the 2009/10 event. The anomaly of the Walker circulation makes a considerable contribution in each case, especially for the EP El Niño events, and it is the strongest in the three tropical circulation anomalies. The index of the Walker circulation anomaly counts for 92.3 % of the total anomaly index (23.89 units) in the 2015/16 El Niño winter and even exceeds the total index in the 2006/07 event owing to the negative anomaly of the monsoon circulation. The anomaly of the monsoon circulation shows an evident change from one event to another because it is sensitive to the local heat contrast and the El Niño shift. In the western Pacific, the CP El Niño can lead to the obvious positive anomaly of the monsoon circulation. The index of the monsoon circulation anomaly is about 69.7 % (44.7 %) of the total anomaly index in the 2009/10 (2018/19) CP El Niño winter. Consequently, for the two intense El Niño events, the water vapor anomaly is caused mainly by the Walker circulation anomaly in the 2015/16 EP event but by the monsoon circulation anomaly in the 2009/10 CP event. The Walker and monsoon circulation anomalies nearly equally (and oppositely) contribute to the CWV anomaly in the 2018/19 (2006/07) event. Therefore, outside of the Hadley circulation anomaly, the Walker and monsoon circulation anomalies may have the largest differences in their contributions to water vapor variation in different El Niño events. In addition, in the 2015/16 and 2018/19 winters, the reanalysis CWV anomalies of −4.34 and −1.30 kg m−2 are roughly consistent with −4.46 and −1.54 kg m−2 in the radiosonde observation, respectively. However, in the first two events, there is a distinct difference in the CWV anomaly between the reanalysis and radiosonde data, and we will discuss the discrepancy in detail below.
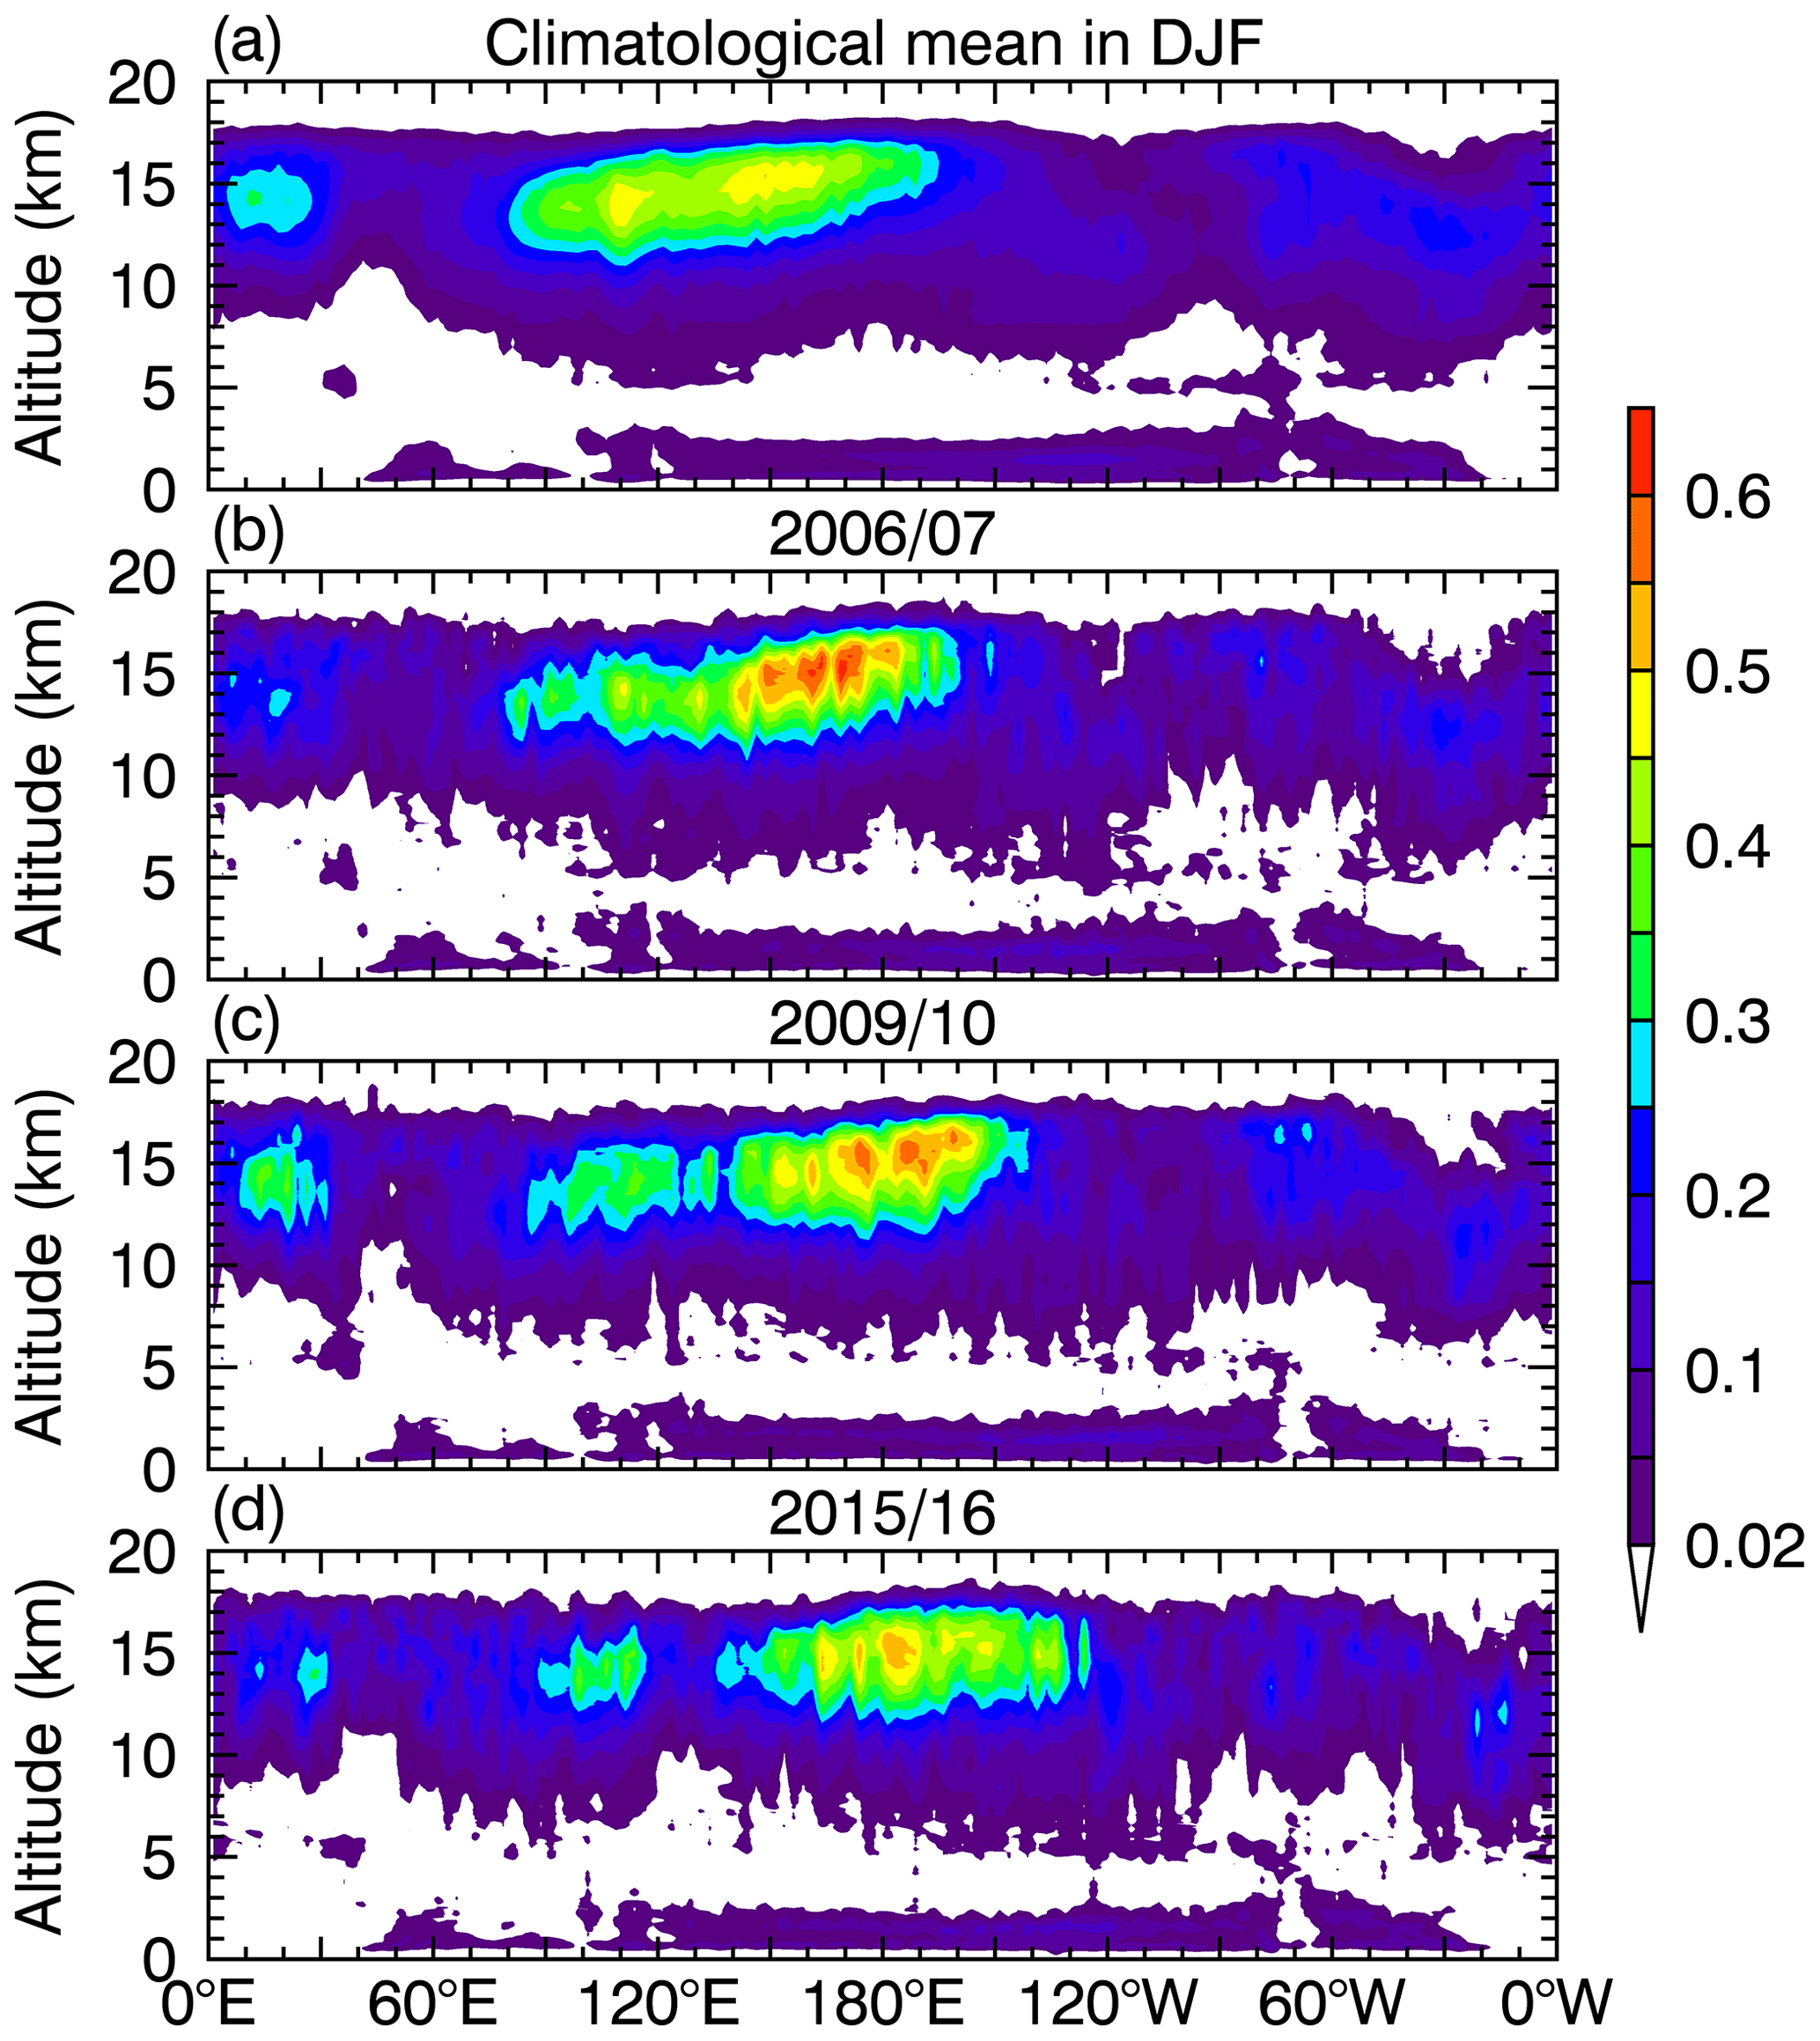
Figure 11Distribution of cloud occurrence between 0∘ N and 15∘ N in (a) all winters and the (b) 2006/07, (c) 2009/10, and (d) 2015/16 winters derived from CALIPSO from June 2006 to December 2016.
In order to obtain the general features of water vapor and circulation anomalies in the EP and CP El Niño events, we extend the reanalysis data back to 1979 to examine two types of composite El Niño events. There are six EP El Niño events in the winters of 1982/83, 1986/87, 1991/92, 1997/98, 2006/07, and 2015/16 and five CP El Niño events in the 1994/95, 2002/03, 2004/05, 2009/10, and 2018/19 winters for the 41 years from 1979 to 2019, which are averaged as the composite EP and CP El Niños, respectively. We calculate the CWV anomalies in the two composite events based the climatic mean CWV in 41 winters, and the corresponding velocity potential and divergent wind anomalies of the Walker, monsoon, and total circulations from the reanalysis horizontal wind at 850 hPa, which are shown in Fig. 10. The Hadley circulation anomaly (not presented) is very small, and its patterns in the composite EP and CP El Niños are also analogous to those in the EP and CP events shown in Fig. 6, respectively. On the whole, Fig. 10 illustrates that the total circulation anomaly is stronger in EP event than in CP event and that the CWV anomaly is larger in EP event relative to that in CP event. The Walker circulation plays an important role in the total circulation anomaly, especially in EP El Niño. Despite significant variability from one event to another, the monsoon circulation anomaly not only has a larger proportion of the total anomaly but also has a slightly higher intensity in CP El Niño than in EP El Niño. At the five radiosonde stations, the composite events indicate that the CWV anomaly is about −4.36 and −1.74 kg m−2 in the EP and CP El Niños, respectively. The index of the Walker circulation anomaly accounts for about 75.8 % (47.8 %) of the total anomaly index in EP (CP) El Niño, while for the monsoon circulation, the anomaly index of 6.16 (4.66) units contributes to 49.6 % (18.4 %) of the total anomaly index in CP (EP) El Niño. Therefore, the relative importance of the Hadley, Walker, and monsoon circulation anomalies in the composite El Niños is roughly in accordance with that in the case study above. In addition, at the radiosonde sites, the CP El Niño can generally cause an intense monsoon circulation anomaly, which is comparable to and even larger than the Walker circulation anomaly; thus, the CP El Niño in the winter of 2009/10 may induce a quite strong monsoon circulation anomaly now that the 2009/10 event is the strongest CP El Niño from the 1980s onwards, as observed by satellite (Lee and McPhaden, 2010).
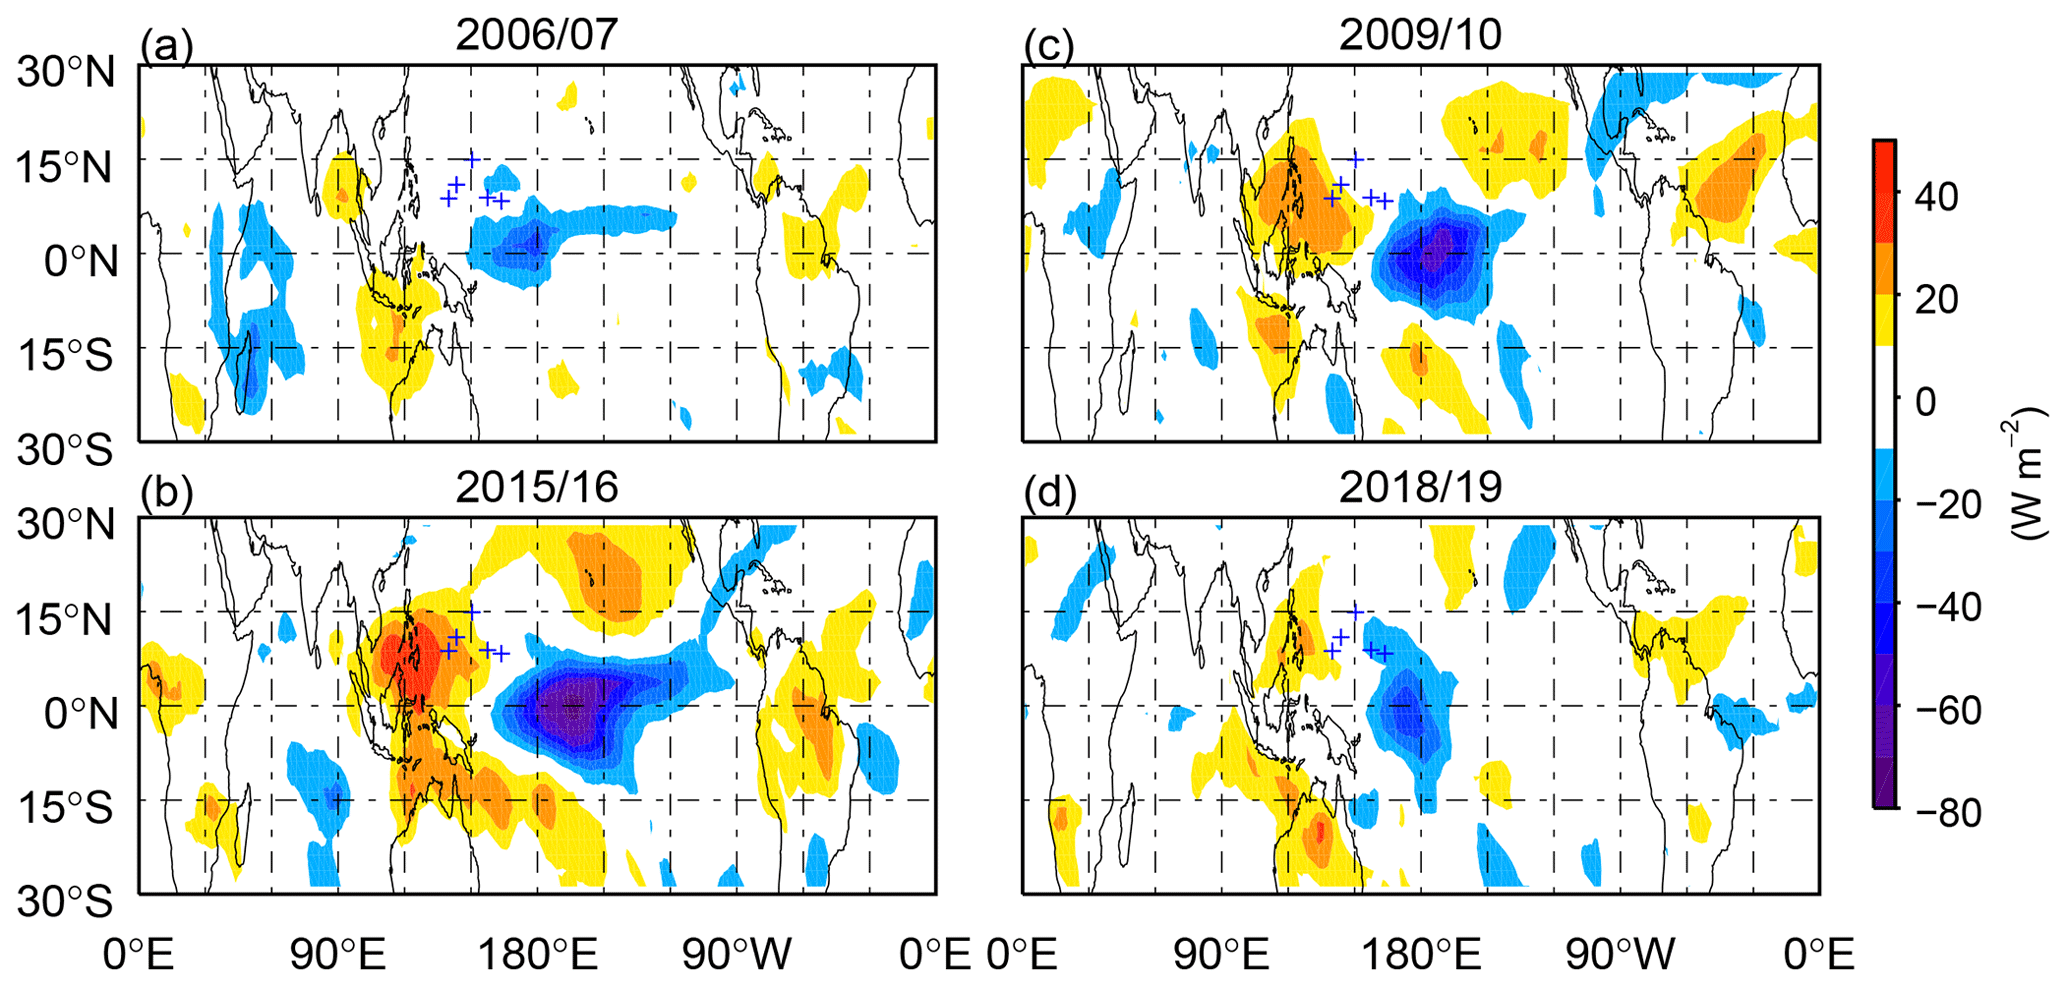
Figure 12OLR anomalies averaged over the (a) 2006/07, (b) 2015/16, (c) 2009/10, and (d) 2018/19 winters. The blue pluses denote the five radiosonde stations.
Using the cloud occurrence from the CALIPSO from June 2006 to December 2016, we calculate tropical cloud fraction between 0 and 15∘ N in the 2006/07, 2009/10, and 2015/16 winters and its climatic mean in winter, which is shown in Fig. 11. We also compute the OLR anomalies over 30∘ S–30∘ N in the four El Niño winters based on the monthly OLR data between 2005 and 2019. Figure 12 shows the OLR anomalies in the four El Niño events. In the western Pacific, the strong rising flow carries abundant water vapor to high level due to the convergence of horizontal wind field in winter, as shown in Fig. 4, and then the water vapor condenses to form clouds as it cools, and thus there are clouds over the tropical western Pacific. In the El Niño events, the cloud amount decreases from about 80 to 160∘ E but tends to increase between about 160∘ E to 120∘ W because of the tropical circulation changes. Owing to the reflection effect of cloud on OLR, the OLR change is opposite to the variation of cloud amount. In the 2009/10 and 2015/16 strong El Niño winters, the OLR is obviously enhanced in the tropical northwest Pacific and significantly reduced in the equatorial central eastern Pacific as the cloud occurrence changes. Hence, the cloud and OLR have a clear response to the water vapor anomaly in the El Niño events.
As described above, the reanalysis CWV anomalies at the radiosonde stations in the 2009/10 winter have almost the same intensity as that in the 2015/16 winter, but the radiosonde observation indicates that the water vapor reduction is evidently lower in the 2009/10 winter than in the 2015/16 winter. As shown in Figs. 11 and 12, the satellite observation shows that there is less cloud occurrence and more OLR at the radiosonde stations in the 2015/16 winter compared with in the 2009/10 winter. Therefore, this supports the radiosonde observation that the water vapor over the radiosonde stations in the 2009/10 winter may be moister than in the reanalysis.
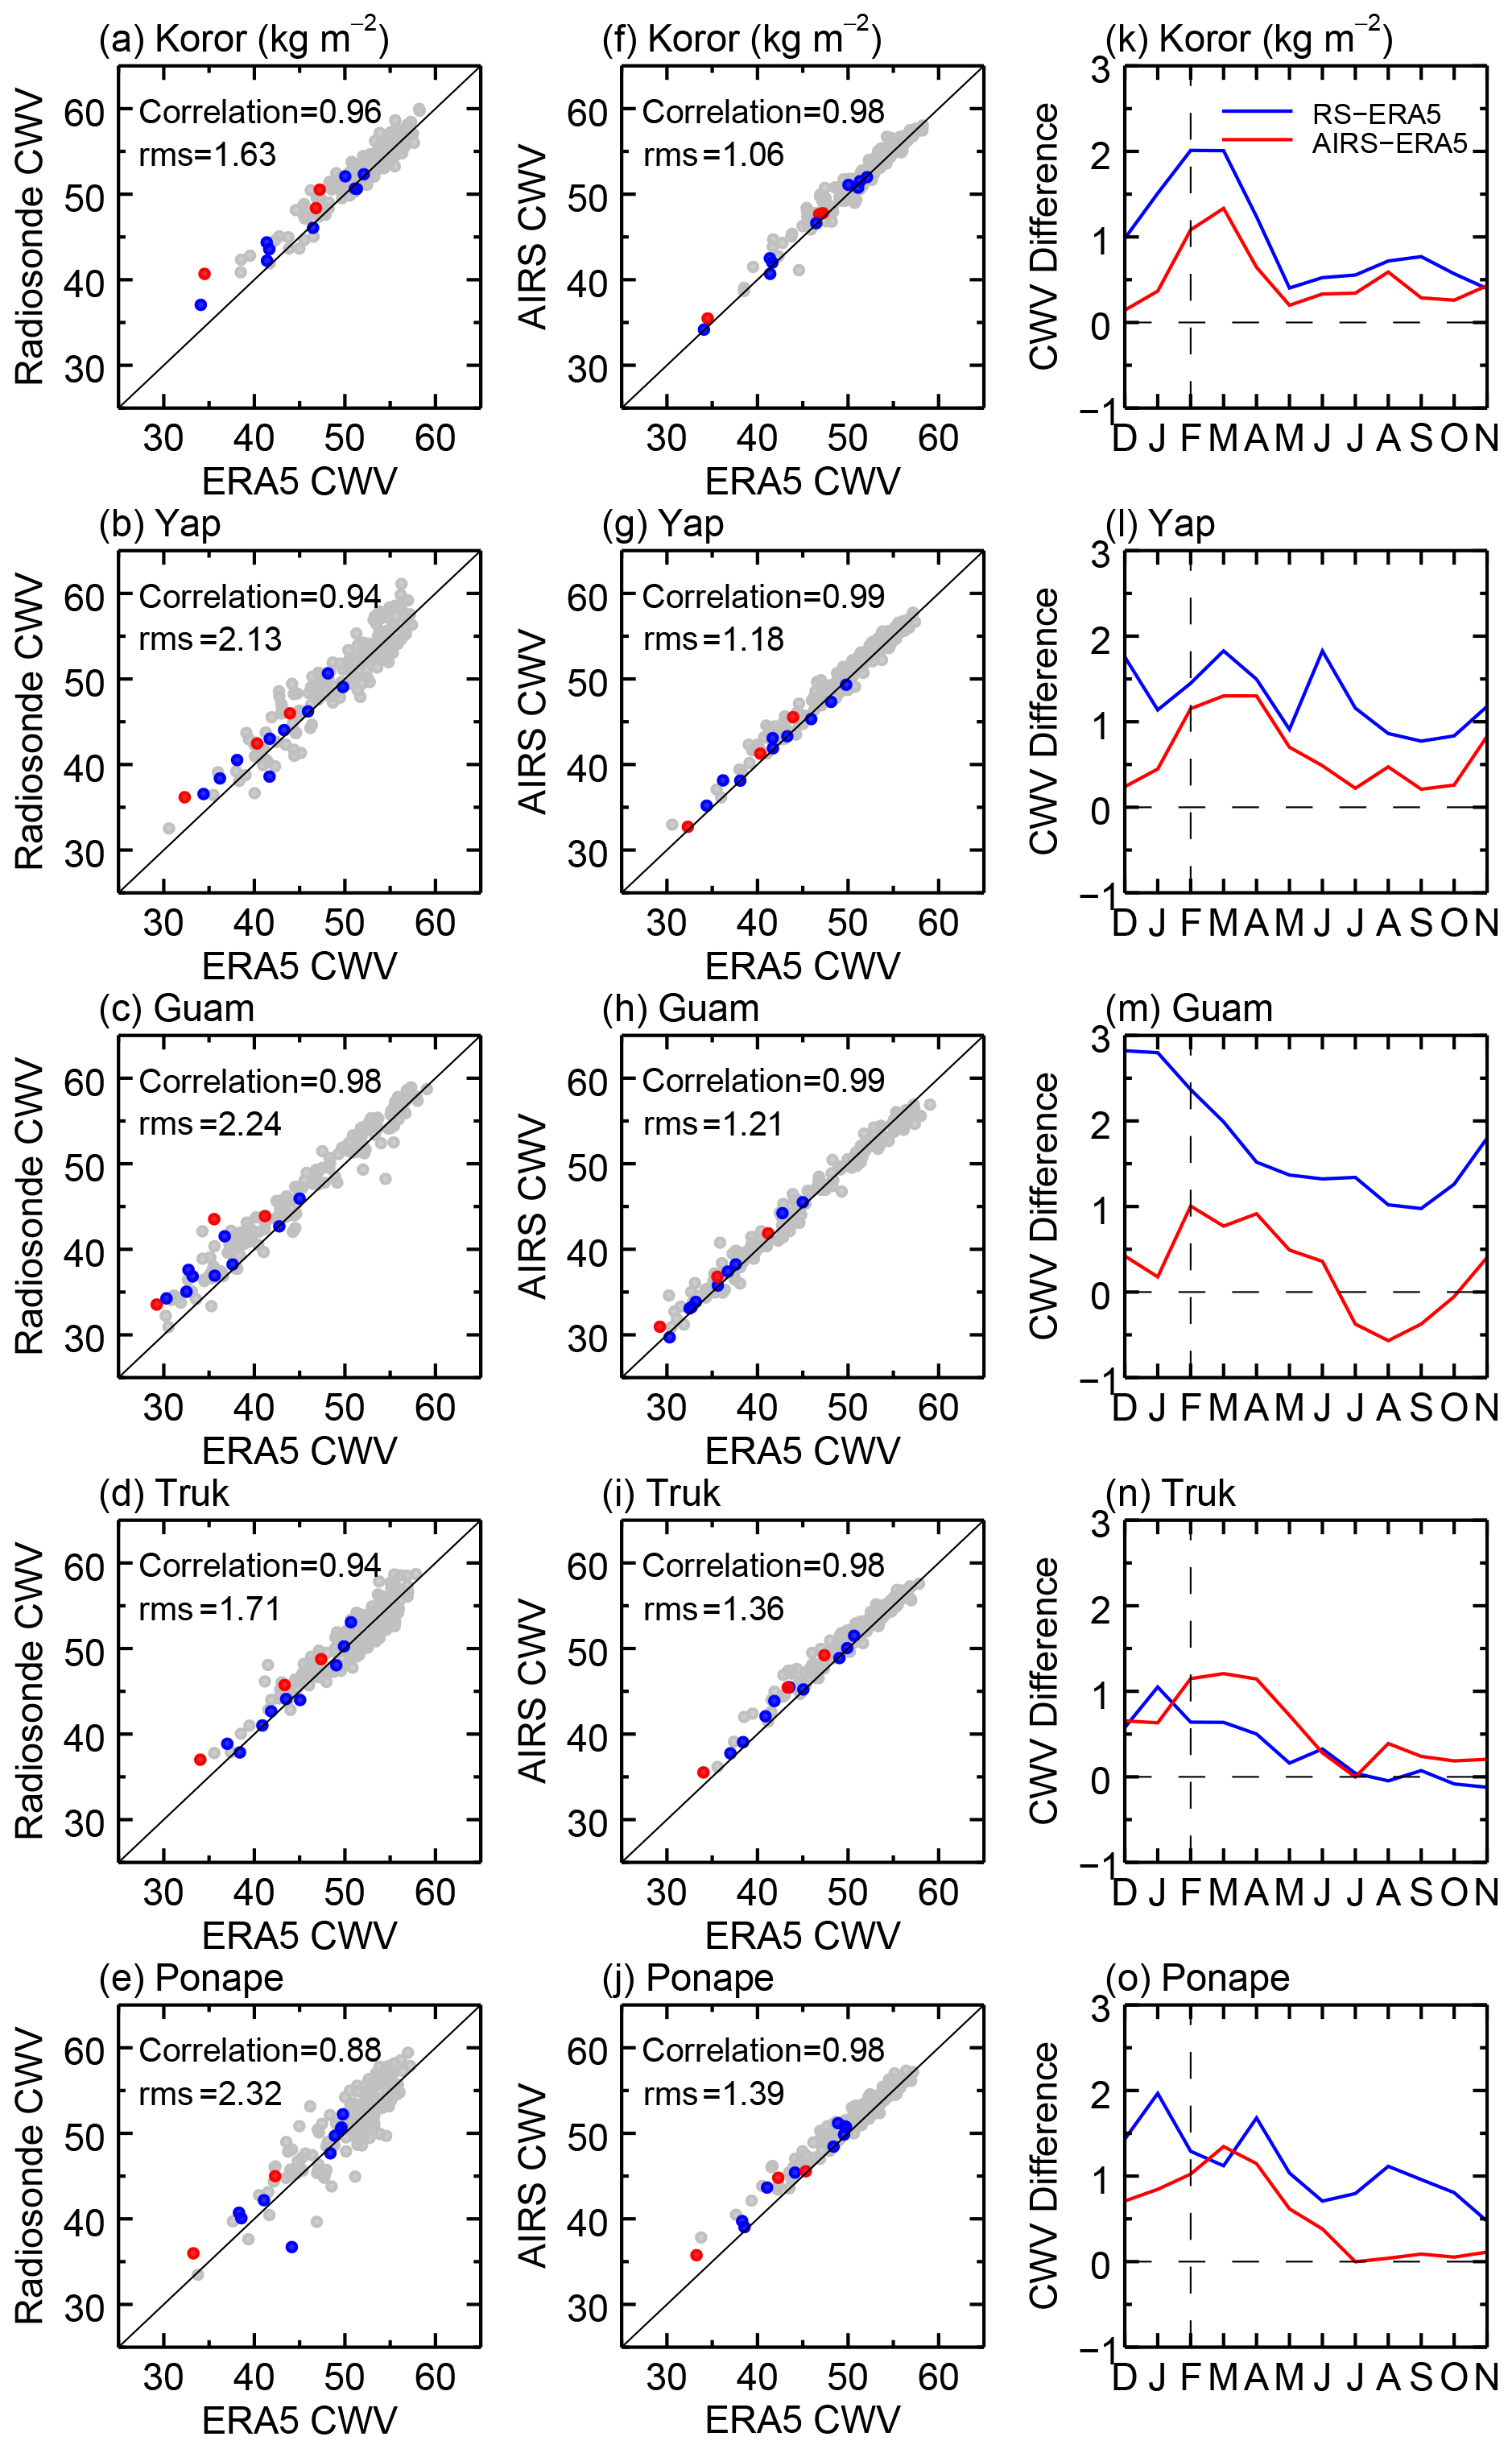
Figure 13Scatterplots of monthly mean CWV in winter derived from (a–e) radiosonde and (f–j) AIRS observations against corresponding CWV from ERA5 reanalysis and (k–o) climatic mean CWV difference (blue lines) between radiosonde and ERA5 reanalysis data and (red lines) between AIRS and ERA5 reanalysis data at five stations during 2005–2019. In (a–j), the red, blue, and gray dots denote the CWV values in the 2009/10 winter; the 2006/2007, 2015/2016, and 2018/2019 winters; and the other winters, respectively.
In the ERA5 reanalysis data, water vapor is calculated by a humidity analysis scheme introduced by Hólm (2003), which involves nonlinear transformation of the humidity control variable to render the humidity background errors nearly Gaussian. The transformation normalizes relative humidity increments by a factor that varies as a function of background errors of relative humidity and vertical level (Dee et al., 2011). For the ERA5 humidity analysis, measurements from radiosondes, surface synoptic observations, aircraft, and satellite observations are assimilated (Andersson et al., 2007). To date, the reliability and accuracy of ERA5 water vapor products have been extensively estimated. Overall, ERA5-retrieved precipitable water vapor (PWV) performs well over the Indian Ocean (Lees et al., 2020), central Asia (Jiang et al., 2019), the Antarctic (Ye et al., 2007), the East African tropical region (Ssenyunzi et al., 2020), and Varanasi (Kumar et al., 2021), which can be seen via comparisons with ground-based observations, satellite retrievals, and other reanalysis datasets. Nevertheless, some discrepancies can be noticed over small tropical islands characterized by steep orography (Lees et al., 2020), and it is reported that although PWV from the ERA5 reanalysis is in good agreement with the retrievals from the Global Navigation Satellite System over 268 stations, there is a bias of 4 mm PWV in the southwest of South America and western China due to the terrain limitations and fewer observations (Wang et al., 2020).
Since the CWV anomalies look more or less different between the radiosonde and reanalysis data, we compare the CWV in the ERA5 reanalysis with that in the radiosonde and satellite observations at the five stations and attempt to explain the different CWV anomalies between the reanalysis data and radiosonde observations in the 2006/07 and 2009/10 events. By using the reanalysis data and measurements of radiosondes and AIRS on the Aqua satellite for the 15-year period from 2005 to 2019, we calculate the monthly mean CWV at the five radiosonde sites, and Fig. 13 depicts the monthly mean CWV in winter as scatterplots of the reanalysis vs. radiosonde data and the reanalysis vs. AIRS data. Following this, the climatic mean difference is derived from these monthly mean CWV series in 2005–2019, which is also presented in Fig. 13. At the five stations, the monthly mean CWV in winter is distributed between 30 and 60 kg m−2 in all three datasets, and the CWV is obviously shifted to the low values in the El Niño winter, indicating the negative anomaly in the El Niño event. The correlation of the mean CWV series between the reanalysis and observations is quite high with the minimum coefficient of 0.88, and the root mean square (rms) of the mean CWV differences between the reanalysis and observations is less than 2.32 kg m−2. Meanwhile, the difference in the climatic mean CWV is mainly concentrated in the range of 0–2 kg m−2, except for several months at the Guam station, and thus the relative difference in the monthly mean CWV between the reanalysis and observations is generally smaller than 5 %. These comparisons and analyses confirm a fine confidence level of the ERA5 reanalysis and observational datasets. Nevertheless, there are still very small discrepancies among these data, and the discrepancy is relatively large between the radiosonde and reanalysis data compared to between the satellite and reanalysis data, which may be attributed to the different sampling times between the radiosonde and AIRS. It can be noted from Fig. 13 that the red dots representing the reanalysis vs. radiosonde data in the 2009/10 winter show a relatively large scatter around the symmetric axis, indicating a relatively large discrepancy in the CWV anomalies between the reanalysis data and radiosonde observation in this event, as in previous reports of some discrepancies over small tropical islands or in the regions with fewer observations (Lees et al., 2020; Wang et al., 2020). In comparison to the reanalysis data, the CWV derived from AIRS also shows the largest difference of 1.31 kg m−2 in the 2009/10 event, while the differences are less than 1 kg m−2 in the other three events.
Based on specific humidity in the reanalysis and radiosonde data, the CWV is calculated to be 44.87 (44.10), 43.06 (40.23), 41.16 (39.83), and 44.07 (42.87) kg m−2 in the radiosonde (reanalysis) data in the 2006/07, 2009/10, 2015/16, and 2018/19 events, respectively. In fact, the relative difference in the CWV between the radiosonde and reanalysis data is very small, with only 1.7 % in the 2006/07 winter and 6.6 % in the 2009/10 winter. The CWV average in winter is 45.61 (44.17) kg m−2 in the radiosonde (reanalysis) data from 2005 to 2019, and thus the CWV anomaly in the radiosonde (reanalysis) data is −0.74 (−0.07) kg m−2 in the 2006/07 event and −2.55 (−3.94) kg m−2 in the 2009/10 event. This means that the discrepancy in the CWV anomaly looks quite large in Fig. 9, especially in the 2006/07 event, but the differences in both the CWV and CWV anomaly values are small between the radiosonde and reanalysis. Even so, the relatively large discrepancy between the reanalysis data and the radiosonde and AIRS observations in the 2009/10 event, as shown in Figs. 1 and 13, and the cloud and OLR measurements in Figs. 11 and 12 seem to suggest that the reanalysis data underestimates the tropospheric water vapor over the radiosonde stations in the 2009/10 winter.
In this paper, we report the significantly negative water vapor anomaly in the troposphere during four El Niño winters at five radiosonde stations in the tropical western Pacific based on radiosonde and reanalysis data for 15 years from 2005 to 2019 and study the relationship between the water vapor anomaly and the El Niño index and the contribution of the different tropical circulation anomalies to the observed water vapor anomaly in the El Niño events.
The radiosonde observation shows that the negative water vapor anomaly arises in the El Niño winters, specifically showing an extremely negative anomaly in the 2015/16 super El Niño event. The prominent specific humidity anomaly is concentrated below 8 km in the troposphere with the peak at the height of about 2.5–3.5 km. The local CWV anomaly has a large negative correlation coefficient of −0.63 with the ONI in the Niño3.4 region but has a lag of about 2–3 months. The reanalysis data reveal that the negative water vapor anomaly occurs widely in the tropical northwestern Pacific, while the positive anomaly correspondingly takes place in the equatorial central eastern Pacific. The 2015/16 El Niño event (with ONI = 2.6) is the strongest during the 15 years, leading to the extreme anomaly in the water vapor over the tropical Pacific.
The atmospheric water vapor from tropical sea water evaporation is affected not only by the SST but also by the vertical motion of the atmosphere, which can transport the water vapor from near the sea surface up to high levels. By using the definitions and method introduced by Tanaka et al. (2004), we decompose the tropical circulation into the Hadley, Walker, and monsoon circulations to estimate their contributions to the observed water vapor anomaly in the four El Niño events. In general, the tropical circulation anomaly in the El Niño winter is characterized by divergence (convergence) at 850 hPa in the tropical western (eastern) Pacific, and thus the CWV decreases over the tropical western Pacific as the ascending flow is suppressed. As the large-scale meridional circulation is driven by the differential heating, the variation of the Hadley circulation is pretty small with an anomaly index of less than 2 units. At the radiosonde stations, the anomaly of the Walker circulation makes a considerable contribution to the total anomaly in all the El Niño winters, especially in the 2006/07 and 2015/16 EP El Niño events. The monsoon circulation exhibits an obvious variability from one event to another, and its anomaly is large in the 2009/10 and 2018/19 CP El Niño winters and small in the 2006/07 and 2015/16 EP El Niño winters. Therefore, the observed water vapor anomaly is caused mainly by the Walker circulation anomaly in the 2015/16 super EP event but by the monsoon circulation anomaly in the 2009/10 strong CP event. Based on the reanalysis data back to 1979, we examine the general features of water vapor and circulation anomalies in the two types of composite El Niño events. The roles of the Hadley, Walker, and monsoon circulations in the composite EP and CP El Niños are consistent with those in the EP and CP case events.
Because of the reduction in the upward transport of water vapor over the tropical western Pacific in the El Niño events, the satellite observations show that, relative to the climatic means, the cloud decreases and that the OLR is accordingly strengthened, particularly during the strong El Niño winters of 2009/10 and 2015/16. In addition, a detailed comparison of water vapor in the reanalysis, radiosonde, and satellite data shows a high confidence level of these datasets; nevertheless, the reanalysis seems to slightly underestimate the water vapor over the five radiosonde stations in the 2009/10 winter.
The radiosonde observations are provided by NOAA at the following website: https://www.ncei.noaa.gov/pub/data/igra/derived/ (NOAA, 2004). The ERA5 reanalysis data are from the ECMWF: https://cds.climate.copernicus.eu/cdsapp#!/dataset/reanalysis-era5-pressure-levels-monthly-means?tab=form (Hersbach et al., 2019). The Niño3.4 index is from NOAA: https://catalog.data.gov/dataset/climate-prediction-center-cpcoceanic-nino-index (NOAA, 2021). The OLR data are from NOAA: https://downloads.psl.noaa.gov/Datasets/interp_OLR/ (NOAA, 2003). The cloud occurrence monthly data are from NASA: https://search.earthdata.nasa.gov/search/granules?p=C1575511329-LARC_ASDC&pg[0][v]=f&tl=1630929576.307!3!! (NASA, 2018). The AIRS water vapor data are available from NASA: https://doi.org/10.5067/Aqua/AIRS/DATA321 (AIRS Science Team and Teixeira, 2013).
KH and MD proposed the scientific ideas. MD and KH completed the analysis and the manuscript. SZ, CH, YG, and FY discussed the results in the manuscript.
The contact author has declared that neither they nor their co-authors have any competing interests.
Publisher's note: Copernicus Publications remains neutral with regard to jurisdictional claims in published maps and institutional affiliations.
This work was supported by the National Natural Science Foundation of China (grant nos. 41974176 and 41674151).
This research has been supported by the National Natural Science Foundation of China (grant nos. 41974176 and 41674151).
This paper was edited by Bryan N. Duncan and reviewed by two anonymous referees.
AIRS Science Team and Teixeira, J.: AIRS/Aqua L3 Monthly Standard Physical Retrieval (AIRS-only) , Goddard Earth Sciences Data and Information Services Center (GES DISC) [data set], available at: https://doi.org/10.5067/Aqua/AIRS/DATA321, 2013.
Andersson, E., Hólm, E., Bauer, P., Beljaars, A., Kelly, G. A., McNally, A. P., Simmons, A. J., Thépaut, J. N., and Tompkins, A. M.: Analysis and forecast impact of the main humidity observing systems, Q. J. Roy. Meteor. Soc., 133, 1473–1485, https://doi.org/10.1002/qj.112, 2007.
Ashok, K., Behera, S. K., Rao, S. A., Weng, H., and Yamagata, T.: El Niño Modoki and its possible teleconnection, J. Geophys. Res., 112, C11007, https://doi.org/10.1029/2006jc003798, 2007.
Aumann, H. H., Chahine, M. T., Gautier, C., Goldberg, M. D., Kalnay, E., McMillin, L. M., Revercomb, H., Rosenkranz, P. W., Smith, W. L., Staelin, D. H., Strow, L. L., and Susskind, J.: AIRS/AMSU/HSB on the aqua mission: design, science objectives, data products, and processing systems, IEEE T. Geosci. Remote, 41, 253–264, https://doi.org/10.1109/tgrs.2002.808356, 2003.
Avery, M. A., Davis, S. M., Rosenlof, K. H., Ye, H., and Dessler, A. E.: Large anomalies in lower stratospheric water vapour and ice during the 2015–2016 El Niño, Nat. Geosci., 10, 405–409, https://doi.org/10.1038/ngeo2961, 2017.
Dai, A. and Wigley, T. M. L.: Global patterns of ENSO-induced precipitation, Geophys. Res. Lett., 27, 1283–1286, https://doi.org/10.1029/1999gl011140, 2000.
Dee, D. P., Uppala, S. M., Simmons, A. J., Berrisford, P., Poli, P., Kobayashi, S., Andrae, U., Balmaseda, M. A., Balsamo, G., Bauer, P., Bechtold, P., Beljaars, A. C. M., van de Berg, L., Bidlot, J., Bormann, N., Delsol, C., Dragani, R., Fuentes, M., Geer, A. J., Haimberger, L., Healy, S. B., Hersbach, H., Hólm, E. V., Isaksen, L., Kållberg, P., Köhler, M., Matricardi, M., McNally, A. P., Monge-Sanz, B. M., Morcrette, J. J., Park, B. K., Peubey, C., de Rosnay, P., Tavolato, C., Thépaut, J. N., and Vitart, F.: The ERA-Interim reanalysis: configuration and performance of the data assimilation system, Q. J. Roy. Meteor. Soc., 137, 553–597, https://doi.org/10.1002/qj.828, 2011.
Dunkerton, T. J.: The quasi-biennial oscillation of 2015–2016: Hiccup or death spiral?, Geophys. Res. Lett., 43, 10547–510552, https://doi.org/10.1002/2016gl070921, 2016.
Fan, F., Dong, X., Fang, X., Xue, F., Zheng, F., and Zhu, J.: Revisiting the relationship between the South Asian summer monsoon drought and El Niño warming pattern, Atmos. Sci. Lett., 18, 175–182, https://doi.org/10.1002/asl.740, 2017.
Feng, J. and Li, J.: Contrasting impacts of two types of ENSO on the boreal spring Hadley circulation, J. Climate, 26, 4773–4789, https://doi.org/10.1175/jcli-d-12-00298.1, 2013.
Gasparin, F. and Roemmich, D.: The strong freshwater anomaly during the onset of the 2015/2016 El Niño, Geophys. Res. Lett., 43, 6452–6460, https://doi.org/10.1002/2016gl069542, 2016.
Gu, G. and Adler, R. F.: Precipitation, temperature, and moisture transport variations associated with two distinct ENSO flavors during 1979–2014, Clim. Dynam., 52, 7249–7265, https://doi.org/10.1007/s00382-016-3462-3, 2016.
Held, I. M. and Soden, B. J.: Water vapor feedback and global warming, Annu. Rev. Energ. Env., 25, 441–475, https://doi.org/10.1146/annurev.energy.25.1.441, 2000.
Hersbach, H., Bell, B., Berrisford, P., Hirahara, S., Horányi, A., Muñoz‐Sabater, J., Nicolas, J., Peubey, C., Radu, R., Schepers, D., Simmons, A., Soci, C., Abdalla, S., Abellan, X., Balsamo, G., Bechtold, P., Biavati, G., Bidlot, J., Bonavita, M., Chiara, G., Dahlgren, P., Dee, D., Diamantakis, M., Dragani, R., Flemming, J., Forbes, R., Fuentes, M., Geer, A., Haimberger, L., Healy, S., Hogan, R. J., Hólm, E., Janisková, M., Keeley, S., Laloyaux, P., Lopez, P., Lupu, C., Radnoti, G., Rosnay, P., Rozum, I., Vamborg, F., Villaume, S., and Thépaut, J. N.: ERA5 monthly averaged data on pressure levels from 1979 to present, Copernicus Climate Change Service (C3S) Climate Data Store (CDS) [data set], available at: https://cds.climate.copernicus.eu/cdsapp#!/dataset/reanalysis-era5-pressure-levels-monthly-means?tab=form (last access: 6 September 2021), 2019.
Hersbach, H., Bell, B., Berrisford, P., Hirahara, S., Horányi, A., Muñoz-Sabater, J., Nicolas, J., Peubey, C., Radu, R., Schepers, D., Simmons, A., Soci, C., Abdalla, S., Abellan, X., Balsamo, G., Bechtold, P., Biavati, G., Bidlot, J., Bonavita, M., Chiara, G., Dahlgren, P., Dee, D., Diamantakis, M., Dragani, R., Flemming, J., Forbes, R., Fuentes, M., Geer, A., Haimberger, L., Healy, S., Hogan, R. J., Hólm, E., Janisková, M., Keeley, S., Laloyaux, P., Lopez, P., Lupu, C., Radnoti, G., Rosnay, P., Rozum, I., Vamborg, F., Villaume, S., and Thépaut, J. N.: The ERA5 global reanalysis, Q. J. Roy. Meteor. Soc., 146, 1999–2049, https://doi.org/10.1002/qj.3803, 2020.
Hill, K. J., Taschetto, A. S., and England, M. H.: South American rainfall impacts associated with inter-El Niño variations, Geophys. Res. Lett., 36, L19702, https://doi.org/10.1029/2009gl040164, 2009.
Huang, B. Y., Thorne, P. W., Banzon, V. F., Boyer, T., Chepurin, G., Lawrimore, J. H., Menne, M. J., Smith, T. M., Vose, R. S., and Zhang, H. M.: Extended reconstructed sea surface temperature, version 5 (ERSSTv5): Upgrades, validations, and intercomparisons, J. Climate, 30, 8179–8205, https://doi.org/10.1175/jcli-d-16-0836.1, 2017.
Hólm, E. V.: Revision of the ECMWF humidity analysis: Construction of a Gaussian control variable, Proc. Workshop on Humidity Analysis, Reading, United Kingdom, 8–11 July 2002, ECMWF/GEWEX, 1–6, 2003.
Ishida, A., Kashino, Y., Hosoda, S., and Ando, K.: North-south asymmetry of warm water volume transport related with El Niño variability, Geophys. Res. Lett., 35, L18612, https://doi.org/10.1029/2008gl034858, 2008.
Jiang, J., Zhou, T., and Zhang, W.: Evaluation of satellite and reanalysis precipitable water vapor data sets against radiosonde observations in Central Asia, Earth Space Sci., 6, 1129–1148, https://doi.org/10.1029/2019ea000654, 2019.
Kanamitsu, M. and Krishnamurti, T. N.: Northern summer tropical circulations during drought and normal rainfall months, Mon. Weather Rev., 106, 331–347, https://doi.org/10.1175/1520-0493(1978)106<0331:Nstcdd>2.0.Co;2, 1978.
Krishnamurti, T. N.: Tropical east-west circulations during the northern summer, J. Atmos. Sci., 28, 1342–1347, https://doi.org/10.1175/1520-0469(1971)028<1342:TEWCDT>2.0.CO;2, 1971.
Kug, J.-S., Jin, F.-F., and An, S.-I.: Two types of El Niño events: cold tongue El Niño and warm pool El Niño, J. Climate, 22, 1499–1515, https://doi.org/10.1175/2008JCLI2624.1, 2009.
Kumar, A., Kumar, S., Pratap, V., and Singh, A. K.: Performance of water vapour retrieval from MODIS and ECMWF and their validation with ground based GPS measurements over Varanasi, J. Earth Syst. Sci., 130, 41, https://doi.org/10.1007/s12040-020-01529-3, 2021.
Kramer, H. J.: Observation of the earth and its environment: Survey of missions and sensors, Springer Science & Business Media, p. 737, ISBN 978-3-540-42388-1, 2002.
Lanzante, J. R.: Resistant, robust and non-parametric techniques for the analysis of climate data: Theory and examples, including applications to historical radiosonde station data, Int. J. Climatol., 16, 1197–1226, https://doi.org/10.1002/(SICI)1097-0088(199611)16:11<1197::AID-JOC89>3.0.CO;2-L, 1996.
Lee, S.-K., Mapes, B. E., Wang, C., Enfield, D. B., and Weaver, S. J.: Springtime ENSO phase evolution and its relation to rainfall in the continental U.S, Geophys. Res. Lett., 41, 1673–1680, https://doi.org/10.1002/2013gl059137, 2014.
Lee, T. and McPhaden, M. J.: Increasing intensity of El Niño in the central-equatorial Pacific, Geophys. Res. Lett., 37, L14603, https://doi.org/10.1029/2010GL044007, 2010.
Lees, E., Bousquet, O., Roy, D., and de Bellevue, J. L.: Analysis of diurnal to seasonal variability of Integrated Water Vapour in the South Indian Ocean basin using ground-based GNSS and fifth-generation ECMWF reanalysis (ERA5) data, Q. J. Roy. Meteor. Soc., 147, 229–248, https://doi.org/10.1002/qj.3915, 2020.
L'Heureux, M. L., Takahashi, K., Watkins, A. B., Barnston, A. G., Becker, E. J., Di Liberto, T. E., Gamble, F., Gottschalck, J., Halpert, M. S., Huang, B., Mosquera-Vásquez, K., and Wittenberg, A. T.: Observing and predicting the 2015/16 El Niño, B. Am. Meteorol. Soc., 98, 1363–1382, https://doi.org/10.1175/bams-d-16-0009.1, 2017.
Li, Z., Li, Y., Bonsal, B., Manson, A. H., and Scaff, L.: Combined impacts of ENSO and MJO on the 2015 growing season drought on the Canadian Prairies, Hydrol. Earth Syst. Sci., 22, 5057–5067, https://doi.org/10.5194/hess-22-5057-2018, 2018.
Liebmann, B. and Smith, C. A.: Description of a complete (interpolated) outgoing longwave radiation dataset, B. Am. Meteorol. Soc., 77, 1275–1277, 1996.
López-Parages, J. and Rodríguez-Fonseca, B.: Multidecadal modulation of El Niño influence on the Euro-Mediterranean rainfall, Geophys. Res. Lett., 39, L02704, https://doi.org/10.1029/2011GL050049, 2012.
Ma, J. and Xie, S.-P.: Regional patterns of sea surface temperature change: A source of uncertainty in future projections of precipitation and atmospheric circulation, J. Climate, 26, 2482–2501, https://doi.org/10.1175/jcli-d-12-00283.1, 2013.
Madenach, N., Carbajal Henken, C., Preusker, R., Sourdeval, O., and Fischer, J.: Analysis and quantification of ENSO-linked changes in the tropical Atlantic cloud vertical distribution using 14 years of MODIS observations, Atmos. Chem. Phys., 19, 13535–13546, https://doi.org/10.5194/acp-19-13535-2019, 2019.
Mapes, B., Chandra, A. S., Kuang, Z., and Zuidema, P.: Importance profiles for water vapor, Surv. Geophys., 38, 1355–1369, https://doi.org/10.1007/s10712-017-9427-1, 2017.
Mariotti, A.: How ENSO impacts precipitation in southwest central Asia, Geophys. Res. Lett., 34, L16706, https://doi.org/10.1029/2007gl030078, 2007.
Massie, S., Lowe, P., Tie, X., Hervig, M., Thomas, G., and Russell, J.: Effect of the 1997 El Niño on the distribution of upper tropospheric cirrus, J. Geophys. Res.-Atmos., 105, 22725–22741, https://doi.org/10.1029/2000jd900322, 2000.
Murray, F. W.: On the computation of saturation vapor pressure, J. Appl, Meteorol., 6, 203–204, https://doi.org/10.1175/1520-0450(1967)006<0203:OTCOSV>2.0.CO;2, 1967.
NASA: CALIPSO Lidar Level 3 Cloud Occurrence Data, Standard V1-00, Langley Research Center Atmospheric Science Data Center [data set], available at: https://search.earthdata.nasa.gov/search/granules?p=C1575511329-LARC_ASDC&pg[0][v]=f&tl=1630929576.307!3!! (last access: 6 September 2021), 2018.
Newell, R. E., Zhu, Y., Browell, E. V., Read, W. G., and Waters, J. W.: Walker circulation and tropical upper tropospheric water vapor, J. Geophys. Res.-Atmos., 101, 1961–1974, https://doi.org/10.1029/95jd02275, 1996.
Newman, P. A., Coy, L., Pawson, S., and Lait, L. R.: The anomalous change in the QBO in 2015-2016, Geophys. Res. Lett., 43, 8791–8797, https://doi.org/10.1002/2016gl070373, 2016.
NOAA: Interpolated Outgoing Longwave Radiation (OLR), Physical Sciences Laboratory [data set], available at: https://downloads.psl.noaa.gov/Datasets/interp_OLR/ (last access: 6 September 2021), 2003.
NOAA: The Integrated Global Radiosonde Archive (IGRA), National Climatic Data Center [data set], available at: https://www.ncei.noaa.gov/pub/data/igra/derived/ (last access: 6 September 2021), 2004.
NOAA: Climate Prediction Center (CPC) Oceanic Nino Index, Climate Prediction Center [data set], available at: https://catalog.data.gov/dataset/climate-prediction-center-cpcoceanic-nino-index (last access: 6 September 2021), 2021.
Okazaki, A., Satoh, Y., Tremoy, G., Vimeux, F., Scheepmaker, R., and Yoshimura, K.: Interannual variability of isotopic composition in water vapor over western Africa and its relationship to ENSO, Atmos. Chem. Phys., 15, 3193–3204, https://doi.org/10.5194/acp-15-3193-2015, 2015.
Oort, A. H. and Yienger, J. J.: Observed interannual variability in the Hadley circulation and its connection to ENSO, J. Climate, 9, 2751–2767, https://doi.org/10.1175/1520-0442(1996)009<2751:OIVITH>2.0.CO;2, 1996.
Paek, H., Yu, J.-Y., and Qian, C.: Why were the 2015/2016 and 1997/1998 extreme El Niños different?, Geophys. Res. Lett., 44, 1848–1856, https://doi.org/10.1002/2016gl071515, 2017.
Palmeiro, F. M., Iza, M., Barriopedro, D., Calvo, N., and García-Herrera, R.: The complex behavior of El Niño winter 2015–2016, Geophys. Res. Lett., 44, 2902–2910, https://doi.org/10.1002/2017gl072920, 2017.
Park, S.-C. and Sohn, B.-J.: Recent trend of Hadley and Walker circulation shown in water vapor transport potential, in: 20th Conference on climate variability and change, General climate studies: poster session, New York, United States, 21 January 2008, P2.18, 2008.
Permana, D. S., Thompson, L. G., and Setyadi, G.: Tropical West Pacific moisture dynamics and climate controls on rainfall isotopic ratios in southern Papua, Indonesia, J. Geophys. Res.-Atmos., 121, 2222–2245, https://doi.org/10.1002/2015jd023893, 2016.
Quartly, G. D., Srokosz, M. A., and Guymer, T. H.: Changes in oceanic precipitation during the 1997–98 El Niño, Geophys. Res. Lett., 27, 2293–2296, https://doi.org/10.1029/1999gl011311, 2000.
Sandeep, S. and Ajayamohan, R. S.: Modulation of winter precipitation dynamics over the Arabian Gulf by ENSO, J. Geophys. Res.-Atmos., 123, 198–210, https://doi.org/10.1002/2017jd027263, 2018.
Soden, B. J., Held, I. M., Colman, R., Shell, K. M., Kiehl, J. T., and Shields, C. A.: Quantifying climate feedbacks using radiative kernels, J. Climate, 21, 3504–3520, https://doi.org/10.1175/2007jcli2110.1, 2008.
Stephens, G. L., Vane, D. G., Boain, R. J., Mace, G. G., Sassen, K., Wang, Z., Illingworth, A. J., O'connor, E. J., Rossow, W. B., Durden, S. L., Miller, S. D., Austin, R. T., Benedetti, A., and Mitrescu, C. A.: The CloudSat Mission and the A-Train, B. Am. Meteorol. Soc., 83, 1771–1790, https://doi.org/10.1175/BAMS-83-12-1771, 2002.
Stevens, B., Brogniez, H., Kiemle, C., Lacour, J.-L., Crevoisier, C., and Kiliani, J.: Structure and dynamical influence of water vapor in the lower tropical troposphere, Surv. Geophys., 38, 1371–1397, https://doi.org/10.1007/s10712-017-9420-8, 2017.
Su, H. and Jiang, J. H.: Tropical clouds and circulation changes during the 2006/07 and 2009/10 El Niños, J. Climate, 26, 399–413, https://doi.org/10.1175/JCLI-D-12-00152.1, 2013.
Sun, M., Cess, R. D., and Doelling, D. R.: Interpretation of cloud structure anomalies over the tropical Pacific during the 1997/98 El Niño, J. Geophys. Res.-Atmos., 117, D16114, https://doi.org/10.1029/2011JD015861, 2012.
Susskind, J., Blaisdell, J. M., and Iredell, L.: Improved methodology for surface and atmospheric soundings, error estimates, and quality control procedures: the atmospheric infrared sounder science team version-6 retrieval algorithm, J. Appl. Remote Sens., 8, 084994, https://doi.org/10.1117/1.Jrs.8.084994, 2014.
Ssenyunzi, R. C., Oruru, B., D'ujanga, F. M., Realini, E., Barindelli, S., Tagliaferro, G., von Engeln, A., and van de Giesen, N.: Performance of ERA5 data in retrieving precipitable water vapour over East African tropical region, Adv. Space Res., 65, 1877–1893, https://doi.org/10.1016/j.asr.2020.02.003, 2020.
Takahashi, H., Su, H., Jiang, J. H., Luo, Z. J., Xie, S.-P., and Hafner, J.: Tropical water vapor variations during the 2006-2007 and 2009–2010 El Niños: Satellite observation and GFDL AM2.1 simulation, J. Geophys. Res.-Atmos., 118, 8910–8920, https://doi.org/10.1002/jgrd.50684, 2013.
Takemoto, M. and Tanaka, H. L.: Intensities of Hadley, Walker, and monsoon circulations compared in the upper and lower troposphere, J. Korean Meteor. Soc., 43, 239–251, 2007.
Tanaka, H. L., Ishizaki, N., and Kitoh, A.: Trend and interannual variability of Walker, monsoon and Hadley circulations defined by velocity potential in the upper troposphere, Tellus A, 56, 250–269, https://doi.org/10.1111/j.1600-0870.2004.00049.x, 2004.
Tanaka, H. L., Ishizaki, N., and Nohara, D.: Intercomparison of the intensities and trends of Hadley, Walker and monsoon circulations in the global warming projections, SOLA, 1, 77–80, https://doi.org/10.2151/sola.2005-021, 2005.
Viswanadham, Y.: The relationship between total precipitable water and surface dew point, J. Appl. Meteorol. Clim., 20, 3–8, https://doi.org/10.1175/1520-0450(1981)020<0003:TRBTPW>2.0.CO;2, 1981.
Wang, C.: Atmospheric circulation cells associated with the El Niño Southern Oscillation, J. Climate, 15, 399-419, https://doi.org/10.1175/1520-0442(2002)015<0399:ACCAWT>2.0.CO;2, 2002.
Wang, J., Zeng, N., Wang, M., Jiang, F., Chen, J., Friedlingstein, P., Jain, A. K., Jiang, Z., Ju, W., Lienert, S., Nabel, J., Sitch, S., Viovy, N., Wang, H., and Wiltshire, A. J.: Contrasting interannual atmospheric CO2 variabilities and their terrestrial mechanisms for two types of El Niños, Atmos. Chem. Phys., 18, 10333–10345, https://doi.org/10.5194/acp-18-10333-2018, 2018.
Wang, S., Xu, T., Nie, W., Jiang, C., Yang, Y., Fang, Z., Li, M., and Zhang, Z.: Evaluation of precipitable water vapor from five reanalysis products with ground-based GNSS observations, Remote Sens., 12, 1817, https://doi.org/10.3390/rs12111817, 2020.
Wang, X., Jiang, X., Yang, S., and Li, Y.: Different impacts of the two types of El Niño on Asian summer monsoon onset, Environ. Res. Lett., 8, 044053, https://doi.org/10.1088/1748-9326/8/4/044053, 2013.
Weng, H., Behera, S. K., and Yamagata, T.: Anomalous winter climate conditions in the Pacific rim during recent El Niño Modoki and El Niño events, Clim. Dynam., 32, 663–674, https://doi.org/10.1007/s00382-008-0394-6, 2008.
Winker, D. M., Hunt, W. H., and McGill, M. J.: Initial performance assessment of CALIOP, Geophys. Res. Lett., 34, L19803, https://doi.org/10.1029/2007gl030135, 2007.
Xu, K., Tam, C.-Y., Zhu, C., Liu, B., and Wang, W.: CMIP5 projections of two types of El Niño and their related tropical precipitation in the twenty-First century, J. Climate, 30, 849–864, https://doi.org/10.1175/jcli-d-16-0413.1, 2017.
Yan, X., Konopka, P., Ploeger, F., Tao, M., Müller, R., Santee, M. L., Bian, J., and Riese, M.: El Niño Southern Oscillation influence on the Asian summer monsoon anticyclone, Atmos. Chem. Phys., 18, 8079–8096, https://doi.org/10.5194/acp-18-8079-2018, 2018.
Ye, H., Fetzer, E. J., Bromwich, D. H., Fishbein, E. F., Olsen, E. T., Granger, S. L., Lee, S.-Y., Chen, L., and Lambrigtsen, B. H.: Atmospheric total precipitable water from AIRS and ECMWF during Antarctic summer, Geophys. Res. Lett., 34, L19701, https://doi.org/10.1029/2006gl028547, 2007.
Yeh, S.-W., Kug, J.-S., Dewitte, B., Kwon, M.-H., Kirtman, B. P., and Jin, F.-F.: El Nino in a changing climate, Nature, 461, 511–514, https://doi.org/10.1038/nature08316, 2009.
Yeh, S.-W., Kug, J.-S., and An, S.-I.: Recent progress on two types of El Niño: Observations, dynamics, and future changes, Asia-Pac. J. Atmos. Sci., 50, 69–81, https://doi.org/10.1007/s13143-014-0028-3, 2014.
Yu, J.-Y. and Kao, H.-Y.: Contrasting eastern-Pacific and central-Pacific types of ENSO, J. Climate, 22, 615–632, https://doi.org/10.1175/2008jcli2309.1, 2009.
Zhao, P., Yang, S., and Yu, R.: Long-term changes in rainfall over eastern China and large-scale atmospheric circulation associated with recent global warming, J. Climate, 23, 1544–1562, https://doi.org/10.1175/2009jcli2660.1, 2010.