the Creative Commons Attribution 4.0 License.
the Creative Commons Attribution 4.0 License.
 | 10 Sep 2021
In situ observation of new particle formation (NPF) in the tropical tropopause layer of the 2017 Asian monsoon anticyclone – Part 2: NPF inside ice clouds
Christoph Mahnke
Manuel Baumgartner
Martina Krämer
Peter Spichtinger
Nicole Spelten
Armin Afchine
Christian Rolf
Silvia Viciani
Francesco D'Amato
Holger Tost
Stephan Borrmann
From 27 July to 10 August 2017, the airborne StratoClim mission took place in Kathmandu, Nepal, where eight mission flights were conducted with the M-55 Geophysica up to altitudes of 20 km. New particle formation (NPF) was identified by the abundant presence of nucleation-mode aerosols, with particle diameters dp smaller than 15 nm, which were in-situ-detected by means of condensation nuclei (CN) counter techniques. NPF fields in clear skies as well as in the presence of cloud ice particles (dp > 3 µm) were encountered at upper troposphere–lowermost stratosphere (UTLS) levels and within the Asian monsoon anticyclone (AMA). NPF-generated nucleation-mode particles in elevated concentrations (Nnm) were frequently found together with cloud ice (in number concentrations Nice of up to 3 cm−3) at heights between ∼ 11 and 16 km. From a total measurement time of ∼ 22.5 h above 10 km altitude, in-cloud NPF was in sum detected over ∼ 1.3 h (∼ 50 % of all NPF records throughout StratoClim). Maximum Nnm of up to ∼ 11 000 cm−3 was detected coincidently with intermediate ice particle concentrations Nice of 0.05–0.1 cm−3 at comparatively moderate carbon monoxide (CO) contents of ∼ 90–100 nmol mol−1. Neither under clear-sky nor during in-cloud NPF do the highest Nnm concentrations correlate with the highest CO mixing ratios, suggesting that an elevated pollutant load is not a prerequisite for NPF. Under clear-air conditions, NPF with elevated Nnm (> 8000 cm−3) occurred slightly less often than within clouds. In the presence of cloud ice, NPF with Nnm between 1500–4000 cm−3 was observed about twice as often as under clear-air conditions. NPF was not found when ice water contents exceeded 1000 µmol mol−1 in very cold air (< 195 K) at tropopause levels. This indicates a reduction in NPF once deep convection is prevalent together with the presence of mainly liquid-origin ice particles. Within in situ cirrus near the cold point tropopause, recent NPF or intense events with mixing ration nnm larger than 5000 mg−1 were observed only in about 6 % of the in-cloud NPF data. In determining whether the cloud-internal NPF is attenuated or prevented by the microphysical properties of cloud elements, the integral radius (IR) of the ice cloud population turned out to be indicative. Neither the number of ice particles nor the free distance between the ice particles is clearly related to the NPF rate detected. While the increase in ice particles' mass per time is proportional to the IR and mainly due to the condensation of water vapour, additional condensation of NPF precursors proceeds at the expense of the NPF rate as the precursor's saturation ratio declines. Numerical simulations show the impact of the IR on the supersaturation of a condensable vapour, such as sulfuric acid, and furthermore illustrate that the IR of the cloud ice determines the effective limitation of NPF rates.
- Article
(14201 KB) - Full-text XML
- Companion paper
- BibTeX
- EndNote


The process of gas-to-particle conversion, also denoted as homogeneous aerosol nucleation and most commonly known as new particle formation (NPF), is a major source of atmospheric aerosols and cloud condensation nuclei, which could promote the cloud formation at intermediate and upper tropospheric altitudes (e.g. Spracklen et al., 2006; Merikanto et al., 2009; Dunne et al., 2016; Gordon et al., 2017). Sulfuric acid (H2SO4) and water (H2O) are important chemical compounds involved in the NPF process, which is aided when ions come into play at elevated altitudes and cold temperatures within the atmosphere (Lee et al., 2003; Kazil et al., 2008; Weigel et al., 2011; Duplissy et al., 2016). It was suggested that a ternary nucleation process involves, apart from sulfuric acid and water, an additional constituent such as ammonia (NH3; Ball et al., 1999; Benson et al., 2009; Höpfner et al., 2019). Experimental studies at the CLOUD (Cosmics Leaving OUtdoor Droplets) chamber confirmed that NPF rates are substantially elevated within this ternary H2SO4–H2O–NH3 system (e.g. Kirkby et al., 2011; Kürten et al., 2016; Kürten, 2019). In addition to sulfuric acid and ammonia, organic species (e.g. Metzger et al., 2010; Kerminen et al., 2010) or amines (Kürten et al., 2018) may also promote particle nucleation and growth. Considering the quantities of organic aerosols (Murphy et al., 2006) and ammonia species (Höpfner et al., 2019) that were frequently found in aerosol particles at upper troposphere (UT)–tropical transition layer (TTL) heights in the AMA during StratoClim 2017, NPF is likely promoted by such species in the UT and TTL region.
The results of individual CLOUD experiments (Kürten et al., 2015, 2016) under a variety of controlled conditions and at different and elevated concentrations of the H2SO4 solution, always at supersaturated states, show how strongly the nucleation rates are associated with the precursor concentrations. The time series of a nucleation event within the CLOUD chamber (supplementary material of Kirkby et al., 2011) shows that the nucleation rate remains elevated as long as the quantity of precursors is kept at a constant level. Under real conditions in the atmosphere, however, the concentration of precursor material is spatially and temporally highly variable (e.g. Speidel et al., 2007; Ranjithkumar et al., 2021; Höpfner et al., 2019). Besides the precursor gas abundance, temperature determines the degree of supersaturation, which implies that even high precursor concentrations can yield weak NPF rates. Additionally, also temperature fluctuations at any (low) precursor concentration can increase the local supersaturation and induce intense NPF (see Weigel et al., 2021).
For ternary or multi-component NPF, the degree of supersaturation as a function of temperature remains indeterminable if the respective concentration of the different substances is unknown as so far is the case for most atmospheric observations. The chamber experiments allow for studying the nucleation rate as a function of the precursor concentration at different temperatures, i.e. at varying supersaturation ratios, which are specific but mostly unknown, with respect to the system of nucleating substances (involving H2SO4, H2O, and NH3). The complexity increases with sulfuric acid nucleation systems involving besides NH3 also nitric acid (HNO3) (Wang et al., 2020) or oxidised organic vapours (Riccobono et al., 2014), all of which are reported as promoting NPF at supersaturations lower than required for pure H2SO4 solutions. The role of organic substances in connection with NPF is of particular importance in the tropical upper troposphere–lowermost stratosphere (UTLS), as has been indicated by Schulz et al. (2018) and Andreae et al. (2018). The influence of a third substance (or even more substances) possibly involved in the NPF process is not conclusively detectable or quantifiable in the nucleation-mode particle population due to the current lack of instrumentation capable of directly analysing the chemical composition of such small particles.
By means of ground-based as well as airborne in situ measurements, NPF was frequently observed to occur at various conditions and atmospheric altitudes (Kerminen et al., 2018). Recently, Williamson et al. (2019) compiled a comprehensive data set of in situ NPF observations at altitudes from 180 m above sea level to up to ∼ 12 km, thereby covering a latitude range from 80∘ N to 70∘ S alongside the Americas and probing air over both oceans, the Pacific and the Atlantic. In tropical regions, most of the in situ NPF observations were made below the level of zero net radiative heating, i.e. at altitudes where subsidence or cloud formation is still well capable of efficiently removing or scavenging aerosol particles. Investigations at high altitudes (i.e. > 12 km) concerning the occurrence of NPF within clouds or in their immediate vicinity are sparse; most of such observations are limited to tropospheric altitudes (e.g. Clarke and Kapustin, 2002). The region above tropospheric clouds seems favourable for NPF to occur, and possible reasons for this are discussed by Wehner et al. (2015). They found that the majority of their near-cloud NPF observations correlated with increased ultraviolet irradiance, so they concluded cloud edges to be a favourable environment for the production of precursor gases for the formation of new particles (Wehner et al., 2015). These authors argued that nucleation and particle growth are promoted by turbulence at the cloud edges, which also Radke and Hobbs (1991) already observed coincidently with abundant particles at increased relative humidity. Furthermore, NPF was found to be an important process inside the convective outflows (e.g. Twohy et al., 2002; Waddicor et al., 2012). From measurements in the upper troposphere it is commonly assumed that the occurrence of NPF is directly connected to deep-convective cloud systems (e.g. de Reus et al., 2001; Clarke and Kapustin, 2002; Weigelt et al., 2009; Andreae et al., 2018). The relationship between NPF and ice clouds is discussed in this study, whilst the immediate connection of NPF and deep-convective events is addressed in Weigel et al. (2021).
During in situ measurements aboard the NASA high-altitude research aircraft WB-57, Lee et al. (2004) observed nucleation events inside subtropical and tropical cirrus clouds between 7 and 16 km over Florida. The same authors summarise that they found the recent occurrence of NPF in 72 % of their measurements within clouds. Despite the conceptual notion that the presence of cloud elements generally inhibits the formation of new particles, Kazil et al. (2007) demonstrated by means of model simulations that new sulfate aerosol can form within ice clouds such as cirrus. New particles are also produced in the anvil region and cirrus decks of mesoscale convective systems (MCSs) over West Africa (Frey et al., 2011). The particular role of mid-latitude MCSs as a source of freshly formed aerosol within the upper troposphere was already suggested by Twohy et al. (2002), based on the detection of increased concentrations of particles with size diameter (dp) greater than 25 nm, concurrently with elevated particle volatility. In the region of the tropical transition layer (TTL) over South America, Australia, and West Africa, the in situ measurements by Weigel et al. (2011) revealed nucleation-mode particles in elevated number concentrations from recent NPF. Based on coincident detections of abundant nucleation-mode particles together with cloud elements (i.e. ice particles of diameters 2.7 µm < dp < 1.6 mm) at ice number concentrations always below ∼ 2 cm−3, the authors concluded that the occurrence of NPF is mainly limited by the number of cloud particles. The underlying notion is that the surfaces of the cloud elements either scavenge the NPF-produced aerosol particles or remove the nucleating vapour molecules prior to the NPF process.
Regarding the occurrence of NPF in conjunction with the presence of upper tropospheric ice clouds, several unspecified details remain.
-
What are the sets of chemical species acting as NPF precursors?
-
Does NPF require (or not) contributions by cosmic radiation, by ions (Lovejoy et al., 2004; Kazil et al., 2008; Weigel et al., 2011), or by chemical agents or catalysts (e.g. Kürten, 2019)?
-
Which are the advantageous thermodynamic conditions for NPF within a cloud?
-
What are the conditions under which NPF is suppressed by the presence of ice particles of certain size and/or number?
-
What are the relative contributions from clear-air or in-cloud NPF to the aerosol population in the UTLS?
-
Furthermore, it is of interest how the nucleation-mode particles from in-cloud NPF are processed:
- a.
Are the nucleation-mode particles dispersed as a contribution to the clear-air background aerosol as soon as the cloud elements evaporate?
- b.
Or are the nucleation-mode particles scavenged by present ice particles?
- a.
A comprehensive understanding of these relationships and their influences under real atmospheric conditions is necessary, particularly for modelling purposes. Such insights allow for narrowing down the cloud type and properties as well as the location in the cloud where NPF preferentially occurs in order to obtain estimates of the importance of NPF in the cloud. In the context of the Asian monsoon anticyclone (AMA) it is important to clarify the origin of observed aerosol enhancements in the embedded Asian tropopause aerosol layer (ATAL; cf. Vernier et al., 2011 and Vernier et al., 2018). NPF is an important source of aerosol particles which are then available for further processing to form the ATAL (Höpfner et al., 2019; He et al., 2019; Mahnke et al., 2021). Furthermore, the relative contribution of in-cloud versus clear-air NPF is of importance in this context.
The Asian monsoon anticyclone (AMA) is a meteorological structure, which determines the regional circulation in the UTLS between June and September. The AMA is associated with extensive deep convection capable of transporting polluted air from the regional boundary layer (BL) to high altitudes (e.g. Randel and Park, 2006; Park et al., 2007; Vogel et al., 2014, 2019). The vertical upward transport within the Asian monsoon circulation is an effective pathway for young air from the BL (Vogel et al., 2019) to UTLS altitudes, accompanied by pollutants, further gaseous material (Pan et al., 2016), and water vapour (Ploeger et al., 2013). The constituents of the uplifted young air from BL altitudes also comprise precursor material from anthropogenic (Vernier et al., 2015; Yu et al., 2015; Höpfner et al., 2019; Mahnke et al., 2021) and other sources to develop and maintain the observed ATAL.
This study reports on the frequent occurrence of NPF in the presence of cloud ice in the tropopause region over the Indian subcontinent during the Asian monsoon season of the year 2017. All measurement data shown herein were acquired during StratoClim (in July/August 2017) based in Kathmandu, Nepal, and conducted with the M-55 Geophysica that operates up to 20 km altitude. NPF was observed to an almost equivalent extent in clear air as well as in the midst of cloud ice particles. This investigation summarises the various conditions under which NPF was observed coincidently with cloud ice particles. The caveats limiting the magnitude of encountered NPF are examined, as are the possibly constraining mechanisms imposed by the cloud elements' microphysical properties. The frequency of NPF observations in coincidence with elevated ice particle densities as well as in clear air highlights the importance of the tropopause region within the AMA as an effective source region of aerosols.
During the Asian monsoon season, between 27 July and 10 August 2017, a total of eight scientific flights were conducted above parts of the Indian subcontinent, out of Kathmandu, Nepal (27∘42′3′′ N, 85∘21′42′′ E), throughout StratoClim 2017 (see Fig. 1). Some of these flights also led out of the Nepalese airspace, to eastern India and Bangladesh, and to the northernmost part of the Bay of Bengal. The occurrence of NPF was encountered (see Fig. 1) during each flight, either in clear air or in the presence of cloud (ice) particles.

Figure 1The flight patterns of the M-55 Geophysica during StratoClim 2017 over the Indian subcontinent. New particle formation (NPF) encountered in clear air along the flight tracks is indicated by orange colour in the main panel (a). All NPF events coinciding with the detection of cloud (ice) particles are coloured in blue. The general perspective (b) exhibits the patterns of the eight StratoClim flights over Nepal, north-eastern India, Bangladesh, and the Bay of Bengal. For more details, see Table 1.
2.1 Number concentration of sub-micrometre-sized particles
The four-channel continuous flow condensation particle counter COPAS (COndensation PArticle counting System; Weigel et al., 2009) was used for measuring aerosol particle number concentrations. Particle detection and data storage occurred at 1 Hz frequency. The COPAS channels were set to different 50 % detection particle diameters dp50 (i.e. 6, 10, and 15 nm). By counting aerosols (with dp50 = 10 nm) downstream of a heated (∼ 270 ∘C) sample flow line, a fourth COPAS channel measured particle concentrations of non-volatile (nv) or refractory particles (e.g. soot, mineral dust, and metallic aerosol material as well as, for example, organic material mixtures not evaporating at 270 ∘C). The measured data revealed that potential artefacts on the aerosol measurements due to the presence of ice particles, as suggested by Williamson et al. (2019), are largely excludable for the StratoClim data set (see Appendix A). For further details on the operation of COPAS during StratoClim 2017, the companion paper (Weigel et al., 2021) provides further insights, as does the article with the technical introduction and characterisation of the COPAS device, the aerosol inlet system, and the particle vaporiser (Weigel et al., 2009). COPAS is an established instrument for high-altitude application, and its data were used and discussed in various studies (e.g. in Curtius et al., 2005; Borrmann et al., 2010; Frey et al., 2011; Weigel et al., 2011, 2014; Schumann et al., 2017; Höpfner et al., 2019).
2.2 Terminology and notations
Measured particle number concentrations N are provided in units of particle number per cubic centimetre of sampled air (ambient conditions). To compare aerosol observations from different pressure altitudes and, for example, for correlations with mixing ratios of trace gases, COPAS measurements are also given as mixing ratio n in units of particles per milligram of air (mg−1) as calculated based on the 1 Hz resolved data of ambient static pressure and temperature (see Sect. 2.5). With N6 (N15) as the number concentration of sub-micrometre-sized particles with diameter greater than 6 nm (15 nm), the number concentration of nucleation-mode particles (denoted as Nnm) is calculated from the difference N6−N15 = N6−15. This concentration of nucleation-mode particles indicates recent NPF if the designated NPF criterion (Eq. 1) is met:
This criterion was reassessed for the StratoClim 2017 data set and accounts for the COPAS detectors' signal-to-noise ratio and the counting statistics. Further details concerning the criterion and the corrections applied to COPAS data are provided in Weigel et al. (2021).
If compliant with the NPF criterion, a series of data points is a designated NPF event if measured number concentrations (or mixing ratios) of nucleation-mode particles continuously remain greater than zero over at least 5 consecutive seconds. The term NPF event duration refers to the contiguous and uninterrupted measurement time (the sum of consecutive measurement seconds) for which the definition of in-cloud NPF applies. Due to the detector's signal-to-noise ratio and counting statistics, the given quantity and durations of events that are too short (over 1–5 s) bear uncertainties in the resulting number concentrations of newly formed particles and the event duration. With the mean airspeed of the M-55 Geophysica (∼ 154 ± 39 m s−1), the event definition implies that within 5 s a horizontal distance of ∼ 770 m (in flight direction) is covered. The total of 308 individual detections of elevated Nnm coincide with the presence of cloud elements, 104 of which fulfilled the event criterion. Note that the in-cloud NPF events discussed herein are partially embedded in larger NPF fields, which are identified by successive and uninterrupted detections of elevated Nnm. One or more in-cloud NPF events can be subsets of widespread NPF events as those discussed by Weigel et al. (2021), where also further details are provided concerning the persistence of the freshly formed particles in the nucleation mode and the presence of non-volatile particles under NPF conditions during StratoClim 2017.
The NPF rate and, hence, the intensity of NPF vary with the degree of supersaturation of the NPF precursor (Kirkby et al., 2011; Kürten et al., 2016). For the StratoClim 2017 data set the strength of an NPF event is classified as
-
intense NPF (often used synonymously with most recent NPF) if detected aerosol densities of nucleation-mode particles exceed
-
mixing ratios of 10 000 mg−1 or
-
number concentrations of 5000 cm−3;
-
-
intermediate NPF when number densities of nucleation-mode particles are in the ranges of
-
mixing ratios of 1000 mg−1 < nnm < 10 000 mg−1 or
-
number concentrations Nnm between 500 and 5000 cm−3; and
-
-
weak NPF when
-
mixing ratios nnm remain below 1000 mg−1, or
-
number concentrations Nnm of less than 500 cm−3 are detected.
-
As the persistence of the particles in the nucleation mode is short (i.e. a few hours only due to coagulation; cf. Weigel et al., 2021), an intense NPF event could still be in process when observed, or it had expired recently, i.e. 1–2 h prior to the detection. For NPF encounters with low or intermediate nnm (or Nnm), the conclusions concerning the event's age remain ambiguous since they can result from a proceeding event with a low NPF rate or from an event that had expired several hours previously.
2.3 Cloud particle and water vapour detection
The NIXE-CAPS (New Ice eXpEriment: Cloud and Aerosol Particle Spectrometer, in the following denoted as NIXE) was deployed during StratoClim for measuring the number size distribution in the cloud particles' diameter size range of 3–930 µm with 1 Hz resolution (Luebke et al., 2016; Costa et al., 2017; Afchine et al., 2018). The NIXE-CAPS consist of two detectors: the NIXE-CAS-DPOL (Cloud and Aerosol Spectrometer with Detection of POLarization) and the NIXE-CIPg (Cloud Imaging Probe – grayscale). The compiled measurement data of both independent detectors delivers microphysical properties, in terms of size and number, of particles with diameters ranging from 0.61 to 937 µm. The methods of post-flight data processing and corrections were described by Luebke et al. (2016).
In the StratoClim 2017 data set, cloud particle detections were recognised as such when particles of diameters > 3 µm were encountered in numbers greater than zero. The number concentration of ice particles is denoted as Nice (i.e. N3–937 µm for the number concentration of ice particles with diameters of 3 µm < dp < 937 µm). The data of ice water content (IWC) used herein were ascertained by using the relationship of cloud particles' mass (mp) to diameter (dp) (Krämer et al., 2016; Luebke et al., 2016; Afchine et al., 2018).
The closed-path Lyman-α photo-fragment fluorescence hygrometer FISH (Fast In situ Stratospheric Hygrometer; cf. Zöger et al., 1999; Meyer et al., 2015) allows for 1 Hz resolved measurements of the atmosphere's gaseous- and solid-phase water, denoted as total water or H2Otot. The FISH detection of H2Otot covers mixing ratios of 1–1000 µmol mol−1 over atmospheric pressures ranging from 50 to 500 hPa with an accuracy and precision of 6 %–8 % and 0.3 µmol mol−1. The IWC was calculated by subtracting the H2OGas (measured by another Lyman-α detector, FLASH, the FLuorescent Airborne Stratospheric Hygrometer) from H2Otot. For further details concerning the data processing, see Afchine et al. (2018). Dependent on ambient temperatures, the smallest IWC detectable by the FISH instrument is approximately between 1 × 10⁻³ and 20 × 10−3 µmol mol−1, which corresponds to approximately 1–20 × 10−4 mg m−3 (Afchine et al., 2018).
To cover the wide range of IWC observed during the StratoClim mission (from thousandths to thousands of µmol mol−1) the complementary data sets of NIXE-CAPS and FISH concerning IWC were merged (see Krämer et al., 2020).
2.4 Carbon monoxide
In the troposphere, carbon monoxide (CO) is a component of atmospheric pollution (Park et al., 2009), the main sources of which are both natural and anthropogenic (including combustion and the oxidation of hydrocarbons). Measured CO mixing ratios are often used as a dynamic tracer for air parcel transport. Typical CO mixing ratios range from unpolluted 50 nmol mol−1 up to mixing ratios well exceeding 700 nmol mol−1 in close vicinity of emission sources (Clerbaux et al., 2008; Park et al., 2009). Inside the AMA and up to 15 km altitude, CO mixing ratios remain comparatively high (100 nmol mol−1), while between 15 and 20 km altitude the CO mixing ratios decrease monotonically down to ∼ 40 nmol mol−1 (Park et al., 2009).
During the StratoClim mission, the mixing ratio of CO was measured by means of the tunable diode laser (TDL) technique implied in the revised version of the cryogenically operated laser diode (COLD) spectrometer. Compared to the previous instrument version (4 s temporal resolution; Viciani et al., 2008), COLD-2 integrates improvements (Viciani et al., 2018) regarding
-
a measurement resolution increased by a factor of 4,
-
an enhanced in-flight sensitivity of the COLD-2 spectrometer (ranking at ∼ 2 nmol mol−1 at integration times of 1 s), and
-
an accuracy of 3 % specified for the CO measurement with COLD-2.
In the data set of simultaneous measurements of COPAS and COLD-2, minimum and maximum CO mixing ratios of 14 and 153 nmol mol−1 are included.
2.5 Data of ambient temperature and static pressure
The atmospheric temperature and pressure data were taken from the Unit for Connection with the Scientific Equipment (UCSE; Sokolov and Lepuchov, 1998), a part of the navigational system of the M-55 Geophysica. UCSE data are provided as 1 Hz resolved ambient pressure (with an accuracy of ±1 hPa) and temperature (±2 K accuracy).
The potential temperature θ is calculated with 1 Hz resolution in compliance with the definition by the World Meteorological Organization (WMO, 1966). Note that for the given vertical temperature gradients and over the θ range covered during StratoClim 2017 (i.e. up to ∼ 477 K), the WMO-recommended calculation of θ differs only by up to ∼ 1 K from the values obtained by using the recently reappraised θ calculation (Baumgartner et al., 2020).
During StratoClim 2017, eight mission flights were conducted with a total of 36.6 flight hours, whereas over a total of 6.42 h ice clouds were encountered at air temperatures colder than 240 K. The cirrus cloud observations are described and discussed by Krämer et al. (2020). Most of the in-cloud measurements during StratoClim 2017 were performed at temperatures ≲ 205 K, corresponding to potential temperatures above ∼ 355 K and geometric altitudes higher than ∼ 12 km. The clouds observed during the Asian monsoon season include (1) in situ cirrus, which had formed in dynamically calm situations associated with very slow updraught, as well as (2) liquid-origin cirrus, the formation of which is connected to deep (including overshooting) convection with elevated uplift velocities (see Sect. 5.2), including ice clouds (e.g. anvils) associated with convective outflow.
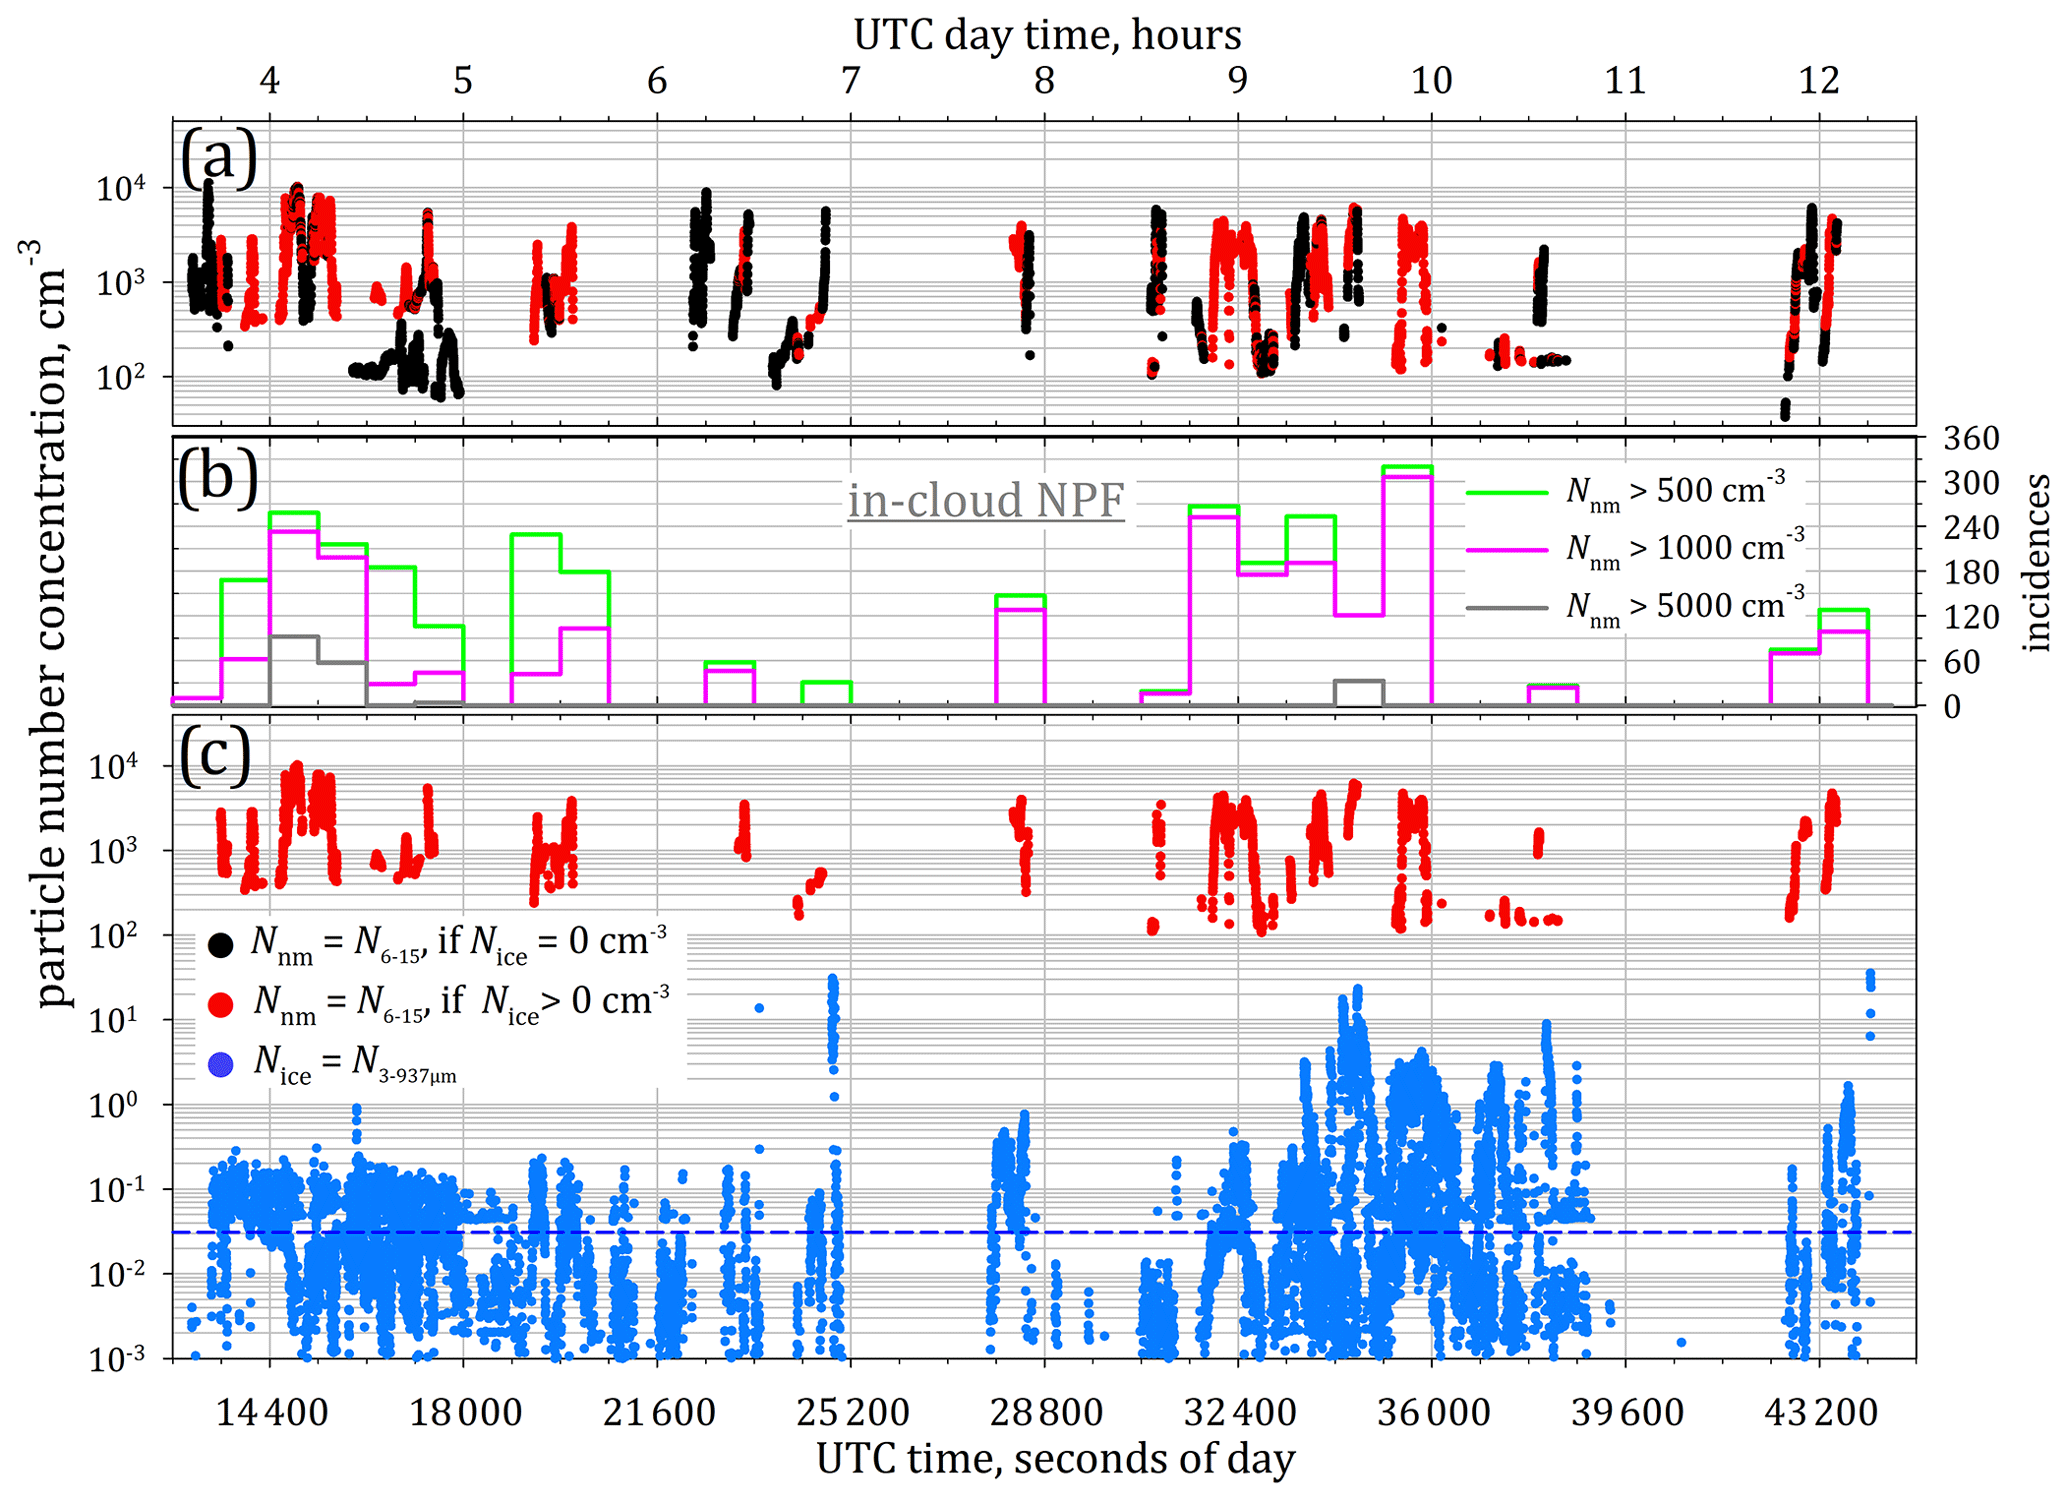
Figure 2Number concentrations (1 Hz resolved) of aerosol particles in the nucleation-mode size range (Nnm) and of cloud (ice) particles (Nice) of the eight StratoClim flights compiled in one time series ranging from 03:30 to 12:30 UTC. Kathmandu's (Nepal) local noontime is indicated by the vertical orange line (corresponding to 06:15 UTC, or 22 500 s of the day; UTC). (b) Incidences of concentrations Nnm exceeding 500, 1000, and 5000 cm−3 within 15 min time intervals. Data points of Nnm in black whenever Nice (cyan) equals zero; otherwise Nnm is coloured in red. The dashed blue line (c) indicates the median of Nice (0.031 cm−3) over all cloud particle detections during StratoClim 2017 (Krämer et al., 2020).
At temperatures colder than 205 K, Nice and IWC often reached values above their respective median of 0.031 cm−3 (dashed blue line in Fig. 2c) and ∼ 0.2–2 µmol mol−1 (see Fig. 6). The highest observed IWC values at these temperatures reach up to 1000 µ mol mol−1 with a maximum Nice as high as 30 cm−3. Moreover, the ice crystal sizes (not shown here) exceed their corresponding median; hence, comparatively large ice crystals were found up to and around the cold point tropopause. Such large particles were detected during flights in strong convection.
3.1 The distribution of NPF and the presence of cloud ice particles over daytime
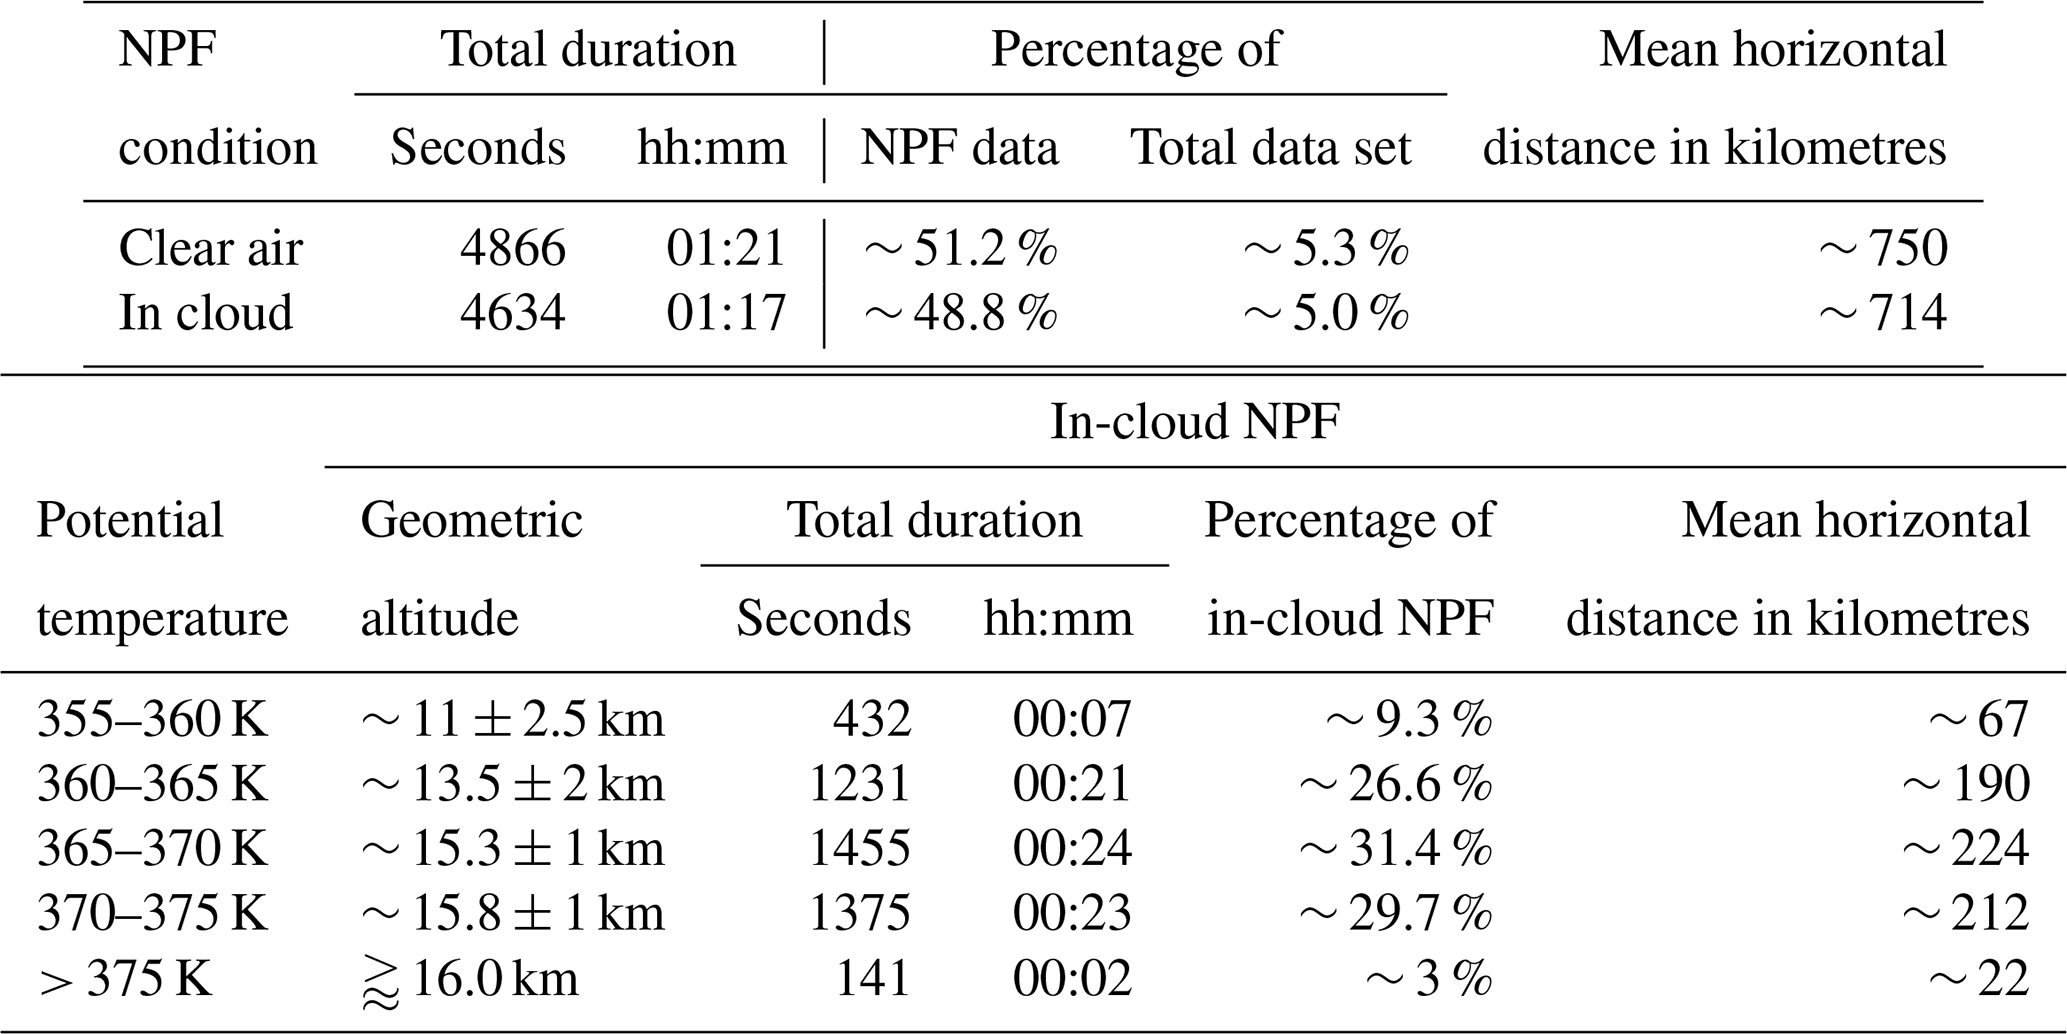
During a total of ∼ 22.5 h of COPAS measurement time at altitudes above ∼ 10 km (θ ≳ 350 K) a total duration of 2 h and 38 min was spent under NPF conditions in the TTL region (∼ 11–17.5 km, ∼ 355–400 K; see Weigel et al., 2021). Throughout the StratoClim 2017 mission, elevated number densities of nucleation-mode particles were observed coincidently with cloud particles (Nice > 0 cm−3) over a total of about 1 h and 17 min (see Table 1). The encountered in-cloud NPF events at altitudes between approximately 11 and 16.5 km (∼ 355–385 K) had a mean event duration of 14.5 s (ranging from 1 s to a maximum of about 300 s; median duration: 2 s).
Table 1NPF data set of StratoClim 2017, separated by event detection under clear-air (i.e. Nice = 0 cm−3) and in-cloud conditions (i.e. Nice > 0 cm−3). Discussed in-cloud NPF events (104 incidents that comply with introduced NPF criterion; Sect. 2.2) are partially embedded in larger clear-air NPF fields with continuously elevated Nnm. The total number of measurement seconds with NPF detections under either of both conditions is scaled to the total data set of the condensation nuclei (CN) measurements and the total duration of NPF encounters. The mean horizontal distance is calculated from the event duration based on a mean flight speed of the M-55 Geophysica (154 ± 39 m s−1), providing an equivalent horizontal extension of NPF. Geometric heights are interpolated values with maximum range of scattering from UCSE data of the eight flights.
In Fig. 2, all NPF detections throughout the StratoClim mission are compiled in a 1 d time series. The range of this time series is limited to the schedules of the eight mission flights between 03:30 and 12:30 UTC, corresponding to local times of 09:15 to 18:15 LT. The encounter of NPF is considered to be a clear-air observation (black data points in Fig. 2) when cloud (ice) particle number concentration Nice remained at 0 cm−3. Coincident observations of NPF and cloud (ice) particles (Nice > 0 cm−3) are highlighted by red points in Fig. 2a and c. The number of in-cloud NPF encounters exceeding different thresholds of measured particle number concentration Nnm (500, 1000, and 5000 cm−3; Fig. 2b) shows for StratoClim 2017 that the intense events of in-cloud NPF occurred predominantly in the late morning, well before local noon. The incidences of in-cloud NPF accumulate in the later morning hours as well as in the local afternoon. Temporal dependencies on daytime were not observed for the occurrence, severity, or frequency of NPF.
3.2 Vertical distribution of nucleation-mode particles in presence or absence of cloud ice particles
Figure 3 displays the vertical distribution of NPF-generated nucleation-mode aerosols in terms of the mixing ratio nnm as a function of potential temperature. Figure 3 a depicts the clear-air observations of elevated nnm (black) together with those when ice particles were coincidently detected (red). The coincident observation of ice particles and nucleation-mode aerosols is vertically limited to a range of potential temperatures from 355 to 385 K (see also Table 1). Thereby, in-cloud NPF of intermediate strength was encountered together with convective overshooting up to altitudes above the mean tropopause height (∼ 380 K, averaged over the StratoClim 2017 period and area of operation). Further above (above 385 K and up to ∼ 400 K) and at altitudes below 355 K, exclusively clear-air NPF was sampled. As already indicated by Fig. 2, also the vertical profiles in Fig. 3 suggest that the strength of NPF was largely independent from the presence of cloud elements. The intermediate panels (c and d) in Fig. 3 show the StratoClim NPF data after their separation into clear-air and in-cloud conditions. Figure 3c shows that in-cloud NPF observations were made during each of the eight mission flights (see Fig. 1). During the first four flights (from 27 July through 2 August) no in-cloud NPF was found above 365 K since deep convection occurred more sparsely in the first half of the StratoClim mission period than in the second half (Bucci et al., 2020). During the second half of the mission flights (4 to 10 August), the frequency and the spatial extent of in-cloud NPF events were increased.
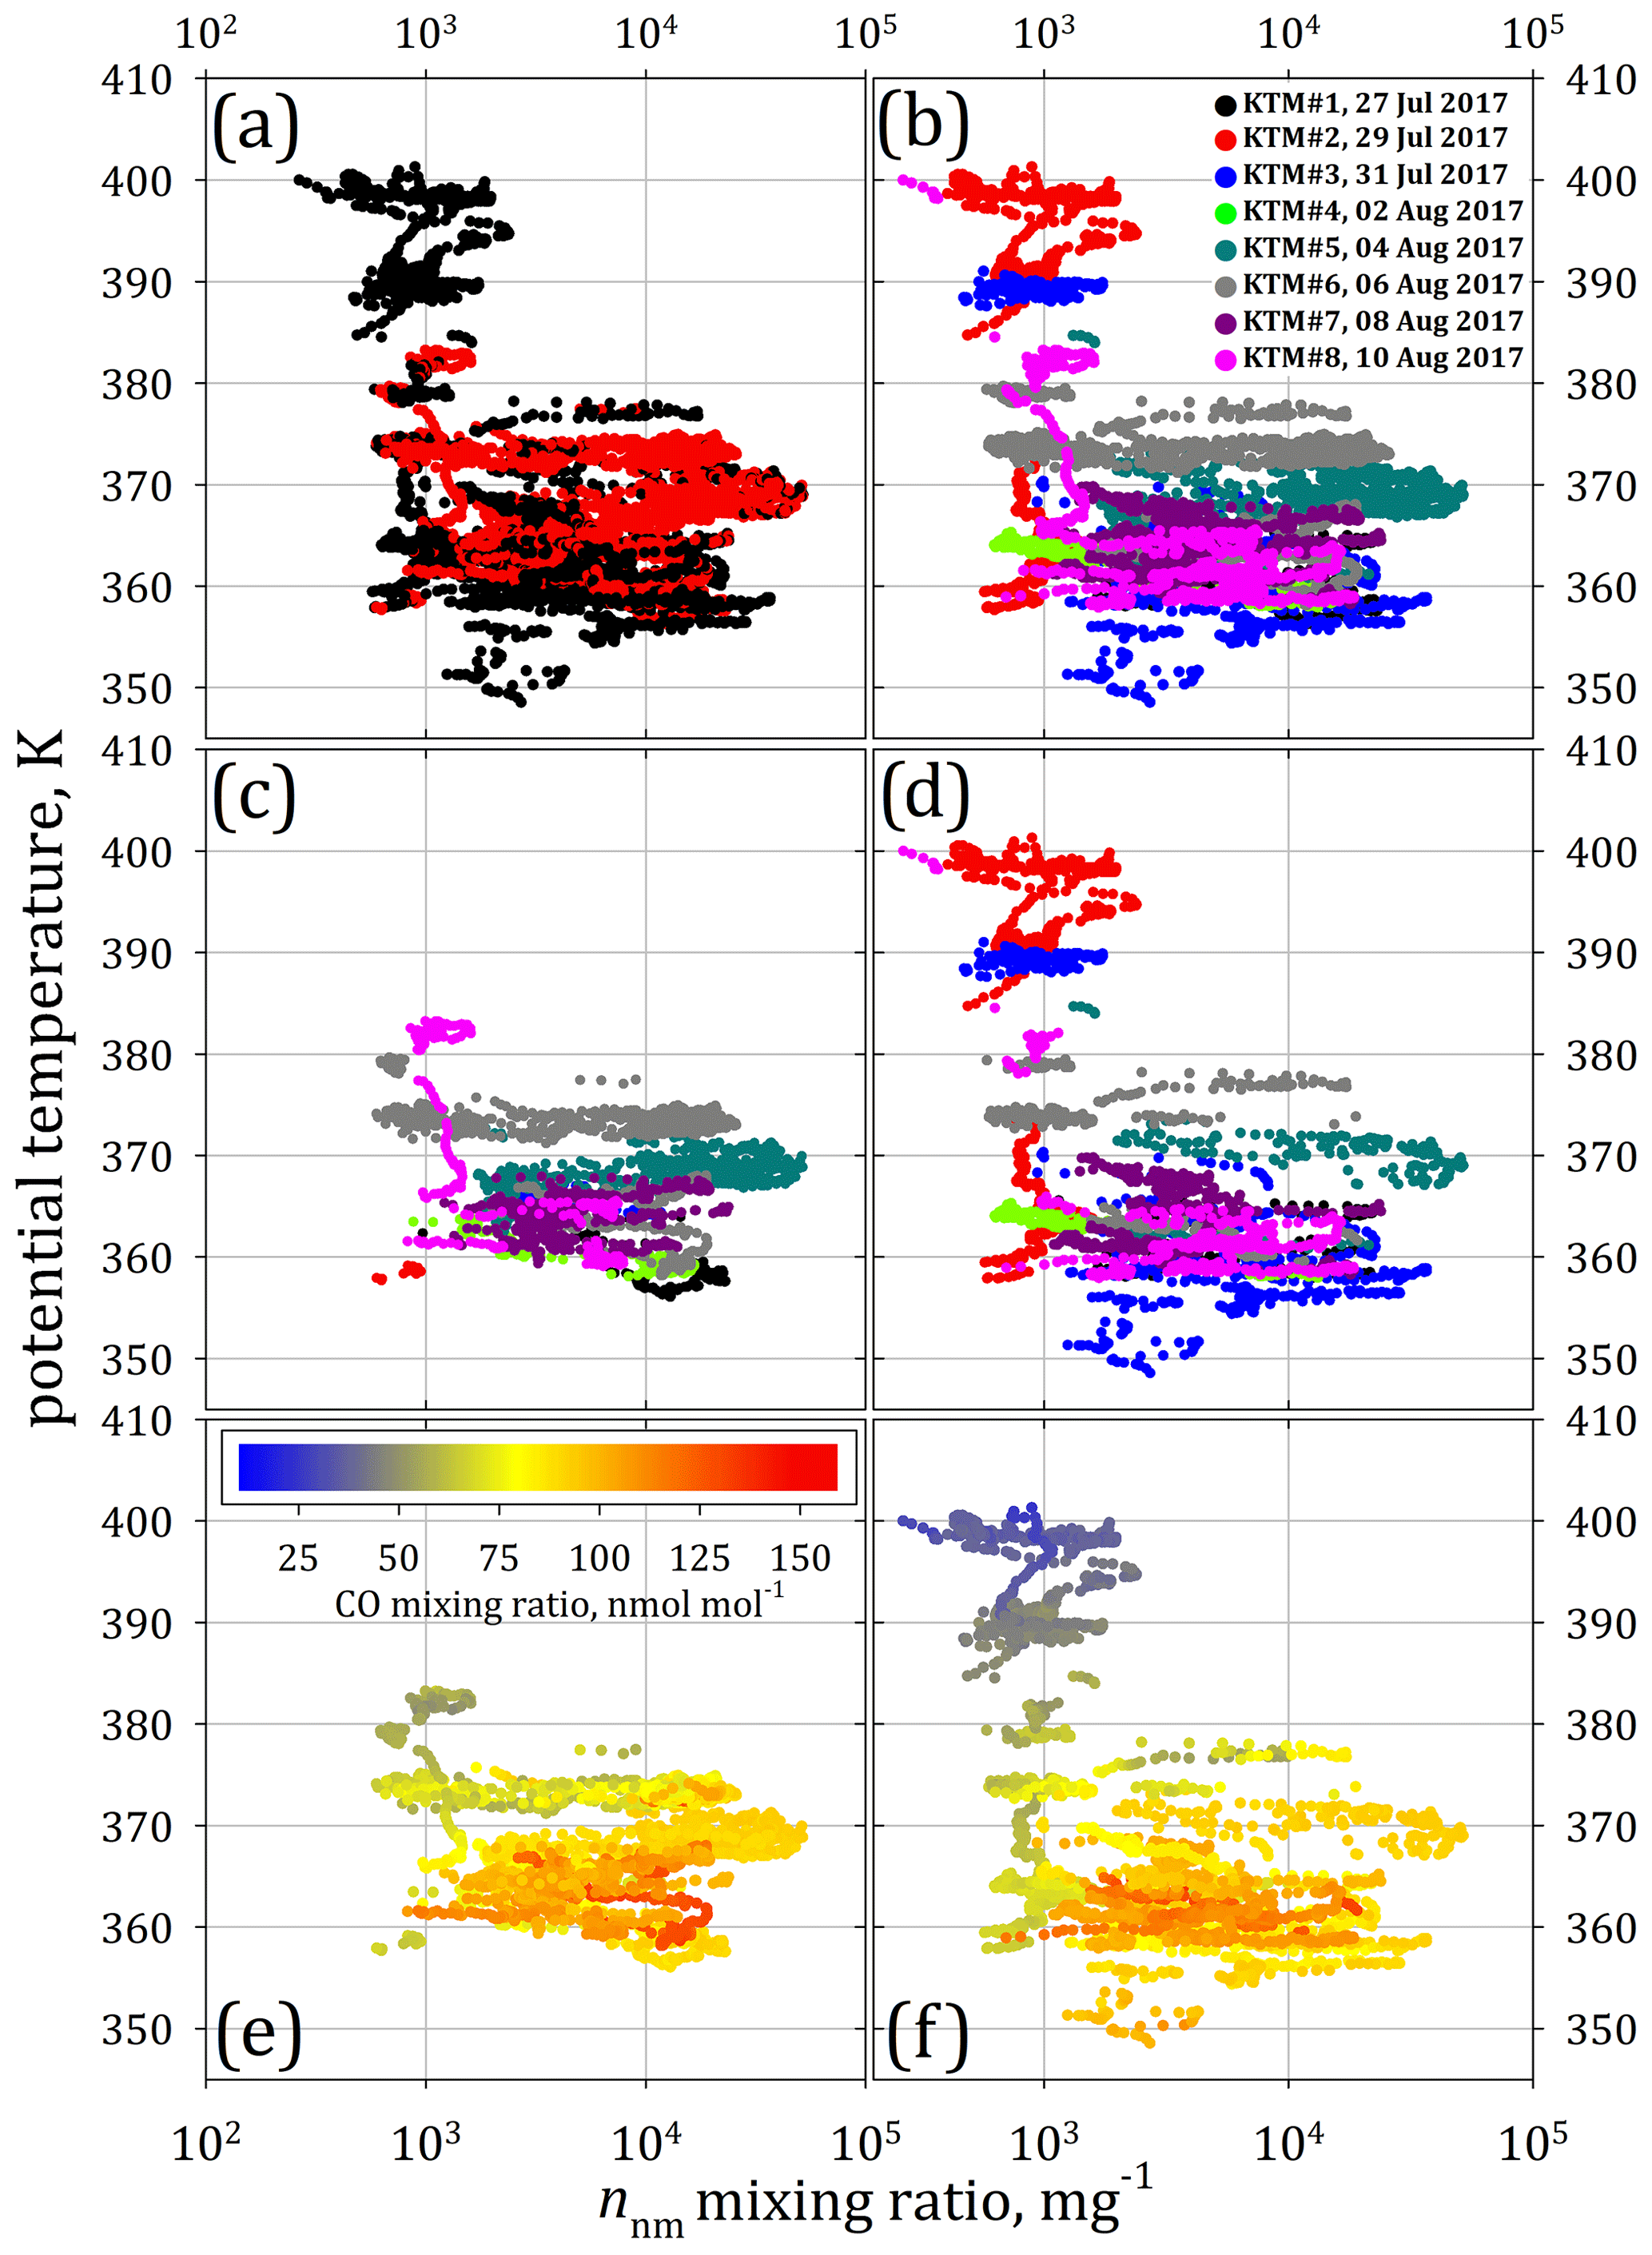
Figure 3Vertical profiles of the mixing ratio (1 Hz resolved) of aerosols in the nucleation-mode size range (nnm) versus the potential temperature (θ). (a) All data separated concerning coincident detection of cloud (ice) particles (black: Nice = 0 cm−3; red: Nice > 0 cm−3) and (b) all data coloured in reference to the flight date (c) exclusively for Nice > 0 cm−3 and (d) when Nice = 0 cm−3. In panels (e) and (f), in-cloud and clear-air measurements are distinguished as in intermediate panels (c, d) and coloured with reference to carbon monoxide (CO) mixing ratios.
The comparison of CO mixing ratios and NPF occurrence in the tropical UTLS over West Africa (Weigel et al., 2011) suggested a link between NPF rate and ground-level sources of NPF precursors. These precursors (likely sulfur compounds, possibly also organics) are thought to be efficiently lifted into the TTL region by convection and not completely removed by scavenging. NPF should most frequently occur in air enriched with precursor material and which experienced vertical uplift. According to Fig. 3e and f, neither clear-air nor in-cloud NPF exhibits nnm maxima coincidently with the highest CO mixing ratios. This is not a typical characteristic of only in-cloud NPF, as is discussed in more detail in Weigel et al. (2021). During in-cloud NPF, the highest densities of nucleation-mode particles were observed at moderate CO mixing ratios of ∼ 90–100 nmol mol−1. In air masses with the lowest CO content (∼ 40–60 nmol mol−1), NPF was observed only above the tropopause (θ > 380 K) and in the absence of ice particles with nnm ranging from 300 mg−1 to a maximum of 2000 mg−1.
The most intense NPF, i.e. with the highest densities of nucleation-mode aerosols, was found below the tropopause (∼ 380 K). In the presence of ice particles (as in clear air), intermediate nnm values were also encountered at CO mixing ratios below ∼ 70 nmol mol−1 at potential temperatures of 370–380 K. Under clear-air conditions, NPF occurred even at much lower CO mixing ratios (mainly from measurements on 29 and 31 July), which is shown by the nnm vertical profile at altitudes above 385 K (Fig. 3f). According to Fig. 3, in-cloud NPF was predominantly found in an altitude band between 355 and 385 K (corresponding to ∼ 9–16.5 km) with nnm in the range of about 1000 to 50 000 mg−1 (∼ 500–11 000 cm−3). Thennm values of NPF in ice clouds generally do not differ from those of NPF under clear-sky conditions.
3.3 Statistics of NPF events in the presence of ice particles
The frequency of NPF occurrence in coincidence with ice particles is illustrated in Fig. 4. The upper panel (Fig. 4a) exhibits the absolute frequency of occurrence of number concentrations Nnm observed during NPF events. The graphs compile all measurements (more than 4600 samples of 1 Hz resolved data; see Table 1) which comply with the NPF criterion (black) for a comparison with clear-air NPF events (green) and those which were coincidently detected with ice particles (red). At heights of in-cloud NPF observations (i.e. between 355 and 385 K), the number concentrations of particles larger than the nucleation mode, i.e. N15 and N65, were in the range (by median) of ∼ 200 cm−3 < N15 < 1000 cm−3 (COPAS) and ∼ 60 cm−3 < N65< 150 cm−3 (from measurements with the modified ultra-high-sensitivity aerosol spectrometer, UHSAS; Mahnke et al., 2021). Two features are apparent:
-
Number concentrations Nnm of more than ∼ 8000 cm−3 seem to be observed more frequently (about 1.5 times more often) in clear-air conditions. As the number of in-cloud NPF observations with Nnm > 8000 cm−3 is comparably low (≤ 10 encounters), the statistics are likely insufficient for drawing further conclusions from this. It is discussed in Sect. 6 whether the presence of cloud ice constrains the chance to detect very recent NPF (resulting in high Nnm).
-
For NPF in the presence of cloud ice, number concentrations Nnm between 1500–4000 cm−3 were observed about twice as often as under clear-air conditions (Fig. 4a).
The highest Nnm values are found mainly in the absence of deposition surfaces, which ice particles would provide. It seems less understandable why NPF should generate a particular range of Nnm more frequently in the presence of cloud ice. Further discussion on this issue is provided in Sect. 6.
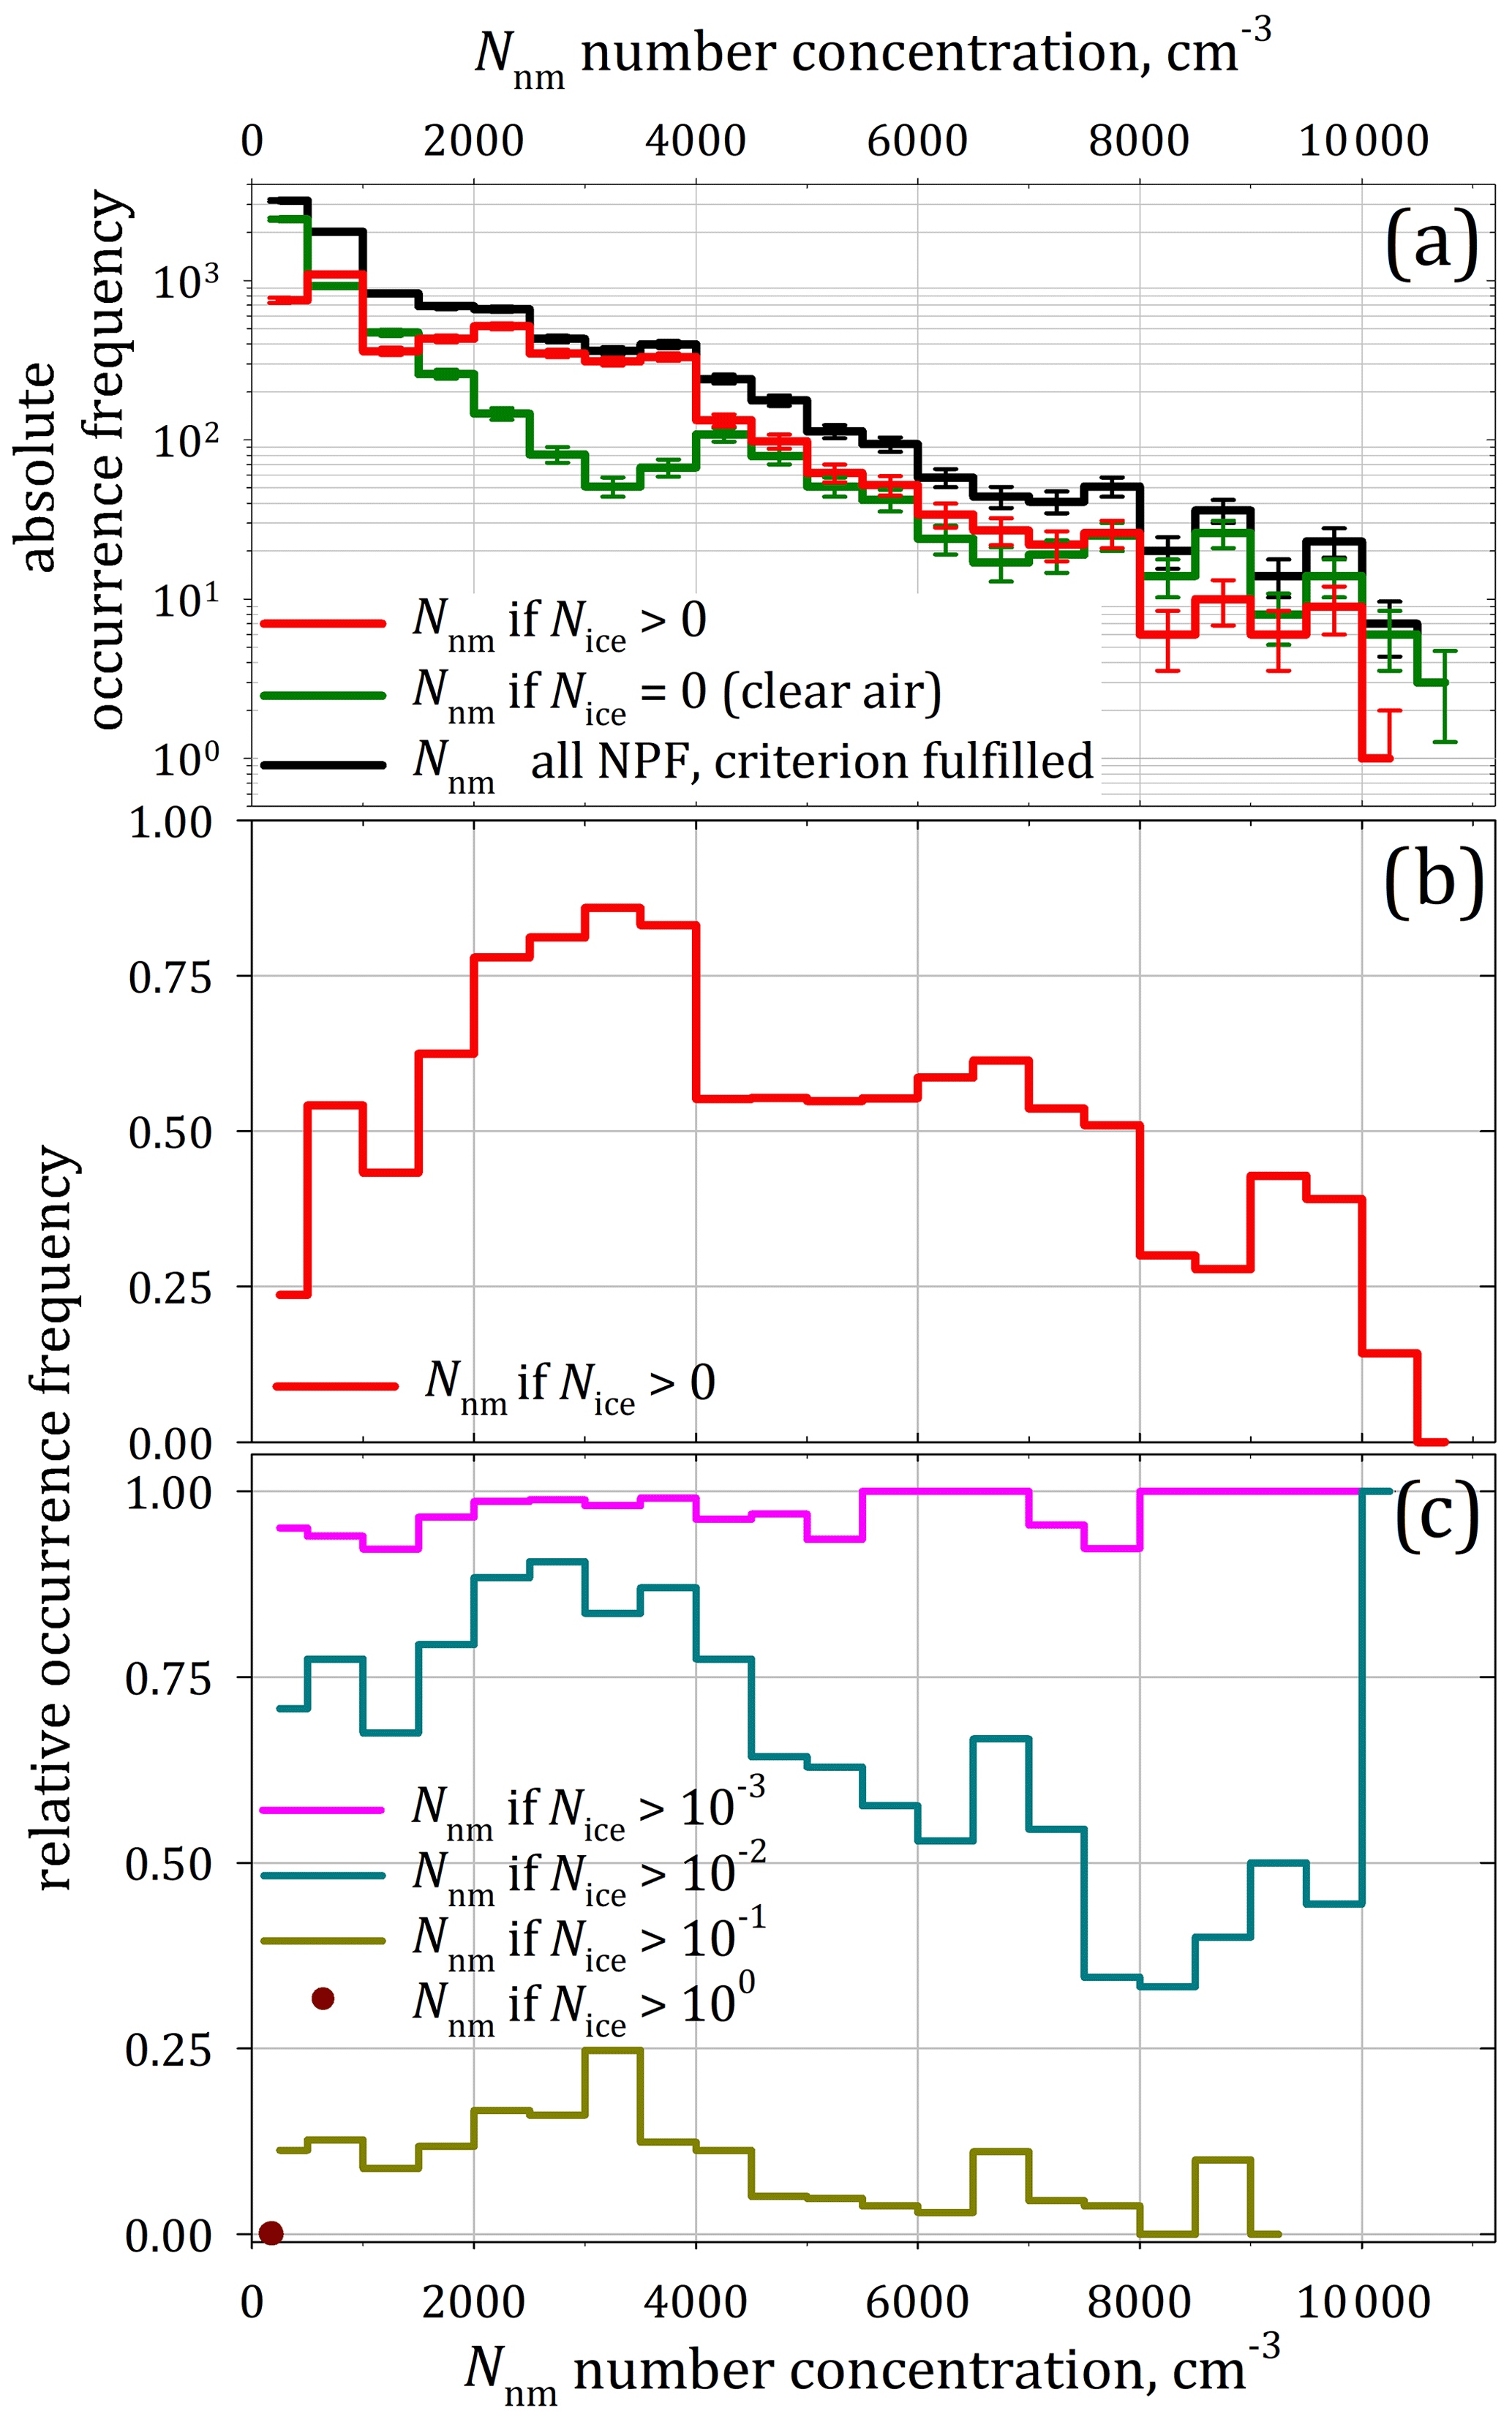
Figure 4Histograms of the occurrence frequency of number concentrations Nnm of all NPF detections (1 Hz resolved) throughout StratoClim 2017. (a) All data of Nnm in general (black) and separated concerning coincident detection of cloud (ice) particles in the diameter size range 3 µm < dp < 937 µm (green: Nice = N3−937μm = 0 cm−3; red: Nice > 0 cm−3). The sum of the green and red curve yields the black curve, the vertical bars of which represent the square root of counts. (b) Relative occurrence frequency of Nnm for in-cloud NPF (if detected coincidently with Nice > 0 cm−3), normalised with respect to all NPF detections, i.e. the ratio of the absolute occurrence frequencies (in red and black in panel a). (c) Relative occurrence frequency of Nnm for in-cloud NPF if detected coincidently with various Nice levels, which were normalised with respect to those NPF detections with Nice > 0 cm−3, (in red; panel b).
Until this point, the presence or absence of ice particles was distinguished by the criteria Nice = 0 cm−3 or Nice > 0 cm−3, respectively. Figure 4b depicts the occurrence frequency of Nnm with ice particles Nice > 0 cm−3 normalised to the occurrence frequency of Nnm of all NPF events (black curve in Fig. 4a). More than 75 % of observed NPF cases with 2000 cm−3 < Nnm < 4000 cm−3 (∼ 200 samples) were detected while ice particles were present. In Fig. 4c, the occurrence frequencies of Nnm are compiled for various levels of number densities Nice, which were normalised to Nnm at Nice > 0 cm−3 (red curve in Fig. 4a). Thresholds of Nice are set with stepwise-increasing number concentrations (by 1 order of magnitude) to investigate whether the NPF is eventually constrained or influenced by the ice particle number density.
Although very faint, so-called sub-visible cirrus clouds were found to comprise very small ice particle number concentrations of 10−5 cm−3 (corresponding to 0.1 L−1; cf. Kübbeler et al., 2011; Spreitzer et al., 2017). Sub-visible cirrus with Nice < 10−3 cm−3 are assumed to have negligible influence on the NPF process, as is also to conclude from Fig. 4c. Therefore, a first threshold level is set to Nice > 10−3 cm−3 (magenta curve), followed by the threshold level of Nice > 10−2 cm−3 (corresponding to 1–10 ice particles per litre; blue curve), which still represents a comparatively small amount of Nice within sub-visible cirrus clouds (cf. Thomas et al., 2002; Peter et al., 2003; Davis et al., 2010; Frey et al., 2011). The maximum observed Nice reached up to ∼ 3 cm−3. Concerning the frequency of observed Nnm, the difference between Nice > 0 cm−3 and Nice > 10−3 cm−3 appears negligibly small. This leaves us to conclude that elevated Nnm was mostly observed coincidently with ice crystal number densities greater than 10−3 cm−3. With rising Nice level (above 10−2 cm−3), the occurrence frequency of the highest Nnm (> ∼ 5000 cm−3) decreased. When Nice exceeds 10−1 cm−3, the occurrence of Nnm > 4500 cm−3 is significantly reduced, and Nnm > 8500 cm−3 was absent. At the highest observed Nice of ∼ 3 cm−3, NPF with Nnm > 250 cm−3 was not detected anymore.
Hence, events with the highest NPF rates occurred preferentially at low ice particle concentrations or in clear air. At a certain Nice level (∼ 3 cm−3), the process of NPF appears to be suppressed, in general agreement with earlier findings (Weigel et al., 2011), indicating the limitation of NPF by 2 cm−3 of cloud ice particles with diameter larger than 2 µm. Among other incidences, a singularly observed event was discussed (Weigel et al., 2011), during which NPF appeared to be suppressed by abundant cloud ice particles, while upon leaving the cloud the NPF re-emerged at almost previously observed concentrations of nucleation-mode particles. These findings suggest that NPF is entirely prevented in cases when Nice exceeds 2–3 cm−3.
4.1 The relationship between cloud ice and aerosols
Based on in situ measurements over northern Australia and over West Africa, de Reus et al. (2009) investigated the relationship between the number density of sub-micrometre-sized aerosol particles and the abundance of cloud particles at UTLS levels. The authors provided aerosol and ice particle number concentrations averaged over the duration of various cloud encounters to determine the proportion of sub-micrometre-sized particles that potentially convert into cloud ice. In the context of homogeneous ice nucleation, a specific relationship between the number concentration of aerosol and of ice particles cannot be expected (Kärcher and Lohmann, 2002), whereas such a relationship is inherent in the ice clouds' heterogeneous freezing process. From their analyses, de Reus et al. (2009) concluded that a similar range of ice–aerosol ratios is observable in the convective outflow of both ordinary tropical convection (Australia) and large mesoscale convective systems (MCSs; West Africa).
Figure 5 depicts the StratoClim 2017 data correspondingly to the data presentation by de Reus et al. (2009) from UT measurements in 2005 during SCOUT-O3 over Darwin, Australia. Reference lines are included, which indicate the number of encountered cloud particles per number of sub-micrometre-sized aerosol particles. The two panels in Fig. 5 comprise the identical set of data points of ice cloud encounters during StratoClim 2017, each of which are averaged over at least 10 s and up to ∼ 23 min.
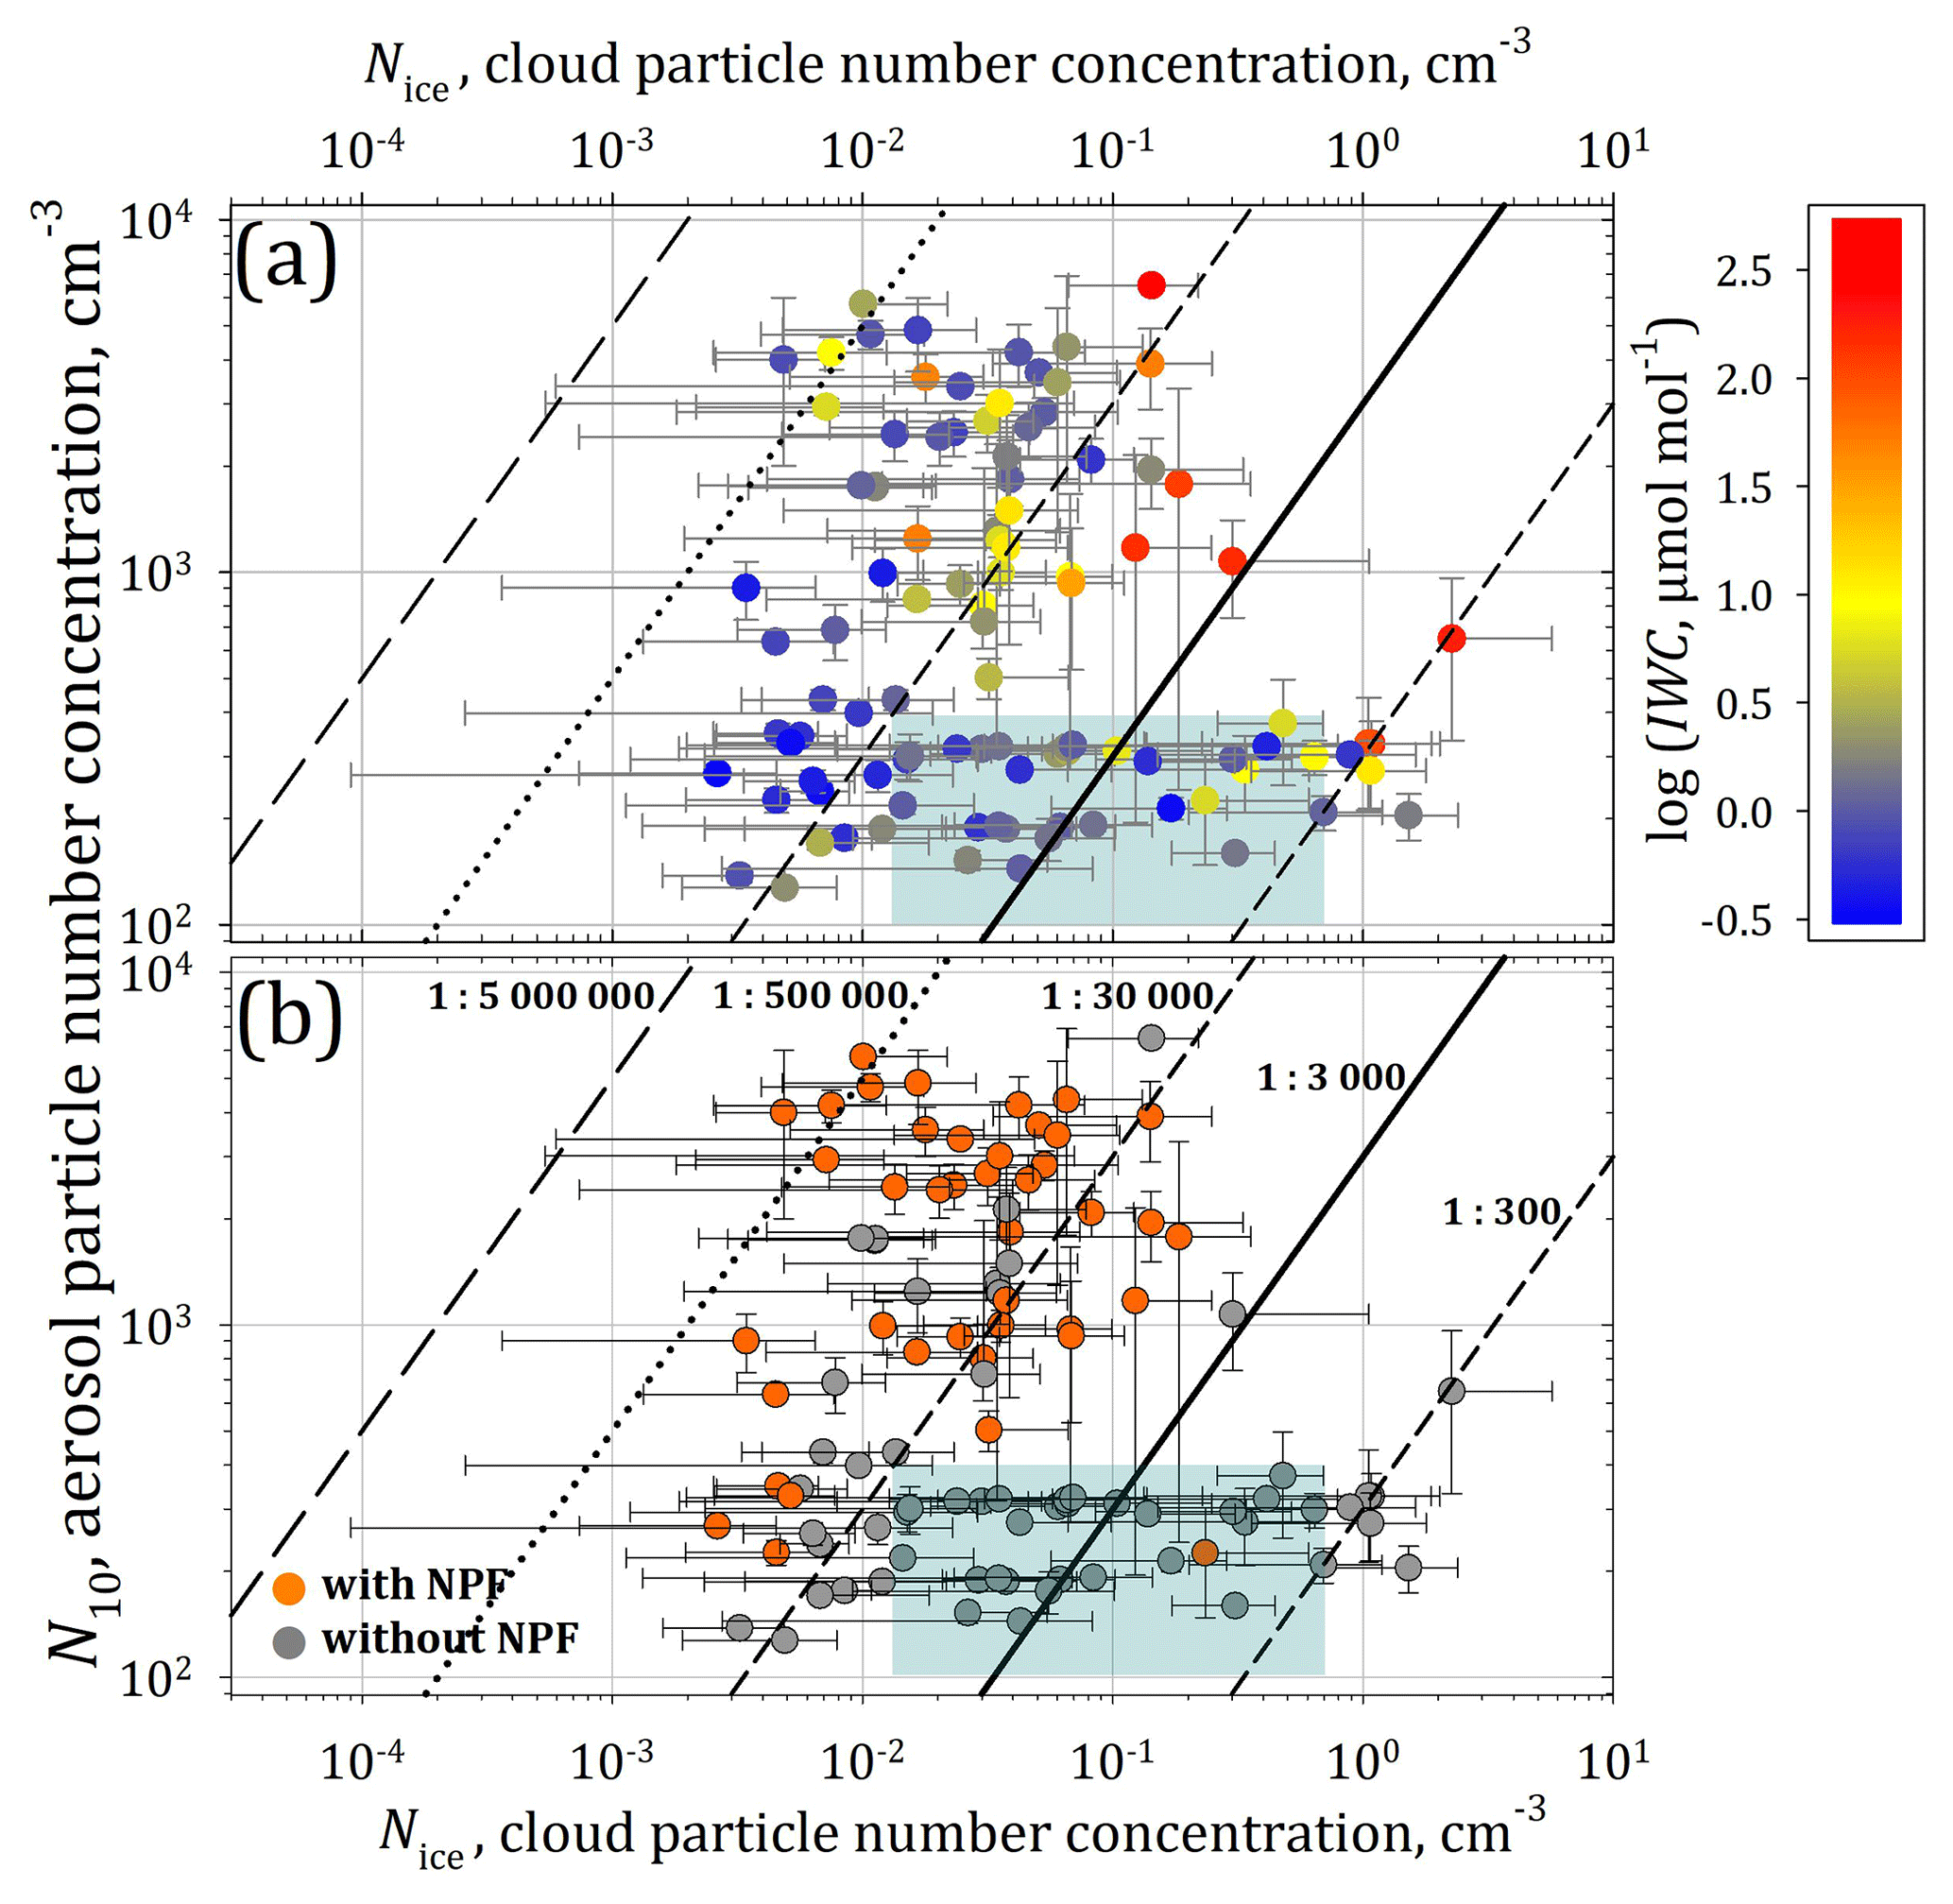
Figure 5StratoClim 2017 data of the total number concentration N10 together with coincident detections of Nice (i.e. N3–937 µm) by the NIXE-CAPS. The vertical bars represent the standard deviation over the averaging periods. Data points are colour-coded in panel (a) with reference to IWC. (b) NPF encounters (orange) throughout the averaging period (otherwise grey). Shaded blue areas in both panels indicate the range of most of the data points provided by de Reus et al. (2009). Reference lines for concentration ratios of 1 : 300 and 1 : 30 000 (as in de Reus et al., 2009) and here additionally for 1 : 500 000 and 1 : 5 000 000 are provided.
Several occasions were identified by de Reus et al. (2009) when comparatively high ratios with up to a few hundred aerosol particles remained non-activated per single ice particle. The cloud ice–aerosol ratios which were found in the Asian monsoon's convective outflow region agree with previous observations (de Reus et al., 2009), which were limited to the shaded blue area in Fig. 5. Total aerosol numbers of significantly less than a few hundred per single ice particle were observed neither during StratoClim 2017 nor by de Reus et al. (2009). Up to N10 of 700 cm−3 almost all StratoClim data result from measurements at mean ambient temperatures colder than −75 ∘C (i.e. the temperatures at which the observations by de Reus et al., 2009, were made). Frequent observations were made at aerosol concentrations below 1000 cm−3. Compared to previous findings, the StratoClim data set comprises more observations at cloud ice–aerosol ratios between 1 : 3000 and 1 : 500 000, including frequent events of elevated N10 (> 103 cm−3). High N10 of more than 6000 cm−3 was observed at IWC values mostly below 10 µmol mol−1 (i.e. log (IWC; µmol mol−1) ≈ 1; Fig. 5a). The majority of observations were made at mean IWC values below ∼ 300 µmol mol−1 (i.e. log (IWC; µmol mol−1) ≈ 2.5), which rules out that the measured N10 was impacted by shattering artefacts from ice particles (see Appendix A). The majority of NPF occurrences (mostly at ambient air temperatures between −50 and −80 ∘C) coincide with cloud ice–aerosol ratios between 1 : 3000 and 1 : 500 000 (see Fig. 5b). The data points with in-cloud NPF concentrate between ratios of 1 : 30 000 and 1 : 500 000 because as a consequence of NPF, the aerosol proportion in the cloud ice–aerosol ratio is strongly elevated. Concentration N10 of more than 1000 cm−3 were not detected at ratios greater than 1 : 3000. For N10 above 500 cm−3 and for cloud ice–aerosol ratios smaller than 1 : 30 000, i.e. where elevated total aerosol concentrations mostly coincide with lower ice particle densities (∼ 10−3–10−1 cm−3), the observations occurred during NPF. Cloud ice–aerosol ratios greater than 1 : 3000 were reached mostly in the absence of NPF.
As pointed out by de Reus et al. (2009), there are caveats inherent to this kind of analysis. The strength or efficiency of the aerosol activation is not straightforward to deduce from provided ratios of total aerosol and cloud particle numbers. Many interdependencies exist that may impact the illustrated relationship, such as
-
the altering of the aerosol particles (coagulation, condensation) or of the cloud elements (sedimentation)
-
the mixing of air masses with different aerosol and/or variable vapour saturation characteristics (entrainment).
The type of ice formation process (liquid-origin or in situ) and the convection dynamics additionally affect the relationship of cloud elements and interstitial aerosol. Assigning nucleation-mode particles of thousands per cubic centimetre (or more) to result from NPF is straightforward. In contrast, Nnm of a few tens to hundreds of particles per cubic centimetre is potentially filtered by the NPF criterion and is probably not identified as an NPF event if detected together with total aerosol concentrations (N10) of comparable numbers. Apart from demonstrating the reproducibility of earlier findings (de Reus et al., 2009), the data set was extended by new observations at different conditions (including NPF) obtained from StratoClim measurements.
4.2 NPF in the IWC–T parameter space
Analyses in earlier cirrus-related studies concerning the clouds' ice water content (IWC) as a function of ambient air temperature provide insight into the processes inherent to the cirrus formation (Krämer et al., 2016). As introduced by Luebke et al. (2016), Krämer et al. (2016), and Wernli et al. (2016), a distinction of cirrus clouds regarding their formation mechanism is obtainable within the IWC–T parameter space. The cirrus forms in situ at elevated altitudes and instantaneously at sufficiently cold temperatures. The liquid-origin cirrus cloud forms on convective uplift from initially liquid droplets at lower altitudes (and less cold temperatures). More specifically, Wernli et al. (2016) distinguish between the following.
-
Liquid-origin cirrus. Initially well-sized liquid cloud droplets freeze at almost thermodynamic equilibrium in the ambient temperature range 235 K < T < 273 K under nearly saturated conditions with respect to liquid water (relative humidity RHw of ∼ 100 %) but at high supersaturation with respect to ice (RHi ≫ 100 %), while at freezing level, the water can coexist in each of its three phases.
-
In situ cirrus. Under exclusion of pre-existing large liquid cloud droplets, ice crystals nucleate heterogeneously (due to deposition freezing) or freeze homogeneously from tiny super-cooled aqueous solution droplets (Koop et al., 2000), which are designated as “too small to be considered as cloud droplets” (Wernli et al., 2016).
In Fig. 6 the IWC versus ambient air temperatures is displayed for all cloud encounters throughout StratoClim 2017 as a function (colour code) of
- a.
the mixing ratio of nucleation-mode particles (i.e. n6−15 = nnm; Fig. 6a),
- b.
the total mixing ratio n6 of particles with dp > 6 nm (Fig. 6b), and
- c.
the CO mixing ratio (Fig. 6c), respectively.

Figure 6NPF in the IWC–T parameter space (Krämer et al., 2016): measured ice water content (IWC) coincidently detected with COPAS data as a function of ambient air temperature throughout StratoClim 2017 (1 Hz resolved). Data points are colour-coded referring to (a) the detected mixing ratios of nucleation-mode particles, nnm; (b) the total mixing ratio n6; and (c) the carbon monoxide (CO) mixing ratio. Note: in panel (a), the data points are grey if data of n6−15 are available, while colours are apportioned only to those nnm (i.e. n6−15) complying with the NPF criterion. Generally, the black lines represent the median (solid) and the upper- and lowermost bounds (dashed) of the core IWC band, respectively, as obtained from earlier measurements at other locations (Krämer et al., 2016).
The upper panel of Fig. 6 includes two data sets: (1) all data from StratoClim 2017 in 1 Hz resolution (grey data points) and (2) only the resulting nnm complying with the NPF criterion (colour-coded data points). At very low ambient air temperatures (∼ 200 K and colder) and for comparatively high IWC values, the n6−15 (grey) data were available, but many failed the NPF criterion. The absolute values of the mixing ratio n6 of sub-micrometre-sized particles were relatively high (Fig. 6b). The detection of likewise excessive mixing ratios n15 (without illustration) resulted in n6−15 that did not exceed the specified threshold of the NPF criterion (see Sect. 1.1). Nevertheless, most of the n6−15 data points which failed the NPF criterion (see the grey points in Fig. 6a) coincide with the mixing ratios n6 reaching up to several thousands of particles per milligram. It is not deducible from COPAS measurements how the enriched particle densities (n6 and n15) distribute over the diameter spectrum of the sub-micrometre-sized aerosols. It therefore remains open whether the restrained n6−15 is due to expired NPF with particles' rapid coagulation (with background aerosol and cloud ice) out of the nucleation-mode size range (Weigel et al., 2021) or whether the particle enrichment (consistently in n6 and n15) is due to larger particles that were lifted with deep convection. The main findings from these juxtapositions can be summarised as follows:
-
The absence of NPF with IWC exceeding 1000 µmol mol−1 in very cold air (Fig. 6) suggests that NPF is constrained as soon as deep convection prevails due to the presence of predominantly liquid-origin ice particles. IWC exceeding 1000 µmol mol−1 at air temperatures colder than 200 K indicates that deep convection had occurred. This high IWC originated from cloud ice that formed from liquid droplets at lower altitudes as the amount of water vapour in the air at such cold temperatures is not sufficient to achieve comparable IWC values. Thus, the formation of encountered cirrus cannot be attributed to any other process than the liquid-origin process. This feature was observed during the flights on 27 July and on 10 August 2017, respectively. Within the same temperature range (T < 200 K), only a few NPF events with intermediate nnm of more than ∼ 4000 mg−1 (log (nnm; mg−1) ≳ 3.6; yellow and reddish colours in Fig. 6a) were encountered offside from strong convection.
-
In the presence of in-situ-formed cirrus particles at cold temperatures (185–200 K), i.e. in or around the cold point tropopause region, NPF events with nnm > 5000 (i.e. log (nnm; mg−1) > 3.7; orange and reddish colours in Fig. 6a) or recent NPF bursts were rarely observed. When the cloud ice has formed in situ (CO < 80 nmol mol−1; yellow, greenish, and blue colours in Fig. 6c), mostly weak NPF with nnm < 1500 mg−1 (i.e. log (nnm; mg−1) < 3.2; bluish colours of data points in Fig. 6a) was observed. These data also indicate that NPF proceeds in air with low CO content.
-
Suppression of NPF by cloud particles (due to the large total surface area from their number density and particle size) could explain why the number of nucleation-mode particles remained below the NPF criterion threshold at high IWC although total particle mixing ratios (n6 and n15) were significantly elevated. It is unlikely that the abundance of sub-micrometre-sized particles of up to 11 000 cm−3 originates from interstitial (non-activated) aerosols carried in the cloud without contributions from NPF. The large particle quantities observed (103–104 mg−1) and the moderate CO content of the air sampled (≲ 100 nmol mol−1) indicate a source of these particles at high altitudes. About 4 h after an NPF event has expired, the event may not be detectable anymore due to the short persistence of the particles in the nucleation-mode size range (Weigel et al., 2021). Hence, if the IWC values remained high over several hours due to deep convection and if NPF had happened more than 4 h prior to the measurements, then the nucleation-mode particles have certainly coagulated to sizes beyond 15 nm in diameter.
-
Air's low pollutant load is indicated by comparatively moderate or low CO mixing ratios between 50 and about 100 nmol mol−1 at ambient air temperatures of < 200 K (Fig. 6c). For comparison, the NPF observed during the West African monsoon was associated with CO levels between 60 and 90 nmol mol−1 (Weigel et al., 2011). Observation of intermediate NPF (nnm < 1500 mg−1, log (nnm; mg−1) ≲ 3.3) in the midst of in-situ-formed cloud ice in air with low pollutant load (CO < 80 nmol mol−1) indicates that recent convective uplift of polluted air is not a prerequisite for NPF to occur. Advection of air from elsewhere or chemical and/or photochemical conversion causes the accumulation of NPF precursors at UTLS levels. In air with the highest CO content (> 100 nmol mol−1), the IWC–T values (for T > 200 K, i.e. at lower altitudes) remain in expected ranges, and they scatter within the limits of most frequent observations (dashed black lines in Fig. 6) as obtained from earlier analyses (Krämer et al., 2016). At the highest CO content (> 100 nmol mol−1), the nnm values predominantly remained below 5000 mg−1.
5.1 NPF as a function of mean free distance between ice elements
Surfaces such as those of ice particles constitute sinks for the gaseous precursor species such as the H2SO4–H2O system (Bogdan et al., 2006, 2013), and the abundance of condensation surface reduces or even prevents the NPF process.
The free distance between the ice particles is quantified based on the measurements of Nice and of the ice particles' mean mass radius (consider ). The mean free volume in between the ice particles (the inter-crystal volume, ICV, per cubic centimetre of air) is calculated with the number of ice particles (instead of the particles' number concentration) as
which basically subtracts the total ice volume from the sampled air volume (V = 1 cm3), and the division by yields the ICV. Consequently, the ICV represents the mean particle-free volume assuming a homogeneous distribution of ice crystals within the air volume. With a maximum of measured ice particles ( = 3) together with the maximum detected ice particle radius of 100 µm, the subtraction corresponds by the order of magnitude to a subtraction of 10−11 cm−3 from 1 cm−3. Hence, the volume of ice is insignificant compared to the volume of air, and the ICV may be considered to be a function of only. The mean inter-crystalline distance (ICD; in centimetres) is then calculated by
and the ICV is assumed as a sphere around each individual ice particle. The radius of each sphere represents the mean ice-free distance in any direction from the individual ice particle. Conceptually, this approach corresponds to the definition of the cloud elements' distance provided by Baumgartner and Spichtinger (2018).
Figure 7a depicts the number concentration of nucleation-mode particles (Nnm) as a function of the calculated ICD. The continuous colour transition of the data points in the x direction together with unchanged colouring in y direction demonstrates the independence of Nnm from the ICD and rather illustrates the correlation between the number of ice particles and their distance. The present ice particles compete for the limited amount of available water vapour such that elevated number concentrations of ice particles mainly result from the abundance of small ice particles. Hence, by means of the number of ice particles only, it is not possible to constrain the occurrence and/or strength of NPF as a wide scattering of Nnm concentrations was observed at any ICD between about 1 and 10 cm.

Figure 7Concentrations of in-cloud-detected nucleation-mode aerosols (Nnm) in 1 Hz resolution as a function of the mean inter-crystal distance, ICD, between encountered cloud (ice) particles colour-coded with reference (a) to the number concentration of cloud ice particles, (b) to the IWC, and (c) to the mean ice particles' radius.
Figure 7b shows the ice particles' mean mass radius as a function of the ICD and the number of nucleation-mode particles. By means of the mean mass radius , two different cases were distinguished:
- a.
For the smallest ice particle sizes (∼ 3 µm < < ∼ 20 µm, log (; µm) ≲ 1.3), a dependency of the ICD on the particle size was discernible. For instance, the smallest ice particles (bluish ) predominantly coincided with short ICD of about 1 cm at elevated Nice. Towards larger ICD, ice particle sizes continuously increased up to ≈ 20 µm, which reflects the competition of the ice crystals for the available water vapour. Within the same interval of ice particle sizes ( < ∼ 20 µm), the concentrations Nnm scattered over almost 2 orders of magnitude (from ∼ 100 to ∼ 10 000 cm−3) up to ICD of ∼ 10 cm without any obvious systematics.
- b.
In the presence of larger ice particles ( > ∼ 30 µm 1.3 < log (; µm) ≲ 1.4, orange and reddish colours), the ICD ranged from ∼ 1 cm to values above ∼ 10 cm. Hence, not only did determine the resulting ICD, but Nice increasingly contributed as well. The concentrations Nnm were not at the highest when ICD values reached their maximum at ∼ 10 cm. For the largest particle sizes ( > ∼ 30 µm), the values of Nnm accumulate at ∼ 400–4000 cm−3 over the entire range of ICDs.
As long as the mean ice particle radius remained below a few dozen micrometres, NPF was encountered with almost any resulting Nnm concentration. As shown in Fig. 4 and summarised in Sect. 4.4, a wide scatter of Nnm was observed to occur largely independent from coincidently detected number Nice of ice particles. Hence, the in-cloud NPF observed during StratoClim 2017 was almost unaffected by the ice particle number as long as the mean ice particle size remained small enough (i.e. with < 20 µm).
The IWC combines both microphysical parameters of the observed ice clouds, particle size and number concentration. If Nnm over ICD is analysed as a function of IWC, systematics become visible (Fig. 7c). At lower IWC (< 1 µmol mol−1, log (IWC; nmol mol−1) ≲ 0; bluish and green colours) the ICDs were at the largest, and observed NPF was of the highest intensity (Nnm of several thousands per cubic centimetre). Between 1 and 10 µmol mol−1 (yellow colours), the maximum of Nnm throughout observed NPF events was reduced. The maximum Nnm was further reduced when IWC increased to values beyond 10 µmol mol−1. This result demonstrates that the maximum Nnm reached throughout in-cloud NPF is determined (in addition to the precursor gas concentration) by the combination of both the ice particles' number concentration Nice and their mean mass radius .
5.2 NPF as a function of cloud elements' integral radius IR
The combined effect of cloud ice particles' number density and size on the detectable Nnm during in-cloud NPF motivates the investigation of Nnm values as a function of the integral radius IR = of the ice particle population. The parameter IR was described, e.g. by Manton (1979) or Politovich and Cooper (1988), and is frequently used to characterise clouds' microphysical properties (e.g. Korolev and Mazin, 2003; Krämer et al., 2009). IWC and IR are expected to be strongly related (also visible by the systematic sorting of data in Fig. 8a) as the diffusive growth rate of an ice particle is proportional to IR (see e.g. Pruppacher and Klett, 2012). The IR is the direct control variable for the mass increase per time by condensation (mainly of water vapour) on the surface of a cloud ice particle and thus for the particle's growth rate. At supersaturated NPF conditions, the NPF precursors condense on the cloud ice particles, and the change in the ice particle's mass from the condensation of a gaseous precursor converts into a reduction in the gaseous precursor concentration.
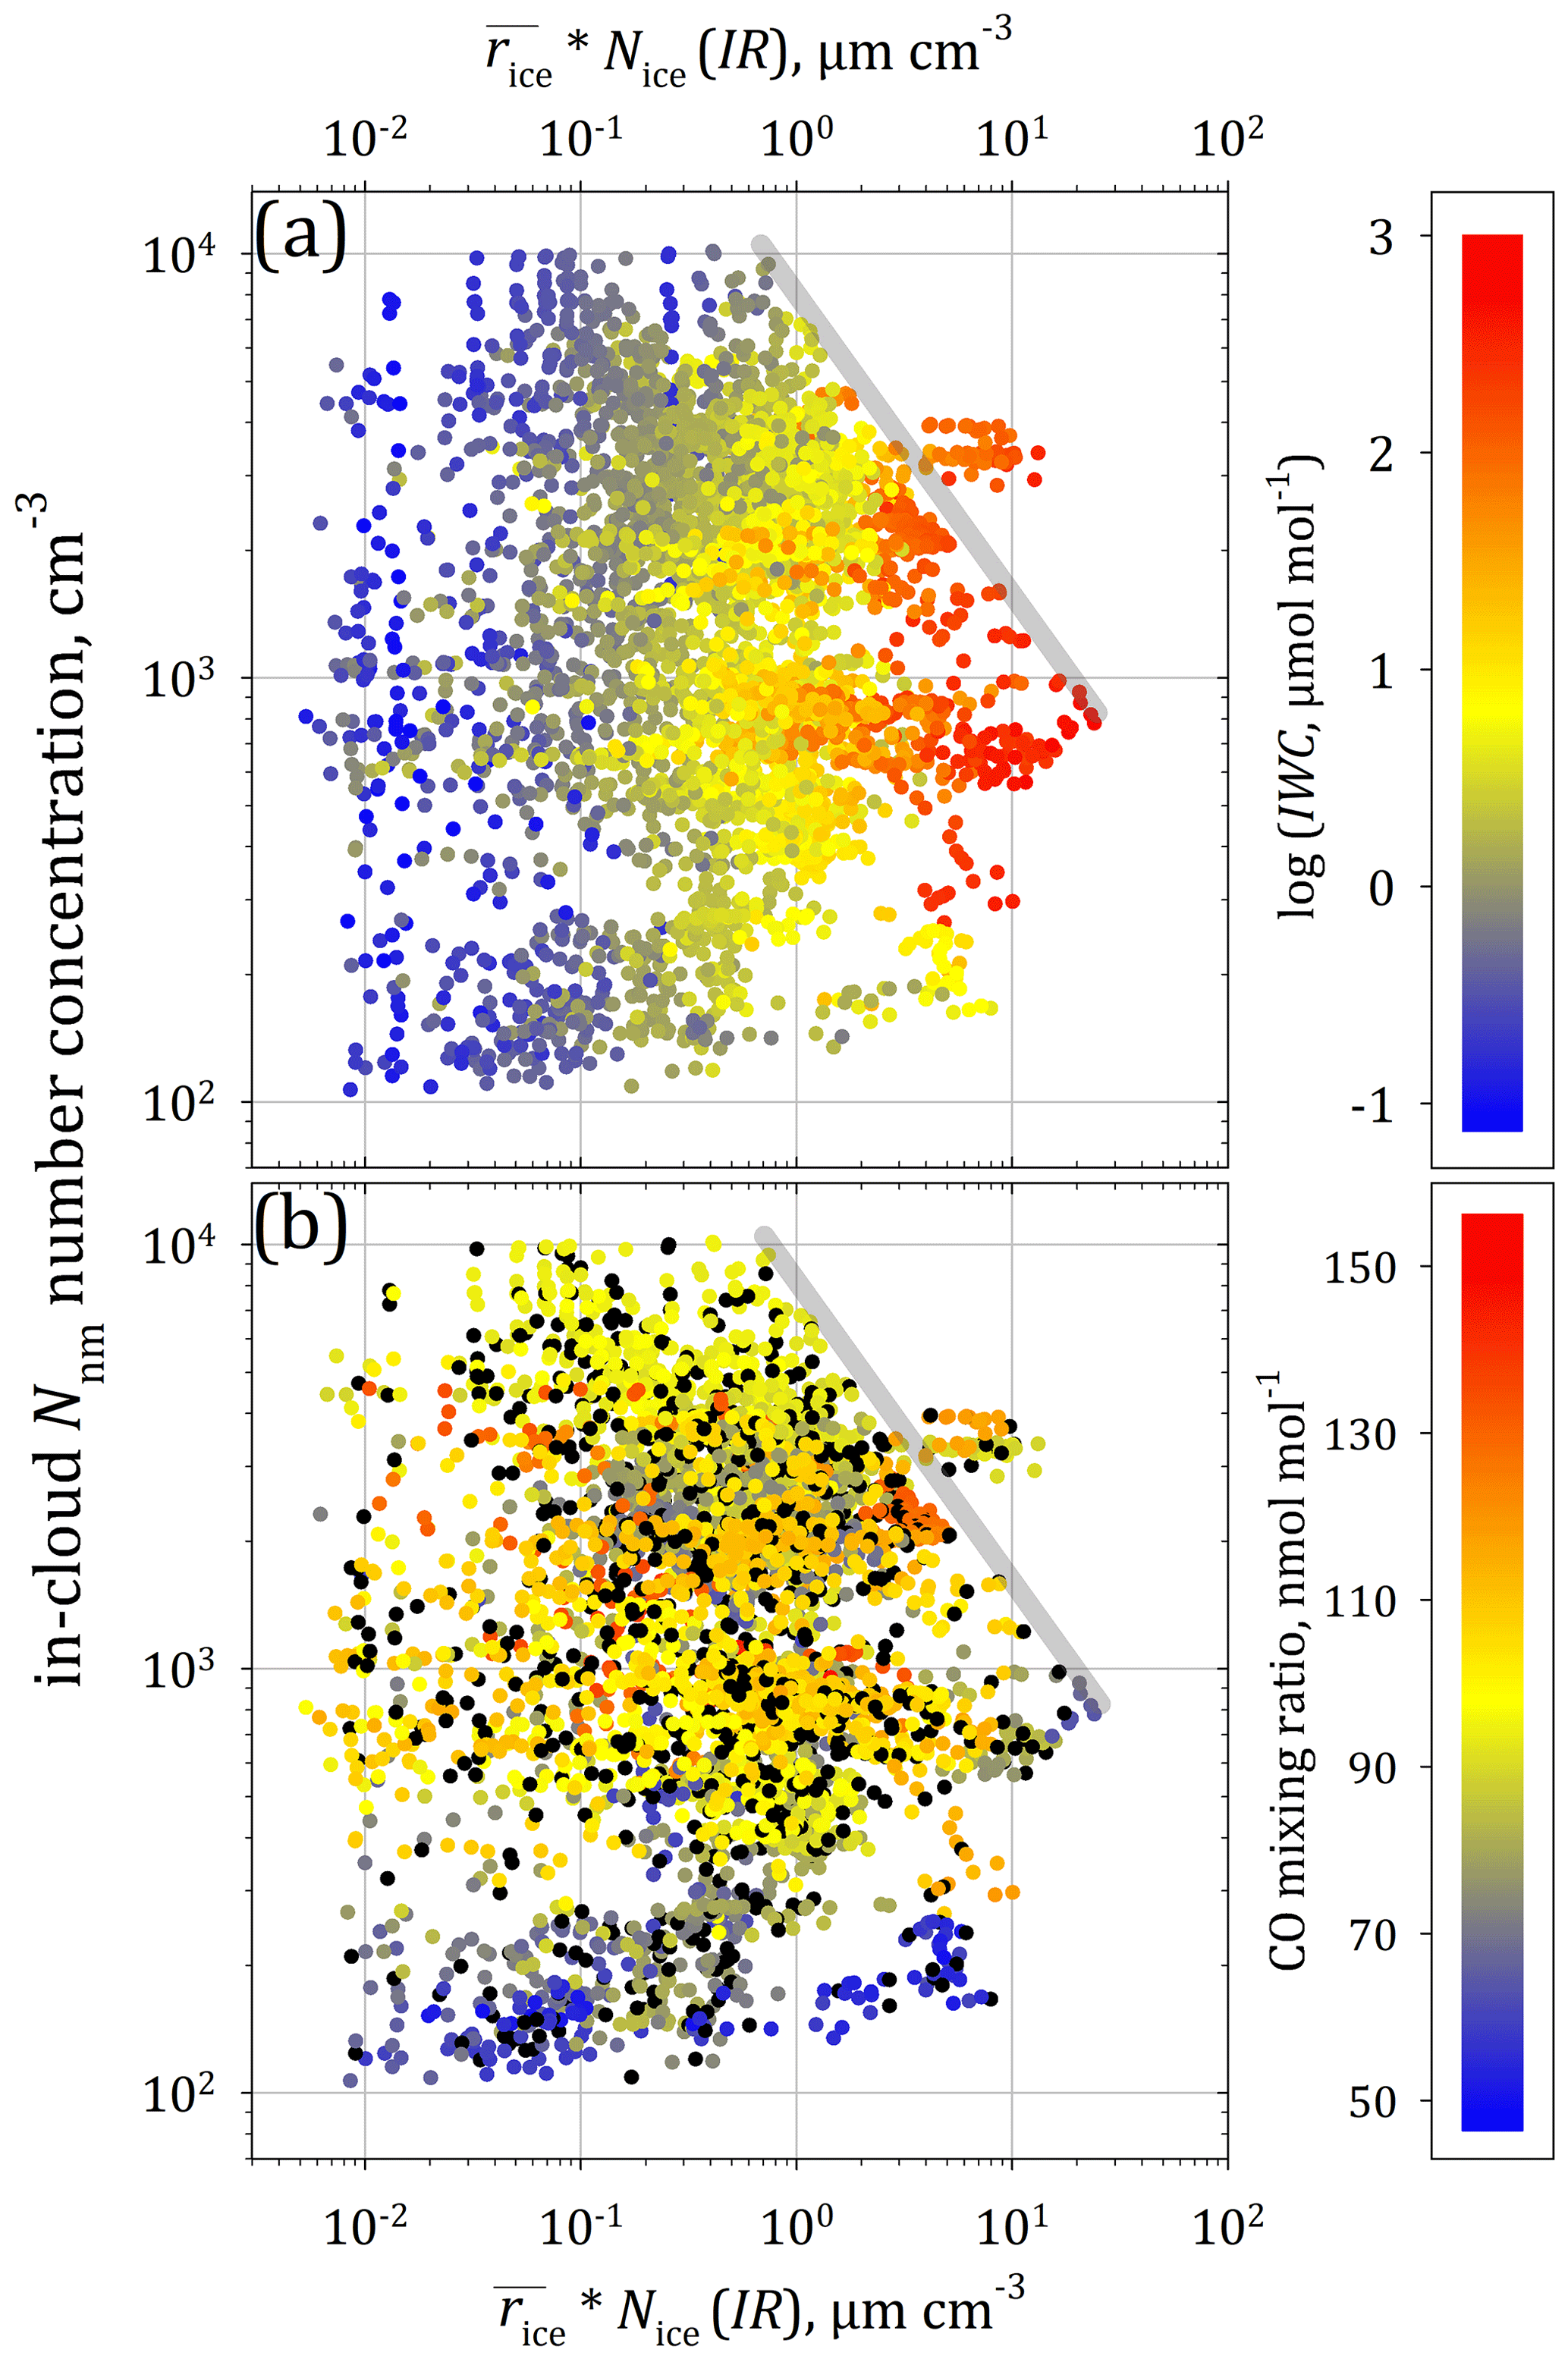
Figure 8Concentrations of nucleation-mode aerosols (Nnm) in 1 Hz resolution as a function of the cloud (ice) particles' integral radius, IR = colour-coded in correspondence to detected ice water content (IWC; panel a) and to measured CO mixing ratio (b); in the absence of CO values the data points are blackened. The diagonal, grey-coloured bars indicate a limiting range beyond which the probability of NPF observations decreases, with two exceptional encounters of very recent or just proceeding NPF (see text for details).
For almost all IRs below 1 µm cm−3, the Nnm concentrations were unsystematically scattered over the entire interval between ∼ 100 and ∼ 10 000 cm−3. Towards the highest IR (> 1 µm cm−3), the maximum of observed Nnm continuously decreased. This reflects a limiting influence by the cloud ice on the maximum strength of occurring NPF (indicated by the diagonal shaded grey bars in Fig. 8). An exceptional feature is exhibited in Fig. 8a with a high signal of Nnm (∼ 3000–4000 cm−3) amongst elevated IR (between ∼ 4 and 10 µm cm−3). This cluster of data points resulted from the measurements of two individual mission flights, on 27 July (∼ 3000 cm−3 < Nnm < ∼ 3500 cm−3) and on 6 August (∼ 3500 cm−3 < Nnm < ∼ 4000 cm−3), respectively. During these measuring periods, ice particle densities (Nice) and the mean ice particle sizes (i.e. the particles' mean mass radius ) did not rise above 0.1–0.3 cm−3 and 25–50 µm. Neither Nnm nor the ice microphysics exceeded the range of moderate values. The two independent exceptions in the observational data indicate a local and temporal state of imbalance that could have been caused by
-
intermediate NPF which was just proceeding when measured or which had been completed very recently (cf. Weigel et al., 2021; in such a case, the observed Nnm should rapidly (< 1 h) decay to values of ∼ 1000 cm−3 due to coagulation);
-
ice particles which sediment from high altitudes into an area of currently active NPF; or
-
cooling of air accompanied by nucleation of ice, while the cooling is due to the air parcel's vertical displacement, which results from deep convection or gravity wave activity (see Weigel et al., 2021).
The limiting influence of the cloud ice on the maximum strength of NPF as indicated by the majority of observations is explainable by the reduction in NPF precursor material due to its condensation onto present ice particle surfaces. The question arises whether the distance between the ice particles allows efficient absorption and sustained reduction in NPF precursor molecules or whether such an effect exists only in the immediate vicinity of an ice particle. The effectiveness of such a process strongly depends on the diffusivity of the NPF precursor molecules. If the molecules of the NPF precursor are absorbed before the thermodynamic conditions for NPF are reached, then these molecules are removed and missing in the formation of molecular clusters as an initial step in the nucleation process. Numerical analyses concerning the reduction in the saturation ratio of H2SO4 due to the presence of ice particles which are coated with H2SO4 (as is typical for cirrus particles at 10–20 km altitude; cf. Bogdan et al., 2006, 2013) are described in Appendix B (see also Fig. B1). Although the binary H2SO4–H2O nucleation process alone is assumed as insufficient to explain atmospheric NPF (Bianchi et al., 2016; Kirkby et al., 2011), the numerical analysis qualitatively applies also to saturated condensable vapours containing compounds other than H2SO4 (see Riccobono et al., 2014).
The numerical analysis yielded that the precursor's saturation ratio decreases rapidly with increasing IR. As long as the ice particles' size remains small (radii < 10 µm) their influence on the saturation ratio of the NPF precursor is comparatively weak. As demonstrated for H2SO4 (cf. Appendix B), rising IR (combining ice particle size and number) constrains the production of high Nnm or inhibits NPF altogether. Note that only completely uncoated ice particles of pure water (which do not exist in the UTLS; cf. Bogdan et al., 2006, 2013) would be ineffective condensation surfaces for H2SO4 vapour.
According to Fig. 8a, the Nnm range of 500–3000 cm−3 is most frequently observed over the range of detected IR values. Regarding Fig. 4, Sect. 4.4, Fig. 8, and the simulation of Appendix B, the following conclusions seem likely:
-
The maximum Nnm resulting from in-cloud NPF is determined by IR. Abundant ice particles of sufficient size are capable of reducing the saturation ratio of NPF precursors within timescales ranging from half an hour to a few hours. Consequently, intermediate or weak NPF events with low Nnm production occur most frequently in the presence of cloud ice. The probability of instrumentally identifying weak NPF events decreases with decreasing Nnm.
-
These NPF limitations by the IR result from the StratoClim 2017 data set and may not necessarily be of general validity. Further investigations at other locations and under variable conditions and dedicated laboratory experiments are necessary to confirm these limitations marked as grey bars in Fig. 8, which do not represent sharply quantifiable relationships.
-
Coagulation additionally affects Nnm on timescales of a few hours (see Weigel et al., 2021).
According to the results in Fig. 8, IR values of about 24 µm cm−3 (corresponding to Nice of about 0.7–0.8 cm−3 and of about 32 µm) constituted the uppermost limit for in-cloud NPF observation during StratoClim 2017. Below the IR limits marked with grey bars, in-cloud NPF is encountered largely unaffected by the presence of ice particles. It is emphasised that the grey bars primarily mark a region in the IR–nnm parameter space where the duration of an exceedance of marked levels decreases with increasing IR and/or nnm. Hence, the detection of these points becomes less likely, or the probability increases to miss such events when the values cross the marked levels.
Figure 8b depicts Nnm as a function of IR with reference to the CO mixing ratio. Neither samples with the highest Nnm nor samples with the highest IR were directly ascribable to polluted air recently lifted from the surface. Intense NPF (with Nnm > 5000 cm−3) was observed at CO mixing ratios ranging between ∼ 90 and 100 nmol mol−1, which indicates the air's moderate pollutant load or its moderate age. In less polluted air (CO mixing ratios below∼ 70 nmol mol−1), the IR reaches the highest values (up to ∼ 24 µm cm−3), which were observed together with elevated IWC (up to ∼ 750 µmol mol−1, i.e. log (IWC; nmol mol−1) ≈ 0.88). Within lightly polluted air, cloud ice particles mostly form in situ. It is conceivable that the in situ cloud ice formation and NPF happen simultaneously and are induced by the same process: e.g. by updraughts due to subjacent convection (pileus effect) or by (local) cooling due to gravity waves (see Weigel et al., 2021). At CO mixing ratios below 70 nmol mol−1, the observed Nnm values rank at a few hundred per cubic centimetre but systematically below 1000 cm−3.
Based on NPF encountered during StratoClim, the air masses with low pollutant loads therefore still contain sufficient amounts of precursor material to supply intermediate NPF (100 cm−3 < Nnm < 1000 cm−3). This differs from earlier findings from ground-based measurements at high mountain sites (at about 5 km altitude) in the Himalaya region by Venzac et al. (2008) or at the Jungfraujoch station (∼ 3.5 km altitude) in the Swiss Alps by Bianchi et al. (2016), who attributed their frequent NPF observations to the advection of polluted air which rises up from the valleys towards the research stations. Williamson et al. (2019) found frequent NPF during measurements over the Atlantic and the Pacific, i.e. at a certain distance away from sources of industrial pollution. Like for StratoClim 2017, low levels of pollution here were sufficient to support NPF.
Between 27 July and 10 August 2017 the airborne StratoClim mission took place in Kathmandu, Nepal, comprising eight mission flights (∼ 22.5 h of COPAS measurement time above 10 km, θ ≳ 350 K) up to altitudes of 20 km (θ ≈ 475 K) with the Russian high-altitude research aircraft M-55 Geophysica. New particle formation in the presence of cloud ice particles was analysed as it was encountered in the UTLS region of the Asian monsoon anticyclone (AMA) over northern India, Nepal, and Bangladesh. Over the StratoClim observation period, in-cloud NPF was a frequently occurring phenomenon within the AMA associated with predominantly large convective cloud systems over the Himalayan foothills. Elevated concentrations of nucleation-mode particles (Nnm) generated by NPF were observed in hitherto unreported frequency together with ice particles (Nice > 0 cm−3) at altitudes between ∼ 11 km and 16.5 km (∼ 355–385 K) and mainly at ambient temperatures colder than ∼ 230 K. During StratoClim 2017, a total of 104 in-cloud NPF events were observed over a total duration of 1 h and 17 min (∼ 5 % of the total data set, ∼ 49 % of all observed NPF cases). Maximum concentrations of nucleation-mode particles of up to ∼ 11 000 cm−3 (≈ 50 000 mg−1) were detected coincidently with ice particles in concentrations Nice of 0.05–0.1 cm−3 (correspondent to 50–100 ice particles per litre) at heights of approximately 15.5 km (∼ 370 K).
The observations indicate the Nnm range of 500–3000 cm−3 as most frequently observed during in-cloud NPF. Weak events with low NPF rate occur most frequently in the presence of cloud ice, whilst the probability of instrumentally identifying such weak events decreases with Nnm. Coagulation additionally affects elevated Nnm at timescales of a few hours (see Weigel et al., 2021). Consequently, the supposedly preferred Nnm range results from superimposed effects, and it is a matter of probability and timing (delay between NPF event and observation) that the Nnm range of 500–3000 cm−3 is most frequently observed in the presence of cloud ice.
Analyses of the StratoClim data set concerning the relationship between interstitial aerosol and the abundance of cloud particles in the UTLS are consistent with the findings from earlier measurements (de Reus et al., 2009) and extended these by new observations under different conditions. When ice particles are abundant (Nice > 0.5 cm−3), total aerosol number concentrations (N10) remain generally between ∼ 200 and 700 cm−3. In agreement with earlier findings (de Reus et al., 2009), the ratio of ice particle number and the number of sub-micrometre-sized aerosols did not significantly rise above 300 sub-micrometre-sized aerosols per ice particle at low air temperatures (< 200 K). Intense NPF, generating nucleation-mode particles of several thousands per cubic centimetre, substantially decreases the ratio of number concentrations of ice particles to aerosols. However, such intense NPF was not observed at ratios larger than 1 : 3000, which indicates that the presence of cloud ice imposes limitations to NPF.
In-cloud NPF appears limited in the presence of predominantly liquid-origin ice particles with increased ice water content resulting from deep convection up to cold point tropopause levels. This is confirmed by coincidently measured CO content of the air sample: air's pollutant load and/or its recent surface contact do not determine the strength of in-cloud NPF. Otherwise, the most intensive NPF events should have been found more frequently in air masses with the highest CO content. When the cloud ice has formed in situ, at low CO mixing ratios, NPF was observed although with reduced strength. However, it is not yet conclusively clarified whether the direct convective supply of precursor material from pollution in the boundary layer is an essential prerequisite for the occurrence of NPF in the UTLS or whether NPF together with the ice cloud formation is initialised in processed and diluted air masses. The observations suggest that sufficient amounts of NPF precursor material accumulate at UTLS altitude, which is not necessarily connected to air's recent vertical uplift. It remains speculative, and the extent to which the vertically lifted ice particles themselves contribute as a carrier for soluble NPF precursor gases such as SO2, H2SO4, or others, e.g. if dissolved in the cloud elements' liquid phase at lower heights and released again at TTL altitudes after the cloud ice has sublimated, should be the subject of suitable numerical analyses. Comparatively slow processes as air mass transport from elsewhere or the chemical and/or photochemical conversion at elevated altitudes may suffice to supply the reservoir of NPF precursors at UTLS altitudes. NPF of the highest intensity, however, was observed at moderate CO mixing ratios. Intense NPF seems suppressed in strong convective updraughts (cf. Sect. 4.2) either because of the intense dynamics inherent to convection or because the precursor's saturation ratio of recently uplifted air does not suffice for NPF.
At the moment of observation, the age of the nucleation-mode aerosols (the delay between the NPF burst and the instrumental detection) as well as the aerosol's processing history is unknown. While the aerosol's persistence in the nucleation mode is limited, it is conceivable that the abundance of aerosols influences the local formation of ice particles or that ice particles are coated by nucleation-mode aerosol material due to coagulation. Above certain sizes, the cloud ice elements are increasingly subject to sedimentation. Upon sedimentation to warmer ambient temperatures, the ice particles sublimate. The remnants of sublimated cloud ice consist of materials attributed to the initially NPF-generated nucleation-mode aerosols. It remains speculative whether or not, in terms of physico-chemical characteristics, the released aerosol material is comparable with the primary NPF-generated aerosol. The sublimation of coated ice particles and the release of aerosol material at intermediate altitudes provide nuclei for cloud entrainment and/or for cloud formation. It remains unquantified whether NPF near the surface (see Venzac et al., 2008; Bianchi et al., 2016) or the NPF at UTLS altitudes contributes the most to the availability of cloud condensation nuclei (CCN), which are supposed to promote cloud formation (Andreae et al., 2018) at the cloud condensation levels. The specific source contributions to the abundance of available CCN are as variable as the chemical species that may be involved in the NPF process.
Ice particles in sufficient number and size are well capable of reducing the saturation ratio of an NPF precursor such as H2SO4. This implies two conclusions: (1) in-cloud NPF is limited by abundant ice particles, and (2) not only the number of ice particles limits the NPF occurrence but also the ice particles' size. The strength of in-cloud NPF depends on the integral radius IR (), which constitutes the control value of the ice particle's growth . Up to IR of ∼ 1 µm cm−3 the occurrence of NPF of any strength (with ∼ 100 < Nnm < 10 000 cm−3) seems independent of the presence of ice particles altogether. At larger IR (> 1 µm cm−3) the presence of ice particles limits the maximum of Nnm from NPF. This result refines earlier conclusions (Weigel et al., 2011), according to which mainly the number of ice particles would limit the occurrence of NPF.
During the herein discussed NPF events, the detected total number concentration of cloud elements never exceeded ∼ 2–3 cm−3. Thus, the number density of cloud elements was always at least 2 orders of magnitude smaller compared to detected aerosol number concentrations. At ambient air temperatures ranging from 187 to 235 K, the clouds entirely consisted of ice particles. In other studies, however, the discussions on NPF are restricted to measurements under cloud-free (clear-air) conditions as the cloud particles are suspected to possibly impact onto the aircraft's hull or the aerosol inlet, this way possibly generating artefacts on the aerosol measurements (Williamson et al., 2019, referring to Weber et al., 1998). Regarding the in-cloud NPF observations throughout StratoClim 2017, the following aspects are noteworthy:
-
At typical flight speeds of the M-55 Geophysica (154 ± 39 m s−1), sub-micrometre-sized particles are not subject to impaction on parts of the aircraft structure (nose, wing's leading edge, etc.) as the particles follow the airstream around such flow obstacles (Kulkarni et al., 2011). Furthermore, ice particles in the diameter size range of a few micrometres (i.e. 1 µm < dp < 10 µm) partially sublimate in the congestion region upstream of any aircraft structure (e.g. the wings leading edge or the aerosol inlet). The diffuser-type entry of the aerosol inlet leads to a flow deceleration inside the probe head accompanied by a sudden temperature increase (according to fluid dynamical simulations by up to 13 ∘C on flow deceleration from 170 to 60 m s−1; see Weigel et al., 2009, and references therein). Hence, if a single particle with 1 µm < dp < 10 µm randomly enters the COPAS aerosol inlet, rapid sublimation of such an ice particle can be expected to occur inside the aerosol inlet of COPAS. The entry of the sample air into the inlet's second diffuser additionally reduces the sampling of ice particle fragments. Due to additional heating of the air sample and during their passage through the aerosol line to the COPAS detector (less than about 0.5 s), the ice particles from shattering with diameters of a few micrometres evaporate even if they are present in large numbers.
-
The number concentration of ice particles with diameter dp > 10 µm mostly remained below 0.4 cm−3 when coincidently detected with NPF. On impact and shattering of a single ice particle of such a size, the number of generated fragments is estimated to range between about 10 and 100 cm−3 (Korolev et al., 2013). Hence, to substantially affect the detected number concentration of nucleation-mode particles (on the scale of hundreds to up to 10 000 per cubic centimetre), the number of ice particles emanating from shattering appears too low.
-
The probability that ice particles hit the sharp-edged tips of the COPAS aerosol inlet (Weigel et al., 2009) appears negligibly small. The impaction surface provided by the COPAS aerosol inlet is mainly the inlet's ring-shaped entry with an opening diameter of ∼ 7.3 mm and a wall thickness of ∼ 100 µm. In the unlikely case that a single ice particle impact occurred, all generated fragments were required to endure the temperature rise within the inlet head (cf. first argument of this list) and the transport through the aerosol lines towards the COPAS detectors before they can cause any effect on the measurement.
An effect of shattered large ice particles on the detection of nucleation-mode particles is ultimately not excludable. However, despite the reference by Williamson et al. (2019) in this context, ice particle fragmentation was not described by Weber et al. (1998). The same authors discuss the influence on NPF detections due to fragmentation of super-cooled liquid-water cloud droplets and suggest a careful discussion in such cases. In general, such an influence due to the fragmentation of ice particles was largely ruled out or estimated as much lower than that of liquid droplets (Weber et al., 1998). Concerning the analyses discussed herein, however, it seems a statistical exception that ice particle fragments emanating from shattered ice particles crucially affect the measurement of the numbers of nucleation-mode particles. Moreover, if the NPF detections were systematically affected by the presence of cloud ice, the observed quantities of nucleation-mode particles would feature systematic and larger differences during in-cloud measurements compared to clear-air observations. None of the described artefacts were observable in the data from StratoClim 2017.
Calculations were made regarding the timescales on which the decrease in the supersaturation of H2SO4 vapour occurs in the presence of coated ice particles. In the closest vicinity of an ice particle, the condensational loss of a precursor gas like sulfuric acid (H2SO4) predominates over the NPF process. The molecules' mobility and the condensation efficiency of the H2SO4 molecules are mainly determined by their diffusivity under the given atmospheric conditions. The diffusivity of H2SO4 is about a factor of 0.2–0.5 of the diffusivity of water vapour (Tang et al., 2014).
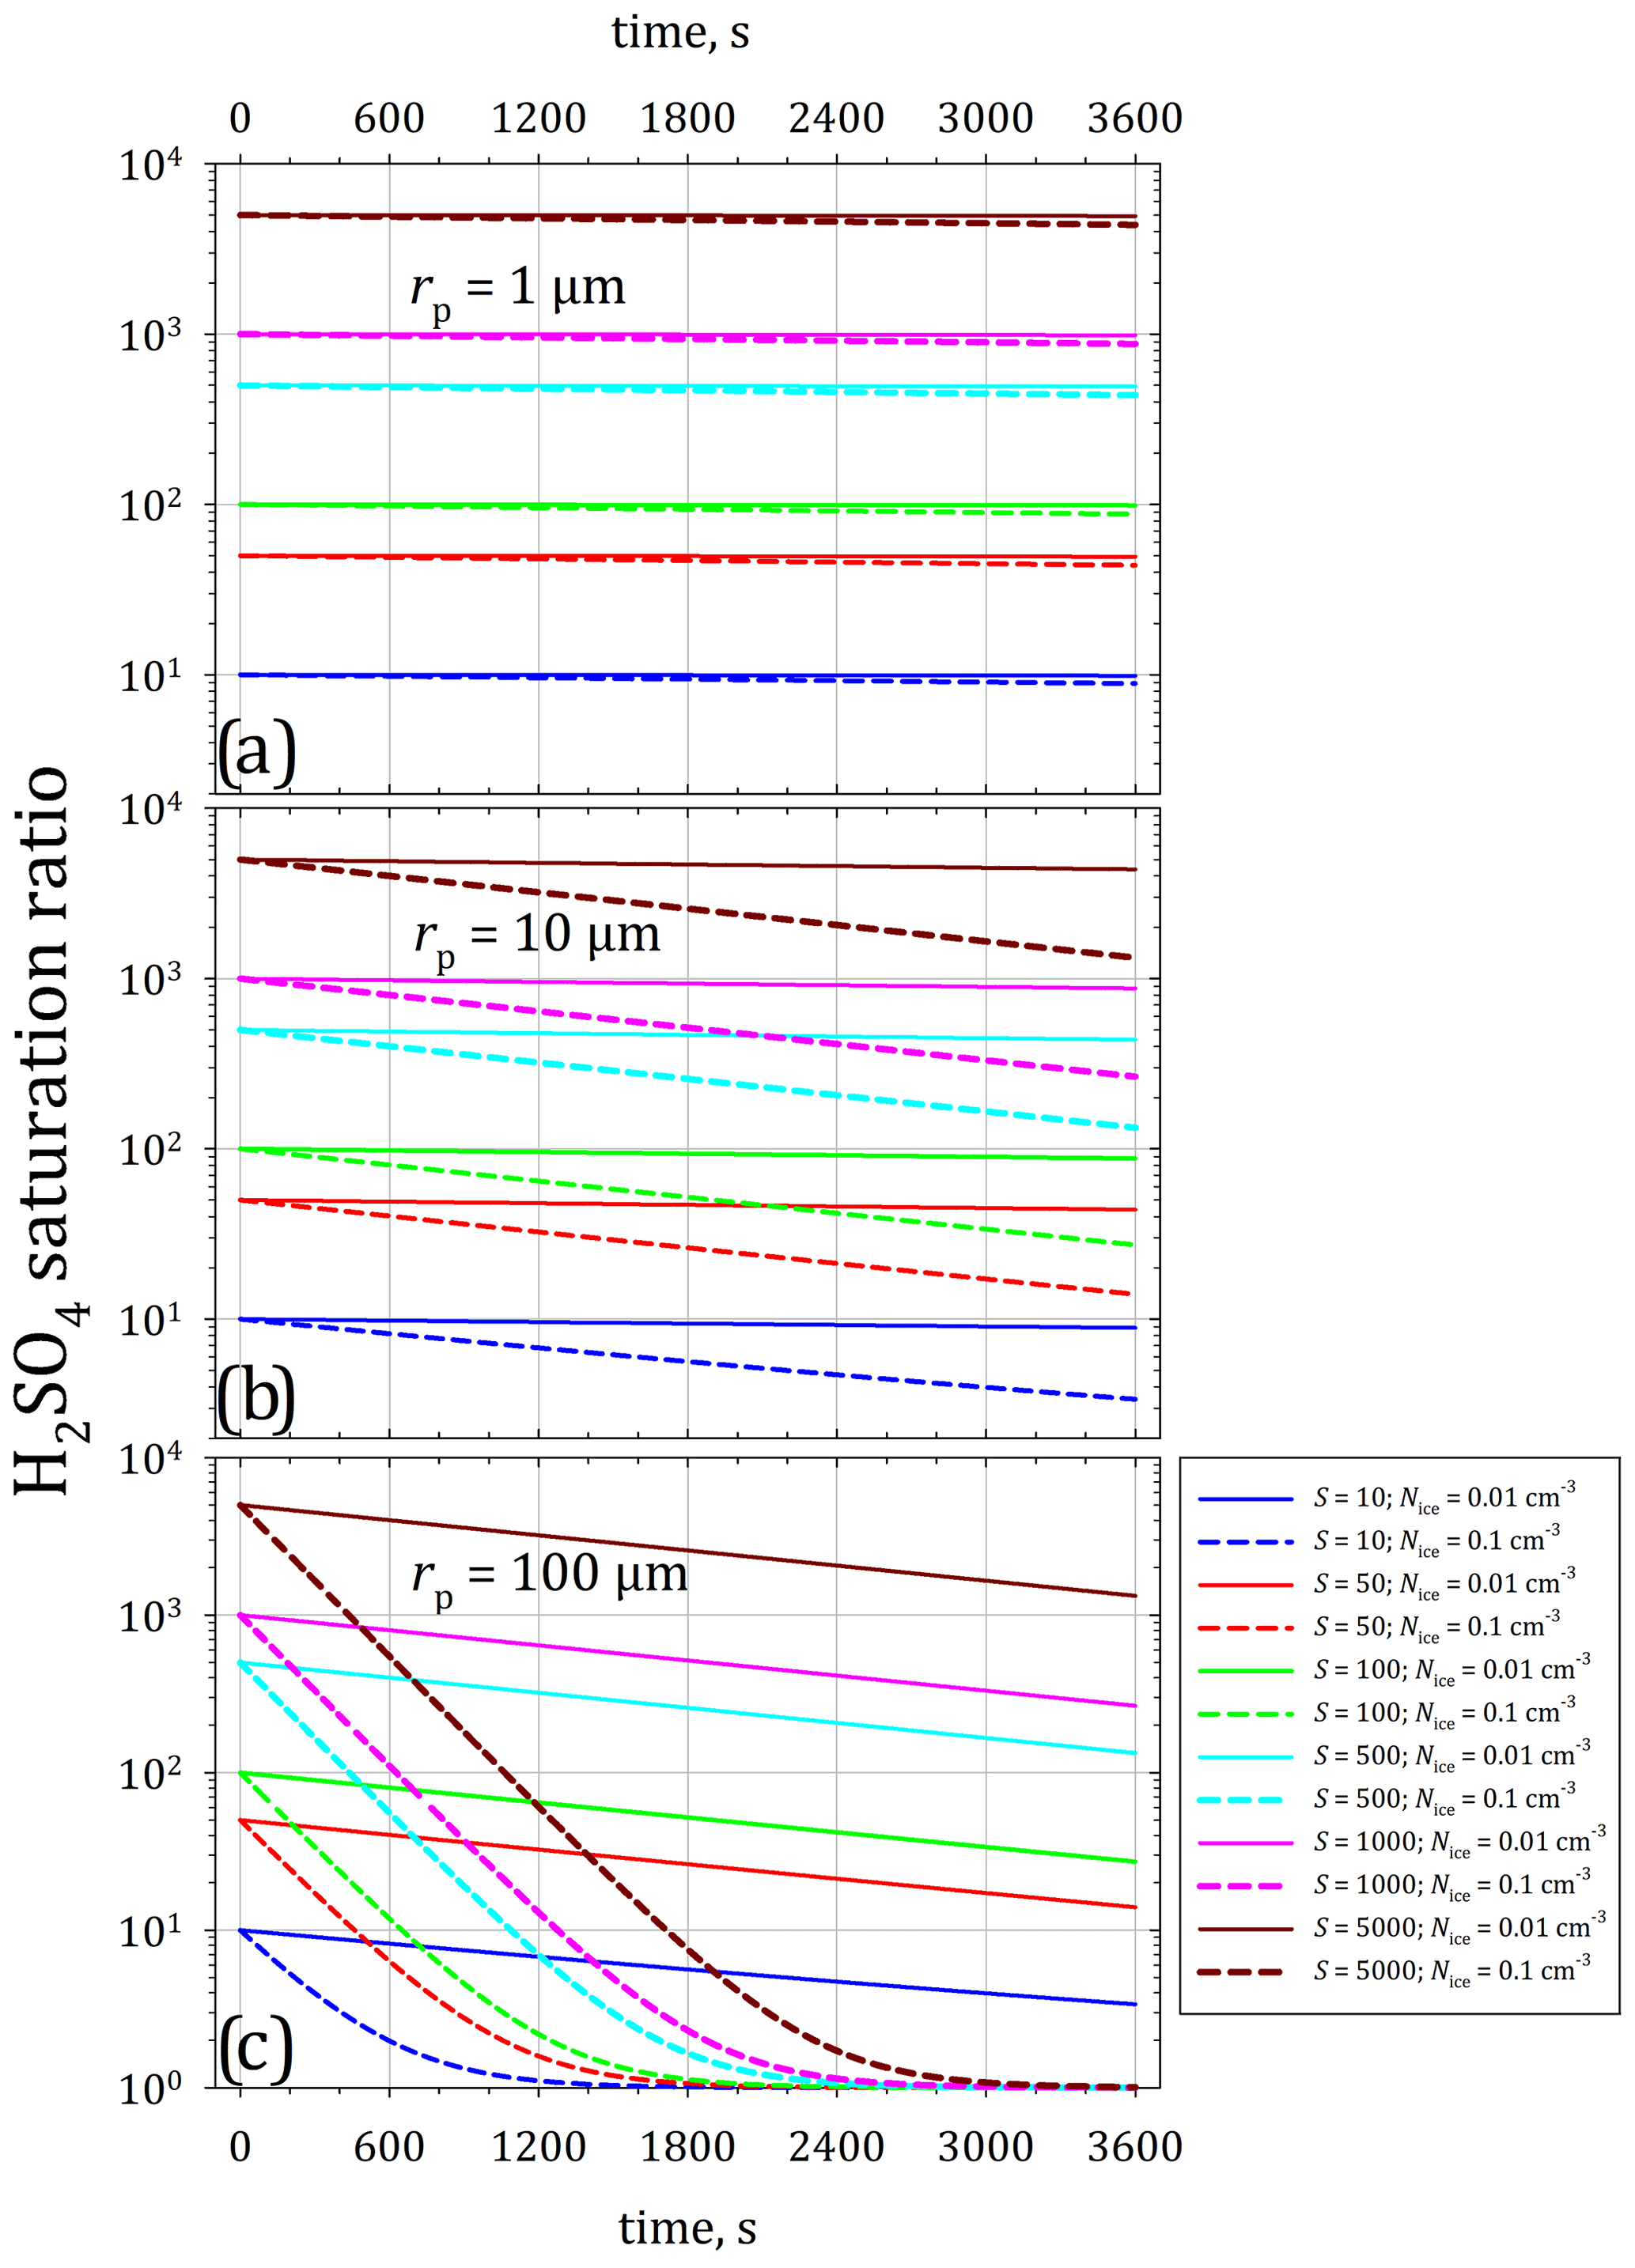
Figure B1Simulated change in the H2SO4 vapour's saturation ratio as a function of time due to the presence of entirely H2SO4-coated ice particle surfaces of various sizes and number concentrations. (a) Particles with radii rp = 1 µm, (b) rp = 10 µm, (c) rp = 100 µm. Overall, this simulation covers a range of integral radii IR () from 0.01 to 10 µm cm−3. Note: a cloud (ice) particle is assumed as coated with H2SO4 (consistent with Bogdan et al., 2006, 2013).
Presuming that the ice particles are coated with H2SO4 (Bogdan et al., 2006, 2013), model simulations were performed to investigate the timescales on which the coated ice particles reduce various H2SO4 saturation ratios. The simulation results (shown in Fig. B1) are based on constant ambient temperature (T ≈ 200 K) and pressure (p = 110 hPa) conditions. For the same temperature conditions, the saturation vapour pressure psat of H2SO4 is calculated according to Vehkamäki et al. (2002). In this way, the degree of supersaturation is deducible from the H2SO4 molecules' concentrations reported for the CLOUD (Cosmics Leaving OUtdoor Droplets) chamber experiments (see Kürten, 2019, and references therein). According to this study and in agreement with other references (Hamish Gordon, School of Earth and Environment, Leeds University, UK, personal communication, October 2019), molecule concentrations of 106–107 cm−3 are required in the CLOUD chamber at temperatures of 208 K to induce NPF with nucleation rates of 10−2–100 cm−3 s−1 (read-out from Fig. 4 in Kürten, 2019, from experiments at relative humidity of 38 %). Keeping possible wall effects of the laboratory experiments in mind, for the occurrence of NPF under real atmospheric conditions, the lower bound of required molecule concentrations (106 cm−3) may suffice, with an uncertainty of a factor of 5 (Hamish Gordon, School of Earth and Environment, Leeds University, UK, personal communication, October 2019). At an ambient temperature of 208 K, the molecule concentrations of 106–107 H2SO4 cm−3 (Kürten, 2019) correspond to saturation ratios of about S ≈ 10–100. The following analysis, however, comprises a much wider range of saturation ratios between 10 and up to 5000 to account for a higher sensitivity of the temperature dependency of S.
Based on the expression formulated by Tsagkogeorgas et al. (2017) with the saturation vapour pressure psat of H2SO4 (above a flat surface) and with an accommodation coefficient of α = 0.65 (Pöschl et al., 1998), the change in the fully coated ice crystal with mass m per time unit is calculated by
which conceptually represents the change in mass (size) of the particles onto which the H2SO4 condenses and which is also consistent with the finding that cirrus cloud elements are coated with an H2SO4–H2O layer (Bogdan et al., 2006, 2013). The diffusivity of H2SO4 molecules in air is denoted with D, and K refers to the thermal conductivity of air, while R and Ra are the gas constants of H2SO4 and the air, respectively. Since the ice particles grow predominantly by the uptake of water vapour, the effective contribution to by the condensing H2SO4 is of minor concern. The from the condensing H2SO4 converts instead to a reduction in the saturation ratio of gaseous H2SO4, the change in which is
with the latent heat of vaporisation assumed as constant:
and Nice constitutes the number density of ice particles. Here, the sulfuric acid's molar mass is = 0.098078 kg mol−1. Note that the combination of the Eqs. (B2) and (B1) implies that ; i.e. the temporal change in the precursor's saturation ratio is proportional to the integral radius IR considered in Sect. 5.2.
In Fig. B1 the variability of two aspects is considered, and in the panels (a)–(c) it is distinguished between three ice particle radii (1, 10, and 100 µm) and two different ice particle number concentrations (0.01 and 0.1 cm−3). The study by Ueyama et al. (2020) revealed that ice particles (effective radii of about 15 µm) persist over 12 to 20 h at convective outflow levels between 365 and 370 K potential temperature in the AMA of the 2017 season.
Based on the simulation, the largest particles (rp = 100 µm) are capable of efficiently suppressing NPF. Particles of this size and in the highest concentrations of 0.1 cm−3 cause the saturation ratio to abate to saturation level (i.e. S = 1) within 20–50 min. At lower concentrations (0.01 cm−3) of particles of 100 µm radius, the saturation ratio is reduced by more than 70 % within 1 h. Particles of 10 µm radius and in concentrations of 0.1 cm−3 are almost equally efficient in reducing the saturation ratio by ∼ 70 % within 1 h. Smaller number concentrations of the same particle size range and smaller particles (rp = 1 µm) require considerably more time than 1 h to reduce the H2SO4 saturation ratio.
In essence, cloud ice particles can rapidly reduce the saturation ratio of H2SO4 as well as that of other condensable gases. The ranges of Nice (0.01–0.1 cm−3) and particle size (1 µm < rp < 100 µm) considered in the simulation correspond to the characteristics of ice particles coincidently observed with NPF throughout the StratoClim 2017 mission (note that away from NPF, higher Nice and larger were found; cf. Krämer et al., 2020). About 71 % of all ice cloud detections in coincidence with NPF had an IR (i.e. ) of less than 1 µm cm−3, while only about 1.5 % of the ice particle samples reached IR values greater than 7.5 µm cm−3; the maximum IR of 24 µm cm−3 was encountered once throughout the entire mission. In general, the cirrus cloud particles are expected as coated with an H2SO4–H2O layer (Bogdan et al., 2006, 2013), onto which sulfuric acid can condense. Impurities by weaker and substitutable acids (such as organic acids or HCl or HNO3) also allow the H2SO4 uptake on the surface, which could reduce the gaseous H2SO4 concentration, thereby suppressing NPF. Hence, in a certain abundance the presence of cloud ice particles restrains the NPF process when condensation prevails over the competing gas-to-particle conversion. The efficiency of condensation onto the ice particles' surface depends on
-
the size and number concentration of cloud ice particles
-
on the time interval during which the conditions remain at least saturated.
For the condensation of H2SO4, a partial coating of the ice particles' surface with sulfuric acid (or organic acids, HCl, or HNO3) suffices to supply the gaseous H2SO4 with the required attachment points. To simplify the numerical simulation of the saturation decay, an ice particle is assumed as entirely coated (consistent with Bogdan et al., 2006, 2013), and the (real) ice particle's habit (e.g. asphericity, porosity, etc.) remains unconsidered. Sporadic updraughts due to convective lifting well below the NPF level or gravity waves cause small-scaled expansion and cooling, which increases the precursor's supersaturation (Weigel et al., 2021). Certain concentrations of H2SO4 molecules exceed the supersaturation threshold for NPF, even in the presence of abundant cloud ice as long as the NPF process occurs faster than the reduction in S due to the present ice.
The data shown in this study will be available from the HALO database at https://halo-db.pa.op.dlr.de/mission/101 (last access: 6 September 2021; German Aerospace Center, 2021), or they may be provided by the respective PI upon request.
RW evaluated and analysed the data, created the figures, and drafted the manuscript with contributions by CM, MB, MK, HT, and PS. SB participated in the data analyses and the manuscript drafting. Numerical simulations concerning the impact of ice particles on the saturation ratio of H2SO4 were performed by MB with contributions by HT. MK, NS, AA, and CR contributed with cloud microphysical and water vapour data. SV and FD'A provided the CO data. The manuscript was critically reviewed by CM, MB, MK, PS, NS, AA, CR, SV, FD'A, HT, and SB.
The authors declare that they have no conflict of interest.
Publisher's note: Copernicus Publications remains neutral with regard to jurisdictional claims in published maps and institutional affiliations.
This article is part of the special issue “StratoClim stratospheric and upper tropospheric processes for better climate predictions (ACP/AMT inter-journal SI)”. It is not associated with a conference.
The contributions from the workshops of the Max Planck Institute for Chemistry and of the Institute for Physics of the Atmosphere (Johannes Gutenberg University Mainz) were essential for this work. In particular, we acknowledge support of Thomas Böttger, Michael Flanz, Christian von Glahn, Harald Rott, and Wilhelm A. Schneider. Also acknowledged are the comprehensive and helpful discussions with Miklós Szakáll. We very much thank the crew of MDB (Myasishchev Design Bureau) and the M-55 Geophysica pilots. The extraordinary commitment of Fred Stroh in the realisation of the campaign and the leadership of the entire StratoClim project by Markus Rex are gratefully acknowledged. We explicitly thank the officials of the Nepalese government authorities, research institutions, and Tribhuvan Airport as well as of the German Embassy for their extraordinary support and hospitality, which enabled our field campaign and research.
Some of our research leading to the presented results received funding from the European Research Council under the European Union's Seventh Framework Programme (FP/2007-2013) ERC grant agreement no. 321040 (EXCATRO). The StratoClim project was funded by the EU (FP7/2007–2018 grant no. 603557) and also supported by the German “Bundesministerium für Bildung und Forschung” (BMBF) under the joint ROMIC project SPITFIRE (01LG1205A). Manuel Baumgartner was supported by the DFG within the Transregional Collaborative Research CentreTRR165 “Waves to Weather”, Project Z2. Peter Spichtinger was supported by the DFG within the research unit Multiscale Dynamics of Gravity Waves (MS-GWaves) through grant SP 1163/5-2. Holger Tost received funding from the Carl Zeiss Foundation.
This paper was edited by Rob MacKenzie and reviewed by two anonymous referees.
Afchine, A., Rolf, C., Costa, A., Spelten, N., Riese, M., Buchholz, B., Ebert, V., Heller, R., Kaufmann, S., Minikin, A., Voigt, C., Zöger, M., Smith, J., Lawson, P., Lykov, A., Khaykin, S., and Krämer, M.: Ice particle sampling from aircraft – influence of the probing position on the ice water content, Atmos. Meas. Tech., 11, 4015–4031, https://doi.org/10.5194/amt-11-4015-2018, 2018.
Andreae, M. O., Afchine, A., Albrecht, R., Holanda, B. A., Artaxo, P., Barbosa, H. M. J., Borrmann, S., Cecchini, M. A., Costa, A., Dollner, M., Fütterer, D., Järvinen, E., Jurkat, T., Klimach, T., Konemann, T., Knote, C., Krämer, M., Krisna, T., Machado, L. A. T., Mertes, S., Minikin, A., Pöhlker, C., Pöhlker, M. L., Pöschl, U., Rosenfeld, D., Sauer, D., Schlager, H., Schnaiter, M., Schneider, J., Schulz, C., Spanu, A., Sperling, V. B., Voigt, C., Walser, A., Wang, J., Weinzierl, B., Wendisch, M., and Ziereis, H.: Aerosol characteristics and particle production in the upper troposphere over the Amazon Basin, Atmos. Chem. Phys., 18, 921–961, https://doi.org/10.5194/acp-18-921-2018, 2018.
Ball, S. M., Hanson, D. R., Eisele, F. L., and McMurry, P. H.: Laboratory studies of particle nucleation: Initial results for H2SO4, H2O, and NH3 vapors, J. Geophys. Res.-Atmos., 104, 23709–23718, https://doi.org/10.1029/1999jd900411, 1999.
Baumgartner, M. and Spichtinger, P.: Towards a bulk approach to local interactions of hydrometeors, Atmos. Chem. Phys., 18, 2525–2546, https://doi.org/10.5194/acp-18-2525-2018, 2018.
Baumgartner, M., Weigel, R., Harvey, A. H., Plöger, F., Achatz, U., and Spichtinger, P.: Reappraising the appropriate calculation of a common meteorological quantity: potential temperature, Atmos. Chem. Phys., 20, 15585–15616, https://doi.org/10.5194/acp-20-15585-2020, 2020.
Benson, D. R., Erupe, M. E., and Lee, S. H.: Laboratory-measured H2SO4-H2O-NH3 ternary homogeneous nucleation rates: Initial observations, Geophys. Res. Lett., 36, L15818, https://doi.org/10.1029/2009gl038728, 2009.
Bianchi, F., Tröstl, J., Junninen, H., Frege, C., Henne, S., Hoyle, C. R., Molteni, U., Herrmann, E., Adamov, A., Bukowiecki, N., Chen, X., Duplissy, J., Gysel, M., Hutterli, M., Kangasluoma, J., Kontkanen, J., Kürten, A., Manninen, H. E., Münch, S., Peräkylä, O., Petäjä, T., Rondo, L., Williamson, C., Weingartner, E., Curtius, J., Worsnop, D. R., Kulmala, M., Dommen, J., and Baltensperger, U.: New particle formation in the free troposphere: A question of chemistry and timing, Science, 352, 1109–1112, https://doi.org/10.1126/science.aad5456, 2016.
Bogdan, A., Molina, M. J., Sassen, K., and Kulmala, M.: Formation of low-temperature cirrus from H2SO4/H2O aerosol droplets, J. Phys. Chem. A, 110, 12541–12542, https://doi.org/10.1021/jp065898e, 2006.
Bogdan, A., Molina, M. J., Kulmala, M., Tenhu, H., and Loerting, T.: Solution coating around ice particles of incipient cirrus clouds, P. Natl. Acad. Sci. USA, 110, E2439–E2439, https://doi.org/10.1073/pnas.1304471110, 2013.
Borrmann, S., Kunkel, D., Weigel, R., Minikin, A., Deshler, T., Wilson, J. C., Curtius, J., Volk, C. M., Homan, C. D., Ulanovsky, A., Ravegnani, F., Viciani, S., Shur, G. N., Belyaev, G. V., Law, K. S., and Cairo, F.: Aerosols in the tropical and subtropical UT/LS: in-situ measurements of submicron particle abundance and volatility, Atmos. Chem. Phys., 10, 5573–5592, https://doi.org/10.5194/acp-10-5573-2010, 2010.
Bucci, S., Legras, B., Sellitto, P., D'Amato, F., Viciani, S., Montori, A., Chiarugi, A., Ravegnani, F., Ulanovsky, A., Cairo, F., and Stroh, F.: Deep-convective influence on the upper troposphere–lower stratosphere composition in the Asian monsoon anticyclone region: 2017 StratoClim campaign results, Atmos. Chem. Phys., 20, 12193–12210, https://doi.org/10.5194/acp-20-12193-2020, 2020.
Clarke, A. D. and Kapustin, V. N.: A pacific aerosol survey. Part I: A decade of data on particle production, transport, evolution, and mixing in the troposphere, J. Atmos. Sci., 59, 363–382, https://doi.org/10.1175/1520-0469(2002)059<0363:Apaspi>2.0.Co;2, 2002.
Clerbaux, C., George, M., Turquety, S., Walker, K. A., Barret, B., Bernath, P., Boone, C., Borsdorff, T., Cammas, J. P., Catoire, V., Coffey, M., Coheur, P.-F., Deeter, M., De Mazière, M., Drummond, J., Duchatelet, P., Dupuy, E., de Zafra, R., Eddounia, F., Edwards, D. P., Emmons, L., Funke, B., Gille, J., Griffith, D. W. T., Hannigan, J., Hase, F., Höpfner, M., Jones, N., Kagawa, A., Kasai, Y., Kramer, I., Le Flochmoën, E., Livesey, N. J., López-Puertas, M., Luo, M., Mahieu, E., Murtagh, D., Nédélec, P., Pazmino, A., Pumphrey, H., Ricaud, P., Rinsland, C. P., Robert, C., Schneider, M., Senten, C., Stiller, G., Strandberg, A., Strong, K., Sussmann, R., Thouret, V., Urban, J., and Wiacek, A.: CO measurements from the ACE-FTS satellite instrument: data analysis and validation using ground-based, airborne and spaceborne observations, Atmos. Chem. Phys., 8, 2569–2594, https://doi.org/10.5194/acp-8-2569-2008, 2008.
Costa, A., Meyer, J., Afchine, A., Luebke, A., Günther, G., Dorsey, J. R., Gallagher, M. W., Ehrlich, A., Wendisch, M., Baumgardner, D., Wex, H., and Krämer, M.: Classification of Arctic, midlatitude and tropical clouds in the mixed-phase temperature regime, Atmos. Chem. Phys., 17, 12219–12238, https://doi.org/10.5194/acp-17-12219-2017, 2017.
Curtius, J., Weigel, R., Vössing, H.-J., Wernli, H., Werner, A., Volk, C.-M., Konopka, P., Krebsbach, M., Schiller, C., Roiger, A., Schlager, H., Dreiling, V., and Borrmann, S.: Observations of meteoric material and implications for aerosol nucleation in the winter Arctic lower stratosphere derived from in situ particle measurements, Atmos. Chem. Phys., 5, 3053–3069, https://doi.org/10.5194/acp-5-3053-2005, 2005.
Davis, S., Hlavka, D. L., Jensen, E. J., Rosenlof, K., Yang, Q., Schmidt, S., Borrmann, S., Frey, W., Lawson, P., Voemel, H., and Bui, T. P.: In situ and lidar observations of tropopause subvisible cirrus clouds during TC4, J. Geophys. Res.-Atmos., 115, D00J17, https://doi.org/10.1029/2009jd013093, 2010.
de Reus, M., Krejci, R., Williams, J., Fischer, H., Scheele, R., and Strom, J.: Vertical and horizontal distributions of the aerosol number concentration and size distribution over the northern Indian Ocean, J. Geophys. Res.-Atmos., 106, 28629–28641, https://doi.org/10.1029/2001jd900017, 2001.
de Reus, M., Borrmann, S., Bansemer, A., Heymsfield, A. J., Weigel, R., Schiller, C., Mitev, V., Frey, W., Kunkel, D., Kürten, A., Curtius, J., Sitnikov, N. M., Ulanovsky, A., and Ravegnani, F.: Evidence for ice particles in the tropical stratosphere from in-situ measurements, Atmos. Chem. Phys., 9, 6775–6792, https://doi.org/10.5194/acp-9-6775-2009, 2009.
Dunne, E. M., Gordon, H., Kürten, A., Almeida, J., Duplissy, J., Williamson, C., Ortega, I. K., Pringle, K. J., Adamov, A., Baltensperger, U., Barmet, P., Benduhn, F., Bianchi, F., Breitenlechner, M., Clarke, A., Curtius, J., Dommen, J., Donahue, N. M., Ehrhart, S., Flagan, R. C., Franchin, A., Guida, R., Hakala, J., Hansel, A., Heinritzi, M., Jokinen, T., Kangasluoma, J., Kirkby, J., Kulmala, M., Kupc, A., Lawler, M. J., Lehtipalo, K., Makhmutov, V., Mann, G., Mathot, S., Merikanto, J., Miettinen, P., Nenes, A., Onnela, A., Rap, A., Reddington, C. L. S., Riccobono, F., Richards, N. A. D., Rissanen, M. P., Rondo, L., Sarnela, N., Schobesberger, S., Sengupta, K., Simon, M., Sipilä, M., Smith, J. N., Stozkhov, Y., Tomé, A., Tröstl, J., Wagner, P. E., Wimmer, D., Winkler, P. M., Worsnop, D. R., and Carslaw, K. S.: Global atmospheric particle formation from CERN CLOUD measurements, Science, 354, 1119–1124, https://doi.org/10.1126/science.aaf2649, 2016.
Duplissy, J., Merikanto, J., Franchin, A., Tsagkogeorgas, G., Kangasluoma, J., Wimmer, D., Vuollekoski, H., Schobesberger, S., Lehtipalo, K., Flagan, R. C., Brus, D., Donahue, N. M., Vehkamaki, H., Almeida, J., Amorim, A., Barmet, P., Bianchi, F., Breitenlechner, M., Dunne, E. M., Guida, R., Henschel, H., Junninen, H., Kirkby, J., Kurten, A., Kupc, A., Maattanen, A., Makhmutov, V., Mathot, S., Nieminen, T., Onnela, A., Praplan, A. P., Riccobono, F., Rondo, L., Steiner, G., Tome, A., Walther, H., Baltensperger, U., Carslaw, K. S., Dommen, J., Hansel, A., Petaja, T., Sipila, M., Stratmann, F., Vrtala, A., Wagner, P. E., Worsnop, D. R., Curtius, J., and Kulmala, M.: Effect of ions on sulfuric acid-water binary particle formation: 2. Experimental data and comparison with QC-normalized classical nucleation theory, J. Geophys. Res.-Atmos., 121, 1752–1775, https://doi.org/10.1002/2015jd023539, 2016.
Frey, W., Borrmann, S., Kunkel, D., Weigel, R., de Reus, M., Schlager, H., Roiger, A., Voigt, C., Hoor, P., Curtius, J., Krämer, M., Schiller, C., Volk, C. M., Homan, C. D., Fierli, F., Di Donfrancesco, G., Ulanovsky, A., Ravegnani, F., Sitnikov, N. M., Viciani, S., D'Amato, F., Shur, G. N., Belyaev, G. V., Law, K. S., and Cairo, F.: In situ measurements of tropical cloud properties in the West African Monsoon: upper tropospheric ice clouds, Mesoscale Convective System outflow, and subvisual cirrus, Atmos. Chem. Phys., 11, 5569–5590, https://doi.org/10.5194/acp-11-5569-2011, 2011.
German Aerospace Center: HALO database, available at: https://halo-db.pa.op.dlr.de/mission/101, last access: 6 September 2021.
Gordon, H., Kirkby, J., Baltensperger, U., Bianchi, F., Breitenlechner, M., Curtius, J., Dias, A., Dommen, J., Donahue, N. M., Dunne, E. M., Duplissy, J., Ehrhart, S., Flagan, R. C., Frege, C., Fuchs, C., Hansel, A., Hoyle, C. R., Kulmala, M., Kürten, A., Lehtipalo, K., Makhmutov, V., Molteni, U., Rissanen, M. P., Stozkhov, Y., Tröstl, J., Tsagkogeorgas, G., Wagner, R., Williamson, C., Wimmer, D., Winkler, P. M., Yan, C., and Carslaw, K. S.: Causes and importance of new particle formation in the present-day and preindustrial atmospheres, J. Geophys. Res.-Atmos., 122, 8739–8760, https://doi.org/10.1002/2017jd026844, 2017.
He, Q., Ma, J., Zheng, X., Yan, X., Vömel, H., Wienhold, F. G., Gao, W., Liu, D., Shi, G., and Cheng, T.: Observational evidence of particle hygroscopic growth in the upper troposphere–lower stratosphere (UTLS) over the Tibetan Plateau, Atmos. Chem. Phys., 19, 8399–8406, https://doi.org/10.5194/acp-19-8399-2019, 2019.
Höpfner, M., Ungermann, J., Borrmann, S., Wagner, R., Spang, R., Riese, M., Stiller, G., Appel, O., Batenburg, A. M., Bucci, S., Cairo, F., Dragoneas, A., Friedl-Vallon, F., Hünig, A., Johansson, S., Krasauskas, L., Legras, B., Leisner, T., Mahnke, C., Möhler, O., Molleker, S., Müller, R., Neubert, T., Orphal, J., Preusse, P., Rex, M., Saathoff, H., Stroh, F., Weigel, R., and Wohltmann, I.: Ammonium nitrate particles formed in upper troposphere from ground ammonia sources during Asian monsoons, Nat. Geosci., 12, 608–612, https://doi.org/10.1038/s41561-019-0385-8, 2019.
Kärcher, B. and Lohmann, U.: A parameterization of cirrus cloud formation: Homogeneous freezing of supercooled aerosols, J. Geophys. Res.-Atmos., 107, 4010, https://doi.org/10.1029/2001jd000470, 2002.
Kazil, J., Lovejoy, E. R., Jensen, E. J., and Hanson, D. R.: Is aerosol formation in cirrus clouds possible?, Atmos. Chem. Phys., 7, 1407–1413, https://doi.org/10.5194/acp-7-1407-2007, 2007.
Kazil, J., Harrison, R. G., and Lovejoy, E. R.: Tropospheric new particle formation and the role of ions, Space Sci. Rev., 137, 241–255, https://doi.org/10.1007/s11214-008-9388-2, 2008.
Kerminen, V.-M., Petäjä, T., Manninen, H. E., Paasonen, P., Nieminen, T., Sipilä, M., Junninen, H., Ehn, M., Gagné, S., Laakso, L., Riipinen, I., Vehkamäki, H., Kurten, T., Ortega, I. K., Dal Maso, M., Brus, D., Hyvärinen, A., Lihavainen, H., Leppä, J., Lehtinen, K. E. J., Mirme, A., Mirme, S., Hõrrak, U., Berndt, T., Stratmann, F., Birmili, W., Wiedensohler, A., Metzger, A., Dommen, J., Baltensperger, U., Kiendler-Scharr, A., Mentel, T. F., Wildt, J., Winkler, P. M., Wagner, P. E., Petzold, A., Minikin, A., Plass-Dülmer, C., Pöschl, U., Laaksonen, A., and Kulmala, M.: Atmospheric nucleation: highlights of the EUCAARI project and future directions, Atmos. Chem. Phys., 10, 10829–10848, https://doi.org/10.5194/acp-10-10829-2010, 2010.
Kerminen, V. M., Chen, X. M., Vakkari, V., Petäjä, T., Kulmala, M., and Bianchi, F.: Atmospheric new particle formation and growth: review of field observations, Environ. Res. Lett., 13, 103003, https://doi.org/10.1088/1748-9326/Aadf3c, 2018.
Kirkby, J., Curtius, J., Almeida, J., Dunne, E., Duplissy, J., Ehrhart, S., Franchin, A., Gagne, S., Ickes, L., Kurten, A., Kupc, A., Metzger, A., Riccobono, F., Rondo, L., Schobesberger, S., Tsagkogeorgas, G., Wimmer, D., Amorim, A., Bianchi, F., Breitenlechner, M., David, A., Dommen, J., Downard, A., Ehn, M., Flagan, R. C., Haider, S., Hansel, A., Hauser, D., Jud, W., Junninen, H., Kreissl, F., Kvashin, A., Laaksonen, A., Lehtipalo, K., Lima, J., Lovejoy, E. R., Makhmutov, V., Mathot, S., Mikkila, J., Minginette, P., Mogo, S., Nieminen, T., Onnela, A., Pereira, P., Petaja, T., Schnitzhofer, R., Seinfeld, J. H., Sipila, M., Stozhkov, Y., Stratmann, F., Tome, A., Vanhanen, J., Viisanen, Y., Vrtala, A., Wagner, P. E., Walther, H., Weingartner, E., Wex, H., Winkler, P. M., Carslaw, K. S., Worsnop, D. R., Baltensperger, U., and Kulmala, M.: Role of sulphuric acid, ammonia and galactic cosmic rays in atmospheric aerosol nucleation, Nature, 476, 429–433, https://doi.org/10.1038/nature10343, 2011.
Koop, T., Luo, B. P., Tsias, A., and Peter, T.: Water activity as the determinant for homogeneous ice nucleation in aqueous solutions, Nature, 406, 611–614, https://doi.org/10.1038/35020537, 2000.
Korolev, A., Emery, E., and Creelman, K.: Modification and tests of particle probe tips to mitigate effects of ice shattering, J. Atmos. Ocean. Tech., 30, 690–708, https://doi.org/10.1175/JTECH-D-12-00142.1, 2013.
Korolev, A. V. and Mazin, I. P.: Supersaturation of Water Vapor in Clouds, J. Atmos. Sci., 60, 2957–2974, https://doi.org/10.1175/1520-0469(2003)060<2957:SOWVIC>2.0.CO;2, 2003.
Krämer, M., Schiller, C., Afchine, A., Bauer, R., Gensch, I., Mangold, A., Schlicht, S., Spelten, N., Sitnikov, N., Borrmann, S., de Reus, M., and Spichtinger, P.: Ice supersaturations and cirrus cloud crystal numbers, Atmos. Chem. Phys., 9, 3505–3522, https://doi.org/10.5194/acp-9-3505-2009, 2009.
Krämer, M., Rolf, C., Luebke, A., Afchine, A., Spelten, N., Costa, A., Meyer, J., Zöger, M., Smith, J., Herman, R. L., Buchholz, B., Ebert, V., Baumgardner, D., Borrmann, S., Klingebiel, M., and Avallone, L.: A microphysics guide to cirrus clouds – Part 1: Cirrus types, Atmos. Chem. Phys., 16, 3463–3483, https://doi.org/10.5194/acp-16-3463-2016, 2016.
Krämer, M., Rolf, C., Spelten, N., Afchine, A., Fahey, D., Jensen, E., Khaykin, S., Kuhn, T., Lawson, P., Lykov, A., Pan, L. L., Riese, M., Rollins, A., Stroh, F., Thornberry, T., Wolf, V., Woods, S., Spichtinger, P., Quaas, J., and Sourdeval, O.: A microphysics guide to cirrus – Part 2: Climatologies of clouds and humidity from observations, Atmos. Chem. Phys., 20, 12569–12608, https://doi.org/10.5194/acp-20-12569-2020, 2020.
Kübbeler, M., Hildebrandt, M., Meyer, J., Schiller, C., Hamburger, Th., Jurkat, T., Minikin, A., Petzold, A., Rautenhaus, M., Schlager, H., Schumann, U., Voigt, C., Spichtinger, P., Gayet, J.-F., Gourbeyre, C., and Krämer, M.: Thin and subvisible cirrus and contrails in a subsaturated environment, Atmos. Chem. Phys., 11, 5853–5865, https://doi.org/10.5194/acp-11-5853-2011, 2011.
Kulkarni, P., Baron, P. A., and Willeke, K.: Aerosol measurement: principles, techniques, and applications, John Wiley & Sons, Hoboken, New Jersey, USA, 2011.
Kürten, A.: New particle formation from sulfuric acid and ammonia: nucleation and growth model based on thermodynamics derived from CLOUD measurements for a wide range of conditions, Atmos. Chem. Phys., 19, 5033–5050, https://doi.org/10.5194/acp-19-5033-2019, 2019.
Kürten, A., Williamson, C., Almeida, J., Kirkby, J., and Curtius, J.: On the derivation of particle nucleation rates from experimental formation rates, Atmos. Chem. Phys., 15, 4063–4075, https://doi.org/10.5194/acp-15-4063-2015, 2015.
Kürten, A., Bianchi, F., Almeida, J., Kupiainen-Maatta, O., Dunne, E. M., Duplissy, J., Williamson, C., Barmet, P., Breitenlechner, M., Dommen, J., Donahue, N. M., Flagan, R. C., Franchin, A., Gordon, H., Hakala, J., Hansel, A., Heinritzi, M., Ickes, L., Jokinen, T., Kangasluoma, J., Kim, J., Kirkby, J., Kupc, A., Lehtipalo, K., Leiminger, M., Makhmutov, V., Onnela, A., Ortega, I. K., Petaja, T., Praplan, A. P., Riccobono, F., Rissanen, M. P., Rondo, L., Schnitzhofer, R., Schobesberger, S., Smith, J. N., Steiner, G., Stozhkov, Y., Tome, A., Trostl, J., Tsagkogeorgas, G., Wagner, P. E., Wimmer, D., Ye, P. L., Baltensperger, U., Carslaw, K., Kulmala, M., and Curtius, J.: Experimental particle formation rates spanning tropospheric sulfuric acid and ammonia abundances, ion production rates, and temperatures, J. Geophys. Res.-Atmos., 121, 12377–12400, https://doi.org/10.1002/2015jd023908, 2016.
Kürten, A., Li, C., Bianchi, F., Curtius, J., Dias, A., Donahue, N. M., Duplissy, J., Flagan, R. C., Hakala, J., Jokinen, T., Kirkby, J., Kulmala, M., Laaksonen, A., Lehtipalo, K., Makhmutov, V., Onnela, A., Rissanen, M. P., Simon, M., Sipilä, M., Stozhkov, Y., Tröstl, J., Ye, P., and McMurry, P. H.: New particle formation in the sulfuric acid–dimethylamine–water system: reevaluation of CLOUD chamber measurements and comparison to an aerosol nucleation and growth model, Atmos. Chem. Phys., 18, 845–863, https://doi.org/10.5194/acp-18-845-2018, 2018.
Lee, S. H., Reeves, J. M., Wilson, J. C., Hunton, D. E., Viggiano, A. A., Miller, T. M., Ballenthin, J. O., and Lait, L. R.: Particle formation by ion nucleation in the upper troposphere and lower stratosphere, Science, 301, 1886–1889, https://doi.org/10.1126/science.1087236, 2003.
Lee, S. H., Wilson, J. C., Baumgardner, D., Herman, R. L., Weinstock, E. M., LaFleur, B. G., Kok, G., Anderson, B., Lawson, P., Baker, B., Strawa, A., Pittman, J. V., Reeves, J. M., and Bui, T. P.: New particle formation observed in the tropical/subtropical cirrus clouds, J. Geophys. Res.-Atmos., 109, D20209, https://doi.org/10.1029/2004jd005033, 2004.
Lovejoy, E. R., Curtius, J., and Froyd, K. D.: Atmospheric ion-induced nucleation of sulfuric acid and water, J. Geophys. Res.-Atmos., 109, D08204, https://doi.org/10.1029/2003jd004460, 2004.
Luebke, A. E., Afchine, A., Costa, A., Grooß, J.-U., Meyer, J., Rolf, C., Spelten, N., Avallone, L. M., Baumgardner, D., and Krämer, M.: The origin of midlatitude ice clouds and the resulting influence on their microphysical properties, Atmos. Chem. Phys., 16, 5793–5809, https://doi.org/10.5194/acp-16-5793-2016, 2016.
Mahnke, C., Weigel, R., Cairo, F., Vernier, J.-P., Afchine, A., Krämer, M., Mitev, V., Matthey, R., Viciani, S., D'Amato, F., Ploeger, F., Deshler, T., and Borrmann, S.: The ATAL within the 2017 Asian Monsoon Anticyclone: Microphysical aerosol properties derived from aircraft-borne in situ measurements, Atmos. Chem. Phys. Discuss. [preprint], https://doi.org/10.5194/acp-2020-1241, in review, 2021.
Manton, M. J.: On the broadening of a droplet distribution by turbulence near cloud base, Q. J. Roy. Meteor. Soc., 105, 899–914, https://doi.org/10.1002/qj.49710544613, 1979.
Merikanto, J., Spracklen, D. V., Mann, G. W., Pickering, S. J., and Carslaw, K. S.: Impact of nucleation on global CCN, Atmos. Chem. Phys., 9, 8601–8616, https://doi.org/10.5194/acp-9-8601-2009, 2009.
Metzger, A., Verheggen, B., Dommen, J., Duplissy, J., Prevot, A. S. H., Weingartner, E., Riipinen, I., Kulmala, M., Spracklen, D. V., Carslaw, K. S., and Baltensperger, U.: Evidence for the role of organics in aerosol particle formation under atmospheric conditions, P. Natl. Acad. Sci. USA, 107, 6646–6651, https://doi.org/10.1073/pnas.0911330107, 2010.
Meyer, J., Rolf, C., Schiller, C., Rohs, S., Spelten, N., Afchine, A., Zöger, M., Sitnikov, N., Thornberry, T. D., Rollins, A. W., Bozóki, Z., Tátrai, D., Ebert, V., Kühnreich, B., Mackrodt, P., Möhler, O., Saathoff, H., Rosenlof, K. H., and Krämer, M.: Two decades of water vapor measurements with the FISH fluorescence hygrometer: a review, Atmos. Chem. Phys., 15, 8521–8538, https://doi.org/10.5194/acp-15-8521-2015, 2015.
Murphy, D. M., Cziczo, D. J., Froyd, K. D., Hudson, P. K., Matthew, B. M., Middlebrook, A. M., Peltier, R. E., Sullivan, A., Thomson, D. S., and Weber, R. J.: Single-particle mass spectrometry of tropospheric aerosol particles, J. Geophys. Res.-Atmos., 111, D23s32, https://doi.org/10.1029/2006jd007340, 2006.
Pan, L. L., Honomichl, S. B., Kinnison, D. E., Abalos, M., Randel, W. J., Bergman, J. W., and Bian, J.: Transport of chemical tracers from the boundary layer to stratosphere associated with the dynamics of the Asian summer monsoon, J. Geophys. Res.-Atmos., 121, 14.159–114.174, https://doi.org/10.1002/2016jd025616, 2016.
Park, M., Randel, W. J., Gettelman, A., Massie, S. T., and Jiang, J. H.: Transport above the Asian summer monsoon anticyclone inferred from Aura Microwave Limb Sounder tracers, J. Geophys. Res.-Atmos., 112, D16309, https://doi.org/10.1029/2006jd008294, 2007.
Park, M., Randel, W. J., Emmons, L. K., and Livesey, N. J.: Transport pathways of carbon monoxide in the Asian summer monsoon diagnosed from Model of Ozone and Related Tracers (MOZART), J. Geophys. Res.-Atmos., 114, D08303, https://doi.org/10.1029/2008jd010621, 2009.
Peter, Th., Luo, B. P., Wirth, M., Kiemle, C., Flentje, H., Yushkov, V. A., Khattatov, V., Rudakov, V., Thomas, A., Borrmann, S., Toci, G., Mazzinghi, P., Beuermann, J., Schiller, C., Cairo, F., Di Donfrancesco, G., Adriani, A., Volk, C. M., Strom, J., Noone, K., Mitev, V., MacKenzie, R. A., Carslaw, K. S., Trautmann, T., Santacesaria, V., and Stefanutti, L.: Ultrathin Tropical Tropopause Clouds (UTTCs): I. Cloud morphology and occurrence, Atmos. Chem. Phys., 3, 1083–1091, https://doi.org/10.5194/acp-3-1083-2003, 2003.
Ploeger, F., Günther, G., Konopka, P., Fueglistaler, S., Müller, R., Hoppe, C., Kunz, A., Spang, R., Grooss, J. U., and Riese, M.: Horizontal water vapor transport in the lower stratosphere from subtropics to high latitudes during boreal summer, J. Geophys. Res.-Atmos., 118, 8111–8127, https://doi.org/10.1002/jgrd.50636, 2013.
Politovich, M. K. and Cooper, W. A.: Variability of the Supersaturation in Cumulus Clouds, J. Atmos. Sci., 45, 1651–1664, https://doi.org/10.1175/1520-0469(1988)045<1651:votsic>2.0.co;2, 1988.
Pöschl, U., Canagaratna, M., Jayne, J. T., Molina, L. T., Worsnop, D. R., Kolb, C. E., and Molina, M. J.: Mass Accommodation Coefficient of H2SO4 Vapor on Aqueous Sulfuric Acid Surfaces and Gaseous Diffusion Coefficient of H2SO4 in N2/H2O, J. Phys. Chem. A, 102, 10082–10089, https://doi.org/10.1021/jp982809s, 1998.
Pruppacher, H. R. and Klett, J. D.: Microphysics of Clouds and Precipitation: Reprinted 1980, Springer Science & Business Media, Dordrecht, the Netherlands, 2012.
Radke, L. F. and Hobbs, P. V.: Humidity and Particle Fields around Some Small Cumulus Clouds, J. Atmos. Sci., 48, 1190–1193, https://doi.org/10.1175/1520-0469(1991)048<1190:Hapfas>2.0.Co;2, 1991.
Randel, W. J. and Park, M.: Deep convective influence on the Asian summer monsoon anticyclone and associated tracer variability observed with Atmospheric Infrared Sounder (AIRS), J. Geophys. Res.-Atmos., 111, D12314, https://doi.org/10.1029/2005jd006490, 2006.
Ranjithkumar, A., Gordon, H., Williamson, C., Rollins, A., Pringle, K., Kupc, A., Abraham, N. L., Brock, C., and Carslaw, K.: Constraints on global aerosol number concentration, SO2 and condensation sink in UKESM1 using ATom measurements, Atmos. Chem. Phys., 21, 4979–5014, https://doi.org/10.5194/acp-21-4979-2021, 2021.
Riccobono, F., Schobesberger, S., Scott, C. E., Dommen, J., Ortega, I. K., Rondo, L., Almeida, J., Amorim, A., Bianchi, F., Breitenlechner, M., David, A., Downard, A., Dunne, E. M., Duplissy, J., Ehrhart, S., Flagan, R. C., Franchin, A., Hansel, A., Junninen, H., Kajos, M., Keskinen, H., Kupc, A., Kürten, A., Kvashin, A. N., Laaksonen, A., Lehtipalo, K., Makhmutov, V., Mathot, S., Nieminen, T., Onnela, A., Petaja, T., Praplan, A. P., Santos, F. D., Schallhart, S., Seinfeld, J. H., Sipila, M., Spracklen, D. V., Stozhkov, Y., Stratmann, F., Tome, A., Tsagkogeorgas, G., Vaattovaara, P., Viisanen, Y., Vrtala, A., Wagner, P. E., Weingartner, E., Wex, H., Wimmer, D., Carslaw, K. S., Curtius, J., Donahue, N. M., Kirkby, J., Kulmala, M., Worsnop, D. R., and Baltensperger, U.: Oxidation Products of Biogenic Emissions Contribute to Nucleation of Atmospheric Particles, Science, 344, 717–721, https://doi.org/10.1126/science.1243527, 2014.
Schulz, C., Schneider, J., Amorim Holanda, B., Appel, O., Costa, A., de Sá, S. S., Dreiling, V., Fütterer, D., Jurkat-Witschas, T., Klimach, T., Knote, C., Krämer, M., Martin, S. T., Mertes, S., Pöhlker, M. L., Sauer, D., Voigt, C., Walser, A., Weinzierl, B., Ziereis, H., Zöger, M., Andreae, M. O., Artaxo, P., Machado, L. A. T., Pöschl, U., Wendisch, M., and Borrmann, S.: Aircraft-based observations of isoprene-epoxydiol-derived secondary organic aerosol (IEPOX-SOA) in the tropical upper troposphere over the Amazon region, Atmos. Chem. Phys., 18, 14979–15001, https://doi.org/10.5194/acp-18-14979-2018, 2018.
Schumann, U., Kiemle, C., Schlager, H., Weigel, R., Borrmann, S., D'Amato, F., Krämer, M., Matthey, R., Protat, A., Voigt, C., and Volk, C. M.: Long-lived contrails and convective cirrus above the tropical tropopause, Atmos. Chem. Phys., 17, 2311–2346, https://doi.org/10.5194/acp-17-2311-2017, 2017.
Sokolov, L. and Lepuchov, B.: Protocol of interaction between Unit for Connection with Scientific Equipment (UCSE) and on-board scientific equipment of Geophysica aircraft (Second edition), Myasishchev Design Bureau (MDB), Moscow, Russia, 1998.
Speidel, M., Nau, R., Arnold, F., Schlager, H., and Stohl, A.: Sulfur dioxide measurements in the lower, middle and upper troposphere: Deployment of an aircraft-based chemical ionization mass spectrometer with permanent in-flight calibration, Atmos. Environ., 41, 2427–2437, https://doi.org/10.1016/j.atmosenv.2006.07.047, 2007.
Spracklen, D. V., Carslaw, K. S., Kulmala, M., Kerminen, V.-M., Mann, G. W., and Sihto, S.-L.: The contribution of boundary layer nucleation events to total particle concentrations on regional and global scales, Atmos. Chem. Phys., 6, 5631–5648, https://doi.org/10.5194/acp-6-5631-2006, 2006.
Spreitzer, E. J., Marschalik, M. P., and Spichtinger, P.: Subvisible cirrus clouds – a dynamical system approach, Nonlin. Processes Geophys., 24, 307–328, https://doi.org/10.5194/npg-24-307-2017, 2017.
Tang, M. J., Cox, R. A., and Kalberer, M.: Compilation and evaluation of gas phase diffusion coefficients of reactive trace gases in the atmosphere: volume 1. Inorganic compounds, Atmos. Chem. Phys., 14, 9233–9247, https://doi.org/10.5194/acp-14-9233-2014, 2014.
Thomas, A., Borrmann, S., Kiemle, C., Cairo, F., Volk, M., Beuermann, J., Lepuchov, B., Santacesaria, V., Matthey, R., Rudakov, V., Yushkov, V., MacKenzie, A. R., and Stefanutti, L.: In situ measurements of background aerosol and subvisible cirrus in the tropical tropopause region, J. Geophys. Res.-Atmos., 107, AAC 8-1–AAC 8-14, https://doi.org/10.1029/2001jd001385, 2002.
Tsagkogeorgas, G., Roldin, P., Duplissy, J., Rondo, L., Tröstl, J., Slowik, J. G., Ehrhart, S., Franchin, A., Kürten, A., Amorim, A., Bianchi, F., Kirkby, J., Petäjä, T., Baltensperger, U., Boy, M., Curtius, J., Flagan, R. C., Kulmala, M., Donahue, N. M., and Stratmann, F.: Evaporation of sulfate aerosols at low relative humidity, Atmos. Chem. Phys., 17, 8923–8938, https://doi.org/10.5194/acp-17-8923-2017, 2017.
Twohy, C. H., Clement, C. F., Gandrud, B. W., Weinheimer, A. J., Campos, T. L., Baumgardner, D., Brune, W. H., Faloona, I., Sachse, G. W., Vay, S. A., and Tan, D.: Deep convection as a source of new particles in the midlatitude upper troposphere, J. Geophys. Res.-Atmos., 107, 4560, https://doi.org/10.1029/2001jd000323, 2002.
Ueyama, R., Jensen, E. J., Pfister, L., Krämer, M., Afchine, A., and Schoeberl, M.: Impact of Convectively Detrained Ice Crystals on the Humidity of the Tropical Tropopause Layer in Boreal Winter, J. Geophys. Res.-Atmos., 125, e2020JD032894, https://doi.org/10.1029/2020JD032894, 2020.
Vehkamäki, H., Kulmala, M., Napari, I., Lehtinen, K. E. J., Timmreck, C., Noppel, M., and Laaksonen, A.: An improved parameterization for sulfuric acid–water nucleation rates for tropospheric and stratospheric conditions, J. Geophys. Res.-Atmos., 107, AAC 3-1–AAC 3-10, https://doi.org/10.1029/2002jd002184, 2002.
Venzac, H., Sellegri, K., Laj, P., Villani, P., Bonasoni, P., Marinoni, A., Cristofanelli, P., Calzolari, F., Fuzzi, S., Decesari, S., Facchini, M. C., Vuillermoz, E., and Verza, G. P.: High frequency new particle formation in the Himalayas, P. Natl. Acad. Sci. USA, 105, 15666–15671, https://doi.org/10.1073/pnas.0801355105, 2008.
Vernier, J. P., Thomason, L. W., and Kar, J.: CALIPSO detection of an Asian tropopause aerosol layer, Geophys. Res. Lett., 38, L07804, https://doi.org/10.1029/2010gl046614, 2011.
Vernier, J. P., Fairlie, T. D., Natarajan, M., Wienhold, F. G., Bian, J., Martinsson, B. G., Crumeyrolle, S., Thomason, L. W., and Bedka, K. M.: Increase in upper tropospheric and lower stratospheric aerosol levels and its potential connection with Asian pollution, J. Geophys. Res.-Atmos., 120, 1608–1619, https://doi.org/10.1002/2014jd022372, 2015.
Vernier, J.-P., Fairlie, T. D., Deshler, T., Ratnam, M. V., Gadhavi, H., Kumar, B. S., Natarajan, M., Pandit, A. K., Raj, S. T. A., Kumar, A. H., Jayaraman, A., Singh, A. K., Rastogi, N., Sinha, P. R., Kumar, S., Tiwari, S., Wegner, T., Baker, N., Vignelles, D., Stenchikov, G., Shevchenko, I., Smith, J., Bedka, K., Kesarkar, A., Singh, V., Bhate, J., Ravikiran, V., Rao, M. D., Ravindrababu, S., Patel, A., Vernier, H., Wienhold, F. G., Liu, H., Knepp, T. N., Thomason, L., Crawford, J., Ziemba, L., Moore, J., Crumeyrolle, S., Williamson, M., Berthet, G., Jégou, F., and Renard, J.-B.: BATAL: The Balloon Measurement Campaigns of the Asian Tropopause Aerosol Layer, B. Am. Meteorol. Soc., 99, 955–973, https://doi.org/10.1175/bams-d-17-0014.1, 2018.
Viciani, S., D'Amato, F., Mazzinghi, P., Castagnoli, F., Toci, G., and Werle, P.: A cryogenically operated laser diode spectrometer for airborne measurement of stratospheric trace gases, Appl. Phys. B, 90, 581–592, https://doi.org/10.1007/s00340-007-2885-2, 2008.
Viciani, S., Montori, A., Chiarugi, A., and D'Amato, F.: A Portable Quantum Cascade Laser Spectrometer for Atmospheric Measurements of Carbon Monoxide, Sensors, 18, 2380, https://doi.org/10.3390/s18072380, 2018.
Vogel, B., Günther, G., Müller, R., Grooß, J.-U., Hoor, P., Krämer, M., Müller, S., Zahn, A., and Riese, M.: Fast transport from Southeast Asia boundary layer sources to northern Europe: rapid uplift in typhoons and eastward eddy shedding of the Asian monsoon anticyclone, Atmos. Chem. Phys., 14, 12745–12762, https://doi.org/10.5194/acp-14-12745-2014, 2014.
Vogel, B., Müller, R., Günther, G., Spang, R., Hanumanthu, S., Li, D., Riese, M., and Stiller, G. P.: Lagrangian simulations of the transport of young air masses to the top of the Asian monsoon anticyclone and into the tropical pipe, Atmos. Chem. Phys., 19, 6007–6034, https://doi.org/10.5194/acp-19-6007-2019, 2019.
Waddicor, D. A., Vaughan, G., Choularton, T. W., Bower, K. N., Coe, H., Gallagher, M., Williams, P. I., Flynn, M., Volz-Thomas, A., Pätz, H.-W., Isaac, P., Hacker, J., Arnold, F., Schlager, H., and Whiteway, J. A.: Aerosol observations and growth rates downwind of the anvil of a deep tropical thunderstorm, Atmos. Chem. Phys., 12, 6157–6172, https://doi.org/10.5194/acp-12-6157-2012, 2012.
Wang, M., Kong, W., Marten, R., He, X.-C., Chen, D., Pfeifer, J., Heitto, A., Kontkanen, J., Dada, L., Kürten, A., Yli-Juuti, T., Manninen, H. E., Amanatidis, S., Amorim, A., Baalbaki, R., Baccarini, A., Bell, D. M., Bertozzi, B., Bräkling, S., Brilke, S., Murillo, L. C., Chiu, R., Chu, B., De Menezes, L.-P., Duplissy, J., Finkenzeller, H., Carracedo, L. G., Granzin, M., Guida, R., Hansel, A., Hofbauer, V., Krechmer, J., Lehtipalo, K., Lamkaddam, H., Lampimäki, M., Lee, C. P., Makhmutov, V., Marie, G., Mathot, S., Mauldin, R. L., Mentler, B., Müller, T., Onnela, A., Partoll, E., Petäjä, T., Philippov, M., Pospisilova, V., Ranjithkumar, A., Rissanen, M., Rörup, B., Scholz, W., Shen, J., Simon, M., Sipilä, M., Steiner, G., Stolzenburg, D., Tham, Y. J., Tomé, A., Wagner, A. C., Wang, D. S., Wang, Y., Weber, S. K., Winkler, P. M., Wlasits, P. J., Wu, Y., Xiao, M., Ye, Q., Zauner-Wieczorek, M., Zhou, X., Volkamer, R., Riipinen, I., Dommen, J., Curtius, J., Baltensperger, U., Kulmala, M., Worsnop, D. R., Kirkby, J., Seinfeld, J. H., El-Haddad, I., Flagan, R. C., and Donahue, N. M.: Rapid growth of new atmospheric particles by nitric acid and ammonia condensation, Nature, 581, 184–189, https://doi.org/10.1038/s41586-020-2270-4, 2020.
Weber, R. J., Clarke, A. D., Litchy, M., Li, J., Kok, G., Schillawski, R. D., and McMurry, P. H.: Spurious aerosol measurements when sampling from aircraft in the vicinity of clouds, J. Geophys. Res.-Atmos., 103, 28337–28346, https://doi.org/10.1029/98jd02086, 1998.
Wehner, B., Werner, F., Ditas, F., Shaw, R. A., Kulmala, M., and Siebert, H.: Observations of new particle formation in enhanced UV irradiance zones near cumulus clouds, Atmos. Chem. Phys., 15, 11701–11711, https://doi.org/10.5194/acp-15-11701-2015, 2015.
Weigel, R., Hermann, M., Curtius, J., Voigt, C., Walter, S., Böttger, T., Lepukhov, B., Belyaev, G., and Borrmann, S.: Experimental characterization of the COndensation PArticle counting System for high altitude aircraft-borne application, Atmos. Meas. Tech., 2, 243–258, https://doi.org/10.5194/amt-2-243-2009, 2009.
Weigel, R., Borrmann, S., Kazil, J., Minikin, A., Stohl, A., Wilson, J. C., Reeves, J. M., Kunkel, D., de Reus, M., Frey, W., Lovejoy, E. R., Volk, C. M., Viciani, S., D'Amato, F., Schiller, C., Peter, T., Schlager, H., Cairo, F., Law, K. S., Shur, G. N., Belyaev, G. V., and Curtius, J.: In situ observations of new particle formation in the tropical upper troposphere: the role of clouds and the nucleation mechanism, Atmos. Chem. Phys., 11, 9983–10010, https://doi.org/10.5194/acp-11-9983-2011, 2011.
Weigel, R., Volk, C. M., Kandler, K., Hösen, E., Günther, G., Vogel, B., Grooß, J.-U., Khaykin, S., Belyaev, G. V., and Borrmann, S.: Enhancements of the refractory submicron aerosol fraction in the Arctic polar vortex: feature or exception?, Atmos. Chem. Phys., 14, 12319–12342, https://doi.org/10.5194/acp-14-12319-2014, 2014.
Weigel, R., Mahnke, C., Baumgartner, M., Dragoneas, A., Vogel, B., Ploeger, F., Viciani, S., D'Amato, F., Bucci, S., Legras, B., Luo, B., and Borrmann, S.: In situ observation of new particle formation (NPF) in the tropical tropopause layer of the 2017 Asian monsoon anticyclone – Part 1: Summary of StratoClim results, Atmos. Chem. Phys., 21, 11689–11722, https://doi.org/10.5194/acp-21-11689-2021, 2021.
Weigelt, A., Hermann, M., van Velthoven, P. F. J., Brenninkmeijer, C. A. M., Schlaf, G., Zahn, A., and Wiedensohler, A.: Influence of clouds on aerosol particle number concentrations in the upper troposphere, J. Geophys. Res.-Atmos., 114, D01204, https://doi.org/10.1029/2008jd009805, 2009.
Wernli, H., Boettcher, M., Joos, H., Miltenberger, A. K., and Spichtinger, P.: A trajectory-based classification of ERA-Interim ice clouds in the region of the North Atlantic storm track, Geophys. Res. Lett., 43, 6657–6664, https://doi.org/10.1002/2016gl068922, 2016.
Williamson, C. J., Kupc, A., Axisa, D., Bilsback, K. R., Bui, T., Campuzano-Jost, P., Dollner, M., Froyd, K. D., Hodshire, A. L., Jimenez, J. L., Kodros, J. K., Luo, G., Murphy, D. M., Nault, B. A., Ray, E. A., Weinzierl, B., Wilson, J. C., Yu, F., Yu, P., Pierce, J. R., and Brock, C. A.: A large source of cloud condensation nuclei from new particle formation in the tropics, Nature, 574, 399–403, https://doi.org/10.1038/s41586-019-1638-9, 2019.
WMO: International Meteorological Tables, WMO-No.188.TP97, edited by: Letestu, S., Secretariat of the World Meteorological Organization, Geneva, Switzerland, 1966.
Yu, P. F., Toon, O. B., Neely, R. R., Martinsson, B. G., and Brenninkmeijer, C. A. M.: Composition and physical properties of the Asian Tropopause Aerosol Layer and the North American Tropospheric Aerosol Layer, Geophys. Res. Lett., 42, 2540–2546, https://doi.org/10.1002/2015gl063181, 2015.
Zöger, M., Afchine, A., Eicke, N., Gerhards, M. T., Klein, E., McKenna, D. S., Morschel, U., Schmidt, U., Tan, V., Tuitjer, F., Woyke, T., and Schiller, C.: Fast in situ stratospheric hygrometers: A new family of balloon-borne and airborne Lyman alpha photofragment fluorescence hygrometers, J. Geophys. Res.-Atmos., 104, 1807–1816, https://doi.org/10.1029/1998jd100025, 1999.
- Abstract
- Introduction
- The StratoClim field campaign, instruments, and methods
- Observations and results
- In-cloud NPF related to IWC and cloud particle number densities
- The dependency of NPF on the proximity to ice particles
- Summary and conclusions
- Appendix A: Exclusion of sampling artefacts due to the presence of cloud ice
- Appendix B: Impact of ice particles on NPF precursors' saturation ratio
- Data availability
- Author contributions
- Competing interests
- Disclaimer
- Special issue statement
- Acknowledgements
- Financial support
- Review statement
- References