the Creative Commons Attribution 4.0 License.
the Creative Commons Attribution 4.0 License.
 | 06 Aug 2021
In situ observation of new particle formation (NPF) in the tropical tropopause layer of the 2017 Asian monsoon anticyclone – Part 1: Summary of StratoClim results
Christoph Mahnke
Manuel Baumgartner
Antonis Dragoneas
Bärbel Vogel
Felix Ploeger
Silvia Viciani
Francesco D'Amato
Silvia Bucci
Bernard Legras
Beiping Luo
Stephan Borrmann
During the monsoon season of the year 2017 the airborne StratoClim mission took place in Kathmandu, Nepal, with eight mission flights of the M-55 Geophysica in the upper troposphere–lower stratosphere (UTLS) of the Asian monsoon anticyclone (AMA) over northern India, Nepal, and Bangladesh. More than 100 events of new particle formation (NPF) were observed. In total, more than 2 h of flight time was spent under NPF conditions as indicated by the abundant presence of nucleation-mode aerosols, i.e. with particle diameters dp smaller than 15 nm, which were detected in situ by means of condensation nuclei counting techniques. Mixing ratios of nucleation-mode particles (nnm) of up to ∼ 50 000 mg−1 were measured at heights of 15–16 km (θ ≈ 370 K). NPF was most frequently observed at ∼ 12–16 km altitude (θ ≈ 355–380 K) and mainly below the tropopause. Resulting nnm remained elevated (∼ 300–2000 mg−1) up to altitudes of ∼ 17.5 km (θ ≈ 400 K), while under NPF conditions the fraction (f) of sub-micrometre-sized non-volatile residues (dp > 10 nm) remained below 50 %. At ∼ 12–14 km (θ ≈ 355–365 K) the minimum of f (< 15 %) was found, and underneath, the median f generally remains below 25 %. The persistence of particles at nucleation-mode sizes is limited to a few hours, mainly due to coagulation, as demonstrated by a numerical simulation. The frequency of NPF events observed during StratoClim 2017 underlines the importance of the AMA as a source region for UTLS aerosols and for the formation and maintenance of the Asian tropopause aerosol layer (ATAL). The observed abundance of NPF-produced nucleation-mode particles within the AMA is not unambiguously attributable to (a) specific source regions in the boundary layer (according to backward trajectory analyses), or (b) the direct supply with precursor material by convective updraught (from correlations of NPF with carbon monoxide), or (c) the recent release of NPF-capable material from the convective outflow (according to air mass transport times in the tropical tropopause layer, TTL). Temperature anomalies with ΔT of 2 K (peak-to-peak amplitude), as observed at a horizontal wavelength of ∼ 70–100 km during a level flight of several hours, match with NPF detections and represent an additional mechanism for local increases in supersaturation of the NPF precursors. Effective precursor supply and widely distributed temperature anomalies within the AMA can explain the higher frequency of intense NPF observed during StratoClim 2017 than all previous NPF detections with COPAS (COndensation PArticle counting System) at TTL levels over Brazil, northern Australia, or West Africa.
- Article
(21024 KB) - Full-text XML
- Companion paper
- BibTeX
- EndNote


Aerosol particles in the upper troposphere–lower stratosphere (UTLS) influence the radiative balance of the Earth's atmosphere, stratospheric chemistry, and properties of cirrus clouds near the tropopause (Kremser et al., 2016). UTLS aerosols are mainly composed of sulfuric acid (H2SO4), nitric acid (HNO3), water (H2O), and organic compounds. Additionally, the particles include fractions of non-volatile (or refractory) material (e.g. Froyd et al., 2010; Borrmann et al., 2010; Murphy et al., 2014; Schneider et al., 2021). Non-volatile components of stratospheric aerosol particles originate from (1) natural tropospheric sources, e.g. volcanoes, biomass burning, or pyro-cumulonimbus, or (2) from meteoric ablation, or (3) they are anthropogenic, as, for instance, space debris, rocket exhaust fumes, and products from combustion (Kremser et al., 2016). Chemical and microphysical processes, which involve the stratospheric aerosol, could be influenced by solutes that, for example, had previously been constituents of the refractory aerosol compounds. Soot, mineral dust, fly ashes, metal-containing condensates, inorganic salts, and other species probably make up the largest share of the non-volatile components of aerosol particles in the UTLS. In the tropics, underneath the tropopause, the number of non-volatile fine-mode particles (i.e. smaller than 1 µm and larger than 10 nm in diameter dp) typically exhibits a characteristic minimum, resulting in a fraction of ∼ 20 % (and less) of non-volatile aerosol particles (cf. Borrmann et al., 2010; Weigel et al., 2011). Above the tropopause, at potential temperatures greater than 390–400 K, a maximum contribution of non-volatile aerosol constituents seldom exceeds 50 % (see e.g. Borrmann et al., 2010). Schneider et al. (2021) recently provided laser ablation mass spectrometric analyses of refractory particles in the LS region between the Equator and the Arctic, which indicate detectable signatures of meteoric ablation material at all sample locations in the LS. They assume that the meteoric ablation material is partly present as a solute or as insoluble inclusion within stratospheric H2SO4–H2O droplets.
In general, the typical particle size distribution of the stratospheric aerosol is characterised by processes such as formation of new particles and their coagulation, the condensation of saturated vapours, and the evaporation as well as removal when the largest particles sediment. In the tropics, above the level of zero net radiative heating, where scavenging is lacking in the absence of clouds, aerosol particles are available for isentropic dispersion or upward transport into the stratosphere. Sedimentation or isentropic transport and mixing remove particles from the stratosphere (Thomason and Peter, 2006; Kremser et al., 2016). Moreover, the aerosol removal from the stratosphere occurs with particular efficiency via large-scale air mass subsidence in the polar winter vortex in both the Arctic (Weigel et al., 2014) and the Antarctic (Campbell and Deshler, 2014).
The process of new particle formation (NPF) is considered to be one of the most important sources of the H2SO4–H2O solution droplets prevailing in the UT and tropical tropopause layer (TTL) (Brock et al., 1995). The reservoir of stratospheric H2SO4 is maintained by oxidation of gaseous precursors like sulfur dioxide (SO2), carbonyl sulfide (OCS), and carbon disulfide (CS2) or dimethyl sulfide (C2H6S) (Thomason and Peter, 2006; Kremser et al., 2016). These species can originate from sea surface emissions, from volcanism, or from anthropogenic pollution, and they often undergo long-range transport before reaching the TTL (e.g. Law et al., 2010). Sporadically, explosive volcanism injects large quantities of SO2 directly into the stratosphere. Weaker volcanic eruptions (with a mean vertical explosion index of about 4) also contribute significantly by delivering volcanic sulfur species indirectly via the TTL into higher altitudes (Vernier et al., 2011b; Kremser et al., 2016). Although SO2 is efficiently bound within clouds during convective uplift and dissolved in cloud hydrometeors, cloud-resolving model calculations suggest that SO2 proportions, which range from only 30 % (Ekman et al., 2006) up to 40 %–90 % (Barth et al., 2001), reach the outflow region of deep convection largely consistent with estimates by Crutzen and Lawrence (2000). Laboratory investigations by Jost et al. (2017) yielded a comparatively moderate retention coefficient (0.2–0.5) of SO2 in the ice phase of clouds compared to a retention of 100 % for hydrochloric acid (HCl) and for nitric acid (HNO3) (Jost et al., 2017). Hence, large fractions of the in-cloud dissolved SO2 leave the cloud ice composite as soon as the cloud particles freeze or when riming occurs. Alternatively, the SO2, which remains in the cloud ice composite, is entirely released when the ice particles sublimate in the convective outflow region or below, while the ice particles sediment. Rollins et al. (2017) presented the results of in situ SO2 measurements at up to 19 km altitude over the Gulf of Mexico and compared these with both model results and satellite observations. Generally, at altitudes between 8 and 15 km, the mean values of SO2 mixing ratio vary between 5 and 800 pmol mol−1 in the Northern Hemisphere, between 8 and 120 pmol mol−1 in the tropics, and between 5 and 20 pmol mol−1 in the Southern Hemisphere (Kremser et al., 2016). Enhanced SO2 mixing ratios in the vicinity of the tropopause are often observed in connection with the uplift of polluted air masses by warm conveyor belts (WBCs) (Kremser et al., 2016). Apart from sulfuric acid, also other species contribute to particle nucleation and growth, such as organics (Metzger et al., 2010; Kerminen et al., 2010), amines (Kürten et al., 2018), or ammonia (e.g. Kirkby et al., 2011; Kürten, 2019). Given the quantity of organics (Murphy et al., 2006) and ammonia species (Höpfner et al., 2019) which were found in aerosol particles at UT and TTL heights in the AMA during the StratoClim 2017 mission, such compounds can act as agents promoting NPF in the UT and TTL region.
1.1 New particle formation
New particle formation (NPF) comprises (1) the initial combination of molecules into clusters (of ∼ 1 nm diameter) and (2) their subsequent growth to larger diameters (Kulmala et al., 2013). Nucleation-mode aerosol particles with a diameter (dp) of at least 3 nm frequently form in considerable quantities from gaseous precursors. Once formed, the particles are subject to altering processes (e.g. coagulation, growth by condensation of water vapour and other gases, evaporation, and scavenging). Within the entire atmosphere, NPF seems ubiquitous as was demonstrated by various studies and observations of NPF's occurrence:
-
at or close to the surface (Kulmala et al., 2004; Nieminen et al., 2018)
-
at elevated altitudes within the boundary layer (e.g. Bianchi et al., 2021; Sellegri et al., 2019; Wehner et al., 2015; Crumeyrolle et al., 2010; Venzac et al., 2008)
-
in the boundary layer and in the free troposphere under the direct influence of volcanic activity (e.g. Sahyoun et al., 2019)
-
up to tropopause altitudes and the TTL region (Kerminen et al., 2018; Williamson et al., 2018, 2019).
Modelling studies suggest that the NPF process constitutes one of the most important contributions (up to 45 %) to global mean tropospheric concentrations of cloud condensation nuclei (CCN) activated at 0.2 % supersaturation (Merikanto et al., 2009). Uncertainties remain concerning the effectiveness of NPF, which complicates the implementation of the NPF mechanism in global-scale simulations of aerosol number densities (Yu et al., 2010; Zhang et al., 2010). Chamber experiments, conducted at temperatures similar to those prevailing in the UT, and also numerical simulations confirm that the UT constitutes an important source region for atmospheric particles (Kürten et al., 2016; Dunne et al., 2016).
Based on airborne in situ observations of high particle number concentrations together with high levels of particle volatility in the cloud-free tropical UT, the conditions of NPF occurrence were described for the first time by Brock et al. (1995). Between 7 and 20 km altitude, fields of recent NPF events were encountered in about 20 % of the probed flight segments (Lee et al., 2004). High NPF productivity with the largest nnm was observed particularly at the bottom TTL, as shown by airborne measurements during missions over Brazil and over northern Australia (Weigel et al., 2011). Recently, a survey of NPF occurrence in the free troposphere (∼ 0.2–12 km altitude) has suggested that the NPF-produced particles persist (zonally almost invariant) as a globally extending band within the tropical UT, thereby covering 40 % of the Earth's surface (Williamson et al., 2019). At altitudes between 12 and 20 km within the tropics, this had also been reported by Borrmann et al. (2010).
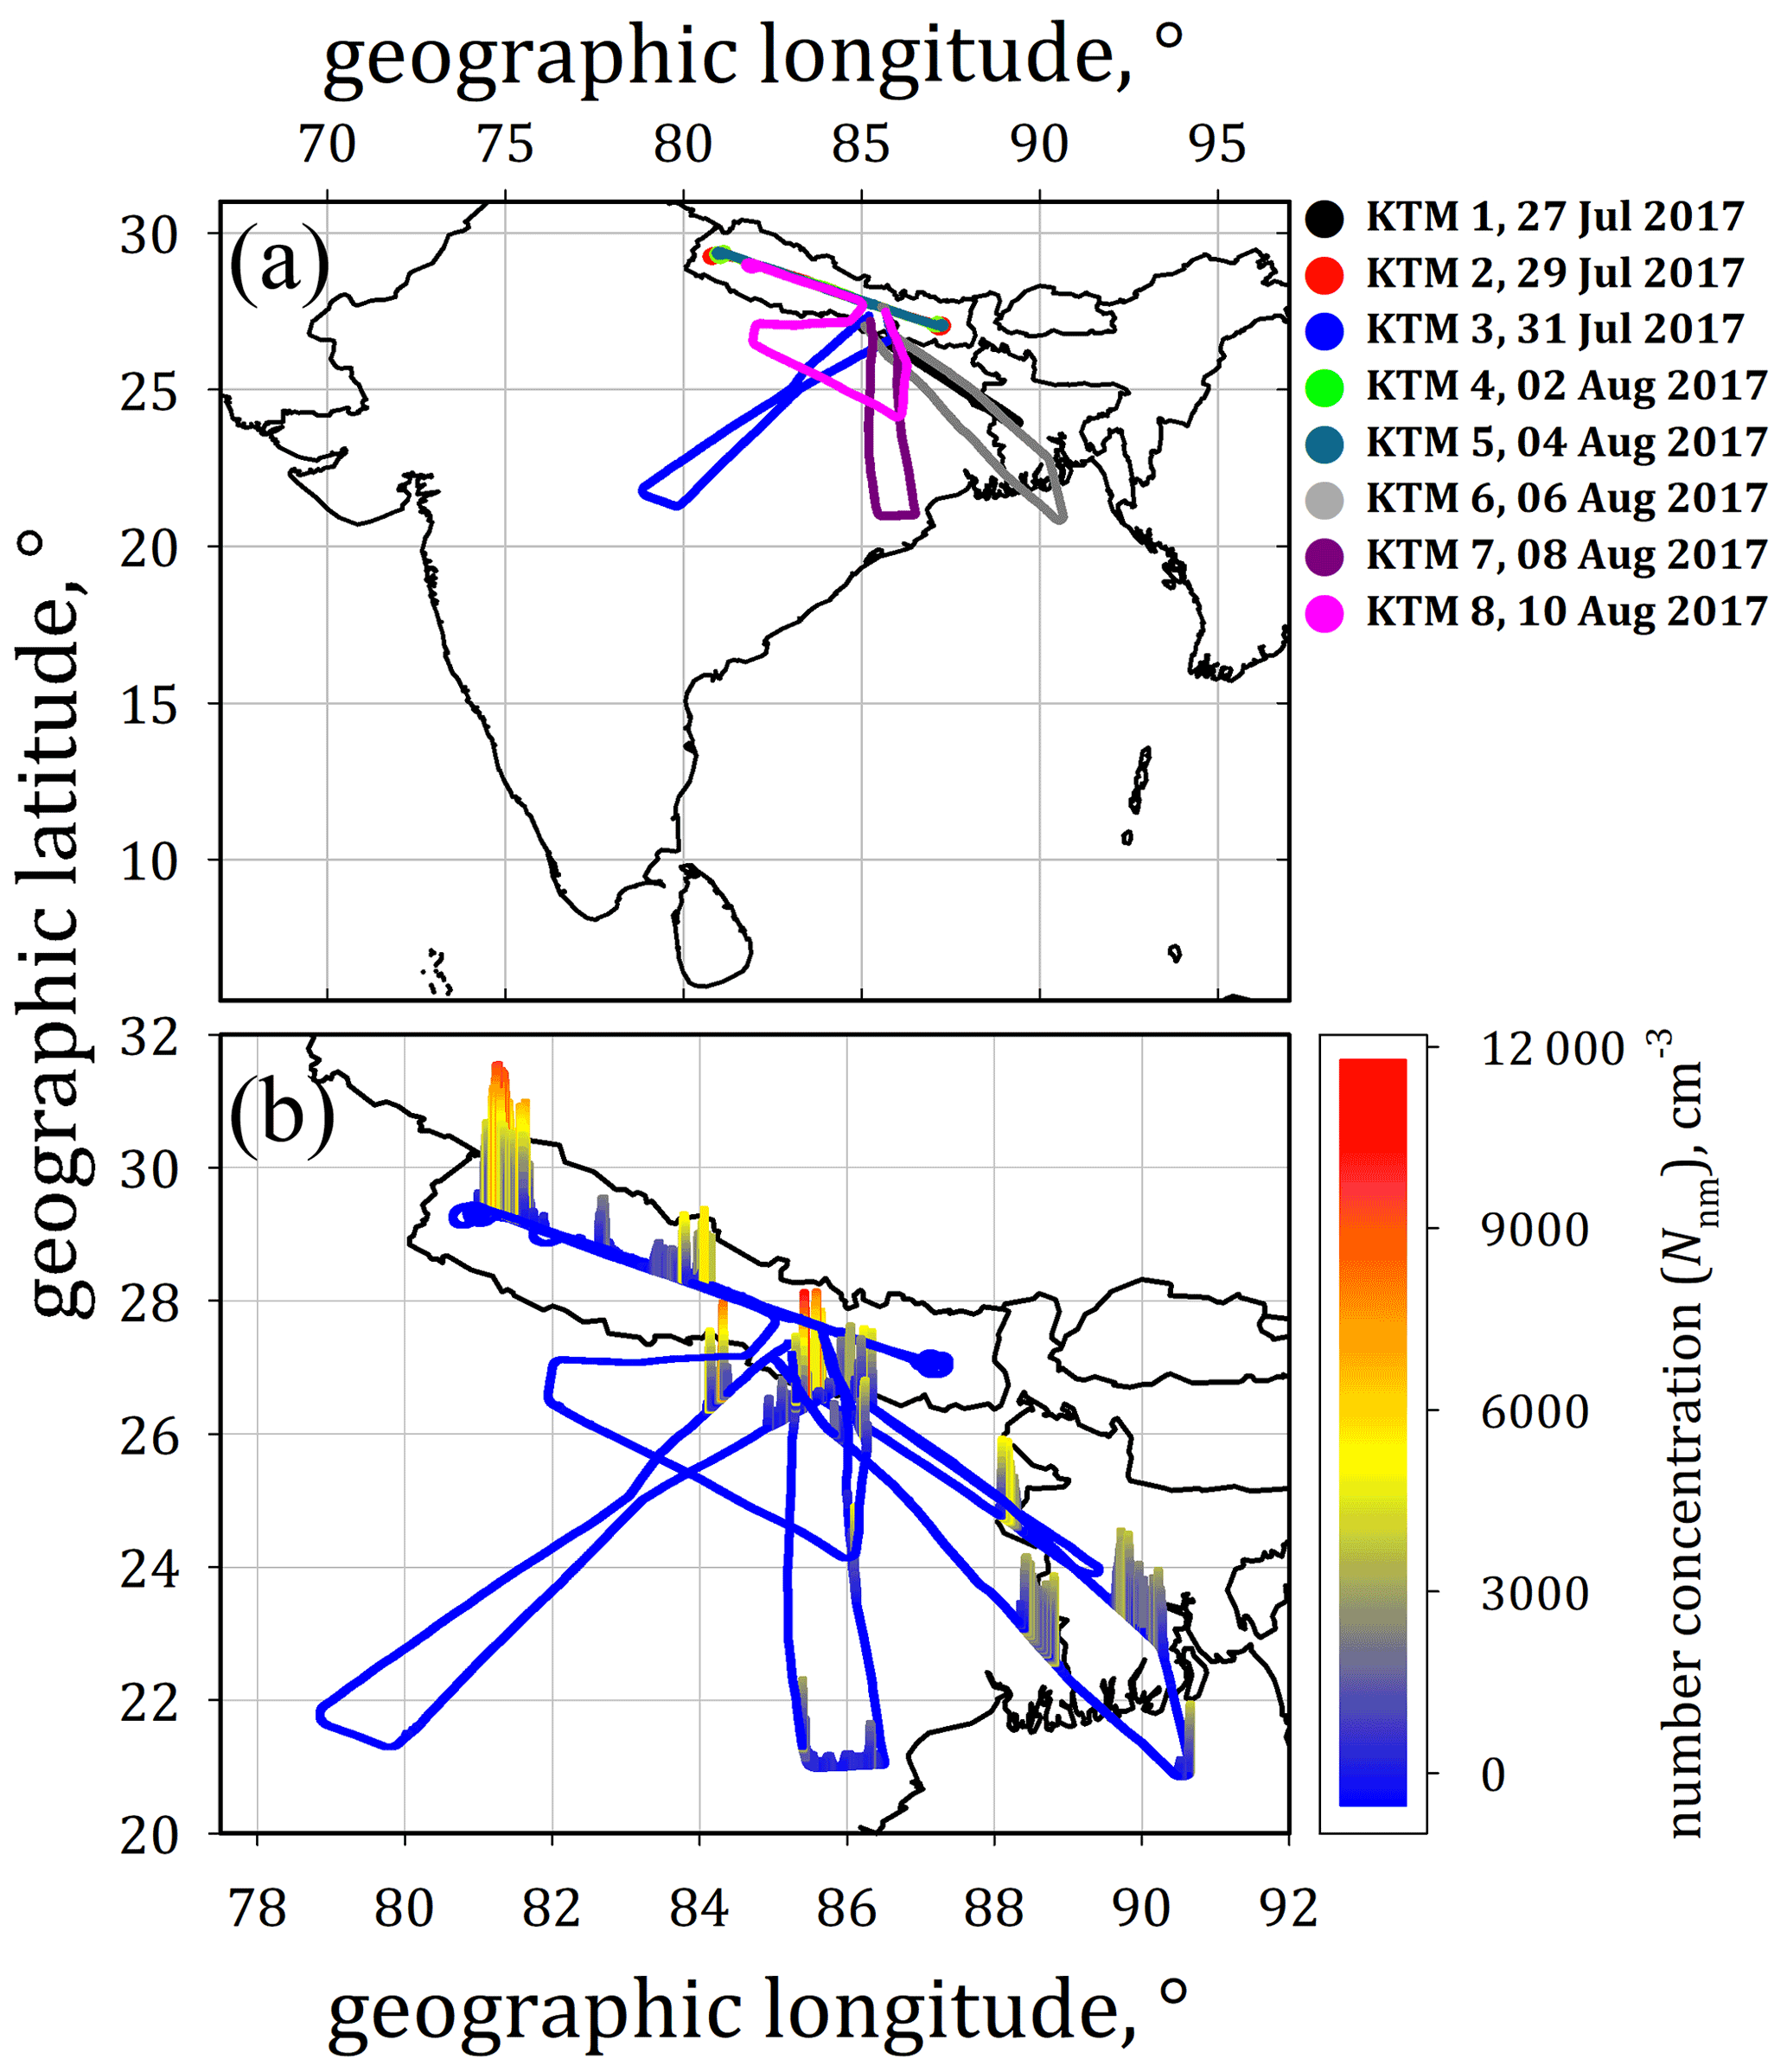
Figure 1(a) Flight patterns of the StratoClim 2017 mission over Nepal, India, Bangladesh, and the Bay of Bengal. (b) Regions with elevated number concentrations of nucleation-mode particles (Nnm, ambient conditions) of sizes in the diameter range of 6 nm < dp < 15 nm from COPAS (COndensation PArticle counting System) measurements are indicated by the colour code and by symbol size along the flight tracks.
Between 27 July and 10 August 2017, during the Asian monsoon season, a total of eight scientific flights with the high-altitude research aircraft M-55 Geophysica over parts of the Indian subcontinent were performed from Kathmandu, Nepal (27∘42′3′′ N, 85∘21′42′′ E), during the StratoClim 2017 mission (see Fig. 1 and also Bucci et al., 2020). Some of these flights partly spanned out of Nepalese airspace to eastern India, Bangladesh, and the northern part of the Bay of Bengal. During StratoClim 2017, NPF was frequently observed in the presence of ice cloud particles within cirrus or in anvils of the convective outflow and is discussed in detail in the companion paper (Weigel et al., 2021). Based on these observations during StratoClim 2017, NPF turned out to be largely unaffected by faint ice clouds that typically occur in the TTL (Weigel et al., 2021). This study aims at discussing the NPF encounters in their entirety as observed during the StratoClim 2017 mission in the UT and TTL region at altitudes of up to 20 km in the Asian monsoon anticyclone.
1.2 The Asian monsoon anticyclone and the Asian tropopause aerosol layer
The Asian monsoon anticyclone (AMA) represents one of the most important circulation systems in the UTLS associated with deep convection over the Indian subcontinent and beyond. From the beginning of June until about the end of August, the large-scale anticyclone persists at altitudes from the UT to the LS regions (e.g. Randel and Park, 2006; Park et al., 2007), extending over longitudes from East Asia to the Middle East and East Africa (e.g. Vogel et al., 2014, 2019). The anticyclonic rotation of the system induces confinement of air inside the AMA's interior (Ploeger et al., 2015). Air masses in the region of the Asian monsoon are rapidly lifted by convection up to the maximum level of convective outflow (∼ 360 K, corresponding to ∼ 13 km) followed by a slow diabatic lift superimposed on the anticyclonic motion (e.g. Vogel et al., 2019). Within the AMA, young air is transported to UTLS altitudes during boreal summer, and in this way various pollutants and other gaseous material (Glatthor et al., 2015; Chirkov et al., 2016; Pan et al., 2016; Santee et al., 2017) and in particular water vapour (Ploeger et al., 2013) are lifted into the UTLS region. Based on satellite studies, the existence of the aerosol layer at tropopause altitudes within the AMA region (Asian tropopause aerosol layer, ATAL) was demonstrated (Vernier et al., 2011a; Thomason and Vernier, 2013). The existence of the ATAL was further confirmed by in situ balloon-borne backscatter measurements between 2013 and 2017 at different locations near the AMA centre (Vernier et al., 2015, 2018; Brunamonti et al., 2018; Hanumanthu et al., 2020) and recent aircraft measurements of Mahnke et al. (2021) or Fujiwara et al. (2021).
Hence, the constituents of the rising young air also include precursor material from anthropogenic (Vernier et al., 2015; Yu et al., 2015) and other sources. The NPF process in the TTL region could contribute significantly to the formation and persistence of ATAL as a source of additional aerosol material (He et al., 2019). Once the boundary layer material has reached UTLS levels within the AMA, the elevated tropopause potential temperature during the monsoon season allows the material's isentropic dispersion into the “overworld” stratosphere (Pan et al., 2016). Three-dimensional simulations with the Chemical Lagrangian Model of the Stratosphere (CLaMS) and backward trajectory analyses show that by the end of August, during the 2008 monsoon season, air masses younger than 6 months reach the top of the AMA at about 460 K potential temperature (corresponding to ∼ 60 hPa). According to these simulations (Vogel et al., 2019), air masses are lifted due to diabatic (radiative) heating in an anticyclonic large-scale upward spiral with ascent rates of about 1 K potential temperature per day across the tropopause, consistent with the conclusions of previous works (Bergman et al., 2012; Garny and Randel, 2016; Ploeger et al., 2017).
2.1 Total number concentration of sub-micrometre-sized particles
Particle number concentrations were measured in situ in 1 Hz resolution by means of a four-channel condensation nuclei (CN) counter COPAS (COndensation PArticle counting System; see Weigel et al., 2009). For reduction in the statistical noise, the COPAS 1 Hz raw data (direct signal of the scattered-light detectors) are preprocessed by applying a 15 s running average. Three of the four COPAS channels operate with different 50 % detection particle diameters dp50 (i.e. 6, 10, and 15 nm). The fourth COPAS channel (with dp50 = 10 nm) detects particles downstream of a heated (270 ∘C) sample flow line, resulting in measured particle mixing ratios of non-volatile (nv) particle residues or refractory particles (e.g. soot, mineral dust, metallic particle material, etc.).
2.2 COPAS operation during StratoClim 2017
The sampling is carried out via the forward-facing aerosol inlet of COPAS well outside the boundary layer of the aircraft. For stratospheric particle concentrations, the COPAS measurement uncertainty in the StratoClim 2017 data discussed herein is about 15 %, which is due to particle counting statistics and uncertainties in the volume flow. The measurement properties of COPAS are described in detail by Weigel et al. (2009), and its performance has been demonstrated by several studies (Curtius et al., 2005; de Reus et al., 2009; Borrmann et al., 2010; Frey et al., 2011; Weigel et al., 2011, 2014).
Table 1Pressure-dependent corrections κL for number concentrations of nucleation-mode particles due to particle losses () in the aerosol line configuration (both COPAS instruments attached to a single aerosol inlet) as deployed during StratoClim 2017 by using the particle loss calculator (von der Weiden et al., 2009) modified for low-pressure applications; κL = ), corresponding to Weigel et al. (2009).
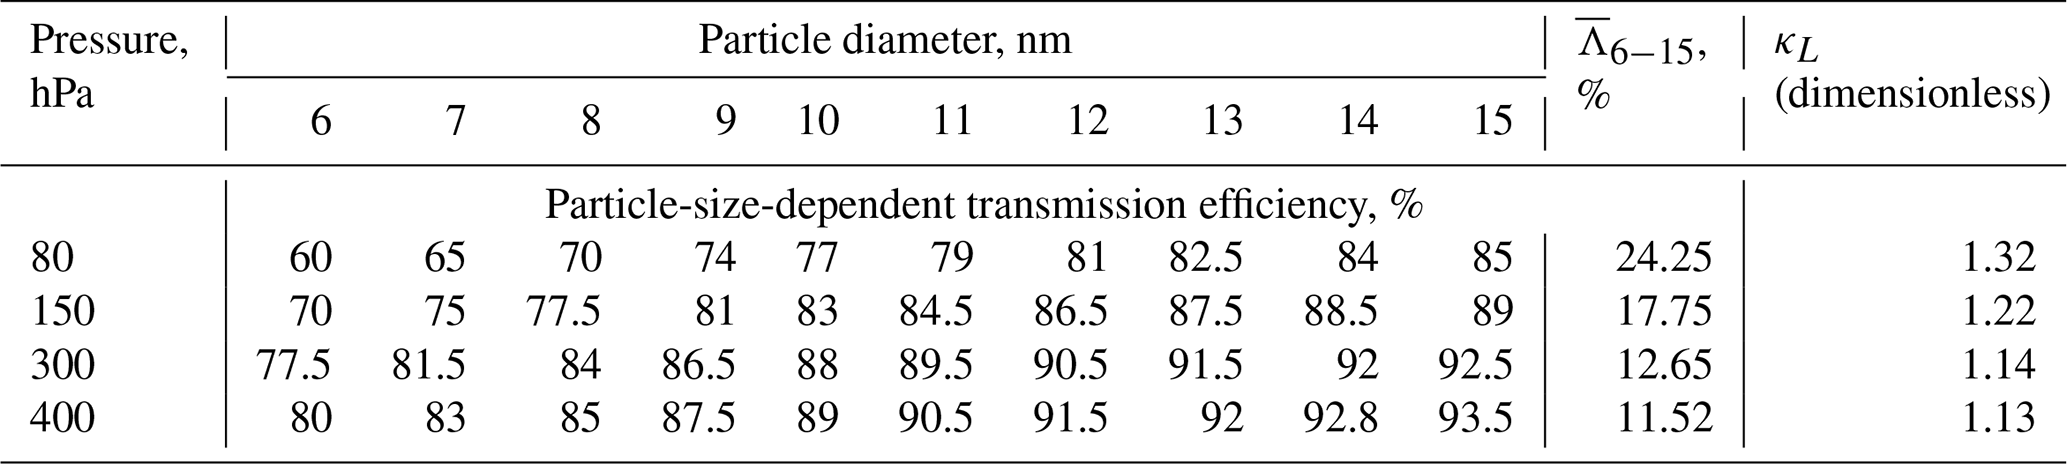
For StratoClim 2017, a new inlet configuration was used, allowing both COPAS instruments to sample through a single aerosol inlet, resulting in an almost doubled flow velocity through the sample tubes and reduced diffusional particle loss. This set-up required the reanalysis of the corrections to account for particle loss (Table 1) using the method introduced by von der Weiden et al. (2009) with modifications for low-pressure application. One of the four COPAS channels detects particle number densities of non-volatile particle residues downstream of a heated stainless steel tube (at ∼ 270 ∘C) (Appendix A).
2.2.1 NPF identification: definitions and notations
The particle densities are typically measured by COPAS in particle number concentrations N (in cm−3; ambient conditions) but are also presented here as mixing ratio n in units of particles per milligram of air (mg−1) for consistent comparisons of measurements from different pressure levels and for correlations with the mixing ratios of gaseous tracers. Hereafter, the notation n10 refers to the mixing ratio of sub-micrometre-sized particles with diameters greater than 10 nm. The measurement of n6 (of particles with dp > 6 nm) and n15 (dp > 15 nm) allows for the identification of recent NPF. The notation n10nv refers to the mixing ratio of non-volatile particles (Appendix A) with corresponding size range as specified for n10. The proportion f of non-volatile particles is given as the ratio in per cent.
Elevated number concentrations Nnm of nucleation-mode particles (defined as ) serve as an indication of recent NPF when additionally the NPF criterion (Eq. 1) is met:
This criterion was reassessed for the StratoClim 2017 data set based on the definition used by Weigel et al. (2011) to account for the COPAS detectors' signal-to-noise ratio and the counting statistics. The NPF criterion therefore sets a conservative threshold (Weigel et al., 2011) that additionally accounts for the full range of data scattering (i.e. 20 % over periods of invariable N) that exceeds the 15 % uncertainty in the concentrations measured with COPAS. The strict criterion suppresses artificial features that mainly result from the scattering of the measured concentrations, and the criterion constrains the data set to the most significant of those that were interpreted as NPF events. Calculated N6−15 values are then corrected concerning particles' diffusional loss inside the aerosol lines as described in Sect. 2.2 (see also Table 1). The calculated number concentrations N6−15 are corrected by multiplying the factor κL (Table 1), which is a function of the static pressure during the measurements.
Provided that the NPF criterion is met, a series of measurement points is denoted as an NPF event if the measured number concentration (or mixing ratio) of nucleation-mode particles remains continuously greater than zero for at least 5 s of measurement. In total, 25 cases out of 130 individual events had a duration of less than 5 s; therefore for these 25 cases the number of newly formed particles and the feature duration are uncertain. Mainly those features that are much too short (e.g. lasting only 1 s) are filtered out by applying the NPF event definition. Based on the mean airspeed and maximum ascent and descent rates of the M-55 Geophysica (∼ 154 ± 39 m s−1, up to 10 m s−1), this definition implies that a feature of elevated Nnm lasting over 5 s extends over a horizontal distance of ∼ 770 m (at constant course) or vertically up to 50 m.
The period of flight time during which the event criterion (Eq. 1) is met is referred to as the NPF event duration. From this information, the mean airspeed is used to infer the horizontal extent of NPF fields – with caveats. Such estimates are limited by the assumption that an encounter of elevated Nnm (over tens of seconds and minutes) is actually due to a single NPF event and does not consist of a series of possibly overlapping events. In addition, the determined horizontal distances refer to an average flight speed (∼ 154 ± 39 m s−1), and the flight attitude is assumed to be unchanged during the event duration.
NPF events are distinguished by the peak number density of detected nucleation-mode particles and are denoted as
-
intense (often used synonymously with most recent NPF) if nnm exceeds 10 000 mg−1
-
intermediate for NPF with 1000 mg−1 < nnm < 10 000 mg−1
-
weak NPF when detected nnm remained below 1000 mg−1.
This classification refers to laboratory studies by Kirkby et al. (2011) and Kürten et al. (2016), according to which the NPF rate and the NPF intensity (i.e. its new particle productivity) vary with the degree of supersaturation of the vapour from which the new particles form. Due to the short persistence of the freshly formed particles in the nucleation mode (see Sect. 4.5), an intense NPF event is still proceeding when observed, or it had phased out very recently (within hours) before the detection. For encounters of weak or intermediate NPF the conclusions concerning the event's age remain ambiguous.
2.3 Particle size distributions from the ultra-high-sensitivity aerosol spectrometer UHSAS-A
The measurements of the aerosol particle size distributions during StratoClim 2017 were performed with an in-house-modified airborne version of the ultra-high-sensitivity aerosol spectrometer (UHSAS-A; DMT Inc., Longmont, CO, USA). The modifications on the flow and pumping system of the UHSAS-A enabled the maintenance of constant system flows (sample, sheath, purge flow) through the instrument even under ambient pressures as low as 50 hPa. Details concerning the modified airflow system of the UHSAS-A, the characterisation of the instrument's particle sizing performance, and its calibration during the campaign period are provided by Mahnke et al. (2021). The uncertainty in the number concentration measured by the UHSAS-A with 1 Hz resolution was determined to be ∼ 10 % for the particle diameter range of 65 nm < dp < 1000 nm, based on laboratory characterisations of the sample flow measurement and of the counting efficiency of the instrument (Mahnke et al., 2021). Due to the unknown in-line temperature of the sample and the wide ambient temperature range throughout StratoClim 2017, a maximum uncertainty in the UHSAS-A measurements is estimated at 25 %. Some of the results from the measured particle size distributions and a comparison with other instruments and the Cloud-Aerosol Lidar with Orthogonal Polarization (CALIOP) are presented by Mahnke et al. (2021).
2.4 Carbon monoxide (CO) measurements
During the StratoClim 2017 mission, CO mixing ratios were determined by means of the tunable diode laser (TDL) detection principle, which the Carbon Oxide Laser Detector-2 (COLD-2) spectrometer is based on. According to comprehensive comparisons to the previous instrument version COLD (Cryogenically Operated Laser Diode; 4 s temporal resolution; Viciani et al., 2008), the new system implies several improvements (Viciani et al., 2018). The measurement's temporal resolution is improved by a factor of 4, the in-flight sensitivity of the COLD-2 spectrometer is about 2 nmol mol−1 at integration times of 1 s, and an accuracy of 3 % is specified for the CO measurement with COLD-2 (Viciani et al., 2018).
2.5 Meteorological measurements
Atmospheric temperature and pressure data were taken from the Unit for Connection with the Scientific Equipment (UCSE; Sokolov and Lepuchov, 1998), which is a part of the avionic system of the M-55 Geophysica. UCSE data are available as 1 Hz resolved ambient pressure (accuracy: ± 1 hPa) and temperature (± 2 K accuracy). Based on these UCSE data, the potential temperature θ along the mission flight tracks is calculated in compliance with the definition by the World Meteorological Organization (WMO, 1966). For the given vertical temperature gradients and for the θ range over which the StratoClim 2017 flights extended (i.e. up to ∼ 477 K), the WMO-recommended calculation of θ differs at the most by up to ∼ 1 K from the values obtained when using the recently reappraised θ calculation (Baumgartner et al., 2020).
3.1 The height of the lapse-rate tropopause and the equivalent latitude
Meteorological data were also taken from ERA-Interim reanalyses by the European Centre of Medium-Range Weather Forecasts (ECMWF) (Dee et al., 2011). Hybrid reanalysis levels in the TTL are located at various pressure heights (i.e. around 177, 154, 133, 113, 96, 80, 67, and 55 hPa, respectively) representing a vertical resolution of about 1 km in this region.
The aircraft data are analysed in coordinates relative to the tropopause height and to the monsoon anticyclone centre, respectively. The height of the lapse-rate-based thermal tropopause was determined based on ERA-Interim data and following the WMO criterion (WMO, 1957). The potential temperature θ at tropopause level was interpolated to the 1 Hz resolved position along the flight track of the M-55 Geophysica, and the measurement data were sorted as a function of θ distance (Δθ) to the local tropopause as a vertical coordinate.
The centre of the AMA was determined based on the anomalous potential vorticity distribution within the monsoon region at the 380 K potential temperature level, where lowest values of the potential vorticity (PV) are found in the AMA centre. The AMA-centred equivalent latitude was calculated for a given closed PV contour as a projection onto polar coordinates (Ploeger et al., 2015). An equivalent latitude of 90∘ N corresponds to the centre of the anticyclone (lowest PV), and the equivalent latitude decreases with increasing distance from the centre, or rather, towards the anticyclone's edge. Note that the calculation of AMA-centred equivalent latitude is valid within a layer of about ± 10 K around 380 K potential temperature, where a clear negative PV anomaly occurs. The uncertainties in calculated equivalent latitude become significant at levels beyond the ± 30 K range above or below 380 K.
3.2 The coagulation model for investigating the particles' persistence in the nucleation mode
The model employed in this study numerically solves the discretised coagulation equation (e.g. Jacobson, 2005, and Eq. 15.2 therein) as formulated in the numerical chemistry–climate model SOCOL (SOlar Climate Ozone Links; Stenke et al., 2013). For the coagulation of nucleation-mode aerosol particles the Brownian coagulation kernel (Jacobson, 2005, Eq. 15.33 therein) is used. The particles are assumed to be spherical, and the model is based on a discretisation of the volume space, wherein the ratio of two subsequent volume size bins is constant, . The particle size range of the first volume size bin V1 corresponds to particle diameters of 7.5 nm < dp,1 < 8.5 nm. With a total number of 40 size bins, the largest particle size included in this investigation is about 635 nm ().
The coagulation rate and thus the persistence of the nucleation-mode particles were simulated under given background conditions during observation. As input for the simulation, the aerosol size distribution detected by the UHSAS-A (nominally covering 65 nm < dp < 1000 nm; see Sect. 2.2 and Mahnke et al., 2021) was extended towards smaller diameters by further particle size bins obtained from the measurements with COPAS. For the simulation presented herein, the NPF event on 4 August 2017 (KTM 5) over 26 s between 04:04:40 and 04:05:06 UTC (pressure altitude: 110 hPa; ambient air temperature: 196 K) was selected. Each of the two size intervals of the COPAS measurements in the nucleation mode, i.e. 6 nm < dp < 10 nm and 10 nm < dp < 15 nm, is divided into three subintervals to adapt to the higher particle size resolution of the coagulation model. The three sub-bins within the size classes 6–10 and 10–15 nm were uniformly set to one-third of the respective concentrationN6−10 and N10−15. The difference between the total number concentrations N15 (COPAS) and N65 (UHSAS-A) yields the number concentration of N15−65. The number concentration N15−65 (∼ 5000 cm−3) was interpolated over 13 sub-bins (with exponential degradation on increasing particles size) such that the size distribution exhibits a continuous transition towards the detection size range of the UHSAS-A. The size-segregated aerosol concentrations measured with the UHSAS-A were interpolated (with respect to particle size) to the resolution of the remaining 21 sub-bins of the coagulation simulation. The particle concentrations N(dp) over the entire particle size range from the nucleation-mode sizes up to dp = 1 µm were converted into an aerosol size distribution in cm−3 as a representation of an initial state and input for the coagulation simulation (for more details see the results in Sect. 4.5).
It is worth noting that for the coagulation simulation, the NPF event is considered to be expired; i.e. any fresh supply of nucleation-mode particles due to continuous or renascent NPF is excluded for the simulated runtime of the coagulation process over 24 h. Generally, constant conditions of atmospheric pressure (p) and temperature (T) are assumed over the 24 h period for the simulation as the air is lifted very slowly at TTL levels within the AMA (by ∼ 1 K potential temperature per day, corresponding to Δp ≈ 1–1.5 hPa and ΔT < 1 K d−1; see Vogel et al. 2019).
3.3 Analyses of trajectories and the air mass transport history
Backward trajectories of 50 d were calculated for each sampling position along Geophysica's flight track in 1 Hz resolution during the StratoClim 2017 mission using the trajectory module of the Chemical Lagrangian Model of the Stratosphere (CLaMS; McKenna et al., 2002; Konopka et al., 2012; Pommrich et al., 2014) driven by horizontal winds from ERA5 reanalysis (Hersbach and Dee, 2016). With the vertical resolution of the ERA5 data, a much better representation of convective updraught and tropical cyclones is realised (Hoffmann et al., 2019) compared to earlier reanalyses (Dee et al., 2011), in particular in the region of the Asian summer monsoon (Li et al., 2020). Further detailed validation of the very new ERA5 products is required, so ERA interim reanalyses still represent the state of the art until ERA5 becomes the new standard.
For vertical air mass transport velocities, the diabatic approach was applied using the total diabatic heating rate to extract the vertical velocity, thereby including the release of latent heat (for details, see Ploeger et al., 2021).
The CLaMS backward trajectory calculations, which were initialised from each sampling position along the flight track in 1 Hz resolution, were used to allocate the air's latest contact with the model boundary layer at 2–3 km above the ground. This allows for the investigation of the location of sources which influence the mixing ratios in the air samples taken aboard the M-55 Geophysica.
3.4 The age of air since release from convective outflow
The history of a convective air mass is analysed by making use of the TRACZILLA Lagrangian model (Pisso and Legras, 2008), which is a variation in FLEXPART (Stohl et al., 2005). The simulations were based on the release of a cluster of 1000 back trajectories, representative of a generic aerosol tracer, each launched from a 1 s resolved time step along the flight path. The trajectories were traced back over a period of 30 d in the geographical domain (between 10∘ W and 160∘ E and between the Equator and 50∘ N, respectively). The meteorological fields (horizontal winds and radiative heating rates) are taken from ERA5 reanalyses. The convective influence is then distinguished from uninfluenced cases by high-frequency images (one image per 10–15 min) of cloud top altitudes from the geostationary satellites MSG1 and Himawari (for details see Bucci et al., 2020).
Investigations by Weigelt et al. (2009) previously approached the influence of convective cloud processes on the number concentrations of aerosols and in particular of nucleation-mode particles in the upper troposphere. In the present study, the convective sources were identified as such if the course of a TRACZILLA-modelled trajectory within a certain geographical area is found below the cloud top level, as similarly done by Tzella and Legras (2011) and Tissier and Legras (2016). It is noteworthy that, while the adopted trajectory method bypasses the uncertainties related to the convective representation in the reanalysis by using observation-based information on the convective events, uncertainties still remain. Those arise mainly from uncertainties in the identification of the cloud top from image data of geostationary satellites, the impossibility of accounting for the entrainment–detrainment-processes, and reanalysis-related uncertainties concerning advection (for more details see Bucci et al., 2020). In the presented analysis, the air mass age is computed as the difference between the time of release of the cluster and the convective cloud crossing. Since the trajectory cluster can spread in space and bring different contributions from different regions, only the mean age from the dominant convective source (i.e. the mean age from the regions with the highest percentage of convective cloud crossings) is considered in this analysis.
Figure 1 shows the flight tracks of the eight mission flights conducted during StratoClim 2017. The vertical indices (visible in Fig. 1b) highlight the flight sections where significantly increased mixing ratios of nucleation-mode particles nnm were encountered, which are attributable to NPF. NPF of varying intensity occurred near or above the southern flank of the Himalayas (features over Nepal and towards north-eastern India) and at a distance of more than 500 km away from the mountains (near the coastline of Bangladesh or the north-eastern Indian coast towards the Sea of Bengal). Of the entire COPAS measurement time (∼ 22.5 h), at altitudes above 10 km (350 K potential temperature) about one-third (i.e. ∼ 9 h) of the air samples were taken north of 26∘ N, i.e. mainly in the immediate vicinity of the Himalayas, over Nepal, and neighbouring areas of north-eastern India. Hence, over the period of the StratoClim field mission during the 2017 monsoon season, the main transport of NPF precursor material into the UTLS was by convection above the foothills of the Himalayas. The present study aims at a classification of encountered NPF events with regard to
-
the height intervals and geographical positions of NPF observations
-
the time limits (event duration and time of occurrence)
-
spatial dependencies with regard to tropopause height and AMA geometry
-
the relationship between NPF and the air's origin and age.
It is noteworthy that, during StratoClim 2017, NPF was frequently observed in the presence of ice cloud particles at the bottom TTL of the AMA. The conditions under which in-cloud NPF occurred during StratoClim are discussed in Weigel et al. (2021). Since the NPF turned out to be almost undisturbed by the presence of cloud elements (until a certain number density and size of the ice particles are reached), for the present study the NPF encounters remain undifferentiated concerning clear-air or in-cloud conditions.
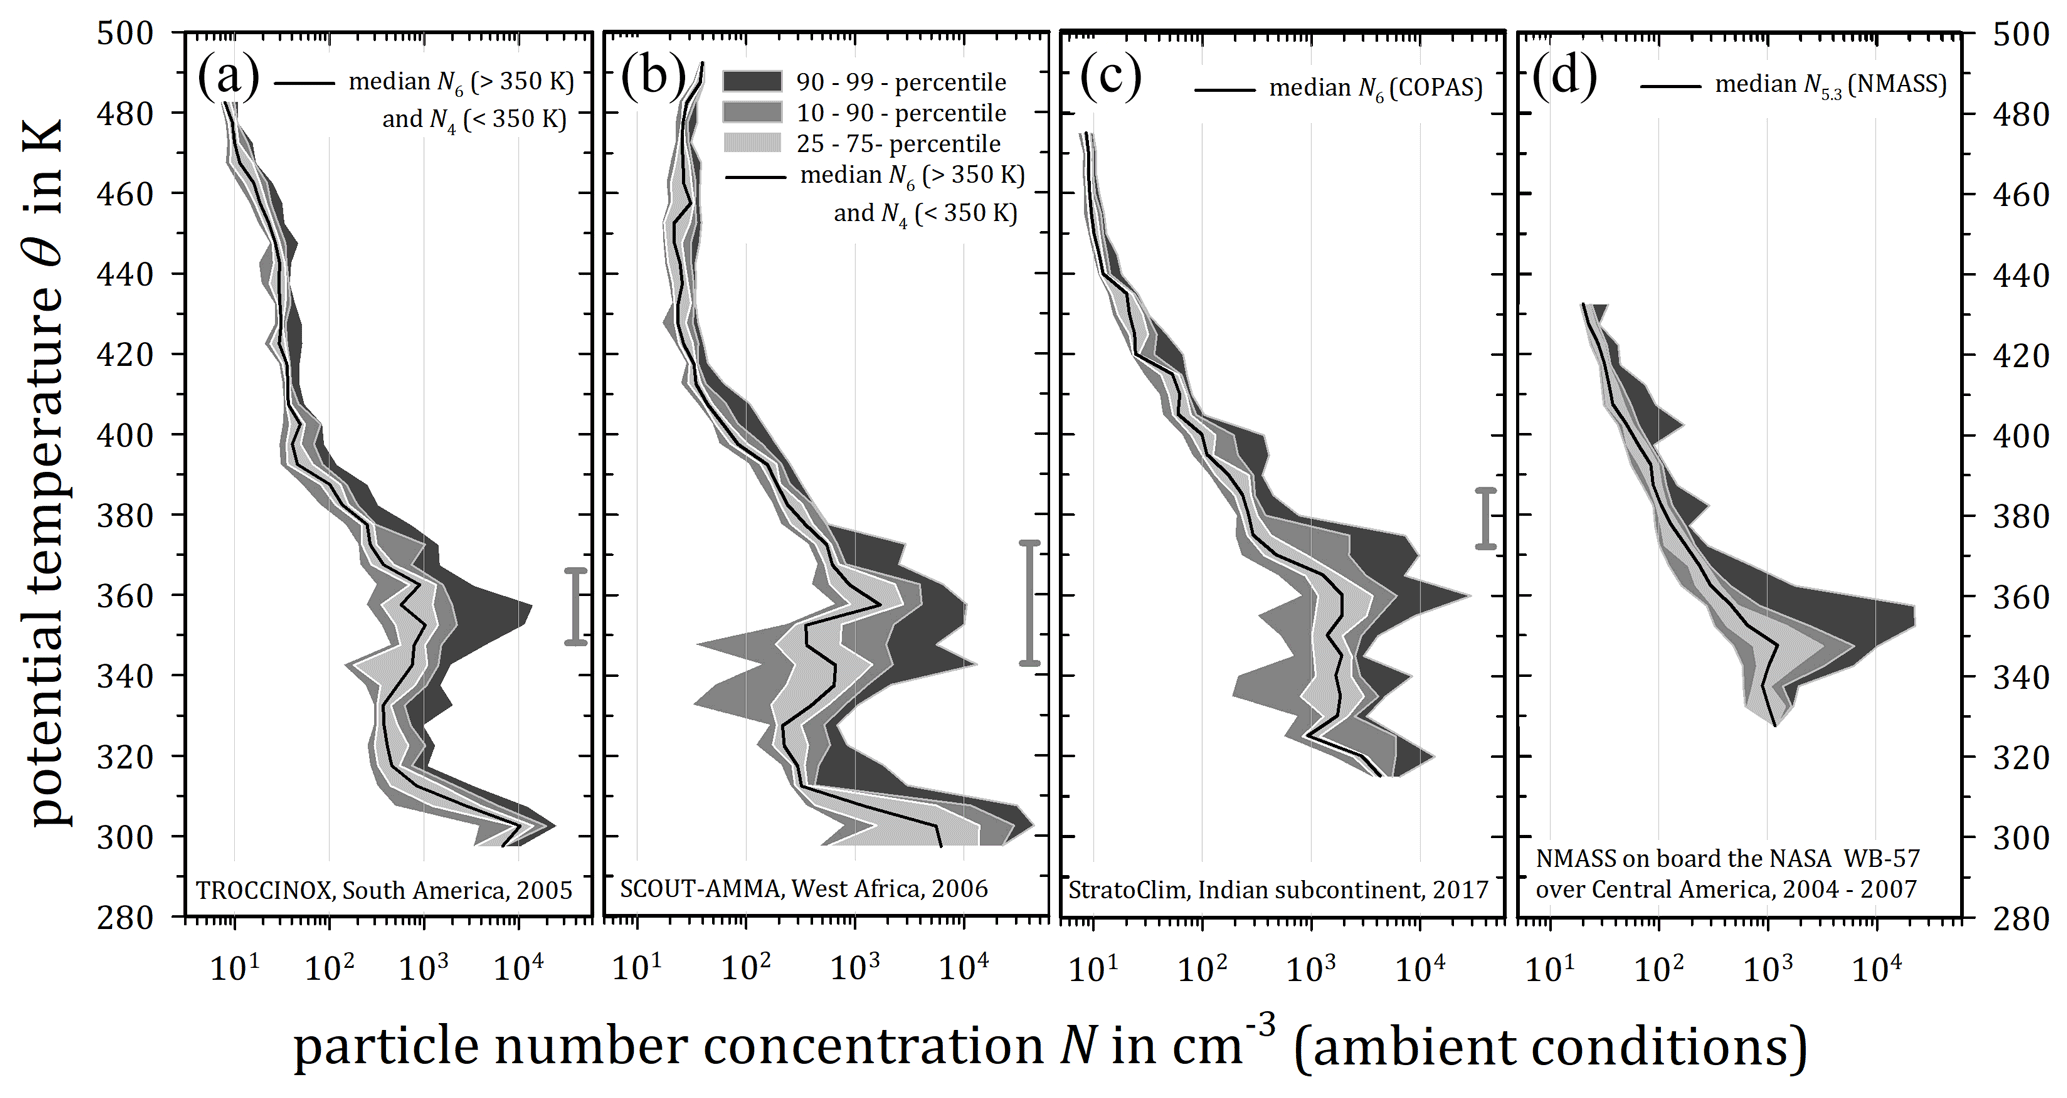
Figure 2Synopsis of vertical profiles of the total number concentration (median with 10th, 25th, 75th, 90th, and 99th percentiles) of sub-micrometre-sized particles as a function of potential temperature obtained from condensation nuclei (CN) detections over (a) Brazil (TROCCINOX, 2005), over (b) West Africa (SCOUT-AMMA, 2006), and over (c) the Indian subcontinent (StratoClim 2017). During TROCCINOX (a) and SCOUT-AMMA (b) the number concentrations N4 at lower heights (θ < 350 K) were measured aboard the DLR Falcon 20 (cf. Borrmann et al., 2010, and Weigel et al., 2011). All high-altitude measurements (θ > 350 K) from the M-55 Geophysica and the entire StratoClim 2017 data set result from COPAS measurements. (c) The median profile of N5.3 from repeated measurements (over the years 2004–2007) with the NMASS multi-channel CN counter over Central America (aboard the NASA WB-57F; data courtesy of J. C. Wilson, Denver University, 2011). All number concentrations are given at ambient conditions.
4.1 Vertical distribution of particle number concentrations with respect to observations in different tropical regions
Vertical profiles of the total particle number concentration obtained from various field campaigns in the tropics are shown as medians with percentiles in Fig. 2. The vertical CN profiles from tropical regions of South America and West Africa (TROCCINOX, 2005; SCOUT-AMMA, 2006; Fig. 2a and b) exhibit merged data of two independent CN detectors with individual dp50 (i.e. N6 for θ > 350 K and N4 for θ < 350 K), which were deployed on individual aircraft, the M-55 Geophysica and the DLR Falcon 20 Borrmann et al., 2010; Weigel et al., 2011). The dark shaded areas of the vertical profiles illustrate the scatter of number concentrations between the 90th and 99th percentiles. At tropopause altitudes around 380 K (indicated by vertical bars), or rather at the bottom TTL, the variability in detected concentration reaches a maximum between the 90th and 99th percentile. The increased data scatter indicates the influence of NPF on the class of sub-micrometre-sized particles at these TTL levels, resulting in increased and fluctuating particle number concentrations due to the variable production rate of particles by NPF (see Sect. 2.2.1). Exclusively above the tropopause within the AMA (Fig. 2c), the scatter of the concentration values of sub-micrometre-sized particles remains elevated up to heights of ∼ 400 K potential temperature. Up to this point within the AMA, the scatter of the peak number concentrations (90th to 99th percentile range) is significantly increased in reference to the median values, while in other regions above the tropopause (Fig. 2a and b) the profiles of aerosol concentrations show a smoother transition into the stratosphere.
For comparison (Fig. 2d), particle number concentrations N5.3 are compiled as a vertical median profile (with percentiles) obtained from airborne measurements with the nuclei-mode aerosol spectrometer (NMASS; Brock et al., 2000) during several years (2004–2007, including winter and summer season) over Central America. These observations differentiate the bottom TTL (here 350–379 K) as the region where NPF predominantly occurs with the largest impact on the fine-mode (sub-micrometre-sized) aerosol particle concentration (e.g. Borrmann et al., 2010; Weigel et al., 2011). However, this vertical profile (Fig. 2d) illustrates additional features at altitudes above the mean tropopause altitude (assumedly located at ∼ 380 K). The locally increased concentrations with respect to the median become apparent at ∼ 380–390 and at ∼ 400–410 K, respectively. Above tropopause levels, significantly increased number concentrations of fine-mode particles, potentially caused by local NPF, were observed over both Central America (Fig. 2d) and the Indian subcontinent within the AMA (Fig. 2c).
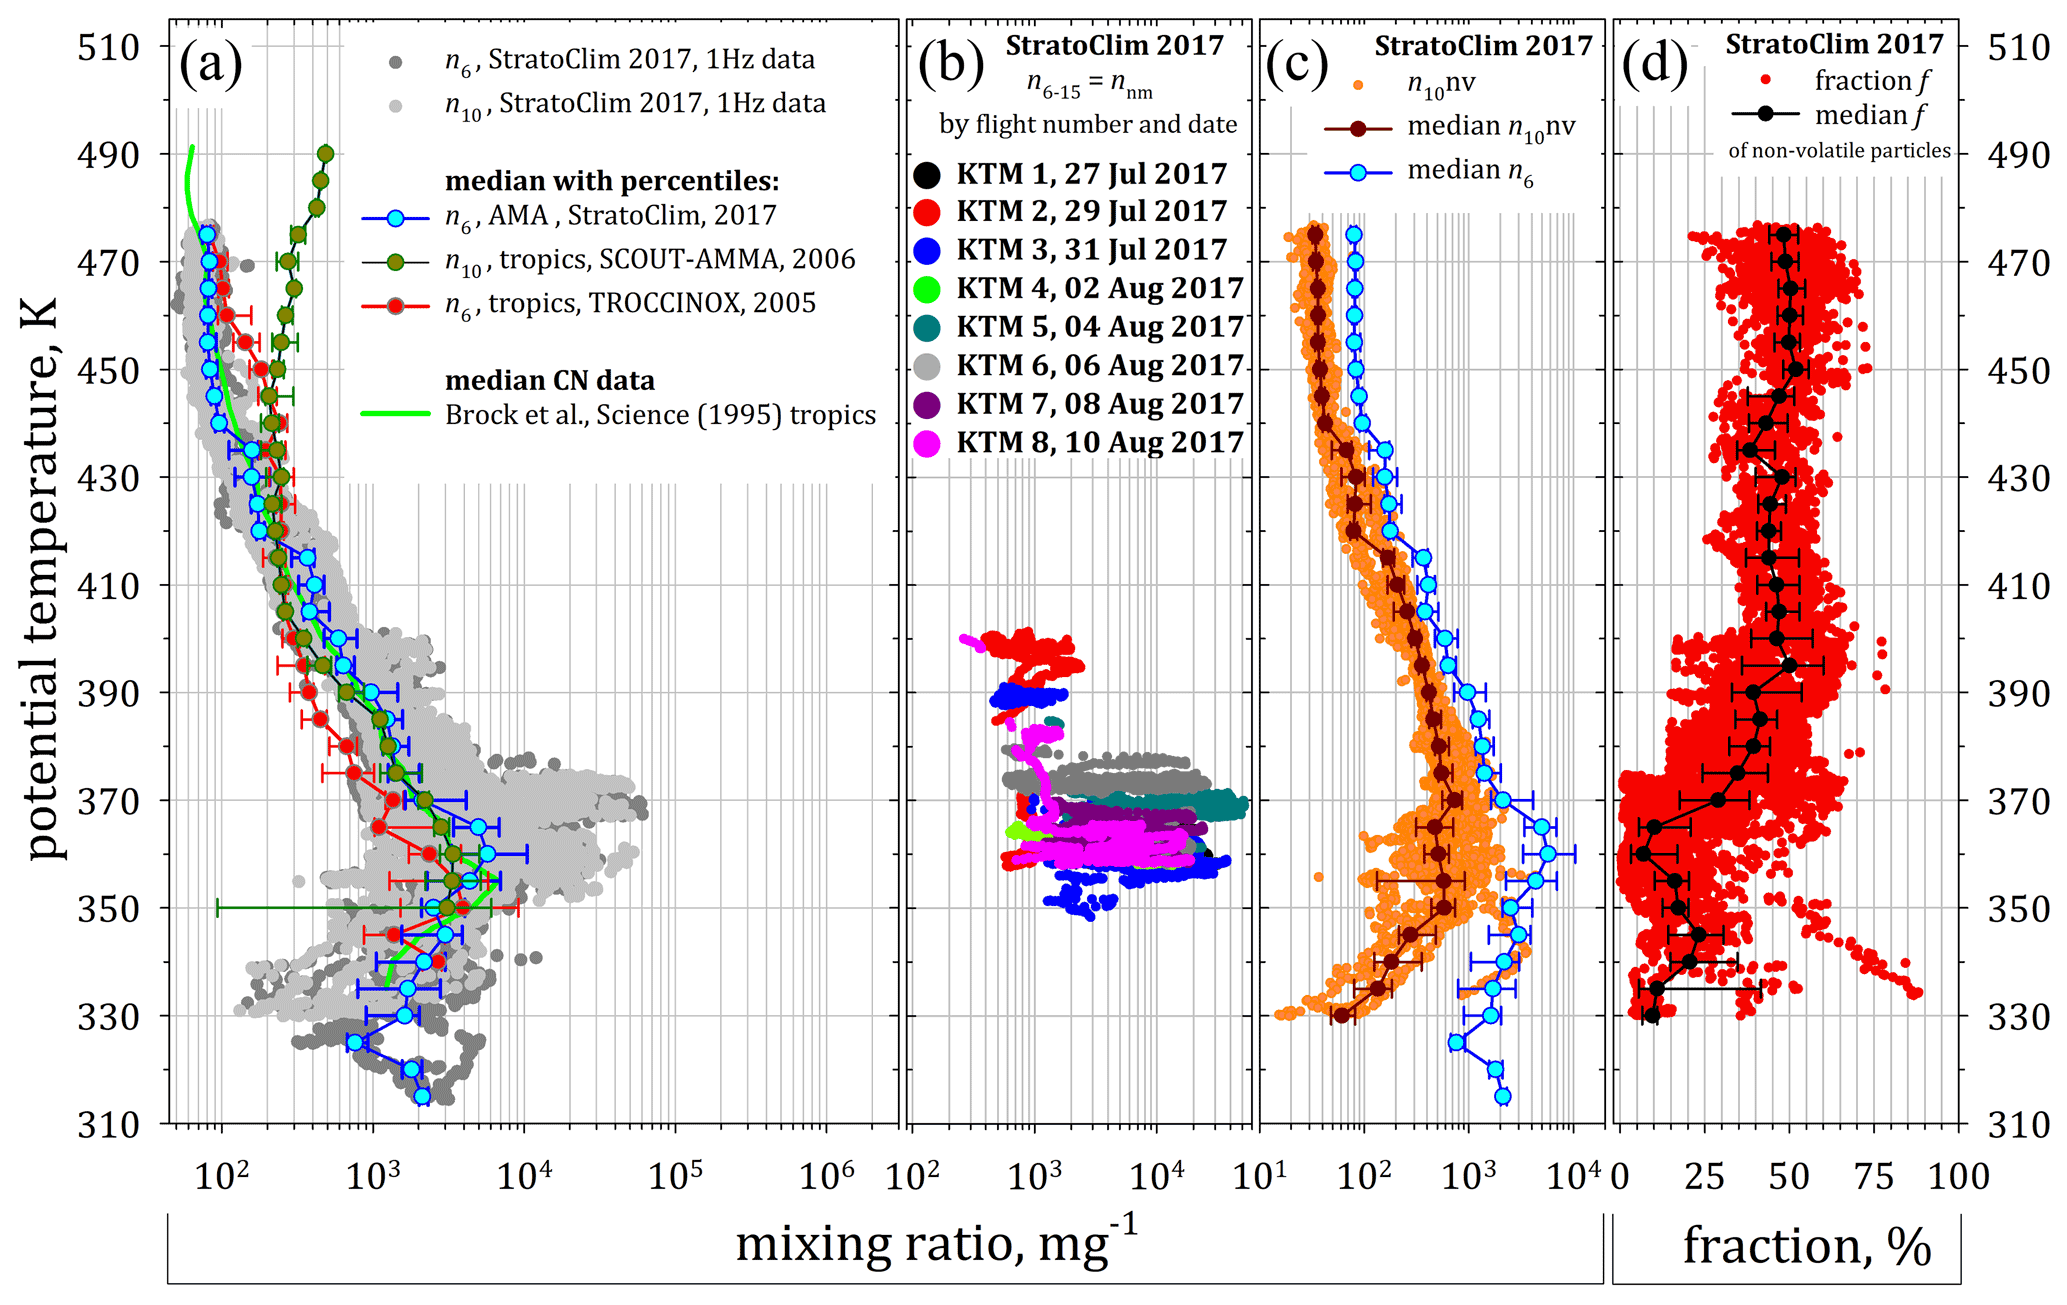
Figure 3(a) 1 Hz resolved particle mixing ratios n6 and n10 (grey shaded COPAS data points) with n6 median profile from StratoClim 2017 together with COPAS data from other tropical regions (over Brazil – TROCCINOX, 2005 – and over West Africa – SCOUT-AMMA, 2006; cf. Borrmann et al., 2010). The median profile of measurements in the tropics over the Americas (Brock et al., 1995) is coloured in green. (b) The vertical distribution of the mixing ratio of nucleation-mode particles (nnm = n6−15) in compliance with the NPF criterion (see Sect. 2.2.1). (c) The 1 Hz resolved mixing ratio of non-volatile particles (i.e. thermostable at ∼ 270 ∘C) from COPAS measurements throughout StratoClim 2017 with corresponding median profile, including 25th and 75th percentile. Herein, the n6 median profile is implied from (a) for comparison. (d) The fraction f () of non-volatile particles with median and with 25th and 75th percentiles.
4.2 Mixing ratio of sub-micrometre particles, abundance, and fraction of refractory particles from StratoClim 2017 observations
The entire StratoClim 2017 data set of measured (1 Hz resolved) particle mixing ratios n6 and n10 is summarised in Fig. 3a as a function of potential temperature. The resulting median profile n6 of the StratoClim 2017 measurements is shown with the 25th and 75th percentile (blue profile). This allows for a direct comparison with the corresponding median profiles from earlier COPAS measurements at tropical regions (in red: TROCCINOX, Brazil, 2005; in dark green: SCOUT-AMMA, West Africa, 2006; cf. Borrmann et al., 2010 and Weigel et al., 2011). Figure 3a also includes the median vertical profile of the mixing ratios of fine-mode particles (bright-green line), which was obtained from measurements over the central Pacific, at tropical latitudes (Brock et al., 1995).
The profiles (n6, n10, and nnm in Fig. 3a and b) are structured as
-
∼ 350–380 K – characterised by the largest scatter of the particle mixing ratios and the highest values of up to 5 × 10⁴ mg−1, thus representing the height level of the profile's maximum;
-
∼ 380–415 K – where the scatter of the particle mixing ratios is still increased though less prominent;
-
above ∼ 415 K – characterised by a comparatively weak but extant scatter level of particle mixing ratios, which also includes features of the median n6 profile at 410–415 K within the AMA.
The course of the median profiles exhibits similar characteristics. The common feature of all median profiles from the tropics is their maximum at about 350–360 K, while the AMA observations indicate a corresponding maximum at slightly higher altitudes (i.e. 355–365 K). Further aloft, the particle mixing ratios obtained from different locations decrease with altitude on a similar gradient. In the altitude range between 360 and 400 K, the tropical data obtained over South America (red) constitute the lowest particle mixing ratios (by median values), whereas all other profiles are almost in line with each other up to 400 K. The vertical median profile of particle mixing ratios determined in the AMA (blue) during StratoClim 2017 exhibits the highest mixing ratios at each height level up to ∼ 415 K. Additionally, the AMA profile features a substantial increase in the median mixing ratio at altitudes of ∼ 410–415 K, where the values exceed those from the tropical regions by about 35 %. Above 415 K, the continuation of the tropical profiles from West Africa and Central America (coloured green) with altitude is largely consistent with the particle mixing ratios measured throughout StratoClim 2017, while at these altitudes the measurements from South America (red) show comparatively increased values. Above 440 K, the particle mixing ratio over West Africa (dark green) significantly deviates from those of all other vertical profiles, as is visible from the gradual increase in the particle mixing ratio with altitude. This deviation was attributed to the influence of the high-reaching volcanic injections of the Soufrière Hills (Borrmann et al., 2010). The 1 Hz resolved StratoClim 2017 data (grey dots in Fig. 3a) are added to the graph to illustrate how the scatter of measured particle mixing ratios relates to corresponding median profiles.
Figure 3b shows the vertical distribution of the mixing ratio of the nucleation-mode particles nnm (see Sect. 2.2.1). The flight-by-flight colouration of the data points indicates that increased nnm values were observed during each of the eight StratoClim 2017 mission flights. In addition, Fig. 3b shows the wide range of altitudes over which the layers of increased nnm were observed during the individual flights. Remarkably increased values of nnm were detected up to altitudes as high as 400 K.
Figure 3c depicts the 1 Hz resolved mixing ratios of the non-volatile particles n10nv (see Appendix A) as well as the resulting median profile of n10nv with the 25th and 75th percentiles. Figure 3c additionally shows the median profile of n6 as in Fig. 3a, which illustrates the vertical progression of n10nv in direct relationship to the NPF-influenced total particle mixing ratio. Figure 3d illustrates the vertical distribution of the fraction f of non-volatile particles, i.e. the ratio (see Sect. 2.1.2), which is presented in 1 Hz resolution, as well as the profiles of resulting median with the 25th and 75th percentiles. At lower altitudes (< 350 K), the mixing ratio of non-volatile particles appears low with a relatively large scatter. The local minima of the n10nv profile and of the fraction f coincide with the local maximum of n6 (i.e. ∼ 355–375 K). Above 370 K, the n10nv profile follows the general decline with height. Above 390 K, both mixing ratios (n6 and n10nv) decrease uniformly, and the fraction f remains almost constant at ∼ 45 %–50 % up to altitudes of 430 K. Towards 435 K, the total mixing ratio n6 nearly stagnates, whereas n10nv exhibits slightly dropping mixing ratios.
In essence, the vertical profiles of the total particle mixing ratio n6 and those of the non-volatile particles n10nv are divided into three ranges:
- A.
At the bottom TTL region (θ < 375 K), both n6 and n10nv are mainly characterised by NPF, as indicated by the high mixing ratios of nucleation-mode particles nnm. NPF causes a significant addition to the scatter of the total mixing ratios towards high values, which exceed the median by more than 1 order of magnitude. In this altitude range, a local deficit of the non-volatile particle compounds favours the occurrence of NPF.
- B.
Further above, i.e. ∼ 375 K < θ < 415 K, continued albeit attenuated NPF is identified at tropopause levels within the AMA. The non-volatile-particle compounds (n10nv) slightly decrease compared to levels below 375 K. The fraction f, however, rises towards 40 %. Nevertheless, nnm values of 400–2000 mg−1 at heights of up to ∼ 400 K indicate sustainably effective NPF.
- C.
Above 415 K, the values of the total mixing ratio n6 approach previous observations (e.g. Brock et al., 1995). The scatter of n6 and n10nv is considerably decreased at these altitudes. NPF appears to have entirely abated since at these heights sufficiently high nnm values were not observed at all. The median proportion f of non-volatile particles remains at ∼ 40 %–50 % up to the highest altitude.
The steeply dropping vertical profile of the total mixing ratio of the sub-micrometre-sized aerosols above ∼ 415 K subtly indicates the upper limit of the AMA's influence on the vertical mixing of the UTLS. From the CO, ozone, and nitrous oxide content in air samples taken throughout StratoClim 2017, von Hobe et al. (2021) concluded that the AMA's interior was largely isolated from stratospheric in-mixing up to altitudes of 10 to 20 K above the tropopause (i.e. θ ≈ 400 K). Moreover, they found that mixing processes with stratospheric air are of increasing significance at levels between 400 and 420 K (von Hobe et al., 2021). At altitudes above θ ≈ 440 K, the median mixing ratios n6 exhibit a vertically stable continuation after another sharp drop between 435 and 440 K (Fig. 3a and b). Brunamonti et al. (2018) specified the 440 K level as the top of confinement (TOC) of the AMA for the 2017 monsoon season. So, according to this TOC definition, above 440 K potential temperature (≳ 18.5–19 km), the median n6 (Fig. 3a and b) represents stratospheric background values.
The ATAL (Vernier et al., 2011a; and see also Höpfner et al., 2019; Mahnke et al., 2021) is mainly attributed to the uplift of pollution from the boundary layer as concluded from balloon-borne and satellite-based observations (Vernier et al., 2018). The described drop in the aerosol concentration (Vernier et al., 2018) at potential temperatures of ∼ 400–420 K (well above tropopause levels) coincides with the uppermost altitude limit of main NPF activity at ∼ 400 K (∼ 17.5 km) observed during StratoClim 2017 (see Fig. 3). Here, the most substantial decrease in both mixing ratios n6 and n10nv was observed in transit from ∼ 410 to ∼ 415 K (at ∼ 18 km).
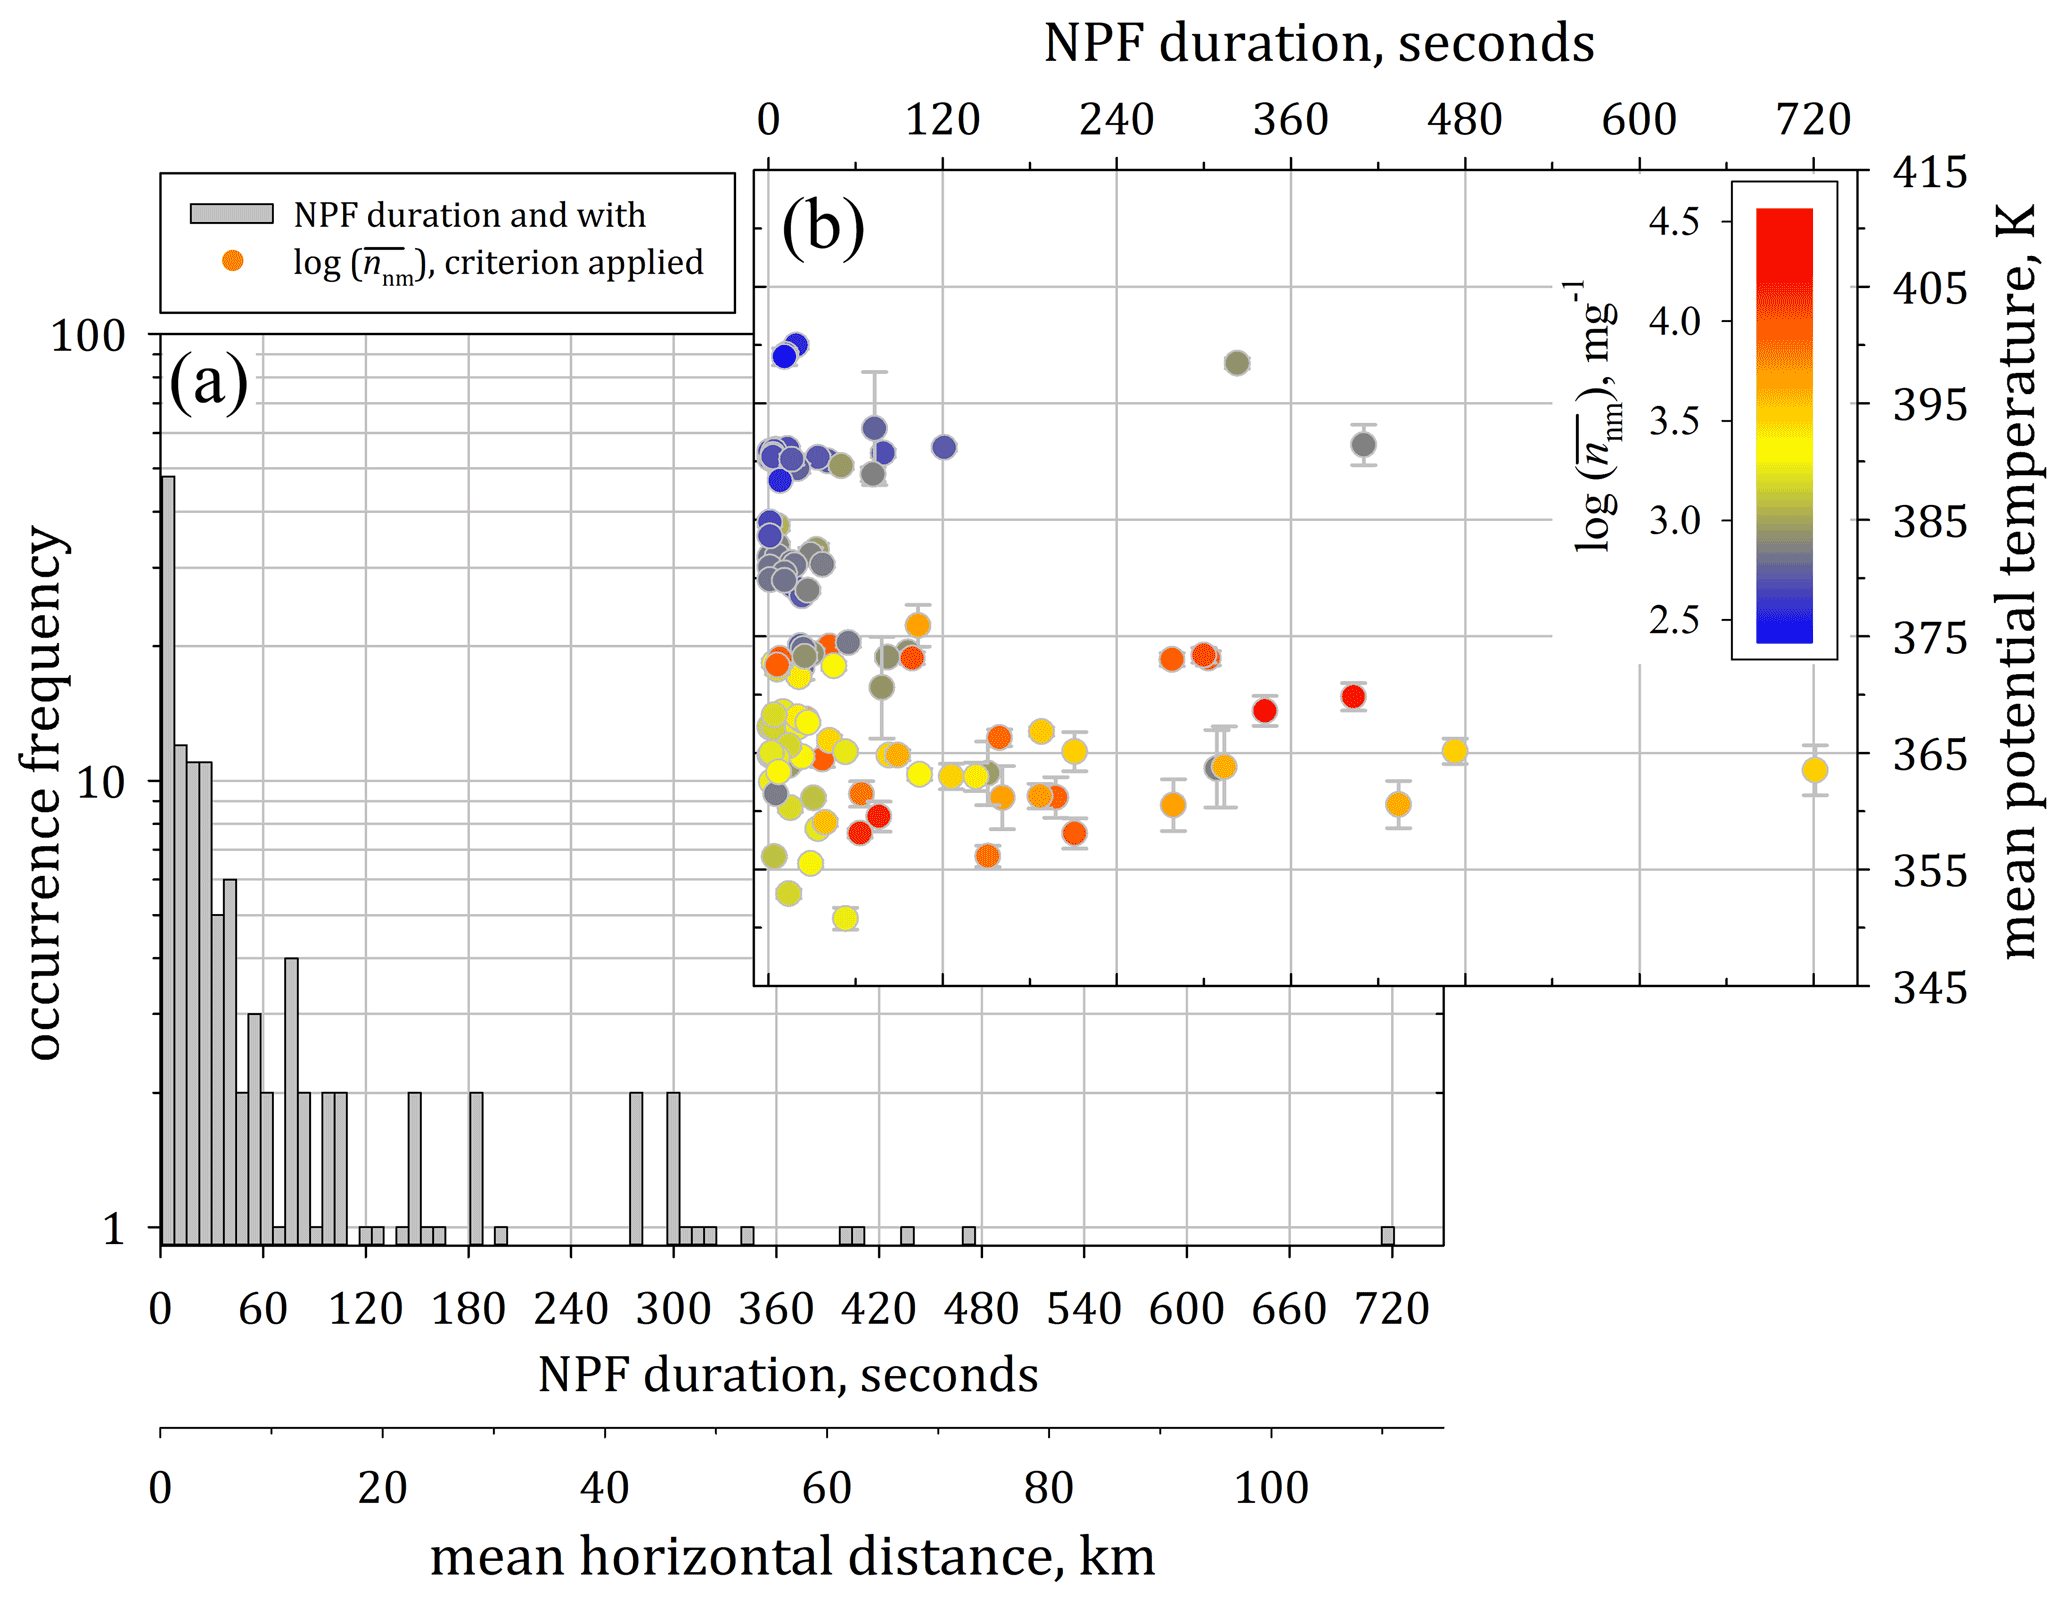
Figure 4Frequency of the duration of observed NPF events during the StratoClim 2017 mission (a) as the frequency distribution of the NPF duration and (b) as a vertical profile as a function of mean potential temperature and coloured with reference to the mean mixing ratio of the nucleation-mode particles.
4.3 Occurrence frequency of NPF events
Figure 4 shows the 130 individual NPF events sorted according to their duration. Based on the average flight speed (Sect. 2.2.1) and assuming a constant heading during flight, the mean horizontal distance per 10 s flight time spans about 1.5 km. The spatially most extended uninterrupted NPF signature throughout StratoClim 2017 spanned a mean horizontal distance of ∼ 110 km. The hitherto most extended NPF event observed with COPAS at TTL level over South America (Weigel et al., 2011) lasted over a continuous duration of 262 s (∼ 35.5 km of covered flight distance). Another three individual NPF events were observed above West Africa (Weigel et al., 2011) over 20, 83, and 98 s (∼ 3, ∼ 12, and ∼ 13 km), respectively. Approximately 45 % of 130 NPF events observed throughout StratoClim 2017 were of less than 20 s duration (∼ 3 km), while the majority (∼ 75 %) of NPF observations above the Indian subcontinent extended over less than 80 s (∼ 12 km; Fig. 4a). The vertical profile (Fig. 4b) shows that above 380 K, predominantly short events of less than 2 min duration with comparatively low mixing ratios nnm were encountered. Here, observed NPF events rarely lasted for several minutes (i.e. 5–6 min). In the lower TTL range, i.e. below the tropopause, the number of persistent NPF events was higher than above the tropopause, and the mixing ratio of nucleation-mode particles was also more often increased. The highest mixing ratios of nucleation-mode particles were measured in events lasting from 1 min to a few (up to about 7) minutes.
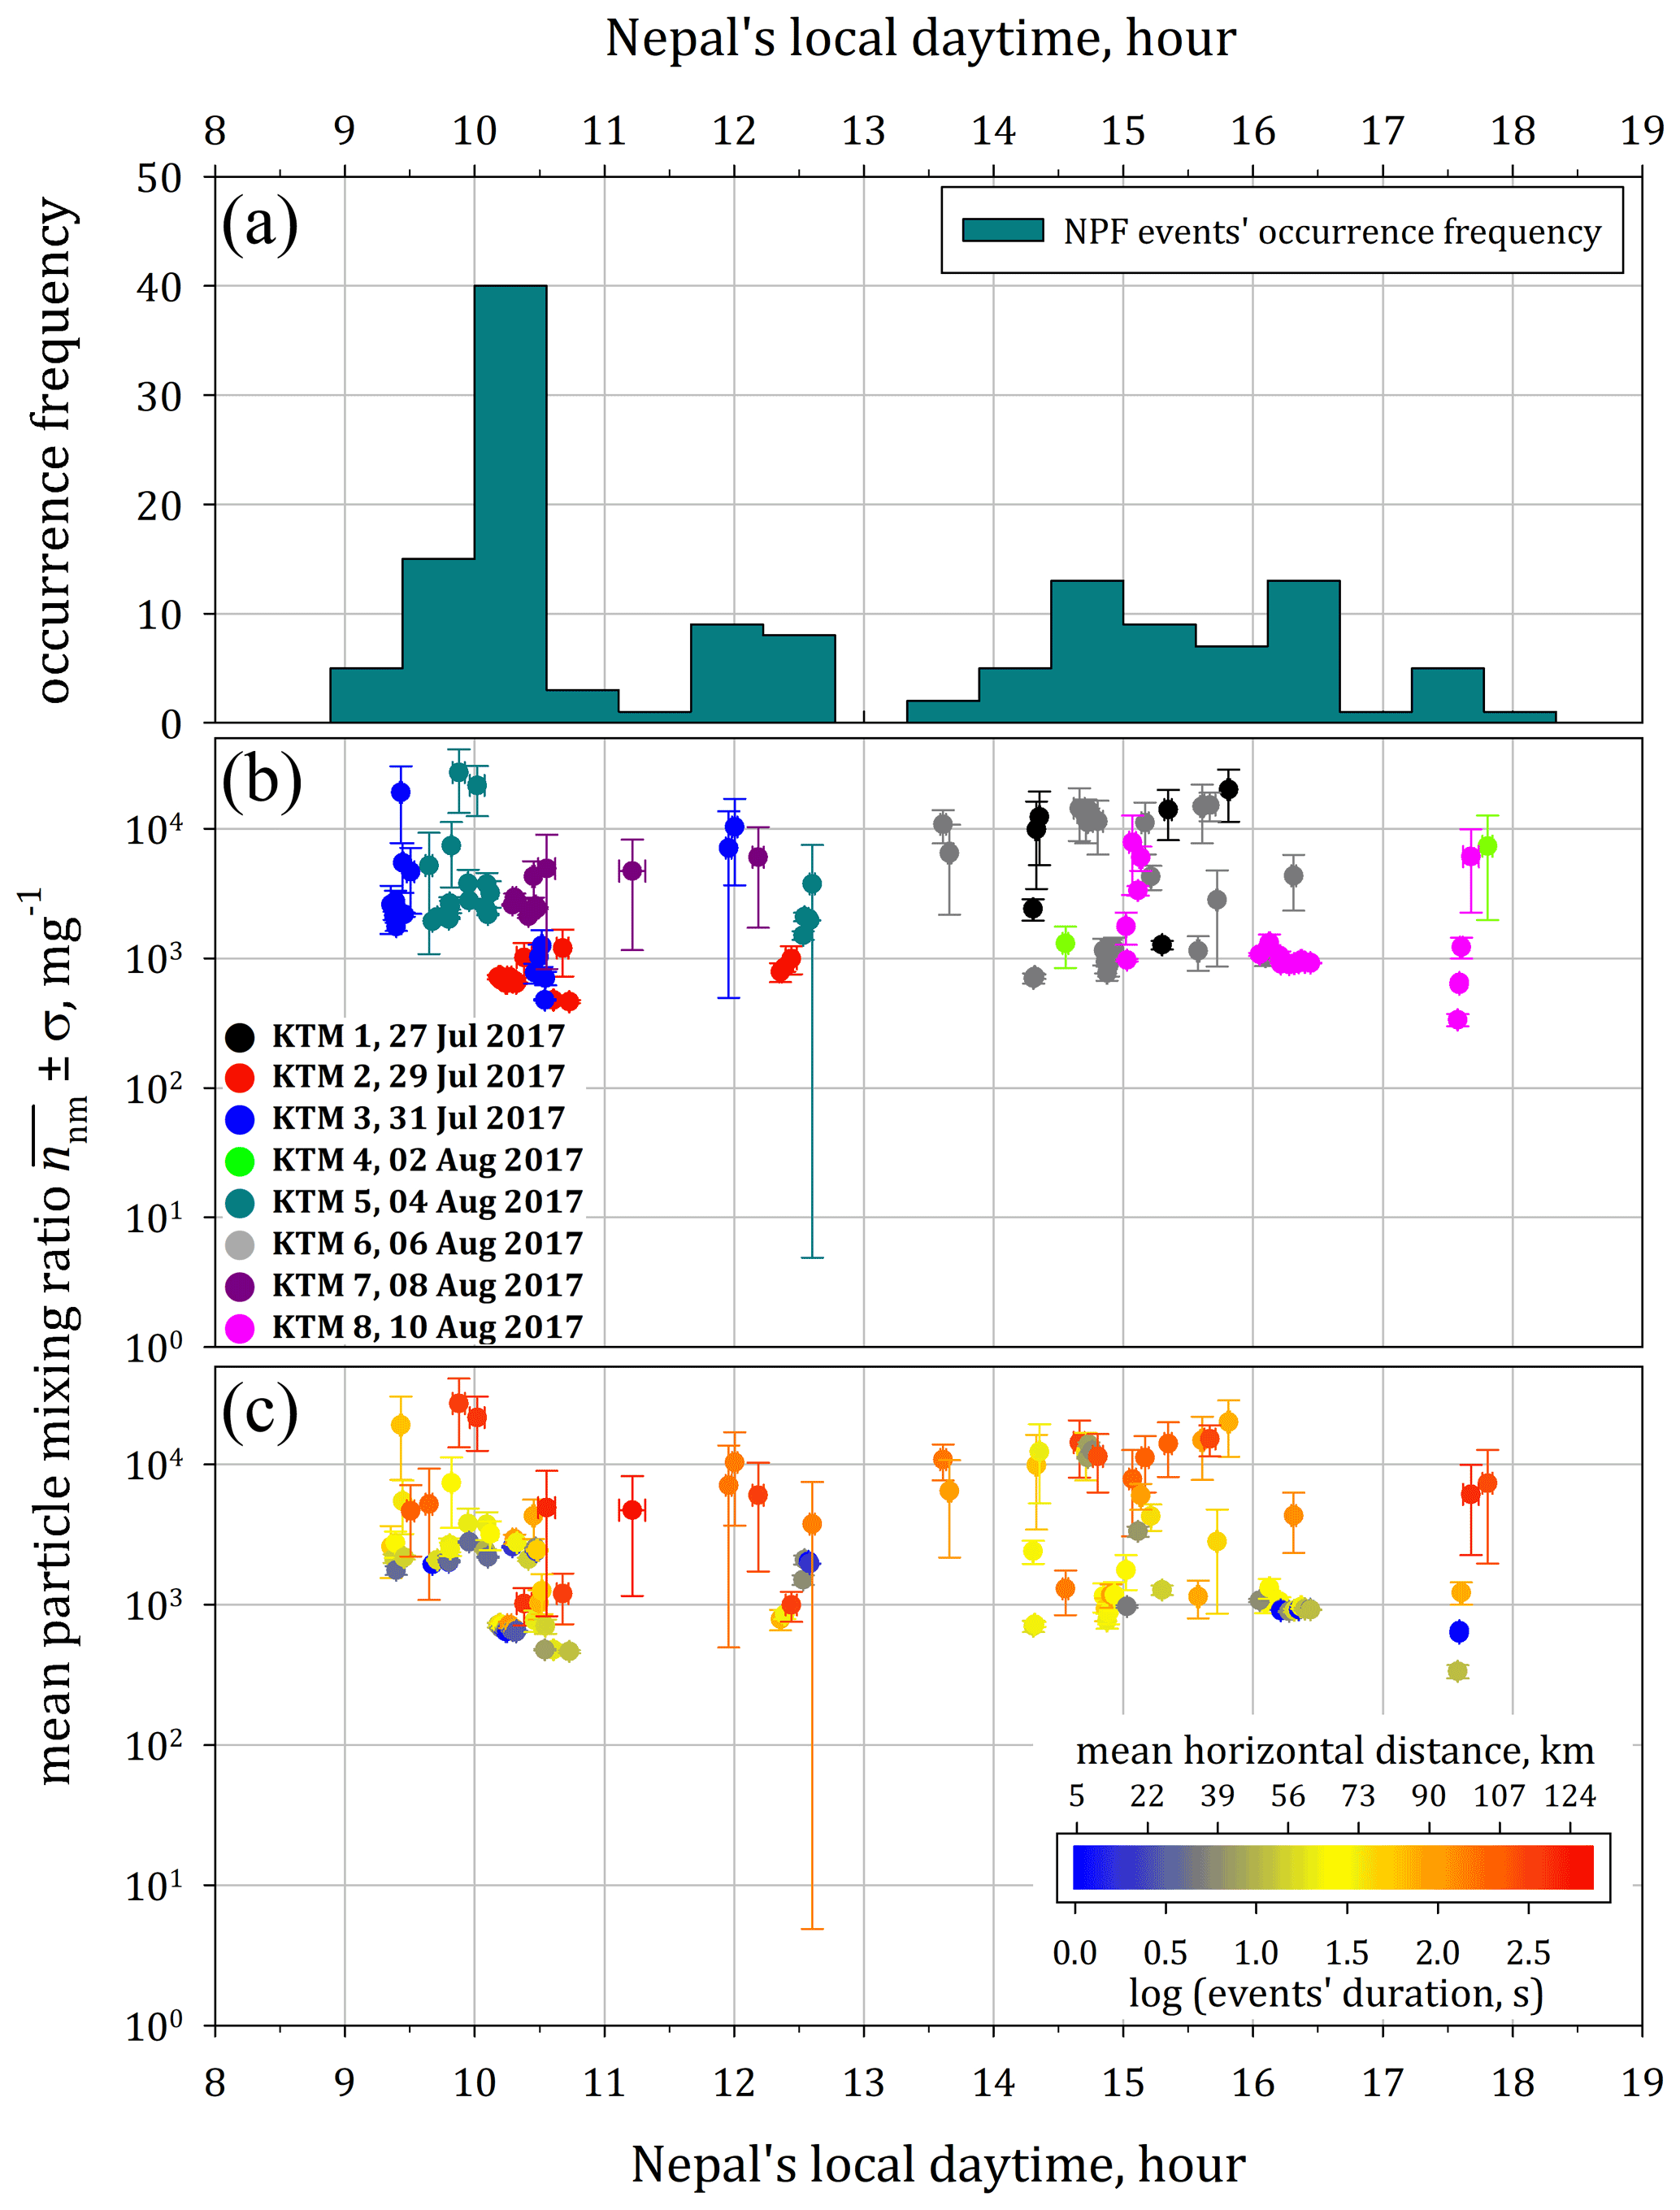
Figure 5(a) Diurnal variation in the occurrence frequency of NPF events. (b) The diurnal distribution of NPF events' mean particle mixing ratio with standard deviation σ, coloured by flight date, and (c) in colours of the (logarithmic) duration of the respective event. Note that the mean horizontal distance is derived from the event duration based on a mean flight speed of 154 m s−1 (σ = ± 39 m s−1; variable flight attitude remains unconsidered) and is understood as equivalent horizontal extension of an NPF event.
Figure 5 depicts the diurnal distribution of observed NPF events. The frequency of NPF event observations is analysed as a function of the local daytime (LT) at Kathmandu, Nepal (Fig. 5a). Apart from one exception, the occurrence frequency of the NPF events seems evenly distributed over the course of a day. The exception is a time window between 10:00 and 10:30 (LT), when recent particle formation was observed up to 2.5 times more often than at other times of the day. In this time window, about one-third of all NPF events (31 of 105 events with durations of more than 5 s) were observed, most of which (25 of 31 events) lasted for less than 80 s (< 12 km mean horizontal distance). The measurements in this time window occurred at two distinct altitude layers, ∼ 360–370 and ∼ 390–400 K. The majority of the StratoClim NPF events in this period (20 of 31 events) were from altitudes above 390 K, while ascertained mixing ratios were never outside ∼ 500–5000 mg−1 during this time of day. Throughout the StratoClim 2017 mission, no further NPF event was observed above 390 K at any earlier time of day, and only two single events were encountered at these heights during different flights at a later time of day (∼ 12:20 and ∼ 17:30 LT, respectively). Determining whether this pronounced frequency of NPF occurrence at a particular time of day is due to bias effects would require a larger database. Beyond this, preferred times of day when NPF was observed with particular frequency were not identified in the StratoClim observations, while instead, within the same region, a diurnal dependence of NPF was previously concluded based on a larger data set (Hermann et al., 2003). The diurnal dependence of NPF would be expected if H2SO4 is assumed to be the main nucleating compound whose production maximum (from the reaction SO2 + OH) at the local noon time correlates with the solar zenith (cf. Weigel et al., 2011).
Throughout StratoClim 2017, NPF was predominantly observed before local noontime during the mission flights KTM 2, KTM 3, KTM 5, and KTM 7, while all other observations were made mainly during the afternoon. All NPF events which lasted longer than 5 s were almost evenly distributed over the day. Furthermore, Fig. 5c indicates that the longest NPF events are not generally associated with the highest mean mixing ratios . The duration of an event is therefore primarily an indicator of the spatial extent of a region where NPF takes place. The derivation of the spatial extent from the duration of individual events, however, bears significant uncertainties since changes in flight attitude, such as curve manoeuvres or changing flight levels during an event, are not taken into account.
The NPF events observed during StratoClim 2017 are among the most frequent and spatially most extended of all those which have been identified by means of COPAS measurements during previous missions (cf. Borrmann et al., 2010; Weigel et al., 2011). Only a few events which lasted more than 100 s were observed during StratoClim 2017, but it cannot be excluded that they were actually composed of individual events of smaller extent. Very short events (< 10 s) make up almost 40 % of all NPF events observed. Consequently, hereafter, all events shorter than 5 s (i.e. 25 out of 130 events) are discarded from further analyses. In this way, individual 1–2 s features are filtered from the data. In addition, for the evaluation of individual NPF events, the reliability of the results increases if the arithmetic averaging occurs over more than five data points. Finally, the accuracy of the specified event duration improves as the raw signal processing (Sect. 2.1.3) smooths the temporal salience of short events.
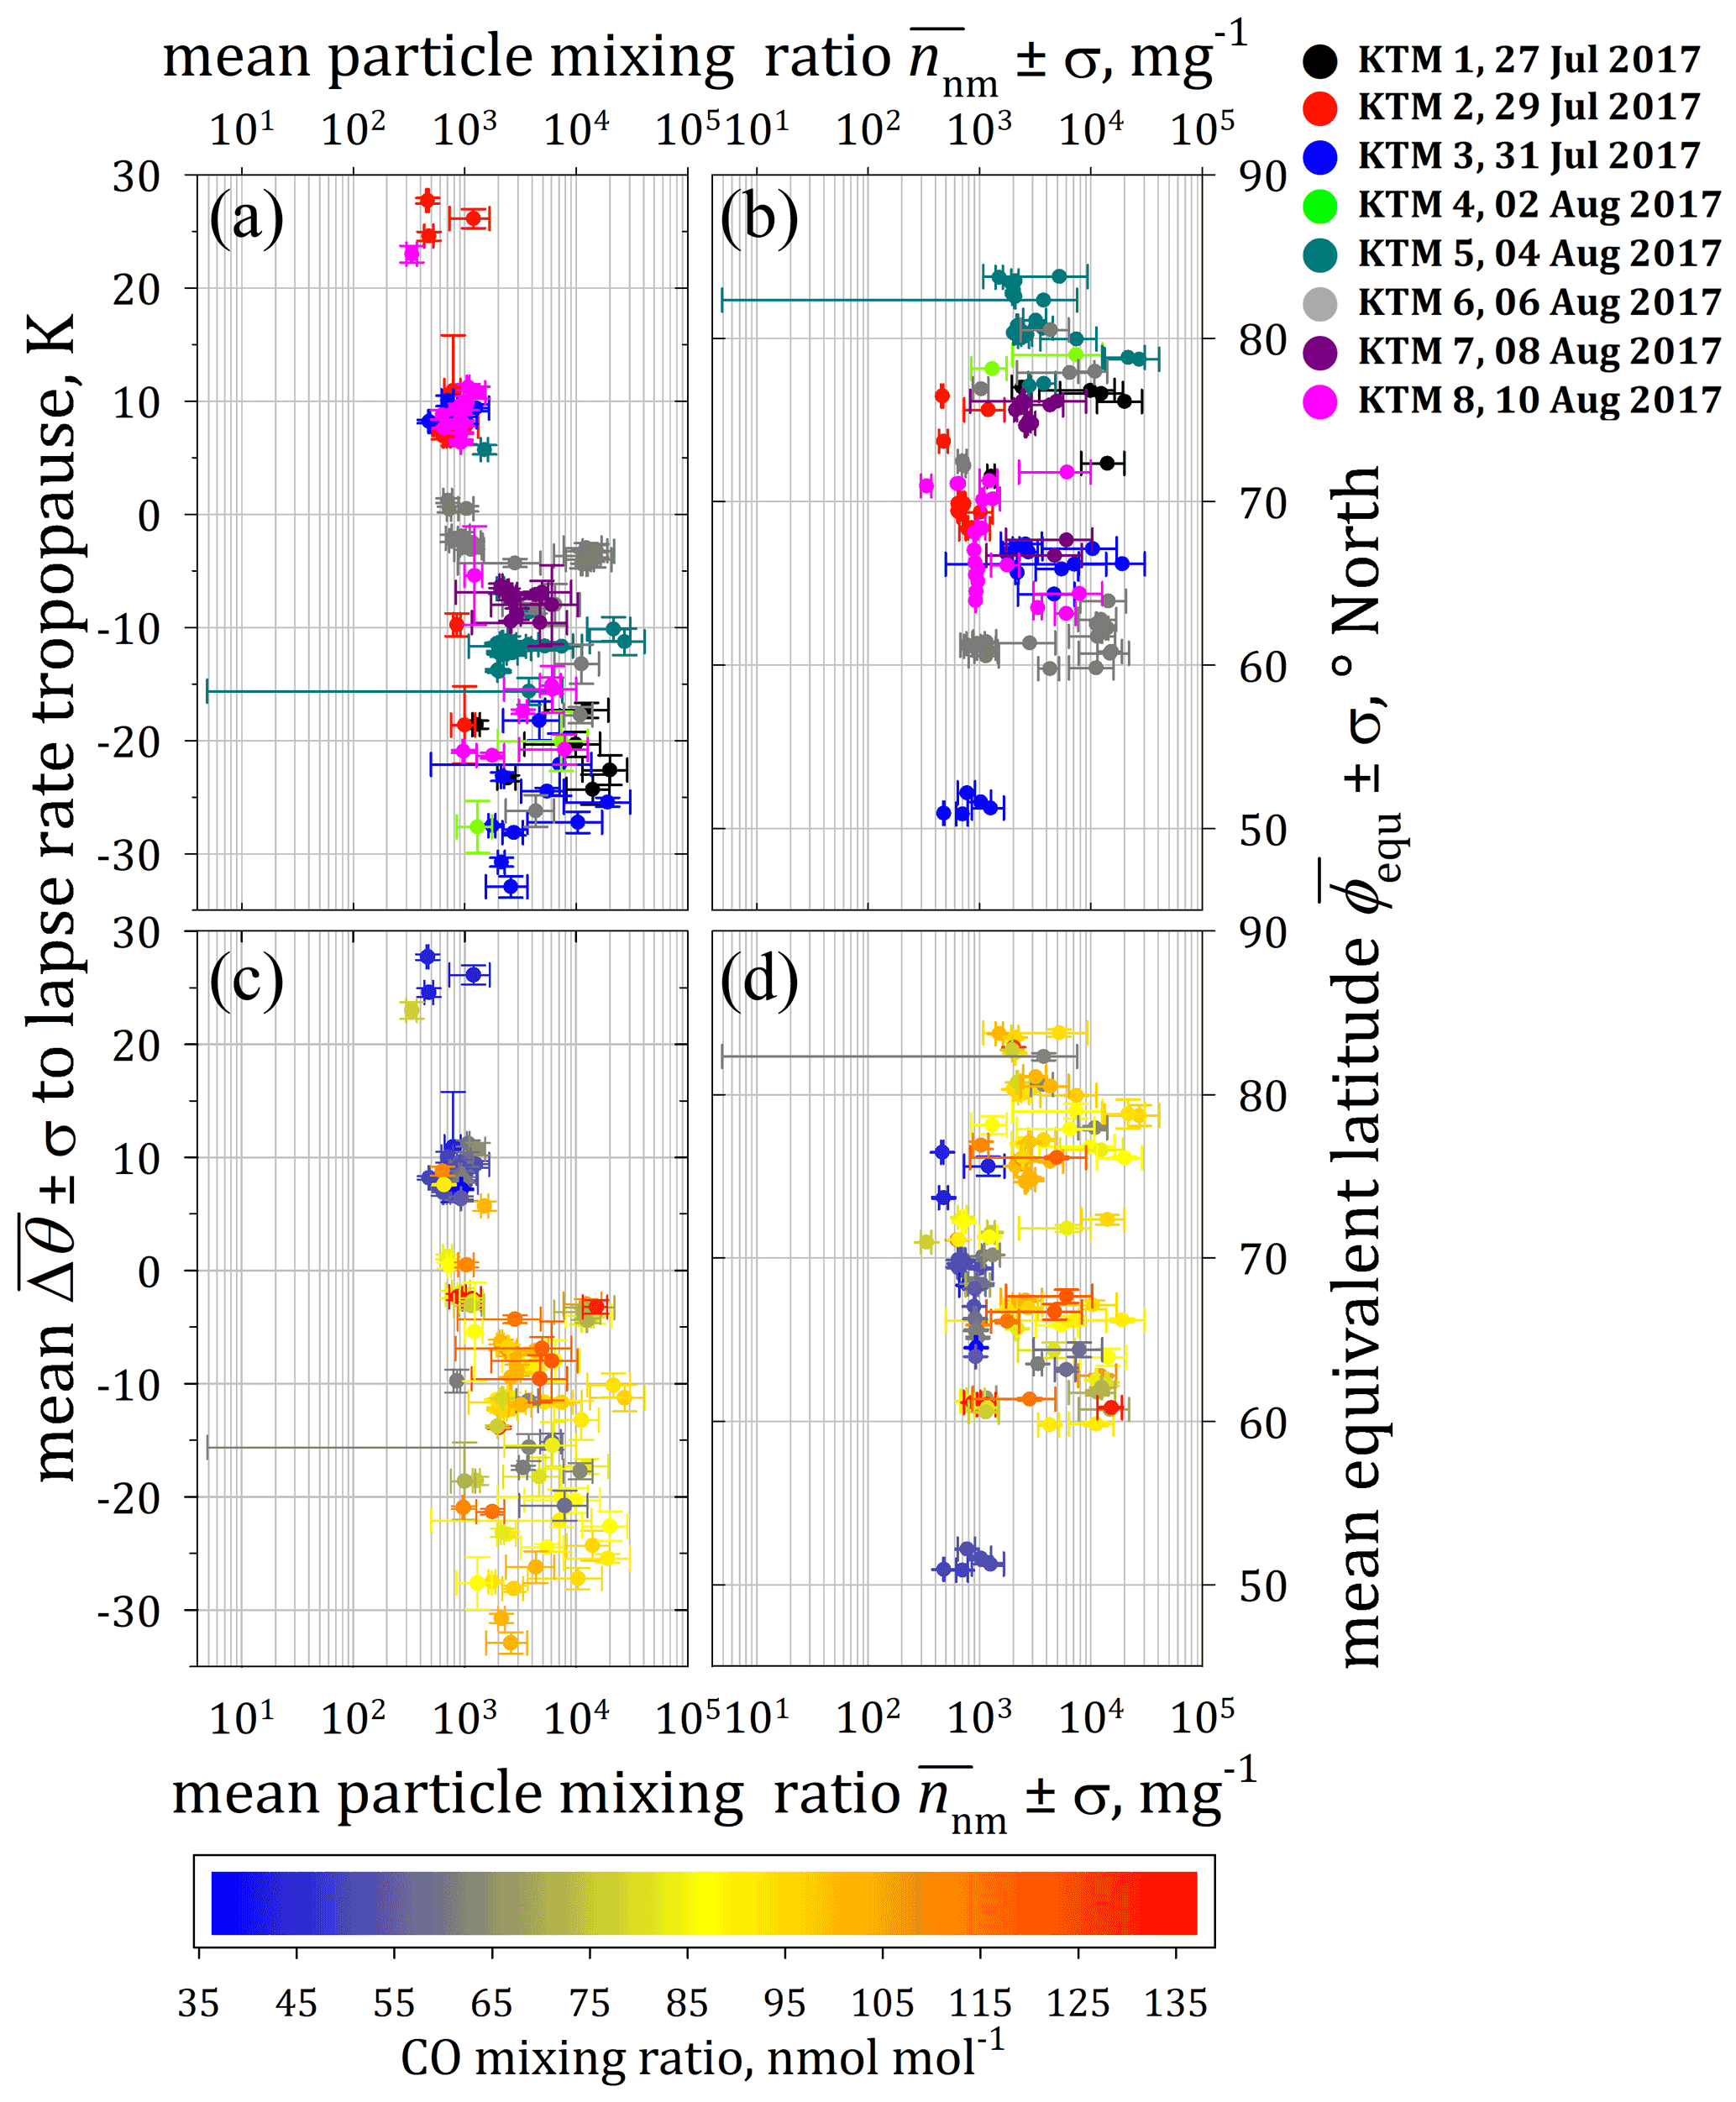
Figure 6Mean particle mixing ratio of individual NPF events as a function of (a, c) the vertical distance from the mean lapse-rate tropopause () and of (b, d) the equivalent latitude (90∘ represents the centre of the AMA as projected to polar coordinates). Data points are coloured by flight date (a, b) and by CO mixing ratios (c, d). (e) The mean particle mixing ratio as a function of the equivalent latitude is colour-coded by the values (colour scale on the left of panel e).
4.4 The occurrence of NPF relative to the tropopause height and the AMA's centre
Figure 6 illustrates the mean mixing ratio of nucleation-mode particles measured during the individual NPF events as a function of (1) the vertical distance to the lapse-rate tropopause (Fig. 6a and c) and (2) the mean equivalent latitude (Fig. 6b and d). NPF events above the lapse-rate tropopause (Fig. 6a; positive and up to +30 K) were mainly observed during the first half of the StratoClim 2017 mission (KTM 2, KTM 3, and KTM 5 on 29 July, 31 July, and 4 August 2017, respectively, with a maximum ceiling > 475 K) or during the last mission flight (KTM 8, on 10 August 2017, with a maximum ceiling ∼ 435 K). All further observations up to θ > 425 K were located below the lapse-rate tropopause (negative , down to −35 K) or in its close vicinity ( ≈ 0 K; e.g. KTM 6, 6 August 2017, with a maximum ceiling ∼ 380 K), i.e. in or above the region of the main convective outflow. As indicated by Bucci et al. (2020) and von Hobe et al. (2021), the first half of the StratoClim 2017 mission was characterised by weak convection, while the convective activity increased as the campaign progressed.
With respect to the AMA centre, most NPF events were encountered north of 60∘ equivalent latitude (Fig. 6b). An exception is a flight segment of flight KTM 3 (on 31 July 2017), where weak NPF with mixing ratios of ∼ 500–1300 mg−1 was detected at the farthest distance from the AMA centre (near the turning point at about 21.5∘ N and 80∘ E geographic coordinates; see Fig. 1). These measurements (at < 60∘ N) were made well above the tropopause since at positive (up to +10 K) mean CO mixing ratios of 45–50 nmol mol−1 (Fig. 6c and d) were found, in agreement with satellite-based CO observations for altitudes of ∼ 16–19 km within the AMA (Park et al., 2009).
Towards the AMA centre ( > 60∘ N), the NPF events are distributed over the entire range of . Here, weak NPF with several hundreds of nucleation-mode particles per milligram was observed well above the lapse-rate tropopause ( ≈ +28 K). The vertical distribution of the NPF events indicates that those events with the highest and mainly elevated CO mixing ratios (65 to ∼ 137 nmol mol−1) were encountered exclusively below the lapse-rate tropopause (to minimum of −35 K). Regarding a relationship between (a) the position relative to the AMA centre and (b) the effectiveness of vertical transport or the NPF rate, the StratoClim 2017 data show that between 60∘ N and 90∘ N equivalent latitude, there is no indication that the mixing ratios of and CO depend on the position with respect to the AMA centre. Close to the AMA centre (60∘–90∘ N) and in an altitude range of almost ± 30 K around tropopause heights, both the distribution of CO-enriched air masses and the occurrence of NPF appear to be largely independent from .
4.5 Persistence of particles in the nucleation mode
Coagulation represents one of the main processes limiting the persistence of nucleation-mode particles, i.e. the duration during which freshly formed particles remain in the size range of the nucleation mode. At elevated number densities, the highly diffusive nucleation-mode particles collide and coagulate with each other and with the present background aerosols on short timescales. Gaseous precursors, which are saturated or supersaturated under NPF conditions, may condense and additionally contribute to the growth of particles out of the nucleation-mode size range, which is considered to be a secondary process.
The aerosol size distribution, which was compiled from the measurements during an NPF event as input for the coagulation simulation (see Sect. 3.2), is depicted in Fig. 7 (black circles with horizontal bars indicating the width of their respective particle size bins of the model). The simulated change in the initial aerosol size distribution due to coagulation is shown in 1 h steps in different colours and line types (Fig. 7a). From this simulation, the temporal decay of Nnm was derived (Fig. 7b, solid black line), whereby the gradient of this decay illustrates the coagulation rate. The sequence of the simulated size distributions indicates that the initial number of nucleation-mode particles is reduced by coagulation within a few hours. Within the first hour after an expired NPF event the nucleation mode is no longer predominant in the overall size distribution, as seen from the maximum of the distribution at dp > 15 nm after 1 h of simulated coagulation (solid red line in Fig. 7a). Hence, with adopted instruments for the detection of nucleation-mode particles, a clear NPF signature is identified only while NPF is just proceeding or for a very short time immediately after an expired NPF event.

Figure 7Results of a coagulation simulation based on the assumption of a distinct and expired burst-like event. The simulation's initial particle size distribution (black circles; horizontal bars indicate the width of each size bin) is merged from data of three COPAS detectors (for N6, N10, and N15) and of the UHSAS-A (65 nm < dp < 1 µm) as detected during NPF encountered on 4 August 2017, between 04:04:40 and 04:05:06 UTC. (a) The processing particle size distribution (coloured lines) over several hours. (b) The concentration of nucleation-mode particles (Nnm) over the simulation's runtime and its fractional contribution to the total particle number concentration (Ntotal). Furthermore, the simulated decay of variably multiplied Nnm (by factors of 0.1, 10, and 100) as initial input of the simulation under constant background conditions (dashed lines).
The concentration of nucleation-mode particles Nnm decreases steeply over time (Fig. 7b). From initially ∼ 13 000 cm−3 of nucleation-mode particles (∼ 75 % of Ntotal) at the earliest stage, Nnm falls below 1000 cm−3 (∼ 20 % of Ntotal) within about 1 h (the grey shaded areas serve for reference). The detection of 1000 cm−3 of nucleation-mode particles, however, would be interpreted as an NPF event of intermediate strength (see Sect. 2.2.1). In addition, coagulation leads to Nnm below 100 cm−3 (< 5 % of Ntotal) during less than 4 h and to Nnm of less than 10 cm−3 within 9 h. The efficiently proceeding coagulation impedes the identification of NPF based on in situ detections, and it is required to be at the NPF site at the right time. This circumstance is corroborated by tests concerning the sensitivity of the simulation to varying input parameters. For these tests, the input in the nucleation mode was modified while keeping constant background aerosol conditions. In three further simulation runs, the initial Nnm was multiplied by the factors 0.1, 10, and 100, respectively (Nnm,0.1, Nnm,10, Nnm,100; dashed lines in Fig. 7b). Increased initial concentrations of nucleation-mode particles, Nnm,10 and Nnm,100, last only for about 15 min compared to the original Nnm (black line in Fig. 7b). The initial values ∼ 105 or ∼ 106 cm−3 drop very quickly due to elevated coagulation rates, and in both of these cases, Nnm,10 and Nnm,100 fall below 1000 cm−3 within less than 1 h. The threshold of 100 cm−3 is crossed after less than 2 h (Nnm,10) or after 30 min (Nnm,100). Therefore, NPF events, which produce much higher concentrations of nucleation-mode particles, require even shorter time periods for a successful detection (e.g. by COPAS) after their expiration. However, for the simulation of decreased concentrations (Nnm,0.1), the coagulation rates remain nearly constant, as indicated from the almost identical decays of Nnm,0.1 and Nnm (Fig. 7b). Simulated concentration of nucleation-mode particles falls below 100 cm−3 within almost the same time from the initial values Nnm,0.1 or Nnm,10, respectively. Further investigation on the sensitivity of the simulation to the pressure and temperature conditions that were assumed as simulation input did not reveal any significant dependence unless the input is varied by more than ± 10 hPa and ± 18 K from the used values of the respective parameter (not shown here).
Based on these estimations, the detection of elevated Nnm indicates that an event with high NPF rates is currently proceeding, or a recently expired NPF event was observed. Detections of lower values of Nnm could indicate (a) intermediate or weak (currently proceeding) NPF at low supersaturation of the NPF precursor or (b) an NPF event (e.g. of high particle productivity) that has phased out several hours before the observation. NPF is measured in situ, while the formation event is currently in progress or at most a few hours later. Therefore, the short periods of time available for a clear NPF detection and the still frequent NPF encounters on each measurement flight during StratoClim 2017 indicate the prevalence of such events within the AMA.
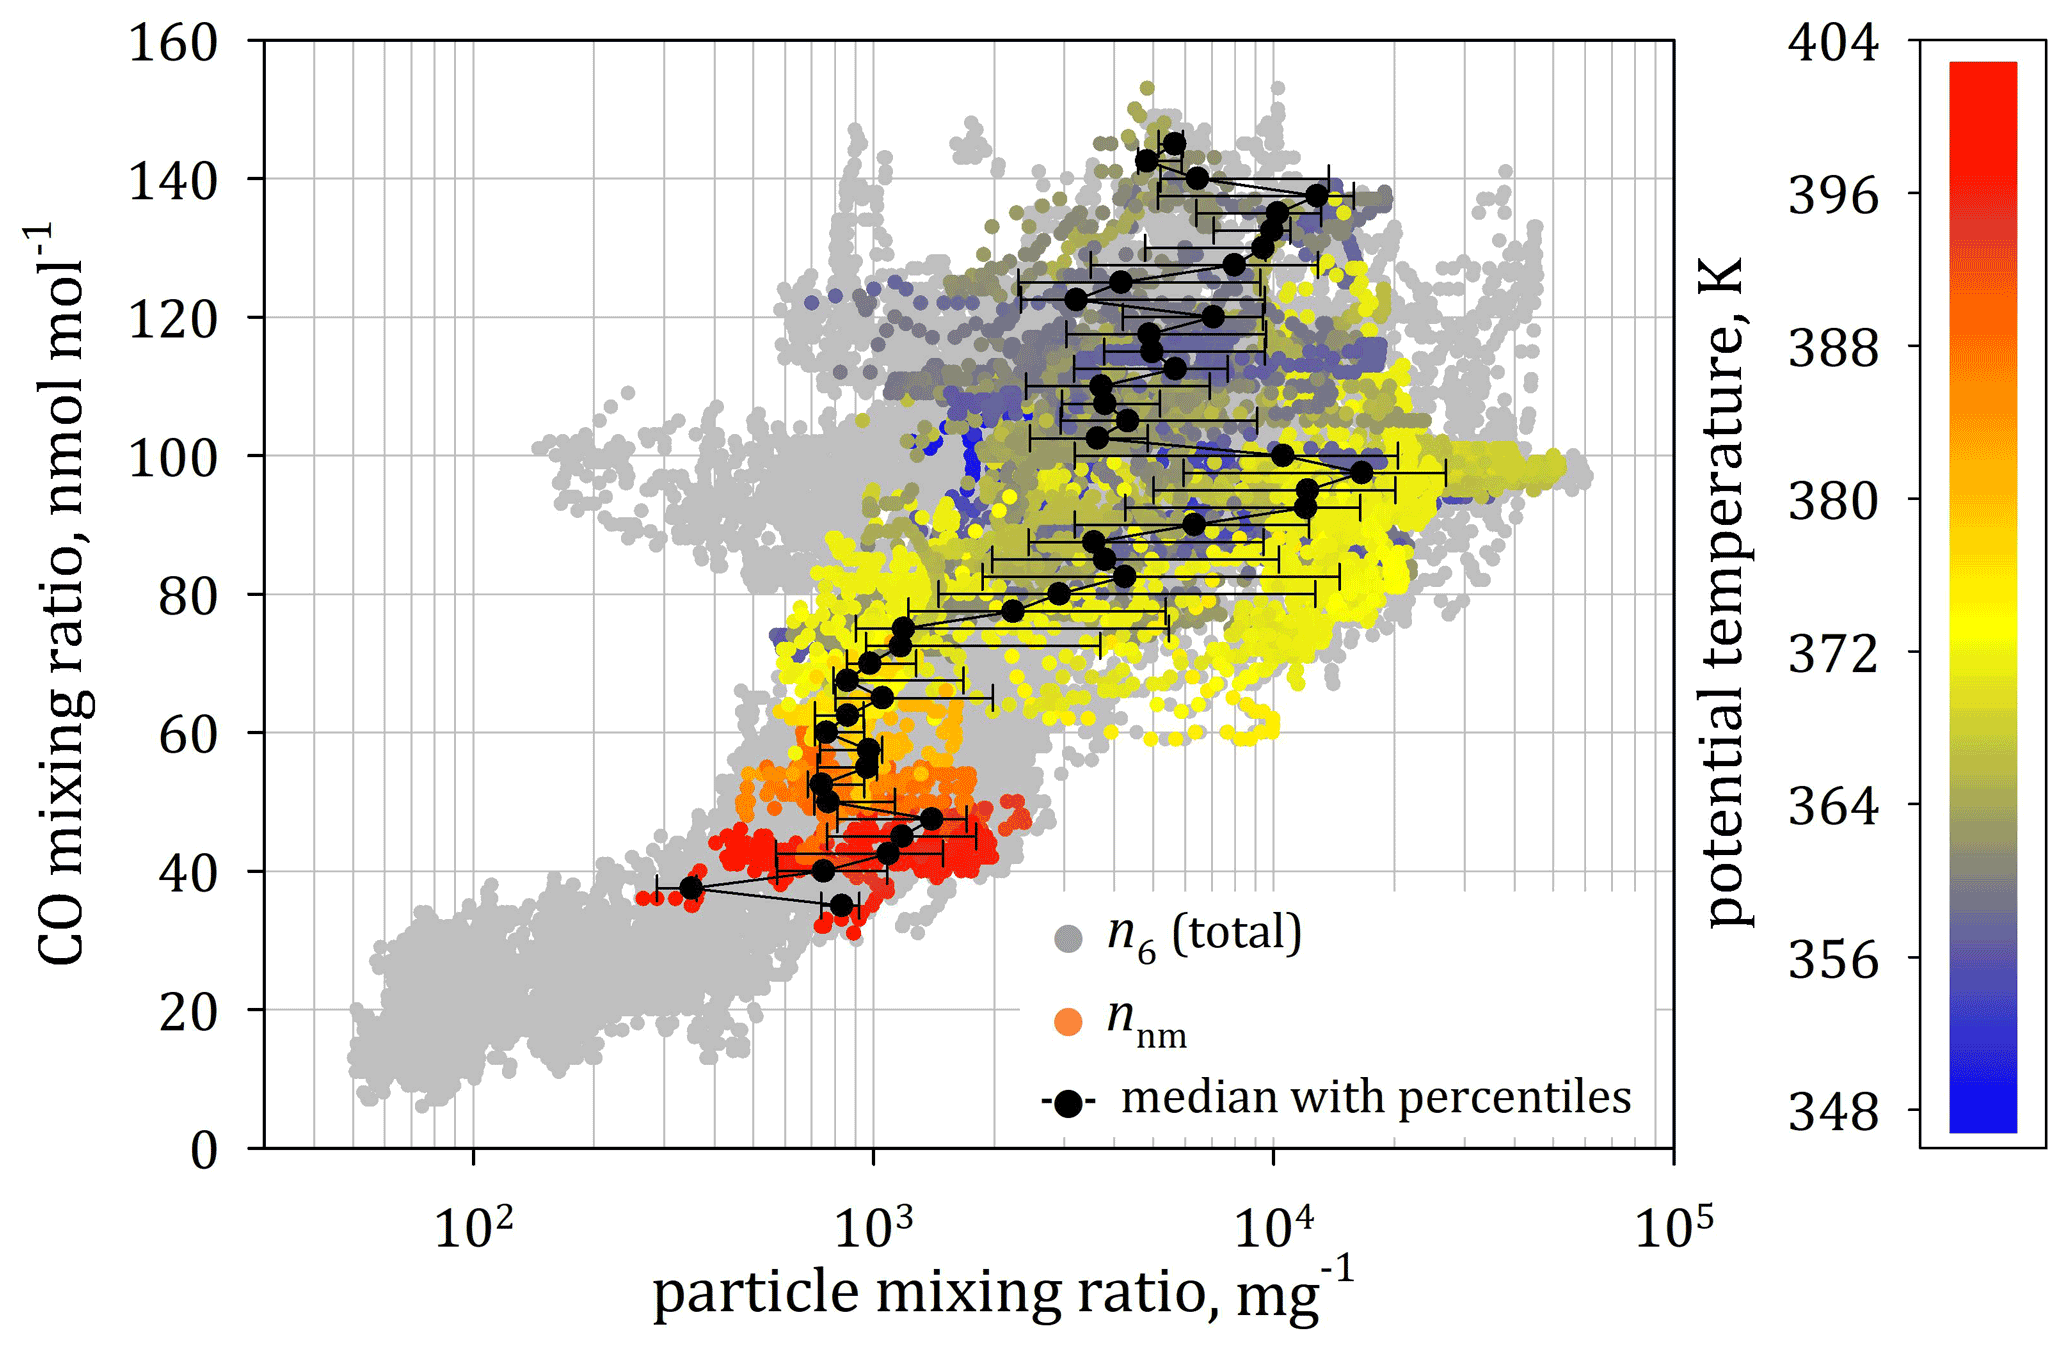
Figure 8Particle mixing ratio of fine-mode particles n6 (grey dots in the background) and of nucleation-mode particles nnm (colour-coded with reference to the potential temperature) in relationship to the CO mixing ratio. The median nnm with the 25th and 75th percentile is shown in bin widths of 2.5 nmol mol−1 of the CO mixing ratio (black dots).
5.1 NPF in relationship to CO as a pollution indicator
NPF events with moderate numbers of nucleation-mode particles (< 1000 cm−3) in the lower-TTL region were previously attributed to CO mixing ratios above ∼ 70 nmol mol−1 (60–70 nmol mol−1 was assumed to be a typical CO background in the pristine marine boundary layer; cf. Weigel et al., 2011). Elevated concentrations of nucleation-mode particles (of up to ∼ 6000 cm−3) at altitudes of 350 K < θ < 360 K were associated with significantly increased CO mixing ratios of more than 85 nmol mol−1 (Weigel et al., 2011). These results, mainly based on two single NPF events over West Africa (SCOUT AMMA, 2008), could have indicated a correlation between NPF rates and CO load from pollution. However, almost 100 individual event observations (Sect. 4.4 and Fig. 6c and d) indicate that the relationship between pollution level and NPF rates is less direct than expected. In Fig. 8, the 1 Hz resolved data of synchronous detections of CO and particle mixing ratio during the entire StratoClim 2017 mission are compared. To illustrate the relative scattering of both n6 and nnm, the total particle mixing ratio n6 is shown in the background (grey dots), and the mixing ratio of particles in nucleation mode nnm (dots coloured with respect to θ) is displayed in the foreground.
At altitudes below the tropopause (below ∼ 380 K), where NPF rates lead to the highest nnm, the relationship between the 1 Hz resolved n6 or nnm and the CO mixing ratio is highly variable. At CO levels of 80–100 nmol mol−1, the scatter of nnm ranges from 700 mg−1 to the absolute maximum of about 50 000 mg−1. This maximum nnm is exclusively reached at CO mixing ratios of 100 ± 2.5 nmol mol−1. At the maximum CO mixing ratio (i.e. ∼ 150 nmol mol−1), particle mixing ratios nnm of about 6000 mg−1 (median value) were detected. Within a range of CO content between 85 and 130 nmol mol−1, the nnm (median) mixing ratios ranged consistently between 2000 and 10 000 mg−1, apart from the notable exception at about 100 nmol mol−1. CO mixing ratios between 60 and 80 nmol mol−1 were detected just below or at tropopause levels (yellow to orange colours) coincidently with decreasing nnm from about 3000 mg−1 to values below 1000 mg−1. For CO mixing ratios below 60 nmol mol−1, nnm almost stagnates between 300 and 1300 mg−1. At tropopause levels and aloft, the decreasing CO mixing ratio as well as abating NPF (expressed in decreasing nnm values) likely results from both the degradation of CO (see von Hobe et al., 2021) and the lacking supply of NPF precursor material by direct transport. According to von Hobe et al. (2021) any indication is missing that convection penetrated the tropopause during the StratoClim 2017 period. However, Lee et al. (2019) investigated the TTL-hydrating influence of an overshooting event that occurred in the Sichuan Basin about 1.5 d before the StratoClim measurements southbound of Kathmandu over north-eastern India (M-55 Geophysica, KTM 7 on 8 August 2017). Hence, there is no clear indication for a direct relationship between CO-enriched (polluted) air and the NPF rate.
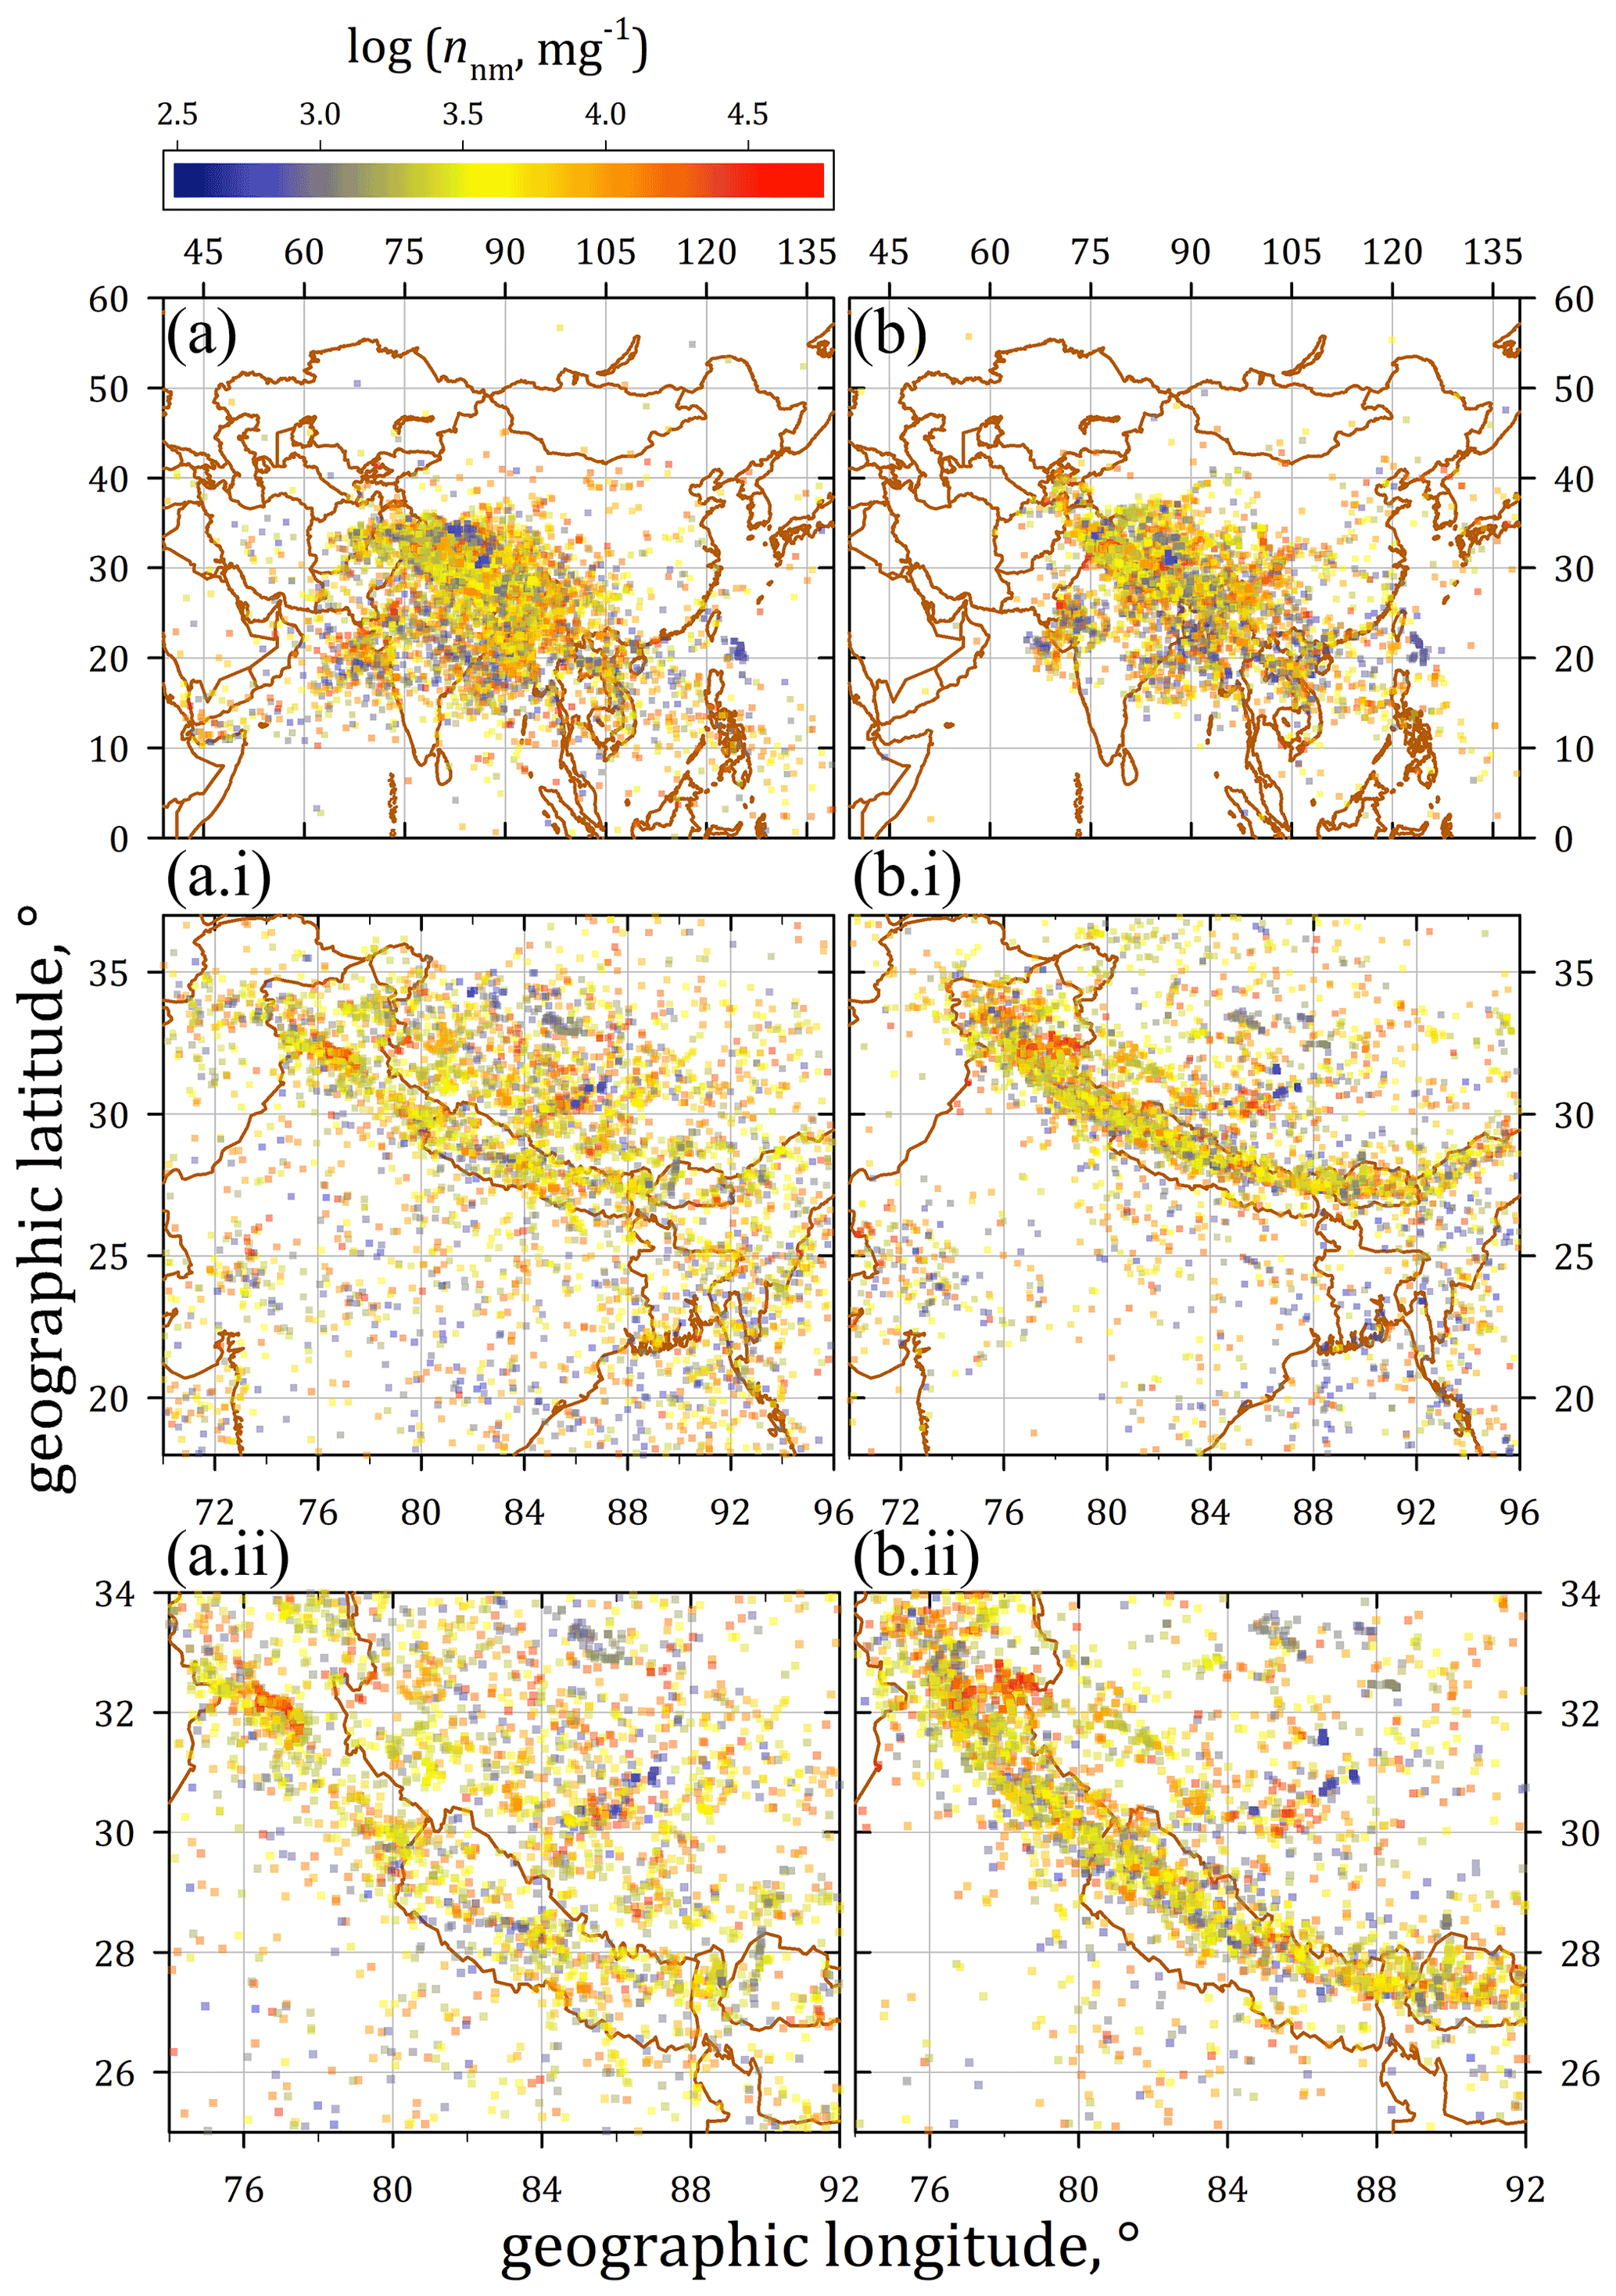
Figure 9From backward trajectory analyses by means of the chemistry transport model ClaMS and based on ERA5 data. (a) The geographic position of the last boundary layer (BL) contact of the NPF-connected air mass backward trajectories. (b) The geographic position of the maximum ascent rate. Subpanels a.i and a.ii (b.i and b.ii) provide two-level zoom-ins of the respective main panel (a) or (b) based on the same data set. The backward trajectories were analysed over the last 50 d prior to the NPF detection as a starting point of each trajectory. Here, the data points are coloured with reference to the (logarithmic) mixing ratio nnm of nucleation-mode particles; grey data points indicate transport times > 25 d.
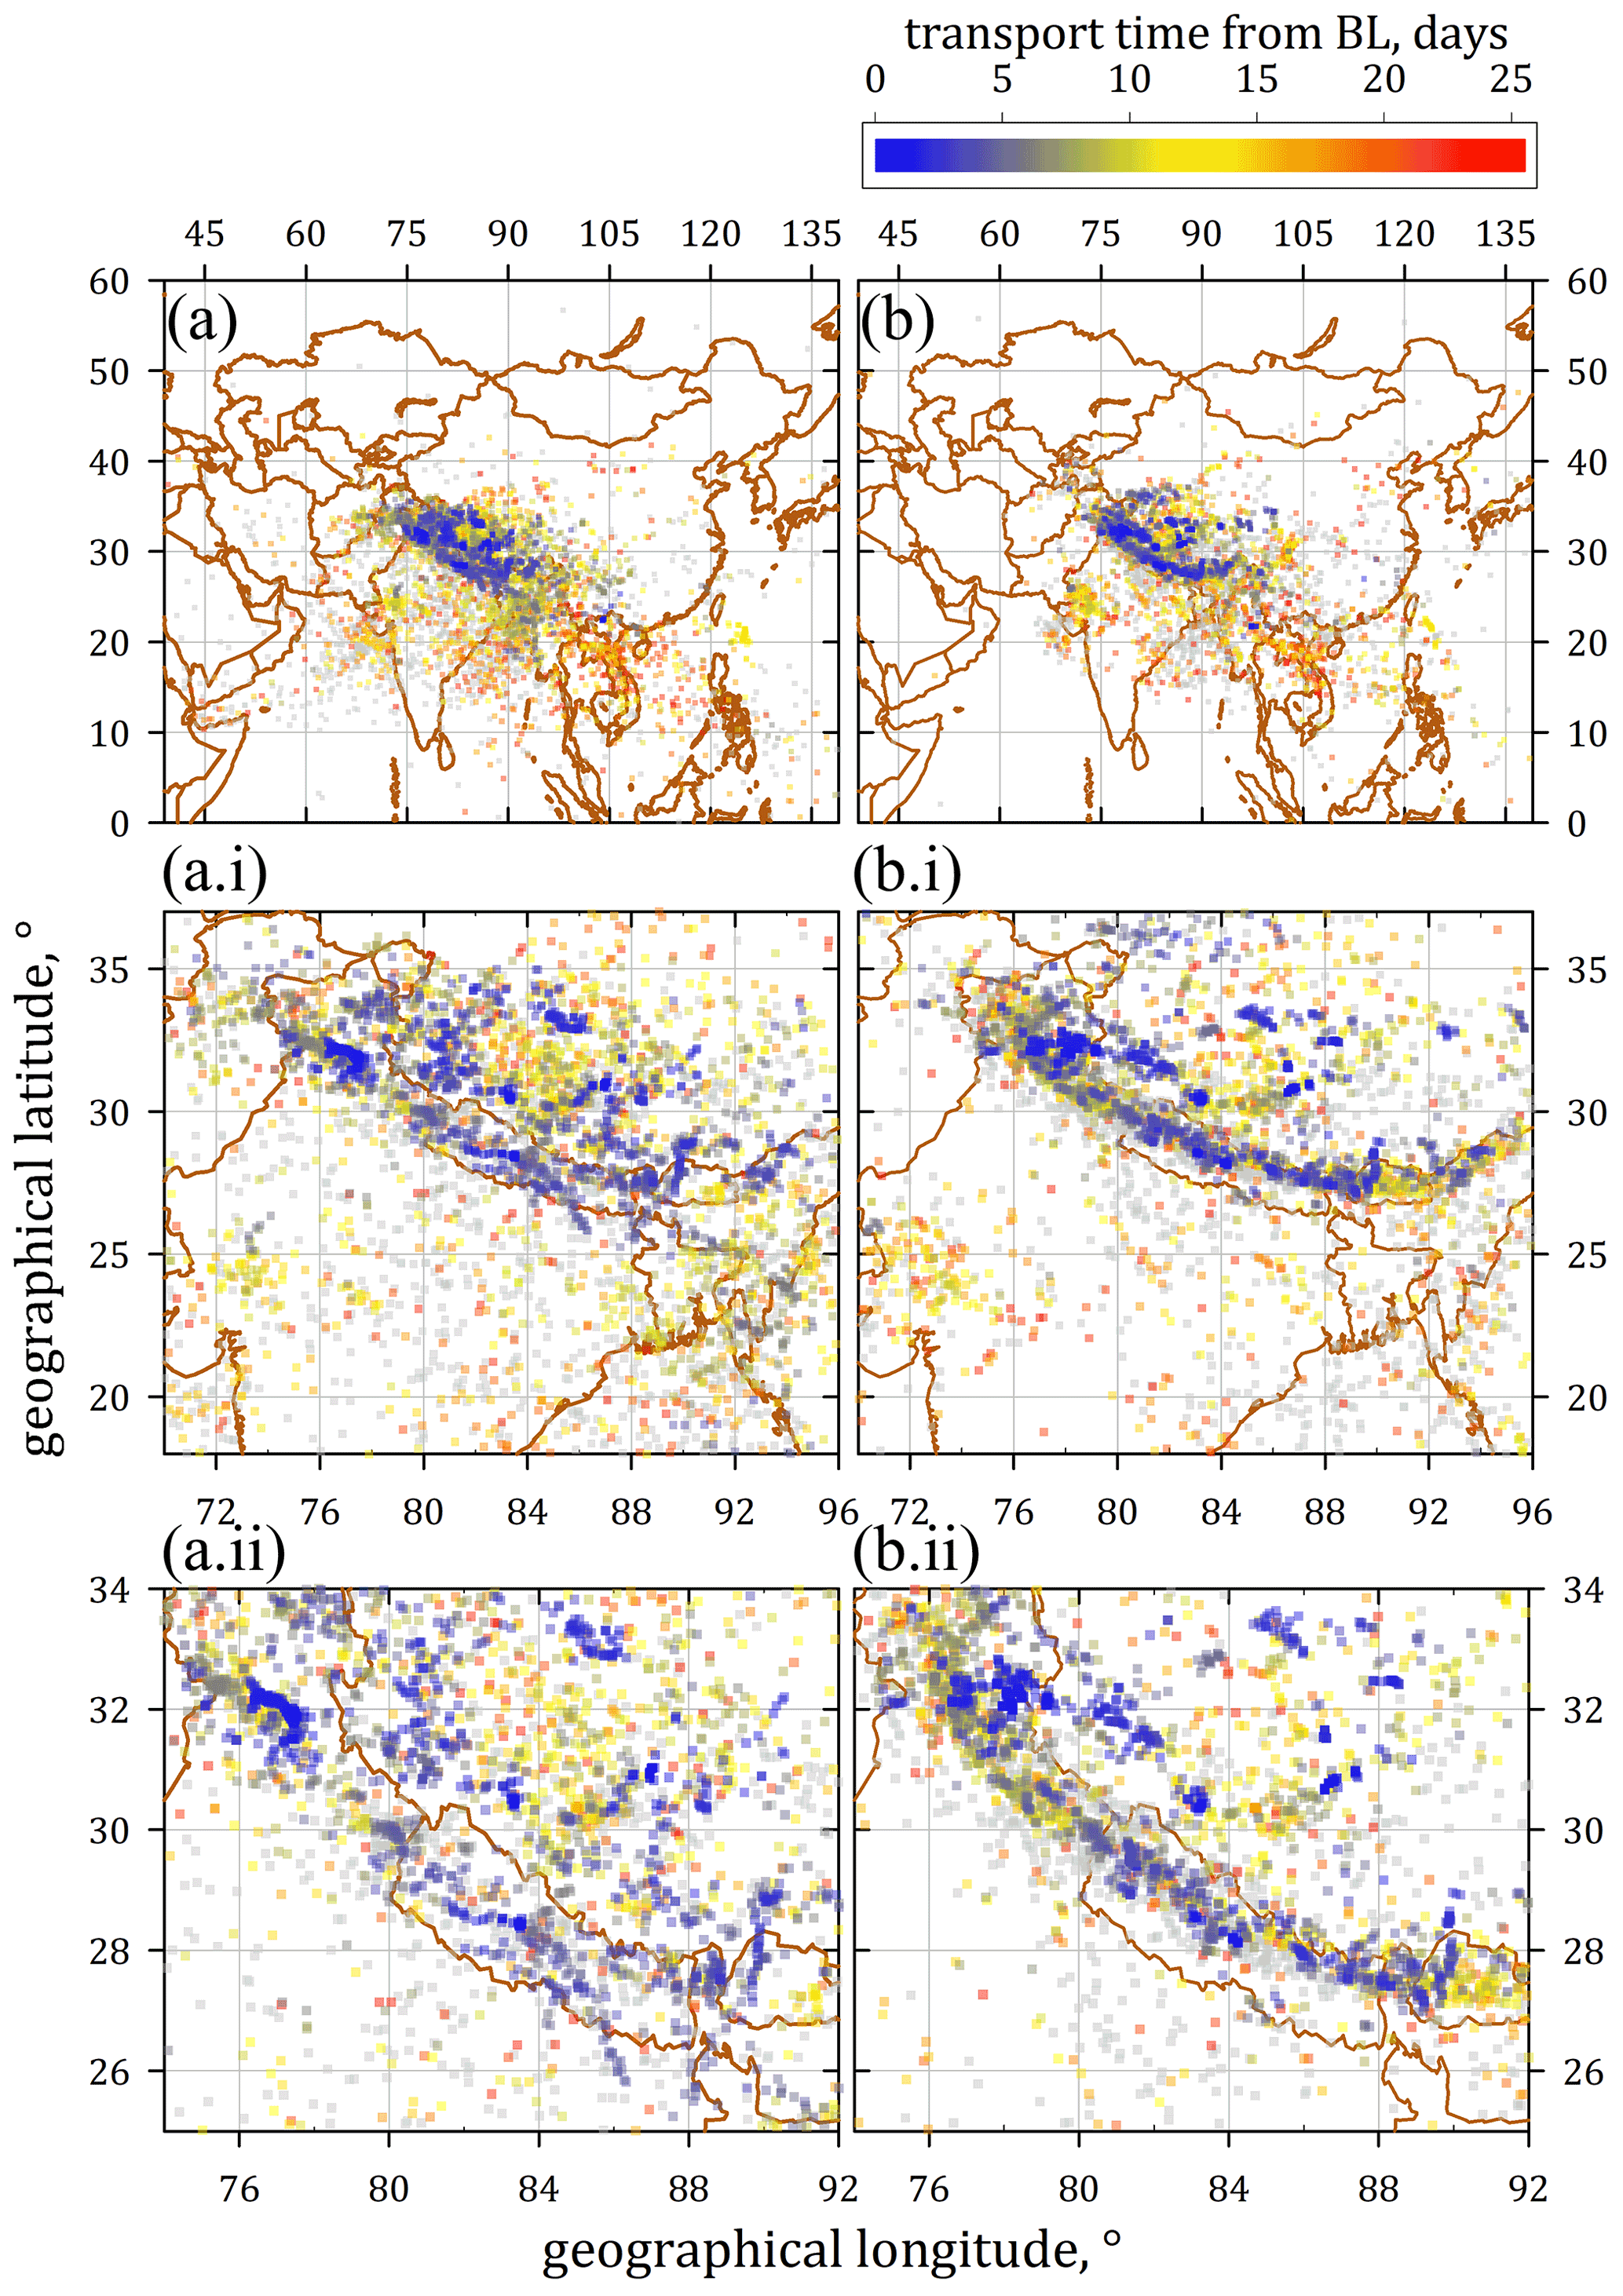
Figure 10Structured as in Fig. 9. (a) The last boundary layer (BL) contact of the NPF-connected air mass backward trajectories. (b) The maximum ascent rate of these trajectories (for details of the trajectory analyses with ClaMS, see Fig. 9). Here, the data points are coloured to the air mass transport time since the last BL contact; grey data points indicate transport times > 25 d.
5.2 NPF and air mass origin in the boundary layer
The assignment of certain measurement sections of elevated nnm to possible source regions of NPF precursors is carried out in two steps:
-
The backward trajectories were traced down to the boundary layer (BL) for each measurement point (see Sect. 3.3) at which NPF was detected (Fig. 9a and b). In this way, the geographical position of the last BL contact of the air before the observations (1 Hz resolution) of elevated nnm ( 300 mg−1) is obtained throughout the StratoClim 2017 mission (Fig. 9a). In addition, the geographical position of the trajectories' fastest uplift during their transport history was determined (Fig. 9b).
-
The ERA5 reanalysis data were examined with regard to the transport time of the trajectories between the position in the BL and the coordinates of the measurement point (Fig. 10a and b). The transport time is then coupled with the geographical position of the last BL contact of the air before the NPF observations (Fig. 10a) and the position of the trajectories' fastest uplift in their transport history (Fig. 10b). According to the distribution of the trajectories' latest BL contact with reference to the nnm mixing ratio (Fig. 9a), hardly any systematic structure is visible (the close-up views in Fig. 10a.ii and a.ii provide a new scaling and arrangement of the points of identical data set). The possible source regions are distributed over the entire region almost independently of the NPF intensity. The last BL contact of some trajectories was at locations far away from the monsoon region (e.g. in the west: the east coast of Africa and the Gulf of Aden; in the east: Indochina, the South China Sea, and as far as the Philippine Sea). The entire possible source area of NPF precursors ranges from the north of India and the Arabian Sea, Pakistan, Afghanistan, Southwest China, Taiwan, the Philippines, and the Bay of Bengal.
Locations of fastest vertical updraught are more compactly distributed (Fig. 9b, close-up views in Fig. 9b.ii and b.ii) and better reflect the contours of an area where efficient convection frequently occurs within the monsoon region. The fastest updraught with simultaneously increased nnm is found in the Kathiawar region on the Indian west coast towards the Arabian Sea or in the far north of India (in the areas around Ladakh, Himachal Pradesh, and eastern Punjab). In areas of the central Tibetan Plateau, some sites were identified with elevated nnm, where also the fastest vertical upward transport occurred. Finally, the shape of the Himalayas is traced by the locations with the fastest vertical air mass transport over a wide range of nnm.
Also the shortest transport times from the BL are found around the Himalayas and their foothills, whereas the transport times from locations of air's last BL contact, which fall south of 25∘ N, west of 72∘ W, or east of 96∘ W, are rarely shorter than 10 d. In Fig. 10 (Fig. 10a and b; see also respective close-up view), the contour of the Himalayas is clearly reproduced by the distribution of the data points (transport times of less than ∼ 5 d and fastest vertical updraught). Hence, for the duration of the StratoClim 2017 mission, the convective uplift mainly occurred within the AMA. This more compact regional distribution of vertical uplift (Fig. 10b) is possibly related to the occurrence of a vertical conduit for upward transport in the monsoon, as conjectured by Bergman et al. (2013). Figure 10 also indicates air masses of elevated nnm, which have experienced convective uplift over Tajikistan and northern Afghanistan as well as over regions around the Yellow Sea, the Korean Peninsula, or Japan, hence far away from the AMA system.
Figures 9 and 10 both finally show that the region of the air's last BL contact and the location of the fastest vertical uplift do not necessarily coincide. Similarly, the locations of the fastest updraught do not always match the shortest transport times, but for most cases in the immediate vicinity of the Himalayas this correlation is clearly visible from the StratClim 2017 data set. Ultimately, it cannot be excluded that, within the free troposphere, the air is subject to loading from various source regions (not exclusively from the location of the last BL contact) prior to its convective uplift. Of course, this finding complicates an unambiguous apportioning of NPF to specific source regions of precursors in the BL.
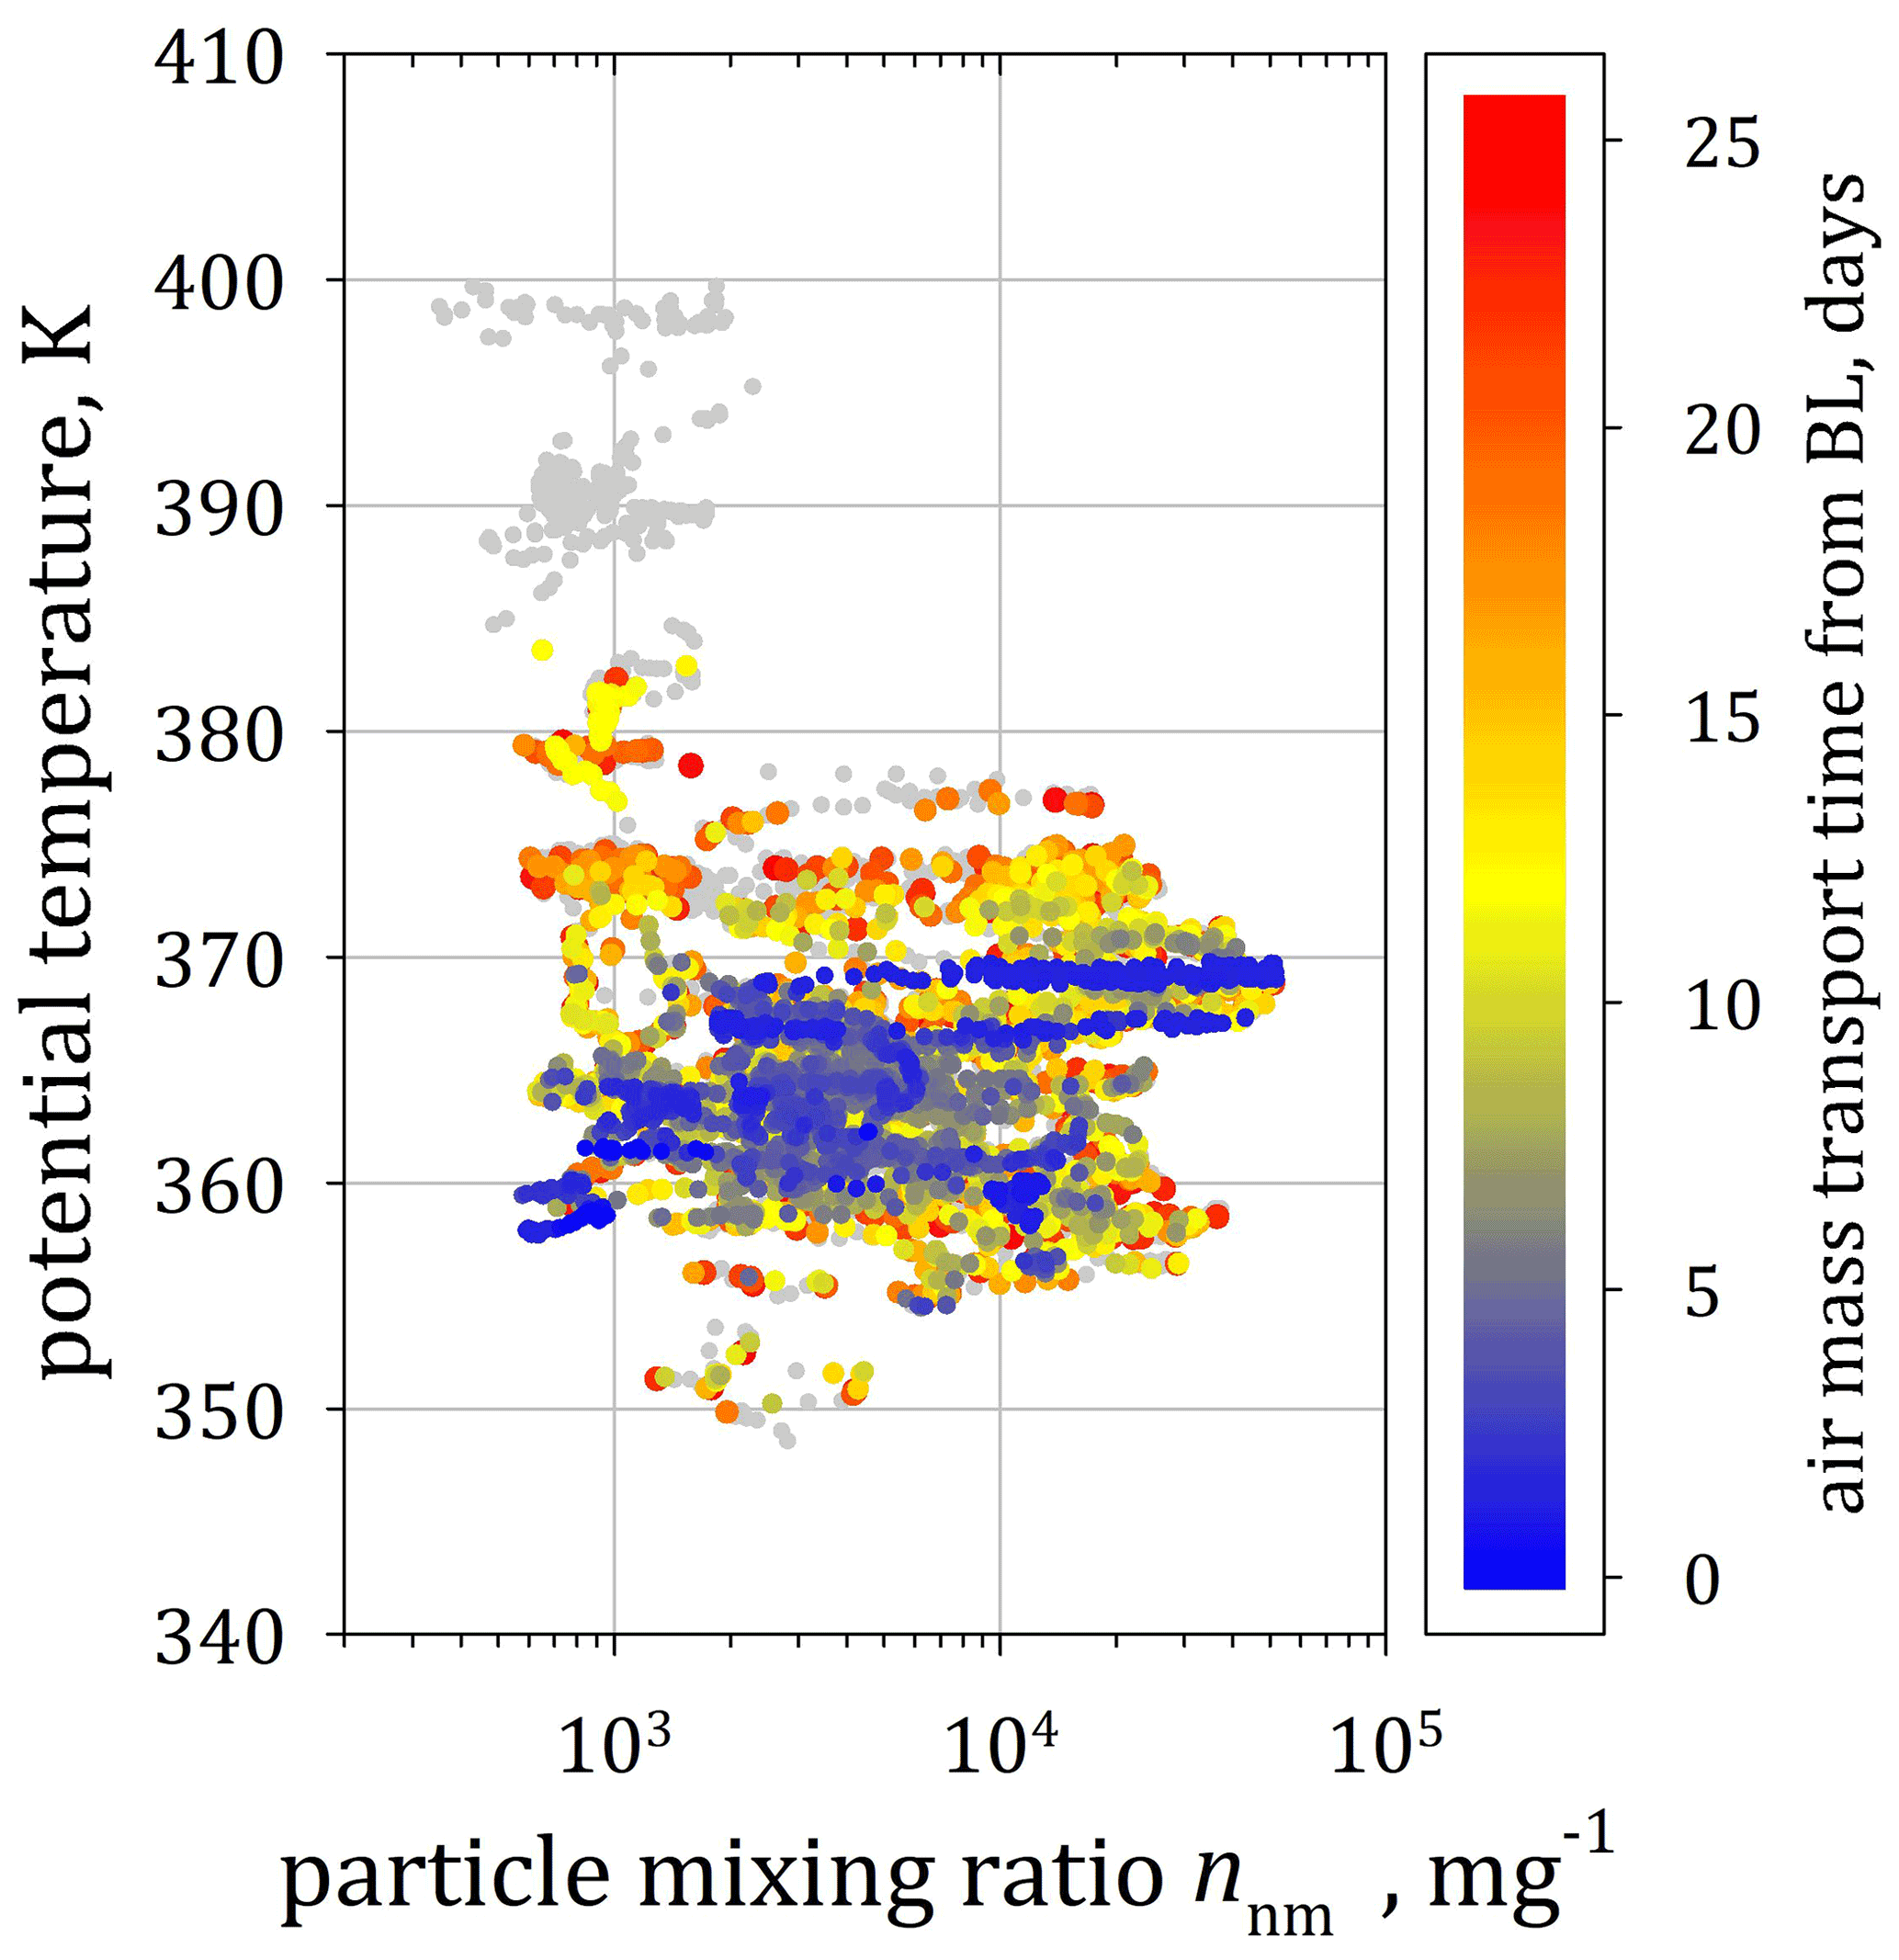
Figure 11Vertical profile of the 1 Hz resolved particle mixing ratio of nucleation-mode particles nnm colour-coded by the air mass transport time (days) from the boundary layer (BL). For details of ClaMS analyses, see Figs. 9 and 10.
The vertical distribution of the nnm mixing ratios as a function of the air mass transport time from the BL is shown in Fig. 11:
-
Above 380 K, almost all observations of enhanced nnm are associated with air mass transport times of more than 12 d. At 380 ± 3 K, none of the detected nnm is connected to air mass transport times of less than 12 d. Values of nnm that were several times higher (with 103–104 mg−1) were detected below 380 K in air masses, which had experienced more than 25 d of transport time from the BL.
-
Below 380 K, the transport times are variably distributed over the altitude range between 350 and 380 K. The air masses with shortest transport times are located in the height interval between 360 and 370 K. As shown by a recently published investigation, these air masses have presumably reached the ∼ 360 K level (altitude of the main convective outflow) very quickly by an effective convective transport and are then moved further aloft, towards 370 K, with much lower ascent rates (Vogel et al., 2019) due to the prevailing air mass uplift within the AMA.
-
On occasion, very short transport times were found with maximum nnm at altitudes of about 367 and 370 K. However, the highest nnm values are mostly not observed in air with such short transport times. Within 370 ± 3 K, the detected nnm reaches extreme values (∼ 50 000 mg−1) in air with transport times of up to 15 d. Above 370 K and below 355 K none of the maximum nnm is associated with transport times of less than 6 d, and here, the highest nnm values were detected in air with transport times of up to 25 d. Therefore, based on the observations and the trajectories analysed here, the altitude band of the main convective outflow is limited to a range between 355–370 K.
5.3 The relationship between NPF and convective outflow
For the following analysis, which is summarised in Fig. 12, the vertical distribution of the mean mixing ratios of the respective NPF event (see Sects. 2.2.1 and 4.4) is juxtaposed with
- a.
a measure for the convective contribution to the composition of the probed air mass
- b.
the mean transport time within the TTL since their release from the top of individual convective cells (see Sect. 3.4 for both variables).
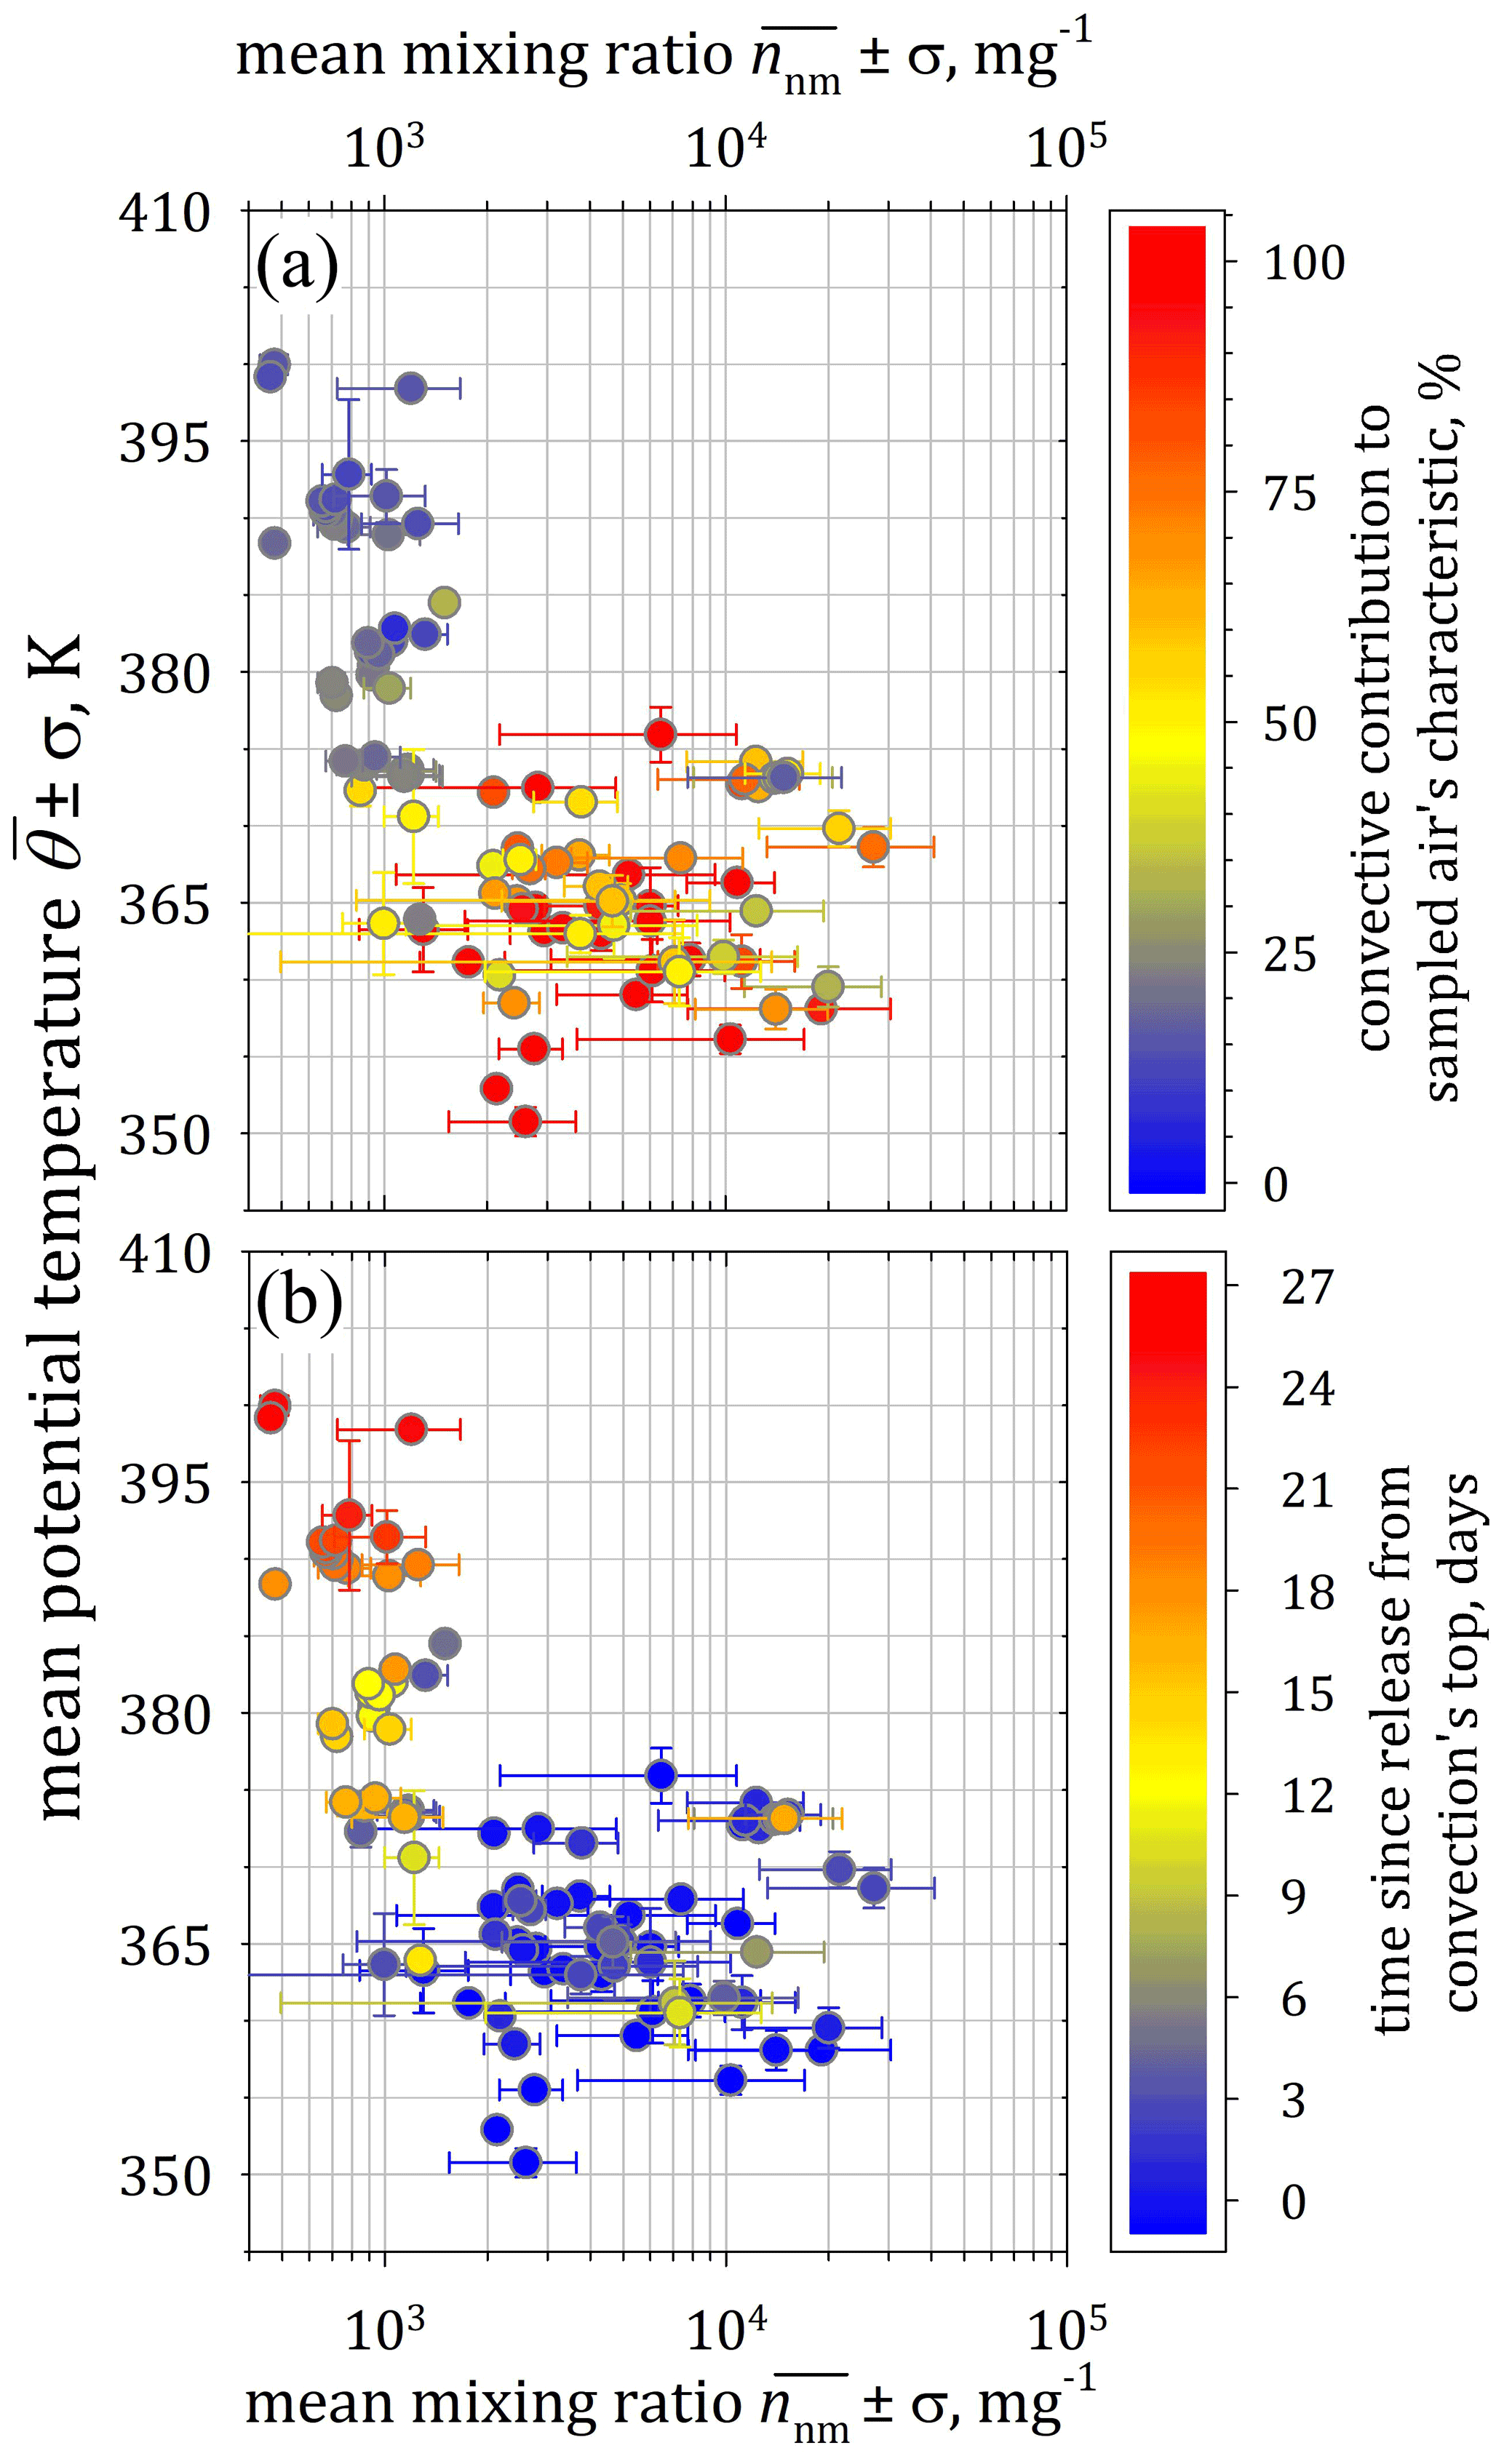
Figure 12Vertical profile of the event-wise mean particle mixing ratio of nucleation-mode particles with standard deviation σ (bars) as a function of the mean potential temperature (± σ). (a) The data points are colour-coded by the proportion of convective contribution to the air sample. (b) The data points are coloured by the time (days) since the release of the air mass at the top of a convective cell.
Figure 12a broadly confirms the general understanding that the main outflow region of deep convection is well below the tropical tropopause (i.e. at 350–370 K), and aloft the air is still rising but at a much lower vertical velocity. At altitudes above ∼ 380 K, the observed NPF events with < 2000 mg−1 generally remain in the lower range of moderate intensity (see Sect. 2.2.1), although there was one of the rare observations of overshooting convection up to levels ∼ 385 K, where NPF was detected in coincidence with ice cloud elements (cf. Weigel et al., 2021). Hence, if in exceptional cases the outflow region of deep convection extends above the 380 K level, as indicated by the presence of ice cloud elements, then high NPF rates are not necessarily to be expected. Below 380 K, about two-thirds of all events are connected to convective influence by more than 75 %. However, a remarkable proportion of observations below 380 K indicate convective contributions of less than 60 % and down to 25 %. Below ∼ 375 K, mean mixing ratios of 1000–2000 mg−1 were associated with 100 % convective contribution, and mixing ratios of more than 10 000 mg−1 were sometimes observed in air masses with ∼ 30 % convective contribution.
For the observed NPF events, Fig. 12b shows the mean age of the probed air masses since their release from the top of individual convective cells. Above ∼ 380 K, the air escaped the convection top mainly 12 d (or more) prior to its probing. Two events at ∼ 382 and at ∼ 385 K, respectively, indicate a more recent convective uplift within 5 d before the air was sampled. Despite the comparatively short transport times, here, the observed remained below 2000 mg−1. At altitudes below ∼ 380 K, the air predominantly resided within the TTL region for less than 5 d prior to the observation. Nevertheless, some of the comparatively intensive NPF events (with ≈ 7000–15 000 mg−1 at ∼ 360–375 K) were observed in air, which has been released from associated clouds' top more than a week (and up to 2 weeks) prior to the measurements. It should be considered, however, that short air mass transport times within the TTL are indicated also for NPF events with minor convective contribution (< 50 %).
From the StratoClim 2017 database emerges that NPF occurs at the lower TTL (i.e. below the tropopause) of the AMA in air masses that have been lifted by convection in time intervals ranging from 5 d to about 2 weeks. However, it remains unclear whether in some of the observed events the air samples were taken at a very advanced stage of NPF. Therefore, it can only be surmised whether or how often the short time period was missed during which NPF is detectable by aircraft-based measurements. Potential uncertainties remain to be considered in connection with the uncertainty in the reanalysis data and the representation of the transport history of the air masses.
If the lifted precursor material would be suitable for NPF and sufficiently enriched right upon release from the convective outflow, the relationship between elevated nnm and convective transport should be clearer than observed (see Sect. 5). The lack of an unambiguous relationship indicates that the recently transported material is deposed in the TTL but not immediately consumed, e.g. by NPF, although the presence of ammonium in the aerosol phase (Höpfner et al., 2019; Wang et al., 2020) or organics should promote the NPF of H2SO4 in the TTL even at low supersaturations (Metzger et al., 2010; Kerminen et al., 2010; Kirkby et al., 2011; Kürten (2019); Wang et al., 2020). The supersaturation required for initiating NPF could temporally result from local cooling. Gravity waves (GWs) represent low-frequency inertial perturbations of the initial atmospheric state. Such a perturbation is expressed particularly by a change in velocity of the vertical wind component. The passage of a GW is associated with a change in the vertical displacement of an air parcel and thus causes locally an adiabatic heating or cooling by a certain absolute value ΔT.
Table 2List of parameters of the wave fit to identify the wave character of two temperature anomalies, which were coincidently observed with two NPF events, respectively, during the StratoClim flight KTM 6 on 6 August 2017.
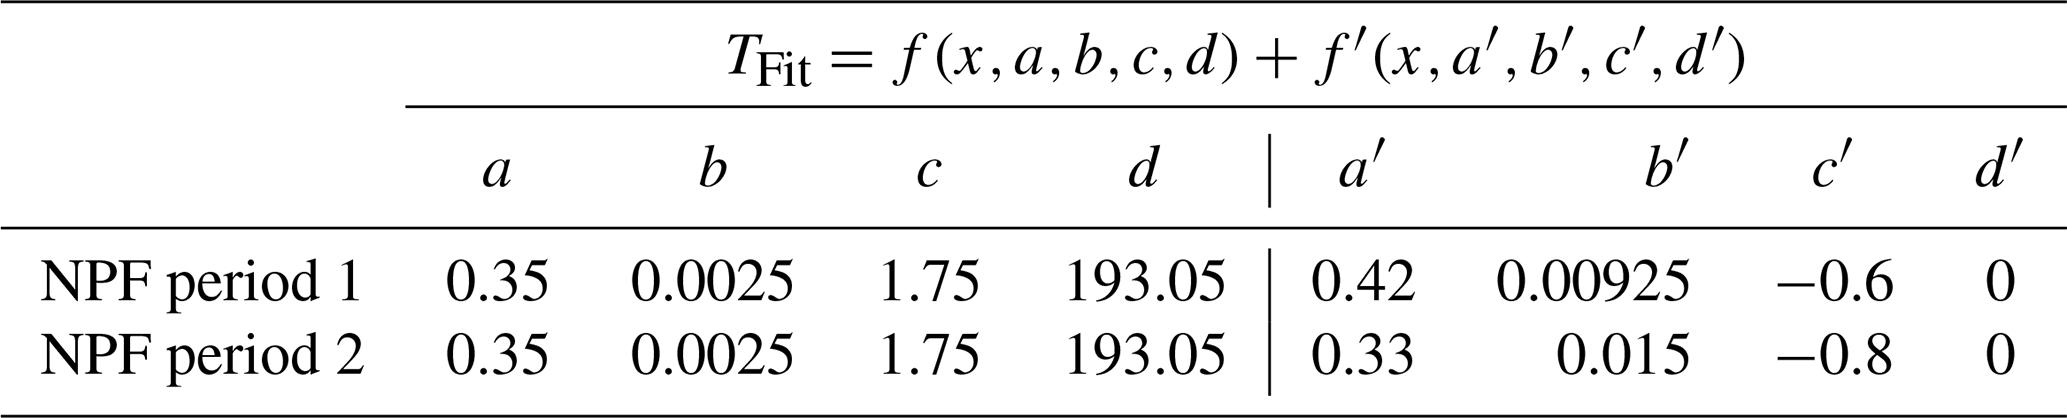
Piani et al. (2000) provided simulations of GWs initiated by deep convection. Their studies reveal a concentric propagation of GWs at altitudes above 15 km and up to ∼ 40 km with wavelengths in the horizontal of about 40 km and of ∼ 4–7 km in the vertical. Similar results were found to be typical by other simulation studies concerning GW propagation at mid-latitudes (Song et al., 2003; Chun and Kim, 2008) or in the tropics (Lane and Moncrieff, 2008). Investigations related to GWs in connection with the monsoon are sparse; e.g. Wright and Gille (2011) and Ern and Preusse (2012) used satellite observations (high-resolution dynamics limb sounder) which, however, are limited to detections of GWs with horizontal wavelengths greater than ∼ 300 km. Despite the numerous observational studies concerning GW properties (Alexander et al., 2010), the indirect retrieval of GWs' horizontal wavelengths remains uncertain by a factor of 2 (or more), whereas instrumental limitations inhibit the GW detection at horizontal wavelengths smaller than 100 km. Based on radiosonde measurements (Vincent and Alexander, 2000), a 6-year-averaged amplitude of 1.5 K is reported as an effect of GWs, with a single-case example of ∼ 4 K amplitude around 20 km altitude in the tropics.
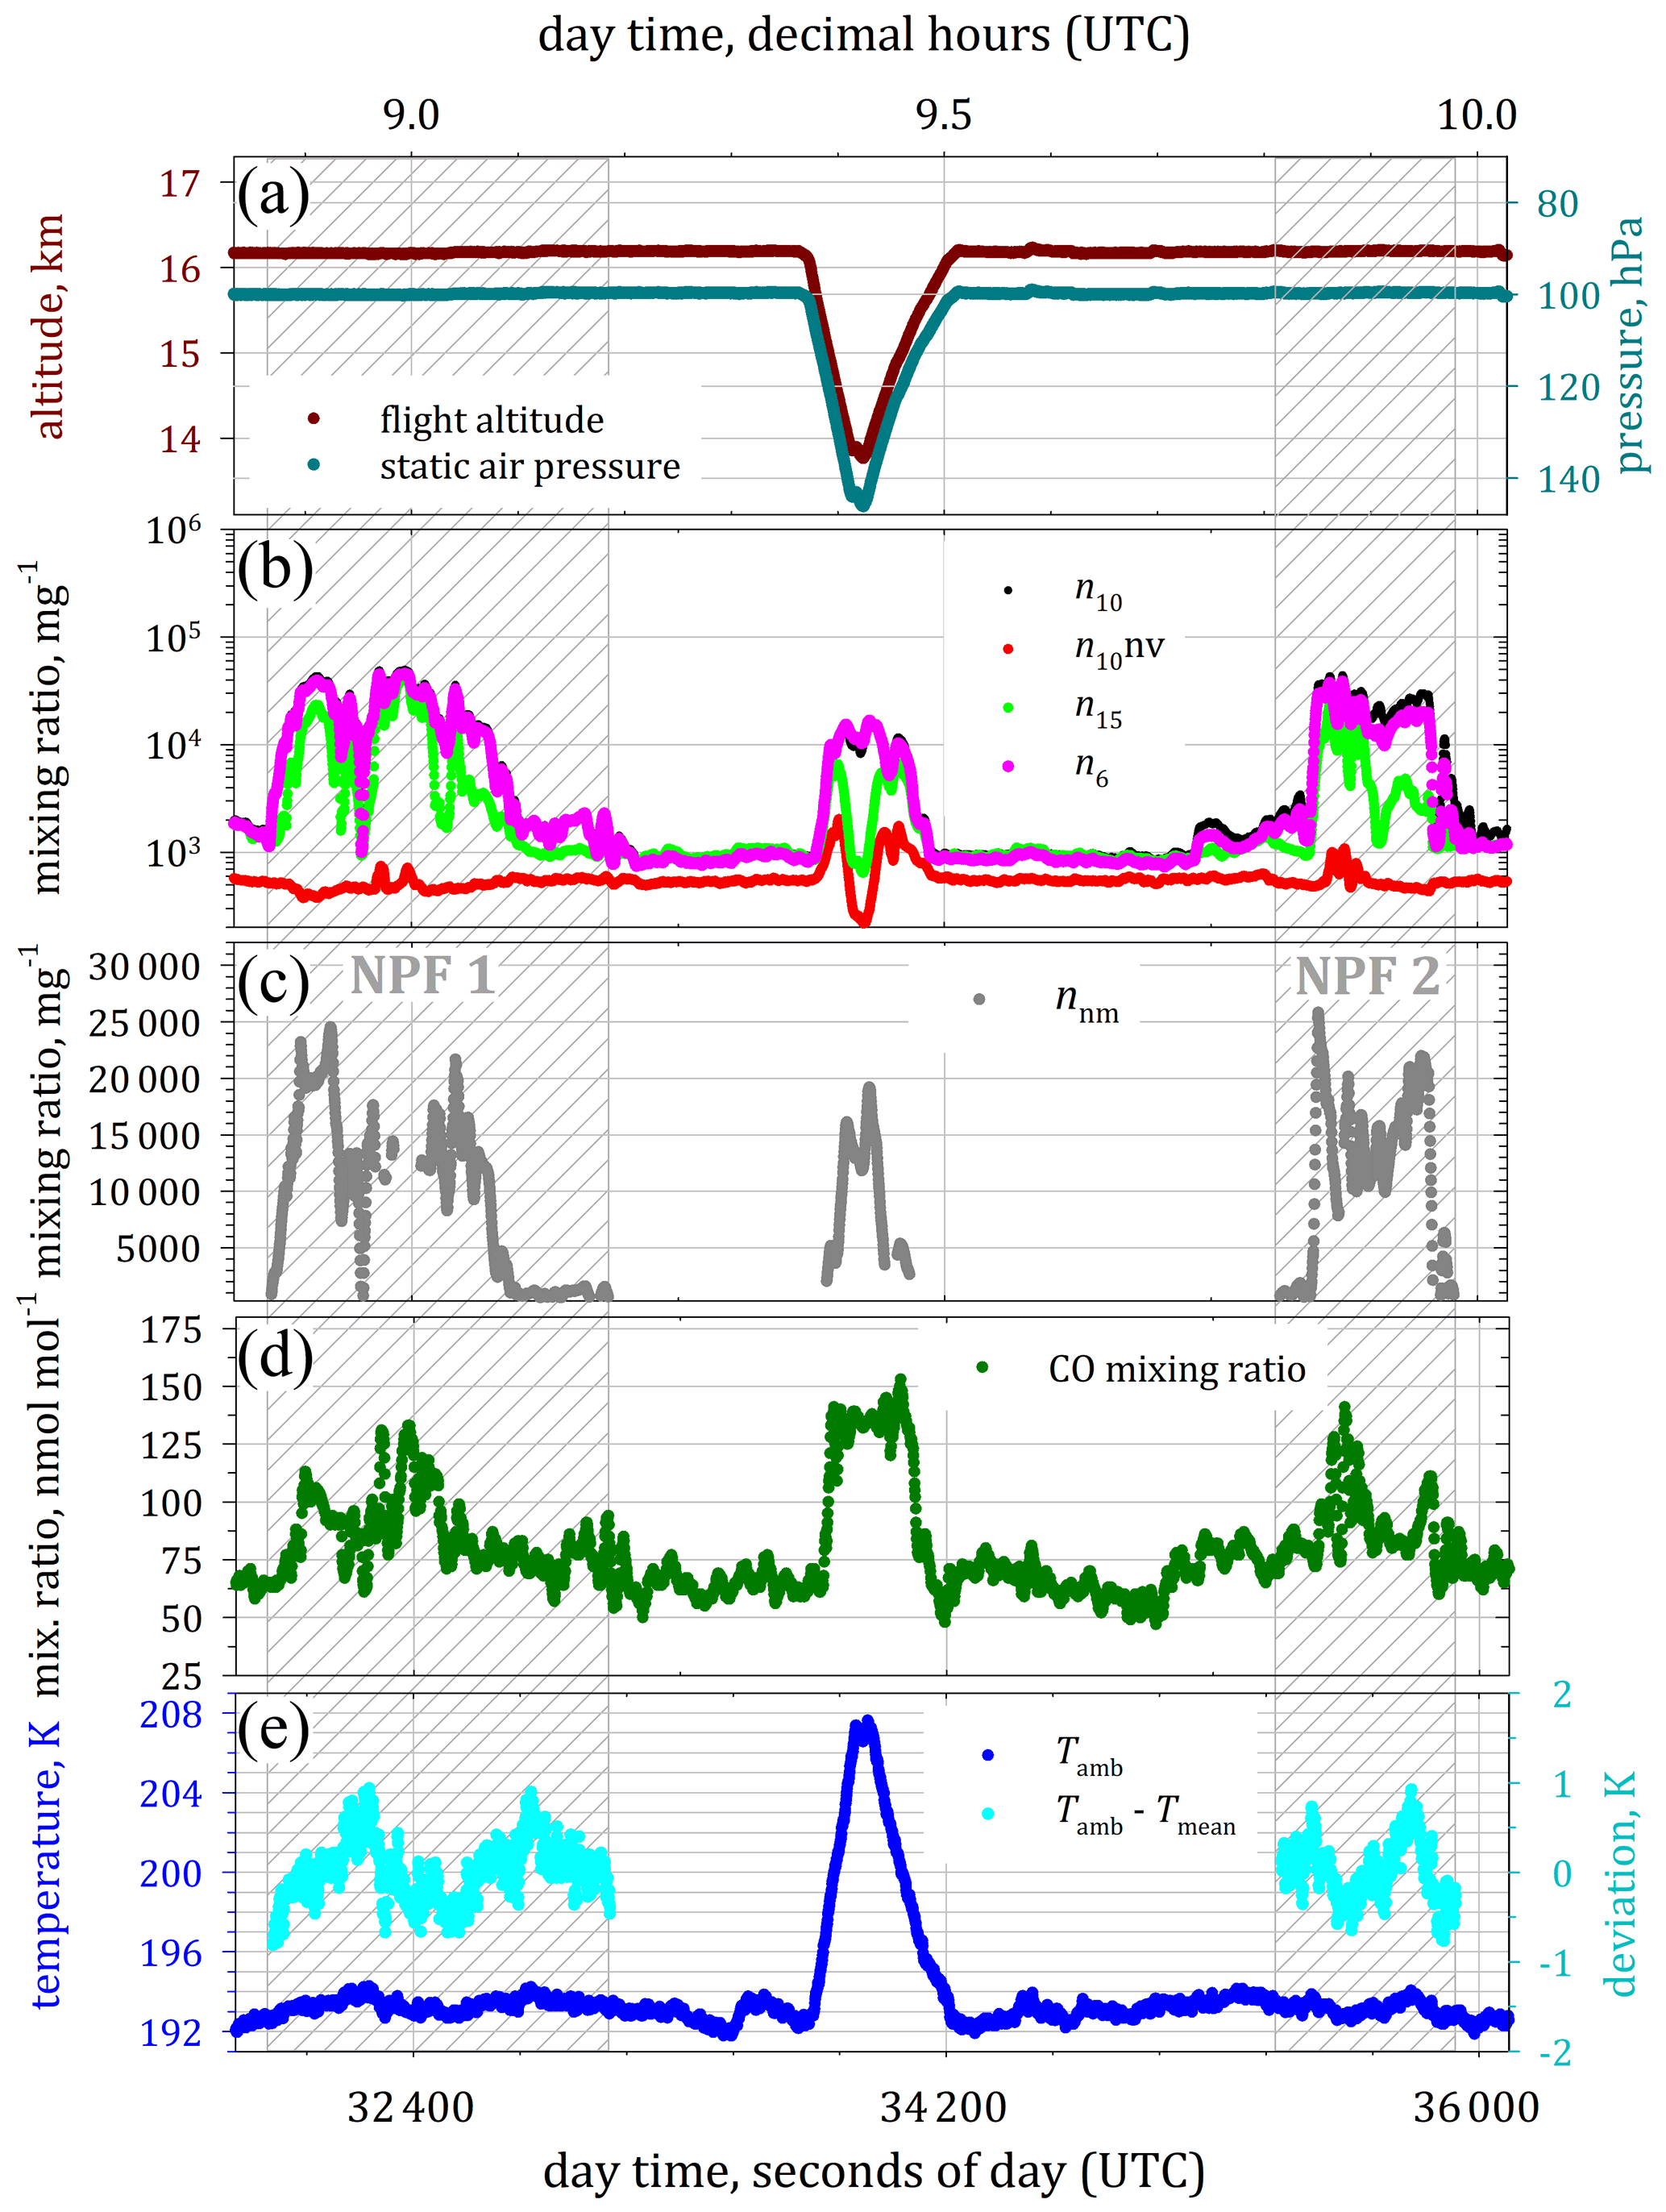
Figure 13Time series of data sampled during a section of a StratoClim 2017 flight (KTM 6) on 6 August 2017. Except the manoeuvre period between 09:20 and 09:30 (UTC), a constant altitude and pressure level (a) were maintained. Particle mixing ratios (n6, n10, n15, and n10nv) (b), the mixing ratio of the nucleation-mode particles (nnm) (c), the CO mixing ratio (d), and the ambient air temperature (Tamb) and the temperature fluctuation (Tamb−Tmean) (e) feature different characteristics and sequence during two NPF phases (oblique hatched areas).
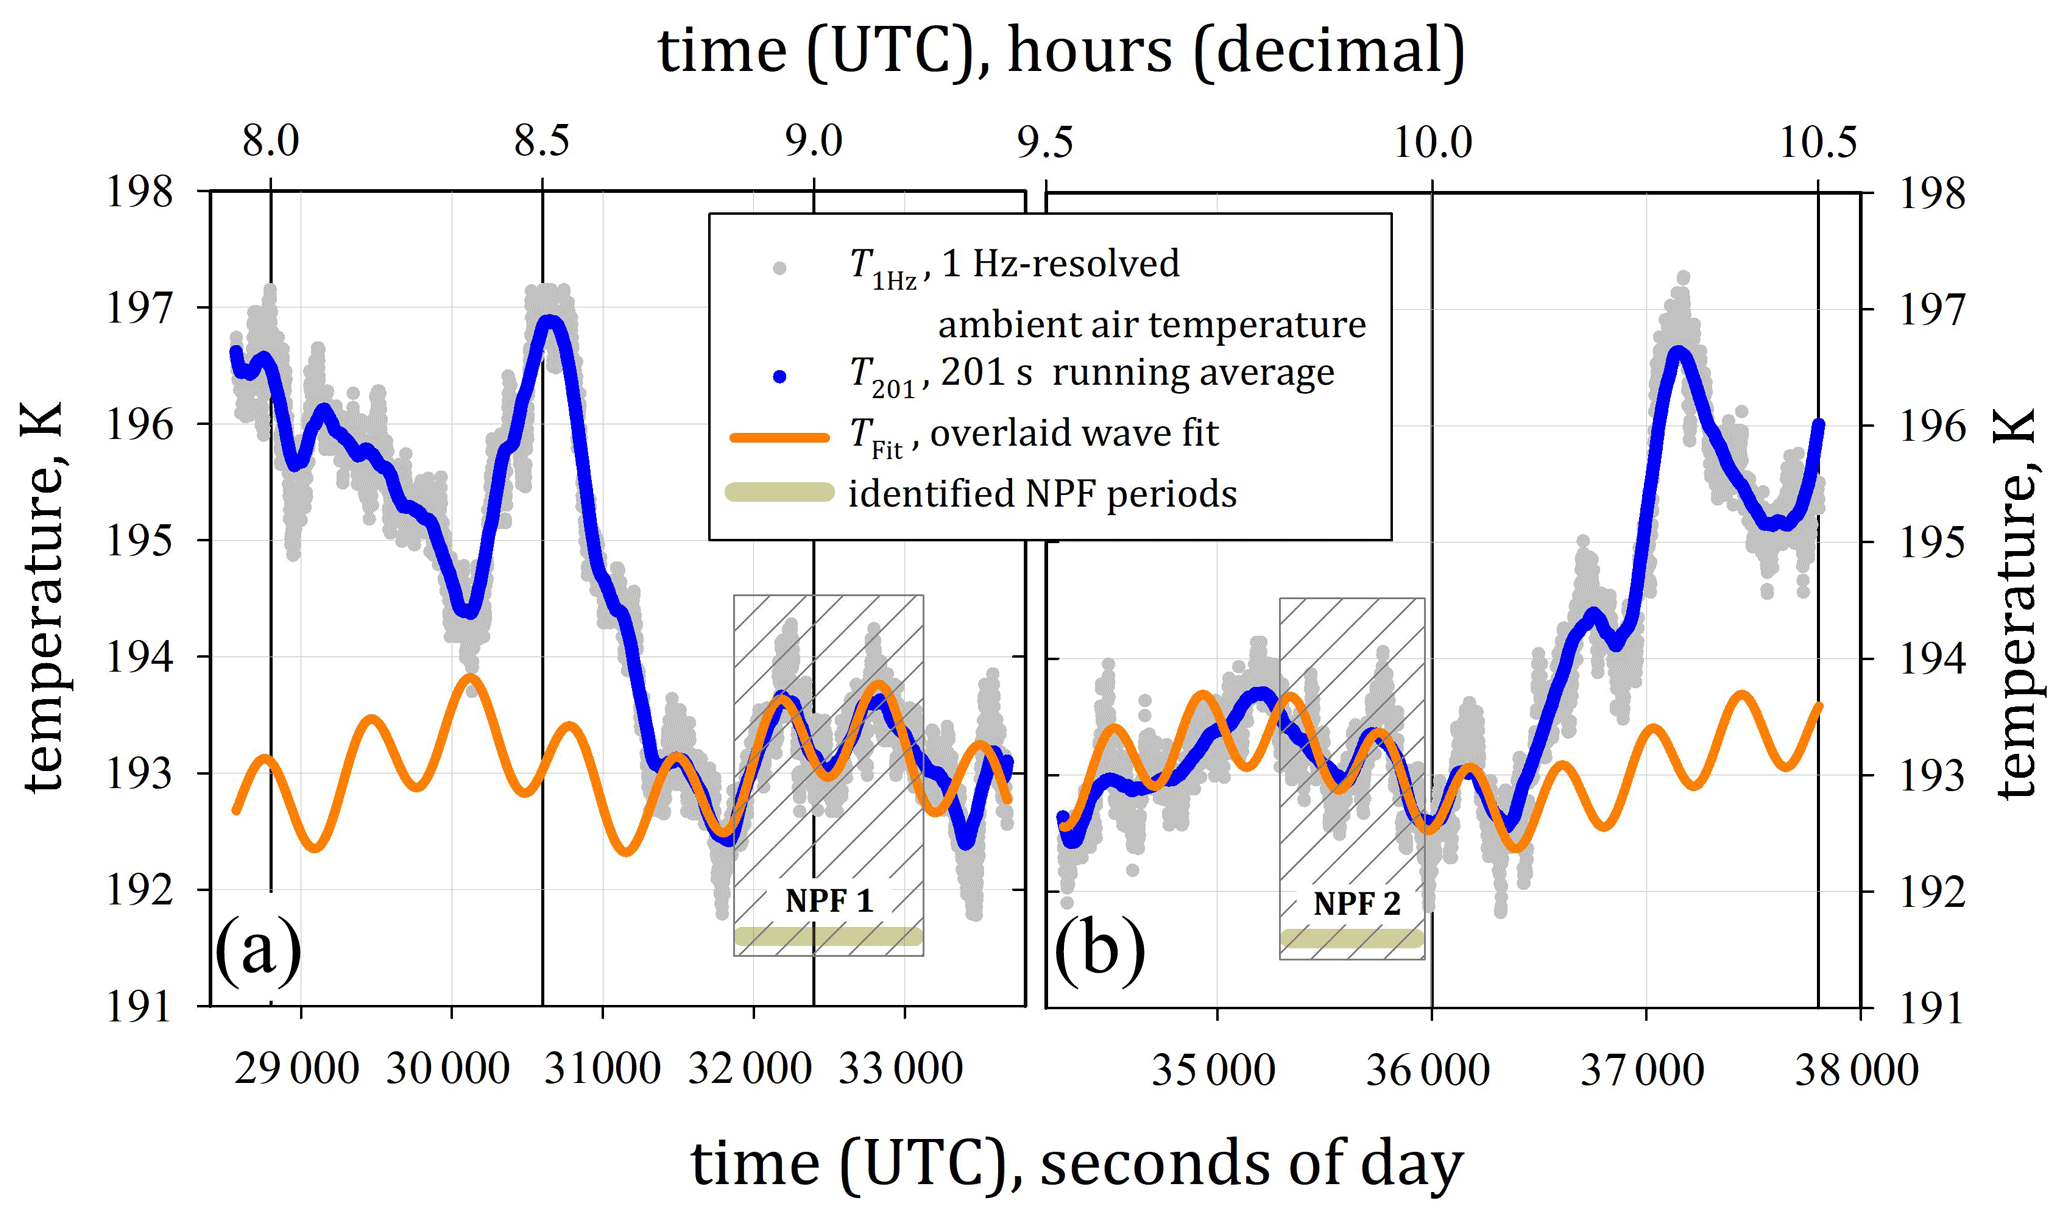
Figure 14Close-up view of the two sections of StratoClim 2017 flight KTM 6 on 6 August 2017 over time ranges of more than 1 h of flight time, respectively, including the two identified NPF periods (horizontal bar in panels a and b). For analysing the observed temperature anomaly, the 1 Hz resolved temperature data are filtered by the noise-reducing running average over 201 data points (T201). The wave fit (TFit) is approximated to the noise-filtered data set within the period of identified NPF (see Appendix B for details). The overlaid fit function approximates the characteristic structure of the observed temperature anomaly only within the two NPF periods.
Satellite images over the Indian subcontinent (e.g. from MSG-1 or HIMAWARI; see https://www.eorc.jaxa.jp/ptree/index.html, last access: 30 July 2021) indicate quite frequent occurrences of convective plumes in the sampling areas during the StratoClim 2017 mission period, which were occasionally arranged in chains of convective cells along the Himalayan foothills. The StratoClim flight KTM 6 on 6 August 2017 enabled NPF observations immediately connected to convection, which penetrated through the flight level on passage at constant flight altitude. The corresponding part of the time series shown in Fig. 13 covers the probing period in the air sector over Bangladesh and the Bay of Bengal (see Fig. 1). Two phases of NPF observations are highlighted (hatched areas in Fig. 13), immediately before and after the period between 09:20 and 09:30 (UTC), during which the flight altitude changed from 16.2 to about 13.8 km with subsequent re-ascent to 16.2 km. The manoeuvre above the northern part of the Bay of Bengal also marks the turning point of the mission flight path, and the two flanking NPF phases were encountered over the mainland near the coastlines of eastern India and Bangladesh (see Fig. 1b). The outbound and return sections of the flight passed through the same convectively active region, and the same convective system was likely probed at opposite positions.
Within the limits of the displayed time series (Fig. 13a) constant flight altitude and pressure level were maintained, except for the turning manoeuvre, which is disregarded in the following discussion. The mixing ratios n6, n10, and n15 coincidentally exhibited increased values of variable strength (Fig. 13b), whereas during both NPF phases the particle mixing ratios nnm are elevated (> 10 000 mg−1) or peak up to values of more than 20 000 mg−1. The course of nnm is not mirrored by the CO signal (Fig. 13d); e.g. nnm is at maximum values when CO is still at intermediate levels of ∼ 110 nmol mol−1. In both NPF phases, the peaks of air's CO content (130–140 nmol mol−1; Fig. 13d) were accompanied by increasing mixing ratios n10nv by a factor of up to 2 compared to the background (Fig. 13b), indicating the passage through the convective outflow plume, which also contained non-volatile aerosol material that was lifted together with gaseous pollutants.
During the periods of the NPF observations, however, the ambient air temperature Tamb (Fig. 13e) visibly fluctuates on the order of ± 1 K around the respective mean temperature (Tmean = 193 K with standard deviation below 1 K). Over the NPF period, the time series of the temperature fluctuation (Tamb − Tmean; Fig. 13e) exhibits the shape of a wave.
Figure 14 shows close-ups of the time series covering slightly more than 1 h of measurement on a level flight, including the two periods of observed NPF (Fig. 14a and b, respectively). The curves exhibit the untreated 1 Hz temperature data set (T1 Hz) and the noise-filtered data set (T201). The filtering was applied using a running average over 201 data points (see Appendix B for details). The filtered data (T201) are additionally approximated with an overlaid wave fit (see Appendix B and Table 2), which aimed at the requirement to reproduce the temperature variation, in particular during the periods of NPF observation. The noise level over the intervals of the mapped time series holds a fairly constant standard deviation σ of about ± 0.25 K. In maxima, the scattering peaks slightly above the 3σ noise level (i.e. about ± 0.75 K), which likely accounts for the largest proportion of uncertainty in the temperature data for this measurement period. The applied fit functions reproduce the wave-like character of the temperature fluctuation during two NPF events with estimated wavelengths between 70 and 100 km (for the higher frequency and in the range of 400 km for the lower frequency). The quality of approximating the noise-reduced data by overlaid wave fit provides indications that the observed temperature fluctuation is subject to a wave that coincides well with the occurrence of NPF.
It would go beyond the scope of this study to clearly attribute this temperature fluctuation to the GW activity initiated by one specific or several convective systems. However, the amplitude and wavelength of the observed fluctuation correspond qualitatively and quantitatively to the values typical for GWs. Simplified estimates reveal that an increase in the H2SO4 saturation ratio by a factor of about 1.75–2 readily occurs when the initial ambient temperature (e.g. at T0 ≈ 190 K) drops by 2 K (see Appendix B). If NPF is initialised by a negative temperature anomaly under supersaturated conditions, the newly formed nucleation-mode particles hardly evaporate at re-rising temperatures (e.g. when the GW-induced temperature anomaly becomes positive).
The horizontal extent of GW-induced temperature anomalies, which can range from a few to hundreds of kilometres, is generally comparable with the magnitude of the horizontal extent of observed NPF fields (see Sects. 2.2.1 and 4.3 as well as Fig. 5c). Since the time offset between NPF observation and NPF initiation is not exactly known, it is not straightforward to connect individual NPF events to specific incidents of GW-induced temperature anomalies. Moreover, during the monsoon season, several widely distributed convective systems may induce GWs at the same time, and the resulting spatially propagating temperature anomalies could interfere at TTL heights. The amplification of temperature anomalies inherent with such interferences is neither locally resolvable nor quantifiable. Hence, GW-induced temperature anomalies can additionally promote the occurrence of NPF.
Between 27 July and 10 August 2017 the airborne StratoClim 2017 mission took place in Kathmandu, Nepal, with eight mission flights (∼ 22.5 h of COPAS measurement time above 10 km, θ ≳ 350 K) up to altitudes of 20 km (θ ≈ 475 K) with the Russian high-altitude research aircraft M-55 Geophysica. The presented analysis comprises the description and discussion of numerous events of new particle formation (NPF), which were observed in the UTLS region of the Asian monsoon anticyclone (AMA) over northern India, Nepal, and Bangladesh.
In total, a duration of 2 h and 38.5 min was spent under NPF conditions in the region of the tropical tropopause layer (TTL), where enhanced quantities of nucleation-mode particles of up to ∼ 50 000 mg−1 (≈ 11 000 cm−3) were detected at heights of 15–16 km (∼ 370 K). The majority of NPF observations with high numbers of nucleation-mode particles (6 nm < dp < 15 nm) were observed below the tropopause (∼ 12–16 km, ∼ 355–380 K), at the lower TTL. NPF with intermediate (∼ 1000–2000 mg−1) or low (∼ 300–500 mg−1) mixing ratios of nucleation-mode particles was also observed around the tropopause (∼ 380 K) and up to about 17.5 km altitude (400 K). The frequency of intense NPF observed during StratoClim 2017 exceeds all previous NPF detections with COPAS in the TTL over Brazil, Australia, and West Africa (TROCCINOX, 2005; SCOUT-O3, 2005; SCOUT-AMMA, 2006; cf. Borrmann et al., 2010; Weigel et al., 2011). The maximum of detected nucleation-mode particles (∼ 50 000 mg−1, correspondent to ∼ 11 000 cm−3 under ambient conditions at 360 K < θ < 370 K) is of orders of magnitude comparable to the earlier COPAS observations (Borrmann et al., 2010; Weigel et al., 2011). The horizontal extent of the NPF fields during StratoClim 2017, ranging from a few hundred metres to about 100 km, compares well to previous COPAS observations in the tropics.
Mainly due to coagulation, the persistence of nucleation-mode particles (dp < 15 nm) in the presence of the background aerosol population is limited to a few hours only. Within the supersaturated environment under NPF conditions, co-condensation of gaseous species other than NPF precursors further promotes the growth of nucleation-mode particles. The comparatively short persistence of the particles in the nucleation-mode size range implies the following:
-
Within 2 h after an NPF event, the number concentration of nucleation-mode particles decays due to coagulation by more than 1 order of magnitude.
-
About 3–4 h after an NPF event, the reduced number of nucleation-mode particles impedes the identification of NPF events based on aircraft-borne in situ measurements.
-
Low and intermediate numbers of nucleation-mode particles result from either moderate and just-proceeding NPF or from an event with elevated NPF rate that has phased out over more than 2 h before the measurement.
-
Identified NPF events with a great abundance of nucleation-mode particles (i.e. > 10 000 mg−1) have occurred very shortly (less than 1 h) prior to the measurement or are just proceeding when detected.
The supersaturated conditions, under which NPF occurs also favour the co-condensation of gaseous substances (Yu et al., 2017). Whether or not coagulation or condensation predominantly contributes to the composition of the background aerosol remains open. Most likely, both processes impact the formation and persistence of the ATAL (Vernier et al. 2011a; see also Höpfner et al., 2019; Mahnke et al., 2021), which was mainly attributed to the uplift of pollution from the boundary layer (Vernier et al., 2018; Brunamonti et al., 2018; Hanumanthu et al., 2020).
Generally, a refractory core with diameter greater than 10 nm was detected in almost every second particle above 395 and up to 475 K. In addition to the local particle source by NPF, additional particulate material is vertically transported by the updraught within the AMA (see also Sect. 6). At altitudes above 18 km, the contribution of meteoric particles from further aloft was found by means of in situ aerosol mass spectrometry during StratoClim 2017 (Schneider et al., 2021).
At altitudes of up to 17.5 km, the fresh particles from NPF are in place for being lifted by a sufficiently effective transport mechanism to indirectly supply the stratospheric (Junge) aerosol layer. However, whether or not aerosol material subsides from TTL levels to mid-tropospheric altitudes and possibly contributes to cloud formation, as suggested by Andreae et al. (2018) to happen in the Amazon region, depends on the efficiency of downward transport and on the aerosol's capability as CCN. Condensation of gaseous species other than those involved in the NPF process and internal chemical conversion of various solutes within a particle influence the aerosols' CCN capabilities. The required transport times to reach altitudes far above or below the TTL range from several days to weeks and stay in contrast to the short persistence (hours) of nucleation-mode particles.
Moreover, the StratoClim 2017 measurements revealed the following:
-
The highest nnm values were predominantly found to coincide with intermediate to elevated CO mixing ratios of ∼ 100 nmol mol−1. Beyond that, the mixing ratio of nucleation-mode particles (∼ 700–20 000 mg−1) is largely independent of the CO content (between 80 and 145 nmol mol−1) of the air at the lower TTL.
-
The most intensive uplift of air was confirmed to occur over the Himalayas and their foothills. However, particular source regions of NPF precursors were not ascertainable within the BL. No indication was found that the most intense NPF was connected to short durations of air mass transport from the BL into the TTL.
-
The convective contribution to the air mass composition did not determine the intensity of the observed NPF. The release of the precursor material in the outflow region of the convective top had occurred up to 6 d before the NPF observation. Occasionally, however, air mass residence times of more than 6 d and up to 14 d were found at TTL levels prior to the NPF detection, while the entire data set covers residence times from ∼ 3 h to about 26 d.
For the period of the StratoClim 2017 mission, the observed NPF rates are not unambiguously attributable to (a) a specific source region in the BL, (b) the effectiveness of the convective vertical transport, or (c) the recent release of NPF-capable material from the convective outflow.
Nevertheless, it is the convective uplift which intermittently supplies the lower TTL with NPF precursor material. At altitudes well above tropopause levels, such an immediate supply by convection is lacking and could alternatively only proceed by the slow uplift superimposed on the anticyclonic ascent of the AMA (∼ 1 K d−; Vogel et al., 2019; von Hobe et al., 2021).
Alternatively, adiabatic cooling could induce sufficient supersaturation of an NPF precursor e.g. due to temperature anomalies associated with gravity waves (GWs). The presented case study based on a continuous level-flight segment (flight KTM 6 on 6 August 2017) revealed wave-like temperature anomalies with a peak-to-peak amplitude of ΔT = 2 K and a horizontal wavelength of 70–100 km, which matched well with two independent NPF events. Hence, the vertical propagation of GW-induced temperature anomalies can initialise NPF above tropopause levels (a) where ambient air temperatures re-increase with altitude (from observational data with ΔT ≈ 1.5 K per Δθ = 10 K), which principally counteracts the supersaturation of a precursor, and (b) where in the absence of deep convection a direct supply of precursor material from below is lacking.
The observations made during StratoClim 2017 demonstrate that frequent NPF with high production of nucleation-mode particles is capable of directly affecting the extent and persistence of the Asian tropopause aerosol layer (ATAL). The continuous supply of freshly formed aerosol material, which coagulates both internally and with the background aerosol and which itself provides a surface for the condensation of supersaturated gaseous substances, contributes significantly to the available aerosol material that composes the ATAL. In this case, the chemical composition of the ATAL aerosol includes significant fractions of the material which was previously involved in the NPF process and the particles' condensational growth, which is subject to further investigation using the StratoClim 2017 data set.
COPAS includes a vaporiser based on an established and commonly used technique. One of the four COPAS channels is equipped with a heated stainless steel tube (at ∼ 270 ∘C) to vaporise volatile compounds upstream of one of the particle detectors. The specific heating temperature is chosen with the aim of vaporising mainly stratospheric particle species, which typically consist of aqueous solutions of sulfuric acid (H2SO4–H2O) and/or nitric acid (HNO3–H2O), which reportedly volatilise at 180 ∘C (Rosen, 1971). In addition, most volatile and several semi-volatile organic compounds can evaporate at colder temperatures than 270 ∘C. Conversely, this means that an undeterminable proportion of semi-volatile and probably highly oxidised organics, whose role as agents in NPF has been identified by Kurtén et al. (2008) or Riccobono et al. (2014), can pass through the preheater without being significantly altered. Downstream of the heated tube section, the re-condensation of evaporated species is not completely excludable. Due to the high diffusivity of, for example, H2SO4 molecules (a factor of up to 0.5 of the diffusivity of H2O; see Tang et al., 2014), the re-condensation is expected to occur predominantly at the tube's inner walls since thermophoresis drives the vapour molecules from the previously heated air sample towards the cold walls. Such a re-condensation affects the particles' size, not their number, and condensation on the largest of the non-volatile residues is favoured over the smaller ones (i.e. those with dp < 10 nm). The working principle of the COPAS aerosol vaporiser was demonstrated by means of laboratory experiments with pure H2SO4–H2O particles of several sizes and at pressure conditions between 70–300 hPa (Weigel et al., 2009); more than 98 % of the sub-micrometre-sized H2SO4–H2O particles were volatilised. As the refractory material, which could be detectable with COPAS, is unlikely to be generated by the heater itself, such instrumental artefacts are largely excluded. To avoid artefacts as a result of, for example, re-suspension of aerosol material, which had been deposited on the tube's inner walls during previous operations, the sample lines were flush-cleaned with ethanol and distilled water at least before every second mission flight. Inefficiencies of the vaporiser, e.g. due to diminished heat transfer from the tube's inner wall to the passing aerosol particles, particularly at low atmospheric pressures, would cause the number (fraction) of detected refractory particles to be unexpectedly high (≈ 100 %) over extended measurement periods, which was not observed throughout the field missions (cf. Borrmann et al., 2010; Weigel et al., 2011). Conversely, instrumental artefacts inherent to the vaporiser's tube length, e.g. particle loss, would lead to comparatively low number concentrations of detected refractory particles. Diffusional loss effects increase with decreasing pressure, but thermophoresis counteracts the particles' diffusion towards the hot tube walls. With the same vaporiser system, Weigel et al. (2014) observed rising mixing ratios of refractory aerosol, most likely from meteoric ablation, with altitude at stratospheric levels inside the polar vortex, while outside the vortex the number of refractory aerosols nearly stagnated over the corresponding altitude range, additionally confirming the principle function of the vaporiser.
For analysing the observed temperature anomaly in the time intervals of the NPF events, a running average is used as a filter to suppress the high-frequency noise in the temperature data. The running average over 201 measurement points (i.e. over 100 data points before and 100 data points after each 1 Hz temperature measurement) is used; Fig. B1 illustrates the effectiveness of the filtering. As a result of subtracting the low-pass-filtered temperature data (T201) from the initial 1 Hz resolved temperature data (T1 Hz), the high-frequency noise remains (red dots in Fig. B1). The noise scatters around the zero level with a maximum amplitude of about ± 0.75 K. The filtering by the running mean turns out to be equally effective inside and outside the observed NPF events with presumed temperature fluctuation. The indicated reference lines for the ± 1σ and ± 3σ levels (where σ denotes the standard deviation) illustrate the noise amplitude, which remains fairly constant (during NPF and away from observed NPF events) over the entire period and also almost within the ± 3σ range. The course of the T201 curves thus represents the temperature fluctuation by excluding the noise which underlies the measurement. The T201 curve is approximated by a wave fit (TFit) for reproducing the temperature fluctuation in the filtered data set (T201), particularly during the periods of NPF observation (see Sect. 6 and Fig. 14).
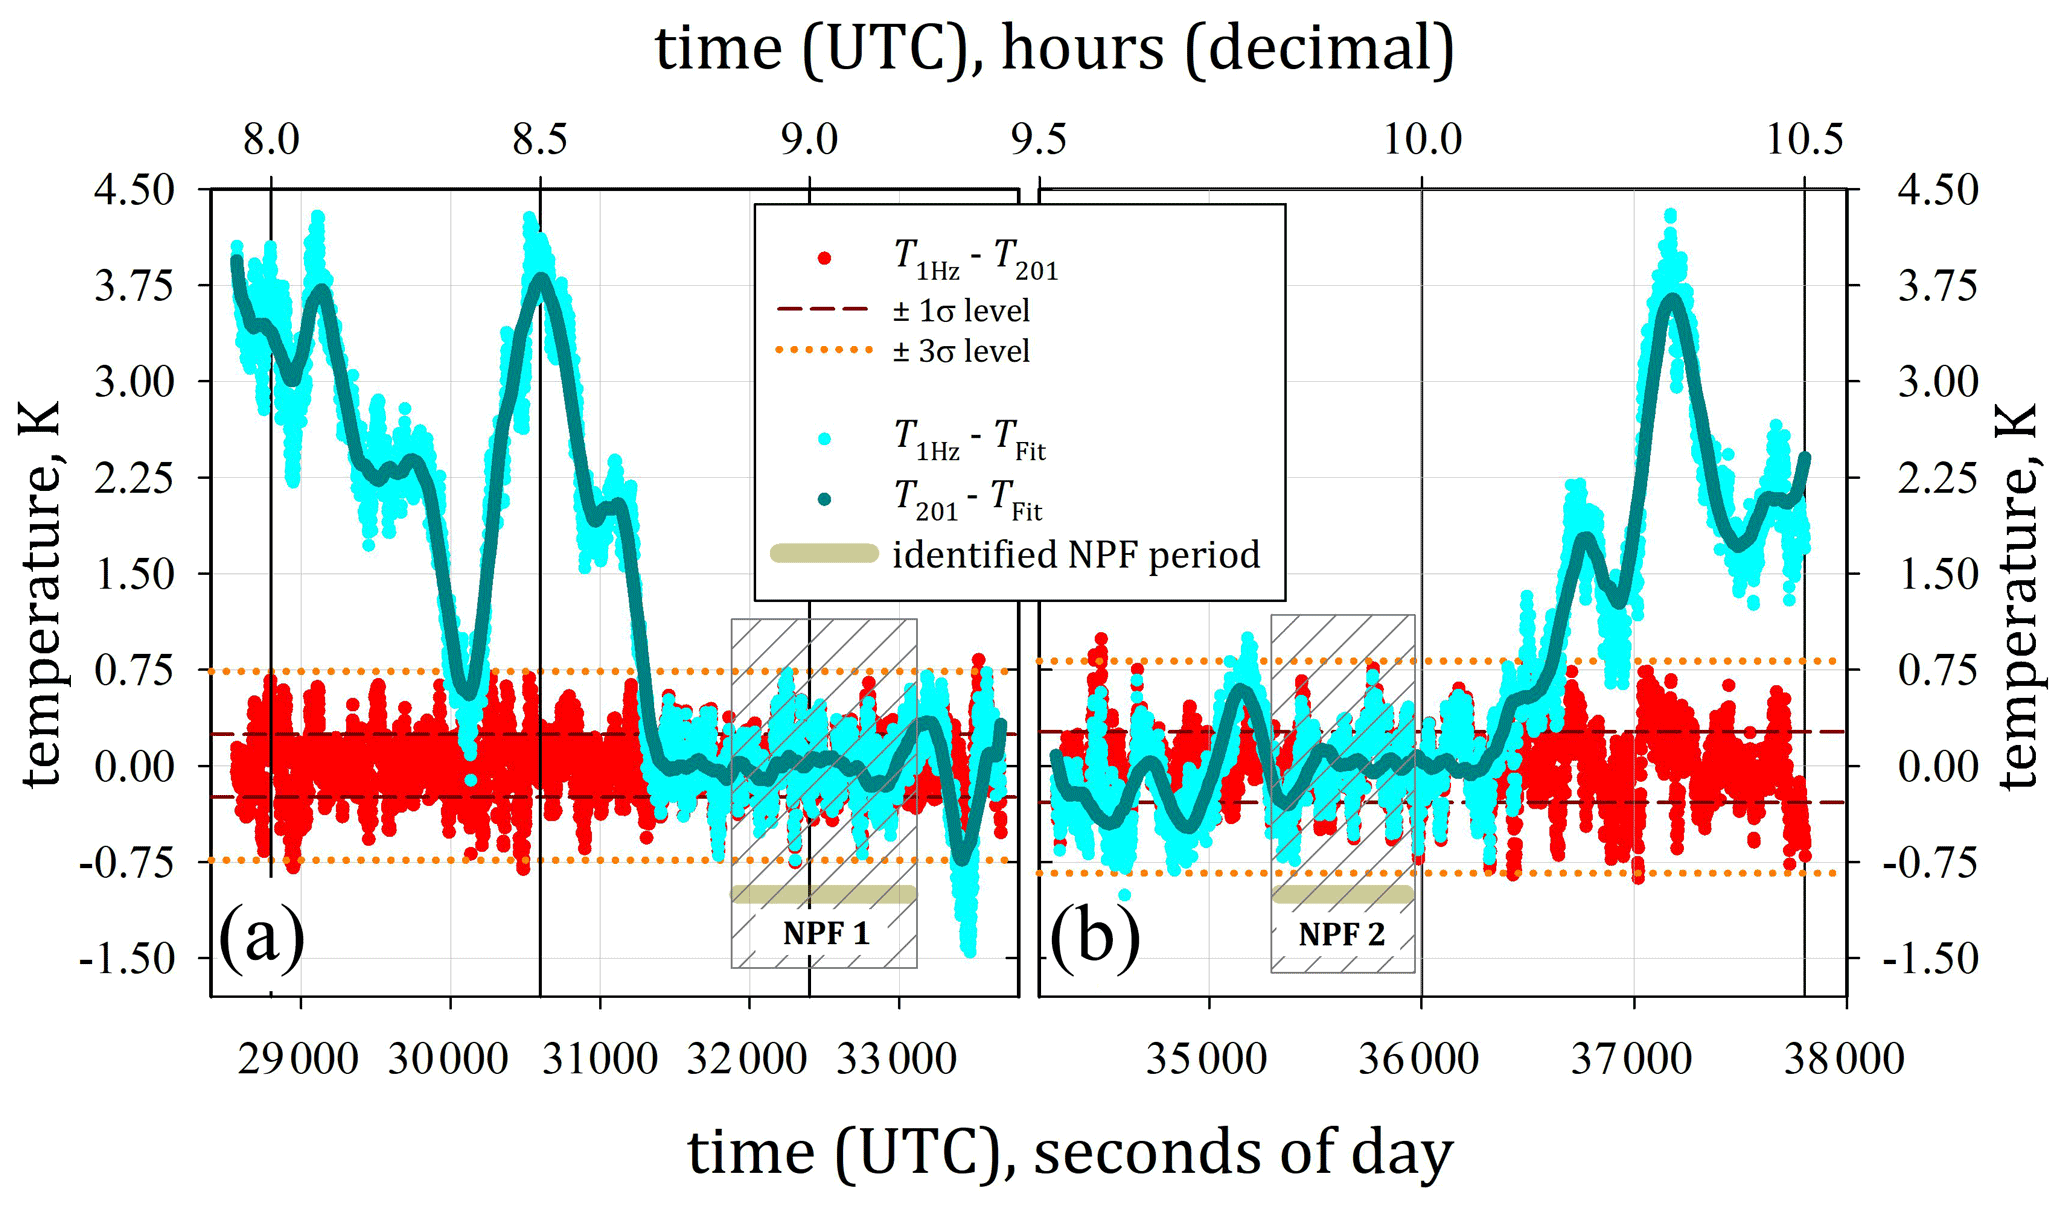
Figure B1For the time intervals shown in Fig. 14, the difference between the 1 Hz data (T1 Hz) and the filtered data with 201 s running average (T201) reveals the high-frequency noise of the temperature measurement (red data points). The dashed reference lines indicate the standard deviation (± 1σ and ± 3σ) of the noise signal within given time intervals. The effectiveness of the wave fit approximation to the filtered data set during the NPF periods is represented by the difference T201−TFit. During NPF this deviation is small, while away from NPF the wave fit increasingly deviates from the temperature measurement. The deviation of the overlaid wave fit from the untreated 1 Hz signal is shown with the differences T1 Hz−TFit; during NPF mainly the noise signal remains.
The basic form of the wave fit function is
where x is the horizontal distance derived from time (UTC) in seconds of the day (since midnight) and mean airspeed; a is the amplitude; b is the frequency; c is the phase shift; and d is the offset.
For each of the two time periods with identified NPF, an individual fit was determined with the parameters from Table 2, and each fit consists of a sum of two functions of the type defined in Eq. (A1). During the NPF event the difference between the two curves, T201 and TFit (Fig. B1), shows that the overlaid wave fit approximates the filtered data with a smaller deviation than given with the ± 1σ noise level. The difference between the 1 Hz temperature signal and the wave fit is also shown in Fig. B1. During the NPF event, the subtraction of the wave fit from the 1 Hz data has almost the same effect as the subtraction of the filtered T201 from T1 Hz; therefore, in the NPF period, the deviation between the two sets of data (T1 Hz−TFit) corresponds mainly to the noise of the temperature measurement. Away from the NPF event, the deviation of the wave fit from T1 Hz and T201 increases as the approximation of the temperature data by the wave function was constrained to the NPF period.
The passage of a gravity wave is associated with adiabatic heating or cooling by a certain amount ΔT. According to Vincent and Alexander (2000) (see also Sect. 6), the maximum realistic value of ΔT is ∼ 4 K. Smaller temperature perturbations occur more frequently. An air parcel at pressure p0 and temperature T0 which is vertically and adiabatically displaced, changes its pressure and temperature to the new values p and T = T0+ΔT. The question arises as to how temperature anomalies influence the occurrence of NPF. In this context, NPF is initialised when the saturation of a nucleating gas or gas mixture exceeds a certain level. Pure sulfuric acid is certainly not the exclusive gas species involved in NPF, but if temperature anomalies sufficiently affect the saturation ratio of pure H2SO4, then additional agents such as ammonium (Höpfner et al., 2019) or organics (Kürten, 2019) could more readily favour the initiation of NPF.

Figure C1Simulated influence of temperature anomalies (up to ∼ 4 K) on the quotient of saturation ratios of pure sulfuric acid (H2SO4) in reference to any initial saturation ratio S0 (including supersaturation) over a range of initial air temperatures at which NPF was observed during StratoClim 2017.
Adiabaticity of the process is presumed, and by approximating the gas constant R and the heat capacity cp with the values for dry air (R ≈ Ra and cp ≈ cpa), the ideal gas equation can be converted such that the mixing ratio of sulfuric acid is related to its partial pressure . Since the conditions within the AMA change rather slowly, the mixing of air masses is considered to be negligible. Hence, the concentration of each gas species within the air parcel remains invariant to the vertical displacement. In the following, is the sulfuric acid partial pressure within the unperturbed air parcel. Denoting the saturation vapour pressure of sulfuric acid as psat, the quotient of the saturation ratios of the unperturbed air parcel and the displaced air parcel reads as
Figure C1 exhibits the quotient (i.e. the factorial increase in the saturation ratio S in reference to an initial saturation ratio S0 at undisturbed conditions, including supersaturated states) for several initial states of ambient air temperature T0 (from 185 to 250 K) and for a range of temperature anomalies with ΔT of up to 4 K. It is to be emphasised that these calculations relate specifically to the impact of temperature anomalies on the supersaturation of pure H2SO4. These estimates based on ordinary precursors (i.e. H2SO4–H2O) do not allow for conclusions concerning the NPF efficiency of complex systems of precursor compositions (e.g. including ammonia or organics). The demonstrated effect, however, is qualitatively transferable to any gaseous substance, while the nucleation of particles from the gas phase requires sufficiently high saturation ratios of the respective species or gas mixture and may be of particular interest in the context of the CLOUD experiments at CERN with H2SO4 (cf. Stolzenburg et al., 2020) under variable conditions and various admixtures.
The data shown in this study will be available from the HALO database at https://halo-db.pa.op.dlr.de/mission/101 (last access: 30 July 2021) (German Aerospace Center, 2021), or they may be provided by respective PI upon request.
RW evaluated and analysed the data, created the figures, and drafted the manuscript with contributions by CM, MB, and AD. SB participated in the data analyses and the manuscript drafting. The code of the coagulation simulation was provided by BPL, and the code was adapted by MB, while the calculations were performed by CM. BV and FP contributed with meteorological reanalyses; BV, SiB, and BL performed the air mass trajectory analyses. SV and FD took care of the CO data. UCSE data were delivered by GB. The manuscript was reviewed by CM, MB, AD, BV, FP, SV, FD, SiB, BL, BPL, and SB.
The authors declare that they have no conflict of interest.
Publisher's note: Copernicus Publications remains neutral with regard to jurisdictional claims in published maps and institutional affiliations.
This article is part of the special issue “StratoClim stratospheric and upper tropospheric processes for better climate predictions (ACP/AMT inter-journal SI)”. It is not associated with a conference.
The contributions from the technical staff at the workshops of the MPI for Chemistry and the Institute for Physics of the Atmosphere (Johannes Gutenberg University Mainz) as well as the Myasishchev Design Bureau (MDB) were essential. In particular, we acknowledge the support of Thomas Böttger, Michael Flanz, and Wilhelm A. Schneider. We thank Young-Ha Kim, Peter Spichtinger, Holger Tost, Miklós Szakáll, Alexander Theis, Annette Miltenberger, Troy Thornberry, and the ACCLIP team for very helpful discussions. Many thanks to Thomas Peter for the planning of flight KTM 6 on 6 August 2017. The extraordinary commitment of Fred Stroh in realisation of the campaign and the leadership of the entire StratoClim project by Markus Rex are gratefully acknowledged. We very much thank the MDB crew and the M-55 Geophysica pilots. We explicitly thank the officials of the Nepalese government authorities, research institutions, and Tribhuvan Airport as well as of the German embassy in Nepal for their extraordinary support and hospitality, which enabled our field campaign and research.
Some of our research leading to the presented results received funding from the European Research Council under the European Union's Seventh Framework Programme (FP/2007-2013) ERC grant agreement no. 321040 (EXCATRO). The StratoClim project was funded by the EU (FP7/2007-2018 grant no. 603557) and also supported by the German “Bundesministerium für Bildung und Forschung” (BMBF) under the joint ROMIC project SPITFIRE (01LG1205A). The work presented includes contributions to the NSFC–DFG 2020 project ATALtrack (BO 1829/12-1 and VO 1276/6-1).
This paper was edited by Martina Krämer and reviewed by two anonymous referees.
Alexander, M. J., Geller, M., McLandress, C., Polavarapu, S., Preusse, P., Sassi, F., Sato, K., Eckermann, S., Ern, M., Hertzog, A., Kawatani, Y., Pulido, M., Shaw, T. A., Sigmond, M., Vincent, R., and Watanabe, S.: Recent developments in gravity-wave effects in climate models and the global distribution of gravity-wave momentum flux from observations and models, Q. J. Roy. Meteor. Soc., 136, 1103–1124, https://doi.org/10.1002/qj.637, 2010.
Andreae, M. O., Afchine, A., Albrecht, R., Holanda, B. A., Artaxo, P., Barbosa, H. M. J., Borrmann, S., Cecchini, M. A., Costa, A., Dollner, M., Fütterer, D., Järvinen, E., Jurkat, T., Klimach, T., Konemann, T., Knote, C., Krämer, M., Krisna, T., Machado, L. A. T., Mertes, S., Minikin, A., Pöhlker, C., Pöhlker, M. L., Pöschl, U., Rosenfeld, D., Sauer, D., Schlager, H., Schnaiter, M., Schneider, J., Schulz, C., Spanu, A., Sperling, V. B., Voigt, C., Walser, A., Wang, J., Weinzierl, B., Wendisch, M., and Ziereis, H.: Aerosol characteristics and particle production in the upper troposphere over the Amazon Basin, Atmos. Chem. Phys., 18, 921–961, https://doi.org/10.5194/acp-18-921-2018, 2018.
Barth, M. C., Stuart, A. L., and Skamarock, W. C.: Numerical simulations of the July 10, 1996, Stratospheric-Tropospheric Experiment: Radiation, Aerosols, and Ozone (STERAO)-Deep Convection experiment storm: Redistribution of soluble tracers, J. Geophys. Res.-Atmos., 106, 12381–12400, https://doi.org/10.1029/2001jd900139, 2001.
Baumgartner, M., Weigel, R., Harvey, A. H., Plöger, F., Achatz, U., and Spichtinger, P.: Reappraising the appropriate calculation of a common meteorological quantity: potential temperature, Atmos. Chem. Phys., 20, 15585–15616, https://doi.org/10.5194/acp-20-15585-2020, 2020.
Bergman, J. W., Jensen, E. J., Pfister, L., and Yang, Q.: Seasonal differences of vertical-transport efficiency in the tropical tropopause layer: On the interplay between tropical deep convection, large-scale vertical ascent, and horizontal circulationes, J. Geophys. Res.-Atmos., 117, D05302, https://doi.org/10.1029/2011jd016992, 2012.
Bergman, J. W., Fierli, F., Jensen, E. J., Honomichl, S., and Pan, L. L.: Boundary layer sources for the Asian anticyclone: Regional contributions to a vertical conduit, J. Geophys. Res.-Atmos., 118, 2560–2575, https://doi.org/10.1002/jgrd.50142, 2013.
Bianchi, F., Junninen, H., Bigi, A., Sinclair, V. A., Dada, L., Hoyle, C. R., Zha, Q., Yao, L., Ahonen, L. R., Bonasoni, P., Buenrostro Mazon, S., Hutterli, M., Laj, P., Lehtipalo, K., Kangasluoma, J., Kerminen, V. M., Kontkanen, J., Marinoni, A., Mirme, S., Molteni, U., Petäjä, T., Riva, M., Rose, C., Sellegri, K., Yan, C., Worsnop, D. R., Kulmala, M., Baltensperger, U., and Dommen, J.: Biogenic particles formed in the Himalaya as an important source of free tropospheric aerosols, Nat. Geosci., 14, 4–9, https://doi.org/10.1038/s41561-020-00661-5, 2021.
Borrmann, S., Kunkel, D., Weigel, R., Minikin, A., Deshler, T., Wilson, J. C., Curtius, J., Volk, C. M., Homan, C. D., Ulanovsky, A., Ravegnani, F., Viciani, S., Shur, G. N., Belyaev, G. V., Law, K. S., and Cairo, F.: Aerosols in the tropical and subtropical UT/LS: in-situ measurements of submicron particle abundance and volatility, Atmos. Chem. Phys., 10, 5573–5592, https://doi.org/10.5194/acp-10-5573-2010, 2010.
Brock, C. A., Hamill, P., Wilson, J. C., Jonsson, H. H., and Chan, K. R.: Particle Formation in the Upper Tropical Troposphere: A Source of Nuclei for the Stratospheric Aerosol, Science, 270, 1650–1653, https://doi.org/10.2307/2887916, 1995.
Brock, C. A., Schröder, F., Kärcher, B., Petzold, A., Busen, R., and Fiebig, M.: Ultrafine particle size distributions measured in aircraft exhaust plumes, J. Geophys. Res.-Atmos., 105, 26555–26567, https://doi.org/10.1029/2000jd900360, 2000.
Brunamonti, S., Jorge, T., Oelsner, P., Hanumanthu, S., Singh, B. B., Kumar, K. R., Sonbawne, S., Meier, S., Singh, D., Wienhold, F. G., Luo, B. P., Boettcher, M., Poltera, Y., Jauhiainen, H., Kayastha, R., Karmacharya, J., Dirksen, R., Naja, M., Rex, M., Fadnavis, S., and Peter, T.: Balloon-borne measurements of temperature, water vapor, ozone and aerosol backscatter on the southern slopes of the Himalayas during StratoClim 2016–2017, Atmos. Chem. Phys., 18, 15937–15957, https://doi.org/10.5194/acp-18-15937-2018, 2018.
Bucci, S., Legras, B., Sellitto, P., D'Amato, F., Viciani, S., Montori, A., Chiarugi, A., Ravegnani, F., Ulanovsky, A., Cairo, F., and Stroh, F.: Deep-convective influence on the upper troposphere–lower stratosphere composition in the Asian monsoon anticyclone region: 2017 StratoClim campaign results, Atmos. Chem. Phys., 20, 12193–12210, https://doi.org/10.5194/acp-20-12193-2020, 2020.
Campbell, P. and Deshler, T.: Condensation nuclei measurements in the midlatitude (1982–2012) and Antarctic (1986–2010) stratosphere between 20 and 35 km, J. Geophys. Res.-Atmos., 119, 2013JD019710, https://doi.org/10.1002/2013jd019710, 2014.
Chirkov, M., Stiller, G. P., Laeng, A., Kellmann, S., von Clarmann, T., Boone, C. D., Elkins, J. W., Engel, A., Glatthor, N., Grabowski, U., Harth, C. M., Kiefer, M., Kolonjari, F., Krummel, P. B., Linden, A., Lunder, C. R., Miller, B. R., Montzka, S. A., Mühle, J., O'Doherty, S., Orphal, J., Prinn, R. G., Toon, G., Vollmer, M. K., Walker, K. A., Weiss, R. F., Wiegele, A., and Young, D.: Global HCFC-22 measurements with MIPAS: retrieval, validation, global distribution and its evolution over 2005–2012, Atmos. Chem. Phys., 16, 3345–3368, https://doi.org/10.5194/acp-16-3345-2016, 2016.
Chun, H.-Y. and Kim, Y.-H.: Secondary waves generated by breaking of convective gravity waves in the mesosphere and their influence in the wave momentum flux, J. Geophys. Res.-Atmos., 113, D23107, https://doi.org/10.1029/2008jd009792, 2008.
Crumeyrolle, S., Manninen, H. E., Sellegri, K., Roberts, G., Gomes, L., Kulmala, M., Weigel, R., Laj, P., and Schwarzenboeck, A.: New particle formation events measured on board the ATR-42 aircraft during the EUCAARI campaign, Atmos. Chem. Phys., 10, 6721–6735, https://doi.org/10.5194/acp-10-6721-2010, 2010.
Crutzen, P. J. and Lawrence, M. G.: The impact of precipitation scavenging on the transport of trace gases: A 3-dimensional model sensitivity study, J. Atmos. Chem., 37, 81–112, https://doi.org/10.1023/A:1006322926426, 2000.
Curtius, J., Weigel, R., Vössing, H.-J., Wernli, H., Werner, A., Volk, C.-M., Konopka, P., Krebsbach, M., Schiller, C., Roiger, A., Schlager, H., Dreiling, V., and Borrmann, S.: Observations of meteoric material and implications for aerosol nucleation in the winter Arctic lower stratosphere derived from in situ particle measurements, Atmos. Chem. Phys., 5, 3053–3069, https://doi.org/10.5194/acp-5-3053-2005, 2005.
Dee, D. P., Uppala, S. M., Simmons, A. J., Berrisford, P., Poli, P., Kobayashi, S., Andrae, U., Balmaseda, M. A., Balsamo, G., Bauer, P., Bechtold, P., Beljaars, A. C. M., van de Berg, L., Bidlot, J., Bormann, N., Delsol, C., Dragani, R., Fuentes, M., Geer, A. J., Haimberger, L., Healy, S. B., Hersbach, H., Hólm, E. V., Isaksen, L., Kållberg, P., Köhler, M., Matricardi, M., McNally, A. P., Monge-Sanz, B. M., Morcrette, J. J., Park, B. K., Peubey, C., de Rosnay, P., Tavolato, C., Thépaut, J. N., and Vitart, F.: The ERA-Interim reanalysis: configuration and performance of the data assimilation system, Q. J. Roy. Meteor. Soc., 137, 553–597, https://doi.org/10.1002/qj.828, 2011.
de Reus, M., Borrmann, S., Bansemer, A., Heymsfield, A. J., Weigel, R., Schiller, C., Mitev, V., Frey, W., Kunkel, D., Kürten, A., Curtius, J., Sitnikov, N. M., Ulanovsky, A., and Ravegnani, F.: Evidence for ice particles in the tropical stratosphere from in-situ measurements, Atmos. Chem. Phys., 9, 6775–6792, https://doi.org/10.5194/acp-9-6775-2009, 2009.
Dunne, E. M., Gordon, H., Kürten, A., Almeida, J., Duplissy, J., Williamson, C., Ortega, I. K., Pringle, K. J., Adamov, A., Baltensperger, U., Barmet, P., Benduhn, F., Bianchi, F., Breitenlechner, M., Clarke, A., Curtius, J., Dommen, J., Donahue, N. M., Ehrhart, S., Flagan, R. C., Franchin, A., Guida, R., Hakala, J., Hansel, A., Heinritzi, M., Jokinen, T., Kangasluoma, J., Kirkby, J., Kulmala, M., Kupc, A., Lawler, M. J., Lehtipalo, K., Makhmutov, V., Mann, G., Mathot, S., Merikanto, J., Miettinen, P., Nenes, A., Onnela, A., Rap, A., Reddington, C. L. S., Riccobono, F., Richards, N. A. D., Rissanen, M. P., Rondo, L., Sarnela, N., Schobesberger, S., Sengupta, K., Simon, M., Sipilä, M., Smith, J. N., Stozkhov, Y., Tomé, A., Tröstl, J., Wagner, P. E., Wimmer, D., Winkler, P. M., Worsnop, D. R., and Carslaw, K. S.: Global atmospheric particle formation from CERN CLOUD measurements, Science, 354, 1119–1124, https://doi.org/10.1126/science.aaf2649, 2016.
Ekman, A. M. L., Wang, C., Strom, J., and Krejci, R.: Explicit simulation of aerosol physics in a cloud-resolving model: Aerosol transport and processing in the free troposphere, J. Atmos. Sci., 63, 682–696, https://doi.org/10.1175/Jas3645.1, 2006.
Ern, M. and Preusse, P.: Gravity wave momentum flux spectra observed from satellite in the summertime subtropics: Implications for global modeling, Geophys. Res. Lett., 39, L15810, https://doi.org/10.1029/2012gl052659, 2012.
Frey, W., Borrmann, S., Kunkel, D., Weigel, R., de Reus, M., Schlager, H., Roiger, A., Voigt, C., Hoor, P., Curtius, J., Krämer, M., Schiller, C., Volk, C. M., Homan, C. D., Fierli, F., Di Donfrancesco, G., Ulanovsky, A., Ravegnani, F., Sitnikov, N. M., Viciani, S., D'Amato, F., Shur, G. N., Belyaev, G. V., Law, K. S., and Cairo, F.: In situ measurements of tropical cloud properties in the West African Monsoon: upper tropospheric ice clouds, Mesoscale Convective System outflow, and subvisual cirrus, Atmos. Chem. Phys., 11, 5569–5590, https://doi.org/10.5194/acp-11-5569-2011, 2011.
Froyd, K. D., Murphy, D. M., Lawson, P., Baumgardner, D., and Herman, R. L.: Aerosols that form subvisible cirrus at the tropical tropopause, Atmos. Chem. Phys., 10, 209–218, https://doi.org/10.5194/acp-10-209-2010, 2010.
Fujiwara, M., Sakai, T., Nagai, T., Shiraishi, K., Inai, Y., Khaykin, S., Xi, H., Shibata, T., Shiotani, M., and Pan, L. L.: Lower-stratospheric aerosol measurements in eastward-shedding vortices over Japan from the Asian summer monsoon anticyclone during the summer of 2018, Atmos. Chem. Phys., 21, 3073–3090, https://doi.org/10.5194/acp-21-3073-2021, 2021.
Garny, H. and Randel, W. J.: Transport pathways from the Asian monsoon anticyclone to the stratosphere, Atmos. Chem. Phys., 16, 2703–2718, https://doi.org/10.5194/acp-16-2703-2016, 2016.
German Aerospace Center: HALO database, available at: https://halo-db.pa.op.dlr.de/mission/101, last access: 30 July 2021.
Glatthor, N., Hopfner, M., Baker, I. T., Berry, J., Campbell, J. E., Kawa, S. R., Krysztofiak, G., Leyser, A., Sinnhuber, B. M., Stiller, G. P., Stinecipher, J., and von Clarmann, T.: Tropical sources and sinks of carbonyl sulfide observed from space, Geophys. Res. Lett., 42, 10082–10090, https://doi.org/10.1002/2015gl066293, 2015.
Hanumanthu, S., Vogel, B., Müller, R., Brunamonti, S., Fadnavis, S., Li, D., Ölsner, P., Naja, M., Singh, B. B., Kumar, K. R., Sonbawne, S., Jauhiainen, H., Vömel, H., Luo, B., Jorge, T., Wienhold, F. G., Dirkson, R., and Peter, T.: Strong day-to-day variability of the Asian Tropopause Aerosol Layer (ATAL) in August 2016 at the Himalayan foothills, Atmos. Chem. Phys., 20, 14273–14302, https://doi.org/10.5194/acp-20-14273-2020, 2020.
He, Q., Ma, J., Zheng, X., Yan, X., Vömel, H., Wienhold, F. G., Gao, W., Liu, D., Shi, G., and Cheng, T.: Observational evidence of particle hygroscopic growth in the upper troposphere–lower stratosphere (UTLS) over the Tibetan Plateau, Atmos. Chem. Phys., 19, 8399–8406, https://doi.org/10.5194/acp-19-8399-2019, 2019.
Hermann, M., Heintzenberg, J., Wiedensohler, A., Zahn, A., Heinrich, G., and Brenninkmeijer, C. A. M.: Meridional distributions of aerosol particle number concentrations in the upper troposphere and lower stratosphere obtained by Civil Aircraft for Regular Investigation of the Atmosphere Based on an Instrument Container (CARIBIC) flights, J. Geophys. Res.-Atmos., 108, 4114, https://doi.org/10.1029/2001jd001077, 2003.
Hersbach, H. and Dee, D. P.: ERA5 reanalysis is in production, ECMWF Newsletter, 147, 7, 2016.
Hoffmann, L., Günther, G., Li, D., Stein, O., Wu, X., Griessbach, S., Heng, Y., Konopka, P., Müller, R., Vogel, B., and Wright, J. S.: From ERA-Interim to ERA5: the considerable impact of ECMWF's next-generation reanalysis on Lagrangian transport simulations, Atmos. Chem. Phys., 19, 3097–3124, https://doi.org/10.5194/acp-19-3097-2019, 2019.
Höpfner, M., Ungermann, J., Borrmann, S., Wagner, R., Spang, R., Riese, M., Stiller, G., Appel, O., Batenburg, A. M., Bucci, S., Cairo, F., Dragoneas, A., Friedl-Vallon, F., Hünig, A., Johansson, S., Krasauskas, L., Legras, B., Leisner, T., Mahnke, C., Möhler, O., Molleker, S., Müller, R., Neubert, T., Orphal, J., Preusse, P., Rex, M., Saathoff, H., Stroh, F., Weigel, R., and Wohltmann, I.: Ammonium nitrate particles formed in upper troposphere from ground ammonia sources during Asian monsoons, Nat. Geosci., 12, 608–612, https://doi.org/10.1038/s41561-019-0385-8, 2019.
Jacobson, M. Z.: Fundamentals of Atmospheric Modeling, Cambridge University Press, New York, 813 pp., 2005.
Jost, A., Szakáll, M., Diehl, K., Mitra, S. K., and Borrmann, S.: Chemistry of riming: the retention of organic and inorganic atmospheric trace constituents, Atmos. Chem. Phys., 17, 9717–9732, https://doi.org/10.5194/acp-17-9717-2017, 2017.
Kerminen, V.-M., Petäjä, T., Manninen, H. E., Paasonen, P., Nieminen, T., Sipilä, M., Junninen, H., Ehn, M., Gagné, S., Laakso, L., Riipinen, I., Vehkamäki, H., Kurten, T., Ortega, I. K., Dal Maso, M., Brus, D., Hyvärinen, A., Lihavainen, H., Leppä, J., Lehtinen, K. E. J., Mirme, A., Mirme, S., Hőrrak, U., Berndt, T., Stratmann, F., Birmili, W., Wiedensohler, A., Metzger, A., Dommen, J., Baltensperger, U., Kiendler-Scharr, A., Mentel, T. F., Wildt, J., Winkler, P. M., Wagner, P. E., Petzold, A., Minikin, A., Plass-Dülmer, C., Pöschl, U., Laaksonen, A., and Kulmala, M.: Atmospheric nucleation: highlights of the EUCAARI project and future directions, Atmos. Chem. Phys., 10, 10829–10848, https://doi.org/10.5194/acp-10-10829-2010, 2010.
Kerminen, V. M., Chen, X. M., Vakkari, V., Petäjä, T., Kulmala, M., and Bianchi, F.: Atmospheric new particle formation and growth: review of field observations, Environ. Res. Lett., 13, 103003, https://doi.org/10.1088/1748-9326/Aadf3c, 2018.
Kirkby, J., Curtius, J., Almeida, J., Dunne, E., Duplissy, J., Ehrhart, S., Franchin, A., Gagne, S., Ickes, L., Kurten, A., Kupc, A., Metzger, A., Riccobono, F., Rondo, L., Schobesberger, S., Tsagkogeorgas, G., Wimmer, D., Amorim, A., Bianchi, F., Breitenlechner, M., David, A., Dommen, J., Downard, A., Ehn, M., Flagan, R. C., Haider, S., Hansel, A., Hauser, D., Jud, W., Junninen, H., Kreissl, F., Kvashin, A., Laaksonen, A., Lehtipalo, K., Lima, J., Lovejoy, E. R., Makhmutov, V., Mathot, S., Mikkila, J., Minginette, P., Mogo, S., Nieminen, T., Onnela, A., Pereira, P., Petaja, T., Schnitzhofer, R., Seinfeld, J. H., Sipila, M., Stozhkov, Y., Stratmann, F., Tome, A., Vanhanen, J., Viisanen, Y., Vrtala, A., Wagner, P. E., Walther, H., Weingartner, E., Wex, H., Winkler, P. M., Carslaw, K. S., Worsnop, D. R., Baltensperger, U., and Kulmala, M.: Role of sulphuric acid, ammonia and galactic cosmic rays in atmospheric aerosol nucleation, Nature, 476, 429–433, https://doi.org/10.1038/nature10343, 2011.
Konopka, P., Ploeger, F. and Müller, R.: Entropy-Based and Static Stability-Based Lagrangian Model Grids, in: Lagrangian Modeling of the Atmosphere, edited by: Lin, J., Brunner, D., Gerbig, C., Stohl, A., Luhar, A., and Webley, P., 99–109, available at: https://agupubs.onlinelibrary.wiley.com/doi/abs/10.1029/2012GM001253 (last access: 30 July 2021), 2012.
Kremser, S., Thomason, L. W., von Hobe, M., Hermann, M., Deshler, T., Timmreck, C., Toohey, M., Stenke, A., Schwarz, J. P., Weigel, R., Fueglistaler, S., Prata, F. J., Vernier, J.-P., Schlager, H., Barnes, J. E., Antu na-Marrero, J.-C., Fairlie, D., Palm, M., Mahieu, E., Notholt, J., Rex, M., Bingen, C., Vanhellemont, F., Bourassa, A., Plane, J. M. C., Klocke, D., Carn, S. A., Clarisse, L., Trickl, T., Neely, R., James, A. D., Rieger, L., Wilson, J. C., and Meland, B.: Stratospheric aerosol – Observations, processes, and impact on climate, Rev. Geophys., 54, 278–335, https://doi.org/10.1002/2015rg000511, 2016.
Kulmala, M., Vehkamaki, H., Petaja, T., Dal Maso, M., Lauri, A., Kerminen, V. M., Birmili, W., and McMurry, P. H.: Formation and growth rates of ultrafine atmospheric particles: a review of observations, J. Aerosol. Sci., 35, 143–176, https://doi.org/10.1016/j.jaerosci.2003.10.003, 2004.
Kulmala, M., Kontkanen, J., Junninen, H., Lehtipalo, K., Manninen, H. E., Nieminen, T., Petaja, T., Sipila, M., Schobesberger, S., Rantala, P., Franchin, A., Jokinen, T., Jarvinen, E., Aijala, M., Kangasluoma, J., Hakala, J., Aalto, P. P., Paasonen, P., Mikkila, J., Vanhanen, J., Aalto, J., Hakola, H., Makkonen, U., Ruuskanen, T., Mauldin, R. L., Duplissy, J., Vehkamaki, H., Back, J., Kortelainen, A., Riipinen, I., Kurten, T., Johnston, M. V., Smith, J. N., Ehn, M., Mentel, T. F., Lehtinen, K. E. J., Laaksonen, A., Kerminen, V. M., and Worsnop, D. R.: Direct Observations of Atmospheric Aerosol Nucleation, Science, 339, 943–946, https://doi.org/10.1126/science.1227385, 2013.
Kurtén, T., Loukonen, V., Vehkamäki, H., and Kulmala, M.: Amines are likely to enhance neutral and ion-induced sulfuric acid-water nucleation in the atmosphere more effectively than ammonia, Atmos. Chem. Phys., 8, 4095–4103, https://doi.org/10.5194/acp-8-4095-2008, 2008.
Kürten, A.: New particle formation from sulfuric acid and ammonia: nucleation and growth model based on thermodynamics derived from CLOUD measurements for a wide range of conditions, Atmos. Chem. Phys., 19, 5033–5050, https://doi.org/10.5194/acp-19-5033-2019, 2019.
Kürten, A., Bianchi, F., Almeida, J., Kupiainen-Maatta, O., Dunne, E. M., Duplissy, J., Williamson, C., Barmet, P., Breitenlechner, M., Dommen, J., Donahue, N. M., Flagan, R. C., Franchin, A., Gordon, H., Hakala, J., Hansel, A., Heinritzi, M., Ickes, L., Jokinen, T., Kangasluoma, J., Kim, J., Kirkby, J., Kupc, A., Lehtipalo, K., Leiminger, M., Makhmutov, V., Onnela, A., Ortega, I. K., Petaja, T., Praplan, A. P., Riccobono, F., Rissanen, M. P., Rondo, L., Schnitzhofer, R., Schobesberger, S., Smith, J. N., Steiner, G., Stozhkov, Y., Tome, A., Trostl, J., Tsagkogeorgas, G., Wagner, P. E., Wimmer, D., Ye, P. L., Baltensperger, U., Carslaw, K., Kulmala, M., and Curtius, J.: Experimental particle formation rates spanning tropospheric sulfuric acid and ammonia abundances, ion production rates, and temperatures, J. Geophys. Res.-Atmos., 121, 12377–12400, https://doi.org/10.1002/2015jd023908, 2016.
Kürten, A., Li, C., Bianchi, F., Curtius, J., Dias, A., Donahue, N. M., Duplissy, J., Flagan, R. C., Hakala, J., Jokinen, T., Kirkby, J., Kulmala, M., Laaksonen, A., Lehtipalo, K., Makhmutov, V., Onnela, A., Rissanen, M. P., Simon, M., Sipilä, M., Stozhkov, Y., Tröstl, J., Ye, P., and McMurry, P. H.: New particle formation in the sulfuric acid–dimethylamine–water system: reevaluation of CLOUD chamber measurements and comparison to an aerosol nucleation and growth model, Atmos. Chem. Phys., 18, 845–863, https://doi.org/10.5194/acp-18-845-2018, 2018.
Lane, T. P. and Moncrieff, M. W.: Stratospheric Gravity Waves Generated by Multiscale Tropical Convection, J. Atmos. Sci., 65, 2598–2614, https://doi.org/10.1175/2007jas2601.1, 2008.
Law, K. S., Fierli, F., Cairo, F., Schlager, H., Borrmann, S., Streibel, M., Real, E., Kunkel, D., Schiller, C., Ravegnani, F., Ulanovsky, A., D'Amato, F., Viciani, S., and Volk, C. M.: Air mass origins influencing TTL chemical composition over West Africa during 2006 summer monsoon, Atmos. Chem. Phys., 10, 10753–10770, https://doi.org/10.5194/acp-10-10753-2010, 2010.
Lee, K.-O., Dauhut, T., Chaboureau, J.-P., Khaykin, S., Krämer, M., and Rolf, C.: Convective hydration in the tropical tropopause layer during the StratoClim aircraft campaign: pathway of an observed hydration patch, Atmos. Chem. Phys., 19, 11803–11820, https://doi.org/10.5194/acp-19-11803-2019, 2019.
Lee, S. H., Wilson, J. C., Baumgardner, D., Herman, R. L., Weinstock, E. M., LaFleur, B. G., Kok, G., Anderson, B., Lawson, P., Baker, B., Strawa, A., Pittman, J. V., Reeves, J. M., and Bui, T. P.: New particle formation observed in the tropical/subtropical cirrus clouds, J. Geophys. Res.-Atmos., 109, D20209, https://doi.org/10.1029/2004jd005033, 2004.
Li, D., Vogel, B., Müller, R., Bian, J., Günther, G., Ploeger, F., Li, Q., Zhang, J., Bai, Z., Vömel, H., and Riese, M.: Dehydration and low ozone in the tropopause layer over the Asian monsoon caused by tropical cyclones: Lagrangian transport calculations using ERA-Interim and ERA5 reanalysis data, Atmos. Chem. Phys., 20, 4133–4152, https://doi.org/10.5194/acp-20-4133-2020, 2020.
Mahnke, C., Weigel, R., Cairo, F., Vernier, J.-P., Afchine, A., Krämer, M., Mitev, V., Matthey, R., Viciani, S., D'Amato, F., Ploeger, F., Deshler, T., and Borrmann, S.: The ATAL within the 2017 Asian Monsoon Anticyclone: Microphysical aerosol properties derived from aircraft-borne in situ measurements, Atmos. Chem. Phys. Discuss. [preprint], https://doi.org/10.5194/acp-2020-1241, in review, 2021.
McKenna, D. S., Konopka, P., Grooss, J. U., Günther, G., Müller, R., Spang, R., Offermann, D., and Orsolini, Y.: A new Chemical Lagrangian Model of the Stratosphere (CLaMS) – 1. Formulation of advection and mixing, J. Geophys. Res.-Atmos., 107, 4309, https://doi.org/10.1029/2000jd000114, 2002.
Merikanto, J., Spracklen, D. V., Mann, G. W., Pickering, S. J., and Carslaw, K. S.: Impact of nucleation on global CCN, Atmos. Chem. Phys., 9, 8601–8616, https://doi.org/10.5194/acp-9-8601-2009, 2009.
Metzger, A., Verheggen, B., Dommen, J., Duplissy, J., Prevot, A. S. H., Weingartner, E., Riipinen, I., Kulmala, M., Spracklen, D. V., Carslaw, K. S., and Baltensperger, U.: Evidence for the role of organics in aerosol particle formation under atmospheric conditions, P. Natl. Acad. Sci. USA, 107, 6646–6651, https://doi.org/10.1073/pnas.0911330107, 2010.
Murphy, D. M., Cziczo, D. J., Froyd, K. D., Hudson, P. K., Matthew, B. M., Middlebrook, A. M., Peltier, R. E., Sullivan, A., Thomson, D. S., and Weber, R. J.: Single-particle mass spectrometry of tropospheric aerosol particles, J. Geophys. Res.-Atmos., 111, D23s32, https://doi.org/10.1029/2006jd007340, 2006.
Murphy, D. M., Froyd, K. D., Schwarz, J. P., and Wilson, J. C.: Observations of the chemical composition of stratospheric aerosol particles, Q. J. Roy. Meteor. Soc., 140, 1269–1278, https://doi.org/10.1002/qj.2213, 2014.
Nieminen, T., Kerminen, V.-M., Petäjä, T., Aalto, P. P., Arshinov, M., Asmi, E., Baltensperger, U., Beddows, D. C. S., Beukes, J. P., Collins, D., Ding, A., Harrison, R. M., Henzing, B., Hooda, R., Hu, M., Hőrrak, U., Kivekäs, N., Komsaare, K., Krejci, R., Kristensson, A., Laakso, L., Laaksonen, A., Leaitch, W. R., Lihavainen, H., Mihalopoulos, N., Németh, Z., Nie, W., O'Dowd, C., Salma, I., Sellegri, K., Svenningsson, B., Swietlicki, E., Tunved, P., Ulevicius, V., Vakkari, V., Vana, M., Wiedensohler, A., Wu, Z., Virtanen, A., and Kulmala, M.: Global analysis of continental boundary layer new particle formation based on long-term measurements, Atmos. Chem. Phys., 18, 14737–14756, https://doi.org/10.5194/acp-18-14737-2018, 2018.
Pan, L. L., Honomichl, S. B., Kinnison, D. E., Abalos, M., Randel, W. J., Bergman, J. W., and Bian, J.: Transport of chemical tracers from the boundary layer to stratosphere associated with the dynamics of the Asian summer monsoon, J. Geophys. Res.-Atmos., 121, 14159–14174, https://doi.org/10.1002/2016jd025616, 2016.
Park, M., Randel, W. J., Gettelman, A., Massie, S. T., and Jiang, J. H.: Transport above the Asian summer monsoon anticyclone inferred from Aura Microwave Limb Sounder tracers, J. Geophys. Res.-Atmos., 112, D16309, https://doi.org/10.1029/2006jd008294, 2007.
Park, M., Randel, W. J., Emmons, L. K., and Livesey, N. J.: Transport pathways of carbon monoxide in the Asian summer monsoon diagnosed from Model of Ozone and Related Tracers (MOZART), J. Geophys. Res.-Atmos., 114, D08303, https://doi.org/10.1029/2008jd010621, 2009.
Piani, C., Durran, D., Alexander, M. J., and Holton, J. R.: A Numerical Study of Three-Dimensional Gravity Waves Triggered by Deep Tropical Convection and Their Role in the Dynamics of the QBO, J. Atmos. Sci., 57, 3689–3702, https://doi.org/10.1175/1520-0469(2000)057<3689:Ansotd>2.0.Co;2, 2000.
Pisso, I. and Legras, B.: Turbulent vertical diffusivity in the sub-tropical stratosphere, Atmos. Chem. Phys., 8, 697–707, https://doi.org/10.5194/acp-8-697-2008, 2008.
Ploeger, F., Günther, G., Konopka, P., Fueglistaler, S., Müller, R., Hoppe, C., Kunz, A., Spang, R., Grooss, J. U., and Riese, M.: Horizontal water vapor transport in the lower stratosphere from subtropics to high latitudes during boreal summer, J. Geophys. Res.-Atmos., 118, 8111–8127, https://doi.org/10.1002/jgrd.50636, 2013.
Ploeger, F., Gottschling, C., Griessbach, S., Grooß, J.-U., Guenther, G., Konopka, P., Müller, R., Riese, M., Stroh, F., Tao, M., Ungermann, J., Vogel, B., and von Hobe, M.: A potential vorticity-based determination of the transport barrier in the Asian summer monsoon anticyclone, Atmos. Chem. Phys., 15, 13145–13159, https://doi.org/10.5194/acp-15-13145-2015, 2015.
Ploeger, F., Konopka, P., Walker, K., and Riese, M.: Quantifying pollution transport from the Asian monsoon anticyclone into the lower stratosphere, Atmos. Chem. Phys., 17, 7055–7066, https://doi.org/10.5194/acp-17-7055-2017, 2017.
Ploeger, F., Diallo, M., Charlesworth, E., Konopka, P., Legras, B., Laube, J. C., Grooß, J.-U., Günther, G., Engel, A., and Riese, M.: The stratospheric Brewer–Dobson circulation inferred from age of air in the ERA5 reanalysis, Atmos. Chem. Phys., 21, 8393–8412, https://doi.org/10.5194/acp-21-8393-2021, 2021.
Pommrich, R., Müller, R., Grooß, J.-U., Konopka, P., Ploeger, F., Vogel, B., Tao, M., Hoppe, C. M., Günther, G., Spelten, N., Hoffmann, L., Pumphrey, H.-C., Viciani, S., D'Amato, F., Volk, C. M., Hoor, P., Schlager, H., and Riese, M.: Tropical troposphere to stratosphere transport of carbon monoxide and long-lived trace species in the Chemical Lagrangian Model of the Stratosphere (CLaMS), Geosci. Model Dev., 7, 2895–2916, https://doi.org/10.5194/gmd-7-2895-2014, 2014.
Randel, W. J. and Park, M.: Deep convective influence on the Asian summer monsoon anticyclone and associated tracer variability observed with Atmospheric Infrared Sounder (AIRS), J. Geophys. Res.-Atmos., 111, D12314, https://doi.org/10.1029/2005jd006490, 2006.
German Aerospace Center: HALO database, available at: https://halo-db.pa.op.dlr.de/mission/101, last access: 30 July 2021.
Riccobono, F., Schobesberger, S., Scott, C. E., Dommen, J., Ortega, I. K., Rondo, L., Almeida, J., Amorim, A., Bianchi, F., Breitenlechner, M., David, A., Downard, A., Dunne, E. M., Duplissy, J., Ehrhart, S., Flagan, R. C., Franchin, A., Hansel, A., Junninen, H., Kajos, M., Keskinen, H., Kupc, A., Kürten, A., Kvashin, A. N., Laaksonen, A., Lehtipalo, K., Makhmutov, V., Mathot, S., Nieminen, T., Onnela, A., Petaja, T., Praplan, A. P., Santos, F. D., Schallhart, S., Seinfeld, J. H., Sipila, M., Spracklen, D. V., Stozhkov, Y., Stratmann, F., Tome, A., Tsagkogeorgas, G., Vaattovaara, P., Viisanen, Y., Vrtala, A., Wagner, P. E., Weingartner, E., Wex, H., Wimmer, D., Carslaw, K. S., Curtius, J., Donahue, N. M., Kirkby, J., Kulmala, M., Worsnop, D. R., and Baltensperger, U.: Oxidation Products of Biogenic Emissions Contribute to Nucleation of Atmospheric Particles, Science, 344, 717–721, https://doi.org/10.1126/science.1243527, 2014.
Rollins, A. W., Thornberry, T. D., Watts, L. A., Yu, P., Rosenlof, K. H., Mills, M., Baumann, E., Giorgetta, F. R., Bui, T. V., Hopfner, M., Walker, K. A., Boone, C., Bernath, P. F., Colarco, P. R., Newman, P. A., Fahey, D. W., and Gao, R. S.: The role of sulfur dioxide in stratospheric aerosol formation evaluated by using in situ measurements in the tropical lower stratosphere, Geophys. Res. Lett., 44, 4280–4286, https://doi.org/10.1002/2017gl072754, 2017.
Rosen, J. M.: The Boiling Point of Stratospheric Aerosols, J. Appl. Meteorol., 10, 1044–1046, https://doi.org/10.1175/1520-0450(1971)010<1044:tbposa>2.0.co;2, 1971.
Sahyoun, M., Freney, E., Brito, J., Duplissy, J., Gouhier, M., Colomb, A., Dupuy, R., Bourianne, T., Nowak, J. B., Yan, C., Petäjä, T., Kulmala, M., Schwarzenboeck, A., Planche, C., and Sellegri, K.: Evidence of New Particle Formation Within Etna and Stromboli Volcanic Plumes and Its Parameterization From Airborne In Situ Measurements, J. Geophys. Res.-Atmos., 124, 5650–5668, https://doi.org/10.1029/2018jd028882, 2019.
Santee, M. L., Manney, G. L., Livesey, N. J., Schwartz, M. J., Neu, J. L., and Read, W. G.: A comprehensive overview of the climatological composition of the Asian summermonsoon anticyclone based on 10 years of Aura Microwave Limb Sounder measurements, J. Geophys. Res.-Atmos., 122, 5491–5514, https://doi.org/10.1002/2016jd026408, 2017.
Schneider, J., Weigel, R., Klimach, T., Dragoneas, A., Appel, O., Hünig, A., Molleker, S., Köllner, F., Clemen, H.-C., Eppers, O., Hoppe, P., Hoor, P., Mahnke, C., Krämer, M., Rolf, C., Grooß, J.-U., Zahn, A., Obersteiner, F., Ravegnani, F., Ulanovsky, A., Schlager, H., Scheibe, M., Diskin, G. S., DiGangi, J. P., Nowak, J. B., Zöger, M., and Borrmann, S.: Aircraft-based observation of meteoric material in lower-stratospheric aerosol particles between 15 and 68∘ N, Atmos. Chem. Phys., 21, 989–1013, https://doi.org/10.5194/acp-21-989-2021, 2021.
Sellegri, K., Rose, C., Marinoni, A., Lupi, A., Wiedensohler, A., Andrade, M., Bonasoni, P., and Laj, P.: New Particle Formation: A Review of Ground-Based Observations at Mountain Research Stations, Atmosphere-Basel, 10, 493, https://doi.org/10.3390/Atmos10090493, 2019.
Sokolov, L. and Lepuchov, B.: Protocol of interaction between Unit for Connection with Scientific Equipment (UCSE) and on-board scientific equipment of Geophysica aircraft (Second edition), Myasishchev Design Bureau (MDB), Moscow, 1998.
Song, I.-S., Chun, H.-Y., and Lane, T. P.: Generation Mechanisms of Convectively Forced Internal Gravity Waves and Their Propagation to the Stratosphere, J. Atmos. Sci., 60, 1960–1980, https://doi.org/10.1175/1520-0469(2003)060<1960:Gmocfi>2.0.Co;2, 2003.
Stenke, A., Schraner, M., Rozanov, E., Egorova, T., Luo, B., and Peter, T.: The SOCOL version 3.0 chemistry–climate model: description, evaluation, and implications from an advanced transport algorithm, Geosci. Model Dev., 6, 1407–1427, https://doi.org/10.5194/gmd-6-1407-2013, 2013.
Stohl, A., Forster, C., Frank, A., Seibert, P., and Wotawa, G.: Technical note: The Lagrangian particle dispersion model FLEXPART version 6.2, Atmos. Chem. Phys., 5, 2461–2474, https://doi.org/10.5194/acp-5-2461-2005, 2005.
Stolzenburg, D., Simon, M., Ranjithkumar, A., Kürten, A., Lehtipalo, K., Gordon, H., Ehrhart, S., Finkenzeller, H., Pichelstorfer, L., Nieminen, T., He, X.-C., Brilke, S., Xiao, M., Amorim, A., Baalbaki, R., Baccarini, A., Beck, L., Bräkling, S., Caudillo Murillo, L., Chen, D., Chu, B., Dada, L., Dias, A., Dommen, J., Duplissy, J., El Haddad, I., Fischer, L., Gonzalez Carracedo, L., Heinritzi, M., Kim, C., Koenig, T. K., Kong, W., Lamkaddam, H., Lee, C. P., Leiminger, M., Li, Z., Makhmutov, V., Manninen, H. E., Marie, G., Marten, R., Müller, T., Nie, W., Partoll, E., Petäjä, T., Pfeifer, J., Philippov, M., Rissanen, M. P., Rörup, B., Schobesberger, S., Schuchmann, S., Shen, J., Sipilä, M., Steiner, G., Stozhkov, Y., Tauber, C., Tham, Y. J., Tomé, A., Vazquez-Pufleau, M., Wagner, A. C., Wang, M., Wang, Y., Weber, S. K., Wimmer, D., Wlasits, P. J., Wu, Y., Ye, Q., Zauner-Wieczorek, M., Baltensperger, U., Carslaw, K. S., Curtius, J., Donahue, N. M., Flagan, R. C., Hansel, A., Kulmala, M., Lelieveld, J., Volkamer, R., Kirkby, J., and Winkler, P. M.: Enhanced growth rate of atmospheric particles from sulfuric acid, Atmos. Chem. Phys., 20, 7359–7372, https://doi.org/10.5194/acp-20-7359-2020, 2020.
Tang, M. J., Cox, R. A., and Kalberer, M.: Compilation and evaluation of gas phase diffusion coefficients of reactive trace gases in the atmosphere: volume 1. Inorganic compounds, Atmos. Chem. Phys., 14, 9233–9247, https://doi.org/10.5194/acp-14-9233-2014, 2014.
Thomason, L. W. and Peter, T. (Eds.): Assessment of Stratospheric Aerosol Properties (ASAP), SPARC Report No. 4, World Climate Research Programme WCRP –124, WMO/TD No. 1295, SPARC office, available at: https://www.sparc-climate.org/publications/sparc-reports/sparc-report-no-4/ (last access: 30 July 2021), 2006.
Thomason, L. W. and Vernier, J.-P.: Improved SAGE II cloud/aerosol categorization and observations of the Asian tropopause aerosol layer: 1989–2005, Atmos. Chem. Phys., 13, 4605–4616, https://doi.org/10.5194/acp-13-4605-2013, 2013.
Tissier, A.-S. and Legras, B.: Convective sources of trajectories traversing the tropical tropopause layer, Atmos. Chem. Phys., 16, 3383–3398, https://doi.org/10.5194/acp-16-3383-2016, 2016.
Tzella, A. and Legras, B.: A Lagrangian view of convective sources for transport of air across the Tropical Tropopause Layer: distribution, times and the radiative influence of clouds, Atmos. Chem. Phys., 11, 12517–12534, https://doi.org/10.5194/acp-11-12517-2011, 2011.
Venzac, H., Sellegri, K., Laj, P., Villani, P., Bonasoni, P., Marinoni, A., Cristofanelli, P., Calzolari, F., Fuzzi, S., Decesari, S., Facchini, M. C., Vuillermoz, E., and Verza, G. P.: High frequency new particle formation in the Himalayas, P. Natl. Acad. Sci. USA, 105, 15666–15671, https://doi.org/10.1073/pnas.0801355105, 2008.
Vernier, J. P., Thomason, L. W., and Kar, J.: CALIPSO detection of an Asian tropopause aerosol layer, Geophys. Res. Lett., 38, L07804, https://doi.org/10.1029/2010gl046614, 2011a.
Vernier, J. P., Thomason, L. W., Pommereau, J. P., Bourassa, A., Pelon, J., Garnier, A., Hauchecorne, A., Blanot, L., Trepte, C., Degenstein, D., and Vargas, F.: Major influence of tropical volcanic eruptions on the stratospheric aerosol layer during the last decade, Geophys. Res. Lett., 38, L12807, https://doi.org/10.1029/2011gl047563, 2011b.
Vernier, J. P., Fairlie, T. D., Natarajan, M., Wienhold, F. G., Bian, J., Martinsson, B. G., Crumeyrolle, S., Thomason, L. W., and Bedka, K. M.: Increase in upper tropospheric and lower stratospheric aerosol levels and its potential connection with Asian pollution, J. Geophys. Res.-Atmos., 120, 1608–1619, https://doi.org/10.1002/2014jd022372, 2015.
Vernier, J.-P., Fairlie, T. D., Deshler, T., Ratnam, M. V., Gadhavi, H., Kumar, B. S., Natarajan, M., Pandit, A. K., Raj, S. T. A., Kumar, A. H., Jayaraman, A., Singh, A. K., Rastogi, N., Sinha, P. R., Kumar, S., Tiwari, S., Wegner, T., Baker, N., Vignelles, D., Stenchikov, G., Shevchenko, I., Smith, J., Bedka, K., Kesarkar, A., Singh, V., Bhate, J., Ravikiran, V., Rao, M. D., Ravindrababu, S., Patel, A., Vernier, H., Wienhold, F. G., Liu, H., Knepp, T. N., Thomason, L., Crawford, J., Ziemba, L., Moore, J., Crumeyrolle, S., Williamson, M., Berthet, G., Jégou, F., and Renard, J.-B.: BATAL: The Balloon Measurement Campaigns of the Asian Tropopause Aerosol Layer, B. Am. Meteorol. Soc., 99, 955–973, https://doi.org/10.1175/bams-d-17-0014.1, 2018.
Viciani, S., D'Amato, F., Mazzinghi, P., Castagnoli, F., Toci, G., and Werle, P.: A cryogenically operated laser diode spectrometer for airborne measurement of stratospheric trace gases, Appl. Phys. B, 90, 581–592, https://doi.org/10.1007/s00340-007-2885-2, 2008.
Viciani, S., Montori, A., Chiarugi, A., and D'Amato, F.: A Portable Quantum Cascade Laser Spectrometer for Atmospheric Measurements of Carbon Monoxide, Sensors, 18, 2380, https://doi.org/10.3390/s18072380, 2018.
Vincent, R. A. and Alexander, M. J.: Gravity waves in the tropical lower stratosphere: An observational study of seasonal and interannual variability, J. Geophys. Res.-Atmos., 105, 17971–17982, https://doi.org/10.1029/2000jd900196, 2000.
Vogel, B., Günther, G., Müller, R., Grooß, J.-U., Hoor, P., Krämer, M., Müller, S., Zahn, A., and Riese, M.: Fast transport from Southeast Asia boundary layer sources to northern Europe: rapid uplift in typhoons and eastward eddy shedding of the Asian monsoon anticyclone, Atmos. Chem. Phys., 14, 12745–12762, https://doi.org/10.5194/acp-14-12745-2014, 2014.
Vogel, B., Müller, R., Günther, G., Spang, R., Hanumanthu, S., Li, D., Riese, M., and Stiller, G. P.: Lagrangian simulations of the transport of young air masses to the top of the Asian monsoon anticyclone and into the tropical pipe, Atmos. Chem. Phys., 19, 6007–6034, https://doi.org/10.5194/acp-19-6007-2019, 2019.
von der Weiden, S.-L., Drewnick, F., and Borrmann, S.: Particle Loss Calculator – a new software tool for the assessment of the performance of aerosol inlet systems, Atmos. Meas. Tech., 2, 479–494, https://doi.org/10.5194/amt-2-479-2009, 2009.
von Hobe, M., Ploeger, F., Konopka, P., Kloss, C., Ulanowski, A., Yushkov, V., Ravegnani, F., Volk, C. M., Pan, L. L., Honomichl, S. B., Tilmes, S., Kinnison, D. E., Garcia, R. R., and Wright, J. S.: Upward transport into and within the Asian monsoon anticyclone as inferred from StratoClim trace gas observations, Atmos. Chem. Phys., 21, 1267–1285, https://doi.org/10.5194/acp-21-1267-2021, 2021.
Wang, M., Kong, W., Marten, R., He, X.-C., Chen, D., Pfeifer, J., Heitto, A., Kontkanen, J., Dada, L., Kürten, A., Yli-Juuti, T., Manninen, H. E., Amanatidis, S., Amorim, A., Baalbaki, R., Baccarini, A., Bell, D. M., Bertozzi, B., Bräkling, S., Brilke, S., Murillo, L. C., Chiu, R., Chu, B., De Menezes, L.-P., Duplissy, J., Finkenzeller, H., Carracedo, L. G., Granzin, M., Guida, R., Hansel, A., Hofbauer, V., Krechmer, J., Lehtipalo, K., Lamkaddam, H., Lampimäki, M., Lee, C. P., Makhmutov, V., Marie, G., Mathot, S., Mauldin, R. L., Mentler, B., Müller, T., Onnela, A., Partoll, E., Petäjä, T., Philippov, M., Pospisilova, V., Ranjithkumar, A., Rissanen, M., Rörup, B., Scholz, W., Shen, J., Simon, M., Sipilä, M., Steiner, G., Stolzenburg, D., Tham, Y. J., Tomé, A., Wagner, A. C., Wang, D. S., Wang, Y., Weber, S. K., Winkler, P. M., Wlasits, P. J., Wu, Y., Xiao, M., Ye, Q., Zauner-Wieczorek, M., Zhou, X., Volkamer, R., Riipinen, I., Dommen, J., Curtius, J., Baltensperger, U., Kulmala, M., Worsnop, D. R., Kirkby, J., Seinfeld, J. H., El-Haddad, I., Flagan, R. C., and Donahue, N. M.: Rapid growth of new atmospheric particles by nitric acid and ammonia condensation, Nature, 581, 184–189, https://doi.org/10.1038/s41586-020-2270-4, 2020.
Wehner, B., Werner, F., Ditas, F., Shaw, R. A., Kulmala, M., and Siebert, H.: Observations of new particle formation in enhanced UV irradiance zones near cumulus clouds, Atmos. Chem. Phys., 15, 11701–11711, https://doi.org/10.5194/acp-15-11701-2015, 2015.
Weigel, R., Hermann, M., Curtius, J., Voigt, C., Walter, S., Böttger, T., Lepukhov, B., Belyaev, G., and Borrmann, S.: Experimental characterization of the COndensation PArticle counting System for high altitude aircraft-borne application, Atmos. Meas. Tech., 2, 243–258, https://doi.org/10.5194/amt-2-243-2009, 2009.
Weigel, R., Borrmann, S., Kazil, J., Minikin, A., Stohl, A., Wilson, J. C., Reeves, J. M., Kunkel, D., de Reus, M., Frey, W., Lovejoy, E. R., Volk, C. M., Viciani, S., D'Amato, F., Schiller, C., Peter, T., Schlager, H., Cairo, F., Law, K. S., Shur, G. N., Belyaev, G. V., and Curtius, J.: In situ observations of new particle formation in the tropical upper troposphere: the role of clouds and the nucleation mechanism, Atmos. Chem. Phys., 11, 9983–10010, https://doi.org/10.5194/acp-11-9983-2011, 2011.
Weigel, R., Volk, C. M., Kandler, K., Hösen, E., Günther, G., Vogel, B., Grooß, J.-U., Khaykin, S., Belyaev, G. V., and Borrmann, S.: Enhancements of the refractory submicron aerosol fraction in the Arctic polar vortex: feature or exception?, Atmos. Chem. Phys., 14, 12319–12342, https://doi.org/10.5194/acp-14-12319-2014, 2014.
Weigel, R., Mahnke, C., Baumgartner, M., Krämer, M., Spichtinger, P., Spelten, N., Afchine, A., Rolf, C., Viciani, S., D'Amato, F., Tost, H., and Borrmann, S.: New particle formation inside ice clouds: In-situ observations in the tropical tropopause layer of the 2017 Asian Monsoon Anticyclone, Atmos. Chem. Phys. Discuss. [preprint], https://doi.org/10.5194/acp-2020-1285, in review, 2021.
Weigelt, A., Hermann, M., van Velthoven, P. F. J., Brenninkmeijer, C. A. M., Schlaf, G., Zahn, A., and Wiedensohler, A.: Influence of clouds on aerosol particle number concentrations in the upper troposphere, J. Geophys. Res.-Atmos., 114, D01204, https://doi.org/10.1029/2008jd009805, 2009.
Williamson, C., Kupc, A., Wilson, J., Gesler, D. W., Reeves, J. M., Erdesz, F., McLaughlin, R., and Brock, C. A.: Fast time response measurements of particle size distributions in the 3–60 nm size range with the nucleation mode aerosol size spectrometer, Atmos. Meas. Tech., 11, 3491–3509, https://doi.org/10.5194/amt-11-3491-2018, 2018.
Williamson, C. J., Kupc, A., Axisa, D., Bilsback, K. R., Bui, T., Campuzano-Jost, P., Dollner, M., Froyd, K. D., Hodshire, A. L., Jimenez, J. L., Kodros, J. K., Luo, G., Murphy, D. M., Nault, B. A., Ray, E. A., Weinzierl, B., Wilson, J. C., Yu, F., Yu, P., Pierce, J. R., and Brock, C. A.: A large source of cloud condensation nuclei from new particle formation in the tropics, Nature, 574, 399–403, https://doi.org/10.1038/s41586-019-1638-9, 2019.
WMO: Meteorology – A three-dimensional science, WMO Bull., 134–138, 1957.
WMO: International Meteorological Tables, WMO-No.188.TP97, edited by: Letestu, S., Secretariat of the World Meteorological Organization, Geneva, Switzerland, 1966.
Wright, C. J. and Gille, J. C.: HIRDLS observations of gravity wave momentum fluxes over the monsoon regions, J. Geophys. Res.-Atmos., 116, D12103, https://doi.org/10.1029/2011jd015725, 2011.
Yu, F. Q., Luo, G., Bates, T. S., Anderson, B., Clarke, A., Kapustin, V., Yantosca, R. M., Wang, Y. X., and Wu, S. L.: Spatial distributions of particle number concentrations in the global troposphere: Simulations, observations, and implications for nucleation mechanisms, J. Geophys. Res.-Atmos., 115, D17205, https://doi.org/10.1029/2009jd013473, 2010.
Yu, P., Rosenlof, K. H., Liu, S., Telg, H., Thornberry, T. D., Rollins, A. W., Portmann, R. W., Bai, Z., Ray, E. A., Duan, Y., Pan, L. L., Toon, O. B., Bian, J., and Gao, R.-S.: Efficient transport of tropospheric aerosol into the stratosphere via the Asian summer monsoon anticyclone, P. Natl. Acad. Sci., 114, 6972–6977, https://doi.org/10.1073/pnas.1701170114, 2017.
Yu, P. F., Toon, O. B., Neely, R. R., Martinsson, B. G., and Brenninkmeijer, C. A. M.: Composition and physical properties of the Asian Tropopause Aerosol Layer and the North American Tropospheric Aerosol Layer, Geophys. Res. Lett., 42, 2540–2546, https://doi.org/10.1002/2015gl063181, 2015.
Zhang, Y., McMurry, P. H., Yu, F. Q., and Jacobson, M. Z.: A comparative study of nucleation parameterizations: 1. Examination and evaluation of the formulations, J. Geophys. Res.-Atmos., 115, D20212, https://doi.org/10.1029/2010jd014150, 2010.
- Abstract
- Introduction
- In situ instrumentation
- Analytical methods
- Observations and results
- NPF's connection to ground sources and vertical transport
- Potential impact of gravity waves on vapours' supersaturation
- Summary and conclusions
- Appendix A: The detection of non-volatile particles with COPAS
- Appendix B: Case study analysis of observed temperature anomaly
- Appendix C: The impact of a temperature anomaly on the saturation ratio of H2SO4
- Data availability
- Author contributions
- Competing interests
- Disclaimer
- Special issue statement
- Acknowledgements
- Financial support
- Review statement
- References