the Creative Commons Attribution 4.0 License.
the Creative Commons Attribution 4.0 License.
 | 03 Sep 2021
Isotopic evidence for dominant secondary production of HONO in near-ground wildfire plumes
Jack E. Dibb
Bruce E. Anderson
Claire Bekker
Danielle E. Blum
Eric Heim
Carolyn E. Jordan
Emily E. Joyce
Jackson H. Kaspari
Hannah Munro
Wendell W. Walters
Meredith G. Hastings
Nitrous acid (HONO) is an important precursor to hydroxyl radical (OH) that determines atmospheric oxidative capacity and thus impacts climate and air quality. Wildfire is not only a major direct source of HONO, it also results in highly polluted conditions that favor the heterogeneous formation of HONO from nitrogen oxides (NOx= NO + NO2) and nitrate on both ground and particle surfaces. However, these processes remain poorly constrained. To quantitatively constrain the HONO budget under various fire and/or smoke conditions, we combine a unique dataset of field concentrations and isotopic ratios (15N 14N and 18O 16O) of NOx and HONO with an isotopic box model. Here we report the first isotopic evidence of secondary HONO production in near-ground wildfire plumes (over a sample integration time of hours) and the subsequent quantification of the relative importance of each pathway to total HONO production. Most importantly, our results reveal that nitrate photolysis plays a minor role (<5 %) in HONO formation in daytime aged smoke, while NO2-to-HONO heterogeneous conversion contributes 85 %–95 % to total HONO production, followed by OH + NO (5 %–15 %). At nighttime, heterogeneous reduction of NO2 catalyzed by redox active species (e.g., iron oxide and/or quinone) is essential (≥ 75 %) for HONO production in addition to surface NO2 hydrolysis. Additionally, the 18O 16O of HONO is used for the first time to constrain the NO-to-NO2 oxidation branching ratio between ozone and peroxy radicals. Our approach provides a new and critical way to mechanistically constrain atmospheric chemistry and/or air quality models on a diurnal timescale.
- Article
(1509 KB) - Full-text XML
- Comment
-
Supplement
(649 KB) - BibTeX
- EndNote


Vastly increased wildfire activity and intensity is a challenging issue in many parts of the world including the western US, and it is strongly linked to warming surface temperatures and earlier spring snowmelt (Westerling, 2016). Wildfire is a significant source of nitrogen oxides (NOx= NO + NO2) and nitrous acid (HONO), as well as other important trace gases and particulate matter. NOx serves as a key precursor to atmospheric ozone (O3) and secondary aerosols in the presence of organic compounds; in wildfire plumes NOx can be a limiting factor to O3 production owing to high emission molar ratios of non-methane organic carbon (NMOC) to NOx (Akagi et al., 2011; Jaffe and Briggs, 2012). HONO is a major daytime photolytic precursor of hydroxyl radical (OH) via Reaction (R1) that determines the atmospheric oxidative capacity and therefore the lifetimes of many other species in the atmosphere. Wildfire-emitted HONO supplies the majority of OH in the first few hours after smoke emission in the daytime, and it greatly counteracts reduced OH production from O3 photolysis caused by high particle loading reducing actinic flux (Jaffe and Briggs, 2012; Peng et al., 2020; Theys et al., 2020). Wildfire-emitted NOx and HONO not only greatly impact the atmospheric chemistry in local regions close to the fire but also contribute significantly to the reactive nitrogen (RN) burden thousands of kilometers downwind via transport and RN cycling, especially when mixed with fossil fuel combustion emissions (Jaffe et al., 2013; McClure and Jaffe, 2018; Westerling et al., 2006; Westerling, 2016).
Despite their important impacts on air quality, climate, and human and ecosystem health, the budgets of wildfire-derived NOx and HONO are poorly constrained due to limited field measurements, high reactivity and large spatiotemporal heterogeneity. Bottom-up approaches rely on limited emission factor measurements with uncertainty in HONO sources and chemistry; top-down approaches (i.e., satellite observations) have limited sensitivity in the lower troposphere and boundary layer and again are limited by large uncertainties in HONO sources and chemistry to interpret the satellite measurements. Although gas-phase reaction between OH and NO (Reaction R2) ubiquitously produces HONO, it is far from sufficient to explain the observed HONO levels in numerous studies given the fast photolysis during the day (Su et al., 2011). HONO, along with NOx, can be directly emitted from various sources including vehicle exhaust, biomass burning (BB) and microbially driven soil emissions. In addition, it has been proposed that HONO can be produced from other RN species (e.g., NO2 and nitrate) via various heterogeneous pathways (Fig. 1). Major secondary HONO production pathways during the day include heterogeneous NO2 conversion on photoactive surfaces (Reaction R3) (Ammann et al., 1998; George et al., 2005; Stemmler et al., 2006) and heterogeneous photolysis of nitrate including particulate nitrate (p-NO) and nitric acid (HNO3) via Reaction (R4) (Ye et al., 2016; Zhou et al., 2011). In past studies, heterogeneous conversion of NO2 to HONO on photoactive surfaces such as organic surfaces (Reaction R3) has been proposed to explain a missing HONO source (Ammann et al., 1998; George et al., 2005; Stemmler et al., 2006; Wong et al., 2012). Organic surfaces exist in both aerosol particles and soils at the surface (e.g., humic acids), but there is major uncertainty associated with quantifying available surface area and the NO2 uptake coefficient. During the night, surface (soils and aerosols) uptake is the predominant sink for HONO (Reaction R5), and heterogeneous conversion of NO2 to HONO has been widely accepted as the major secondary HONO production source during the night (Reaction R6 and/or Reaction R7). Although it is clear that heterogeneous NO2 hydrolysis (Reaction R6) can be a major pathway for nighttime HONO production (Finlayson-Pitts et al., 2003), recent work has also shown compelling evidence for faster HONO formation via reduction of NO2 on inorganic surfaces (e.g., iron-bearing minerals) and organic surfaces (e.g., quinone-rich humic acid) in soils and particulate matter (Reaction R7) (Scharko et al., 2017; Kebede et al., 2016; Martins-Costa et al., 2020). While the emission sources and heterogeneous pathways were hypothetically used to account for missing HONO sources (Stemmler et al., 2006; Su et al., 2011; Ye et al., 2016; VandenBoer et al., 2014; Donaldson et al., 2014a; Kebede et al., 2016; Scharko et al., 2017), their relative importance is poorly quantified due to large uncertainties associated with emission heterogeneity, surface area and composition, environmental condition (day versus night, temperature, relative humidity), quantification of heterogeneous reaction rate, and knowledge gaps in detailed mechanisms. As a result, the HONO budget in the atmospheric boundary layer remains poorly constrained.
Stable isotopes hold unique promise to provide rigorous constraints on sources, chemical processing pathways and sinks of RN species as they reflect isotopic signatures associated with these processes. δ15N (= [(15N 14N)sample (15N 14N)] × 1000 ‰) has shown great potential to trace the atmospheric origin of NOx and its fate as nitrate (Hastings et al., 2009), whereas δ18O (= [(18O 16O)sample (18O 16O)VSMOW−1] × 1000 ‰; VSMOW is Vienna Standard Mean Ocean Water) serves as a sensitive indicator for the relative importance of major oxidants (i.e., O3, RO2 and OH) that lead to NOx conversion (Thiemens, 2006). In particular, O3 has an exclusively high δ18O as a result of mass-independent fractionation associated with its formation in the atmosphere, and this anomaly is transferred to oxidized products such as NO2, HONO and HNO3 (Thiemens, 2006).
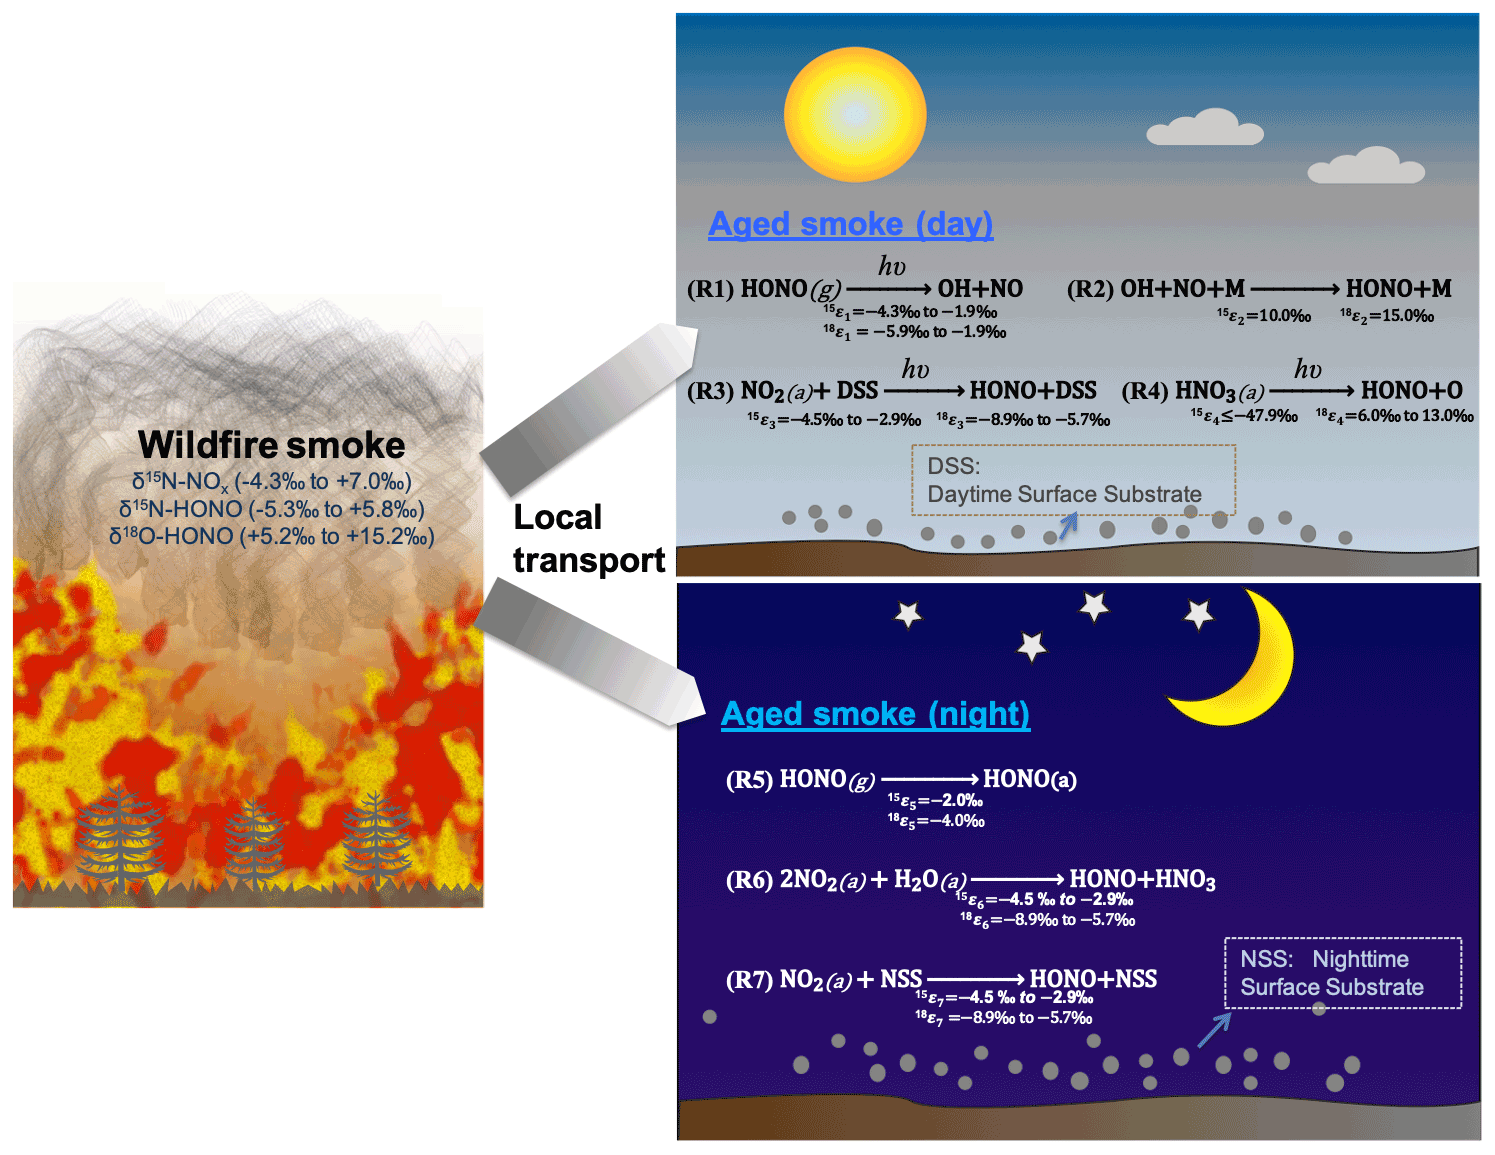
Figure 1The schematics of loss and secondary production of HONO in areas impacted by wildfire smoke in daytime (Reactions R1–R4) and nighttime (Reactions R5–R7). We conducted our sample collection <30 km from the edge of the wildfires, with smoke ages ranging from a few minutes to half a day. M is bath gas including N2, O2, CO2, etc. DSS is daytime substrate surface including terrestrial surfaces and aerosol particles that incorporate photoactive metal oxides (e.g., TiO2), humic-like organics (e.g., quinone), etc. In essence, solar radiation induces reduction of these substrates with H, and this facilitates H abstraction by NO2 (or H transfer). NSS is nighttime substrate surface (terrestrial and aerosol surfaces) containing iron-bearing minerals and/or humic acid (quinone). Note other sinks during both day and night (e.g., OH + HONO) are negligible compared to the major sinks shown here. Isotopic enrichment factors for N and O result from kinetic isotopic effects associated with each reaction and are calculated and expressed as 15εi and 18εi, where the subscript i indicates the reaction number, and the superscripts 15 and 18 denote the isotopic composition 15N/14N and 18O/16O, respectively.
Using our recently developed and validated sampling techniques in combination with offline isotopic composition analyses (Chai et al., 2019), we characterized for the first time δ15N of NOx and HONO, as well as δ18O-HONO, in ground-level wildfire plumes in the western US as part of two major field campaigns: Western Wildfire Experiment for Cloud Chemistry, Aerosol Absorption and Nitrogen (WE-CAN) in summer 2018 and Fire Influence on Regional and Global Environments Experiment – Air Quality (FIREX-AQ) in summer 2019. Here we report our findings based on samples collected in a mobile laboratory platform from three different wildfires; Rabbit Foot fire (RF) in eastern Idaho, Williams Flats fire (WF) in central Washington, and Nethker fire (NF) in northern Idaho (Figs. S1 and S2 in the Supplement). Surface-based mobile sampling allowed us to characterize young nighttime (YN), young daytime (YD), mixed daytime (MD), aged nighttime (AN) and aged daytime (AD) smoke. Physical smoke age determination using meteorological parameters near the ground is challenging due to large variations in wind speed and direction. Proxies involving total RN, NOy and ammonia (NH3) relative to carbon monoxide (CO) can only be used to qualitatively evaluate smoke age due to large uncertainties in source emission factors and complexity caused by photochemistry (Selimovic et al., 2019; Kleinman et al., 2007). In contrast, the concentration ratio between PM2.5 and CO (PM2.5 CO) has shown potential for estimating smoke age (Yokelson et al., 2009; Selimovic et al., 2020). In this work, we determined the smoke conditions (young versus aged) primarily by comparing the field δ18O-HONO results with those obtained in our previous lab study that represents fresh emissions, with additional evaluation involving δ15N-HONO and relative concentration of HONO and NO2 (Fig. 2). Note young and aged smoke refers to negligible and large proportions of secondarily produced HONO, respectively. We also take into account smoke sampling locations (i.e., approximate distance from the wildfire) to confirm the smoke age estimate. In brief, largely elevated δ18O-HONO in field samples compared with those from the lab-controlled fires signifies significant atmospheric processing, and this will be discussed in detail below. Our grouping method using δ18O-HONO shows fairly consistent results with those suggested by PM2.5 CO for WF and NF fire plumes (Kaspari et al., 2021). In addition to distinguishing aged smoke from young smoke, the grouped δ18O and δ15N also allow us to characterize potential mechanisms of secondary HONO formation in the aged smoke, as well as NO-to-NO2 oxidation pathways, with the HONO budget evaluated using the synergistic measurement of HONO, NO and NO2 concentrations in the field.
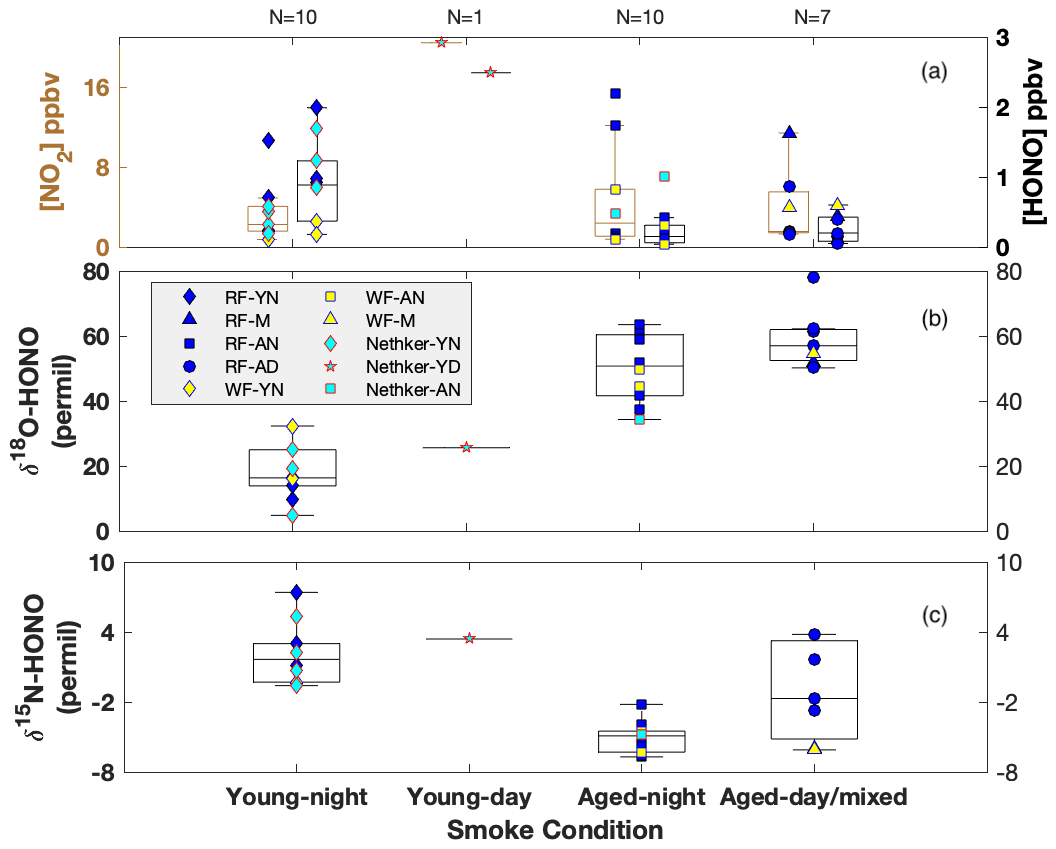
Figure 2Box-whisker plots for concentration of NO2 (left) and HONO (right) (a), δ18O-HONO (b) and δ15N-HONO (c) for each sample. Individual data points are plotted within each box grouped by various field smoke conditions including young nighttime smoke (YN), young daytime smoke (YD), mixed daytime smoke (M) that contains smoke contributed by either night smoke or fresh smoke, aged nighttime smoke (AN) and aged daytime smoke (AD). Data from three wildfires are shown here, including Rabbit Foot (RF) fire during the 2018 WE-CAN campaign, Williams Flats (WF) fire and Nethker fire during the 2019 FIREX-AQ campaign. N is sample number measured for each condition. Each box-whisker presents the 5th, 25th, 50th, 75th and 95th percentile of sample values in each group.
2.1 Description of mobile laboratory platforms: Molab and MACH-2
During the WE-CAN campaign in August 2018, we conducted our measurements and sampling using the NOAA Chemical Science Division mobile laboratory (Molab), which was a cargo van with all instruments mounted on it. Meteorological instrumentation on the roof of the Molab provides temperature, relative humidity, wind speed, wind direction, altitude and GPS coordinates. All additional instruments were mounted onto the interior floor, and ambient air is sampled through 1 or 2 m Teflon inlets that exit the roof of the Molab via boreholes. NO and NOx concentrations were measured with a Thermo Scientific Model 42i chemiluminescence NO NOx analyzer owned by Brown University, with ± 0.4 ppbv precision and 0.2 ppbv zero noise at 1 min time resolution. Note the NOx concentration measured using the chemiluminescence analyzer can be falsely elevated due to known interferences from NOy species, e.g., HONO and PAN. However, these data provide an upper limit of NOx level that supports the isotopic collections of NOx, HONO and nitrate. HONO and HNO3 concentrations were measured using the University of New Hampshire's dual mist chamber and ion chromatograph (MC/IC) system with an uncertainty of 3 % at 5 min resolution (Chai et al., 2019; Scheuer et al., 2003). During the FIREX-AQ field campaign in July–August 2019, we mounted our sampling instruments onto the NASA Langley mobile aerosol characterization platform (MACH-2) (Kaspari et al., 2021).
2.2 Description of sampling location and strategy
While our sampling strategy was similar in both years, the actual sampling approach differed in response to fire condition and accessibility to fresh smoke from the mobile platforms.
During the 2018 WE-CAN campaign, our ground measurements and sampling targeted smoke from Rabbit Foot (RF) fire in the Challis area of Salmon–Challis National Forest in central Idaho, from 9 to 18 August 2018 (Salmon-Challis National Forest, 2018). Measurements were made at various locations around the Challis area of Idaho impacted by the RF fire, consisting of five different conditions: young smoke during nighttime (YN), young smoke during daytime (YD), aged smoke during nighttime (AN), aged smoke during daytime (AD) and mixed daytime smoke (M) that contains smoke contributed by either night smoke or fresh smoke. To sample the young smoke, we drove the Molab to Morgan Creek Road (MCR), which extends into a valley that was several kilometers away from the edge of the fire. We observed heavy smoke that based on distance and wind speed was expected to transport from the RF fire burning locations to the valley within a few hours or less. Three night trips and two day trips were made to MCR. While the nighttime measurements were conducted while driving, the daytime work was carried out while parked at a spike camp (i.e., a campsite for firefighters and support personnel) at the upper end of MCR; the spike camp was about 2 km from the fire, which we were able to see while conducting the measurements. The aged smoke was sampled at three stationary sites located around the Challis area, each less than 30 km away from the RF fire. All of these sites were recreational vehicle parks that allowed for power plugins. A total of 7 nights and 4 d were measured. The sampling locations and driving map are shown in Fig. S1 with detailed information on the measurements listed in Table 1.
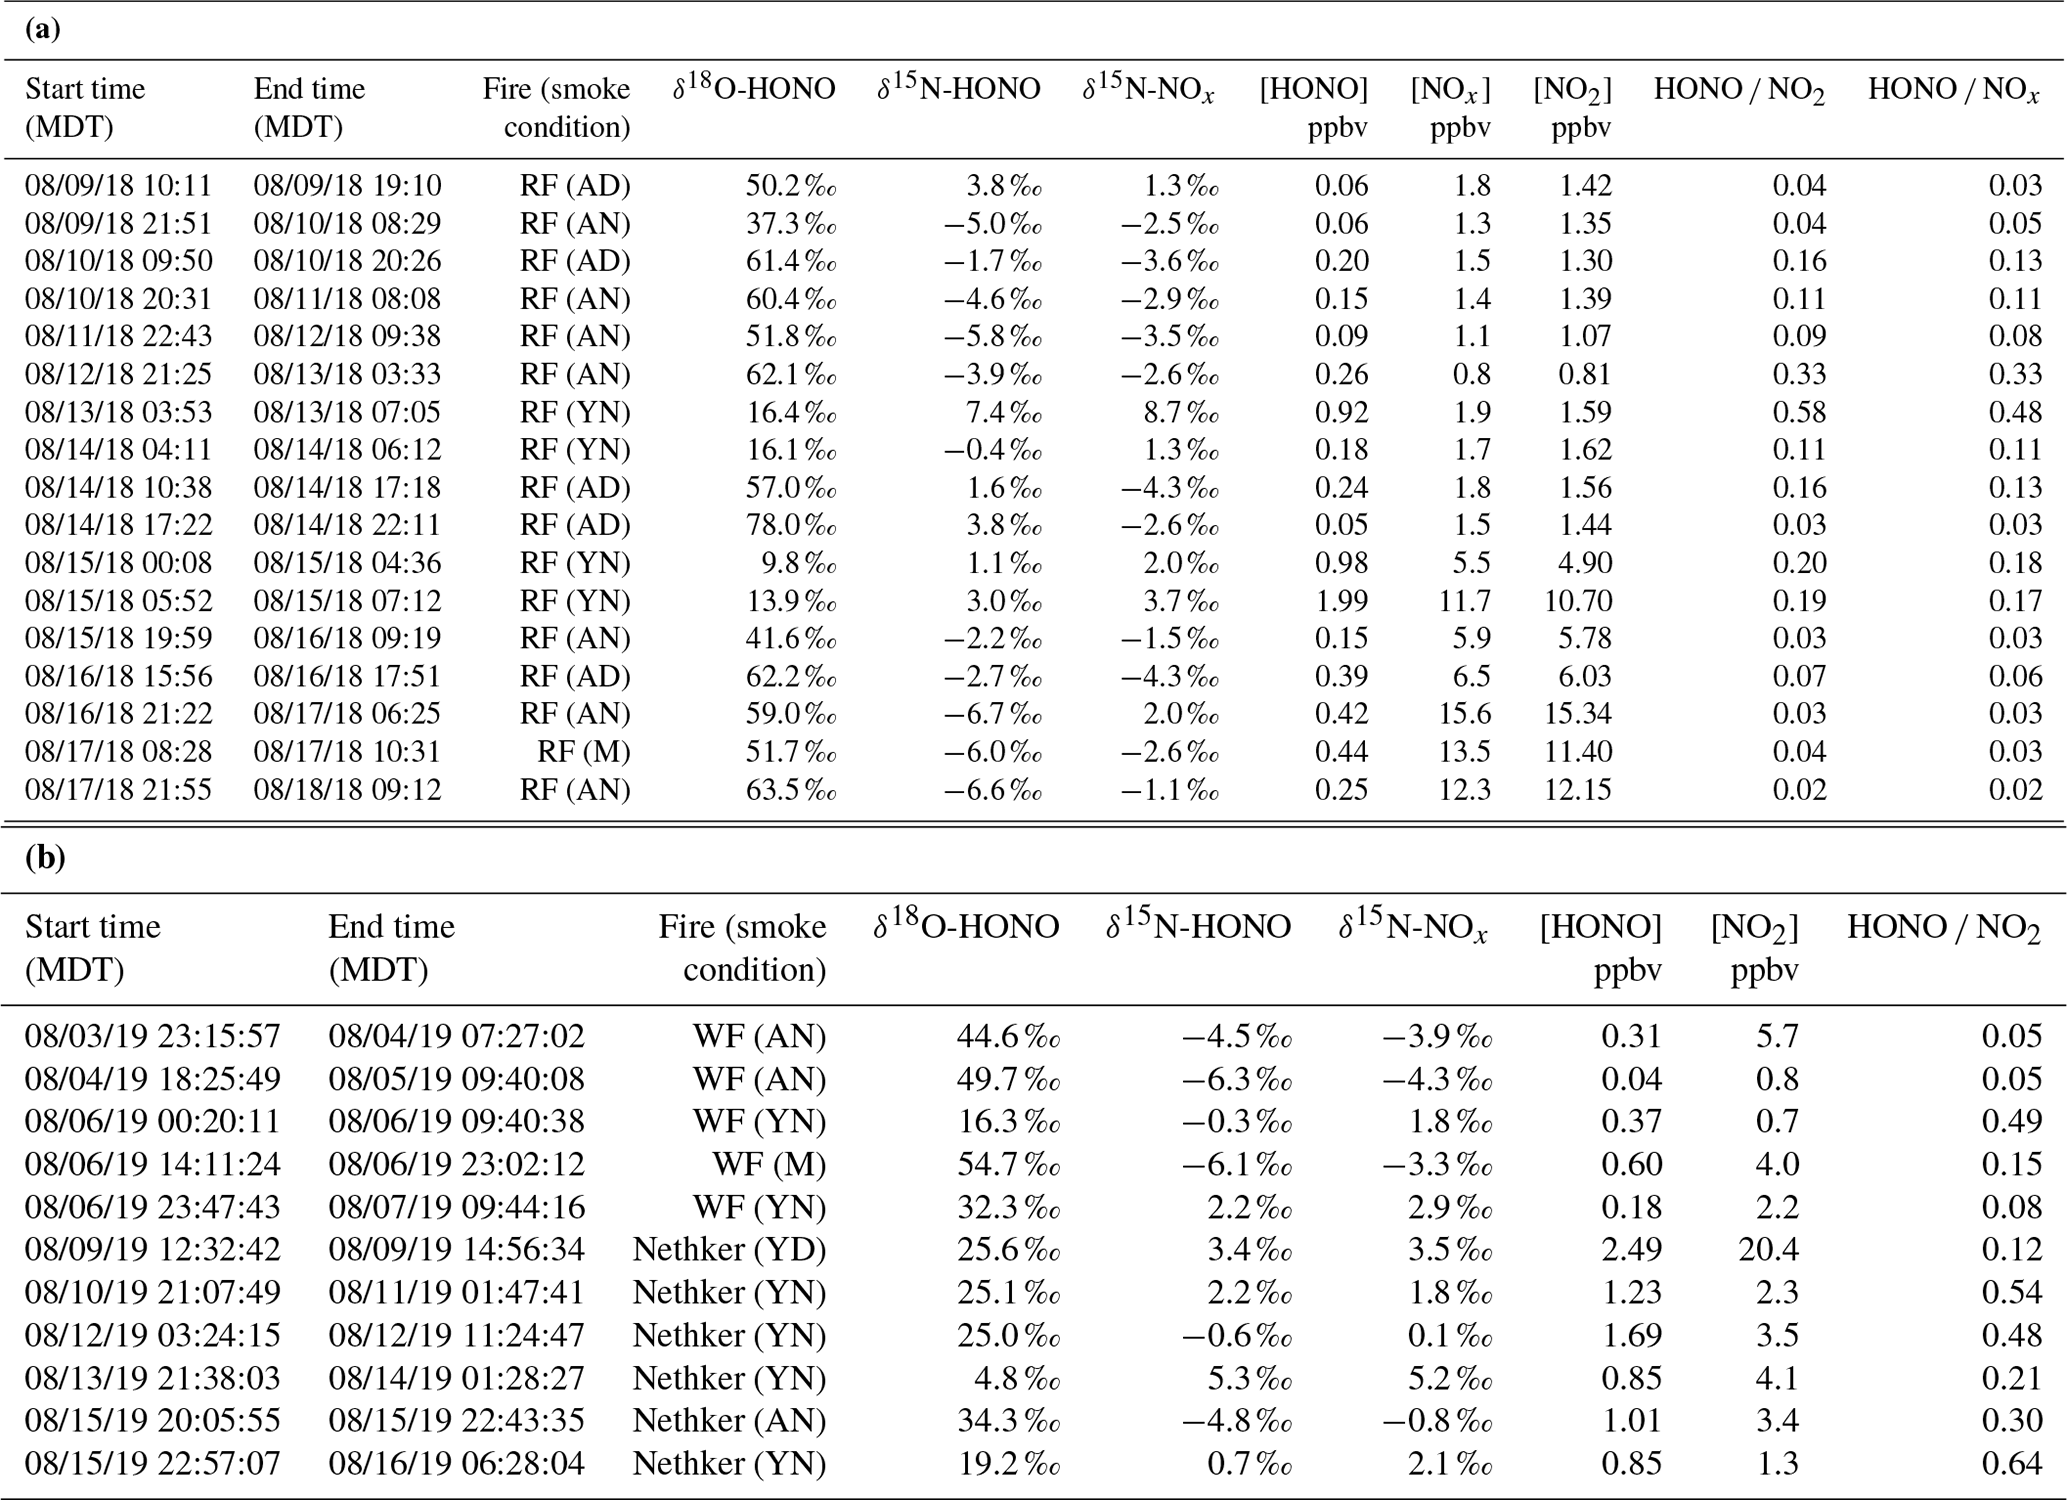
Table 1Sampling condition and isotopic composition and concentration results for NOx and HONO for Rabbit Foot (RF) fire during the 2018 WE-CAN campaign (a), as well as Williams Flats (WF) fire and Nethker fire during the 2019 FIREX-AQ campaign (b). Smoke conditions include young nighttime smoke (YN), young daytime smoke (YD), mixed daytime smoke (MD), aged nighttime smoke (AN) and aged daytime smoke (AD). The conditions are determined primarily by comparing the field data with the lab data involving three factors: δ18O-HONO, δ15N relationship between HONO and NOx, and HONO NOx (or HONO NO2) ratio, along with the smoke sampling locations. Specifically, significantly elevated δ18O-HONO indicates secondary production of HONO. Note that during the 2019 campaign, NOx concentrations were not measured due to instrumental breakdown.
During 2019 FIREX-AQ, we investigated five wildfires in the western US including Shady fire (Idaho), Black Diamond fire (Montana), Williams Flats fire (Washington), Nethker fire (Idaho) and Little Bear fire (Utah) from 24 July to 22 August 2019. We intensively sampled the emissions from Williams Flats fire and Nethker fire based on the large size and easy access to sampling locations (Fig. S2). Similar to the 2018 field campaign, the measurements were conducted under YN, YD, AN, AD and M conditions.
2.3 Collection of HONO, NOx and nitrate for isotopic analysis
Nitrogen oxides (NOx= NO + NO2), nitrous acid (HONO), particulate nitrate (p-NO) and nitric acid (HNO3) were captured in the field using recently developed methods and sent to Brown University for analyses of isotopic composition (Chai et al., 2019; Fibiger and Hastings, 2016; Chai and Hastings, 2018; Fibiger et al., 2014). In brief, HONO was completely captured at a pumping flow rate of ∼ 10 L min−1 with an annular denuder system (ADS), comprised (in order) of a Teflon particulate filter to remove p-NO and a Nylasorb filter to remove HNO3, followed by two annular denuders, each coated with a premixed Na2CO3−glycerol−methanol−H2O solution following a standard Environmental Protection Agency (EPA) method (Chai and Hastings, 2018). Within 24 h after each collection, the coating was extracted in 10 mL of ultrapure water (18.2 MΩ) in two sequential 5 mL extractions. Particulate nitrate on the upstream Millipore filters and HNO3 from the Nylasorb filters, if there was any, were extracted by sonicating the filters in ∼ 30 mL ultrapure H2O (18.2 MΩ). Samples with [NO] >1 µM were analyzed for isotopic composition (concentration techniques detailed below).
The denuder-extracted solution with a pH of ∼ 10 was frozen and transported to Brown University for concentration and isotopic analysis, which was completed within 2 months after the sampling. The timescales for sample extraction and isotopic analysis preserve both the solution concentration and isotopic composition of HONO in the form of nitrite (Chai and Hastings, 2018). The two-denuder setup allows for the minimization of the interference for both concentration and isotopic analysis from other N-containing species that could be trapped and form nitrite in residual amounts on the denuders, especially NO2. Note that HONO levels were above the minimum detection limit (0.07 µM in extraction solution) and that the breakthrough amount of HONO threshold is far from being reached given the concentrations (Table 1), flow rate (∼ 8 L min−1) and collection times. Isotopic analysis of nitrite required the collection of a minimum amount of 10 nmol. NOx was completely collected in an impinging solution containing 0.25 M KMnO4 and 0.5 M NaOH which oxidizes NO and NO2 to NO by pumping sampled air through a gas washing bottle at a flow rate of ∼ 4 L min−1. Collection time for HONO ranged from 2 to 12 h and that for NOx ranged from 0.75 to 2.5 h depending on their mixing ratios to make sure sufficient samples were captured against blanks for isotopic analysis (Fibiger et al., 2014; Fibiger and Hastings, 2016; Wojtal et al., 2016). Particulate filters and Nylasorb filters were collected over 7–12 h due to the low concentration of particulate nitrate and HNO3.
The samples from each collection system were retrieved and processed following the procedures described in Chai et al. (2019). All treated samples from NOx, HONO, p-NO and HNO3 collection and their corresponding blanks were analyzed offline for concentrations of NO and NO with a WestCo SmartChem 200 discrete analyzer colorimetric system. The reproducibility of the concentration measurements was ± 0.3 µmol L−1 (1σ) for NO and ± 0.4 µmol L−1 for NO when a sample was repeatedly measured (n=30). A detection limit of 0.07 µmol L−1 for NO and 0.1 µmol L−1 for NO was determined, and no detectable nitrite or nitrate was found in the blank denuder coating solution, whereas blank NO concentrations of ∼ 5 µM are typical for the NOx collection method (Fibiger et al., 2014; Wojtal et al., 2016). We only report the samples whose concentrations were at least 30 % above NO present in the blank KMnO4 solution upon purchase to avoid increasing the error associated with the isotopic composition (Fibiger et al., 2014). Note that NO concentration was measured on the ADS solutions to verify whether and to what extent NO was oxidized to NO on denuder walls because the denitrifier method will convert both NO and NO to N2O for isotopic analysis (see below).
Note that the complete collection of HONO and NOx have been verified in various environments including biomass burning emissions. During the FIREX fire lab experiment, we applied the same method to quantify the HONO and NOx isotopic composition (Chai et al., 2019). The concentrations of HONO captured with our ADS compared well with four other high-time-resolution concentration measurement techniques, including mist chamber and ion chromatography (MC/IC), open-path Fourier transform infrared spectroscopy, cavity-enhanced spectroscopy, and proton-transfer-reaction time-of-flight mass spectrometer. In the same work, the NOx concentrations collected in the permanganate impinger were verified by real-time measurement with a chemiluminescence NOx analyzer. In addition, our NOx collection technique has been verified with real-time NOx concentrations in on-road, near-road and urban background environments (Wojtal et al., 2016; Miller et al., 2017). These agreements verify complete capture of HONO and NOx associated with biomass burning emissions using our techniques, which preserve the isotopic signatures without isotopic fractionation during the sampling process.
2.4 Isotopic analysis
The denitrifier method was used to complete nitrogen (15N 14N) and oxygen (18O 16O) isotope analyses of separate NO samples converted from NOx and NO samples converted from HONO by quantitative conversion to N2O by denitrifying bacteria P. aureofaciens (Casciotti et al., 2002; Sigman et al., 2001). The isotopic composition of N2O is then determined by a Thermo Finnigan Delta V Plus isotope ratio mass spectrometer at 44, 45 and 46 for 14N14N16O, 14N15N16O and 14N14N18O, respectively. Sample analyses were corrected against replicate measurements of the NO isotopic reference materials USGS34, USGS35 and IAEA-NO-3 (Böhlke et al., 2003) and that of the NO isotopic reference materials N7373 and N10219. Precisions for δ15N-NOx, δ15N-HONO and δ18O-HONO isotopic analysis across each of the entire methods are ± 1.3 ‰, ± 0.6 ‰ and ± 0.5 ‰, respectively (Chai and Hastings, 2018; Fibiger et al., 2014).
3.1 Concentrations of HONO and NOx
Among the three fires, increased HONO concentrations were observed in young smoke during both night (0.2–2.0 ppbv) and day (2.5 ppbv), while HONO level is significantly lower in aged smoke during both night (0.06–1.0 ppbv) and day (0.05–0.6 ppbv) as shown in Fig. 2a. Although median values show young night and day are significantly higher than aged smoke day and night, there is significant overlap between young nighttime and aged day and night for WF and Nethker fires. These parts per billion volume to sub-parts per billion volume HONO concentrations can be a major OH source in areas that are impacted by wildfire. We also determined the molar ratio HONO NO2 from the concentrations for each sample (Fig. 3), and the values represent the upper bound of [HONO] [NOx] (Table 1a). Median ratios of [HONO] [NO2] for the five smoke conditions are 0.35 (YN), 0.12 (YD), 0.07 (AN), 0.09 (AD) and 0.04 (MD). The median ratios of [HONO] [NO2] for the young smoke fall in the range of fresh emissions measured in the lab (0.13–0.53) and the field (0.05–0.33) (Yokelson et al., 2009; Selimovic et al., 2020, and references therein). Our results for YN are also in agreement with airborne measurements (0.34 ± 0.08) from the BB-Flux campaign that occurred in parallel with WE-CAN but are lower than the WE-CAN airborne observation of 0.72 ± 0.34 during the day (Theys et al., 2020; Peng et al., 2020). It is worth noting that the majority of the WE-CAN airborne data overlap with the BB-Flux results and our measurements, and Peng et al. (2020) associate very high ratios with different transport dynamics of fresh plumes. The concentration results for the ADS collected [HONO] agree well with that measured via MC/IC in real time and averaged over the ADS sampling periods (Fig. S3). The good agreement between these techniques sampling the same plumes near the ground and previous agreement with other HONO and NOx observation methods suggest the concentrations are accurate (see also Sect. 2.3). It is important to also consider possible interference of peroxyacetyl nitrate (PAN) with NOx collected in the alkaline permanganate solution for biomass burning conditions (Jaffe and Briggs, 2012). There is minimum PAN formed in fresh biomass burning (BB) emissions and young smoke of less than half an hour, based upon previous lab and field measurements, as well as modeling studies (Stockwell et al., 2014; Yokelson et al., 2009; Alvarado et al., 2010, 2015). In aged BB plumes in the upper troposphere, PAN can form rapidly at low temperatures and act as a temporary NOx reservoir, reaching a maximum PAN NOy ratio of 0.3 (comparable to NOx NOy) within ∼ 2 to 4 h of aging after emission (Yokelson et al., 2009; Liu et al., 2016; Akagi et al., 2012). Though we note that these results are all from airborne measurements. There are no ground-level measurements for PAN in BB plumes during WE-CAN or FIREX-AQ, nor from other field studies to the best of our knowledge. PAN is thermally unstable in the boundary layer during summertime, and its main loss process in the atmosphere is thermal decomposition to release NO2. The lifetime of PAN is on the order of 1 h or less at 20 ∘C and above (Talukdar et al., 1995; Fischer et al., 2010). We therefore expected PAN in near-ground air to maintain low levels or less due to photochemistry and thermal decomposition. Thus, given the short lifetime and the sample integration time of over 40 min to 2 h timescale, PAN is unlikely to interfere with our NOx results.
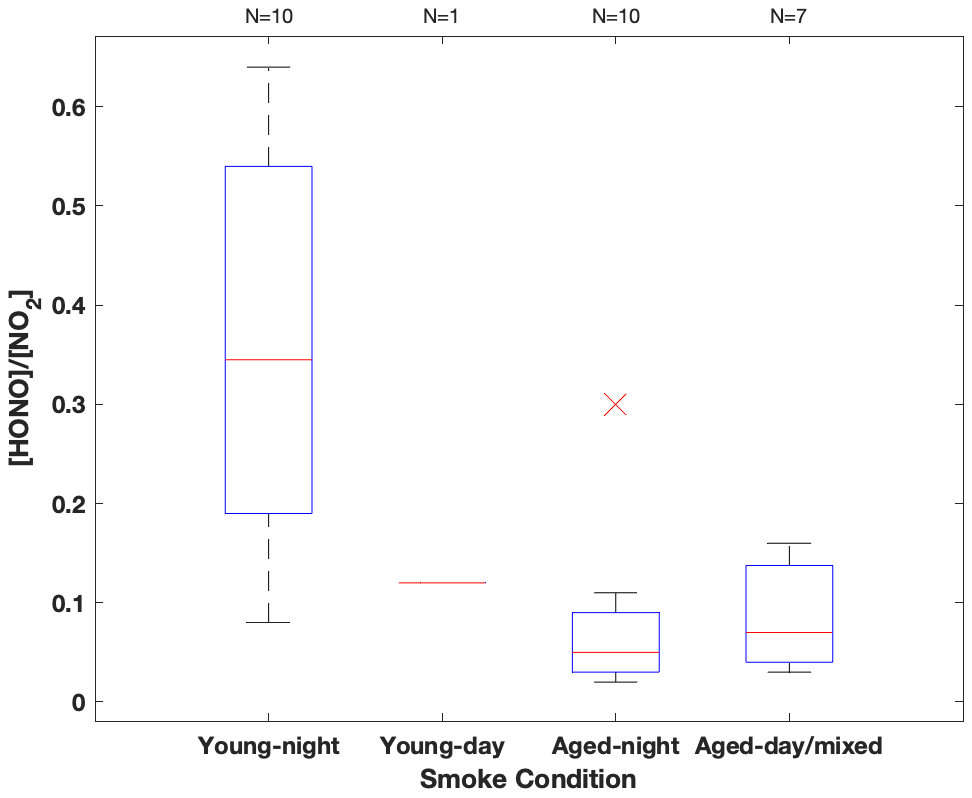
Figure 3HONO NO2 concentration ratio summarized in box-whisker plot for each sampling condition. The red cross indicates an outlier. The whiskers from bottom to top represent 5 %, 25 %, 50 %, 75 % and 95 % quartiles.
In the aged smoke, [HONO] [NO2] are greatly reduced to median values of 0.05 and 0.07 observed for AN and AD, respectively, lower than the lab-derived range (Fig. 3). Wildfire plumes near ground level are expected to be more diluted than those directly injected upwards during the day, and the loss of HONO due to photolysis in the plume and/or surface reactions would be expected to be much faster than that in higher altitude dense plumes. The very low ratios indicate that HONO was lost faster than NOx; however, given the 10–20 min lifetime of HONO against photolysis during the day and up to a couple of hours during the night (Nie et al., 2015), and considering aged smoke was sampled tens of kilometers from the fire, HONO levels may be maintained via secondary chemistry due to the high particle loadings and other terrestrial surface reactions in wildfire plumes (Alvarado and Prinn, 2009). While the concentration data are valuable for the ground-based setting near the fires, considerable uncertainty exists in the rate coefficients of the heterogeneous processes in daytime, as well as the HONO and NO2 uptake coefficient and surface area densities (Appendix A). This makes it challenging to quantify the relative contribution of each potential pathway to the observed HONO budget.
3.2 Isotopic signatures of HONO and NOx
In the 2016 FIREX fire laboratory experiment, we obtained δ15N of NOx and HONO, as well as δ18O of HONO, in direct emissions from controlled burning of various vegetation biomasses representative of the western US (Chai et al., 2019). The lab-based δ15N and δ18O results serve as source signatures of biomass burning (BB) emissions: δ15N-NOx (−4.3 ‰ to +7.0 ‰) and δ15N-HONO (−5.3 ‰ to +5.8 ‰) are derived from biomass N and the transformation in the combustion process, and δ18O-HONO (5.2 ‰ to 15.2 ‰) incorporates δ18O of molecular oxygen and water via combustion reactions (Chai et al., 2019). In the field, we expect that once NOx and HONO are released and transported, atmospheric processing including photochemistry and nighttime chemistry would cause the isotopic composition of emitted NOx and HONO to change.
By directly comparing the field-measured δ18O-HONO with that measured from lab-controlled burning, we separate the data observed in young smoke from those in aged smoke. Very young smoke largely reflects fresh wildfire emissions without significant atmospheric processing, while aged smoke δ18O-HONO should deviate from the lab values due to the influence of secondary chemistry involving RN cycling. The δ18O-HONO of young nighttime smoke ranged from 4.8 ‰ to 32.3 ‰ with a median value of 19.0 ‰, while the value in a single young daytime sample was 25.6 ‰ (Fig. 2b). There is a major overlap between the lab results and young nighttime smoke but with some higher δ18O-HONO values in the field observations. These results suggest the HONO sampled in young smoke was dominated by primary BB emissions from the nearby wildfire but included contributions of secondarily produced HONO. By contrast, δ18O-HONO is greatly elevated in aged smoke from all three fires both day and night. In addition, two aged smoke samples are labeled as mixed smoke because the collection interval included both sunlit and dark periods. The enrichment of δ18O-HONO (up to 78 ‰), regardless of location and time, suggests that HONO in these conditions is produced by secondary chemistry involving NO, NO2 and nitrate, which transfer high δ18O values due to O3 influence via photochemistry (Appendix B) (Thiemens, 2006; Michalski et al., 2003). The varying δ18O-HONO values reflect different oxidizing environments, i.e., NO-to-NO2 conversion via RO2 versus O3. These branching ratios can be determined if we resolve the dominant pathways for HONO production.
The δ15N-HONO in the young smoke ranges from −0.3 ‰ to +7.4 ‰ with a median value of 2.8 ‰ for YN and +3.4 ‰ for YD, whereas that in the aged smoke shows decreased median values of −2.9 ‰ and −1.8 ‰ for AN and AD, respectively. In addition, the daytime aged smoke exhibits the largest variability (Fig. 2c), and this likely reflects daytime HONO secondary chemistry. It is noted that δ15N-NOx and δ15N-HONO measured across the entire period of all three fires at ground level ranges from −4.3 ‰ to +8.7 ‰ and −6.7 ‰ to +7.4 ‰, respectively, with the majority overlapping with the corresponding ranges found in the fire laboratory experiment and no significant difference in mean values (p value >0.5) (Chai et al., 2019; Fibiger and Hastings, 2016). This consistency suggests δ15N is a reliable tracker generally for BB-derived NOx and HONO, although there is clear variability between the different smoke conditions that can refine our understanding of reactive N cycling. We note again that, although no near-ground PAN measurements in BB plumes are available, the isotopic results also suggest that PAN interference is not important to the δ15N-NOx results. For aged smoke, we would expect δ15N-NOx to decrease from that in fresh emissions due to partial transformation of NOx to additional oxidized N products (e.g., PAN), as well as isotopic exchange between NOx and these oxidized species; both processes will leave 15N depleted in NOx and 15N enriched in PAN (Walters and Michalski, 2015). If PAN existed at significant concentrations that were (1) comparable with NOx in the atmosphere and (2) completely collected in the permanganate solution, then the δ15N would reflect the overall δ15N of NOx+ PAN in the final reduced permanganate solution. In this case, we would expect that aged smoke would not shift from the δ15N-NOx range of young smoke because δ15N shifts in both PAN and NOx could offset each other. However, our observed δ15N-NOx mean values for both aged daytime and nighttime smoke are significantly (p<0.05) lower than that of the young smoke, a good indicator of a lack of PAN interference on the isotopic results (see also Miller et al., 2017).
Our prior lab-controlled burning study revealed a linear relationship between δ15N-HONO and δ15N-NOx, with δ15N-HONO slightly more negative than δ15N-NOx in fresh BB emissions (Chai et al., 2019). This δ15N relationship is plotted as a solid line, together with all field observations, to illustrate the potential influence of atmospheric processing on the δ15N-HONO and δ15N-NOx (Fig. 4). The plot can be sub-divided into three regimes. In regime I, we find all of the δ15N of NOx and HONO in young smoke from both daytime and nighttime. In this young smoke regime, more positive δ15N than that of the rest of our samples is found for both species, and all samples concur with the δ15N relationship found for fresh emissions (Fig. 4). This, along with the low δ18O-HONO associated with these samples (Fig. 2b), confirms HONO is not significantly affected by secondary chemical processing in the air mass captured from fresh smoke. Regime II is filled with the results of daytime aged smoke ∼ 30 km away from the RF fire; these results exhibited much more positive δ15N-HONO than δ15N-NOx by 3 ‰ to 6 ‰, as well as the largest (positive) discrepancy from the BB δ15N relationship line, as shown in the upper left region of Fig. 4. The daytime aged smoke also exhibited the highest values of δ18O-HONO observed (Fig. 2). All samples of aged nighttime smoke that were collected fall in regime III. While the majority of the regime III data fall within the 95 % confidence interval for the lab-based δ15N relationship, there is a tendency for these samples to have δ15N-HONO that was more negative than δ15N-NOx to different degrees of up to −8.7 ‰. In particular, we hypothesize that the combination of more negative δ15N-HONO values and elevated δ18O-HONO indicate secondary production of HONO. We next explore quantitative use of δ15N-NOx, δ15N-HONO and δ18O-HONO to understand the isotopic shifts in terms of secondary chemistry involving RN cycling.
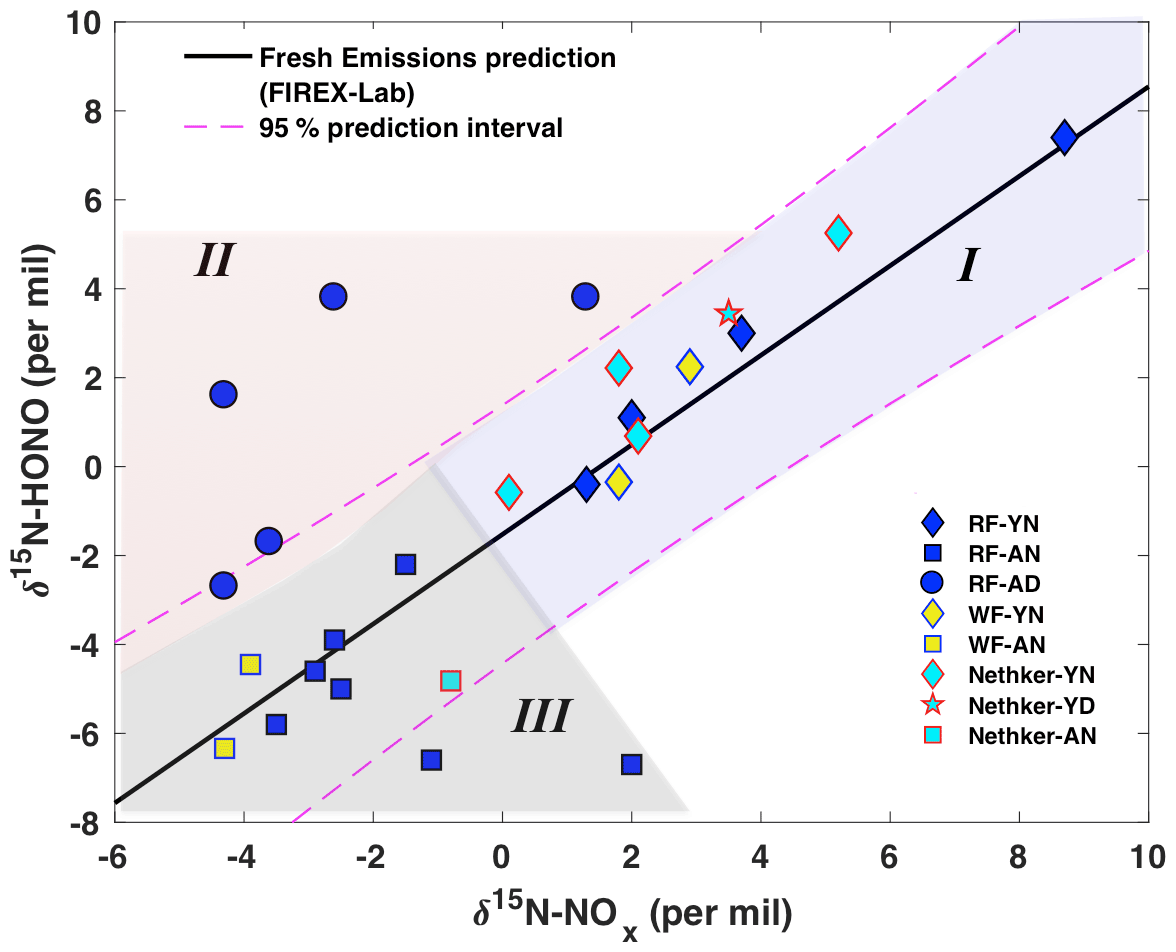
Figure 4Relationship between wildfire-derived δ15N-HONO and δ15N-NOx. Samples from plumes of three wildfires including Rabbit Foot fire (RF; 2018), Williams Flats fire (WF; 2019) and Nethker fire (2019) are shown as different colors. Different symbols indicate different smoke conditions including young nighttime smoke (YN), young daytime smoke (YD), aged nighttime smoke (AN) and aged daytime smoke (AD). Note that the mixed smoke samples displayed in Fig. 2 are not shown here due to their large uncertainty. The solid black line (δ15N-HONO = 1.01δ15N-NOx−1.52; R2=0.89, p<0.001) is derived from lab-controlled burning emissions during the 2016 FIREX fire lab study (Chai et al., 2019) and within the 95 % confidence interval (dashed magenta lines) predicts much of the field-based δ15N-HONO versus δ15N-NOx. The field data are further grouped into three regimes – young smoke in both day and night (I, light purple shading), aged daytime smoke (II, pink shading) and aged nighttime smoke (III, gray shading) based upon the δ18O-HONO results.
3.3 Isotopic mass balance modeling
In aged smoke, the observed δ18O-HONO enhancement and shift of δ15N values away from the δ15N NOx–HONO line, as a result of RN cycling, would be expected to be derived from the integrated kinetic isotopic fractionation (expressed as enrichment factor 18ε and 15ε) associated with each of the loss/production processes (Fig. 1) weighted by their relative contribution to the budget. By definition, ‰, with fractionation factor α referring to the rate coefficient ratio between the heavy isotopologue and the light isotopologue. For δ18O-HONO, we also took into account the transferring effect of oxygen from different O-containing reactants that produce HONO (as explained in Appendix B). In order to elucidate the relative role each process plays in the HONO budget, we constructed an isotopic mass balance model for δ15N and for δ18O.
In aged smoke, a deviation in δ15N, represented as Δδ15N (=δ15N-HONO − δ15N-NOx), is simulated following Eq. (1), where f is the fraction of reaction i (reaction numbering in Sect. 1) to total loss (L) or production (P) of HONO. δ18O-HONO is simulated following Eq. (2), in which the change in δ18O-HONOi,P arises from, in addition to kinetic isotopic fractionation, the transferring of δ18Oi,t (Eq. 3) in the reactant (OH, NO, NO2, H2O and NO) to the product HONO as HONO contains two O atoms that may stem from more than one reactant (Appendix B). The δ18O values of all possible reactions that produce HONO are evaluated, as tabulated in Table S1 in the Supplement, to help determine δ18O of NO, NO2 and HONO. The isotopic enrichment factors 15ε and 18ε associated with each of Reactions (R1)–(R7) are computed via theoretical principles as none of these key parameters are currently available in the literature (Appendix B).
3.3.1 Modeling of δ15N of HONO and NOx in aged daytime and nighttime smoke
We first simulated for both daytime and nighttime aged conditions using this model. According to the potential HONO–NOx chemistry in ground areas impacted by wildfire smoke plumes (Fig. 1), HONO is expected to be predominantly lost to photolysis (Reaction R1) during the day. It is well known that HONO can be produced via a gas-phase radical recombination reaction between NO and OH (Reaction R2) (Platt et al., 1980). However, the rate of Reaction (R2), calculated from the rate coefficient, the typical daytime OH concentration (1–2×10⁶ molecule cm−3) (de Gouw et al., 2006) in biomass burning plumes and our measured mean NOx concentration, can only account for up to 15 % of the HONO production rate (Appendix A and Table A1). Under a typical pseudo-steady-state approximation (PSSA) (), additional sources of HONO must be included to balance the HONO budget. Thus, we modeled three scenarios varying the relative contribution of Reaction (R2) as 5 %, 10 % and 15 %. With rapid photolytic loss, HONO has a lifetime nearly 2 orders of magnitude shorter than the lifetime of NO in Reaction (R2), as well as that of NO2 in Reaction (R3) and nitrate in Reaction (R4); thus, the Δδ15N is mostly sensitive to the change in δ15NHONO immediately upon photolysis but overall remains constant, associated with Reactions (R2)–(R4) within the timescale of HONO photolysis. We quantify the remaining HONO fraction from secondary production, frp, to represent HONO that has been produced but not yet photolyzed. Thus, the daytime Δδ15N for aged smoke was simulated as a function of frp following a Rayleigh-type isotopic fractionation scheme (Fig. 5 and Sect. B2.1). Generally, Δδ15N follows an exponential increase as frp decreases. In other words, as more photolysis occurs the difference in the remaining δ15N-HONO and the δ15N-NOx increases, and this is driven by the negative value of 15ε1 which tends to enrich 15N in the HONO reactant (Reaction R1). The simulation was carried out for two different sets of HONO production mechanisms, with HONO photolysis being the dominant loss pathway. With mechanism M1 (solid lines in Fig. 5), photo-induced surface NO2-to-HONO conversion (Reaction R3) is the major pathway in addition to gas-phase OH + NO (Reaction R2) to produce HONO. As 15ε2 has a positive value, a larger Reaction (R2) contribution leads to higher Δδ15N. With mechanism M2 (dashed line in Fig. 5), nitrate photolysis (Reaction R4) is included in addition to Reactions (R2) and (R3) in the HONO production mechanism. Taking the contribution of Reaction (R2) of 10 % as a constant, three scenarios were modeled by varying the relative contribution of Reaction (R3) (75 %–85 %) and Reaction (R4) (5 %–15 %). The results suggest larger Reaction (R4) contribution yields lower Δδ15N due to severe 15N depletion associated with nitrate photolysis ( ‰) (Appendix B). Importantly, the addition of Reaction (R4) in M2 also lowers Δδ15N compared to M1. By applying the field-observed Δδ15N for the aged daytime smoke to the model, we solved frp for all scenarios and plotted these as circles in Fig. 5. All five aged daytime datasets from RF can be reproduced by M1 under all three scenarios; by contrast, via M2, none of the three scenarios can explain the two highest Δδ15N values observed in the field. As such, we conclude that Reaction (R4) plays a minor role (<5 %) in the secondary HONO production in the aged daytime smoke during our sampling periods. Rather, HONO forms primarily via Reactions (R2) and (R3) during the day in the areas impacted by aged wildfire smoke. However, there are two limitations to the modeling results. First, as the 15N 14N fractionation associated with Reactions (R3), (R6) and (R7) are not distinguishable with our current parameterization (Appendix B1.2 and B2.2), we cannot rule out the potential importance of heterogeneous NO2-to-HONO conversions (Reactions R6 and R7) in daytime. Second, it should be noted that the results represent our best estimate of the average relative importance of Reactions (R2)–(R4) for HONO production during our HONO sampling periods (2–10 h) for the aged daytime plume. Due to the long sample integration time, our samples were influenced by both aged smoke and near-background air when the smoke was very diluted. Under the NOx-limited condition (low NOx<1 ppbv) in remote background air, nitrate photolysis is expected to be the major secondary HONO source (Ye et al., 2016; Zhou et al., 2011), which cannot be ruled out by our results. Isotopic measurement techniques with higher time resolution will be required to achieve real-time quantification of the HONO budget.
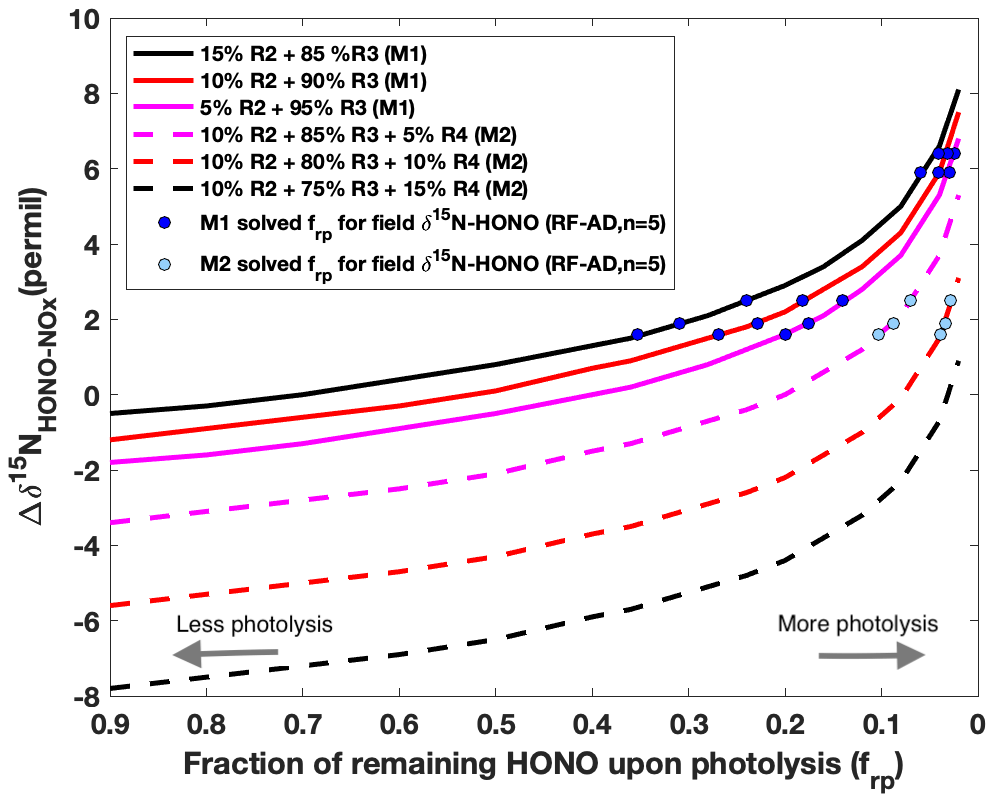
Figure 5Modeling results of δ15N for aged daytime smoke via two plausible mechanisms (M1 and M2) for secondary HONO production. The isotope mass balance model (Eq. 1) is used to simulate the δ15N difference (Δδ15NNHONO−δ15N) as a function of the fraction of HONO remaining after photolysis (frp) in a pseudo-photochemical steady state. The calculated kinetic fractionation factors used here are explained in Appendix B. In the first mechanism (M1, solid lines), Reaction (R3) is the major HONO production pathway with a varying relative contribution from Reaction (R2), which is constrained as producing no more than 15 % of the observed HONO concentrations. In the second mechanism (M2, dashed lines), nitrate photolysis (Reaction R4) is included in addition to Reactions (R2) and (R3) for HONO production. Taking the contribution of Reaction (R2) of 10 % as a constant, three scenarios were modeled by varying the relative contribution of Reaction (R3) (75 %–85 %) and (R4) (5 %–15 %).
For the nighttime smoke, we simulated that the HONO budget is maintained by Reactions (R5)–(R7). Δδ15N reflects the combination of kinetic isotopic fractionation 15ε5 associated with the HONO loss (Reaction R5) and production reactions (Reactions R6 and R7 in proportion). With our calculated uptake 15ε5 (−2 ‰) and estimated 15ε6 or 15ε7 (ranging from −2.9 ‰ to −4.5 ‰), we obtained ranging from −0.9 ‰ to −2.5 ‰ when uptake and production occur at a similar timescale (rate coefficient), and this can explain the majority of observed aged nighttime results (regime III; Fig. 4). Two aged nighttime points sampled for RF (16 and 17 August 2018) fall outside of the predicted range, with much lower (−8.7 ‰ and −5.5 ‰, respectively). These two samples were associated with 2–10 times elevated NOx concentration compared to the previous 4 nights and likely higher concentrations of particulate matter (Figs. 2a; Fig. S4 in the Supplement). This could cause an accelerated conversion of NO2-to-HONO, which is not accounted for in the steady state estimation above, leading to the much lower Δδ15N values that were observed.
3.3.2 Modeling of δ18O of HONO in aged daytime and nighttime smoke
The δ18O-HONO of daytime aged smoke was modeled following M1 (Reactions R1–R3) derived based upon the δ15N modeling results: NO and NO2 are cycled via NO2 photolysis and NO oxidation by O3 and/or peroxy radicals (RO2 including HO2) during the day, through which δ18O of O3 and RO2 can be passed to NO and NO2 via mass transfer (Eqs. B10–B12). O3 is known to have an intrinsically high δ18O value of up to ∼ 117 ‰ caused by unique isotopic fractionation associated with photochemical gas-phase O3 formation (Thiemens, 2006), while OH and RO2 have very low δ18O values (Thiemens, 2006). O3 participation in reactive N cycling involving NOx (Reaction R8) results in high δ18O of NO2 (Michalski et al., 2003; Walters et al., 2018). In pseudo-photochemical steady state, NO and NO2 are expected to have similar δ18O which is a result of competition between O3 and RO2 oxidation (Reactions R8–R10), expressed as via Eqs. (4) and (5) below.
The δ18O signature is subsequently passed to HONO when it is produced from NO (Reaction R2) and NO2 (Reaction R3) during the day and from NO2 (Reactions R6 and R7) during the night, and thus δ18O-HONO is a positive linear function of if kinetic isotopic fractionation (18ε) associated with these processes are fixed values (as calculated in Appendix B). Given that HONO is predominantly produced via Reactions (R2) and (R3) in aged daytime smoke (Fig. 5), δ18O-HONO was simulated following the three M1 scenarios with the contribution of Reaction (R2) varying from 5 % to 15 %. All three scenarios reproduced the range of our field results for aged daytime smoke, further pointing to M1 as explaining the HONO in this environment. In addition, the variation in δ18O was driven by differing oxidation that is determined by , which depends on the relative concentration of O3 to RO2 (Figs. S5 and S6). The corresponding to each observed δ18O-HONO were solved and plotted in Fig. 6a. We found decreased by less than 0.02 as the contribution of Reaction (R2) to total HONO production decreased from 15 % to 5 %. On the other hand, δ18O-HONO changes sensitively with varying , increasing from 50.2 ‰ to 78.0 ‰ as the fraction of NO oxidized by O3 rather than RO2 increases from 0.34 to 0.65.
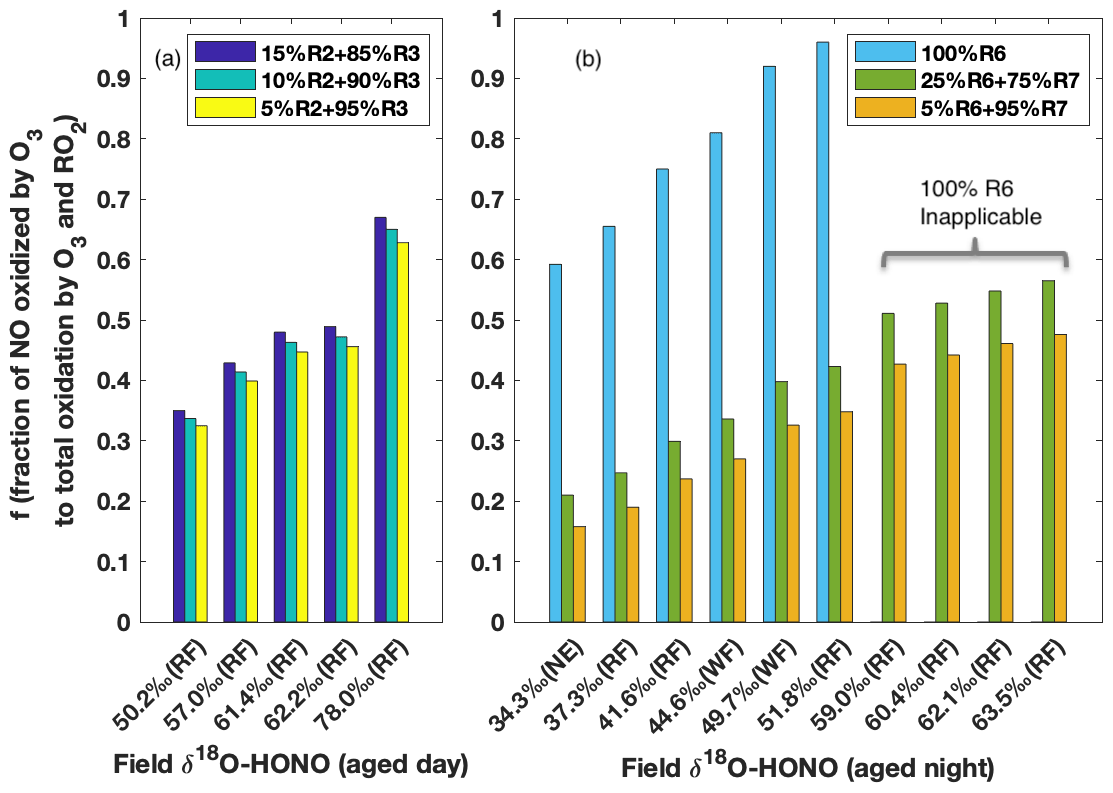
Figure 6Model prediction of fraction of NO oxidized to NO2 via O3 to that via O3 and RO2 together () on the basis of field-measured δ18O-HONO for aged daytime (a) and nighttime (b) smoke. During the day (a), the contribution of Reaction (R2) to HONO production is varied from 5 % to 15 % following M1 in Fig. 5, and Reaction (R3) accounts for the remaining secondary HONO contribution. The modeling results are shown in Fig. S5 and Table S3 in the Supplement. During the night (b), three scenarios with various contributions of Reactions (R6) and (R7) are modeled (Fig. S6 and Table S4). is predicted to be over unity for the last four observed δ18O-HONO values if Reaction (R6) is assumed as the only nighttime pathway.
The δ18O-HONO of nighttime aged smoke was modeled following the nighttime chemistry (Reactions R5–R7), i.e., taking NO2 conversion as the source and surface uptake as the sink. In areas impacted by nighttime aged smoke, HONO forms from wildfire-derived NO2 residing in the nocturnal boundary layer. As the two pathways (Reactions R6 and R7) for heterogeneous NO2 conversion lead to very different δ18O-HONO stemming from different δ18O transfer (Appendix B), we examined the relative importance of the two pathways for HONO production by varying the relative contribution between the two pathways and comparing it to the observed δ18O-HONO (Fig. 6b). If HONO is constrained to exclusively form via Reaction (R6) (surface hydrolysis), the model would require an unrealistic % to explain δ18O-HONO >55 ‰. Even for samples with lower δ18O-HONO values (34 ‰ to 52 ‰), the high branching ratio (>0.6) required to create such large enrichment is unrealistic for BB environments. In particular, [O3] [RO2] converted from solved under this mechanism is at least twice as large as values derived from the previous field measurement of aged wildfire smoke (Baylon et al., 2018). By contrast, the inclusion of Reaction (R7) in addition to Reaction (R6) in rate ratios 3:1 and 20:1 based on previous lab studies (Kebede et al., 2016; Scharko et al., 2017) can elevate the modeled δ18O-HONO and explain all observed δ18O-HONO values. This suggests NO2-to-HONO heterogeneous conversion catalyzed by surface-hosted iron oxides and quinone (Reaction R7) in the nighttime aged smoke proceeds significantly faster than NO2 hydrolysis (Reaction R6). Our isotopic analyses provide evidence for the participation of such a pathway in BB environments and also shows the capability to constrain the relative importance between these two pathways. Although the daytime δ18O-HONO can be larger than that of nighttime aged smoke, similar [O3] [RO2] ratios are derived from our solved and are consistent with the limited field measurements (Parrington et al., 2013; Baylon et al., 2018), and they further indicate the important role peroxy radicals play as an oxidant in wildfire-smoke-impacted environments.
As wildfire has enormously impacted climate, air quality and ecosystems in the past and is expected to worsen (Westerling, 2016), accurately tracking wildfire-derived reactive nitrogen species (i.e., NOx and HONO) and their cycling is extremely important for quantifying and mitigating key pollutants such as O3 in wildfire-impacted areas both close to the fire and thousands of kilometers downwind. We show δ15N-HONO and δ15N-NOx can serve as a powerful tool to track BB sources and constrain secondary HONO production pathways. With the help of field-observed δ18O-HONO, we grouped our measured relationship between the δ15N-HONO and δ15N-NOx into three different regimes, which clearly distinguish between young wildfire plumes, aged daytime plumes and aged nighttime plumes. The δ15N results allow for constraining the daytime HONO budget and particularly secondary production mechanisms via the isotope mass balance simulation. The use of excess δ15N (Δδ15N) also provides an approach for constraining HONO budgets in other environmental settings, such as urban ambient areas and remote areas including forest and polar regions. Furthermore, by combining δ15N emission source signatures and chemical fractionation characteristics, we could potentially track the impact and relative role of wildfire-derived reactive nitrogen more extensively when the plume transfers thousands of kilometers downwind and mixes with other air such as urban plumes. In addition, the δ18O-HONO results not only offer direct evidence for secondary production of HONO that allows for the determination of the NO oxidizing branching ratio between O3 and RO2 but also constrains nighttime HONO production mechanisms. We expect to apply the δ18O-HONO approach to a variety of atmospheric settings for constraining the HONO budget and its cycling with other reactive nitrogen species, as well as O3. As such, online isotopic measurement techniques with higher time resolution will benefit the use of stable isotopes and broaden its application in atmospheric chemistry. In the meantime, in order to more accurately quantify the relative contribution of these potential pathways, further experimental and theoretical investigations on isotopic fractionation characteristics of each pathway under various environmental conditions are required.
A common approach to quantitatively understand the wildfire-derived HONO budget – its direct emissions, secondary productions and sinks – is to use concentration-based mass balance calculation. Ideally, if we know the rate coefficients and reactant concentrations for each of the pathways, we would be able to quantify the relative contribution of each pathway to the total HONO concentration measured in the field under the assumption of pseudo-steady-state approximation (PSSA) as described in Eq. (A1), where Remission, Rproduction and Rloss are rate of emission, production and loss, respectively. In aged smoke, we expect HONO is almost exclusively produced from secondary formation. During the day, HONO is predominantly lost to photolysis with a coefficient depending on solar zenith angle differing with time of the day, while one or more reactions of Reactions (R2)–(R4) may be responsible for producing HONO. Under PSSA, using the well quantified rate coefficient k2, observed NO and HONO concentrations, estimated OH concentration, and TUV-model-calculated (tropospheric ultraviolet and visible) HONO photolysis coefficient jHONO, we estimated the ratio of Reaction (R2) to the total HONO production (POH+NO) via Eq. (A2) and found Reaction (R2) can only contribute 2 %–15 % (Table A1) of the total HONO production under the ambient conditions when the five aged daytime samples were collected. This suggests at least 85 % of HONO was produced from heterogeneous HONO formation via Reaction (R3) and/or Reaction (R4).
HONO production from photo-enhanced NO2 conversion has been proposed to take place on various types of surfaces. However, the uptake coefficient (), which indicates the probability of NO2 collisions with a surface that results in the formation of a HONO molecule, varies by at least 3 orders of magnitude depending on the specific type of surface materials. For instance, on soot particles was found to range from to s−1 (Ammann et al., 1998), while that on surfaces comprised of humic acid was measured as 2– s−1 in several lab studies (Stemmler et al., 2006; Scharko et al., 2017). The latter is consistent with daytime modeling results of s−1 (Wong et al., 2013). Additionally, a much smaller (10−7–10−6 s−1) value was obtained for metal oxide surfaces such as TiO2 and SiO2 (Ndour et al., 2008).
Daytime photolysis of nitrate (HNO3 and pNO) via Reaction (R4) has also been proposed as an important renoxification pathway that produces HONO and NO2 in low NOx remote environments (Zhou et al., 2011), as well as high NOx urban settings with abundant urban grime (Baergen and Donaldson, 2016, 2013). The p-NO and surface-adsorbed HNO3 were found to be photolyzed with rate coefficients 2–3 orders of magnitude larger than gas-phase HNO3 and possess lifetimes as short as a few hours (Ye et al., 2017). However, the rate coefficient of Reaction (R4) is poorly constrained. Not only have the branching ratios between the NOx-producing channel and HONO-forming channel been poorly known (Baergen and Donaldson, 2016), but previous laboratory-measured nitrate photolysis rate coefficients also vary by up to 3 orders of magnitude (Ye et al., 2017). The uncertainty is even greater because it is complicated by dependence on relative humidity, particle composition and pH.
During the night, HONO is primarily lost to uptake on surfaces including aerosols and soils, and the uptake coefficient can be expressed by Eq. (A3).
In this equation, is the mean thermal HONO molecular velocity calculated by , where R, T and M are the gas constant, absolute temperature and molecular weight. is the surface-to-volume ratio (cm2 cm−3). The uptake coefficient γHONO was measured to be 10−5 for soil surface and in the range of 10−5–10−3 for aerosol particle surface (Donaldson et al., 2014b; Wong et al., 2012). In addition, OH + HONO occurs at rates 1–2 orders of magnitude smaller than the uptake and therefore plays a minor role. The combined loss processes lead to a HONO lifetime of about 4 h during the night.
HONO is generally assumed to be produced via heterogeneous NO2 hydrolysis disproportionation (Reaction R6) (Finlayson-Pitts et al., 2003), and the production rate of HONO is estimated by Eq. (A4), expressed in the unit of ppbv-HONO ppbv−1-NO2 s−1.
where is the mean NO2 molecular velocity, and is the surface-to-volume ratio of particles, which could range from to cm2 cm−3 for normally polluted areas and highly polluted areas, respectively (Spataro and Ianniello, 2014). The in biomass burning smoke plumes has huge uncertainty; additionally, ground surface is also expected to play an important role in nighttime HONO production given our ground sampling location (Tuite et al., 2021; Scharko et al., 2017; Kebede et al., 2016; Stemmler et al., 2006); however, its is not well defined/quantified.
Overall, considerable uncertainty remains regarding the rate coefficient of the heterogeneous processes in the daytime, as well as the HONO and NO2 uptake coefficients and ratio. This uncertainty, complicated further with large variability in fire behavior and emissions, make the HONO budget quantification extremely challenging.

B1 Nighttime processes
B1.1 Isotopic fractionation of N and O associated with nighttime uptake
Surface uptake is the major sink for HONO during the night. Surface uptake of HONO has been found to be kinetically limited by bulk diffusion in particles containing viscous organic-water matrices, and it incorporates two simultaneous processes: (1) reactive uptake of HONO on the bare particle/mineral surface and (2) accommodation and reaction of HONO in the bulk aqueous layer that is affected by pH and diffusion in the organic-water matrix (Donaldson et al., 2014b). The uptake coefficient of HONO is determined by the competition between these two processes as a function of fraction of water coverage on the surfaces, , ranging from 0 to 1 in Eq. (B1), where γ0 and γ1 are the reactive uptake coefficients of HONO onto particle (mineral/soil) surfaces at dry () and wet () conditions, respectively. Under completely dry conditions ( 0 or relative humidity (RH) = 0 %), the former process is dominant, and the isotopic fractionation can be estimated by the ratio of the square root of inverse mass, which is caused by different thermal velocities (ωHONO) of two isotopologues following Eq. (B2), where R is the gas constant, T is absolute temperature, and M is the molecular weight. Thus, heavier isotopes are depleted in HONO, resulting in −10 ‰ and −20 ‰ for 15ε and 18ε, respectively. By contrast, under wet conditions when RH is 30 % which results in a monolayer water coverage on particle surfaces (), the aqueous layer uptake becomes dominant, and the wet uptake coefficient γ1 can be mechanistically simulated with a resistor model simplified as Eq. (B3) (Hanson, 1997; Pöschl et al., 2007). In Eq. (B3), α is the accommodation coefficient describing the probability that a HONO molecule striking a water-coated particle enters into the bulk liquid phase, and Γb is the solubility of HONO in the bulk water in the particles or soils. Γb can be calculated with Eq. (B4), where Da is the apparent diffusion coefficient of HONO in the particle–water (soil (organics)–water) matrix, and τ is the exposure time. Heff is the effective Henry's law constant that depends on the absolute Henry's law constant for HONO, pH, and acid dissociation constants for HONO (Ka1) and H2NO (Ka2).
Taking the previously measured HONO γ1 of as that for the light isotopologue and α of as a constant (Donaldson et al., 2014b), Γb (H16O14N16O) is calculated to be following Eq. (B3). As derived from Eqs. (B2) and (B4), Γb ratio between two isotopologues equals the ratio between the two molecular weights, and therefore Γb(H16O15N16O) and Γb(H16O15N16O) were calculated and used to derive the corresponding γ1 values. The fractionation factor associated with HONO uptake (αu-HONO), defined as the ratio between heavy and light rate coefficients (), was calculated following the relationship determined by Eq. (B5). On the basis of this model, we estimate that the isotopic fractionation associated with the wet uptake process is −2 ‰ and −4 ‰ for 15ε and 18ε, respectively. From our calculation, RH clearly influences isotopic fractionation in the range of 0 %–30 %, with the wet uptake of HONO favoring a smaller kinetic isotope effect than dry uptake.
Table B1Vibrational frequencies of HONO and its isotopologues.
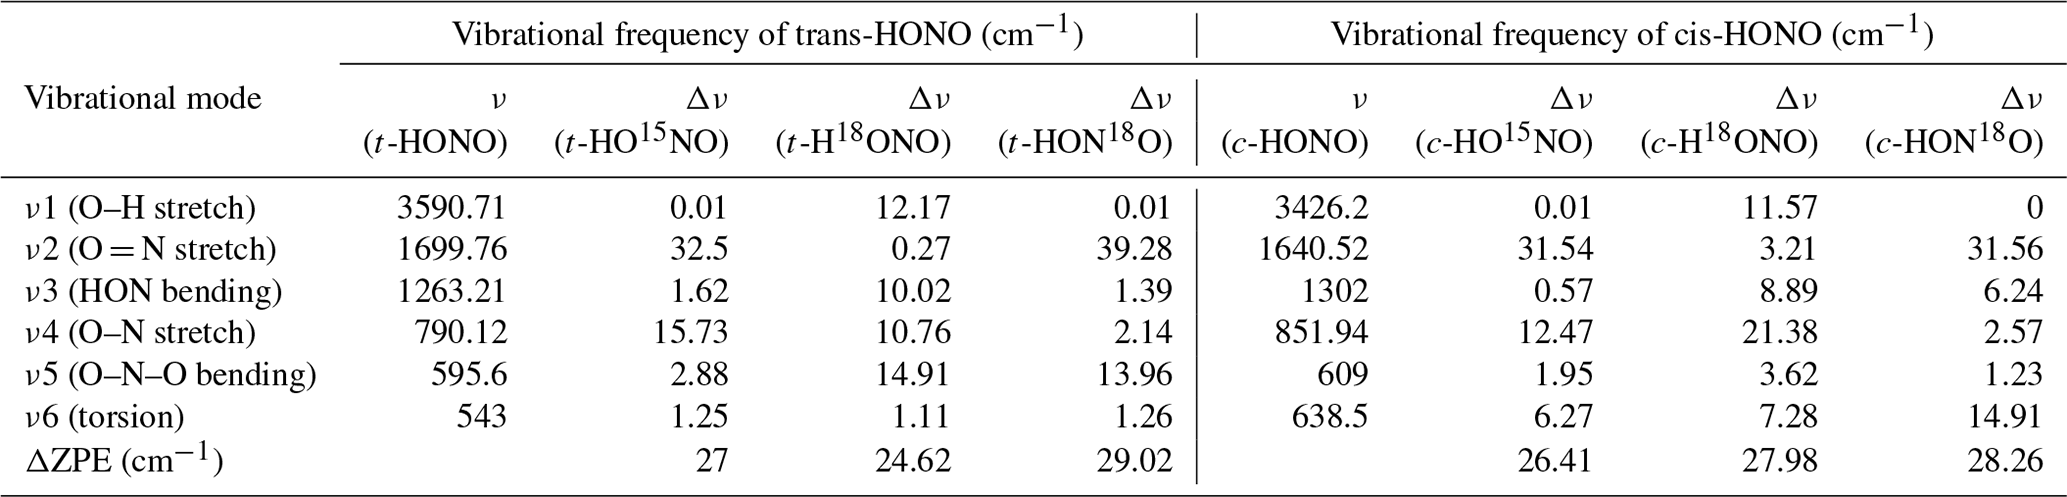
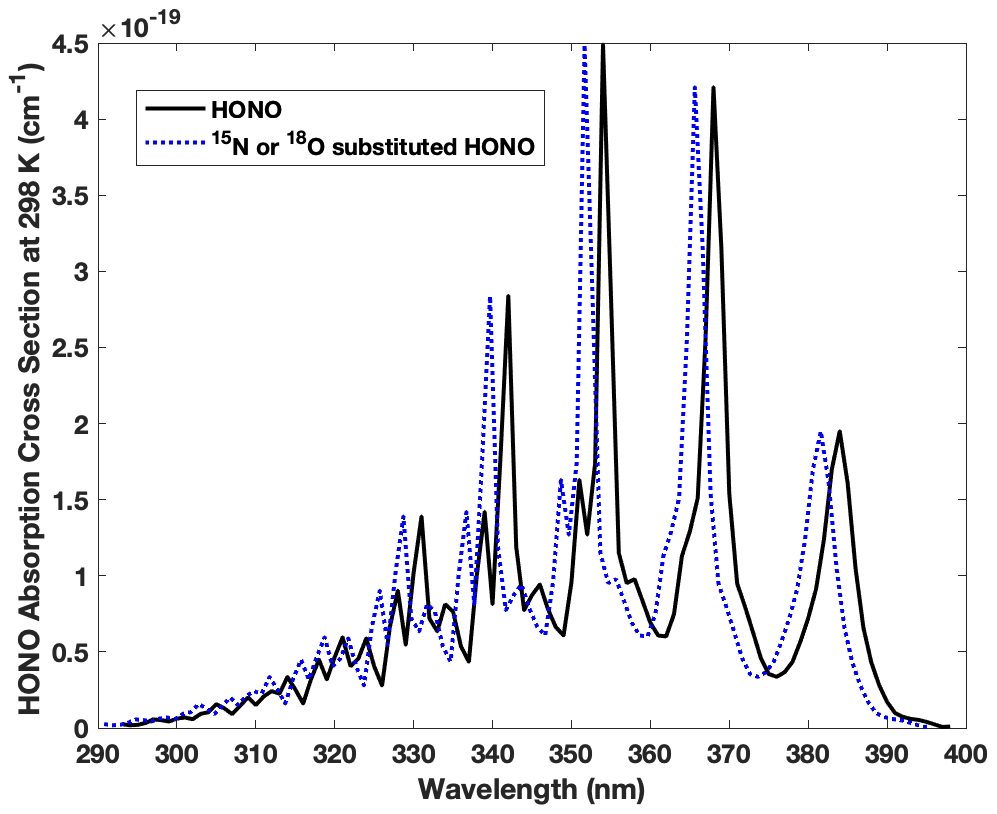
Figure B1Absorption wavelengths shift for HO15NO, H18ONO and HON18O compared with the most abundant form of HONO (H16O14N16O). The spectra of HO15NO, trans-H18ONO and trans-HON18O are blue shifted 0.23–0.43, 0.21–0.39 and 0.25–0.46 nm, respectively, spanning 293–398 nm. Note that the blue shift illustrated here is 2 nm (larger than the actual shift) in order to demonstrate the shift clearly.
B1.2 Isotopic fractionation of N and O associated with each nighttime HONO production pathway
Heterogeneous conversion of NO2 to HONO has been widely accepted as the major secondary HONO production source during the night. However, the mechanism via which the conversion occurs remains disputed. Additionally, the kinetic isotopic fractionation factor (KIF) associated with this process has never been measured or calculated. NO2 hydrolysis (Reaction R6) on a variety of surfaces was determined to be a major source of HONO production. A compelling mechanism proposed by Finlayson-Pitts (Finlayson-Pitts et al., 2003) suggests Reaction (R6) consists of a series of key steps including (1) dimer N2O4 formation from the recombination of two NO2 molecules in the gas phase and uptake of gaseous N2O4 by thin water film on the top surface layer, (2) aqueous-phase isomerization of symmetric N2O4 to asymmetric ONONO2 which is subsequently autoionizing to NO+NO and reacting with H2O to form HONO and HNO3, and (3) desorption of HONO from aqueous to gas phase. Recently it was shown that reduction of NO2 on iron-bearing minerals and quinone-rich humic acid in soils and particulate matter (Reaction R7) leads to faster HONO production than NO2 hydrolysis. Although differing in reaction mechanism, the two possible pathways (Reactions R6 and R7) proceed in three steps including uptake of NO2 into the surface aqueous layer, reactions in aqueous phase and desorption of HONO from aqueous to gas phase. The first two steps are limited by aqueous diffusion, and it is reasonable to assume diffusion-limited processes in the aqueous phase create no KIF. As HONO desorption may involve hydrogen bond breaking of complex HONO–(H2O)n, this process likely determines the KIF associated with the heterogeneous NO2-to-HONO conversion (αd), as calculated by Eq. (B6), where μl and μh are the reduced mass for the light and heavy isotope containing pair, respectively (Shi et al., 2019). As a result, 15ε and 18ε are estimated to be −2.9 ‰ (n=1) to −4.5 ‰ (n=2) and −5.7 ‰ (n=1) to −8.9 ‰ (n=2), respectively. For the isotope mass balance modeling, mean values of 15ε (3.7 ‰) and 18ε (7.4 ‰) were generally used for steady-state Reactions (R3), (R6) and (R7) under steady-state conditions, and the low (n=2) and high (n=1) values were used to evaluate the lower and upper bound.
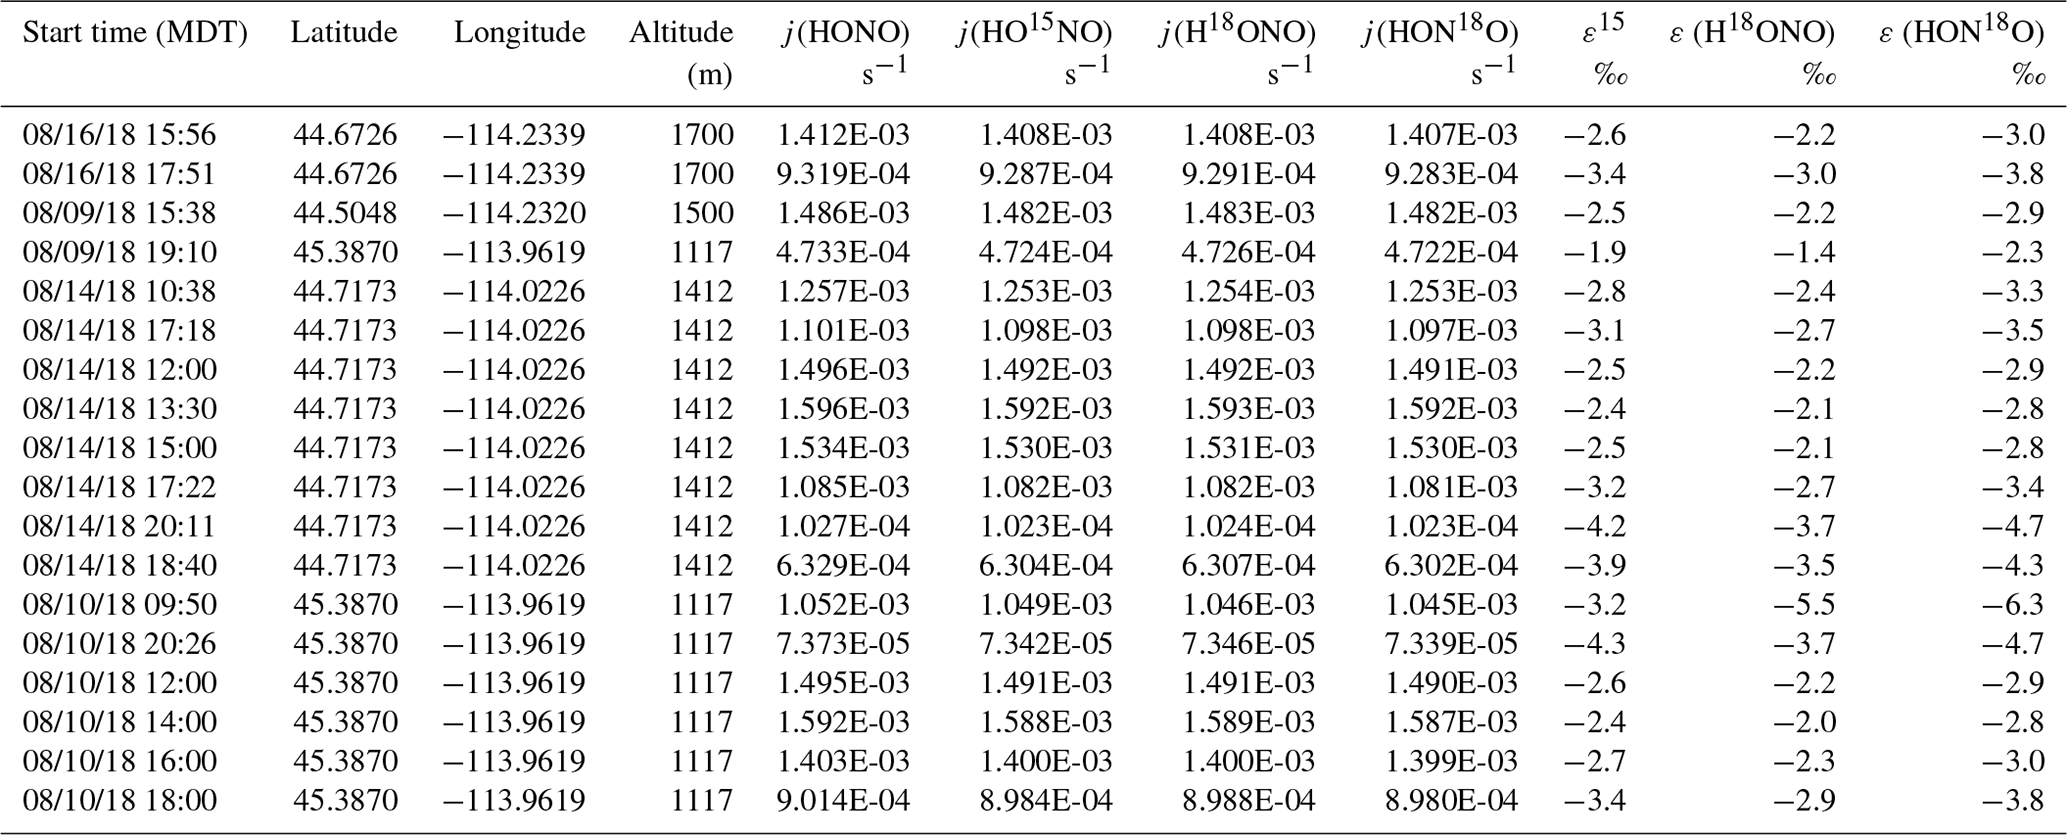
Table B2Parameters used for TUV solar actinic flux modeling. The modeled enrichment coefficients for HONO photolysis for HO15NO, H18ONO and HON18O are presented in a data repository (https://doi.org/10.26300/k056-fs32).
B2 Daytime
B2.1 HONO photolysis
The isotopic effect associated with photolysis (PIE) of HONO is calculated for the first time following the ΔZPE approach proposed by Yung and Miller (1997) to determine the PIE of N2O photolysis. In principle, the absorption spectrum for the same kind of electronic transition is expected to be similar in shape and intensity upon isotopic substitution, based on the assumption that the electronic potential energy surface is constant for each isotopologue. This assures the continuum levels (leading to photolysis) of the excited state are not significantly changed, while the vibrational levels of the ground state vary with isotopic substitutions due to mass difference. The latter results in a lower ground state zero point energy (ZPE) for a heavy isotopologue than a light one and causes blue shift in the absorption spectrum of the heavy isotopologue relative to the light one (Miller and Yung, 2000). When exposed to sunlight in the troposphere (>290 nm), HONO is known to feature a set of progressive absorption bands between 310 and 370 nm arising from electronic excitation (), which results in HONO photolysis to OH and NO with nearly unity quantum yield (Cox et al., 1980; Suter and Huber, 1989). Under the aforementioned assumptions, we calculate the spectra blue shift of all three heavy isotopologues (HO15NO, H18ONO or HON18O) relative to that of HONO using the ΔZPE approach as shown in Fig. B1 and Tables B1 and B2.
We calculated ΔZPE from , where Δνi is the ground state vibrational frequency difference between the normal isotopologue (HONO) and the heavier isotopologue (HO15NO, H18ONO or HON18O) for each vibrational mode calculated via forced field by Monse et al. (1969). Note only HO15NO UV absorption was measured in a previous study that reported an average blue shift of ∼ 20 cm−1 (8–40 cm−1) relative to HONO, and this is consistent with our calculation (Table B1). Note trans-HONO cis-HONO abundance ratio is 2.5 at room temperature (Suter and Huber, 1989), and the difference of ΔZPE for trans-HONO and cis-HONO is less than 0.5 % for 15N and 2 % for 18O (Table B1). The effect of the difference on j calculation is negligible. With the measured absorption cross-section of HONO between 293 and 400 nm and the quantified blue shift of all three isotopologues, we calculate each photolysis rate coefficient following Eq. (B7), which is the integral of photolysis quantum yield Φa(λ) (≈1), absorption cross-section σa(λ) and solar actinic flux I(λ) as a function of wavelength. I(λ) is computed with the radiation transfer model TUV (http://www.acd.ucar.edu/TUV, Madronich and Flocke, 1998) at various locations and times during our sampling period. With these j values listed in Table B2 (j, , , ), the fractionation constant (15ε and 18ε, ‰) associated with HONO photolysis is calculated following Eq. (B8), where j′ and j are photolysis rate coefficients of heavy and light isotopologues, respectively. Note we take the average of and as assuming the 18O is equally distributed between the two O sites of HONO. Results show that 15ε and 18ε range from −1.9 ‰ to −4.3 ‰ (mean = −3.0 ‰, 1σ= 0.7 ‰, n=18 ‰) and −1.9 ‰ to −5.9 ‰ (mean = −3.1 ‰, 1σ= 1.0 ‰, n=18 ‰), respectively, when the HONO photolysis rate decreases from to s−1.
The negative values of 15ε and 18ε suggest both 15N and 18O will be enriched in the remaining HONO upon photolysis. Applying a Rayleigh fractionation model described by equation Eq. (B9), we obtain δ15N and δ18O of HONO (δf) as a function of the fraction of HONO left after photolysis (f). The initial isotopic composition of HONO (δ0) is taken from nighttime young smoke mean values in Table 1, as they are the best estimate of the fresh emission from the fires we investigated.
B2.2 Isotopic fractionation of N and O associated with each daytime HONO production pathway
OH + NO (Reaction R2) is a radical–radical recombination reaction, which is characteristic of the stabilization of activated complex HONO* via collisional energy transfer. This reaction type is characteristic of large KIF that enriches heavier isotopologues in the product at the low-pressure limit but almost no KIF at the high-pressure limit. The closer a reaction system is to the high-pressure limit, the less fractionation occurs (Chai and Dibble, 2014). Under the atmospheric pressure, the rate coefficient k1 is in the fall-off region but close to the high-pressure limiting rate coefficient (Forster et al., 1995). Therefore, we expect a moderate positive 15ε (∼ 10 ‰) and 18ε (∼ 15 ‰) (Chai and Dibble, 2014; Burkholder et al., 2019). Kinetic isotopic fractionation (KIF) associated with photo-enhanced NO2 conversion is not known. Similar to the nighttime heterogeneous NO2 conversion, Reaction (R3) is also expected to occur in the surface aqueous phase, and the overall KIF is largely determined by that associated with the desorption of HONO from aqueous to gas phase. Thus, 15ε3 and 18ε3 are the same as that of Reactions (R6) and (R7) (Appendix B1.2).
KIF associated with HNO3 and p-NO photolysis (Reaction R4) in the atmosphere has never been measured experimentally, and the lack of p-NO absorption spectroscopy hinders calculation. The 15N enrichment factor (15ε) for photolysis of snow-surface-adsorbed HNO3 under natural sunlight was theoretically determined to be ‰ following the ΔZPE approach Yung and Miller (1997), which explained well the laboratory-measured 15ε for snow surface nitrate photolysis under the radiation of simulated sunlight (Berhanu et al., 2014; Frey et al., 2009). If we take this 15ε value and the measured δ15N of nitrate (8 ‰ to 20 ‰), the HONO produced from surface nitrate photolysis will be very negative (−38.9 ‰ to −27.5 ‰) within 2 h of photolysis. The 18O enrichment factor (18ε) for photolysis of snow-surface-adsorbed HNO3 has been measured to range from 6.0 ‰ to 12.5 ‰ (Frey et al., 2009; Berhanu et al., 2015).
B3 The δ18O transferring coefficient by different pathways
For 18O, in addition to KIF (enrichment factor, in ‰), δ18O transferring from different reactants greatly influence δ18O-HONO (δ18Oi,t), especially when the two O atoms of HONO are derived from different reactants. That is, HONO formed from different pathways (Reactions R2, R3, R6, R7) consists of δ18O of each O-containing reacting partner in a proportion determined by stoichiometry of reaction i, expressed with Eqs. (10)–(12). In Reaction (R2), OH and NO equally contribute their O atom to HONO expressed with Eq. (10). In Reactions (R3) and (R7), NO2 is the exclusive O source of HONO, while H3O+ only contributes a H+ to HONO (Ammann et al., 1998; George et al., 2005; Stemmler et al., 2006; Scharko et al., 2017; Kebede et al., 2016). In Reaction (R6), the hydrolysis mechanism discussed in Appendix B suggests the H2O-derived OH− and NO2-derived NO+NO equally contribute their O atom to HONO (Finlayson-Pitts et al., 2003).
During the day, NO–NO2 equilibrium is maintained via NO2 photolysis and NO oxidation by O3 and/or RO2 following Reactions (R8) and (R9), and NO and NO2 are expected to possess similar δ18O, and this can be expressed as δ18O-NOx. During the night, due to increased sink of NOx and decreased O3 concentration, δ18O-NOx is expected to be lower than during daytime. NOx resulting from Reactions (R8) and (R9) should carry δ18O of RO2 and O3, respectively, via transfer; as RO2 and O3 have very different δ18O values ∼ +23 ‰ and +117 ‰, respectively, the competition between Reactions (R8) and (R9) critically affects δ18O-NOx, as described by equations Eqs. (11) and (12). OH radical in the troposphere has been calculated to be −35 ‰ depleted in 18O relative to H2O as a result of isotopic exchange at 298 K (Walters and Michalski, 2016); by taking the 18O values for summertime precipitation water in the western US (−10 ‰ to −5 ‰) (Welker, 2000) and the H2O liquid-to-vapor enrichment factor εg−l of +9 ‰ at 298 K derived from the literature with Eq. (B13) (Michalski et al., 2012), δ18O-OH is estimated in the range of −35 ‰ to −30 ‰ if we ignore the unknown KIF derived from OH oxidation reaction with the vast majority of atmospheric species. The overall δ18O-HONO is modeled using the isotope mass balance model.
All data are available in the manuscript, the Supplement or data repository (https://doi.org/10.26300/k056-fs32) (Chai, 2020).
The supplement related to this article is available online at: https://doi.org/10.5194/acp-21-13077-2021-supplement.
JED and MH conceived the research. JC, JED and MGH designed the research. JC carried out field sampling, laboratory sample analyses, data analyses and figure production, as well as conceived and carried out the isotopic box modeling work. BEA, CEJ, WWW, DEB, EEJ, JHK, HM and EH contributed to field sampling. CB helped with laboratory sample analyses. JC wrote the paper. All authors contributed to the scientific discussions and preparation of the manuscript.
The authors declare that they have no conflict of interest.
Any mention of brand names or manufacturers is for information purposes only
and does not constitute an endorsement.
Publisher’s note: Copernicus Publications remains neutral with regard to jurisdictional claims in published maps and institutional affiliations.
We thank the entire FIREX-AQ team and WE-CAN team, especially Robert Yokelson and the Aerodyne Research Mobile Lab team. We also thank the United States Forest Service for the field support. We are grateful to Ruby Ho for laboratory support. We are particularly thankful that Thomas Ryerson and Jeff Peischl generously let us use the NOAA mobile lab and for their support during the WE-CAN field season. We acknowledge James Roberts and two other anonymous reviewers for their helpful comments.
This research has been supported by the National Science Foundation (grant no. 1351932) and the National Oceanic and Atmospheric Administration (grant no. NA16OAR4310098).
This paper was edited by Christopher Cantrell and reviewed by James Roberts and two anonymous referees.
Akagi, S. K., Yokelson, R. J., Wiedinmyer, C., Alvarado, M. J., Reid, J. S., Karl, T., Crounse, J. D., and Wennberg, P. O.: Emission factors for open and domestic biomass burning for use in atmospheric models, Atmos. Chem. Phys., 11, 4039–4072, https://doi.org/10.5194/acp-11-4039-2011, 2011.
Akagi, S. K., Craven, J. S., Taylor, J. W., McMeeking, G. R., Yokelson, R. J., Burling, I. R., Urbanski, S. P., Wold, C. E., Seinfeld, J. H., Coe, H., Alvarado, M. J., and Weise, D. R.: Evolution of trace gases and particles emitted by a chaparral fire in California, Atmos. Chem. Phys., 12, 1397–1421, https://doi.org/10.5194/acp-12-1397-2012, 2012.
Alvarado, M. J. and Prinn, R. G.: Formation of ozone and growth of aerosols in young smoke plumes from biomass burning: 1. Lagrangian parcel studies, J. Geophys. Res.-Atmos., 114, D09306, https://doi.org/10.1029/2008JD011144, 2009.
Alvarado, M. J., Logan, J. A., Mao, J., Apel, E., Riemer, D., Blake, D., Cohen, R. C., Min, K.-E., Perring, A. E., Browne, E. C., Wooldridge, P. J., Diskin, G. S., Sachse, G. W., Fuelberg, H., Sessions, W. R., Harrigan, D. L., Huey, G., Liao, J., Case-Hanks, A., Jimenez, J. L., Cubison, M. J., Vay, S. A., Weinheimer, A. J., Knapp, D. J., Montzka, D. D., Flocke, F. M., Pollack, I. B., Wennberg, P. O., Kurten, A., Crounse, J., Clair, J. M. S., Wisthaler, A., Mikoviny, T., Yantosca, R. M., Carouge, C. C., and Le Sager, P.: Nitrogen oxides and PAN in plumes from boreal fires during ARCTAS-B and their impact on ozone: an integrated analysis of aircraft and satellite observations, Atmos. Chem. Phys., 10, 9739–9760, https://doi.org/10.5194/acp-10-9739-2010, 2010.
Alvarado, M. J., Lonsdale, C. R., Yokelson, R. J., Akagi, S. K., Coe, H., Craven, J. S., Fischer, E. V., McMeeking, G. R., Seinfeld, J. H., Soni, T., Taylor, J. W., Weise, D. R., and Wold, C. E.: Investigating the links between ozone and organic aerosol chemistry in a biomass burning plume from a prescribed fire in California chaparral, Atmos. Chem. Phys., 15, 6667–6688, https://doi.org/10.5194/acp-15-6667-2015, 2015.
Ammann, M., Kalberer, M., Jost, D. T., Tobler, L., Rössler, E., Piguet, D., Gäggeler, H. W., and Baltensperger, U.: Heterogeneous production of nitrous acid on soot in polluted air masses, Nature, 395, 157–160, https://doi.org/10.1038/25965, 1998.
Baergen, A. M. and Donaldson, D. J.: Photochemical Renoxification of Nitric Acid on Real Urban Grime, Environ. Sci. Technol., 47, 815–820, https://doi.org/10.1021/es3037862, 2013.
Baergen, A. M. and Donaldson, D. J.: Formation of reactive nitrogen oxides from urban grime photochemistry, Atmos. Chem. Phys., 16, 6355–6363, https://doi.org/10.5194/acp-16-6355-2016, 2016.
Baylon, P., Jaffe, D. A., Hall, S. R., Ullmann, K., Alvarado, M. J., and Lefer, B. L.: Impact of Biomass Burning Plumes on Photolysis Rates and Ozone Formation at the Mount Bachelor Observatory, J. Geophys. Res.-Atmos., 123, 2272–2284, https://doi.org/10.1002/2017JD027341, 2018.
Berhanu, T. A., Meusinger, C., Erbland, J., Jost, R., Bhattacharya, S. K., Johnson, M. S., and Savarino, J.: Laboratory study of nitrate photolysis in Antarctic snow, II. Isotopic effects and wavelength dependence, J. Chem. Phys., 140, 244306, https://doi.org/10.1063/1.4882899, 2014.
Berhanu, T. A., Savarino, J., Erbland, J., Vicars, W. C., Preunkert, S., Martins, J. F., and Johnson, M. S.: Isotopic effects of nitrate photochemistry in snow: a field study at Dome C, Antarctica, Atmos. Chem. Phys., 15, 11243–11256, https://doi.org/10.5194/acp-15-11243-2015, 2015.
Böhlke, J. K., Mroczkowski, S. J., and Coplen, T. B.: Oxygen isotopes in nitrate: new reference materials for 18O:17O:16O measurements and observations on nitrate-water equilibration, Rapid Commun. Mass Spectrom., 17, 1835–1846, https://doi.org/10.1002/rcm.1123, 2003.
Burkholder, J. B., Sander, S. P., Abbatt, J., Barker, J. R., Cappa, C., Crounse, J. D., Dibble, T. S., Huie, R. E., Kolb, C. E., Kurylo, M. J., Orkin, V. L., Percival, C. J., Wilmouth, D. M. and Wine P. H.: Chemical Kinetics and Photochemical Data for Use in Atmospheric Studies, Evaluation No. 19, JPL Publication 19-5, Jet Propulsion Laboratory, Pasadena, 2019.
Casciotti, K. L., Sigman, D. M., Hastings, M. G., Böhlke, J. K., and Hilkert, A.: Measurement of the Oxygen Isotopic Composition of Nitrate in Seawater and Freshwater Using the Denitrifier Method, Anal. Chem., 74, 4905–4912, https://doi.org/10.1021/ac020113w, 2002.
Chai, J.: Isotopic evidence for dominant secondary production of HONO in near-ground wildfire plumes, Brown University Open Data Collection, Brown Digital Repository [data set], Brown University Library, https://doi.org/10.26300/k056-fs32 (last access: 15 January 2021), 2020.
Chai, J. and Dibble, T. S.: Pressure Dependence and Kinetic Isotope Effects in the Absolute Rate Constant for Methoxy Radical Reacting with NO2, Int. J. Chem. Kinet., 46, 501–511, https://doi.org/10.1002/kin.20865, 2014.
Chai, J. and Hastings, M.: Collection Method for Isotopic Analysis of Gaseous Nitrous Acid, Anal. Chem., 90, 830–838, https://doi.org/10.1021/acs.analchem.7b03561, 2018.
Chai, J., Miller, D. J., Scheuer, E., Dibb, J., Selimovic, V., Yokelson, R., Zarzana, K. J., Brown, S. S., Koss, A. R., Warneke, C., and Hastings, M.: Isotopic characterization of nitrogen oxides (NOx), nitrous acid (HONO), and nitrate (pNO) from laboratory biomass burning during FIREX, Atmos. Meas. Tech.,12, 6303–6317, https://doi.org/10.5194/amt-12-6303-2019, 2019.
Cox, R. A., Derwent, R. G., Kearsey, S. V., Batt, L., and Patrick, K. G.: Photolysis of methyl nitrite: kinetics of the reaction of the methoxy radical with O2, J. Photochem., 13, 149–163, https://doi.org/10.1016/0047-2670(80)85006-4, 1980.
de Gouw, J. A., Warneke, C., Stohl, A., Wollny, A. G., Brock, C. A., Cooper, O. R., Holloway, J. S., Trainer, M., Fehsenfeld, F. C., Atlas, E. L., Donnelly, S. G., Stroud, V., and Lueb, A.: Volatile organic compounds composition of merged and aged forest fire plumes from Alaska and western Canada, J. Geophys. Res.-Atmos., 111, D10303, https://doi.org/10.1029/2005JD006175, 2006.
Donaldson, M. A., Bish, D. L., and Raff, J. D.: Soil surface acidity plays a determining role in the atmospheric-terrestrial exchange of nitrous acid, P. Natl. Acad. Sci. USA, 111, 18472–18477, https://doi.org/10.1073/pnas.1418545112, 2014a.
Donaldson, M. A., Berke, A. E., and Raff, J. D.: Uptake of Gas Phase Nitrous Acid onto Boundary Layer Soil Surfaces, Environ. Sci. Technol., 48, 375–383, https://doi.org/10.1021/es404156a, 2014b.
Fibiger, D. L. and Hastings, M. G.: First Measurements of the Nitrogen Isotopic Composition of NOx from Biomass Burning, Environ. Sci. Technol., 50, 11569–11574, https://doi.org/10.1021/acs.est.6b03510, 2016.
Fibiger, D. L., Hastings, M. G., Lew, A. F., and Peltier, R. E.: Collection of NO and NO2 for Isotopic Analysis of NOx Emissions, Anal. Chem., 86, 12115–12121, https://doi.org/10.1021/ac502968e, 2014.
Finlayson-Pitts, B. J., Wingen, L. M., Sumner, A. L., Syomin, D., and Ramazan, K. A.: The heterogeneous hydrolysis of NO2 in laboratory systems and in outdoor and indoor atmospheres: An integrated mechanism, Phys. Chem. Chem. Phys., 5, 223–242, https://doi.org/10.1039/B208564J, 2003.
Fischer, E. V., Jaffe, D. A., Reidmiller, D. R., and Jaeglé, L.: Meteorological controls on observed peroxyacetyl nitrate at Mount Bachelor during the spring of 2008, J. Geophys. Res.-Atmos., 115, https://doi.org/10.1029/2009JD012776, 2010.
Forster, R., Frost, M., Fulle, D., Hamann, H. F., Hippler, H., Schlepegrell, A., and Troe, J.: High pressure range of the addition of HO to HO, NO, NO2, and CO, I. Saturated laser induced fluorescence measurements at 298 K, J. Chem. Phys., 103, 2949–2958, https://doi.org/10.1063/1.470482, 1995.
Frey, M. M., Savarino, J., Morin, S., Erbland, J., and Martins, J. M. F.: Photolysis imprint in the nitrate stable isotope signal in snow and atmosphere of East Antarctica and implications for reactive nitrogen cycling, Atmos. Chem. Phys., 9, 8681–8696, https://doi.org/10.5194/acp-9-8681-2009, 2009.
George, C., Strekowski, R. S., Kleffmann, J., Stemmler, K., and Ammann, M.: Photoenhanced uptake of gaseous NO2 on solid organic compounds: a photochemical source of HONO?, Faraday Discuss., 130, 195–210, https://doi.org/10.1039/b417888m, 2005.
Hanson, D. R.: Surface-Specific Reactions on Liquids, J. Phys. Chem. B, 101, 4998–5001, https://doi.org/10.1021/jp970461f, 1997.
Hastings, M. G., Jarvis, J. C., and Steig, E. J.: Anthropogenic Impacts on Nitrogen Isotopes of Ice-Core Nitrate, Science, 324, 1288–1288, https://doi.org/10.1126/science.1170510, 2009.
Jaffe, D. and Briggs, N.: Ozone production from wildfires: A critical review, Atmos. Environ., 51, 1–10, https://doi.org/10.1016/j.atmosenv.2011.11.063, 2012.
Jaffe, D. A., Wigder, N., Downey, N., Pfister, G., Boynard, A., and Reid, S. B.: Impact of Wildfires on Ozone Exceptional Events in the Western U.S., Environ. Sci. Technol., 47, 11065–11072, https://doi.org/10.1021/es402164f, 2013.
Kaspari, J. H., Chai, J., Anderson, B. E., Jordan, C. E., Scheuer, E., Hastings, M. G., Dibb, J. E.: Influence of Solar Irradiation on Nitrous Acid Production in Western U.S. Wildfire Smoke, Earth Space Sci. Open Arch., https:/doi.org/10.1002/essoar.10506007.1, last access: 15 February 2021.
Kebede, M. A., Bish, D. L., Losovyj, Y., Engelhard, M. H., and Raff, J. D.: The Role of Iron-Bearing Minerals in NO2 to HONO Conversion on Soil Surfaces, Environ. Sci. Technol., 50, 8649–8660, https://doi.org/10.1021/acs.est.6b01915, 2016.
Kleinman, L. I., Daum, P. H., Lee, Y.-N., Senum, G. I., Springston, S. R., Wang, J., Berkowitz, C., Hubbe, J., Zaveri, R. A., Brechtel, F. J., Jayne, J., Onasch, T. B., and Worsnop, D.: Aircraft observations of aerosol composition and ageing in New England and Mid-Atlantic States during the summer 2002 New England Air Quality Study field campaign, J. Geophys. Res.-Atmos., 112, D09310, https://doi.org/10.1029/2006JD007786, 2007.
Liu, X., Zhang, Y., Huey, L. G., Yokelson, R. J., Wang, Y., Jimenez, J. L., Campuzano-Jost, P., Beyersdorf, A. J., Blake, D. R., Choi, Y., Clair, J. M. S., Crounse, J. D., Day, D. A., Diskin, G. S., Fried, A., Hall, S. R., Hanisco, T. F., King, L. E., Meinardi, S., Mikoviny, T., Palm, B. B., Peischl, J., Perring, A. E., Pollack, I. B., Ryerson, T. B., Sachse, G., Schwarz, J. P., Simpson, I. J., Tanner, D. J., Thornhill, K. L., Ullmann, K., Weber, R. J., Wennberg, P. O., Wisthaler, A., Wolfe, G. M., and Ziemba, L. D.: Agricultural fires in the southeastern U.S. during SEAC4RS: Emissions of trace gases and particles and evolution of ozone, reactive nitrogen, and organic aerosol, J. Geophys. Res.-Atmos., 121, 7383–7414, https://doi.org/10.1002/2016JD025040, 2016.
Madronich, S., Flocke, F. M., Zeng, J., Petropavlovskikh, I., and Lee-Taylor, J.: Tropospheric Ultraviolet and Visible (TUV) Radiation Model, available at: https://www.acom.ucar.edu/Models/TUV/Interactive_TUV/ (last access: 17 March 2020), 2002.
Mark, C. A.: Salmon-Challis National Forest: Salmon-Challis national forest assessment report, available at: https://www.fs.usda.gov/detail/scnf/landmanagement/planning/?cid=fseprd544724 (last access: 12 December 2020), 2018.
Martins-Costa, M. T. C., Anglada, J. M., Francisco, J. S., and Ruiz-López, M. F.: The Aqueous Surface as an Efficient Transient Stop for the Reactivity of Gaseous NO2 in Liquid Water, J. Am. Chem. Soc., 142, 20937–20941, https://doi.org/10.1021/jacs.0c10364, 2020.
McClure, C. D. and Jaffe, D. A.: US particulate matter air quality improves except in wildfire-prone areas, P. Natl. Acad. Sci. USA, 115, 7901–7906, https://doi.org/10.1073/pnas.1804353115, 2018.
Michalski, G., Scott, Z., Kabiling, M., and Thiemens, M. H.: First measurements and modeling of Δ17O in atmospheric nitrate, Geophys. Res. Lett., 30, 1870, https://doi.org/10.1029/2003GL017015, 2003.
Michalski, G., Bhattacharya, S. K., and Mase, D. F.: Oxygen Isotope Dynamics of Atmospheric Nitrate and Its Precursor Molecules, in: Handbook of Environmental Isotope Geochemistry, Springer, Berlin, Heidelberg, 30, 613–635, https://doi.org/10.1007/978-3-642-10637-8_30, 2012.
Miller, C. E. and Yung, Y. L.: Photo-induced isotopic fractionation, J. Geophys. Res.-Atmos., 105, 29039–29051, https://doi.org/10.1029/2000JD900388, 2000.
Miller, D. J., Wojtal, P. K., Clark, S. C., and Hastings, M. G.: Vehicle NOx emission plume isotopic signatures: Spatial variability across the eastern United States, J. Geophys. Res.-Atmos., 122, 4698–4717, https://doi.org/10.1002/2016JD025877, 2017.
Monse, E. U., Spindel, W., and Stern, M. J.: Analysis of Isotope-effect Calculations Illustrated with Exchange Equilibria Among Oxynitrogen Compounds, in: Isotope Effects in Chemical Processes, Am. Chem. Soc., 89, 148–184, https://doi.org/10.1021/ba-1969-0089.ch009, 1969.
Ndour, M., D'Anna, B., George, C., Ka, O., Balkanski, Y., Kleffmann, J., Stemmler, K., and Ammann, M.: Photoenhanced uptake of NO2 on mineral dust: Laboratory experiments and model simulations, Geophys. Res. Lett., 35, L05812, https://doi.org/10.1029/2007GL032006, 2008.
Nie, W., Ding, A. J., Xie, Y. N., Xu, Z., Mao, H., Kerminen, V.-M., Zheng, L. F., Qi, X. M., Huang, X., Yang, X.-Q., Sun, J. N., Herrmann, E., Petäjä, T., Kulmala, M., and Fu, C. B.: Influence of biomass burning plumes on HONO chemistry in eastern China, Atmos. Chem. Phys., 15, 1147–1159, https://doi.org/10.5194/acp-15-1147-2015, 2015.
Parrington, M., Palmer, P. I., Lewis, A. C., Lee, J. D., Rickard, A. R., Di Carlo, P., Taylor, J. W., Hopkins, J. R., Punjabi, S., Oram, D. E., Forster, G., Aruffo, E., Moller, S. J., Bauguitte, S. J.-B., Allan, J. D., Coe, H., and Leigh, R. J.: Ozone photochemistry in boreal biomass burning plumes, Atmos. Chem. Phys., 13, 7321–7341, https://doi.org/10.5194/acp-13-7321-2013, 2013.
Peng, Q., Palm, B. B., Melander, K. E., Lee, B. H., Hall, S. R., Ullmann, K., Campos, T., Weinheimer, A. J., Apel, E. C., Hornbrook, R. S., Hills, A. J., Montzka, D. D., Flocke, F., Hu, L., Permar, W., Wielgasz, C., Lindaas, J., Pollack, I. B., Fischer, E. V., Bertram, T. H., and Thornton, J. A.: HONO Emissions from Western U.S. Wildfires Provide Dominant Radical Source in Fresh Wildfire Smoke, Environ. Sci. Technol., 54, 5954–5963, https://doi.org/10.1021/acs.est.0c00126, 2020.
Platt, U., Perner, D., Harris, G. W., Winer, A. M., and Pitts, J. N.: Observations of nitrous acid in an urban atmosphere by differential optical absorption, Nature, 285, 312–314, https://doi.org/10.1038/285312a0, 1980.
Pöschl, U., Rudich, Y., and Ammann, M.: Kinetic model framework for aerosol and cloud surface chemistry and gas-particle interactions – Part 1: General equations, parameters, and terminology, Atmos. Chem. Phys., 7, 5989–6023, https://doi.org/10.5194/acp-7-5989-2007, 2007.
Scharko, N. K., Martin, E. T., Losovyj, Y., Peters, D. G., and Raff, J. D.: Evidence for Quinone Redox Chemistry Mediating Daytime and Nighttime NO2-to-HONO Conversion on Soil Surfaces, Environ. Sci. Technol., 51, 9633–9643, https://doi.org/10.1021/acs.est.7b01363, 2017.
Scheuer, E., Talbot, R. W., Dibb, J. E., Seid, G. K., DeBell, L., and Lefer, B.: Seasonal distributions of fine aerosol sulfate in the North American Arctic basin during TOPSE, J. Geophys. Res.-Atmos., 108, 8370, https://doi.org/10.1029/2001JD001364, 2003.
Selimovic, V., Yokelson, R. J., McMeeking, G. R., and Coefield, S.: In situ measurements of trace gases, PM, and aerosol optical properties during the 2017 NW US wildfire smoke event, Atmos. Chem. Phys., 19, 3905–3926, https://doi.org/10.5194/acp-19-3905-2019, 2019.
Selimovic, V., Yokelson, R. J., McMeeking, G. R., and Coefield, S.: Aerosol Mass and Optical Properties, Smoke Influence on O3, and High NO3 Production Rates in a Western U.S. City Impacted by Wildfires, J. Geophys. Res.-Atmos., 125, e2020JD032791, https://doi.org/10.1029/2020JD032791, 2020.
Shi, G., Chai, J., Zhu, Z., Hu, Z., Chen, Z., Yu, J., Ma, T., Ma, H., An, C., Jiang, S., Tang, X., and Hastings, M. G.: Isotope Fractionation of Nitrate During Volatilization in Snow: A Field Investigation in Antarctica, Geophys. Res. Lett., 46, 3287–3297, https://doi.org/10.1029/2019GL081968, 2019.
Sigman, D. M., Casciotti, K. L., Andreani, M., Barford, C., Galanter, M., and Böhlke, J. K.: A Bacterial Method for the Nitrogen Isotopic Analysis of Nitrate in Seawater and Freshwater, Anal. Chem., 73, 4145–4153, https://doi.org/10.1021/ac010088e, 2001.
Spataro, F. and Ianniello, A.: Sources of atmospheric nitrous acid: State of the science, current research needs, and future prospects, J. Air Waste Manage., 64, 1232–1250, https://doi.org/10.1080/10962247.2014.952846, 2014.
Stemmler, K., Ammann, M., Donders, C., Kleffmann, J., and George, C.: Photosensitized reduction of nitrogen dioxide on humic acid as a source of nitrous acid, Nature, 440, 195–198, https://doi.org/10.1038/nature04603, 2006.
Stockwell, C. E., Yokelson, R. J., Kreidenweis, S. M., Robinson, A. L., DeMott, P. J., Sullivan, R. C., Reardon, J., Ryan, K. C., Griffith, D. W. T., and Stevens, L.: Trace gas emissions from combustion of peat, crop residue, domestic biofuels, grasses, and other fuels: configuration and Fourier transform infrared (FTIR) component of the fourth Fire Lab at Missoula Experiment (FLAME-4), Atmos. Chem. Phys., 14, 9727–9754, https://doi.org/10.5194/acp-14-9727-2014, 2014.
Su, H., Cheng, Y., Oswald, R., Behrendt, T., Trebs, I., Meixner, F. X., Andreae, M. O., Cheng, P., Zhang, Y., and Pöschl, U.: Soil Nitrite as a Source of Atmospheric HONO and OH Radicals, Science, 333, 1616–1618, https://doi.org/10.1126/science.1207687, 2011.
Suter, H. U. and Huber, J. R.: S1 potential energy surface of HONO: Absorption spectrum and photodissociation, Chem. Phys. Lett., 155, 203–209, https://doi.org/10.1016/0009-2614(89)85350-3, 1989.
Talukdar, R. K., Burkholder, J. B., Schmoltner, A.-M., Roberts, J. M., Wilson, R. R., and Ravishankara, A. R.: Investigation of the loss processes for peroxyacetyl nitrate in the atmosphere: UV photolysis and reaction with OH, J. Geophys. Res.-Atmos., 100, 14163–14173, https://doi.org/10.1029/95JD00545, 1995.
Theys, N., Volkamer, R., Müller, J.-F., Zarzana, K. J., Kille, N., Clarisse, L., De Smedt, I., Lerot, C., Finkenzeller, H., Hendrick, F., Koenig, T. K., Lee, C. F., Knote, C., Yu, H., and Van Roozendael, M.: Global nitrous acid emissions and levels of regional oxidants enhanced by wildfires, Nat. Geosci., 13, 681–686, https://doi.org/10.1038/s41561-020-0637-7, 2020.
Thiemens, M. H.: History and Applications of Mass-Independent Isotope Effects, Annu. Rev. Earth Planet. Sci., 34, 217–262, https://doi.org/10.1146/annurev.earth.34.031405.125026, 2006.
Tuite, K., Thomas, J. L., Veres, P. R., Roberts, J. M., Stevens, P. S., Griffith, S. M., Dusanter, S., Flynn, J. H., Ahmed, S., Emmons, L., Kim, S.-W., Washenfelder, R., Young, C., Tsai, C., Pikelnaya, O., and Stutz, J.: Quantifying nitrous acid formation mechanisms using measured vertical profiles during the CalNex 2010 campaign and 1D column modeling, J. Geophys. Res.-Atmos, 126, e2021JD034689, https://doi.org/10.1029/2021JD034689, 2021.
VandenBoer, T. C., Young, C. J., Talukdar, R. K., Markovic, M. Z., Brown, S. S., Roberts, J. M., and Murphy, J. G.: Nocturnal loss and daytime source of nitrous acid through reactive uptake and displacement, Nat. Geosci., 8, 55–60, https://doi.org/10.1038/ngeo2298, 2014.
Walters, W. W. and Michalski, G.: Theoretical calculation of nitrogen isotope equilibrium exchange fractionation factors for various NOy molecules, Geochim. Cosmochim. Ac., 164, 284–297, https://doi.org/10.1016/j.gca.2015.05.029, 2015.
Walters, W. W. and Michalski, G.: Theoretical calculation of oxygen equilibrium isotope fractionation factors involving various NOy molecules, OH, and H2O and its implications for isotope variations in atmospheric nitrate, Geochim. Cosmochim. Ac., 191, 89–101, https://doi.org/10.1016/j.gca.2016.06.039, 2016.
Walters, W. W., Fang, H., and Michalski, G.: Summertime diurnal variations in the isotopic composition of atmospheric nitrogen dioxide at a small midwestern United States city, Atmos. Environ., 179, 1–11, https://doi.org/10.1016/j.atmosenv.2018.01.047, 2018.
Welker, J. M.: Isotopic (δ18O) characteristics of weekly precipitation collected across the USA: an initial analysis with application to water source studies, Hydrol. Process., 14, 1449–1464, https://doi.org/10.1002/1099-1085(20000615)14:8<1449::AID-HYP993>3.0.CO;2-7, 2000.
Westerling, A. L.: Increasing western US forest wildfire activity: sensitivity to changes in the timing of spring, Phil. Trans. R. Soc. B, 371, 20150178, https://doi.org/10.1098/rstb.2015.0178, 2016.
Westerling, A. L., Hidalgo, H. G., Cayan, D. R., and Swetnam, T. W.: Warming and Earlier Spring Increase Western U.S. Forest Wildfire Activity, Science, 313, 940–943, https://doi.org/10.1126/science.1128834, 2006.
Wojtal, P. K., Miller, D. J., O'Conner, M., Clark, S. C., and Hastings, M. G.: Automated, High-resolution Mobile Collection System for the Nitrogen Isotopic Analysis of NOx, J. Vis. Exp., 118, e54962, https://doi.org/10.3791/54962, 2016.
Wong, K. W., Tsai, C., Lefer, B., Haman, C., Grossberg, N., Brune, W. H., Ren, X., Luke, W., and Stutz, J.: Daytime HONO vertical gradients during SHARP 2009 in Houston, TX, Atmos. Chem. Phys., 12, 635–652, https://doi.org/10.5194/acp-12-635-2012, 2012.
Wong, K. W., Tsai, C., Lefer, B., Grossberg, N., and Stutz, J.: Modeling of daytime HONO vertical gradients during SHARP 2009, Atmos. Chem. Phys., 13, 3587–3601, https://doi.org/10.5194/acp-13-3587-2013, 2013.
Ye, C., Zhou, X., Pu, D., Stutz, J., Festa, J., Spolaor, M., Tsai, C., Cantrell, C., Mauldin, R. L., Campos, T., Weinheimer, A., Hornbrook, R. S., Apel, E. C., Guenther, A., Kaser, L., Yuan, B., Karl, T., Haggerty, J., Hall, S., Ullmann, K., Smith, J. N., Ortega, J., and Knote, C.: Rapid cycling of reactive nitrogen in the marine boundary layer, Nature, 532, 489–491, https://doi.org/10.1038/nature17195, 2016.
Ye, C., Zhang, N., Gao, H., and Zhou, X.: Photolysis of Particulate Nitrate as a Source of HONO and NOx, Environ. Sci. Technol., 51, 6849–6856, https://doi.org/10.1021/acs.est.7b00387, 2017.
Yokelson, R. J., Crounse, J. D., DeCarlo, P. F., Karl, T., Urbanski, S., Atlas, E., Campos, T., Shinozuka, Y., Kapustin, V., Clarke, A. D., Weinheimer, A., Knapp, D. J., Montzka, D. D., Holloway, J., Weibring, P., Flocke, F., Zheng, W., Toohey, D., Wennberg, P. O., Wiedinmyer, C., Mauldin, L., Fried, A., Richter, D., Walega, J., Jimenez, J. L., Adachi, K., Buseck, P. R., Hall, S. R., and Shetter, R.: Emissions from biomass burning in the Yucatan, Atmos. Chem. Phys., 9, 5785–5812, https://doi.org/10.5194/acp-9-5785-2009, 2009.
Yung, Y. L. and Miller, C. E.: Isotopic Fractionation of Stratospheric Nitrous Oxide, 278, 1778–1780, https://doi.org/10.1126/science.278.5344.1778, 1997.
Zhou, X., Zhang, N., TerAvest, M., Tang, D., Hou, J., Bertman, S., Alaghmand, M., Shepson, P. B., Carroll, M. A., Griffith, S., Dusanter, S., and Stevens, P. S.: Nitric acid photolysis on forest canopy surface as a source for tropospheric nitrous acid, Nat. Geosci., 4, 440–443, https://doi.org/10.1038/ngeo1164, 2011.
- Abstract
- Introduction
- Methodology
- Results and discussion
- Conclusions
- Appendix A: Overview of HONO budget quantification under different conditions based upon concentrations
- Appendix B: Quantification of isotopic fractionation factor
- Data availability
- Author contributions
- Competing interests
- Disclaimer
- Acknowledgement
- Financial support
- Review statement
- References
- Supplement