the Creative Commons Attribution 4.0 License.
the Creative Commons Attribution 4.0 License.
 | 29 Jan 2021
Increased new particle yields with largely decreased probability of survival to CCN size at the summit of Mt. Tai under reduced SO2 emissions
Yujiao Zhu
Likun Xue
Jian Gao
Jianmin Chen
Hongyong Li
Yong Zhao
Zhaoxin Guo
Tianshu Chen
Liang Wen
Penggang Zheng
Xinfeng Wang
Xiaohong Yao
Wenxing Wang
Because anthropogenic sulfur dioxide (SO2) emissions have decreased considerably in the last decade, PM2.5 pollution in China has been alleviated to some extent. However, the effects of reduced SO2 on the particle number concentrations and subsequent contributions of grown new particles to cloud condensation nuclei (CCN) populations, particularly at high altitudes with low aerosol number loadings, are poorly understood. In contrast, the increase in provincial forest areas in China with rapid afforestation over the last few decades expectedly increases the biogenic emissions of volatile organic compounds and their oxidized products as nucleating precursors therein. In this study, we evaluated the campaign-based measurements made at the summit of Mt. Tai (1534 m a.s.l.) from 2007 to 2018. With the decrease in SO2 mixing ratios from 15 ± 13 ppb in 2007 to 1.6 ± 1.6 ppb in 2018, the apparent formation rate (FR) of new particles and the net maximum increase in the nucleation-mode particle number concentration (NMINP) in the spring campaign of 2018 was 2- to 3-fold higher than those in the spring campaign of 2007 with almost the same occurrence frequency of new particle formation (NPF) events. In contrast, the campaign-based comparison showed that the occurrence frequency, in which the maximum geometric median diameter of the grown new particles (Dpgmax) was > 50 nm, decreased considerably from 43 %–78 % of the NPF events before 2015 to < 12 % in 2017–2018. Assuming > 50 nm as a CCN threshold size at high supersaturations, the observed net CCN production decreased from 3.7 × 103 cm−3 (on average) in the five campaigns before 2015 to 1.0 × 103 cm−3 (on average) in the two campaigns in 2017–2018. We argue that the increases in the apparent FR and NMINP are mainly determined by the availability of organic precursors that participate in nucleation and initial growth, whereas the decrease in the growth probability is caused by the reduced emissions of anthropogenic precursors. However, large uncertainties still exist because of a lack of data on the chemical composition of these smaller particles.
- Article
(4079 KB) - Full-text XML
-
Supplement
(1185 KB) - BibTeX
- EndNote


Atmospheric new particle formation (NPF) is regarded as an important source of aerosol particles in terms of number concentrations, and the newly formed particles can grow into a variety of sizes with different health and climate effects. For example, particles larger than 50–80 nm may act as cloud condensation nuclei (CCN), whereas those larger than 100 nm may directly affect solar radiation (Kulmala and Kerminen, 2008; Kerminen et al., 2012; Seinfeld and Pandis, 2012). Sulfuric acid (H2SO4) is considered as the key nucleating precursor for NPF, and other species, such as ammonia (NH3), amines, and highly oxygenated molecules (HOMs, the oxidation products of volatile organic compounds (VOCs)), can also participate and enhance nucleation in the continental troposphere (Ehn et al., 2014; Tröstl et al., 2016; Yao et al., 2018; Kerminen et al., 2018; Chu et al., 2019; Lee et al., 2019). The subsequent growth of new particles is affected by not only the abovementioned precursors but also the semivolatile compounds (Riipinen et al., 2012; Ehn et al., 2014; Tröstl et al., 2016).
NPF events have been reported widely throughout the world, including in severely polluted urban and rural areas in China that experience high sulfur dioxide (SO2) concentrations and high aerosol loading (Kulmala et al., 2004; Gao et al., 2009; Guo et al., 2012; Nie et al., 2014; Kerminen et al., 2018; Chu et al., 2019). In the last few decades, anthropogenic emissions of gaseous and particulate air pollutants in China have been reduced substantially due to rigorous emission control policies. Between 2007 and 2018 (the observation period in this study), the national total SO2 emissions decreased by 67 % (from 24.7 million to 8.2 million tons), and the national average ambient SO2 concentrations decreased by 73 % (from 17.9 to 4.9 ppb; see Fig. S1 in the Supplement). The North China Plain (NCP) region experiences the most severe SO2 pollution, which has a visibly decreased trend since 2011 (Krotkov et al., 2016; Fan et al., 2020). Such huge reductions in SO2 emissions may alter the frequency and intensity of NPF events and the subsequent growth of new particles. The changes in the mixing ratios of VOC components, ambient oxidants, aerosol loading, and meteorological factors may also influence NPF events, yielding more complex and uncertain feedback (Kulmala and Kerminen, 2008; Zhang et al., 2012).
The long-term changes in NPF events under lower SO2 conditions have been studied in several cities in Europe and the US. For example, decreased NPF frequency and reduced new particle yields were associated with decreases in SO2 concentrations in Pittsburgh (US), Rochester (US), and Melpitz (Germany) (Hamed et al., 2010; Y. Wang et al., 2011; Wang et al., 2017; Saha et al., 2018). In contrast, long-term studies in Pallas (Finland), Hyytiälä (Finland), and Crete (Greece) observed no trends in NPF frequencies despite considerable decreases in the ambient SO2 concentrations all over Europe (Asmi et al., 2011; Nieminen et al., 2014; Kalivitis et al., 2019). Moreover, a slight upward trend in the particle formation and growth rates was observed in Pallas and Hyytiälä, attributable to the increased biogenic VOC (BVOC) emissions (Asmi et al., 2011; Nieminen et al., 2014).
In China, the earliest observation of NPF events started in approximately 2004 in Beijing (Wu et al., 2007). The comparison of tens of independent experiments showed that the NPF frequency has remained relatively constant until recent years, possibly due to the reduced production and reduced loss rate of H2SO4; these phenomena may have canceled each other out to some extent in Beijing (Chu et al., 2019; Li et al., 2020). In addition, a recent study reported that China has experienced rapid afforestation by a net increase of ∼ 18 % in leaf area from 2000 to 2017 with provincial forest areas increasing by between 0.04 and 0.44 million ha yr−1 over the past 10 to 15 years, leading to an increase in the CO2 sink based on long-term observations over large spatial scales (Chen et al., 2019; Wang et al., 2020). BVOC emissions in China are reasonably expected to have increased over the past decades (Zhang et al., 2016; Chen et al., 2018). Considering the key roles of oxidized BVOCs in NPF events (Riipinen et al., 2012; Ehn et al., 2014; Tröstl et al., 2016; Chu et al., 2019), the responses of NPF in China in terms of their occurrence frequency, intensity, and potential impacts on the climate to reduced anthropogenic SO2 emissions may not be the same as those observed in Europe and North America. However, the long-term changes in NPF intensities and the subsequent growth of new particles have not been studied in China, where the anthropogenic emissions of various air pollutants and biogenic emissions of VOCs have been changing in opposite directions in the past decade.
In this study, we analyzed the measurement data of particle number concentrations, chemical compositions, trace gases, and meteorological parameters collected at the summit of Mt. Tai (36.25∘ N, 117.1∘ E; 1534 m a.s.l.) during seven observational campaigns from 2007 to 2018. Mt. Tai is the highest mountain in the NCP, located at the region's center, and the observation station has been widely deployed to investigate regional air pollution as well as transport and chemical processes in the NCP (Gao et al., 2005; Li et al., 2011; Sun et al., 2016; Wen et al., 2018). Moreover, the summit is close to the top of the planetary boundary layer, or even in the free troposphere sometimes, and is characterized by relatively few pre-existing particles, strong UV solar radiation, and low ambient temperature, which favor NPF events (Li et al., 2011; Shen et al., 2016a; Lv et al., 2018). The tree coverage areas around the sampling site evidently increased from 2003 to 2016 based on MODIS satellite data (Fig. S2 in the Supplement). The contribution of new particles to the CCN population, compared with that of primary particles, reportedly increases above the boundary layer, indicating a critical role of high-altitude NPF in cloud formation and the related climate impacts (Merikanto et al., 2009). The main goals of this study were (1) to examine the effects of reduced SO2 emissions on regional NPF events at a high altitude (from the upper boundary layer to the lower free troposphere), i.e., the changes in the NPF frequency, intensity, and subsequent growth of new particles; (2) to quantify the potential contribution of new particles to the CCN population and its changes under decreasing SO2 emissions; and (3) to rationalize the variation patterns of the NPF characteristics and CCN parameters in terms of observational concentrations of gaseous precursors and their origins and atmospheric behaviors. Note that all these changes in the study area should occur under the background of an increase in BVOCs and their oxidized products as nucleating precursors over the decade in China, although no studies can confirm the decadal increase in nucleating precursors from biogenic VOCs because of the lack of related analytic technologies in the past.
2.1 Experiment
This study comprised seven intensive campaigns from 2007 to 2018, and the details are summarized in Table 1. The duration of each campaign varied from 18 to 71 d. The measurement data obtained in the four campaigns in 2007, 2014, and 2015 have been reported by Gao (2008) and Lv et al. (2018). Here, all of the available data were combined to examine the effects of reduced SO2 emissions on regional NPF events.
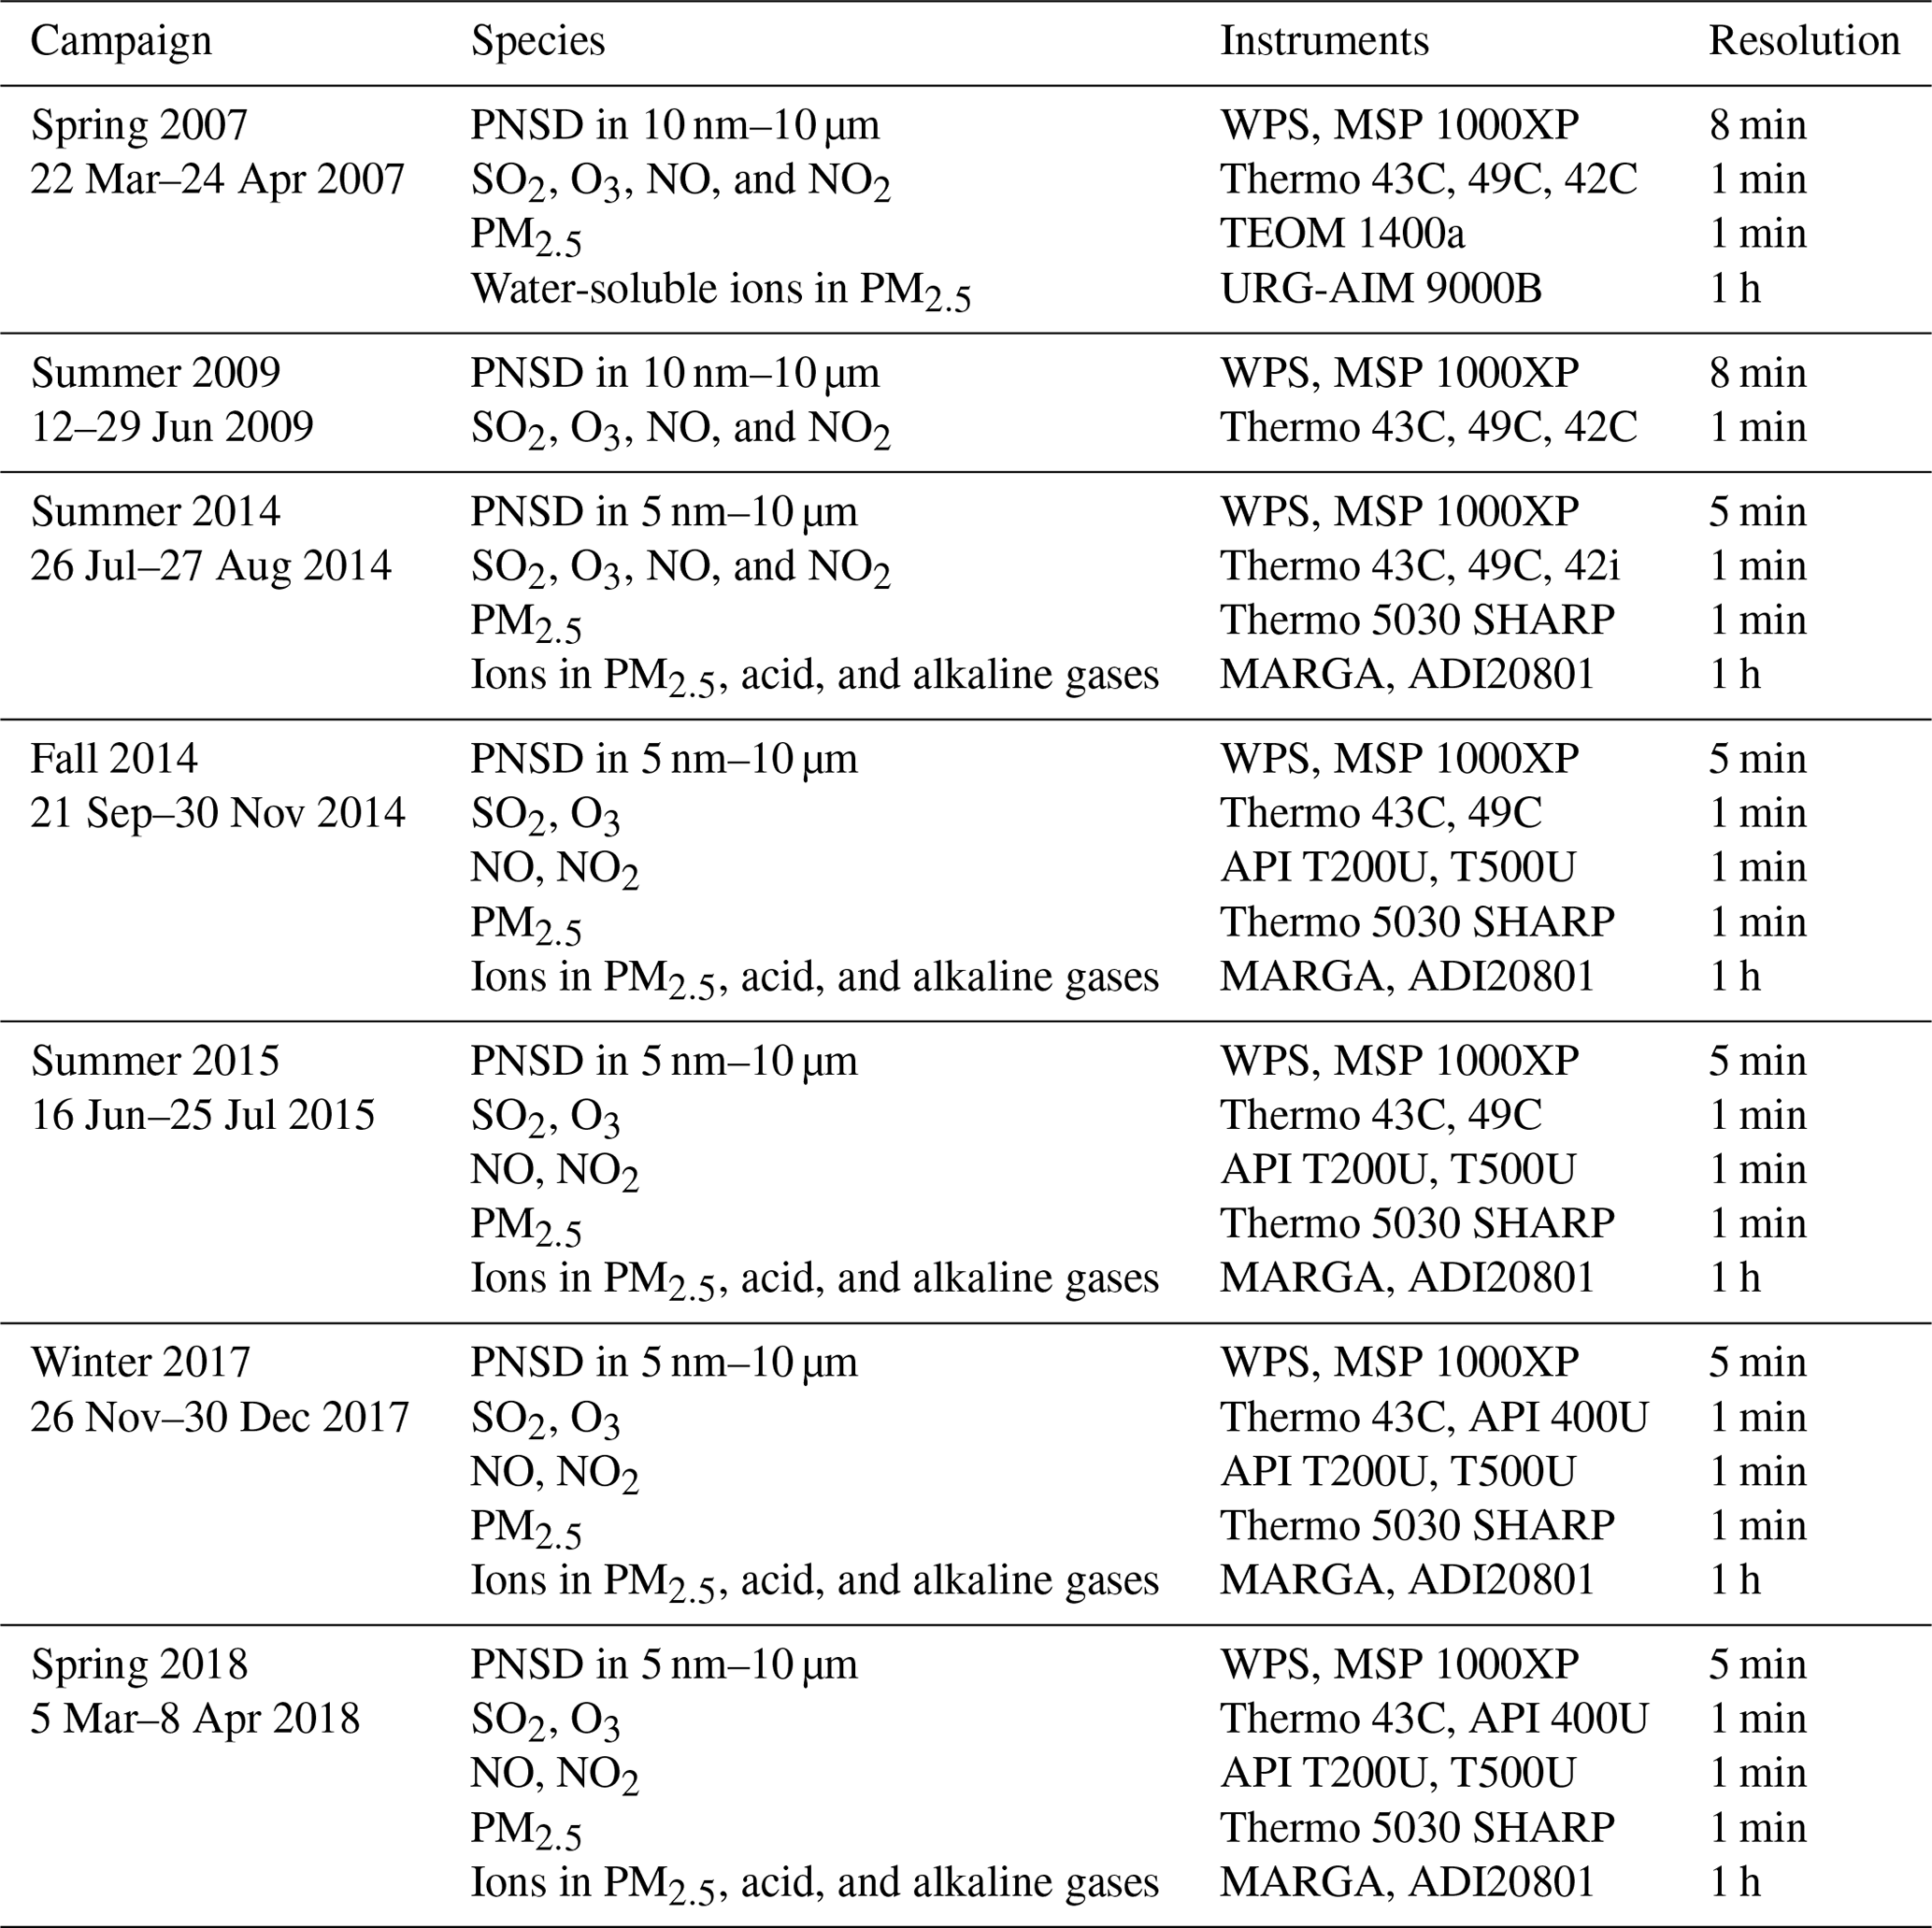
All measurements were obtained using commercial instruments, which were housed in a container and have been described in previous studies (e.g., Zhou et al., 2009; Lv et al., 2018). During the seven campaigns, the particle number size distributions (PNSDs) were monitored using a wide-range particle spectrometer (WPS; Model 1000XP, MSP Corporation, USA) at ambient relative humidity (RH). Conductive tubes (TSI 1∕4 in.) were used for the WPS sampling, and the length of the tube was kept at approximately 2 m in each campaign. The WPS combines a differential mobility analyzer (DMA), a condensation particle counter (CPC), and a laser particle spectrometer (LPS). The DMA and CPC can measure particles in the 10–500 nm (or 5–500 nm in the advance mode) size range in 48 channels. The DMA was operating in the voltage-scanning mode. The LPS covers the size range of 350 nm–10 µm and is divided into 24 channels. In this study, the detection limit of the DMA was 10 nm in 2007 and 2009, while it was 5 nm in 2014, 2015, 2017, and 2018. For consistency, the particles sized 10–300 nm were used for the calculations in all campaigns except for that in spring of 2007, when the data of > 153 nm particles were missing, so we used the data of 10–153 nm particles instead for the calculation. The net increases in the number concentrations of 10–25 nm particles during the initial several hours of NPF events were over 1–2 orders of magnitude in this study, e.g., in Fig. 1b, d. The uncertainties of the measured particle number concentrations at approximately 10 nm in 2007 and 2009 and those after had a negligible influence on the net increases. In addition, the use of the 10–153 nm particles in 2007 may lead to underestimation of the particle number concentration, as detailed in the Supplement.
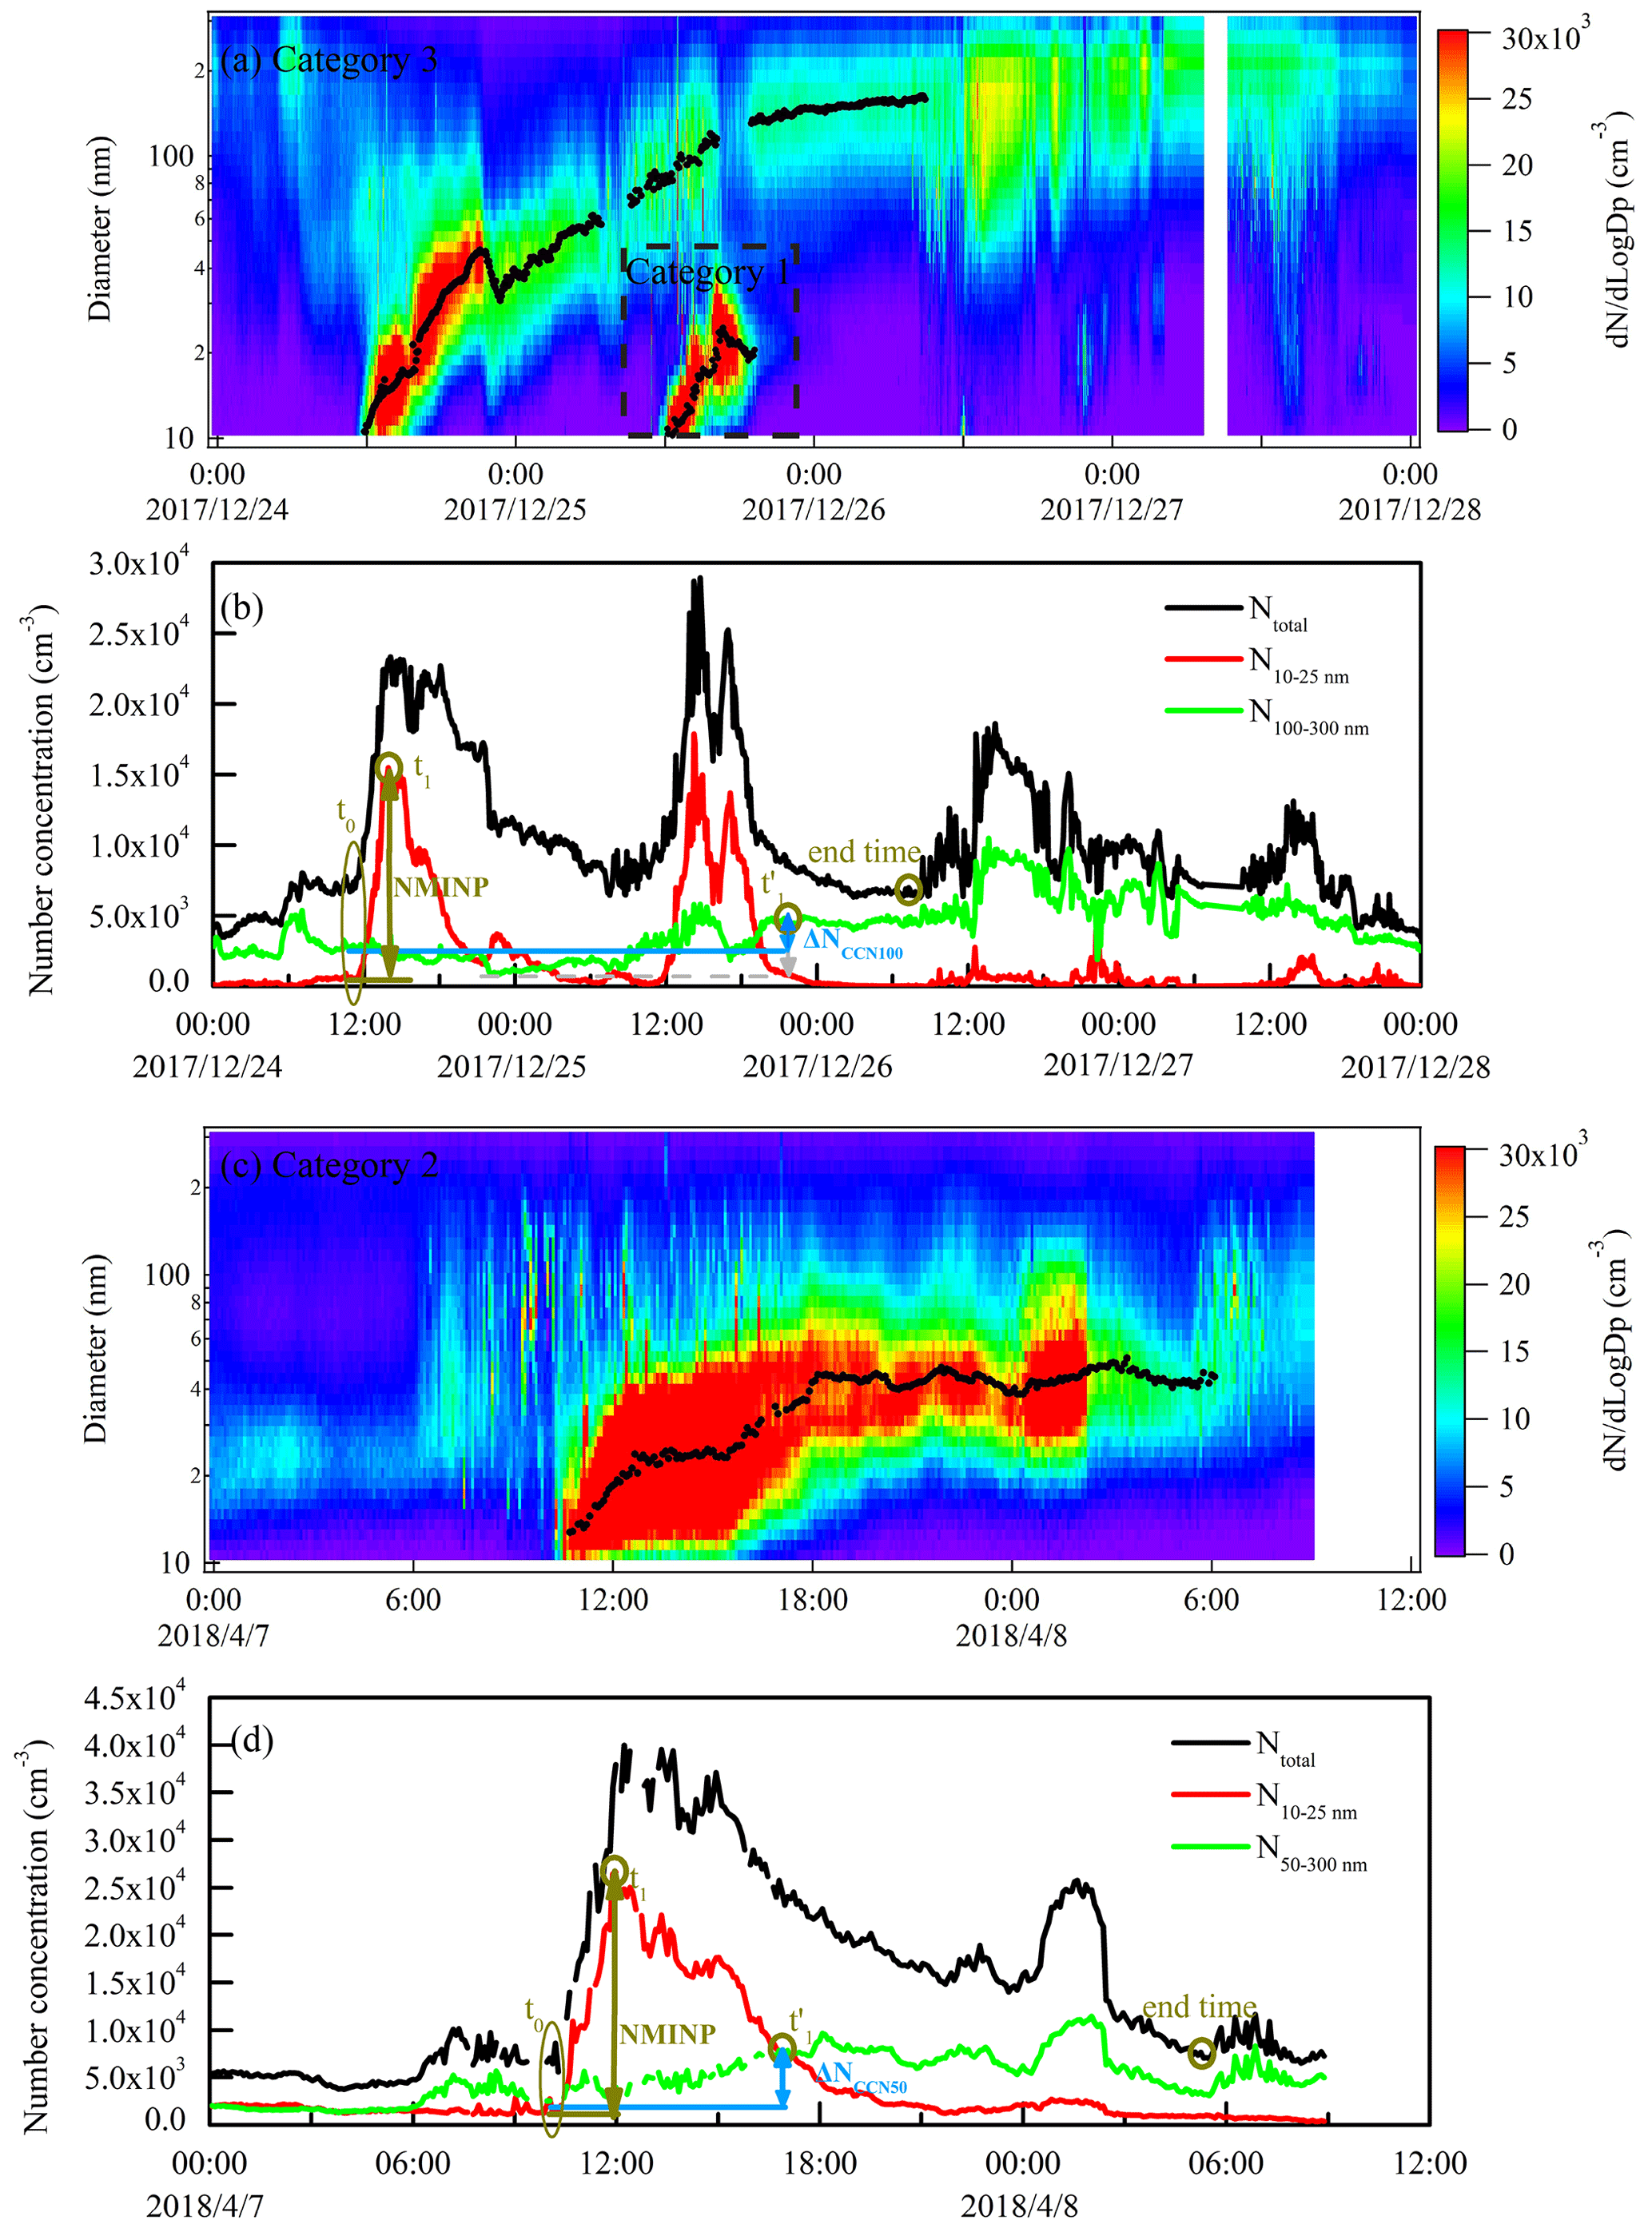
Figure 1Examples of NPF events in three categories. Black dots in the figures are the fitted Dpg. (a) Category 1 on 25 December 2017, in which Dpgmax was 24 nm (< 50 nm), and Category 3 on 24 December 2017, in which Dpgmax grew to 163 nm (> 80 nm); (c) Category 2 on 7 April 2018, in which Dpgmax grew to 53 nm (50–80 nm). (b, d) Schematic diagram of t0, t1, , NMINP, and ΔNCCN100∕ΔNCCN50 on 24 December 2017 and 7 April 2018 NPF events (a few spikes have been removed from d).
The WPS instrument was calibrated and/or repaired every 1–2 years by its vendor. The regular maintenance allowed the WPS to perform well based on the recent comparison results of the WPS and a new scanning mobility particle sizer (SMPS, Grimm, Germany) in the summer of 2020, as shown in Fig. S3 in the Supplement. The regular calibration parameters included the DMA sample/sheath flow, LPS sample/sheath flow, DMA/CPC pressure, DMA voltage, and DMA/ambient temperature. Polystyrene latex (PSL) spheres (NIST, USA) with mean diameters of 100.7 and 269 nm were used for calibration. At the beginning of each campaign, the zero points of the DMA, CPC, and LPS were checked using a purge filter at the inlet. Sometimes the WPS operated improperly and the data were excluded from the analysis (see Fig. S4 in the Supplement for the occasional unexpected errors in three channels around 213 nm). In addition, we reproduced the PM2.3 mass concentration from the WPS data and found that it was reasonably comparable to the measured PM2.5, further supporting the accuracy of the WPS data. Details can be found in Fig. S5 in the Supplement.
The trace gases were monitored during each campaign. SO2 was measured using an ultraviolet fluorescence analyzer (Model 43C, Thermo Electron Corporation, USA), O3 was monitored using two ultraviolet absorption analyzers (Model 49C, Thermo Electron Corporation, USA, or Model 400U, Advanced Pollution Instrumentation Inc., USA), and NO and NO2 were monitored using a chemiluminescence analyzer (Model 42C or 42i, Thermo Electron Corporation, USA) equipped with a blue light converter before August 2014 and subsequently using a chemiluminescence analyzer (Model T200U, API, USA) and a cavity-attenuated phase-shift spectroscopy instrument (Model T500U, API, USA), respectively. For the SO2, O3, NO, and NO2 analyzers, we performed multipoint calibrations every month and changed the filter every two weeks. The detection limits of SO2, O3, NO, and NO2 were 1, 0.4, 0.04, and 0.4 ppb, respectively. PM2.5 was measured using a TEOM 1400a in 2007 and a Thermo 5030 SHARP after 2014. This device was calibrated by mass foil calibration according to the instrument manual and the detection limit was 0.5 µg m−3. The inorganic water-soluble ions in PM2.5 together with the acid and alkaline gases were measured using an online ambient ion monitor (URG-AIM 9000B, URG Corporation, USA; only for water-soluble ions in PM2.5) in 2007 and using a Monitor for Aerosols and Gases (MARGA; ADI20801, Applikon-ECN, Netherlands) in the five campaigns from 2014 onward. A multipoint calibration was performed for the online MARGA before and after the field campaigns to examine the sensitivity of the detectors. The detection limits were determined to be 0.05, 0.05, 0.04, and 0.05 µg m−3 for Cl−, NO, SO, and NH, respectively. More details about the instrument calibration can be found in Wen et al. (2018) and Li et al. (2020). Data on the meteorological parameters including temperature (T), RH, wind speed, wind direction, and precipitation were provided by the Mt. Tai Meteorological Station.
The air mass back trajectories were calculated using the Hybrid Single Particle Lagrangian Integrated Trajectory (HYSPLIT) model. The input meteorological data (Global Data Analysis System (GDAS) data) were used with a 1∘ latitude–longitude resolution. A trajectory ending height of 1400 m a.g.l. was selected because the terrain height on Mt. Tai was approximately 150 m in the GDAS data.
2.2 Calculation methods
2.2.1 Definition of NPF events and relevant parameters
In this study, particles with diameters smaller than 25 nm were defined as nucleation mode particles (Kulmala et al., 2012). Following the criteria proposed by Dal Maso et al. (2005) and Kulmala et al. (2012), three features had to be met for an event to qualify as NPF: (1) distinctly new nucleation mode particles must appear in the size distribution; (2) the new mode should prevail over a time span of hours; and (3) the new mode should show signs of growth. All three features are required for a day (00:00–23:59 LT) to be classified as an NPF day. Otherwise, the day is classified as a non-NPF day.
The initial time of an NPF event was defined as when new nucleation-mode particles started to be observed (e.g., t0 in Fig. 1b, d). The end time of an NPF event was defined as the new particle signal dropping to a negligible level and the total particle number concentrations approaching the background levels before the NPF event. In cases with the invasion of other plumes, the end time was determined to be when the new particle signals were suddenly overwhelmed by plumes and could no longer be identified (e.g., the end times in Fig. 1b, d). The NPF event duration was defined as the time duration between the initial time and end time of an NPF event. Note that the detection limit of WPS was 10 nm, but the particles were nucleated at critical cluster sizes of approximately 1–1.5 nm. Therefore, the NPF actually occurred at some time prior to our observation, and the actual duration should be longer than our calculation.
Three parameters are commonly used to evaluate NPF characteristics, viz., apparent formation rate (FR), growth rate (GR), and condensation sink (CS) (Sihto et al., 2006; Kulmala et al., 2012). The apparent FR of new particles is calculated based on nucleation-mode particles with sizes of 10–25 nm. The GR is quantified by fitting the geometric median diameter of new particles (Dpg) during the whole particle growth period (Zhu et al., 2014, 2019). The size range of Dpg varies from event to event. Details of the calculation equations can be found in the Supplement. Note that the lack of measurements of > 153 nm particles in the spring campaign of 2007 may lead to an underestimation of the CS. We tested the possible underestimation using the data measured in 2018 by comparing the CS values calculated for the measured number concentrations of particles in the 10–153, 10–300, and 10–2500 nm size ranges. The use of the 10–153 nm particles may lead to ∼ 50 % underestimation of the CS compared to that using the 10–2500 nm particles. Thus, the CS value from the 10–153 nm particles in the spring campaign of 2018 was compared with that obtained in the spring campaign of 2007. However, the CS values from the 10–300 nm particles accounted for approximately 94 % of those from the 10–2500 nm particles. Thus, the CS values from the 10–300 nm particles were used throughout the study, except in 2007.
Another two metrics were applied to characterize the NPF events, i.e., the net maximum increase in the nucleation-mode particle number concentration (NMINP) and the maximum size of Dpg (Dpgmax). The two metrics were proposed in our previous studies (Zhu et al., 2017, 2019). The NMINP indicated the intensity of an NPF event, which was calculated as
where N10–25 nm is the sum of the nucleation-mode particle number concentrations, and t0 and t1 represent the time when an NPF event is initially observed and the time when N10–25 nm reaches the maximum value, respectively. Figure 1b, d shows the schematic diagram of the NMINP.
Note that a few spikes were occasionally observed with a broader particle number size distribution during the NPF period. These spikes were excluded in the calculation of the FR, GR, Dpg, NMINP, and CCN parameters (described in Sect. 2.2.2) because they may reflect primary particles from localized sources (Liu et al., 2014; Man et al., 2015; Zhu et al., 2017).
According to the different sizes of Dpgmax, the NPF events were classified into three categories (as shown in Fig. 1). In Category 1 events (e.g., 25 December 2017, Fig. 1a), the new particles grow to a Dpgmax of < 50 nm and are too small to serve as CCN. In Category 2 events (e.g., 7 April 2018, Fig. 1b), the new particles grow to a Dpgmax of 50–80 nm. In Category 3 events (e.g., 24 December 2017, Fig. 1a), the new particles grow to Dpgmax of > 80 nm. The NPF events in Categories 2 and 3 can be regarded as climate-relevant events.
2.2.2 CCN parameters
In the absence of direct CCN measurements, the potential contribution of new particles to the CCN population can be estimated from the particle number size distribution (Lihavainen et al., 2003; Rose et al., 2017). Theoretically, particles larger than 50 nm (i.e., 80 nm) can be activated as CCN under quite high (moderate) supersaturation (Dusek et al., 2006; Petters and Kreidenweis, 2007; Ma et al., 2016), and particles larger than 100 nm can directly impact the climate by scattering and absorbing solar radiation (Charlson et al., 1992; Seinfeld and Pandis, 2012). In this study, we introduced three terms: the net increase in the NPF-derived CCN number concentration (ΔNCCN), the apparent survival probability (SP) of new particles to the CCN sizes, and the relative increase ratio of the CCN population (RCCN). Three sizes, viz., 50, 80, and 100 nm, were defined as the CCN threshold sizes. ΔNCCN was calculated following the method of Rose et al. (2017):
where the NCCN terms represent the potential CCN number concentrations and were estimated from the number concentrations of particles larger than 50, 80, and 100 nm (NCCN50, NCCN80, and NCCN100, respectively); t0 is the time when an NPF event is initially observed, the same as that in Eq. (1); and is the time when NCCN reaches the maximum value during the new particle growth periods. Each concentration was taken as a 1 h average. The ΔNCCN term eliminates the influence of pre-existing particles. A schematic diagram of NCCN100 and NCCN50 can be found in Fig. 1b, d.
The SP was calculated as described by Zhu et al. (2019):
Note that the spatial–temporal heterogeneity during NPF events may result in high SPs. If the observed ΔNCCN exceeded the NMINP and the calculated SPs exceeded 100 %, it suggested that Eq. (3) was not applicable in these cases, and SP was therefore not calculated.
The RCCN values were the ratios of the NPF-derived CCN to the pre-existing CCN and were calculated as follows:
Moreover, Fig. 1b shows that the choice of t0 may lead to underestimation of ΔNCCN to some extent in the presence of spatial–temporal heterogeneity of pre-existing particles with diameters larger than 50 nm. In these cases, the mean value of NCCN in the percentiles smaller than the 5th during the whole NPF event may more accurately represent the background (see the gray dashed line in Fig. 1b). However, this method may also introduce more subjective factors and therefore was not adopted in this study.
In addition, the maximum geometric median diameter of the grown new particles never exceeded 89 nm in spring 2007. Considering the log-normal distribution of the grown new particles, the number concentration of grown new particles with diameters > 153 nm was less than 15 % (Fig. S6 in the Supplement). Thus, it is safe to say that the lack of data for > 153 nm particles had a negligible effect on the calculated ΔNCCN50, ΔNCCN80, and ΔNCCN100 in 2007.
2.2.3 Sulfuric acid proxy
The proxy for the H2SO4 concentration could be roughly estimated based on the solar radiation (SR), SO2 concentration, CS, and RH as follows (Mikkonen et al., 2011; Lv et al., 2018):
where k is a temperature-dependent reaction rate constant and SR was estimated from the HYSPLIT model.
The contribution of H2SO4 vapor to the particle growth from Dp0 to Dp1 can be expressed by the following equation (Kulmala et al., 2001):
where [H2SO4]avg is the average concentration of H2SO4 during the particle growth period and C is the total concentration of condensable vapor for the particle growth from Dp0 to Dp1, which can be calculated as described by Kulmala et al. (2001). Notably, uncertainty may exist in the estimated contribution of the SO2 concentrations and radiation intensity to H2SO4, as well as in the contribution of H2SO4 to the particle growth.
3.1 Variation in the NPF frequency
During the seven campaigns, NPF events were observed on 106 of the 265 sampling days. As shown in Fig. 2, the NPF frequencies in the three seasons of different years were surprisingly almost the same, i.e., 50 % in the spring of 2007, 50 % in the summer of 2009, 49 % in the winter of 2017, and 51 % in the spring of 2018. However, the NPF frequency decreased to 42 % in the summer of 2014, 33 % in the fall of 2014, and 20 % in the summer of 2015. The low NPF frequencies were likely caused by perturbations from meteorological conditions. For example, there were 15 rainy days out of the 40 sampling days during the 2015 summer campaign, but only 3 rainy days out of the total 18 sampling days in the 2009 summer campaign. Moreover, the solar radiation averaged over the 2009 summer campaign was 1.4 times that of the 2015 summer campaign (Fig. S7 in the Supplement). These factors may have caused the NPF frequency in the 2009 summer campaign to be close to that in the other season campaigns but that of the 2015 summer campaign to be lower.
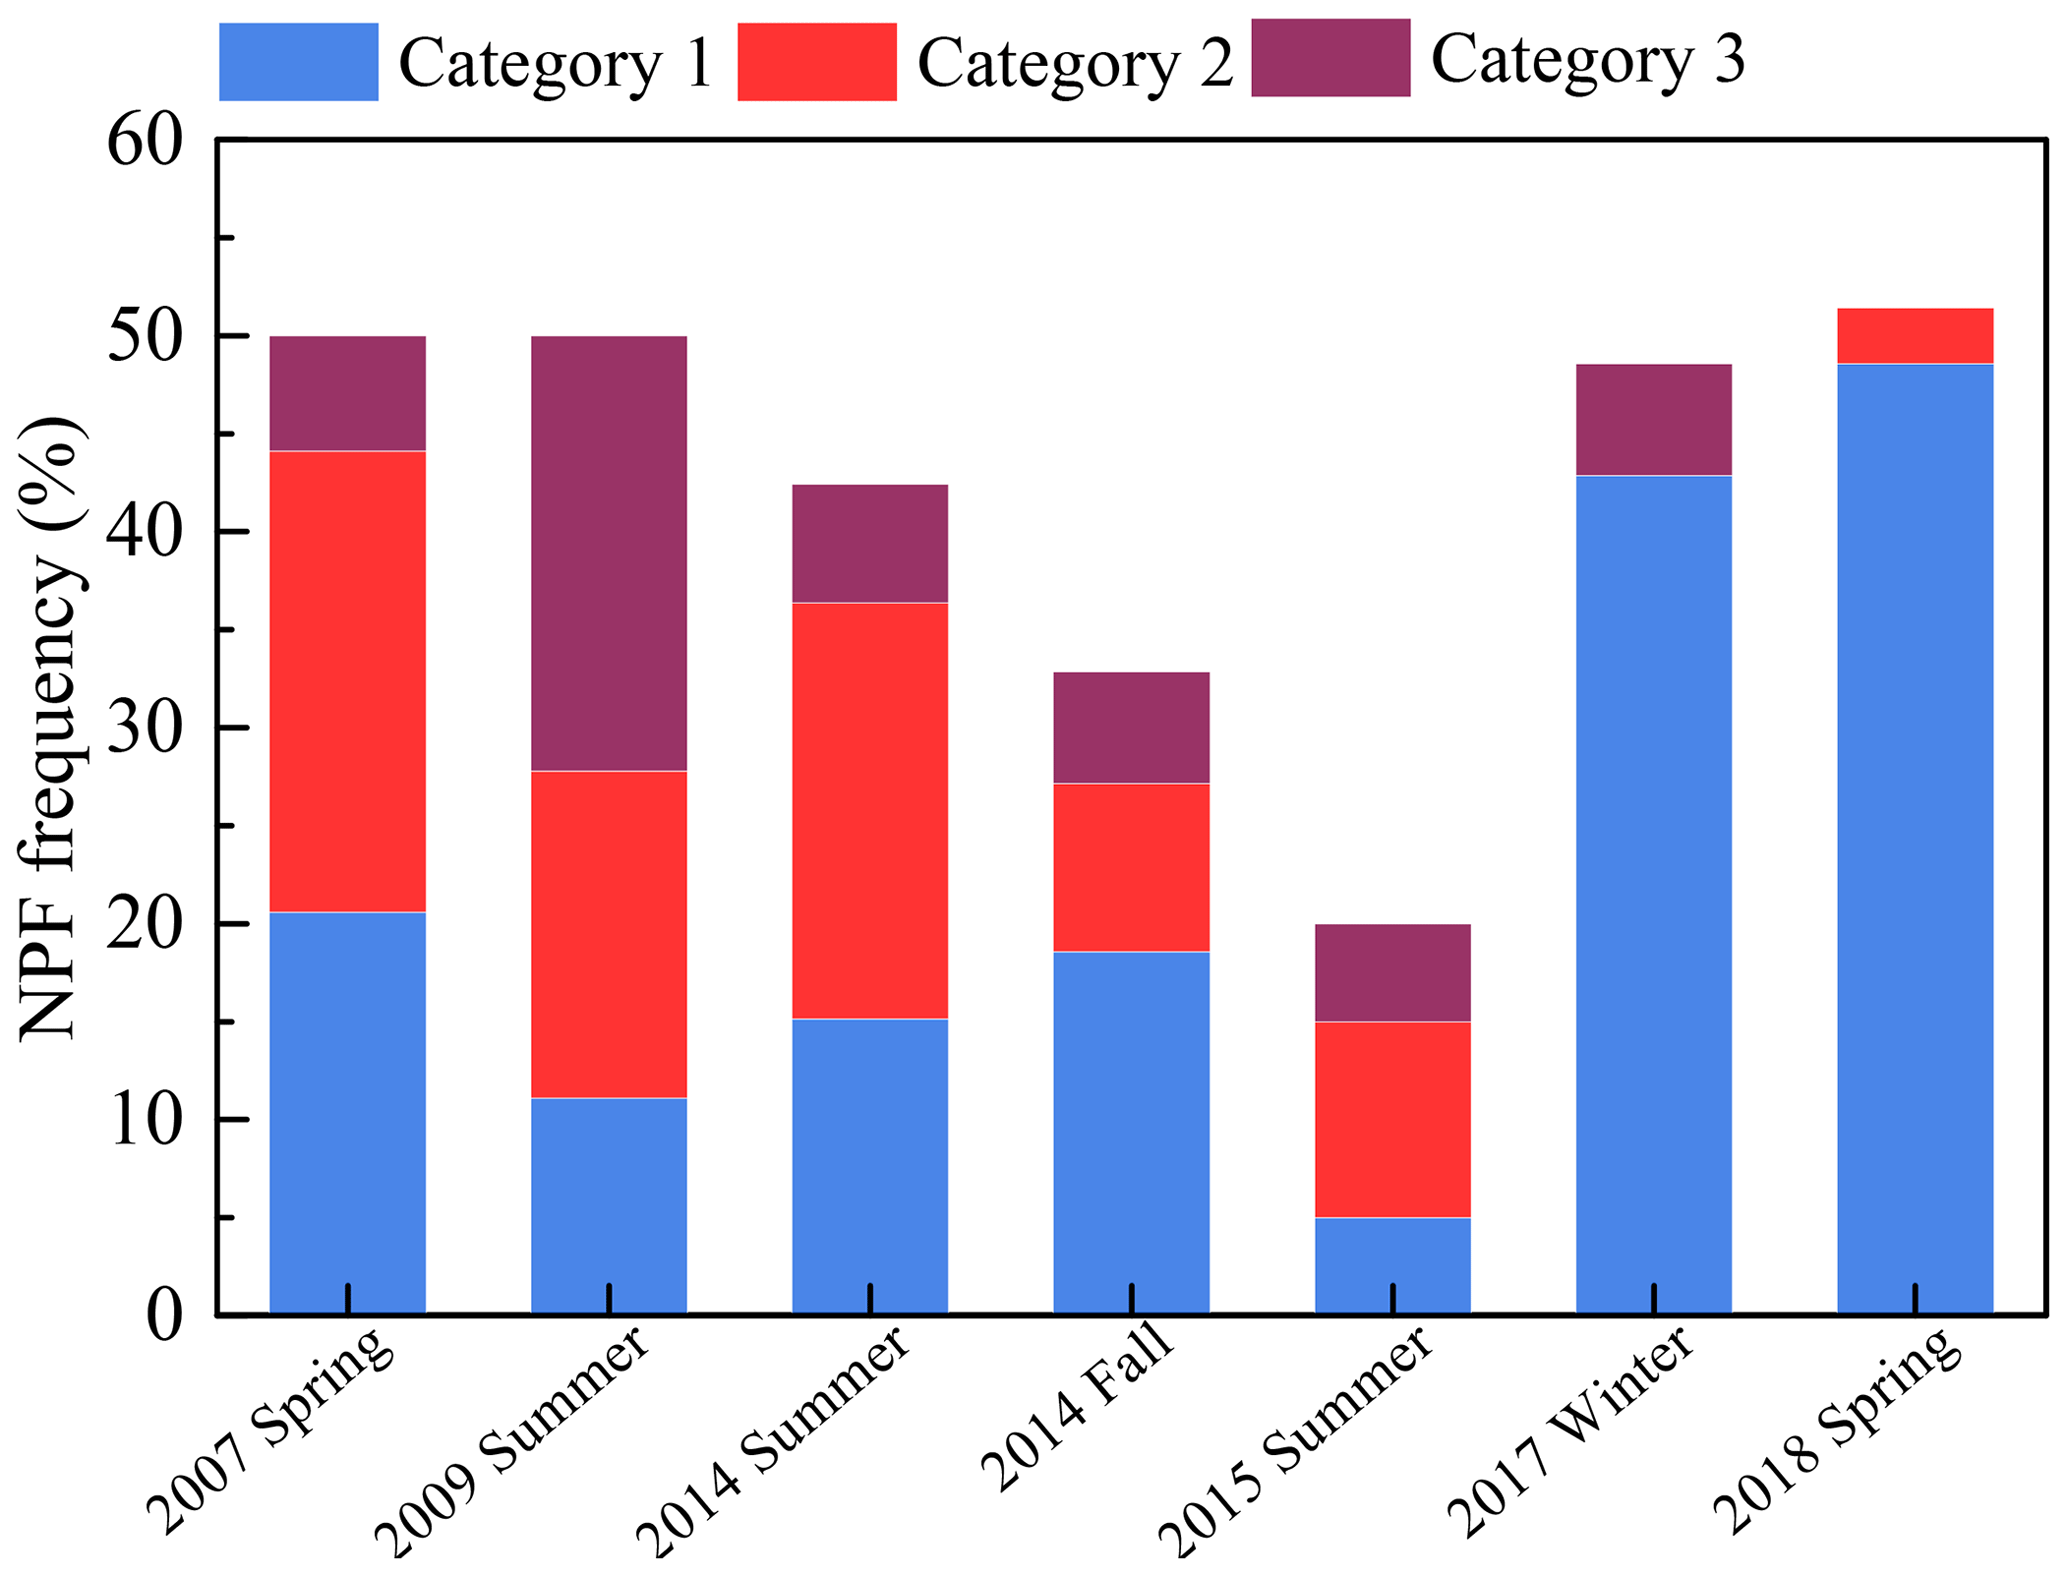
Figure 2Occurrence frequencies of NPF events in different categories at Mt. Tai during the seven observation campaigns.
When Categories 1, 2, and 3 of the NPF events were examined separately, the Category 1 NPF frequencies in the winter of 2017 (43 %) and the spring of 2018 (49 %) were significantly higher than those before (5 %–21 %; p < 0.05). Category 2 events were absent in the winter of 2017, whereas Category 3 events were absent in the spring of 2018. The sums of the Category 2 and 3 NPF frequencies in 2017 (6 %) and 2018 (3 %) were significantly lower than those before (14 %–39 %; p < 0.05), even in comparison with the relatively low NPF frequencies in the summer of 2015 (15 %) and the fall of 2014 (14 %). When the sums of the Category 2 and 3 NPF frequencies in each campaign were normalized by the corresponding total NPF frequency, the boundary was clearer, i.e., the normalized sum values were as high as 43 %–78 % before 2015 and < 12 % in 2017–2018. Clearly, the newly formed particles observed at Mt. Tai in 2017–2018 were less climatically relevant than those before 2015 (64 %–78 % in the three summer campaigns versus 43 % and 59 % in the fall and spring campaigns), despite the comparable NPF frequencies.
3.2 Variations in the apparent FR, NMINP, GR, and Dpgmax
We used four metrics, i.e., the apparent FR, NMINP, GR, and Dpgmax, to characterize the NPF events and evaluate the potential climate impacts of the grown new particles (Fig. 3). During the four campaigns in 2007, 2009, and 2014, the calculated apparent FR varied narrowly in each campaign and the campaign average narrowed to 0.8–1.2 cm−3 s−1. The apparent FR increased in the three subsequent campaigns, i.e., 2.6 ± 1.3 cm−3 s−1 in 2015, 2.0 ± 1.7 cm−3 s−1 in 2017, and 3.0 ± 2.7 cm−3 s−1 in 2018. The apparent FRs were 3–7 times lower than those obtained from the measurements with a lower limit of 3 nm of the twin differential mobility particle sizer (TDMPS) and neutral cluster and air ion spectrometer (NAIS) at the same site during previous campaigns (Shen et al., 2016a, b; Lv et al., 2018).
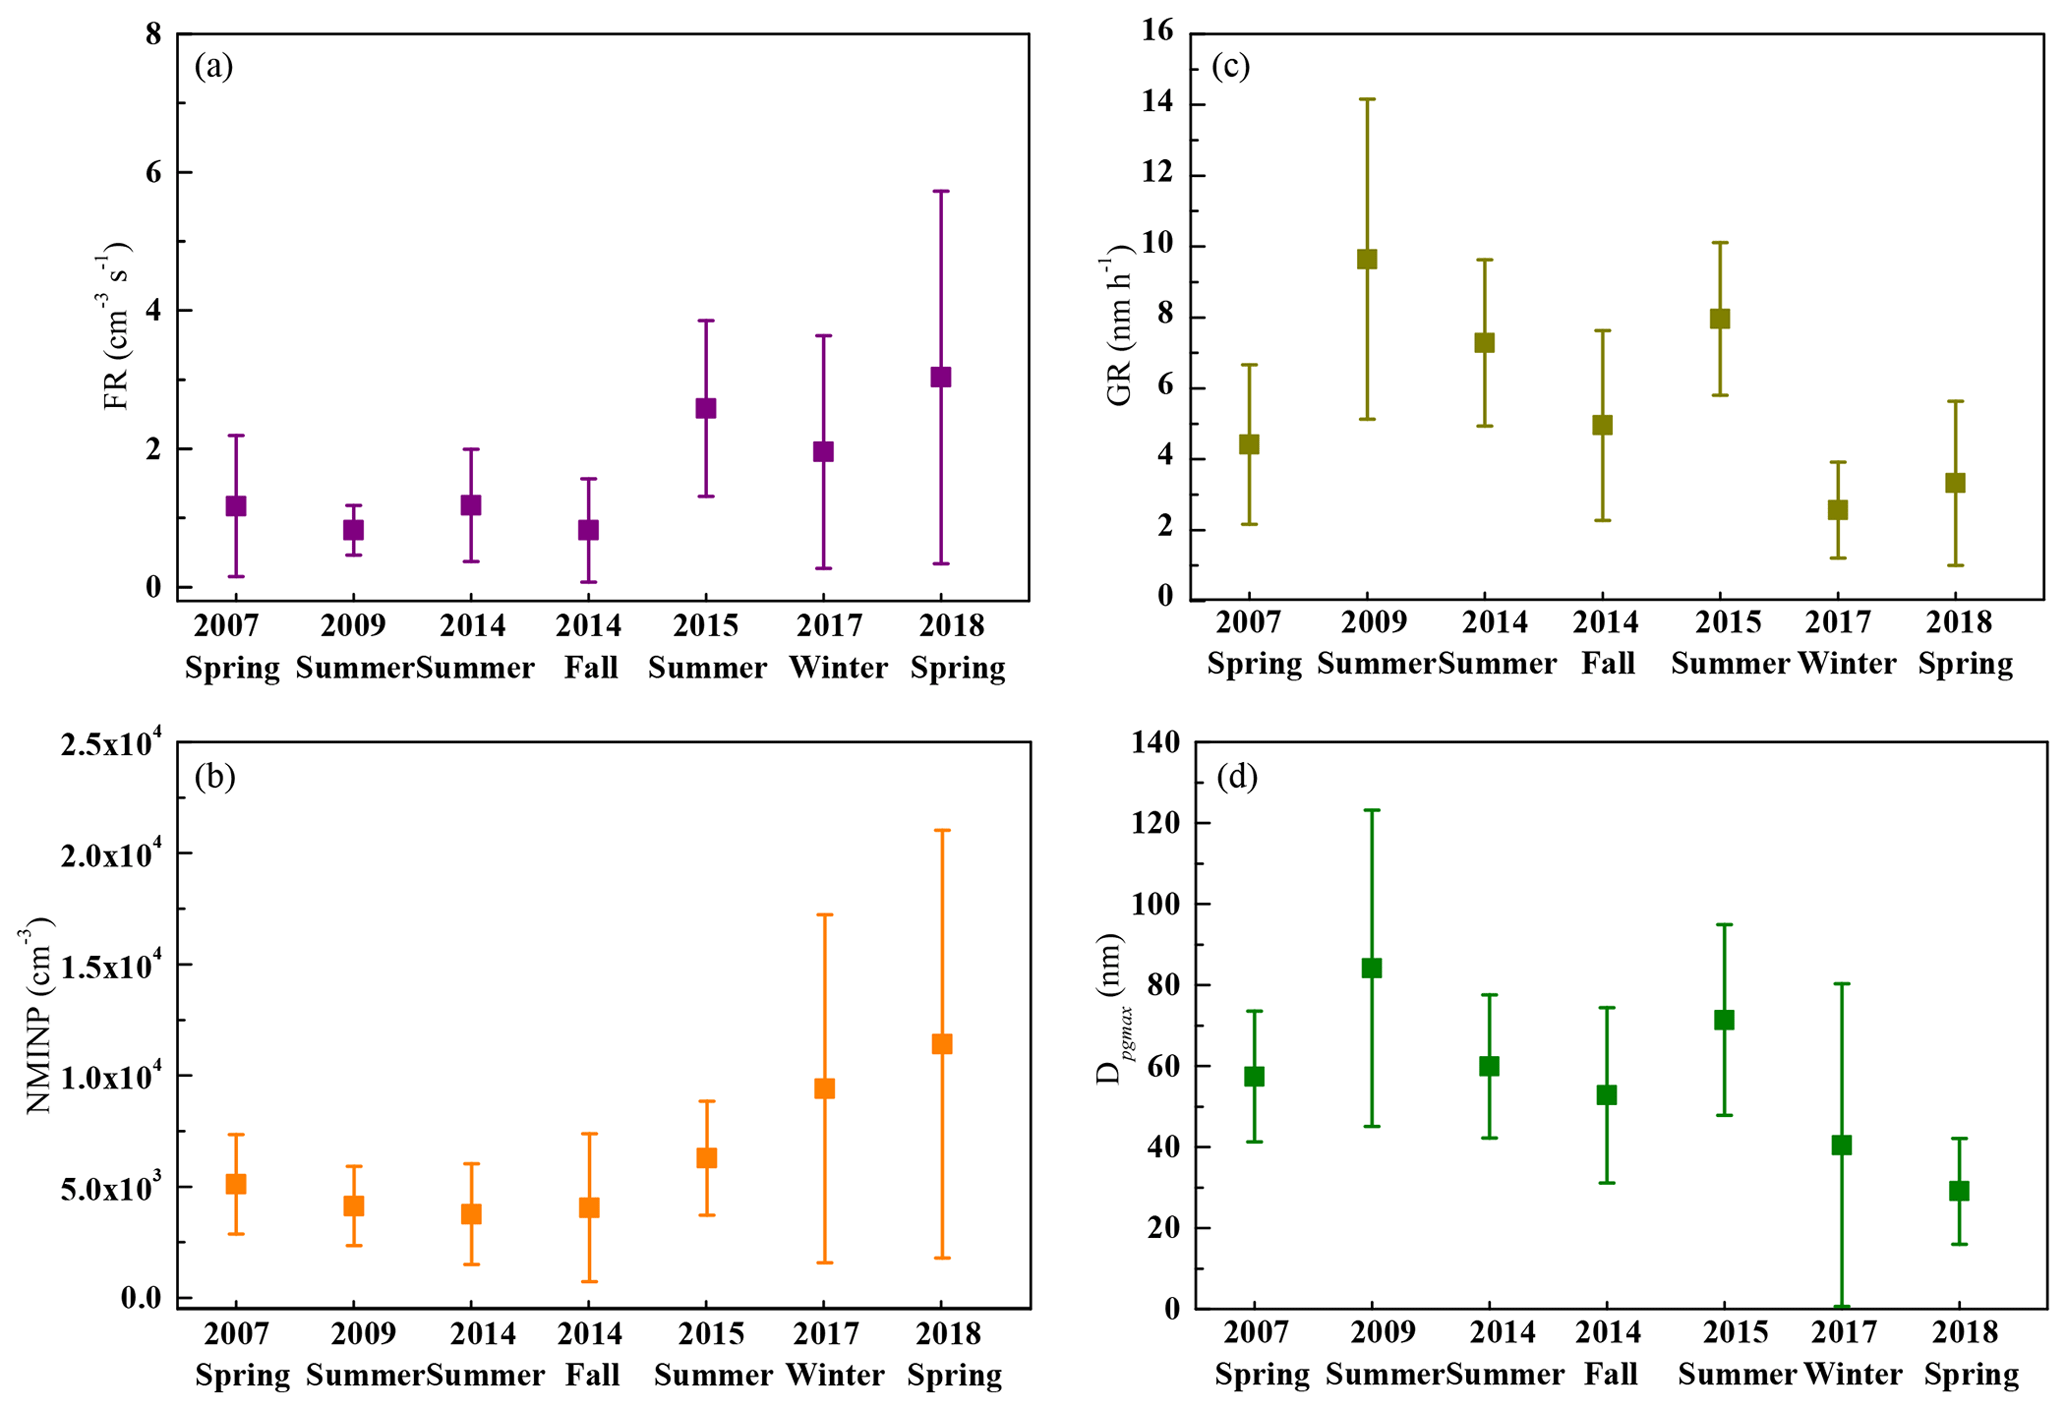
Figure 3Campaign average of the new particle formation rate (FR, a), the net maximum increase in the nucleation-mode particle number concentration (NMINP, b), the new particle growth rate (GR, c), and the maximum geometric median diameter of the grown new particles (Dpgmax, d) during the seven observation campaigns. The error bars are the standard deviations.
The NMINP showed a temporal variation pattern similar to that of the apparent FR (Fig. 3b). The campaign average NMINP varied in a narrow range of 3.8–5.1 × 103 cm−3 in 2007–2014 but then increased to 6.3 ± 2.6 × 103 cm−3 in 2015, 9.4 ± 7.9 × 103 cm−3 in 2017, and 1.1 ± 1.0 × 104 cm−3 in 2018. The increase in the NMINP should enhance the contribution of NPF events to the ambient particle number concentration, but the NMINP at Mt. Tai before 2015 was only approximately 1∕4–1∕2 of those of our previous observations in urban and marine atmospheres (Zhu et al., 2017, 2019).
The variations in GR were strongly seasonally dependent (Fig. 3c). Higher GRs were generally observed in the summer campaigns, with the three campaign averages in the range of 7.3–9.6 nm h−1. The higher GRs in summer were due to the higher photochemical reactions and biological activities, which is consistent with those reported in the literature (Kulmala et al., 2004; Chu et al., 2019). The reverse was true in winter, and a lower GR was expectedly observed in the winter of 2017, i.e., 2.3 ± 1.3 nm h−1. The GRs in the fall and spring campaigns ranked between those of the summer and winter campaigns. For example, the average GR was 4.9 ± 2.7 nm h−1 in the fall of 2014. The average GR in the spring of 2007 (4.4 ± 2.3 nm h−1) was slightly higher than that in the spring of 2018 (3.3 ± 2.3 nm h−1), although the apparent FR and NMINP increased considerably in the latter spring campaign.
The Dpgmax is partially determined by the GR. The largest campaign average Dpgmax of 84 ± 39 nm appeared as expected in the summer of 2009, followed by 71 ± 24 nm in the summer of 2015. However, the campaign average Dpgmax was only 60 ± 18 nm in the summer of 2014, followed by 57 ± 16 nm in the spring of 2007, 53 ± 22 nm in the fall of 2014, and 40 ± 40 nm in the winter of 2017. The campaign average Dpgmax in the spring of 2018 was the lowest, i.e., 29 ± 13 nm, although the campaign average GR was even larger than that in the winter of 2017. These findings indicate that Dpgmax is clearly determined not only by the GR but also by unidentified factors, which is addressed in Sect. 4.2.
In summary, we found that the apparent FR and NMINP in the spring campaign of 2018 were higher than those of 2007. The GR showed strong seasonal dependence. The Dpgmax was significantly lower in 2018, but the GR alone could not explain the lower values.
3.3 Potential contribution to CCN production from the NPF events
Direct measurements of the CCN were not available; therefore, the potential contributions of the grown new particles to the CCN population were estimated using Eqs. (2)–(4). The contributions varied considerably between campaigns (Fig. 4). In general, the NPF-derived CCNs were seasonally dependent, i.e., the highest number concentrations occurred in summer, followed by spring, fall, and winter. With an increase in the threshold diameters, roughly corresponding to a decrease in supersaturation from > 0.6 % to < 0.1 % (Li et al., 2015), the estimated contributions decreased because new particles were continuously removed either by coagulation or atmospheric deposition during the particle growth. During the three summer campaigns in 2009, 2014, and 2015, larger NPF-derived CCNs were estimated with average ΔNCCN50, ΔNCCN80, and ΔNCCN100 values of 4.4 ± 2.5 × 10³, 1.9 ± 1.5 × 10³, and 1.0 ± 0.9 × 103 cm−3, respectively. Overall, the values decreased by approximately 50 % in the spring of 2007 and the fall of 2014. The NPF-derived CCNs in these five campaigns were larger than those reported in previous studies for the same season at Mt. Chacaltaya (5240 m, Bolivia) and Botsalano (1424 m, South Africa) (Kerminen et al., 2012; Rose et al., 2017). In comparison, extremely low NPF-derived CCNs were observed in 2017 and 2018, i.e., ΔNCCN50 of only 1.1 ± 1.7 × 103 cm−3, ΔNCCN80 of 0.5 ± 0.9 × 103 cm−3, and ΔNCCN100 of 0.2 ± 0.5 × 103 cm−3.
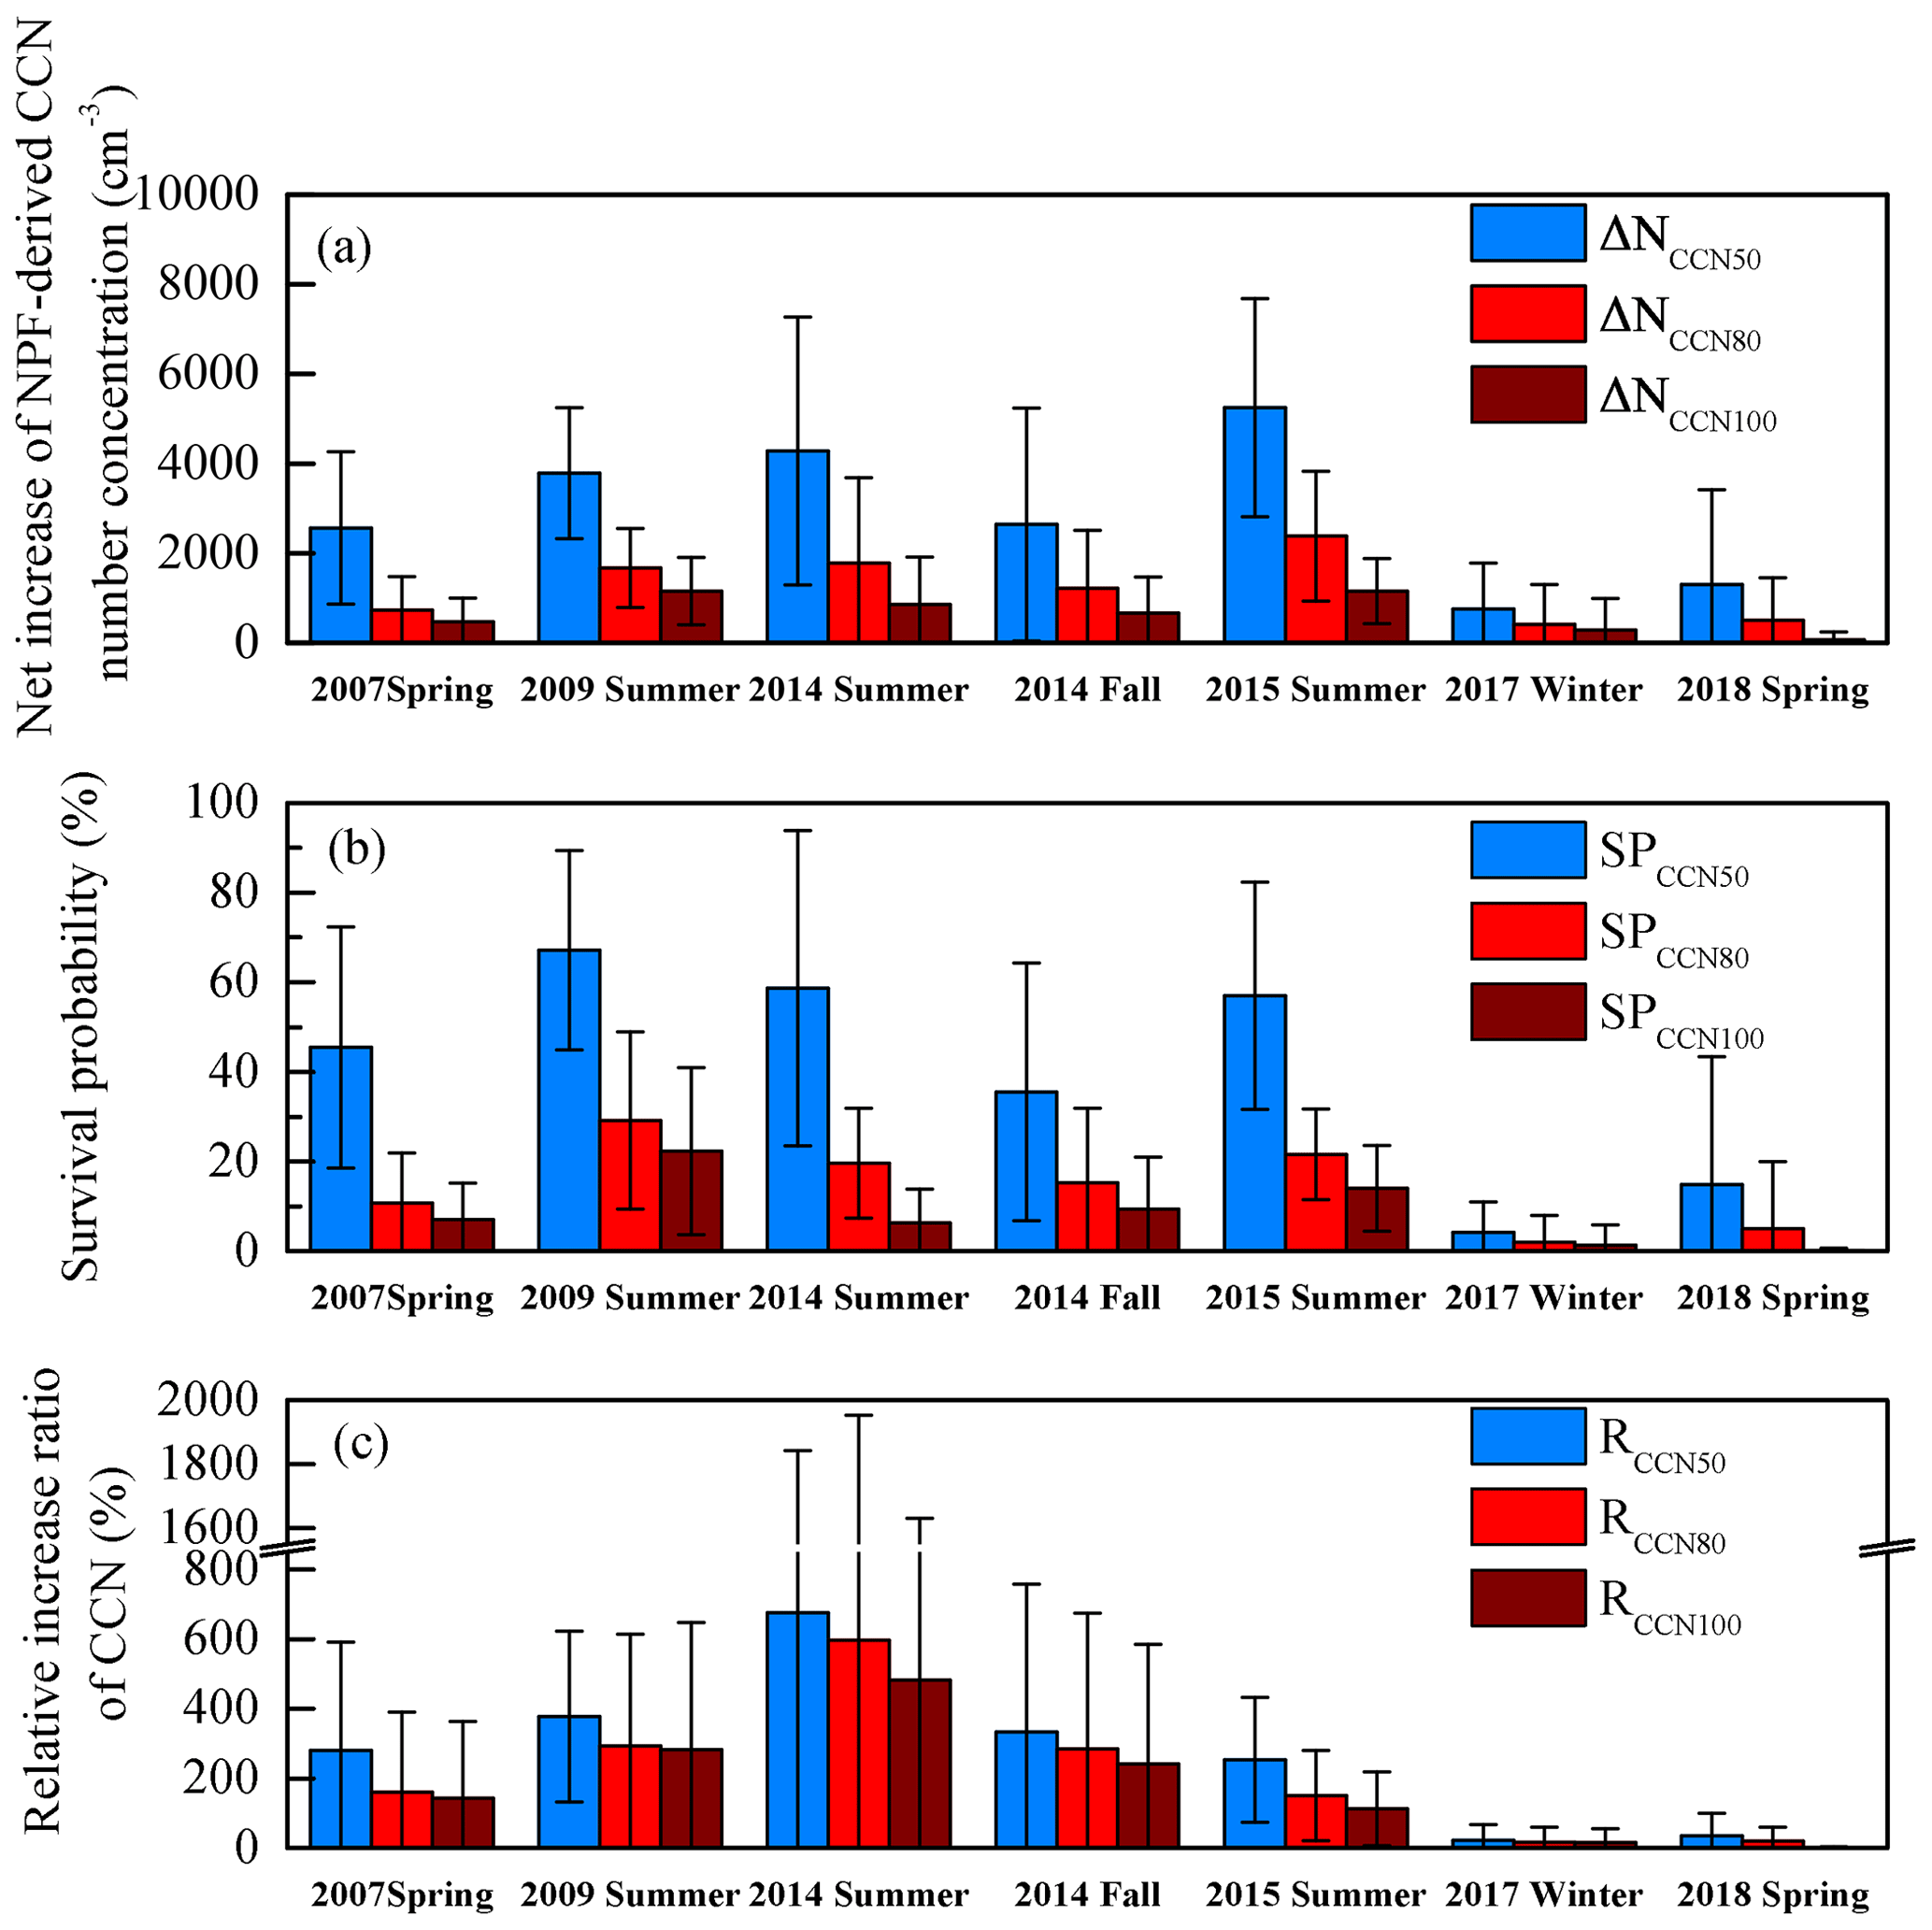
Figure 4Campaign average of the net increase in the NPF-derived CCN number concentration (ΔNCCN, a), the survival probability of new particles growing to CCN sizes (SPCCN, b), and the relative increase ratio of the CCN population (RCCN, c) during the seven observation campaigns. The error bars are the standard deviations.
High SPs were found during the three summer campaigns in 2009, 2014, and 2015, with average SPCCN50, SPCCN80, and SPCCN100 values of 61 %, 23 %, and 14 %, respectively (Fig. 4b). The SPs decreased by approximately 30 % in the spring of 2007 and the fall of 2014. In 2017 and 2018, the average SPCCN50, SPCCN80, and SPCCN100 were only 10 %, 4 %, and 1 %, respectively, indicating that only a minor fraction of new particles could grow to CCN sizes before being scavenged.
Figure 4c shows the percentage increase in the NPF-derived CCN relative to the pre-existing CCN. The percentages were the highest in the summer of 2014, e.g., 6.8 × 10² %, 6.0 × 10² %, and 4.8 × 10² % for RCCN50, RCCN80, and RCCN100, respectively. This finding could be attributed to the combination of high ΔNCCN and low number concentrations of pre-existing particles in that campaign (Figs. S8–S9 in the Supplement). In the remaining four campaigns during 2007–2015, the percentages still exceeded 100 %, i.e., 2.5 × 10² %–3.8 × 10² % for RCCN50, 1.5 × 10² %–2.9 × 10² % for RCCN80, and 1.1 × 10² %–2.8 × 10² % for RCCN100. These ratios are within the range reported in the literature (50 %–1.1 × 10³ %), although the calculation methods of the studies were slightly different (Lee et al., 2019). However, in 2017 and 2018, the percentages decreased considerably, e.g., < 40 % for RCCN50 and < 20 % for RCCN80 and RCCN100.
4.1 Question 1: what caused the unexpected responses of NPF to decreasing SO2 concentrations?
H2SO4 oxidized from ambient SO2 is one of the most important precursors for atmospheric nucleation. Decreases in ambient SO2 mixing ratios, e.g., an annual average concentration decreases from 9 to 1 ppb in Pittsburgh, 5 to 3 ppb in Rochester, and 5 to 2 ppb in Melpitz, have been reported to cause 40 %–60 % reductions in the NPF occurrence frequency and 40 %–70 % reductions in the NPF intensity (e.g., Hamed et al., 2010; Y. Wang et al., 2011; Wang et al., 2017; Saha et al., 2018). However, this was not the case at the summit of Mt. Tai, where the NPF occurrence frequencies were almost invariant in the spring of 2007, summer of 2009, winter of 2017, and spring of 2018. The observed SO2 mixing ratios in this study decreased considerably from 15 ± 13 ppb in 2007 to 1.6 ± 1.6 ppb in 2018 (the SO2 during the NPF periods decreased from 17 ± 11 to 2.8 ± 1.8 ppb, Fig. 5a). In addition, the SO2 emissions in China were reduced by approximately two-thirds from 2007 to 2018 (Fig. S1 in the Supplement), where the sharpest reduction occurred in 2015–2016 owing to stringent mitigation policies.
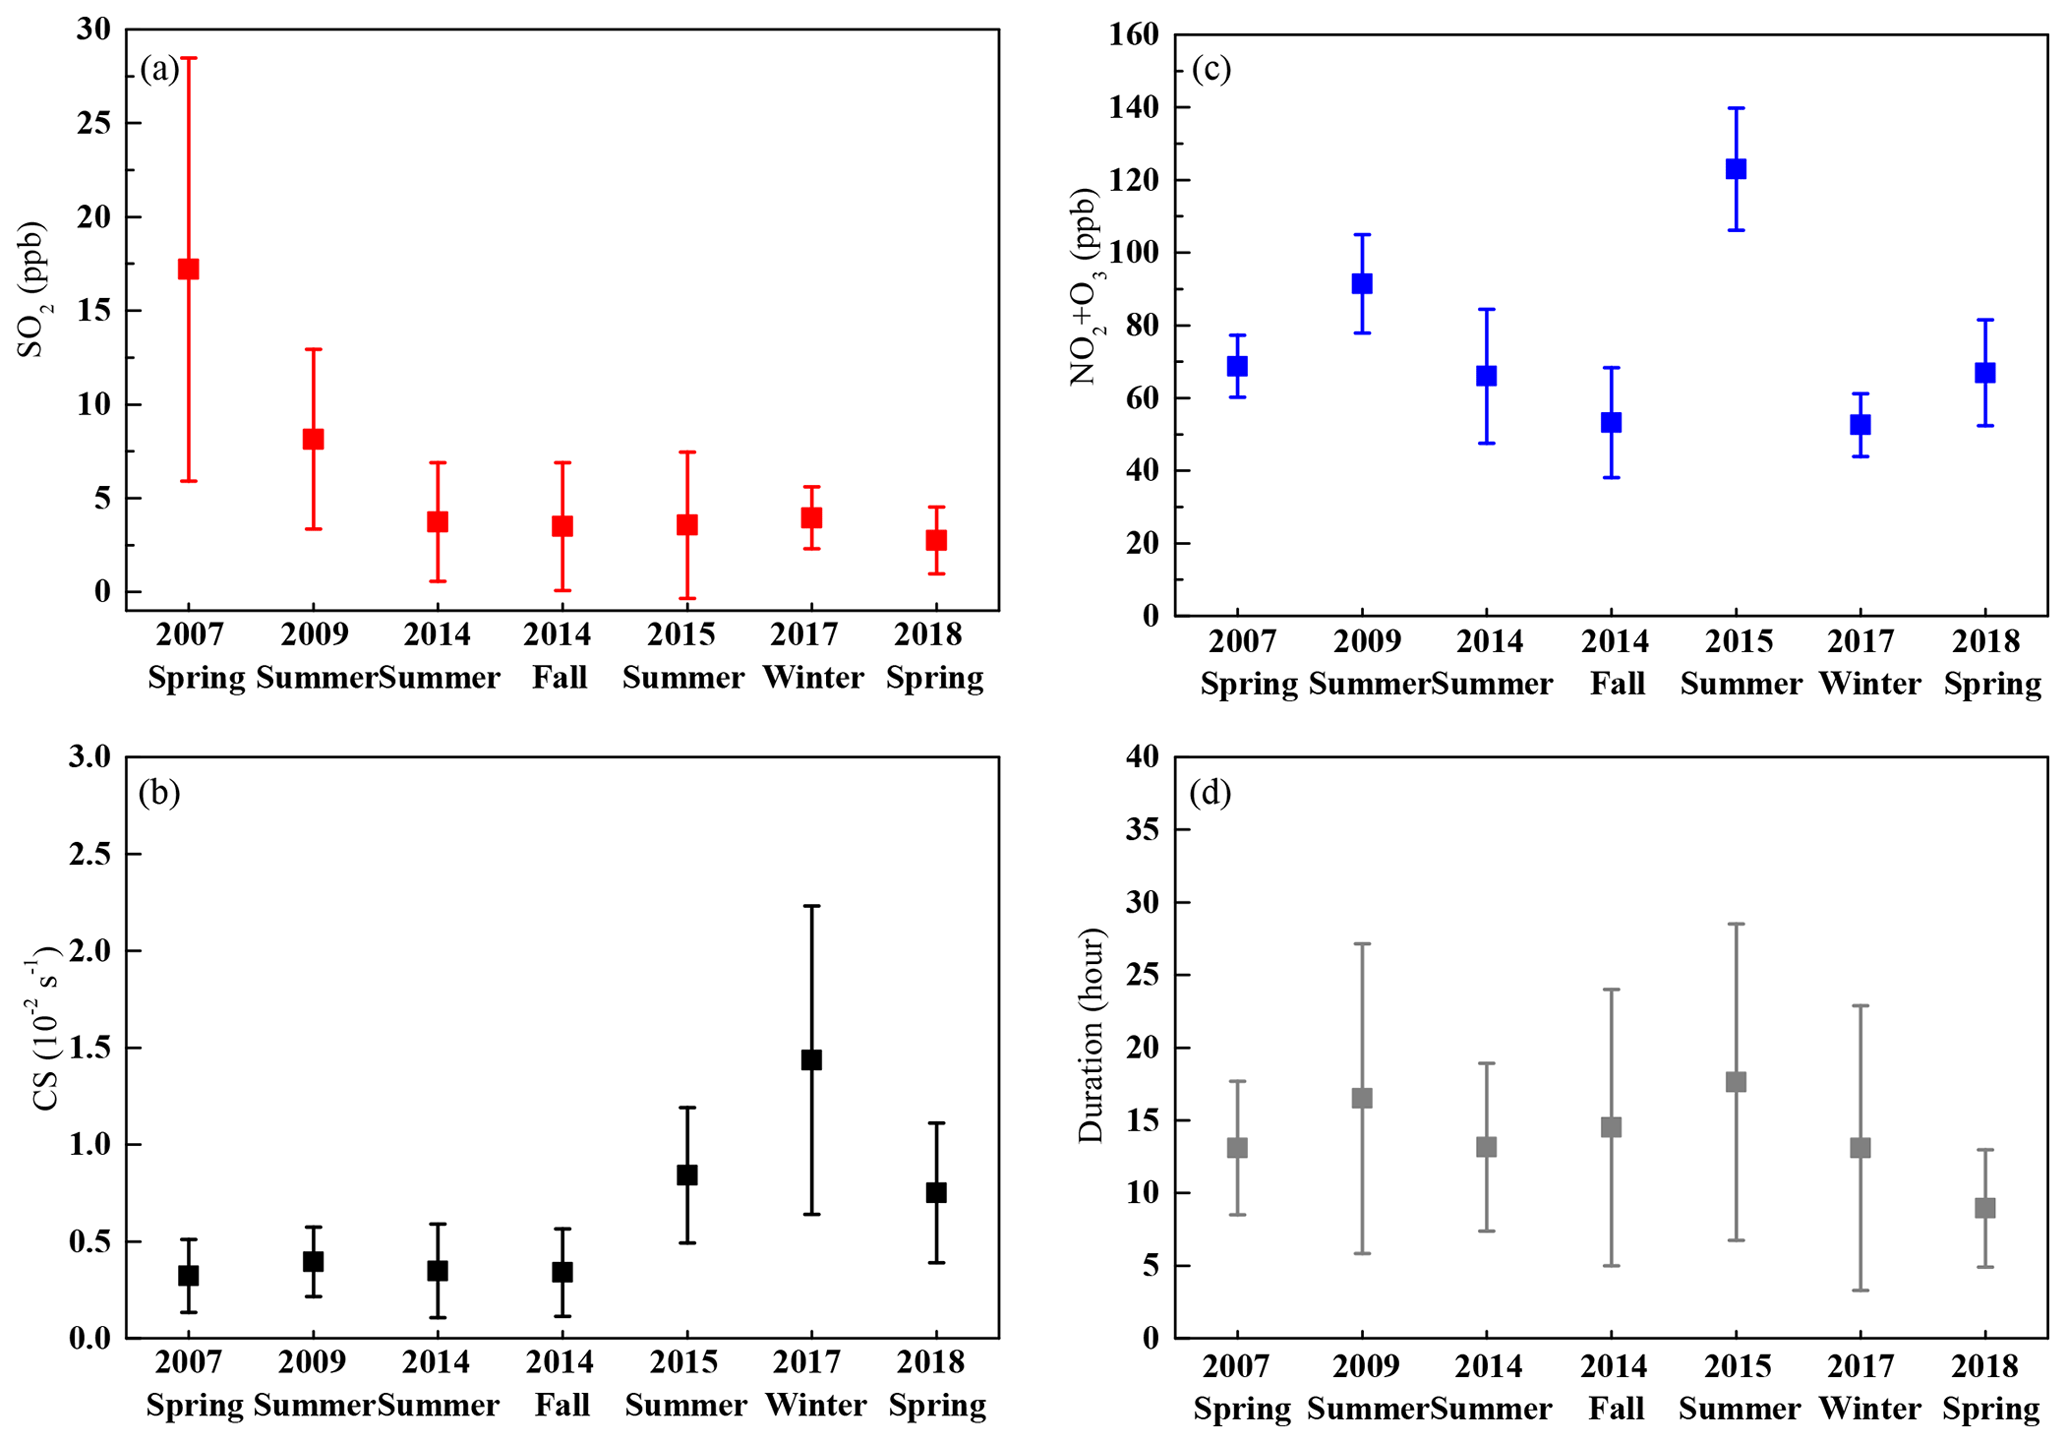
Figure 5Campaign average of SO2 mixing ratios (average during NPF periods, a), CS (1 h prior to NPF events, b), NO2+ O3 (average during new particle growth periods, c), and NPF event durations (d) during the seven observation campaigns. The error bars are the standard deviations.
As the calculated CSs before the NPF events in the 2017 and 2018 campaigns were higher than those in the 2007 and 2009 campaigns (Fig. 5b), CSs were unlikely to be the cause for the lack of decreases in the NPF occurrence frequency in 2017 and 2018. It has been reported that a low CS is not necessary to promote NPF occurrence at altitudes higher than 1000 m (Sellegri et al., 2019). Thus, other factors such as meteorological conditions and biogenic precursors (e.g., amines and highly oxidized organics) may overwhelm the effects of SO2 and CS on the NPF occurrence frequency at Mt. Tai. Note that the increased CSs in the last decade are also found on the basis of our independent unpublished measurements made at a coastal megacity of northern China, which is out of the scope of this study.
We further conducted a few statistical tests to explore the association of the apparent FR and NMINP with SO2. The correlation analysis using the campaign averages showed weak negative correlations for the apparent FRs and NMINPs with the SO2 mixing ratios (r=0.4 and 0.3, respectively; both p> 0.05). Again, these results implied that other factors overwhelmed the effect of the SO2 mixing ratios on the apparent FRs and NMINPs. When the observations were analyzed case by case, the correlations of the apparent FRs and NMINPs with the SO2 mixing ratios were even weaker, with 0.12 and −0.14, respectively (both p > 0.05). Similar results were found when the estimated H2SO4 vapor was used for correlation analysis (0.12 and −0.13, respectively; both p > 0.05). The scatter plots are shown in Fig. S10 in the Supplement.
Recall that the occurrence frequencies of NPF were also almost the same in the spring of 2007 and 2018, at high values of 50 %–51 %, implying that ambient factors in both campaigns favored NPF. Table 2 provides a comprehensive comparison of the measured air pollutants of the two spring campaigns. The decrease in the SO2, estimated H2SO4, and NH3 concentration did not explain the increases in the FRs and NMINP in 2018. Although amines were not measured, they are usually highly correlated with NH3 (Xie et al., 2018). Based on the unique roles of HOMs in enhancing atmospheric nucleation and promoting the growth of new particles (Paasonen et al., 2010; Ehn et al., 2014; Kerminen et al., 2018), it was speculated that HOMs played an important role in the unexpected responses of NPF to lower SO2 in 2018. Increased HOMs were expected on the NPF event days on the basis of the rapid afforestation over the last decade in China (Chen et al., 2019; Wang et al., 2020) and the increase in the forest areas upwind from the sampling site from the west to north. NPF events frequently took place when the air mass came from these directions(Fig. S2 in the Supplement). However, we had no measurements of HOMs. Nevertheless, the correlation between the FR and NMINP at Mt. Tai appears to support the hypothesis as presented below.
Table 2Meteorological conditions and air pollutants during the formation and growth periods of new particles in the spring campaigns in 2007 and 2018.

a Mao et al. (2009). b Z. Wang et al. (2011). c Dong et al. (2020).
During the 106 cases of NPF events, the apparent FR and NMINP showed a good linear correlation (r=0.84, p < 0.01) (Fig. 6). The fitted equation was highly consistent with those derived for urban and marine atmospheres (Man et al., 2015; Zhu et al., 2017, 2019; Ma et al., 2020). The strong linear relationship between the apparent FR and NMINP suggested that H2SO4 vapor was sufficient for nucleation, and the NPF intensity was very likely determined by the abundance of organic vapors available for participating in nucleation. Following the equation in the literature, i.e., FR =kNucOrg[H2SO4]m [NucOrg]n (where kNucOrg is a constant, and m and n are integers; Zhang et al., 2012), the apparent FR is controlled by the concentrations of both H2SO4 vapor and organic vapor. We then considered two technical terms, i.e., the total concentration of H2SO4 vapor and the consumed amount of H2SO4 vapor for NPF. Unlike the apparent FR, the NMINP was always determined by the consumed amount of H2SO4 vapor, which may or may not have a positive correlation with the total concentration of H2SO4 vapor. The linear correlation between the FR and NMINP suggests one possibility, i.e., the H2SO4 vapor was sufficient and the availability of organic vapor determined both the FR and the consumed amount of H2SO4 vapor proportional to the NMINP. Previous field measurements have shown that gaseous H2SO4 at concentrations of 105 molecules cm−3 is necessary for NPF (McMurry et al., 2005; Nieminen et al., 2009; Erupe et al., 2010; Lee et al., 2019). In this study, the estimated H2SO4 concentration was in the range of 106–107 molecules cm−3 and was theoretically sufficient for NPF (Table 2). Under other conditions, poor correlations are expected between the FR and NMINP, e.g., with FR > 8 cm−3 s−1 reported in previous studies (open markers in Fig. 6).
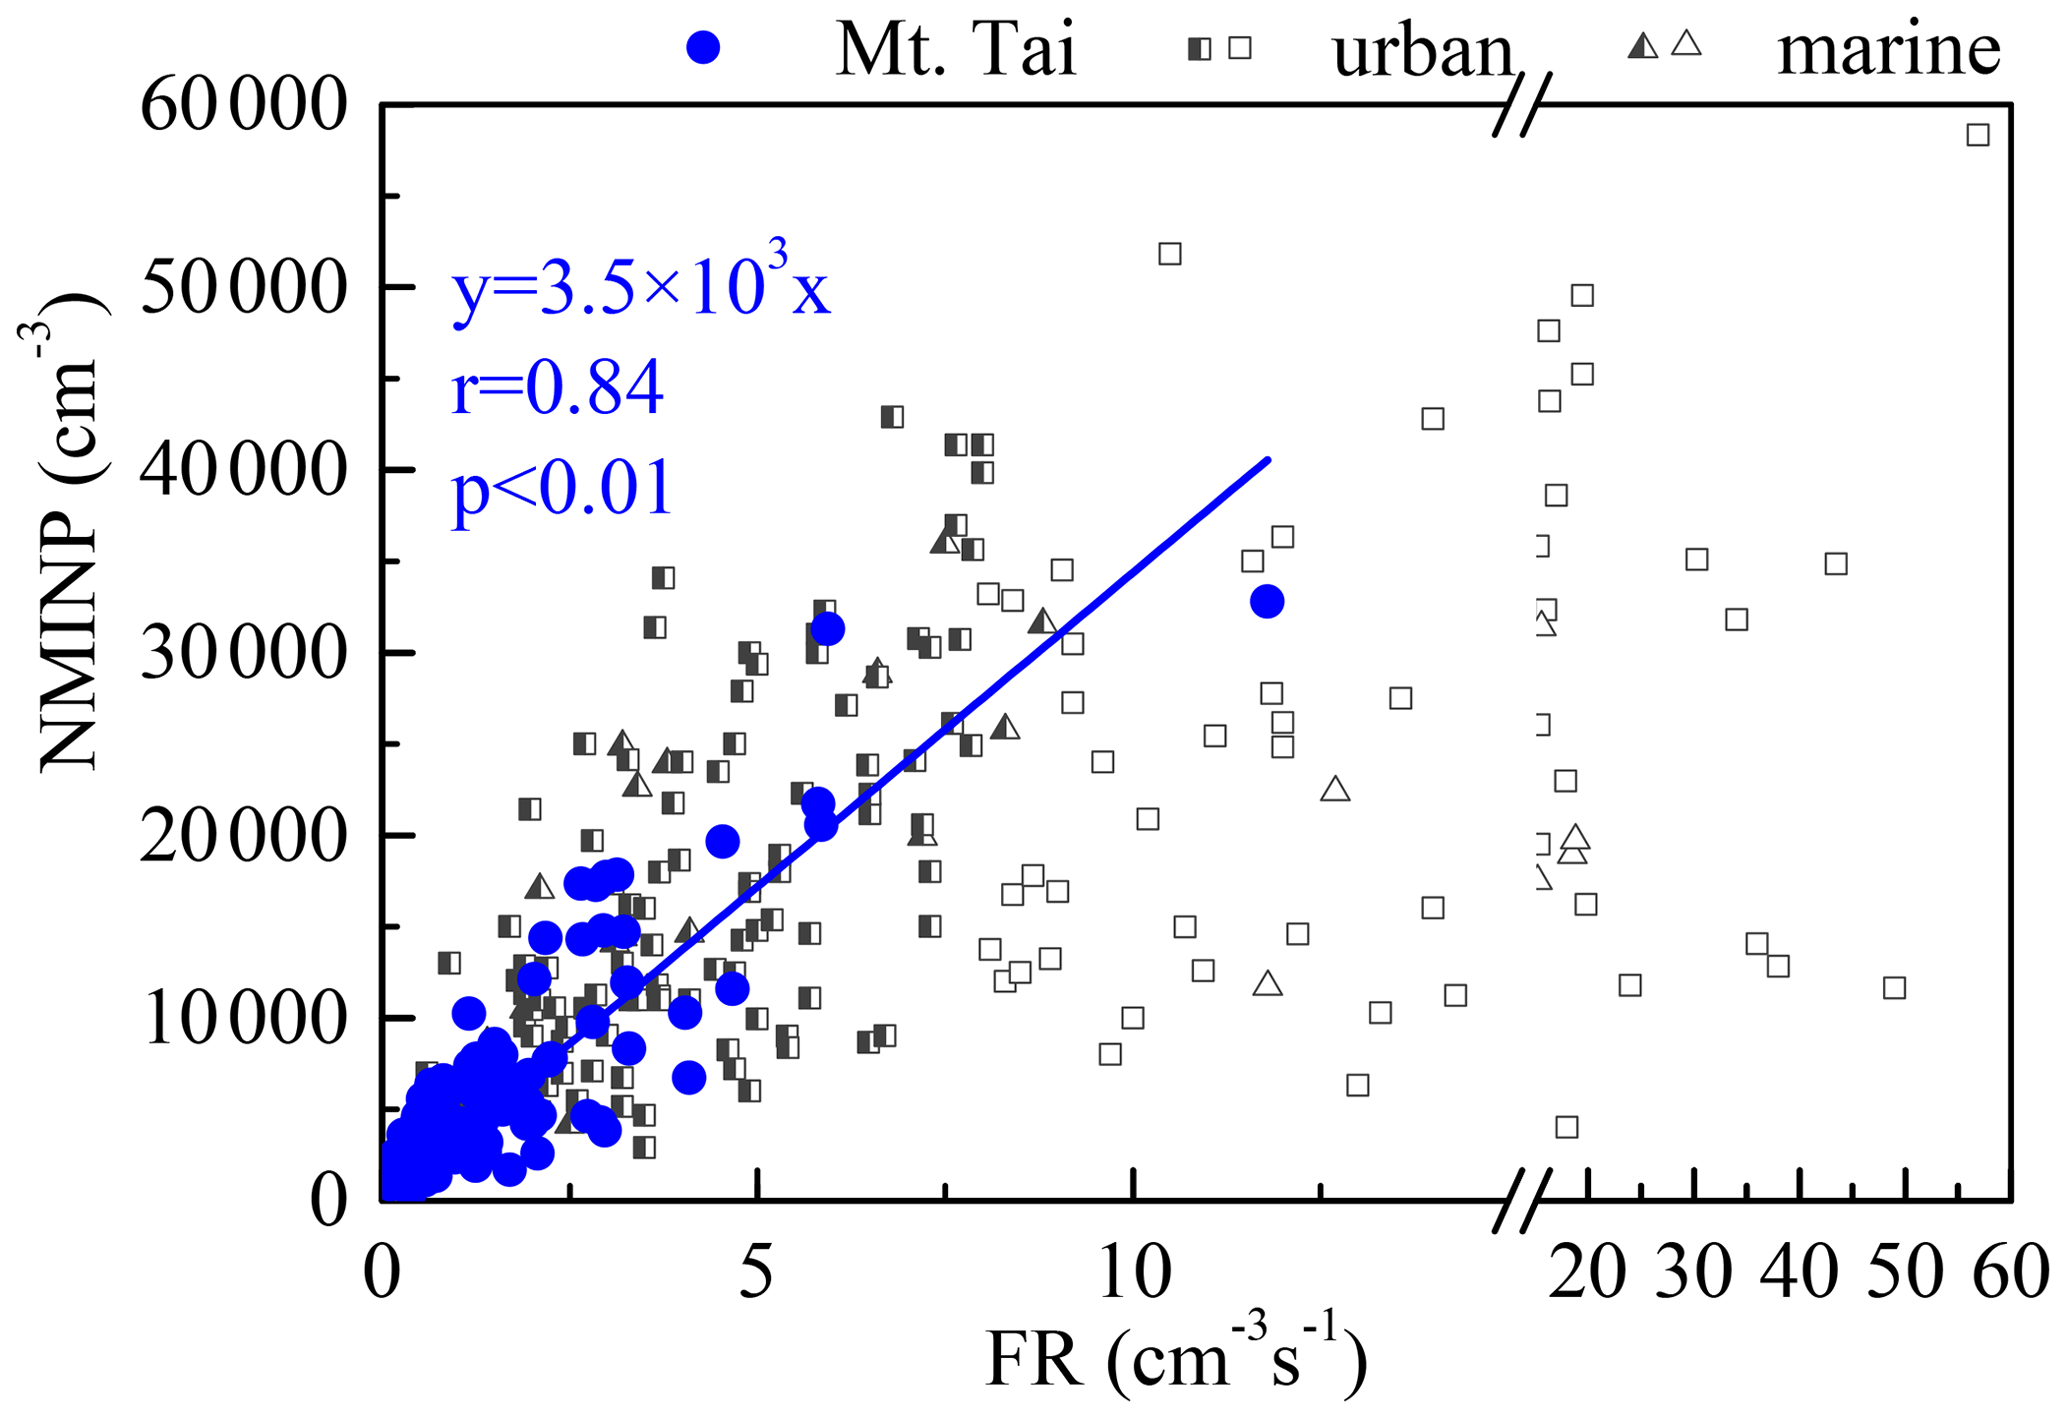
Figure 6Relationship between the FR and NMINP in 106 cases of NPF events at Mt. Tai in this study and in urban and marine atmospheres in previous studies (Man et al., 2015; Zhu et al., 2017, 2019; Ma et al., 2020). The half-solid markers can be fitted linearly in previous studies. The open markers show poor correlations.
Previous studies have reported that the BVOC emissions over the NCP have increased in the last decade because of the afforestation and accelerating global warming (Stavrakou et al., 2014; Ma et al., 2019). During our observations, the total VOCs (including C2–C10) mixing ratios approached 16.1 ± 6.5 ppb in the 2018 spring campaign, which was almost double that (including C4–C12) in the June 2006 campaign (Mao et al., 2009; no data from the spring 2007 campaign were available). The difference was reasonably consistent with the large increase in forest area over the last decade across the whole of China, especially that high BVOC emissions are expected in summer. Note that a discrepancy may also exist between chemical analysis results of VOCs in different labs. However, a large knowledge gap between the increase in BVOC emissions and the increase in nucleating organics still exists because of a lack of studies. Thus, the unexpected response of NPF events to reduced SO2 is still unexplained, and more measurements of H2SO4 and organics (e.g., HOMs) are needed. Note that the campaign average PM2.5 mass concentration in 2018 indeed decreased. The decrease was apparently determined by the decrease in > 153 nm particles since no significant difference existed in the calculated CS based on < 153 nm particles between 2007 (0.32 ± 0.19 × 10⁻² s−1) and 2018 (0.40 ± 0.15 × 10⁻² s−1).
4.2 Question 2: did the contribution of NPF events to the CCN population decrease considerably with decreasing SO2?
Based on the observations alone, the Dpgmax and the contribution of NPF to the CCN population decreased considerably with decreasing SO2. However, the growth behaviors of new particles after the new particle signals disappeared from the observations were unknown. Thus, we further analyzed the Dpgmax in terms of the correlations with the calculated particle GR, the observation duration of the NPF events on site, and the underlying atmospheric processes.
Theoretically, the Dpgmax should be a function of the GR and the NPF duration. The GR is determined by real-time concentrations of condensation vapors, whereas the Dpgmax is determined by the availability of condensation vapor over a certain long period, both of which are influenced by the concentration of oxidants (Zhang et al., 2012, Apsokardu and Johnston, 2018). In this study, a moderate correlation was observed between Dpgmax and GR (r=0.58, p< 0.01). The low r value suggested that the GR alone does not determine the Dpgmax. When one outlier was removed, r increased to 0.66 (Fig. 7a). In addition, the GR had a positive correlation with the total oxidant concentration (Ox= NO2 + O3) but with an r as low as 0.38 (p < 0.01) (Fig. S11 in the Supplement). Additionally, the Dpgmax and the duration of NPF events also showed good correlation (r= 0.67, p < 0.01) (Fig. 7e). Our results imply that both the real-time concentrations and the continuous supply of condensation vapor play dominant roles in the growth of new particles to the CCN size.
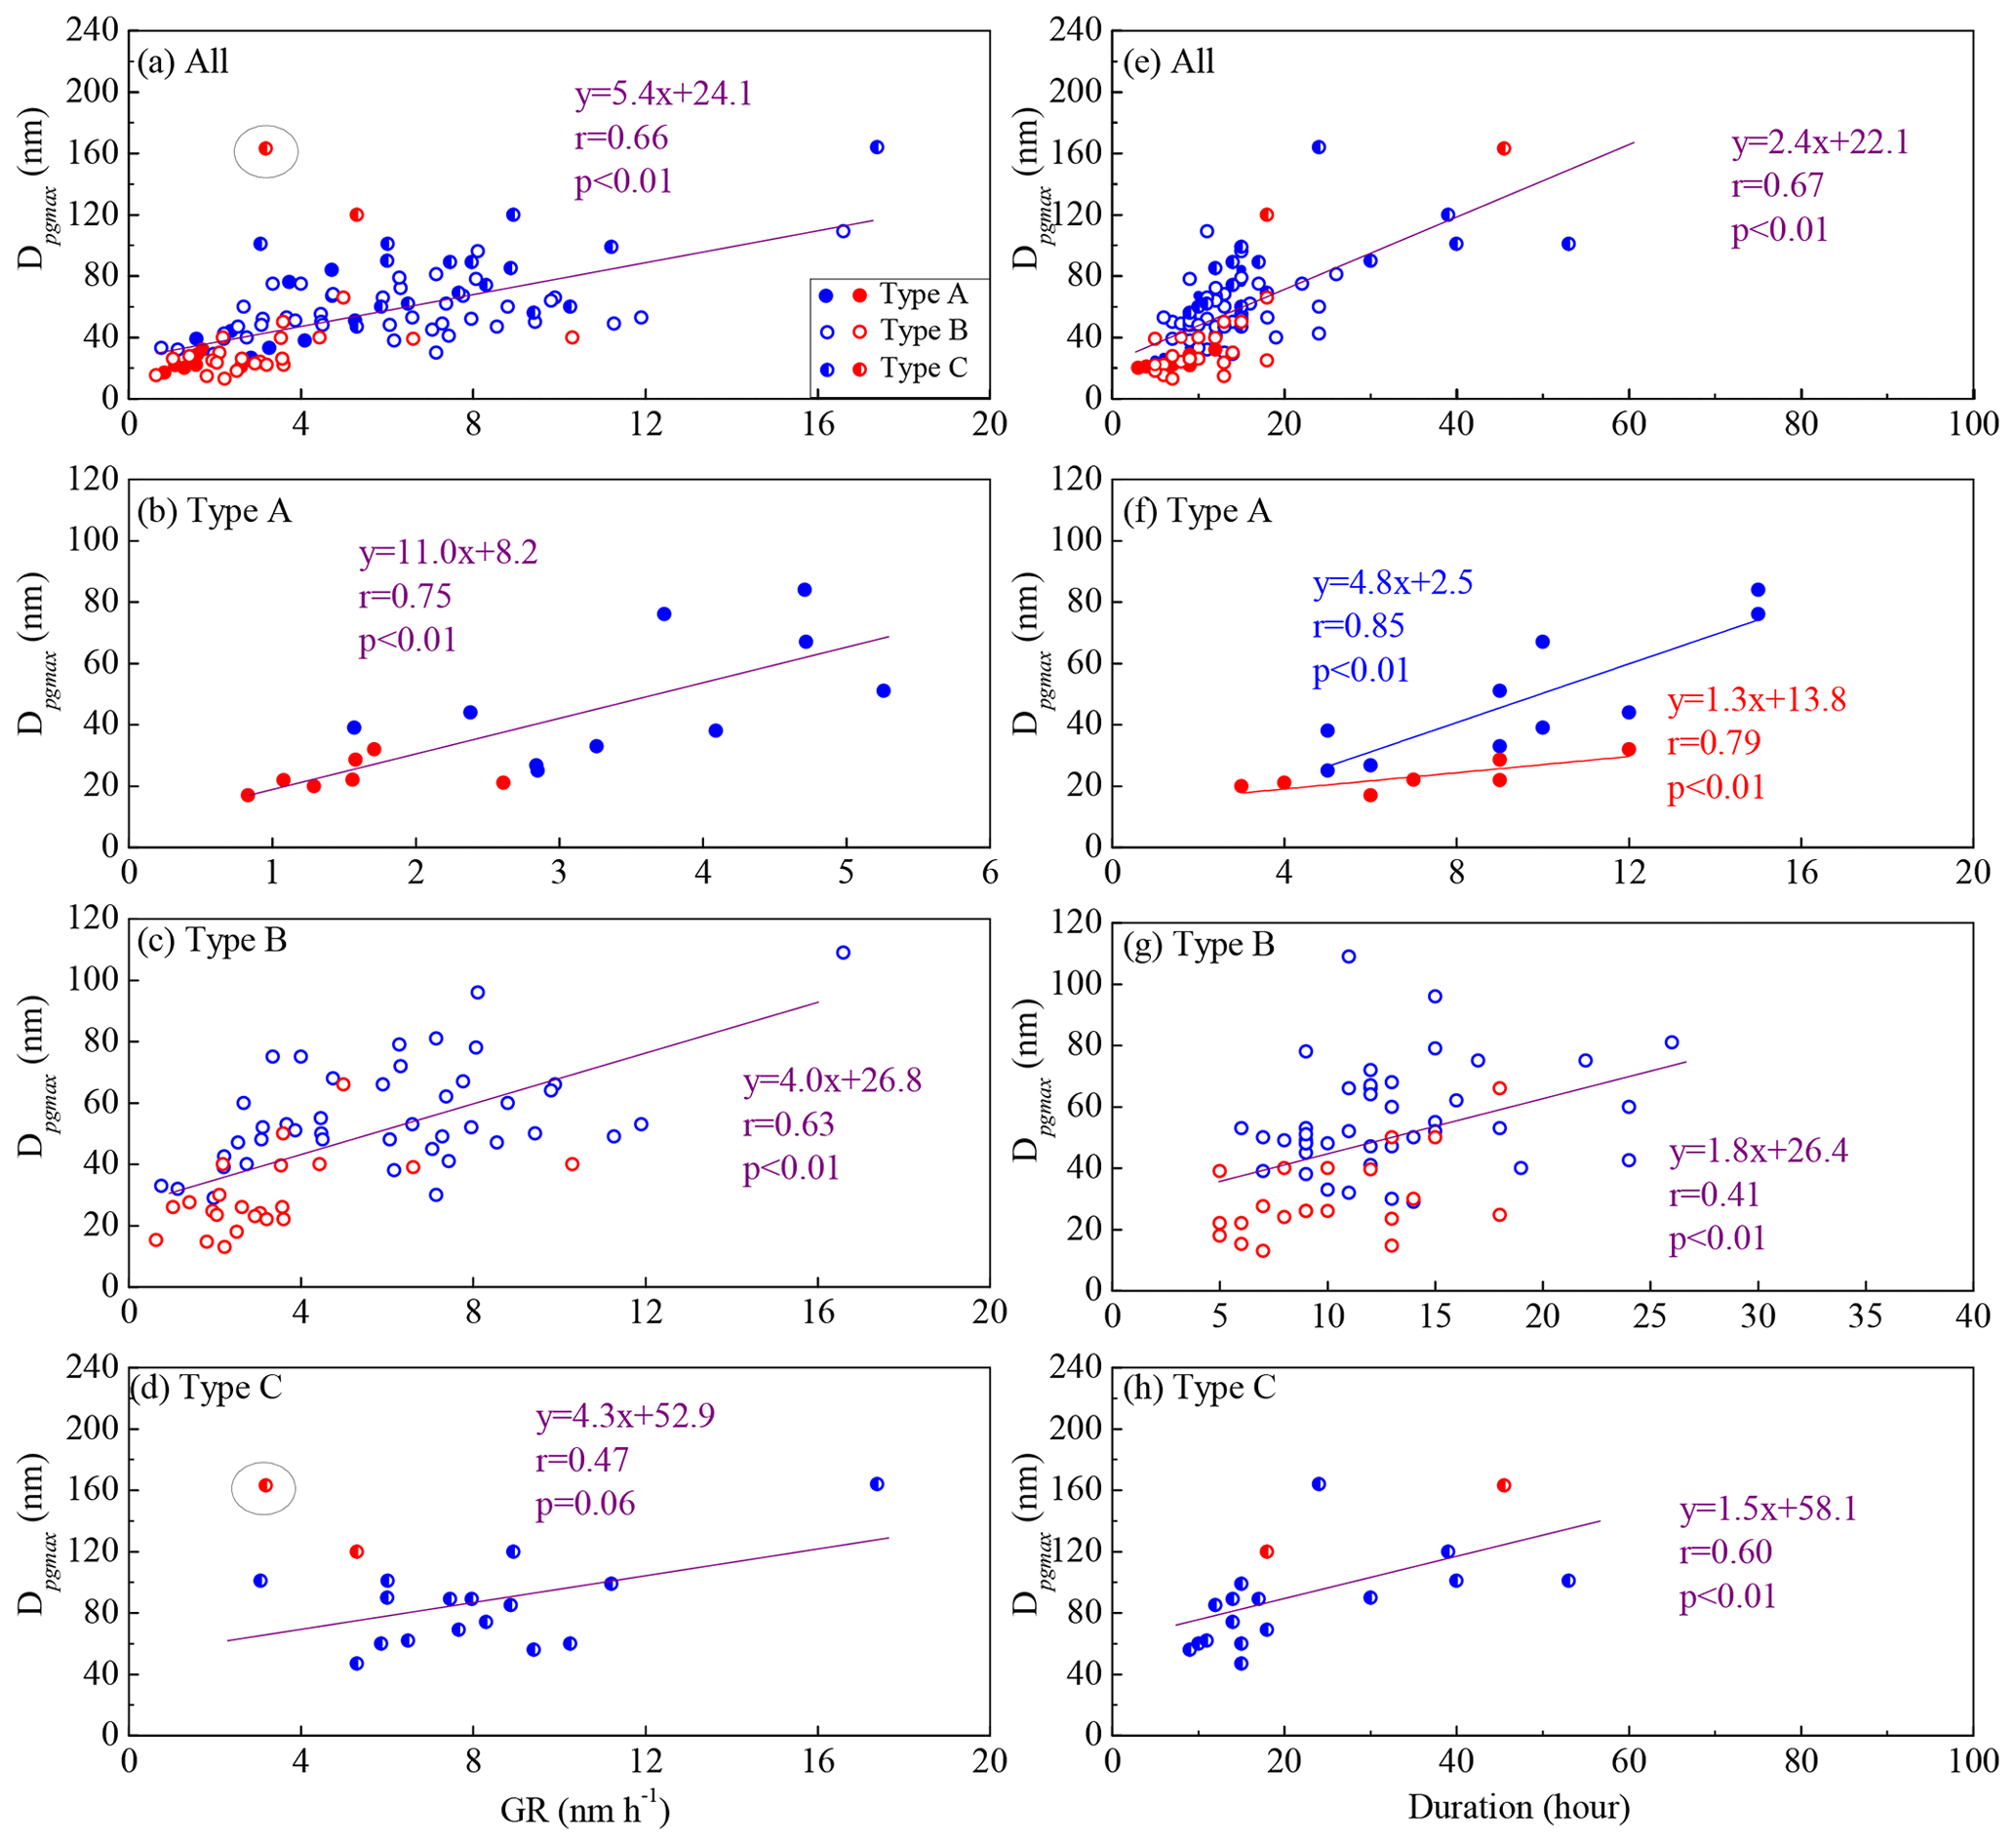
Figure 7Relationship between the GR and Dpgmax (a–d) and between the duration of NPF events and Dpgmax (e–h). Solid markers represent Type A, empty markers represent Type B, and half-solid markers represent Type C. Red markers and equations represent 2017 and 2018, and blue markers and equations represent 2007–2015. The purple equation represents fitting of all data, and the circled marker represents an outlier from the equation fit.
In further analysis, we considered three situations of the new particle growth. Type A (full marker in Fig. 7) represents that new particles continuously grow to the size of Dpgmax until the new particle signal drops to a negligible level. Type B (empty marker) represents the NPF events in which the growth of new particles is similar to that in Type A before Dpgmax is reached. After Dpgmax is reached, the grown new particles in Type B can still be observed for one more hour, after which either the growth stops for over 1 h or the particles start shrinking to a smaller size until the new particle signal disappears. Type C (half-full marker) represents the NPF events that are not subject to Type A or B. Multistage growth of new particles can be observed for Type C particles. A few examples of the three types are shown in Fig. S12 in the Supplement. We also separated the observations in 2017 and 2018 (in red) from those in 2007–2015 (in blue).
For Type A, the average GR and Dpgmax in 2017–2018 were only 1.5 nm h−1 and 23 nm, respectively, significantly lower than the 3.5 nm h−1 and 48 nm values observed in 2007–2015 (p < 0.01). When the regression equation of the GR and Dpgmax is examined, i.e., Dpgmax = 11.0 × GR+8.2 with a moderately good r, newly formed particles appear to grow beyond 50 nm only when the GR exceeds 3.8 nm h−1 in Type A. There was no significant difference between the duration of NPF events in 2017–2018 and that in 2007–2015. However, based on the regression equations between the duration and Dpgmax obtained in 2007–2015 and 2017–2018, newly formed particles could grow beyond 50 nm only when the NPF duration exceeded 9.9 h in 2007–2015, but the duration in 2017–2018 had to exceed 27.8 h. As reported in the literature, the lifetime of 50 nm particles in the boundary layer is approximately 1 d, while that in the free troposphere is much longer (Williams et al., 2002). It can be argued that the new particles in Type A of 2007–2015 may still have been able to grow to the CCN size even after the new particle signal disappeared from the observation. However, the lifetime of 20 nm particles in the boundary layer is only several hours (Williams et al., 2002). If the Type A NPF events in 2017–2018 occurred in the boundary layer, the new particles may not have been able to grow to the CCN size before being scavenged from the ambient air. If they occurred in the free troposphere, the longer lifetime may have allowed the new particles in some events to be able to grow to the CCN size. For example, the NPF event on 21 March 2018 ended with an increase in the wind speed and a change in the wind direction, and the number concentration of new particles remained at a high level. The air mass back trajectories passed through the NCP at a high altitude (> 1700 m a.g.l) at the beginning and end of the NPF event (Fig. S12a, b in the Supplement). In addition, the spikes of PNSDs during this NPF event indicated the vertical transport of atmospheric particles (Meng et al., 2015; Shen et al., 2020). We inferred that this NPF event seemingly occurred in the free troposphere, and a large decrease in the entrainment from the free troposphere to the boundary layer may have led to the disappearance of the new particle signal. Recent aircraft and airship measurements in northern and eastern China suggested that NPF events sometimes occurred in the free troposphere and then mixed down to the boundary layer (Quan et al., 2017; Qi et al., 2019).
In the case of Type B, the GR and Dpgmax in 2017–2018 (the mean values of 3.2 nm h−1 and 29 nm, respectively) were significantly lower than those in 2007–2015 (6.1 nm h−1 and 56 nm, respectively; p < 0.01). Following the regression equation of Dpgmax against GR, newly formed particles in Type B could grow beyond 50 nm only when the GR exceeded 5.8 nm h−1. The number concentrations or the sizes of new particles decreased considerably at the end of Type B NPF events, and the transient time for the decrease suggested that the events occurred in the boundary layer. For example, the air mass back trajectories at the end of the NPF on 7 April 2018 originated from low altitude and the height varied greatly over time (Fig. S12c, d in the Supplement). Most of the Type B NPF events in 2017–2018 may have had less opportunity to contribute to the CCN population if they indeed occurred in the boundary layer. However, aircraft measurements are needed to confirm the altitude at which the NPF events occur. In addition, the changed boundary layer height had no detectable influence on Dpgmax, as shown in Fig. S12 in the Supplement. However, the change in the late afternoon may largely decrease the observed number concentrations of grown new particles.
Type C was characterized by the largest GR, duration, and Dpgmax, with mean values of 7.7 nm h−1, 22 h, and 92 nm, respectively. These particles underwent multiple growth processes, complicating the correlation between GR and Dpgmax, and that between duration and Dpgmax. The air mass back trajectories at the end of the NPF event on 30 September 2014 were local and originated at a low altitude (Fig. S12e, f in the Supplement), implying that these new particles experienced sufficient growth within the boundary layer. There were 16 Type C NPF events during 2007–2015 and only two in 2017. The lack of Type C NPF events in 2017–2018 implies a significant decrease in the contribution of new particles to the CCN population.
The factors influencing the lower Dpgmax and NPF-derived CCN population in 2017–2018 were further explored. In the literature, the growth of newly formed particles is mainly attributed to sulfuric acid, ammonium nitrate, and secondary organic compounds (Wiedensohler et al., 2009; Riipinen et al., 2011; Zhang et al., 2012; Ehn et al., 2014; Man et al., 2015; Wang et al., 2015; Burkart et al., 2017; Lee et al., 2019; Wang et al., 2020). As listed in Table 2, the contribution of H2SO4 vapor to particle growth decreased from 36 % in the spring of 2007 to 11 % in the spring of 2018, indicating an inevitable consequence of decreasing SO2 emission on particle growth. However, this percentage is likely not high enough to explain the 50 % decrease in the GR and Dpgmax of Types A and B. On the other hand, the reduction in SO2 and sulfate may reduce the aerosol acidity, subsequently affecting the acid-enhanced uptake of semivolatile organic species (Ding et al., 2011; Stangl et al., 2019). This hypothesis is supported by the lower level of organic carbon (OC) in PM2.5 found in the spring of 2018 (5.5 ± 2.0 µg m−3) than that in the spring of 2007 (6.1 ± 3.0 µg m−3), although the BVOC emissions over the NCP have reportedly increased in recent years (Table 2, Z. Wang et al., 2011; Stavrakou et al., 2014; Ma et al., 2019; Dong et al., 2020). Furthermore, the mass concentration of nitrate in PM2.5 was 7.4 ± 4.8 µg m−3 in 2007 during the new particle growth period, and it slightly decreased to 6.7 ± 5.5 µg m−3 in 2018. The reduced nitrate may also be partially responsible for the lack of Type C in 2018. In summary, we argued that the reduced H2SO4 vapor, nitrate, and OC formation (most likely because of reduced anthropogenic emissions) may have led to the SP of new particles in the spring campaign of 2018 being lower than that of 2007. Unfortunately, chemical data about size-segregated molecular constituents are not available to confirm this finding, and therefore, more refined observations are urgently needed in the future.
However, uncertainties still exist, e.g., (1) the data were obtained in seven independent campaigns, each lasting 18–71 d, and the data size did not allow us to extend the conclusion to all the years from 2007 to 2018; and (2) the observations were conducted only at one site, alternating between the boundary layer and the free troposphere, and the generality of the conclusions on NPF events needs to be examined at more sites.
With an order of magnitude reduction in SO2 emissions, the NPF frequency observed at the summit of Mt. Tai remained relatively constant during the seven campaigns from 2007–2018. The calculated campaign-based FR and NMINP were 0.8–1.2 cm−3 s−1 and 3.8–5.1 × 103 cm−3 in 2007–2014 and then unexpectedly increased by a factor of 2–3 in 2017–2018 to 2.0–3.0 cm−3 s−1 and 0.9–1.1 × 104 cm−3, respectively. However, the large increase in the NPF intensity was accompanied by a smaller probability of the particles growing to the CCN size. The number concentrations of NPF-derived CCN with the three threshold sizes of 50, 80, and 100 nm were estimated to be 3.7 × 10³, 1.6 × 10³, and 8.6 × 102 cm−3 in the 2007–2015 campaigns, which then decreased to 1.0 × 10³, 4.6 × 10², and 1.8 × 102 cm−3, respectively, in the 2017–2018 campaigns. When the three types of NPF events are separately considered, it remains uncertain whether the new particles in Type A can grow to the CCN size after the disappearance of the new particle signals from observations. No conclusion can be drawn on this issue based on the current limited chemical observations. However, the new particles in Type B may have less opportunity to grow to the CCN size before they are scavenged from the ambient air. The lack of Type C NPF events in the campaigns from 2017–2018 indicates a large decrease in the probability of new particles growing to the CCN size with the reduction in ambient air pollutants. Moreover, the shorter durations of the NPF events in the campaigns from 2017–2018 imply that the events occurred over a smaller spatial scale.
We hypothesize that the NPF intensity increased unexpectedly with the reduction in SO2 concentration, as the net production of NPF seems to be determined mainly by the availability of organic precursors for participating in nucleation and initial growth. This is reasonably consistent with the increase in forest areas over the last decade across China through rapid afforestation. The strong correlation between the FR and NMINP strongly supports this hypothesis, which needs to be further confirmed by direct observations of molecular organic vapors. The decrease in the percentage of new particles growing to the CCN size with increasing NPF intensity in 2017–2018 implies the complexity of the growth of new particles with reduced emissions of anthropogenic precursors under a large-scale increase in BVOC emissions. Overall, this study provides unique observational results regarding NPF at a regional mountaintop site in the NCP from reasonably large datasets. Based on the unique results, we comprehensively analyzed the possible causes and proposed new challenges in determining the underlying mechanisms of the contributions of new particles to ambient particle number loading and CCN populations with reduced anthropogenic emissions.
The datasets related to this work can be accessed via https://doi.org/10.17632/wf3wjvpfw7.1 (Zhu et al., 2021).
The supplement related to this article is available online at: https://doi.org/10.5194/acp-21-1305-2021-supplement.
LX designed the research. JC and JG conducted the field observations in 2007, 2014, and 2015. XW, HL, YZ, ZG, TC, LW, PZ, and YS carried out the field measurements in 2009, 2017, and 2018. YZ analyzed the data and wrote the paper. XY, TW, and WW helped with the interpretation of the results. XY and LX revised the original manuscript. All authors contributed toward improving the paper.
The authors declare that they have no conflict of interest.
This work was funded by the National Key Research and Development Program of China (2016YFC0200500), the National Natural Science Foundation of China (41922051, 42075104, 41706122), Shandong Provincial Science Foundation for Distinguished Young Scholars (ZR2019JQ09), State Key Laboratory of Organic Geochemistry, GIGCAS (SKLOG-201914), and the Jiangsu Collaborative Innovation Center for Climate Change. We appreciate the NOAA Air Resource Laboratory for providing the HYSPLIT model and thank the staff of the Mt. Tai Meteorological Station for the help during the measurement campaigns.
This research was supported by the National Key Research and Development Program of China (grant no. 2016YFC0200500), the National Natural Science Foundation of China (grant nos. 41922051, 42075104 and 41706122), the Shandong Provincial Science Foundation for Distinguished Young Scholars (grant no. ZR2019JQ09), and the State Key Laboratory of Organic Geochemistry, GIGCAS (grant no. SKLOG-201914).
This paper was edited by Veli-Matti Kerminen and reviewed by four anonymous referees.
Apsokardu, M. J. and Johnston, M. V.: Nanoparticle growth by particle-phase chemistry, Atmos. Chem. Phys., 18, 1895–1907, https://doi.org/10.5194/acp-18-1895-2018, 2018.
Asmi, E., Kivekäs, N., Kerminen, V.-M., Komppula, M., Hyvärinen, A.-P., Hatakka, J., Viisanen, Y., and Lihavainen, H.: Secondary new particle formation in Northern Finland Pallas site between the years 2000 and 2010, Atmos. Chem. Phys., 11, 12959–12972, https://doi.org/10.5194/acp-11-12959-2011, 2011.
Burkart, J., Hodshire, A. L., Mungall, E. L., Pierce, J. R., Collins, D. B., Ladino, L. A., Lee, A. K., Irish, V., Wentzell, J. J., Liggio, J., and Papakyriakou, T.: Organic condensation and particle growth to CCN sizes in the summertime marine Arctic is driven by materials more semivolatile than at continental sites, Geophys. Res. Lett., 44, 10725–10734, https://doi.org/10.1002/2017GL075671, 2017.
Charlson, R. J., Schwartz, S. E., Hales, J. M., Cess, R. D., Coakley, J. A., Hansen, J. E., and Hofmann, D. J.: Climate Forcing by Anthropogenic Aerosols, Science, 255, 423–430, 1992.
Chen, C., Park, T., Wang, X. H., Piao, S. L., Xu, B. D., Chaturvedi, R. K., Fuchs, R., Brovkin, V., Ciais, P., Fensholt, R., Tommervik, H., Bala, G., Zhu, Z. C., Nemani, R. R., and Myneni, R. B.: China and India lead in greening of the world through land-use management, Nat. Sustain., 2, 122–129, 2019.
Chen, W. H., Guenther, A. B., Wang, X. M., Chen, Y. H., Gu, D. S ., Chang, M ., Zhou, S. Z., Wu, L. L., and Zhang, Y. Q.: Regional to Global Biogenic Isoprene Emission Responses to Changes in Vegetation From 2000 to 2015, J. Geophys. Res.-Atmos., 123, 3757–3771, 2018.
Chu, B., Kerminen, V.-M., Bianchi, F., Yan, C., Petäjä, T., and Kulmala, M.: Atmospheric new particle formation in China, Atmos. Chem. Phys., 19, 115–138, https://doi.org/10.5194/acp-19-115-2019, 2019.
Dal Maso, M., Kulmala, M., Riipinen, I., Wagner, R., Hussein, T., Aalto, P. P., and Lehtinen, K. E. J.: Formation and growth of fresh atmospheric aerosols: Eight years of aerosol size distribution data from SMEAR II, Hyytiala, Finland, Boreal Environ. Res., 10, 323–336, 2005.
Ding, X., Wang, X., and Zheng, M.: The influence of temperature and aerosol acidity on biogenic secondary organic aerosol tracers: Observations at a rural site in the central Pearl River Delta region, South China, Atmos. Environ., 45, 1303–1311, https://doi.org/10.1016/j.atmosenv.2010.11.057, 2011.
Dong, S., Wang, X., Zhang J., Li, H., Li, W., Li, M., Gu, R., Jiang, Y., Shan, Y., Gao, X., Liu, H., Guo, Z., Xue, L., and Wang, W.: Light absorption properties, absorption contributions, and the influencing factors of atmospheric brown carbon on Mount Tai, Geochimica, 49, 262–272, https://doi.org/10.19700/j.0379-1726.2020.01.011, 2020.
Dusek, U., Frank, G. P., Hildebrandt, L., Curtius, J., Schneider, J., Walter, S., Chand, D., Drewnick, F., Hings, S., Jung, D., Borrmann, S., and Andreae, M. O: Size matters more than chemistry for cloud-nucleating ability of aerosol particles, Science, 312, 1375–1378, https://doi.org/10.1126/science.1125261, 2006.
Ehn, M., Thornton, J. A., Kleist, E., Sipila, M., Junninen, H., Pullinen, I., Springer, M., Rubach, F., Tillmann, R., Lee, B., Lopez-Hilfiker, F., Andres, S., Acir, I.-H., Rissanen, M., Jokinen, T., Schobesberger, S., Kangasluoma, J., Kontkanen, J., Nieminen, T., Kurten, T., Nielsen, L. B., Jorgensen, S., Kjaergaard, H. G., Canagaratna, M., Dal Maso, M., Berndt, T., Petaja, T., Wahner, A., Kerminen, V.-M., Kulmala, M., Worsnop, D. R., Wildt, J., and Mentel, T. F.: A large source of lowvolatility secondary organic aerosol, Nature, 506, 476–479, https://doi.org/10.1038/nature13032, 2014.
Erupe, M. E., Benson, D. R., Li, J., Young, L. H., Verheggen, B., Al-Refai, M., Tahboub, O., Cunningham, V., Frimpong, F., Viggiano, A. A., and Lee, S. H.: Correlation of aerosol nucleation rate with sulfuricacid and ammonia in Kent, Ohio: An atmospheric observation, J. Geophys. Res.-Atmos., 115, D23216, https://doi.org/10.1029/2010JD013942, 2010.
Fan, H., Zhao, C., and Yang, Y.: A comprehensive analysis of the spatio-temporal variation of urban air pollution in China during 2014–2018, Atmos. Environ., 220, 117066, https://doi.org/10.1016/j.atmosenv.2019.117066, 2020.
Gao, J.: Study on aerosol number concentration, size distribution and the particle formation and growth process, Doctoral dissertation, Jinan, Shandong University, 2008.
Gao, J., Wang, T., Ding, A. J., and Liu, C. B.: Observational Study of Ozone and Carbon Monoxide at the Summit of Mount Tai (1534 m a.s.l.) in Central eastern China, Atoms. Envrion., 39, 4779–4791, 2005.
Gao, J., Wang, T., Zhou, X., Wu, W., and Wang, W.: Measurement of aerosol number size distributions in the Yangtze River delta in China: Formation and growth of particles under polluted conditions, Atmos. Environ., 43, 829–836, 2009.
Guo, H., Wang, D. W., Cheung, K., Ling, Z. H., Chan, C. K., and Yao, X. H.: Observation of aerosol size distribution and new particle formation at a mountain site in subtropical Hong Kong, Atmos. Chem. Phys., 12, 9923–9939, https://doi.org/10.5194/acp-12-9923-2012, 2012.
Hamed, A., Birmili, W., Joutsensaari, J., Mikkonen, S., Asmi, A., Wehner, B., Spindler, G., Jaatinen, A., Wiedensohler, A., Korhonen, H., Lehtinen, K. E. J., and Laaksonen, A.: Changes in the production rate of secondary aerosol particles in Central Europe in view of decreasing SO2 emissions between 1996 and 2006, Atmos. Chem. Phys., 10, 1071–1091, https://doi.org/10.5194/acp-10-1071-2010, 2010.
Kalivitis, N., Kerminen, V.-M., Kouvarakis, G., Stavroulas, I., Tzitzikalaki, E., Kalkavouras, P., Daskalakis, N., Myriokefalitakis, S., Bougiatioti, A., Manninen, H. E., Roldin, P., Petäjä, T., Boy, M., Kulmala, M., Kanakidou, M., and Mihalopoulos, N.: Formation and growth of atmospheric nanoparticles in the eastern Mediterranean: results from long-term measurements and process simulations, Atmos. Chem. Phys., 19, 2671–2686, https://doi.org/10.5194/acp-19-2671-2019, 2019.
Kerminen, V. M., Chen, X., Vakkari, V., Petäjä, T., Kulmala, M., and Bianchi, F.: Atmospheric new particle formation and growth: review of field observations, Environ. Res. Lett., 13, 103003, https://doi.org/10.1088/1748-9326/Aadf3c, 2018.
Kerminen, V.-M., Paramonov, M., Anttila, T., Riipinen, I., Fountoukis, C., Korhonen, H., Asmi, E., Laakso, L., Lihavainen, H., Swietlicki, E., Svenningsson, B., Asmi, A., Pandis, S. N., Kulmala, M., and Petäjä, T.: Cloud condensation nuclei production associated with atmospheric nucleation: a synthesis based on existing literature and new results, Atmos. Chem. Phys., 12, 12037–12059, https://doi.org/10.5194/acp-12-12037-2012, 2012.
Krotkov, N. A., McLinden, C. A., Li, C., Lamsal., L. N., Celarier, E. A., Marchenko, S. V., Swartz, W. H., Bucsela, E. J., Joiner, J., Duncan, B. N., Boersma, K. F., Veefkind, J. P., Levelt, P. F., Fioletov, V. E., Dickerson, R. R., He, H., Lu, Z., and Streets, D. G.: Aura OMI observations of regional SO2 and NO2 pollution changes from 2005 to 2015, Atmos. Chem. Phys., 16, 4605–4629, https://doi.org/10.5194/acp-16-4605-2016, 2016.
Kulmala, M. and Kerminen, V. M.: On the formation and growth of atmospheric nanoparticles, Atmos. Res., 90, 132–150, https://doi.org/10.1016/j.atmosres.2008.01.005, 2008.
Kulmala, M., Dal Maso, M., Mäkelä, M., Pirjola, L., Väkevä, M., Aalto, P., Miikkulainen, P., and Hämeri, K.: On the formation, growth and composition of nucleation mode particles, Tellus B, 53, 479–490, https://doi.org/10.1034/j.1600-0889.2001.d01-33.x, 2001.
Kulmala, M., Vehkamäki, H., Petäjä, T., Dal Maso, M., Lauri, A., Kerminen, V.-M., Birmili, W., and McMurry, P. H.: Formation and growth rates of ultrafine atmospheric particles: a review of observations, J. Aerosol Sci., 35, 143–176, https://doi.org/10.1016/j.jaerosci.2003.10.003, 2004.
Kulmala, M., Petäjä, T., Nieminen, T., Sipilä, M., Manninen, H. E., Lehtipalo, K., Dao Maso, M., Aalto, P. P., Junninen, H., Paasonen, P., Riipinen, I., Lehtinen, K. E. J., Laaksonen, A., and Kerminen, V.-M.: Measurement of the nucleation of atmospheric aerosol particles, Nat. Protoc., 7, 1651–1667, https://doi.org/10.1038/nprot.2012.091, 2012.
Lee, S., Gordon, H., Yu, H., Lehtipalo, K., Haley, R., Li, Y., and Zhang, R.: New particle formation in the atmosphere: From molecular clusters to global climate, J. Geophys. Res.-Atmos., 124, 7098–7146, https://doi.org/10.1029/2018JD029356, 2019.
Li, H. Y., Zhu, Y. J., Zhao, Y., Chen, T. S., Jiang, Y., Shan, Y., Liu, Y. H., Mu, J. S., Yin, X. K., Wu, D., Zhang, C., Si, S. C., Wang, X. F., Wang, W. X., Xue, L. K. Evaluation of the Performance of Low-Cost Air Quality Sensors at a High Mountain Station with Complex Meteorological Conditions, Atmosphere, 11, 212, https://doi.org/10.3390/atmos11020212, 2020.
Li, K., Zhu, Y., Gao, H., and Yao, X.: A comparative study of cloud condensation nuclei measured between non-heating and heating periods at a suburb site of Qingdao in the North China, Atmos. Environ., 112, 40–53, https://doi.org/10.1016/j.atmosenv.2015.04.024, 2015.
Li, W. J., Zhang, D. Z., Shao, L. Y., Zhou, S. Z., and Wang, W. X.: Individual particle analysis of aerosols collected under haze and non-haze conditions at a high-elevation mountain site in the North China plain, Atmos. Chem. Phys., 11, 11733–11744, https://doi.org/10.5194/acp-11-11733-2011, 2011.
Li, X., Zhao, B., Zhou, W., Shi, H., Yin, R., Cai, R., Yang, D., Dällenbach, K., Deng, C., Fu, Y., Qiao, X., Wang, L., Liu, Y., Yan, C., Kulmala, M., Zheng, J., Hao, J., Wang, S., and Jiang, J.: Responses of gaseous sulfuric acid and particulate sulfate to reduced SO2 concentration: A perspective from long-term measurements in Beijing, Sci. Total Environ., 721, 137700, https://doi.org/10.1016/j.scitotenv.2020.137700, 2020.
Lihavainen, H., Kerminen, V.-M., Komppula, M., Hatakka, J., Aaltonen, V., Kulmala, M., and Viisanen, Y.: Production of “potential” cloud condensation nuclei associated with atmospheric newparticle formation in northern Finland, J. Geophys. Res.-Atmos., 108, 4782, https://doi.org/10.1029/2003JD003887, 2003.
Liu, X. H., Zhu, Y. J., Zheng, M., Gao, H. W., and Yao, X. H.: Production and growth of new particles during two cruise campaigns in the marginal seas of China, Atmos. Chem. Phys., 14, 7941–7951, https://doi.org/10.5194/acp-14-7941-2014, 2014.
Lv, G., Sui, X., Chen, J., Jayaratne, R., and Mellouki, A.: Investigation of new particle formation at the summit of Mt. Tai, China, Atmos. Chem. Phys., 18, 2243–2258, https://doi.org/10.5194/acp-18-2243-2018, 2018.
Ma, L., Zhu, Y., Zheng, M., Sun, Y., Huang, L., Liu, X., Gao, Y., Shen, Y., Gao, H., and Yao, X.: Investigating three patterns of new particles growing to cloud condensation nuclei size in Beijing's urban atmosphere, Atmos. Chem. Phys. Discuss. [preprint], https://doi.org/10.5194/acp-2019-1151, in review, 2020.
Ma, M., Gao, Y., Wang, Y., Zhang, S., Leung, L. R., Liu, C., Wang, S., Zhao, B., Chang, X., Su, H., Zhang, T., Sheng, L., Yao, X., and Gao, H.: Substantial ozone enhancement over the North China Plain from increased biogenic emissions due to heat waves and land cover in summer 2017, Atmos. Chem. Phys., 19, 12195–12207, https://doi.org/10.5194/acp-19-12195-2019, 2019.
Ma, N., Zhao, C., Tao, J., Wu, Z., Kecorius, S., Wang, Z., Größ, J., Liu, H., Bian, Y., Kuang, Y., Teich, M., Spindler, G., Müller, K., van Pinxteren, D., Herrmann, H., Hu, M., and Wiedensohler, A.: Variation of CCN activity during new particle formation events in the North China Plain, Atmos. Chem. Phys., 16, 8593–8607, https://doi.org/10.5194/acp-16-8593-2016, 2016.
Man, H., Zhu, Y., Ji, F., Yao, X., Lau, N. T., Li, Y. J., Lee, B. P., and Chan, C. K.: Comparison of daytime and nighttime new particle growth at the HKUST Supersite in Hong Kong, Environ. Sci. Technol., 49, 7170–7178, https://doi.org/10.1021/acs.est.5b02143, 2015.
Mao, T., Wang, Y., Xu, H., Jiang, J., Wu, F., and Xu, X.: A study of the atmospheric VOCs of Mount Tai in June 2006, Atoms. Envrion., 43, 2503–2508, https://doi.org/10.1016/j.atmosenv.2009.02.013, 2009.
McMurry, P. H., Fink, M., Sakurai, H., Stolzenburg, M. R., Mauldin, III R. L., Smith, J., Eisele, F., Moore, K., Sjostedt, S., Tanner, D., Huey, L. G., Nowak, J. B., Edgerton, E., and Voisin D.: A criterion for new particle formation in the sulfur-rich Atlanta atmosphere, J. Geophys. Res.-Atmos., 110, D22S02, https://doi.org/10.1029/2005JD005901, 2005.
Meng, H., Zhu, Y. J., Evans, G., and Yao, X. H.: An approach to investigate new particle formation in the vertical direction on the basis of high time-resolution measurements at ground level and sea level, Atmos. Environ., 102, 366–375, https://doi.org/10.1016/j.atmosenv.2014.12.016, 2015.
Merikanto, J., Spracklen, D. V., Mann, G. W., Pickering, S. J., and Carslaw, K. S.: Impact of nucleation on global CCN, Atmos. Chem. Phys., 9, 8601–8616, https://doi.org/10.5194/acp-9-8601-2009, 2009.
Mikkonen, S., Romakkaniemi, S., Smith, J. N., Korhonen, H., Petäjä, T., Plass-Duelmer, C., Boy, M., McMurry, P. H., Lehtinen, K. E. J., Joutsensaari, J., Hamed, A., Mauldin III, R. L., Birmili, W., Spindler, G., Arnold, F., Kulmala, M., and Laaksonen, A.: A statistical proxy for sulphuric acid concentration, Atmos. Chem. Phys., 11, 11319–11334, https://doi.org/10.5194/acp-11-11319-2011, 2011.
Nie, W., Ding, A., Wang, T., Kerminen, V., George, C., Xue, L., Wang, W., Zhang, Q., Petaja, T., Qi, X., Gao, X., Wang, X., Yang, X., Fu, C., and Kulmala, M.: Polluted dust promotes new particle formation and growth, Sci. Rep., 4, 6634, https://doi.org/10.1038/srep06634, 2014
Nieminen, T., Manninen, H. E., Sihto, S. L., Yli-Juuti, T., Mauldin, III R. L., Petäjä, T., Riipinen, I., Kerminen, V.-M., and Kulmala, M.: Connection of sulfuric acid to atmospheric nucleation in boreal forest, Environ. Sci. Technol., 43, 4715–4721, https://doi.org/10.1021/es803152j, 2009.
Nieminen, T., Asmi, A., Dal Maso, M., Aalto, P. P., Keronen, P., Petäjä, T., Kulmala, M., and Kerminen, V-M.: Trends in atmospheric new-particle formation: 16 years of observations in a boreal-forest environment, Boreal Environ. Res., 19, 191–214, 2014.
Paasonen, P., Nieminen, T., Asmi, E., Manninen, H. E., Petäjä, T., Plass-Dülmer, C., Flentje, H., Birmili, W., Wiedensohler, A., Hõrrak, U., Metzger, A., Hamed, A., Laaksonen, A., Facchini, M. C., Kerminen, V.-M., and Kulmala, M.: On the roles of sulphuric acid and low-volatility organic vapours in the initial steps of atmospheric new particle formation, Atmos. Chem. Phys., 10, 11223–11242, https://doi.org/10.5194/acp-10-11223-2010, 2010.
Petters, M. D. and Kreidenweis, S. M.: A single parameter representation of hygroscopic growth and cloud condensation nucleus activity, Atmos. Chem. Phys., 7, 1961–1971, https://doi.org/10.5194/acp-7-1961-2007, 2007.
Qi, X., Ding, A., Nie, W., Chi, X., Huang, X., Xu, Z., Wang, T., Wang, Z., Wang, J., Sun, P., Zhang, Q., Huo, J., Wang, D., Bian, Q., Zhou, L., Zhang, Q., Ning, Z., Fei, D., Xiu, G., and Fu, Q.: Direct measurement of new particle formation based on tethered airship around the top of the planetary boundary layer in eastern China, Atmos. Environ., 209, 92–101, https://doi.org/10.1016/j.atmosenv.2019.04.024, 2019.
Quan, J., Liu, Y., Liu, Q., Jia, X., Li, X., Gao, Y., Ding, D., and Wang, Z.: Anthropogenic pollution elevates the peak height of new particle formation from planetary boundary layer to lower free troposphere, Geophys. Res. Lett., 44, 7537–7543, https://doi.org/10.1002/2017GL074553, 2017.
Riipinen, I., Yli-Juuti, T., Pierce, J. R., Petäjä, T., Worsnop, D. R., Kulmala, M., and Donahue, N. M.: The contribution of organics to atmospheric nanoparticle growth, Nat. Geosci., 5, 453–458, https://doi.org/10.1038/ngeo1499, 2012.
Rose, C., Sellegri, K., Moreno, I., Velarde, F., Ramonet, M., Weinhold, K., Krejci, R., Andrade, M., Wiedensohler, A., Ginot, P., and Laj, P.: CCN production by new particle formation in the free troposphere, Atmos. Chem. Phys., 17, 1529–1541, https://doi.org/10.5194/acp-17-1529-2017, 2017.
Saha, P. K., Robinson, E. S., Shah, R. U., Zimmerman, N., Apte, J. S., Robinson, A. L., and Presto, A.: Reduced ultrafine particle concentration in urban air: changes in nucleation and anthropogenic emissions, Environ. Sci. Technol., 52, 6798–806, https://doi.org/10.1021/acs.est.8b00910, 2018.
Seinfeld, J. H. and Pandis, S. N.: Atmospheric chemistry and physics: From air pollution to climate change, John Wiley & Sons, New York, 2012.
Sellegri, K., Rose, C., Marinoni, A., Lupi, A., Wiedensohler, A., Andrade, M., Bonasoni, P., and Laj, P.: New Particle Formation: A Review of Ground-Based Observations at Mountain Research Stations, Atmosphere, 10, 493, https://doi.org/10.3390/atmos10090493, 2019.
Shen, X., Sun, J., Zhang, X., Kivekäs, N., Zhang, Y., Wang, T., Zhang, X., Yang, Y., Wang, D., Zhao, Y., and Qin, D.: Particle climatology in Central East China retrieved from measurements in planetary boundary layer and in free troposphere at a 1500-m-High mountaintop site, Aerosol Air Qual. Res., 16, 689–701, 2016a.
Shen, X., Sun, J. Y., Zhang, X. Y., Zhang, Y. M., Zhang, L., and Fan, R. X.: Key features of new particle formation events at background sites in China and their influence on cloud condensation nuclei, Fron. Environ. Sci. Eng., 10, 5, https://doi.org/10.1007/s11783-016-0833-2, 2016b.
Shen, Y. J., Wang, J. T., Gao, Y., Chan, C. K ., Zhu, Y. J., Gao, H. W., Petaja, T., and Yao, X. H.: Sources and formation of nucleation mode particles in remote tropical marine atmospheres over the South China Sea and the Northwest Pacific Ocean, Sci. Total Environ., 735, 139302, https://doi.org/10.1016/j.scitotenv.2020.139302, 2020.
Sihto, S.-L., Kulmala, M., Kerminen, V.-M., Dal Maso, M., Petäjä, T., Riipinen, I., Korhonen, H., Arnold, F., Janson, R., Boy, M., Laaksonen, A., and Lehtinen, K. E. J.: Atmospheric sulphuric acid and aerosol formation: implications from atmospheric measurements for nucleation and early growth mechanisms, Atmos. Chem. Phys., 6, 4079–4091, https://doi.org/10.5194/acp-6-4079-2006, 2006.
Stangl, C. M., Krasnomowitz, J. M., Apsokardu, M. J., Tiszenkel, L., Ouyang, Q., Lee, S., and Johnston, M. V.: Sulfur dioxide modifies aerosol particle formation and growth by ozonolysis of monoterpenes and isoprene, J. Geophys. Res.-Atmos., 124, 4800–4811, https://doi.org/10.1029/2018JD030064, 2019.
Stavrakou, T., Müller, J.-F., Bauwens, M., De Smedt, I., Van Roozendael, M., Guenther, A., Wild, M., and Xia, X.: Isoprene emissions over Asia 1979–2012: impact of climate and land-use changes, Atmos. Chem. Phys., 14, 4587–4605, https://doi.org/10.5194/acp-14-4587-2014, 2014.
Sun, L., Xue, L., Wang, T., Gao, J., Ding, A., Cooper, O. R., Lin, M., Xu, P., Wang, Z., Wang, X., Wen, L., Zhu, Y., Chen, T., Yang, L., Wang, Y., Chen, J., and Wang, W.: Significant increase of summertime ozone at Mount Tai in Central Eastern China, Atmos. Chem. Phys., 16, 10637–10650, https://doi.org/10.5194/acp-16-10637-2016, 2016.
Tröstl, J., Chuang, W. K., Gordon, H., Heinritzi, M., Yan, C., Molteni, U., Ahlm, L., Frege, C., Bianchi, F., Wagner, R., Simon, M., Lehtipalo, K., Williamson, C., Craven, J. S., Duplissy, J., Adamov, A., Almeida, J., Bernhammer, A.-K., Breitenlechner, M., Brilke, S., Dias, A., Ehrhart, S., Flagan, R. C., Franchin, A., Fuchs, C., Guida, R., Gysel, M., Hansel, A., Hoyle, C. R., Jokinen, T., Junninen, H., Kangasluoma, J., Keskinen, H., Kim, J., Krapf, M., Kuerten, A., Laaksonen, A., Lawler, M., Leiminger, M., Mathot, S., Moehler, O., Nieminen, T., Onnela, A., Petaejae, T., Piel, F. M., Miettinen, P., Rissanen, M. P., Rondo, L., Sarnela, N., Schobesberger, S., Sengupta, K., Sipila, M., Smith, J. N., Steiner, G., Tome, A., Virtanen, A., Wagner, A. C., Weingartner, E., Wimmer, D., Winkler, P. M., Ye, P., Carslaw, K. S., Curtius, J., Dommen, J., Kirkby, J., Kulmala, M., Riipinen, I., Worsnop, D. R., Donahue, N. M., and Baltensperger, U.: The role of low-volatility organic compounds in initial particle growth in the atmosphere, Nature, 533, 527–531, https://doi.org/10.1038/nature18271, 2016.
Wang, J., Feng, L., Palmer, P. I., Liu, Y., Fang, S., Bösch, H., O'Dell, C. W., Tang, X., Yang, D., Liu, L., and Xia, C. Z. Large Chinese land carbon sink estimated from atmospheric carbon dioxide data, Nature, 586, 720-723, https://doi.org/10.1038/s41586-020-2849-9, 2020.
Wang, Y., Hopke, P. K., Chalupa, D. C., and Utell, M. J.: Long-term study of urban ultrafine particles and other pollutants, Atmos. Environ., 45, 7672–7680, https://doi.org/10.1016/j.atmosenv.2010.08.022, 2011.
Wang, Z., Birmili, W., Hamed, A., Wehner, B., Spindler, G., Pei, X. , Wu, Z., Cheng, Y., Su, H., and Wiedensohler, A.: Contributions of volatile and nonvolatile compounds (at 300 ∘ C) to condensational growth of atmospheric nanoparticles: an assessment based on 8.5 years of observations at the central Europe background site Melpitz, J. Geophys. Res.-Atmos., 122, 485–497, https://doi.org/10.1002/2016JD025581, 2017.
Wang, Z., Wang, T., Gao, R., Xue, L., Guo, J., Zhou, Y., Nie, W., Wang, X., Xu, P., Gao, J., Zhou, X., Wang, W., and Zhang, Q.: Source and variation of carbonaceous aerosols at Mount Tai, North China: Results from a semi-continuous instrument, Atoms. Envrion., 45, 1655–1667, https://doi.org/10.1016/j.atmosenv.2011.01.006, 2011.
Wen, L., Xue, L., Wang, X., Xu, C., Chen, T., Yang, L., Wang, T., Zhang, Q., and Wang, W.: Summertime fine particulate nitrate pollution in the North China Plain: increasing trends, formation mechanisms and implications for control policy, Atmos. Chem. Phys., 18, 11261–11275, https://doi.org/10.5194/acp-18-11261-2018, 2018.
Wiedensohler, A., Cheng, Y. F., Nowak, A., Wehner, B., Achtert, P., Berghof, M., Birmili, W., Wu Z. J., Hu, M., Zhu, T., Takegawa, N., Kita, K., Kondo, Y., Lou, S. R., Hofzumahaus, A., Holland, F., Wahner, A., Gunthe, S. S., Rose, D., Su, H., and Pöschl, U.: Rapid aerosol particle growth and increase of cloud condensation nucleus activity by secondary aerosol formation and condensation: A case study for regional air pollution in northeastern china, J. Geophys. Res., 114, D00G08, https://doi.org/10.1029/2008JD010884, 2009.
Williams, J., de Reus, M., Krejci, R., Fischer, H., and Ström, J.: Application of the variability-size relationship to atmospheric aerosol studies: estimating aerosol lifetimes and ages, Atmos. Chem. Phys., 2, 133–145, https://doi.org/10.5194/acp-2-133-2002, 2002.
Wu, Z. J., Hu, M., Liu, S., Wehner, B., Bauer, S., Ssling, A. M., Wiedensohler, A., Petaja, T., Dal Maso, M., and Kulmala, M.: New particle formation in Beijing, China: Statistical analysis of a 1-year data set, J. Geophys. Res.-Atmos., 112, D09209, https://doi.org/10.1029/2006jd007406, 2007.
Xie, H., Feng, L., Hu, Q., Zhu, Y., Gao, H., Gao, Y., and Yao, X.: Concentration and size distribution of water-extracted dimethylaminium and trimethylaminium in atmospheric particles during nine campaigns – Implications for sources, phase states and formation pathways, Sci. Total Environ., 631-632, 130–141, https://doi.org/10.1016/j.scitotenv.2018.02.303, 2018.
Yao, L., Garmash, O., Bianchi, F., Zheng, J., Yan, C., Kontkanen, J., Junninen, H., Mazon, S. B., Ehn, M., Paasonen, P., Sipilä, M., Wang, M., Wang, X., Xiao, S., Chen, H., Lu, Y., Zhang, B., Wang, D., Fu, Q., Geng, F., Li, L., Wang, H., Qiao, L., Yang, X., Chen, J., Kerminen, V. M., Petäjä, T., Worsnop, D. R., Kulmala, M., and Wang, L.: Atmospheric new particle formation from sulfuric acid and amines in a Chinese megacity, Science, 361, 278–281, https://doi.org/10.1126/science.aao4839, 2018.
Zhang, R., Khalizov, A., Wang, L., Hu, M., and Xu, W.: Nucleation and growth of nanoparticles in the atmosphere, Chem. Rev., 112, 1957–2011, https://doi.org/10.1021/cr2001756, 2012.
Zhang, X., Huang, T., Zhang, L., Shen, Y., Zhao, Y., Gao, H., Mao, X., Jia, C., and Ma, J.: Three-North Shelter Forest Program contribution to long-term increasing trends of biogenic isoprene emissions in northern China, Atmos. Chem. Phys., 16, 6949–6960, https://doi.org/10.5194/acp-16-6949-2016, 2016.
Zhou, Y., Wang, T., Gao, X., Xue, L., Wang, X., Wang, Z., Gao, J., Zhang Q., and Wang, W.: Continuous observations of water-soluble ions in PM2.5 at Mount Tai (1534 m asl) in central-eastern China, J. Atmos. Chem., 64, 107–127, https://doi.org/10.1007/s10874-010-9172-z, 2009.
Zhu, Y., Sabaliauskas, K., Liu, X., Meng, H., Gao, H., Jeong, C. H., Evans, G. J., and Yao, X.: Comparative analysis of new particle formation events in less and severely polluted urban atmosphere, Atmos. Environ., 98, 655–664, https://doi.org/10.1016/j.atmosenv.2014.09.043, 2014.
Zhu, Y., Yan, C., Zhang, R., Wang, Z., Zheng, M., Gao, H., Gao, Y., and Yao, X.: Simultaneous measurements of new particle formation at 1 s time resolution at a street site and a rooftop site, Atmos. Chem. Phys., 17, 9469–9484, https://doi.org/10.5194/acp-17-9469-2017, 2017.
Zhu, Y., Li, K., Shen, Y., Gao, Y., Liu, X., Yu, Y., Gao, H., and Yao, X.: New particle formation in the marine atmosphere during seven cruise campaigns, Atmos. Chem. Phys., 19, 89–113, https://doi.org/10.5194/acp-19-89-2019, 2019.
Zhu, Y., Xue, L., and Yao, X.: Mt. Tai particle number concentration datasets, Mendeley Data, V1, https://doi.org/10.17632/wf3wjvpfw7.1, 2021.