the Creative Commons Attribution 4.0 License.
the Creative Commons Attribution 4.0 License.
 | 20 Aug 2021
Improving prediction of trans-boundary biomass burning plume dispersion: from northern peninsular Southeast Asia to downwind western North Pacific Ocean
Maggie Chel-Gee Ooi
Ming-Tung Chuang
Joshua S. Fu
Steven S. Kong
Wei-Syun Huang
Sheng-Hsiang Wang
Sittichai Pimonsree
Andy Chan
Shantanu Kumar Pani
Neng-Huei Lin
Plumes from the boreal spring biomass burning (BB) in northern peninsular Southeast Asia (nPSEA) are lifted into the subtropical jet stream and transported and deposited across nPSEA, South China, Taiwan and even the western North Pacific Ocean. This paper as part of the Seven SouthEast Asian Studies (7-SEAS) project effort attempts to improve the chemical weather prediction capability of the Weather Research and Forecasting coupled with the Community Multiscale for Air Quality (WRF–CMAQ) model over a vast region, from the mountainous near-source burning sites at nPSEA to its downwind region. Several sensitivity analyses of plume rise are compared in the paper, and it is discovered that the initial vertical allocation profile of BB plumes and the plume rise module (PLMRIM) are the main reasons causing the inaccuracies of the WRF–CMAQ simulations. The smoldering emission from the Western Regional Air Partnership (WRAP) empirical algorithm included has improved the accuracies of PM10, O3 and CO at the source. The best performance at the downwind sites is achieved with the inline PLMRIM, which accounts for the atmospheric stratification at the mountainous source region with the FINN burning emission dataset. Such a setup greatly improves not only the BB aerosol concentration prediction over near-source and receptor ground-based measurement sites but also the aerosol vertical distribution and column aerosol optical depth of the BB aerosol along the transport route. The BB aerosols from nPSEA are carried by the subtropical westerlies in the free troposphere to the western North Pacific, while BB aerosol has been found to interact with the local pollutants in the Taiwan region through three conditions: (a) overpassing western Taiwan and entering the central mountain area, (b) mixing down to western Taiwan, (c) transport of local pollutants upwards and mixing with a BB plume on higher ground. The second condition, which involves the prevailing high-pressure system from Asian cold surge, is able to impact most of the population in Taiwan.
- Article
(11044 KB) - Full-text XML
-
Supplement
(1258 KB) - BibTeX
- EndNote


Large quantities of gaseous and aerosol pollutants released from biomass burning affect regional air quality, radiative forcing, public health and economic burden, especially in Southeast Asia (Chen et al., 2017; Lee et al., 2017; Pani et al., 2018, 2020). The prolonged heat during the dry season (December to May) in peninsular Southeast Asia (PSEA) has led to the deterioration of biomass burning (BB) in northern PSEA (nPSEA) (Kim Oanh and Leelasakultum, 2011). The outflow of the BB smoke plumes from nPSEA usually occurs during the spring season (late February until mid-April), when the high-pressure system has retreated northwards back into the Asian continent. The mountainous structure over the north-central PSEA has lifted the BB plume into the subtropical Pacific High (700 to 800 hPa, ∼1–3 km) under prevailing southern wind (Dong and Fu, 2015b; Huang et al., 2020). The plume is then transported eastward to the West Pacific and frequently detected at the Lulin Atmospheric Background Station (LABS) in central Taiwan (Fu et al., 2012; Lee et al., 2011; Lin et al., 2017, 2014, 2013; Ou-Yang et al., 2014; S.-H. Wang et al., 2013). Moreover, there were several instances when the high-pressure system entered Taiwan and brought the upper-layer BB plumes down to populous southwestern Taiwan and altered the atmospheric chemistry and composition (Dong et al., 2018; Huang et al., 2016; Yen et al., 2013).
Spaceborne remote-sensing data from satellites and the high-resolution spatiotemporal data generated from the chemical weather prediction (CWP) model are often used for studying long-range transport of BB smoke across the region (e.g., Huang et al., 2020; Tsay et al., 2013). Previous studies have found that the numerical model is prone to overestimating the BB emissions including CO, PM2.5 and PM10 up to 3 times the measured amount at the major burning source in northern Thailand (Huang et al., 2013; Pimonsree et al., 2018). The exceedance of estimated emission at the near-source burning leads to the incorrect modeled signal at the downwind site (Fu et al., 2012). The modeled columnar aerosol optical depth (AOD) is found to be comparable with aerosol products of the Aerosol Robotic Network (AERONET) and the Moderate Resolution Imaging Spectroradiometer (MODIS) sensor as well as columnar CO and NO2 at the burning source over the nPSEA region, but great discrepancies are found for the spatial distribution of downwind plumes (Dong and Fu, 2015b; Fu et al., 2012). In those models, the vertical distribution percentage of BB emission was set to be constant throughout the case. However, there are many possible factors that govern the actual plume rise condition, including the fire size, vegetation cover, buoyancy heat flux, wind drag, boundary layer condition, etc. (Freitas et al., 2010; Kukkonen et al., 2014; Paugam et al., 2016; Val Martin et al., 2012). Furthermore, the accuracy of the model depends greatly on the plume rise condition.
As part of the local effort of the interdisciplinary Seven SouthEast Asian Studies (7-SEAS) project (Lin et al., 2013; Reid et al., 2013), this paper attempts to improve the modeling performance of the long-range transport of BB from the nPSEA region to the downwind region using the Weather Research and Forecasting coupled with the Community Multiscale Air Quality (WRF–CMAQ) model. The paper attempts to improve the ability of the CMAQ model and its plume rise module (PLMRIM) to predict the complexity of BB amount from its burning source in nPSEA to its downwind receptor LABS. With the availability of on-site and satellite lidar (light detection and ranging) measurement, the vertical plume rise profile can be better understood to ensure that BB plumes are distributed according to the actual conditions (Walter et al., 2016; S.-H. Wang et al., 2013). In this work, several factors, including the injection height, initial vertical distribution and smoldering fraction, are considered in the model. Knowing that the atmospheric circulation over nPSEA is also affected by terrain, the work now intends to incorporate the interaction of the atmospheric stratification and BB plumes into the PLMRIM. This research takes an approach mainly from the perspective of the vertical distribution profile of modeled BB aerosol concentration with the assistance of top-down and bottom-up vertical lidar profilers. The better-performing setting will be applied to test its applicability and to dissect the sources of high pollution at LABS and in western Taiwan.
The model experimental design (Sect. 2.1), model emission input (Sect. 2.2) and case study setup (Sect. 2.3) are explained in detail. The performance of the PLMRIM is then verified with ground-based measurement stations in Sect. 3.1 and vertical aerosol products from lidar sensors (MPLNET, CALIPSO) and MODIS columnar AOD (Sect. 3.2), where the reliability and accuracy of inline PLMRIM are discussed (Sect. 3.3). The resulting output is subsequently studied in Sect. 4 to answer the transport mechanism to the ground-based observation sites in western Taiwan. Conclusions to these findings are made in Sect. 5.
The study focuses on the spring BB events in March 2013. With moderate burning occurring in nPSEA, this El Niño–Southern Oscillation (ENSO)-neutral year is chosen because the LABS mainly received the BB plumes with minimal influence from the Asian dust storm to Taiwan (NOAA-ESRL, 2020; TAQM, updated daily; Kong et al. 2021). The 7-SEAS spring campaigns carried out during the BB season supply an abundance of air quality and aerosol measurement data (http://rsm2.atm.ncu.edu.tw/, last access: 17 August 2021).
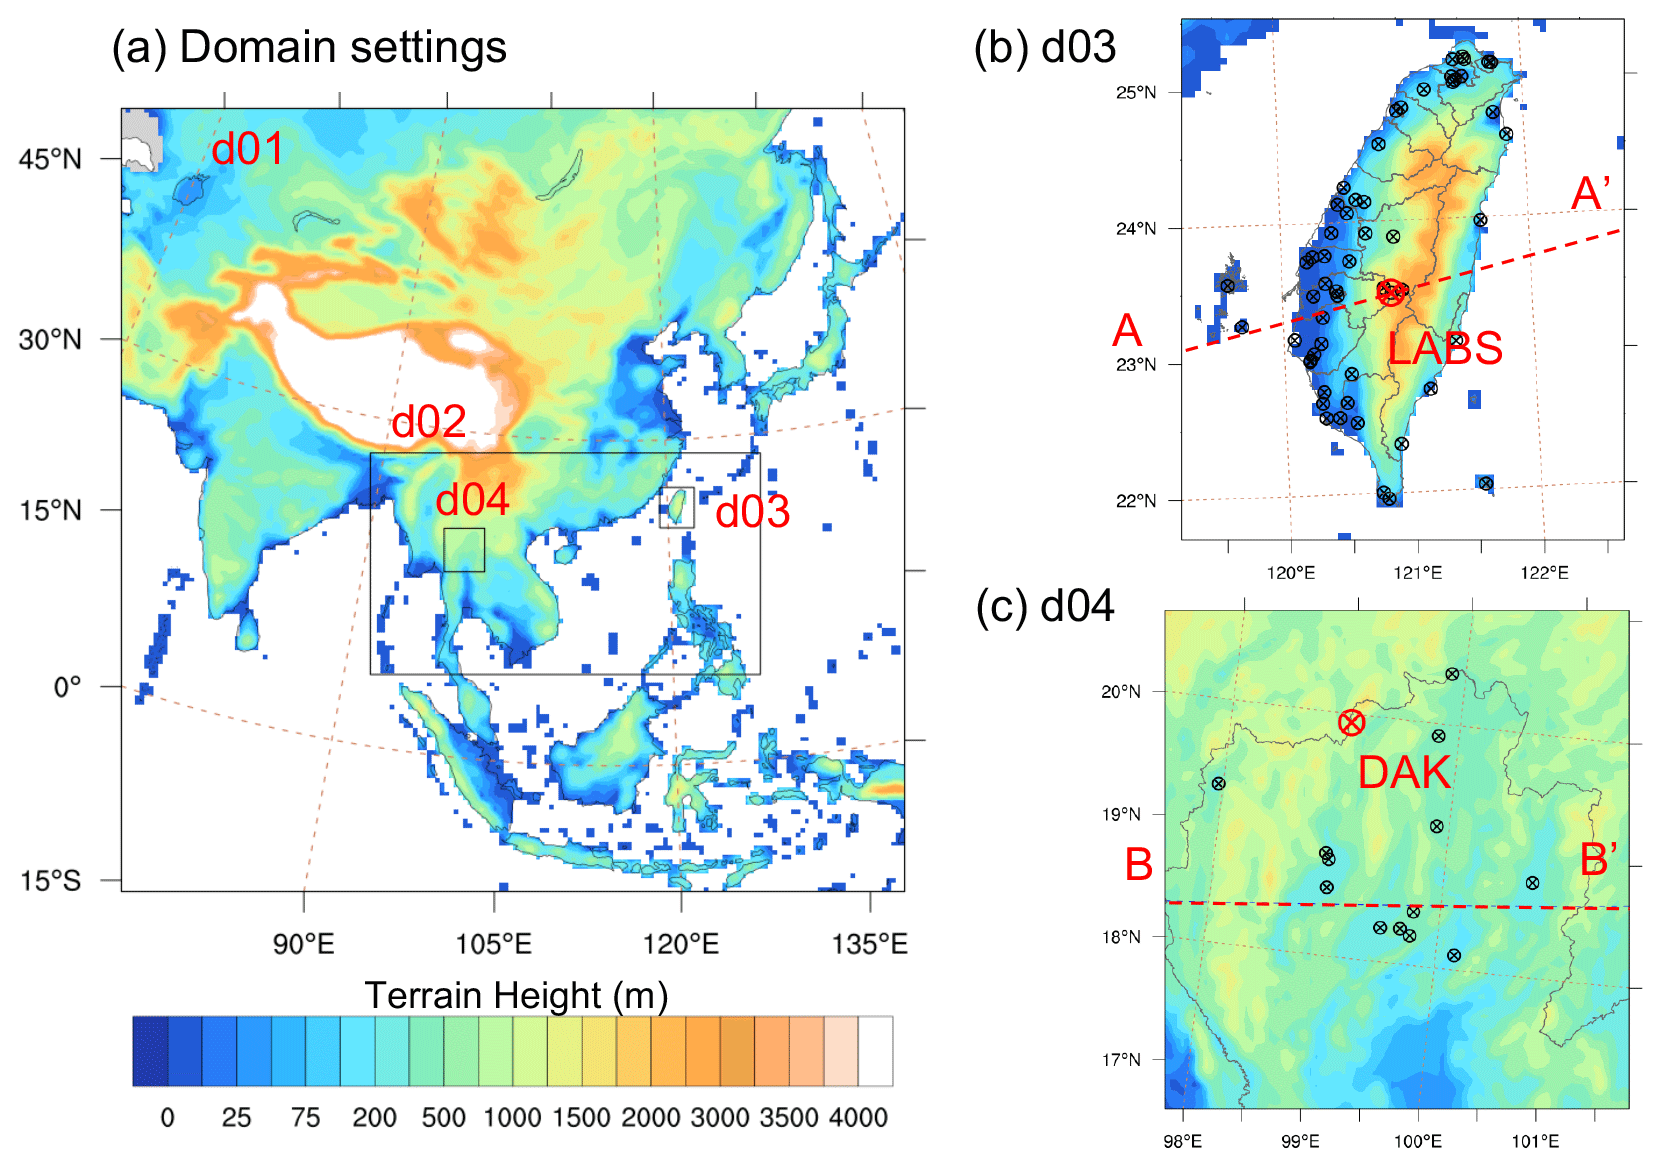
Figure 1(a) Domain setup of model (domain 1–4) with terrain height information; (b) third domain covering Taiwan (d03) with information of terrain height (contour fill), AA' cross-section (dotted red line), and locations of Taiwan EPA air quality and CWB weather stations (black dots) and LABS receptor site (big red dot); (c) fourth domain covering part of nPSEA (d04) with terrain height (contour fill), BB' cross-section (dotted red line), and location of Thailand PCD ground air quality stations (black dots) and the DAK source site (big red dot). The MPLNET data collected are located at the DAK station (big red dot).
2.1 Model physics and experimental design
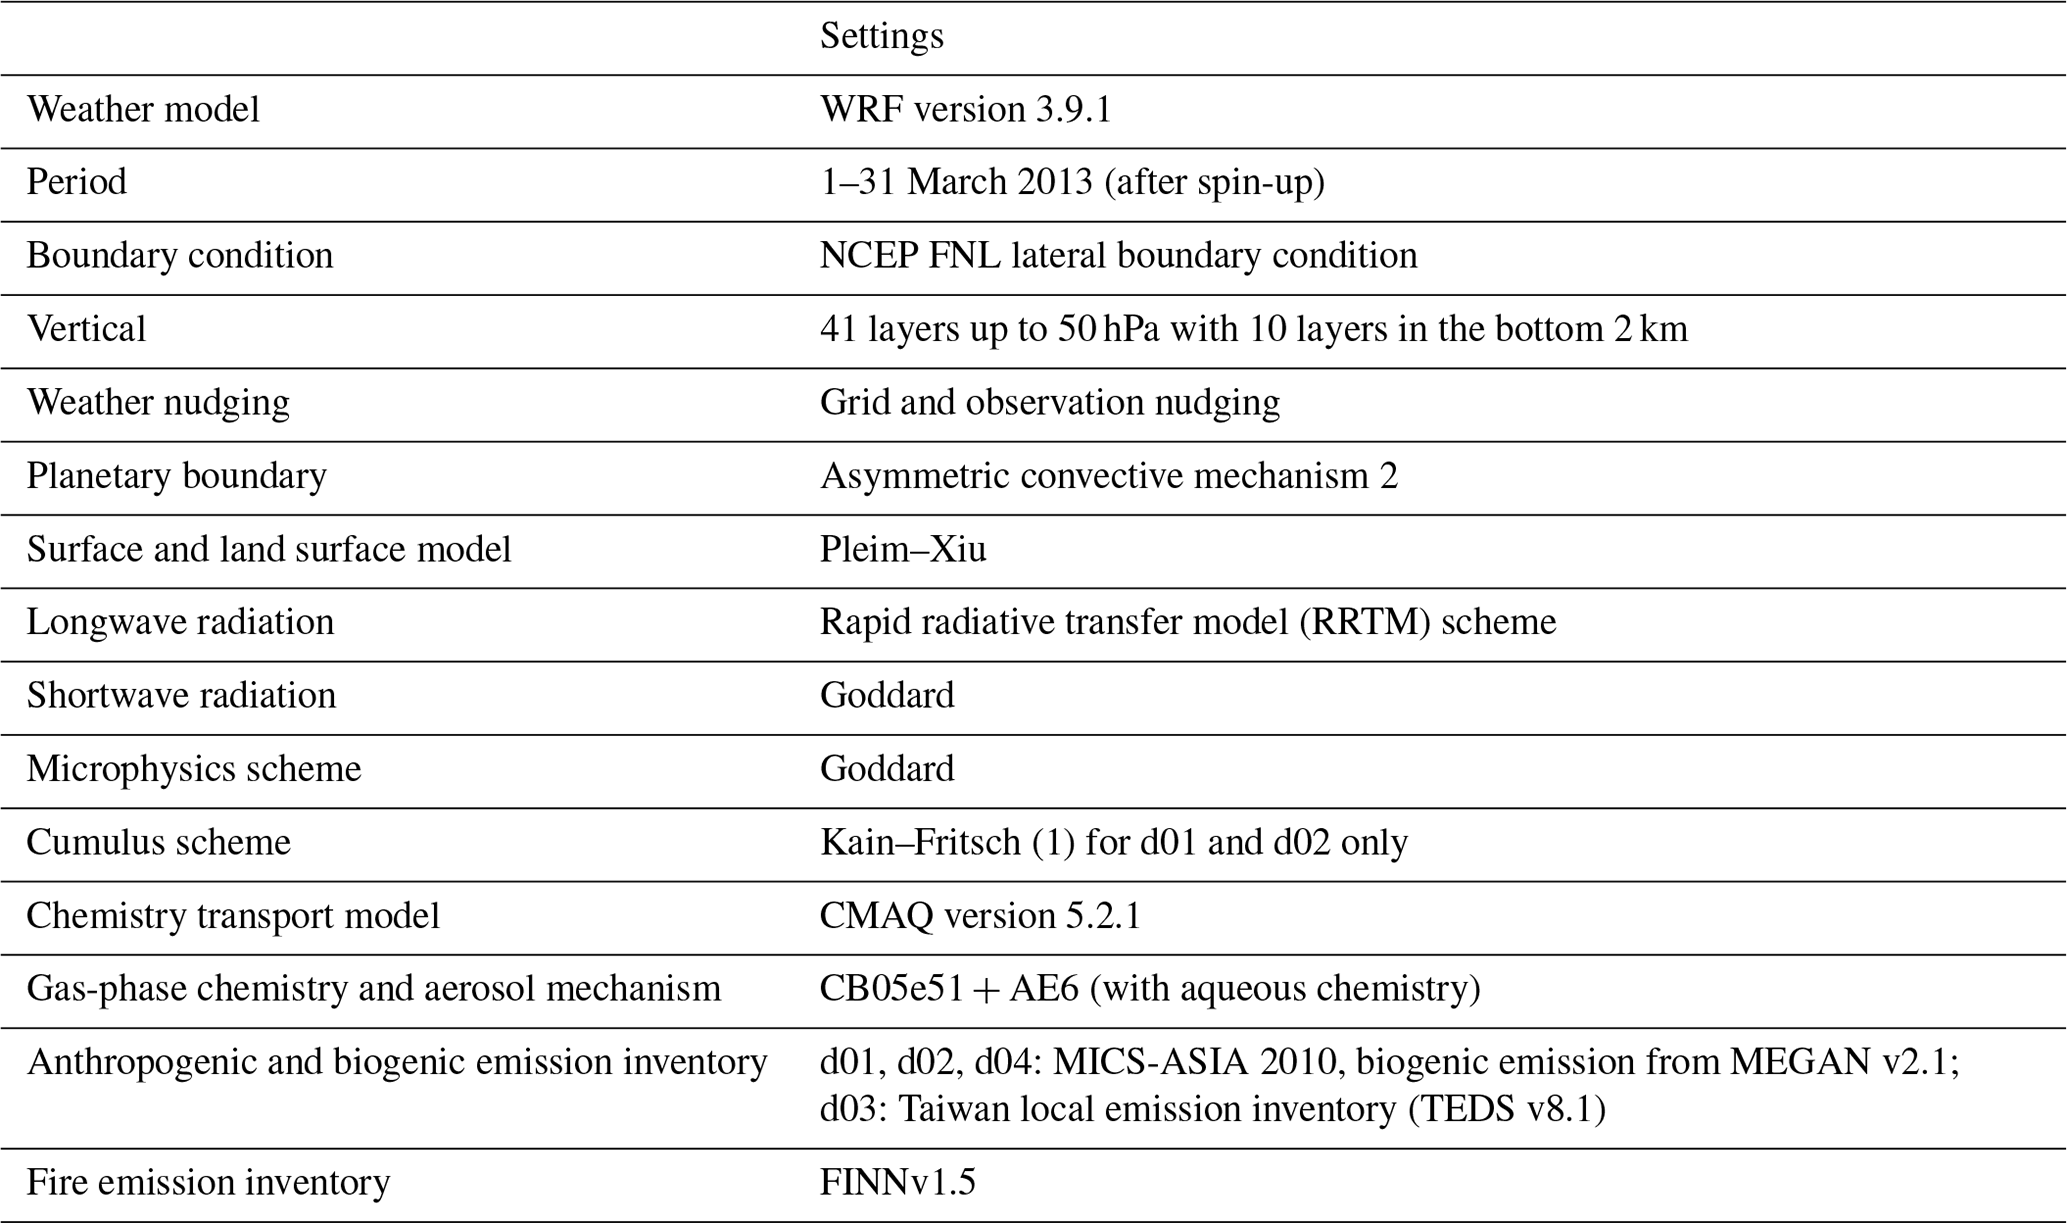
This work employs the Weather Research and Forecasting with the Advanced Research core (WRF–ARW v3.9.1) (Wang et al., 2017) model to hindcast the weather field and predict the corresponding air chemistry field with the chemical transport model CMAQ v5.2.1 (Byun and Schere, 2006). The model domain is dynamically downscaled through nesting from the majority of Asia (d01 resolution: 45 km) to cover the transport route from nPSEA to Taiwan (d02: 15 km), Taiwan only (d03: 5 km) and nPSEA only (d04: 5 km), as shown in Fig. 1. The weather input for the initial and lateral boundary condition is the 6-hourly National Centers for Environmental Prediction (NCEP) Final Analyses (FNL) dataset (NCEP-ds083.2, 2000, updated daily). As an extension of the latter, data assimilation is applied for both grid and observation nudging. The weather data for observation nudging are obtained from the National Centers for Environmental Prediction (NCEP) Automated Data Processing (ADP) Global Surface (NCEP-ds461.0, 2004, updated daily) and Upper Air Observational Weather Data (NCEP-ds351.0, 2000, updated daily), with additional local sites operated by the Taiwan Central Weather Bureau (CWB) and the Thailand Pollution Control Department (PCD). The radii of influence (RIN) for both d03 and d04 are updated to 100 km based on the average distance between the observation stations (d03: 125 km; d04: 153 km) and the minimum distance between two stations (d03: 64 km; d04: 36 km). Wind speed and wind direction are substantially improved by observation nudging. A detailed discussion about meteorology performance is given in Sect. A in the Supplement. Other WRF–CMAQ settings and configurations are listed in Table 1.
On top of the ground-based measurement weather and air quality data, the lidar systems are also used to evaluate the performance of the model ability to estimate the vertical profile of BB aerosols. They are the bottom-up Micro-Pulse Lidar Network (MPLNET) and top-down Cloud-Aerosol Lidar with Orthogonal Polarization (CALIOP) lidar sensors. The MPLNET is a federated network managed by NASA to measure the aerosol vertical structure (Welton et al., 2000). In line with the 2013 7-SEAS spring campaign conducted in nPSEA, the MPLNET device is located at the Doi Ang Khang (DAK) meteorology station to collect the near-source aerosol vertical distribution profile (L1.5a) data. The gridded extinction, diagnosed from the planetary boundary layer height and vertical aerosol extinction coefficient data collected, is used to verify the performance of the model output (S.-H. Wang et al., 2015). The CALIOP sensor mounted on the Cloud-Aerosol Lidar and Infrared Pathfinder Satellite Observations (CALIPSO) satellite is used to study the transport pattern with larger spatial coverage to complement the single-point cross-extinction profile provided by the MPLNET system. The diagnosed vertical feature mask (VFM) product is used to distinguish the aerosol types with consideration of observed backscatter strength and depolarization (Winker et al., 2010).
2.2 Emission data
2.2.1 Anthropogenic and biogenic emission inventories
The anthropogenic emissions are re-gridded for the first, second and fourth domain (d01, d02 and d04 in Fig. 1) from the MIX dataset available at for the year 2010 (Li et al., 2017; Zheng et al., 2018). The Model of Emissions of Gases and Aerosols from Nature (MEGAN v2.10) produces the biogenic emission input (Guenther et al., 2012) using the updated 8 d averaged leaf area index (LAI) (Yuan et al., 2011) and present-day plant functional types (PFTs) from the Community Land Model version 4.0 (CLM4.0) (Oleson et al., 2010). The third domain (d03) covering Taiwan uses the 2010 anthropogenic and biogenic emissions from the locally developed Taiwan national emission database (TEDSv8.1) (TEPA, 2017). Except the high quality of the East Asia national emission inventories (China, Taiwan, Japan and Korea), large uncertainties in Southeast Asia emission due to the scarce availability of region-specific emission factor are pointed out by the inventory developers (Kurokawa et al., 2013; Li et al., 2018; Ohara et al., 2007) and local modeling efforts (Dong and Fu, 2015a; Ooi et al., 2019). Such inaccuracies are likely to affect the performance of further modeling work in the area. Therefore, energy statistics based on the global anthropogenic emissions dataset Evaluating the Climate and Air Quality Impacts of Short-Lived Pollutants (ECLIPSE), developed by the International Energy Agency (IEA) (Klimont et al., 2017), is used in place of the MIX dataset for PSEA. The accuracy deviation between these two datasets in nPSEA is determined through the WRF–CMAQ model performance in Sect. 4. The detailed comparison of ECLIPSE and the MIX dataset in 2010 is shown in Sect. B in the Supplement.

2.2.2 Biomass burning emission inventory
The study region is composed of small fires with a small area burnt but has a rather substantial amount of fuel load and BB emissions due to the high woody compositions of the tropical and temperate forest covers. The global dataset Fire INventory from the NCAR (FINN v1.5; referred as “FINN” here onwards) has been applied in several previous works focusing on the region (Lin et al., 2014; Pimonsree and Vongruang, 2018) and is used as the input to the BB emission inventory into the model. A particular comparison work done for 2014 biomass burning episodes has shown that FINN, when used with NCEP FNL boundary condition, gives the greatest accuracy for PM10 at the source region compared to the GFEDv4.1 fire emission dataset (Takami et al., 2020). Seeing that the temporal speciation is handled in this research work, the main difference between fire emission inventories is the total amount of emission produced (Liu et al., 2020); hence this paper will settle with the regionally more robustly tested FINN dataset for the subsequent studies. FINN is a 1 km×1 km resolution bottom-up daily emission dataset produced from the MODIS product of active fire, land-cover type and continuous vegetation field (Wiedinmyer et al., 2011). Each active fire is assumed for a 1 km2 burnt area, and the emission factor is geographically and land-cover-dependent. The BB emission is processed with the fire_emis preprocessor to allocate to each grid and specify input into the WRF–CMAQ model at the hourly scale.
2.3 Case study setup
The plume rise module (PLMRIM) derives the initial plume top and bottom, plume rise, and its dispersion according to the atmospheric stability and its residual buoyancy flux (Kukkonen et al., 2014). Among a wide range of PLMRIM approaches, the simplest plume rise allocation method is the direct allocation of the initial plume top and bottom through prescribed height for all fires. This is the conventional method adopted in the case study region (Chuang et al., 2016b; Pimonsree et al., 2018). They can be determined on the basis of fixed height (J. Wang et al., 2013) and an empirical ratio of the plume height allocation (WRAP, 2004), and they can be adjusted with, for example, the stereo-height data from the space-based multi-angle imaging spectroradiometer (MISR) (Jian and Fu, 2014; Val Martin et al., 2012). The inline plume rise algorithm couples the interaction of BB plume dispersion with the basic weather dynamics to determine the effective plume rise height and subsequently the plume top and bottom. This inline PLMRIM is also able to resolve the fire on the sub-grid scale and feed the plume dynamics information back into the atmospheric dynamics (Gillani and Godowitch, 1999). However, the more complex the PLMRIM gets, the higher the quality and quantity of input data are required to be to ensure its reliability.
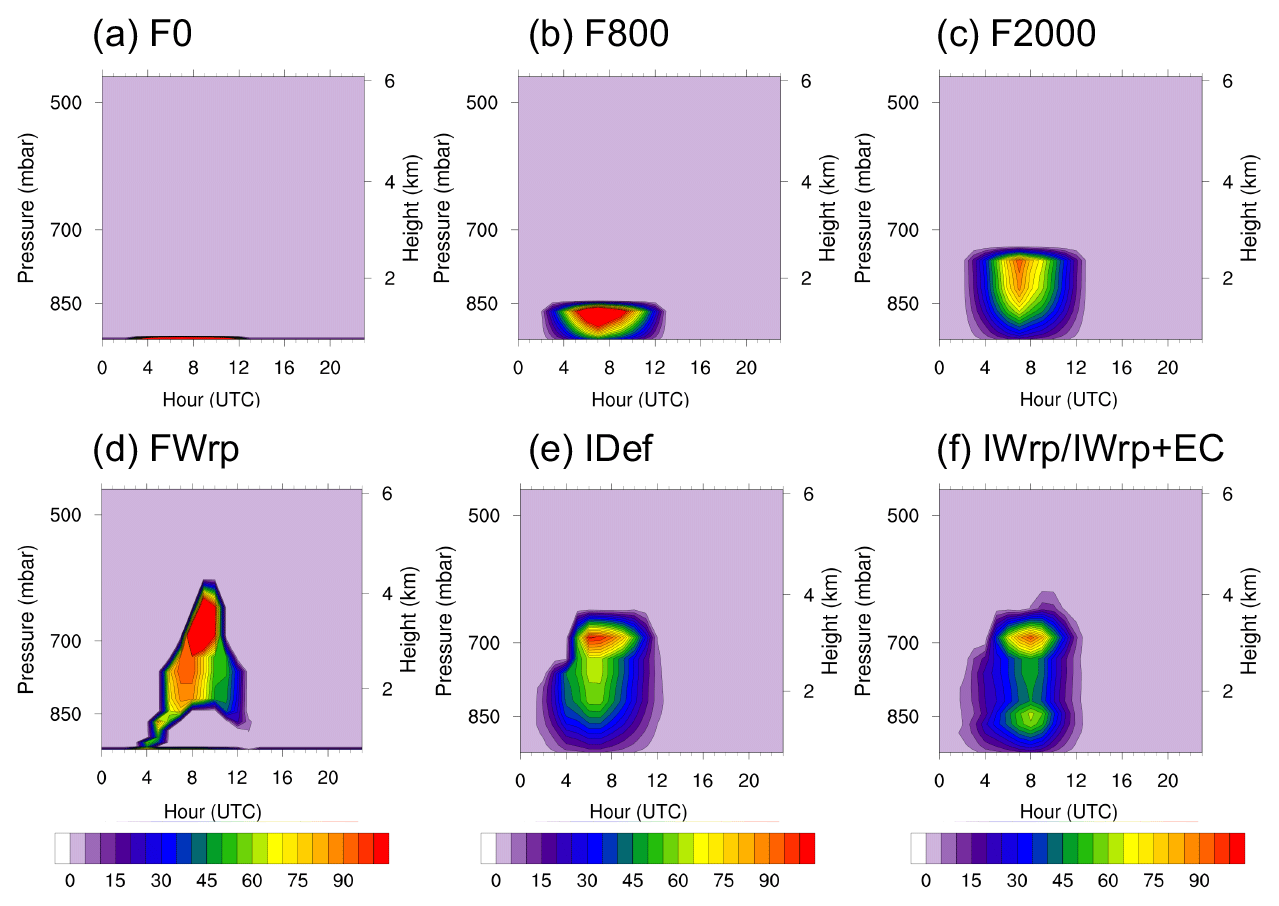
Figure 2Initial CO emission rate (mol s−1) profile at Mae Hong Son, Thailand, on 13 March 2013 (UTC) for each case setup in Table 2 with (a) F0, (b) F800, (c) F2000, (d) FWrp, (e) IDef and (f) IWrp/IWrp + EC.
In this work, combinations of injection height, initial vertical distribution, smoldering fraction, and offline and inline PLMRIM are tested to determine the more suitable settings for prediction of plume rise. Five case studies are set up for the evaluation of plume rise performance, and their respective initial plume rise profiles are shown in Table 2. The Nofire case represents the pollution condition when no BB emission is included, while the others allocate the BB emission from the FINN dataset. F0, F800 and F2000 represent the offline PLMRIM where the injection height is fixed at the generally accepted near-surface layer, 800 and 2000 m (J. Wang et al., 2013). This fixed-height method controls the plume top to be consistent; hence there is no hourly and daily variation in the plume top throughout the simulation period. FWrp uses the WRAP empirical equation to allocate the initial plume rise (WRAP, 2004). The plume top and bottom vary hourly with the buoyancy efficiency, with higher plume height during the hotter noontime, as illustrated in the initial plume profile in Fig. 2 (FWrp). However, the empirical ratio adopted for each burning grid is the same every day. IDef is the inline plume-in-grid system that comes with the CMAQ model (Gillani and Godowitch, 1999). Fire emission is fed into the model at each grid point, with plume top and bottom calculated through interaction of plume buoyancy efficiency and atmospheric stratification. The vertical distribution of CO plume on 12 March 2013 is shown in Fig. 2 (IDef), but the daily weather condition is expected to vary the vertical distribution. IWrp has updated IDef with the WRAP empirical specification on fire size. In this case, the plume can be distributed according to the diurnal buoyancy efficiency and near-surface smoldering fraction as specified by WRAP. With a more reasonable BB plume peak at noontime in Fig. 2 (IWrp), it is expected to improve the near-source concentration prediction of the model as seen from the initial plume profile. IWrp + EC is the same as IWrp but with the anthropogenic emission in PSEA replaced by the ECLIPSE dataset, as specified in Sect. 3.2.1. The initial emission profiles (within plume top and bottom) of all cases are distributed evenly according to the height of each vertical layer.
Table 3Performance of modeled chemistry field with different settings of PLMRIM at a mountain site in the western North Pacific (LABS) and nPSEA (DAK). R: correlation coefficient; MFB: mean fractional bias; MFE: mean fractional error; MNB: mean normalized bias; MNE: mean normalized error. Bold values are model output that satisfied the standard of each index.
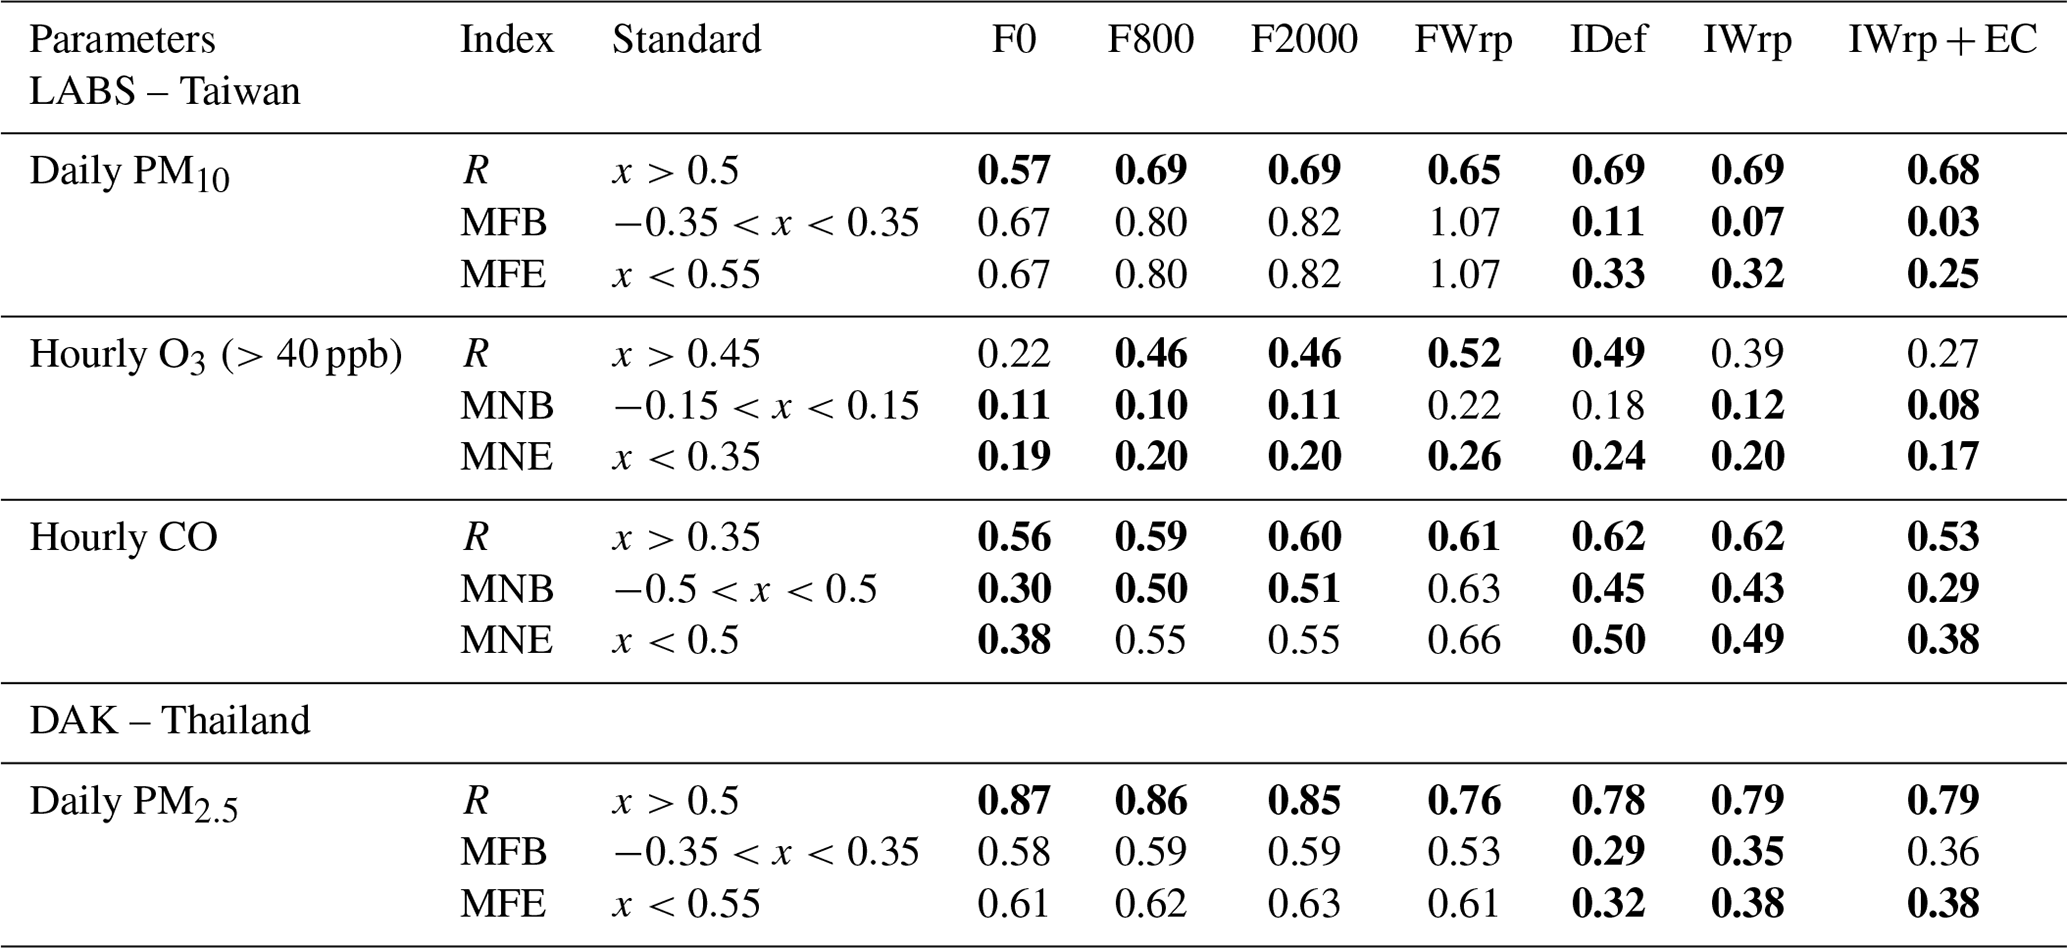
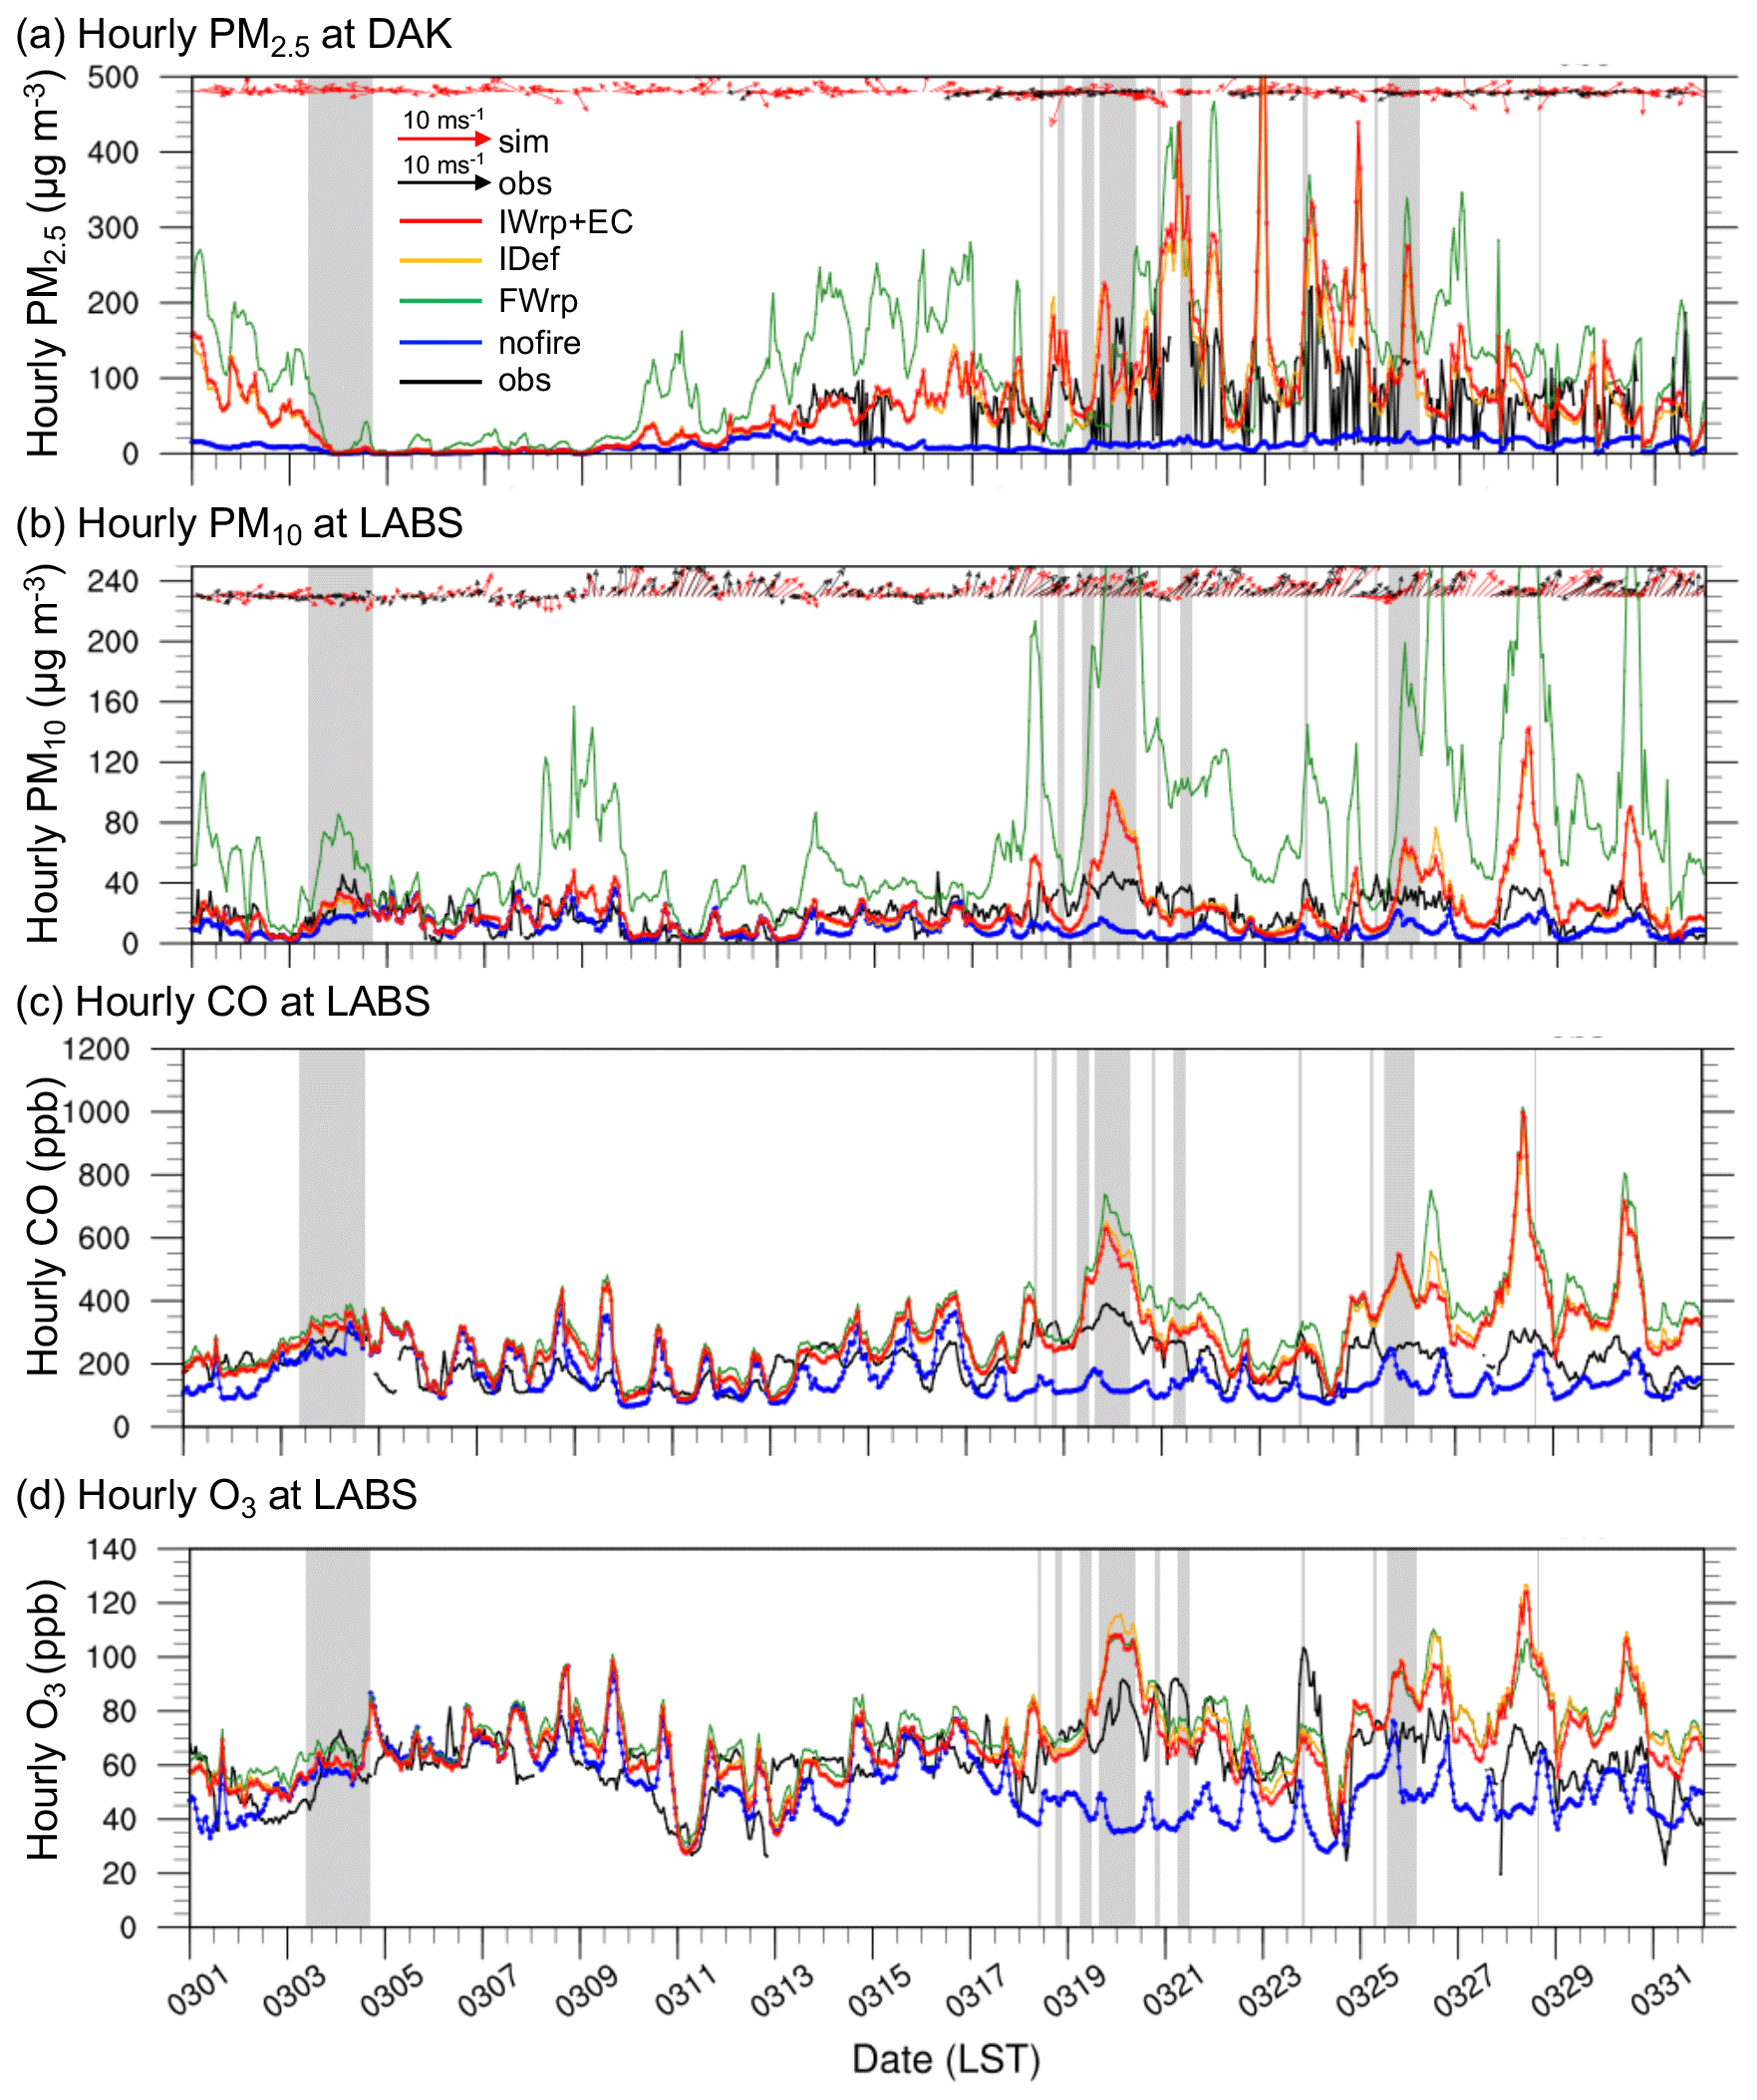
Figure 3Comparison of PLMRIM (observation (black), nofire (blue), FWrp (green), IDef (orange), IWrp + EC (red)) of (a) hourly wind field and PM2.5 at DAK and (b–d) hourly wind field and (b) PM10, (c) CO and (d) O3 at LABS in March 2013; gray shade highlights the high-pollution hour at LABS (CO > 300 ppb, PM10>35 µg m−3). Wind field for observation (black) and simulation (red) is shown in vector form.
3.1 Ground-based measurement stations
The model output is compared with the measurement data at a high-altitude background mountain station in the western North Pacific, the Lulin Atmospheric Background Station (LABS) (receptor; 2862 m a.m.s.l.; 23.47∘ N, 120.87∘ E), and Doi Ang Khang Meteorology Station (DAK) (source; 1536 m a.m.s.l.; 19.93∘ N, 99.05∘ E), marked in Fig. 1b and c. The DAK station is an upwind near-source BB location in nPSEA, located in Chiang Mai Province, Thailand, close to the border of Myanmar and Thailand. It is located away from the cities and mainly received air masses from burning regions in the upwind area (Hsiao et al., 2016; Pani et al., 2016), which made this site representative of the BB emissions from Myanmar, on the western side of Thailand (Khamkaew et al., 2016; S.-H. Wang et al., 2015). The hourly PM2.5 data from the DAK station were collected during the 2013 7-SEAS spring campaign. Table 3 shows the performance of PLMRIM for daily PM10, daily PM2.5, hourly O3 and hourly CO at LABS and DAK according to the model benchmark (correlation coefficient, R; mean fractional bias, MFB; mean fractional error, MFE; mean normalized bias, MNB; mean normalized error, MNE) suggested by the Taiwan EPA (see Sect. C in the Supplement). MFB results show that the pollutants are generally overestimated at these mountain stations. Unlike the case in the maritime continent that worked best with the F800 method (J. Wang et al., 2013), neither of the fixed-height methods (F0, F800, F2000) apply well for the nPSEA region. Only slight improvement is observed for the offline module (FWrp), with injection height varying according to the fire size. The inline modules (IDef, IWrp) have obvious improvement at both LABS and DAK. For the ground stations in Taiwan and Thailand (black markers in Fig. 1b and c), all models have underestimated the pollutant concentrations, while the IWrp has performed better than the default inline mechanism with higher correlation attained. The daily PM10 at the northern Thailand PCD source stations for IWrp achieved R=0.84, an improvement from R=0.77 of FWrp, while daily PM2.5 at the Taiwan EPA ground stations for IWrp achieved R=0.46, an improvement from R=0.26 of FWrp (see Table C1 for a detailed comparison). Adjustment of anthropogenic emission with ECLIPSE data (IWrp + EC) shows clear improvement of CO, especially at the stations in Taiwan but not in Thailand. The comparably insignificant emission amount of anthropogenic emission compared to the BB emission at the near-source BB sites in Thailand is attributed to the minor pollutant changes during the BB period.
Among all, the inline modules (IDef, IWrp, IWrp + EC) give the lowest bias and closest correlation with the measured ground station. This highlights the importance of atmospheric-stability-based PLMRIM to capture the plume rise variation at the source site. The boundary layer evolution throughout the day is very much distinctive for mountain valleys compared to the flat surface where burning usually happens. As highlighted previously (Chuang et al., 2016a; Dong and Fu, 2015b), the geographical lifting mechanism in nPSEA is the main factor enabling the BB emission to be carried into the subtropical westerlies and hence captured by LABS. Due to the similar performance among the offline and inline settings, the best-performing setup of the offline module (FWrp) and inline module (IWrp + EC) is selected to simplify the subsequent discussion.
Figure 3 shows the time series plots for the hourly wind field and PM2.5 at the DAK source site and hourly wind field, PM10, CO and O3 at LABS. The high-pollution episode (marked by gray shade) fits well with the great contrast between the model fire and nofire scenarios, thus confirming that BB plumes are the main pollution source in the high-pollution episodes. From the time series plot, the hourly PM2.5 at DAK (Fig. 3a) and hourly PM10 (Fig. 3b) at LABS are well captured by the inline module compared to the offline counterparts. In Fig. 3b, the wind direction shifted to strong southwesterlies in the second half of March. It is followed by a rise in pollution level at LABS. The offline module (FWrp) has significantly overpredicted PM10 at some peaks, even up 200 µg m−3. Fair agreement is obtained for CO (Fig. 3c) and O3 (Fig. 3d), with slight overestimation when concurrent high PM10 is modeled. Short-term peak values of 4–5 h are observed in all models for PM10, CO and O3. The systematic errors for these pollutants at the peak points are believed to be the uncertainties involving the FINN BB emission (Pimonsree et al., 2018). It is found that the performance of O3 is relatively unaffected by the PLMRIM choice.
3.2 Aerosol vertical distribution
As illustrated in the shaded region in Fig. 3, the major period that affected LABS is during 18–28 March 2013. The transport time is known to be around 2–3 d (Chuang et al., 2015), but a longer time of 4–5 d is taken to account for the BB emission generation, lifting and dispersion at the source site. Hence, the vertical profile of the extinction coefficient of the model output at the DAK station is compared with the ground MPLNET L1.5a lidar data during 13–28 March in Fig. 4. In Fig. 4a, the MPLNET extinction coefficient has shown that the aerosol layer presents around 3–4 km height and is mainly confined below the boundary layer. Despite the lower concentration on the surface than the boundary layer, the concentrated amount of aerosol detected by MPLNET (14–15, 19–22 and 23 March) still agrees well with the DAK time series data in Fig. 3a.
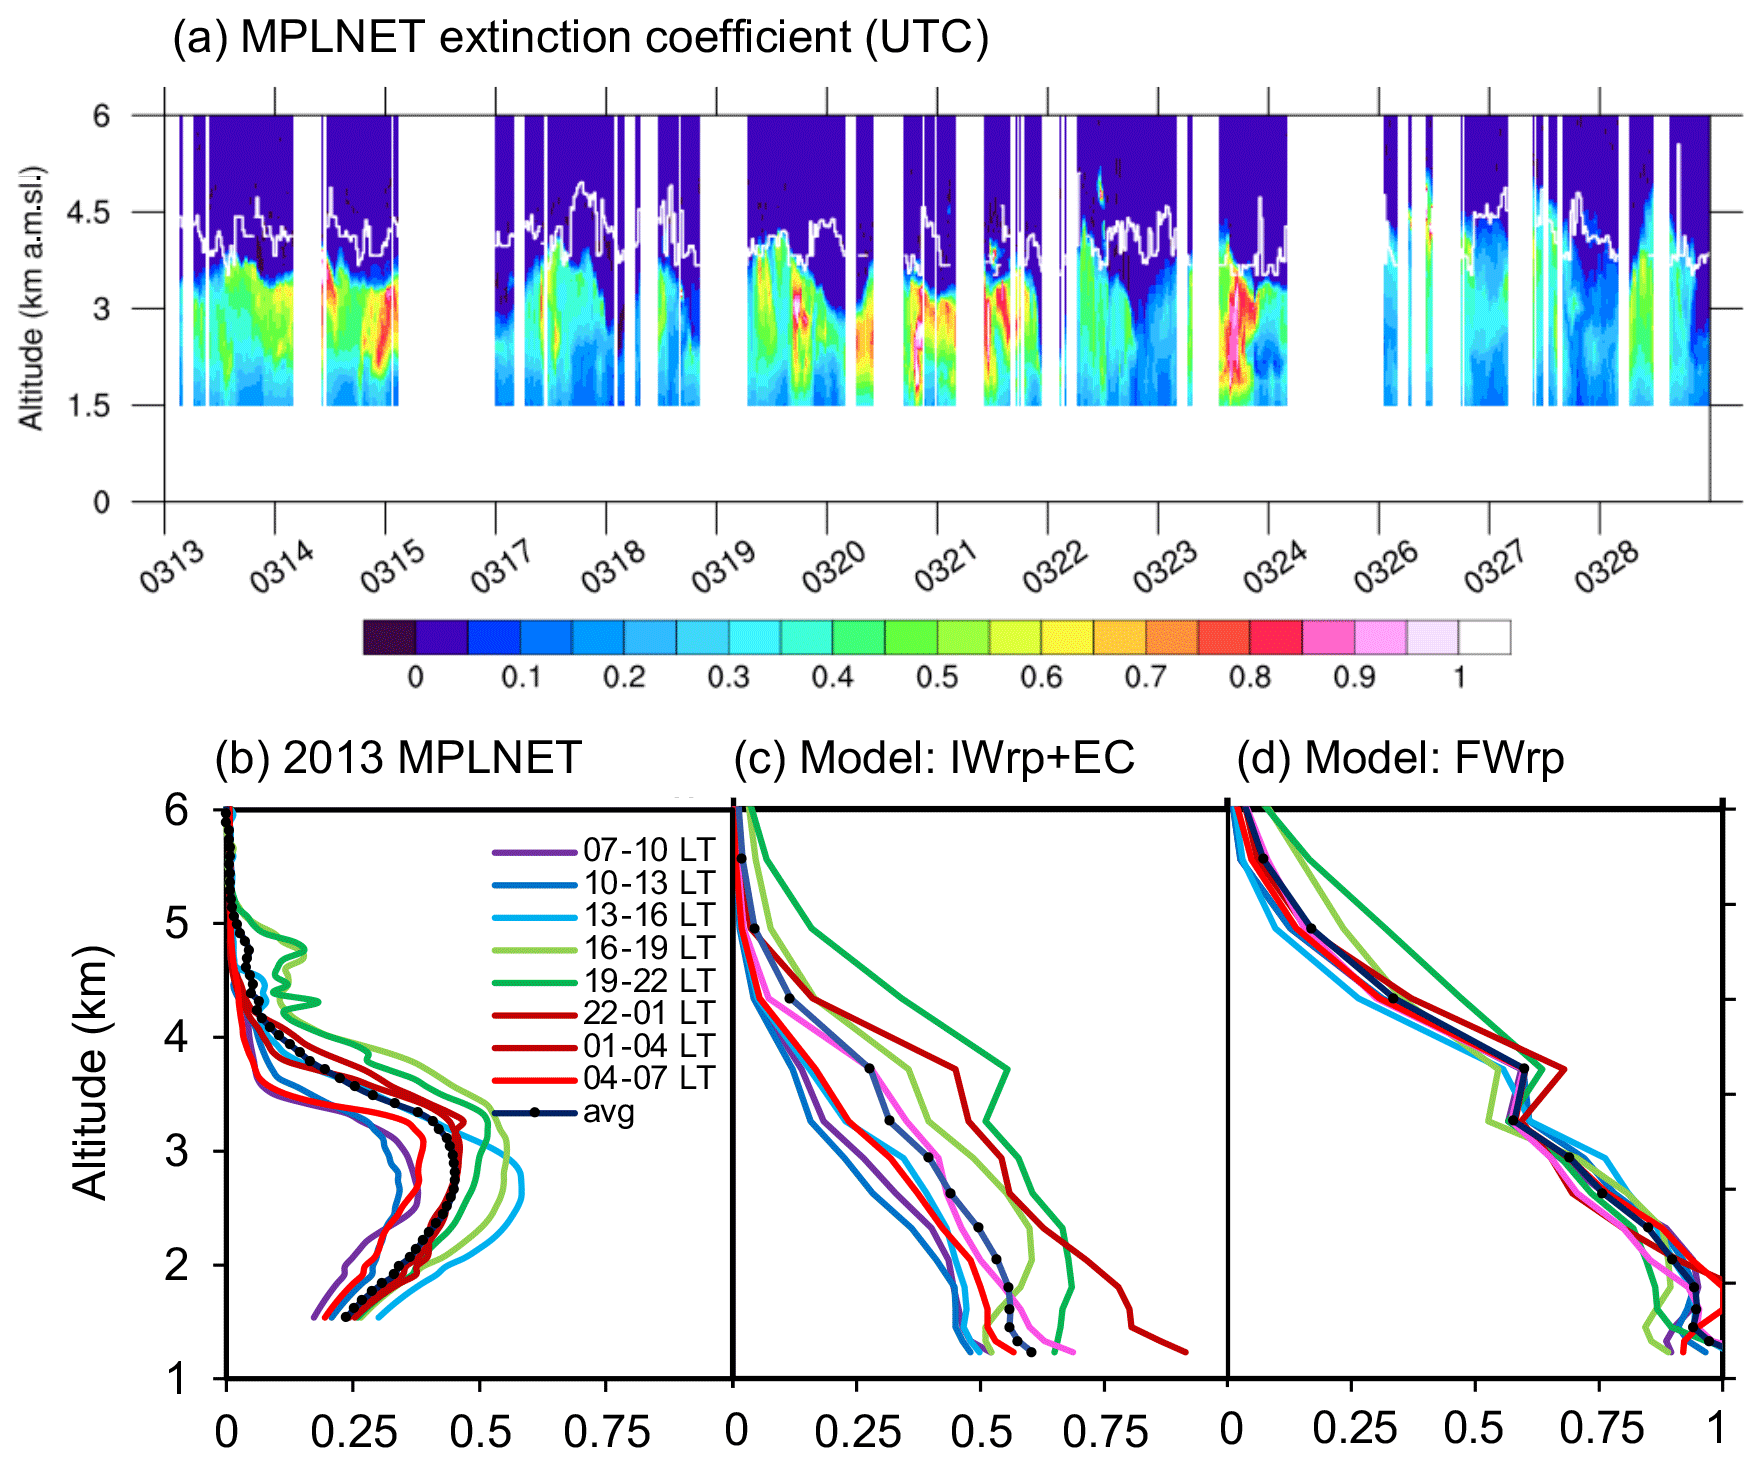
Figure 4(a) Vertical extinction coefficient profiles between 13 and 28 March 2013 at the DAK station from MPLNET with boundary layer height (white), (b) MPLNET 3-hourly average extinction coefficient, (c) IWrp + EC 3-hourly averaged model output, (d) FWrp 3-hourly averaged model output.
The 3-hourly average profile of the extinction coefficient from MPLNET data as well as IWrp + EC and FWrp model output during 13–28 March 2013 at the DAK station is illustrated in Fig. 4b–d. In Fig. 4b, the MPLNET extinction coefficient is low at the surface and peaks between 2.5–3.2 km. The model output has a lower elevation over the DAK station and has modeled a higher extinction coefficient, which is likely to be the accumulation effect due to lower-wind conditions. The model output in Fig. 4c and d shows that the maximum layers above the presumed cap (3.2 km) occurred most prominently during the evening to midnight and more often in offline than inline modules. The model shows that the offline module gives a time-invariant large value over the entire layers, while the inline module gives a greater approximation of the diurnal variation with the MPLNET result throughout the day. Therefore, during the daytime, the offline module has produced a higher plume height than the CMAQ inline module (Guevara et al., 2014). However, the 3-hourly averaged temporal variation in extinction coefficient of inline output fits well with that observed by the MPLNET system.
The extinction coefficient from MPLNET and model output data are only available for qualitative comparison due to their generically different derivations. The lidar system determines the extinction coefficient through the backscatter feedback from the release of the laser beam at 527 nm at every minute, while the CMAQ model used the mass reconstruction method to sum up the extinction coefficient of each model aerosol species in each layer (Mebust et al., 2003). The empirical assumption for each species and the lower vertical model resolution is attributed to the uncertainties in the modeled extinction coefficient that is typically higher than the value retrieved by MPLNET.

Figure 5CALIOP vertical feature type and aerosol subtype during a continuous episode starting from (a–c) 19 March (06:02 LST), (d–f) 19 March (13:42 LST) and (g–i) 20 March (02:07 LST). The corresponding position of the satellite swath is marked in points of red and gray marked in (a, d, f) and altitude below 0 km in (b, c, e, f, h, i). Feature type: 0 – invalid, 1 – clear air, 2 – cloud, 3 – aerosol, 4 – strato, 5 – surface, 6 – subsurface, 7 – no signal; subtype of feature: ND – no data, 1 – marine, 2 – dust, 3 – polluted continental, 4 – clean continental, 5 – polluted dust, 6 – smoke.
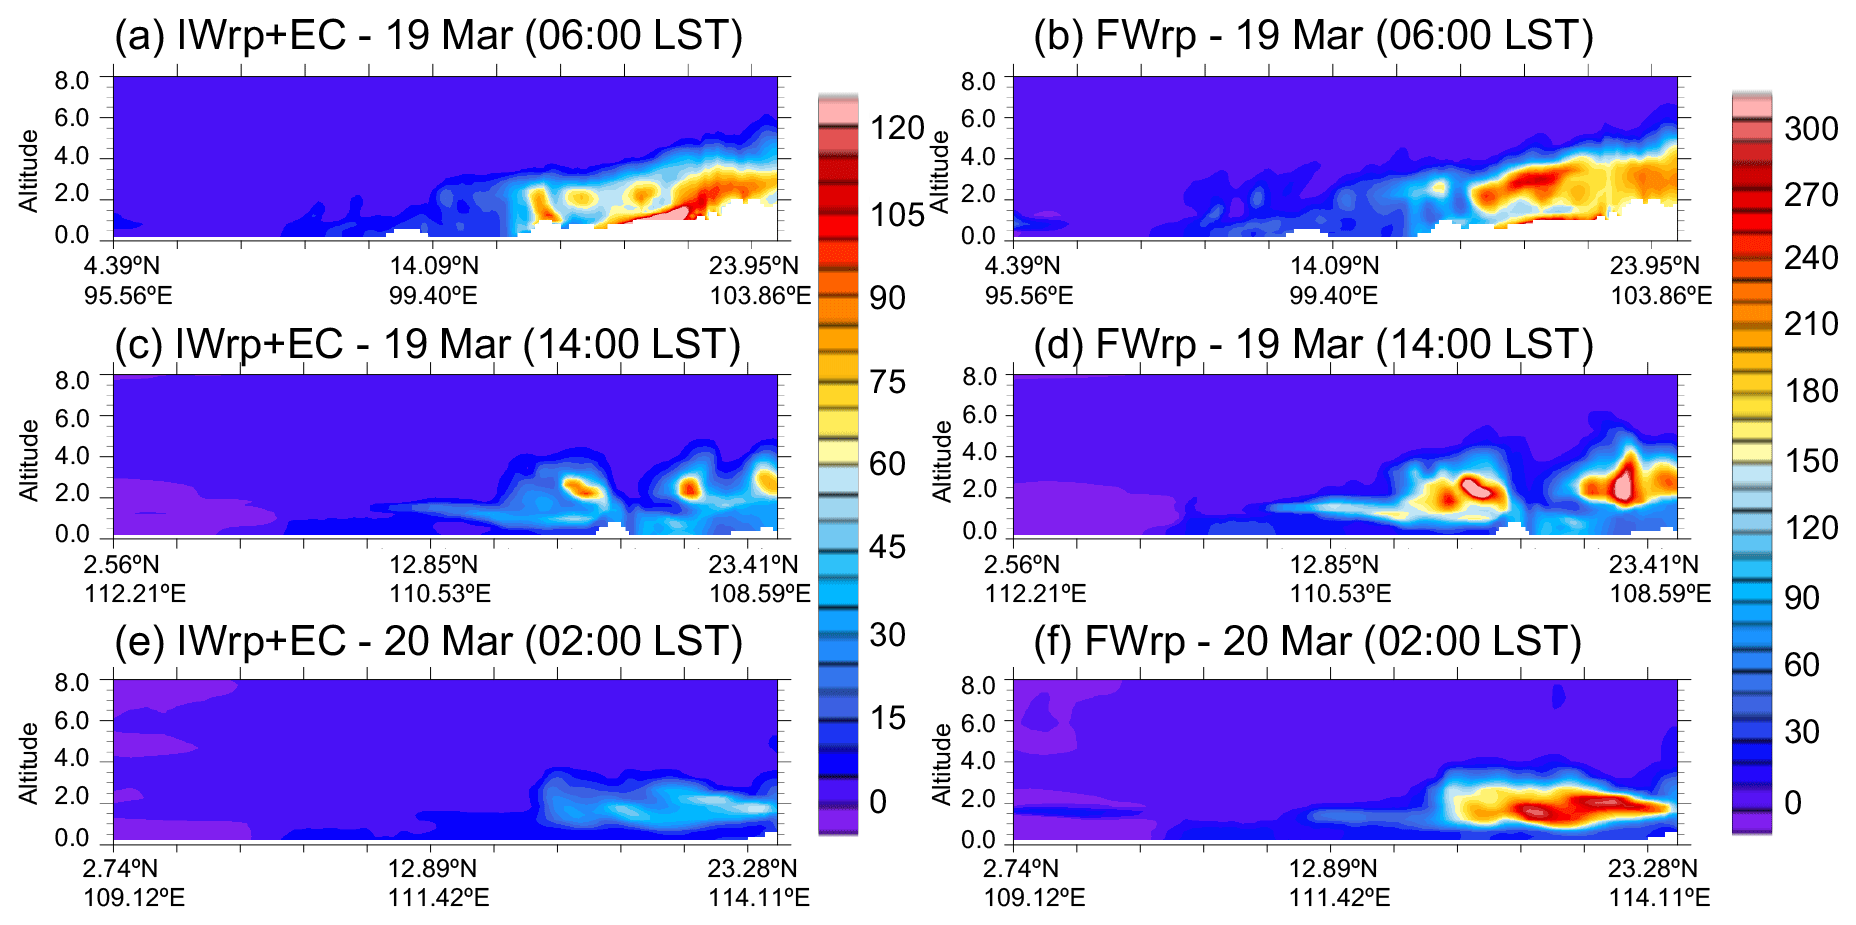
Figure 6Comparison of model PM10 (µg m−3) cross-sectional profile corresponding to CALIPSO period and swath in Fig. 4. The range of the left panel is 0–120 µg m−3, and the range of the right panel is 0–300 µg m−3.
Figure 5 shows the CALIOP VFM at the midpoint of the BB pollutant transport route to the receptor during one of the episodes on 19–20 March 2013. On the morning of 19 March, the sensor (swath: Fig. 5a) captured the smog layer at a height of 4 km a.m.s.l. (above mean sea level) over the mountainous region (Fig. 5b and c). The aerosols detected are mainly made up of smoke and mixed polluted continental aerosols, which is the main burning emission source. It is known that the burning aerosols from the western part of nPSEA are orographically lifted by west-to-southwesterlies to a higher altitude depending on the terrain height (Cheng et al., 2013; Z. Wang et al., 2015). For the swath in Fig. 5d–f, the aerosol layers are detected at high levels up to 4 km during the midday. It is most certain to be transported over from nPSEA since the aerosol layer is detected over the sea, where burning does not occur. Secondly, the plume thickness is around 4 km despite the flat land surface, which is much higher than the source site, which usually ranges between 0–3 km. The aerosol layers are believed to be lifted to a higher level and also mixed to the surface over the land mask in southeastern China, which is later confirmed in the model result in Sect. 4. This region locates one of the largest cities and main industrial bases in Asia, the Pearl River Delta (PRD), which produces a large amount of anthropogenic emission. The potential vertical mixing is very likely to pick up the pollutants from the industrial base into the aerosol plume. Recently, it is proven through brute-force methods that the pollution from the PRD cluster arrived at the higher altitude in Taiwan during the winter season (Chuang et al., 2020). About 12 h later, when the swath (Fig. 5g–i) moved closer to Taiwan, the plumes moved towards north of 16∘ N but still maintained a similar altitude that could be detected by the LABS station at ∼2.4 km a.m.s.l. in the model (Fig. 1). The plume is also found to continue gaining moisture content along the path.
A detailed comparison of vertical distribution for all sensitivity tests is given in Sect. D in the Supplement, but here we continue to discuss the FWrp and IWrp + EC cases. In general, the offline FWrp produces a much higher concentration of high-PM10 aerosol layers compared to the inline IWrp + EC. Figure 6 shows the model PM10 result for FWrp (range: 0–300 µg m−3) and IWrp + EC (range: 0–120 µg m−3) for the corresponding period of CALIPSO swath in Fig. 5. Comparison of Fig. 6a–d shows that the FWrp produces higher plumes, and IWrp + EC produces lower plumes since the former produces the initial plume profile on 19 March that is consistently high and less dependent on the atmospheric stability induced by mountain flow (Fig. S3). Farther from the source site (Fig. 6e and f), both runs predict a much lower aerosol layer around 2 km compared to the 4 km height captured by the CALIOP sensor. The underrepresentation of both systems along the transport path above the sea might be due to the moisture detrainment and entrainment process that is not accounted for in the current model (Paugam et al., 2016; Sofiev et al., 2012).
With a concentration difference of more than a factor of 2 between FWrp (up to 300 µg m−3) and IWrp + EC (up to 120 µg m−3), a more accurate value is captured at LABS by the IWrp + EC, as shown in Table 3. Regardless of the PLMRIM used, the top height of the plume is confined by an overhead upper-layer wind system. The system has created a strong shear and suppressed the lifting pertaining to the burning convective heat. This explains the invariant of plume height when different settings are used.
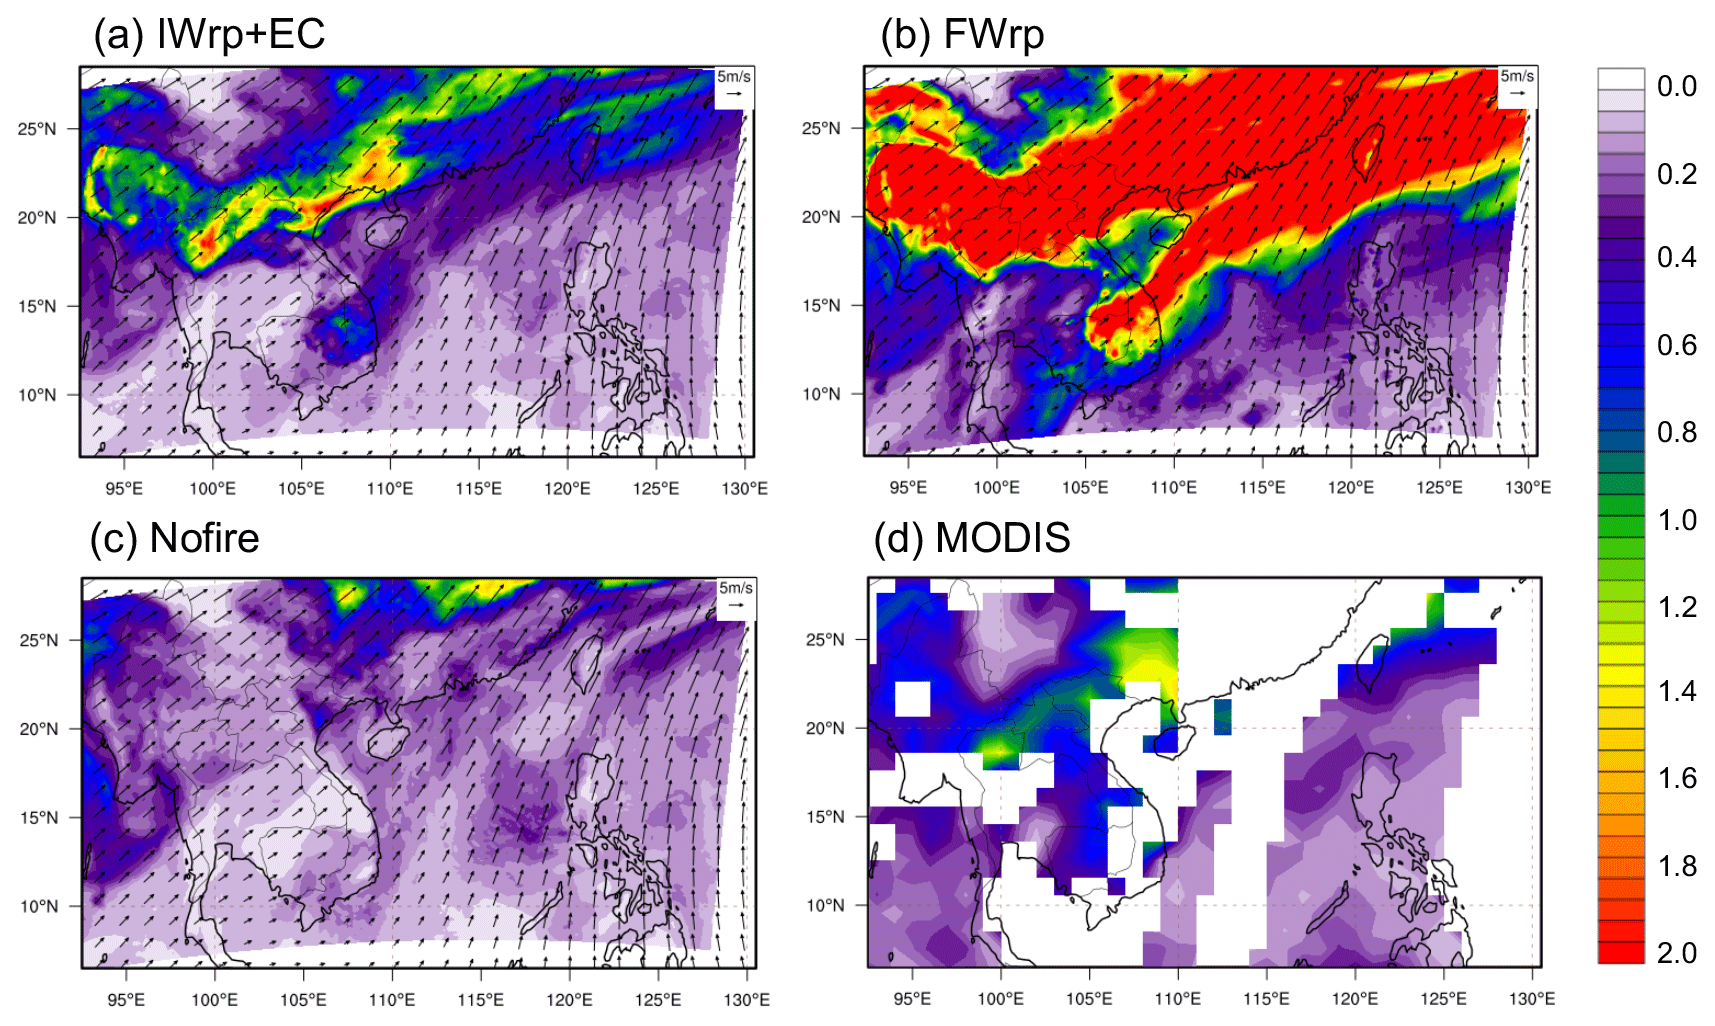
Figure 7Comparison of daily total column AOD on 20 March (10:30 LST) of model output (a) IWrp + EC, (b) FWrp and (c) nofire with (d) MODIS data from Fig. 5. Vector profiles given in (a–c) are the surface wind profile.
The cross-sectional profile of PM10 in Fig. 6 shows that the amount of emission produced by the offline method is substantially larger than the amount produced by the inline method. However, the vertical PM10 value could not be verified due to the lack of measurement of vertical distribution of PM10. The amount of PM10 has directly contributed to the columnar AOD value, and the latter could serve as a good benchmark for the accuracy of model aerosol concentration. Hence, the total columnar AOD data provided by the MODIS Terra Level 3 AOD product (MOD08_D3; Platnick et al., 2015) during the same period (20 March, 10:30 LST) are used for the verification of the aerosol concentration through the columnar AOD value. Figure 7 shows the second model domain (d02), which covers the transport route between the source (d04) and the receptor (d03) domains. The comparison between Fig. 7a and c is able to show the difference between fire and nofire cases, which is solely contributed by the biomass burning plumes from nPSEA. The figure also shows that the total column AOD produced by the inline module gives an approximation closer to that of MODIS. FWrp greatly overestimates the aerosol produced by the BB emissions, while the inline module gives a closer agreement in northern Thailand and southern Vietnam.
3.3 Reliability of inline PLMRIM
The variation in model performance might be caused by the compatibility of the emission inventory with the PLMRIM performance. The FINN dataset provides higher-resolution data for each fire (1 km2) compared to the other emission dataset (GFEDv4s: 0.25∘; GFASv1.2: 0.1∘). As the finest study domain at the burning source is downscaled to 5 km, the FINN dataset would have the nearest representation of the emission grid distribution. BB emission in nPSEA is mainly caused by small fires and prevailing dry conditions over the period (Giglio et al., 2013; Reid et al., 2013); hence the representation of the small fires (usually accounted from 500 m burnt area) in the emission inventory is relatively crucial. This might have been one of the reasons that it fits better in the inline calculation with the plume-in-grid concept. When the offline method is adopted (FWrp), the FINN emission dataset in the nPSEA region tends to overpredict by a factor of 4 (Fig. 3a). Previous literature has had to make an adjustment to the fire inventory to bring down the FINN emission amount of PM2.5 and PM10 that was overestimated by a factor of up to 2 to 3 at the source region (Pimonsree et al., 2018), and FLAMBE overestimates CO and PM10 up to a factor of 3 at the LABS site (Chuang et al., 2015; Fu et al., 2012). From this study, it is seen that the prescribed heights in the offline method have overestimated the plume rise height under the dry weather condition, where the atmospheric stratification damps the pyro-convection through entrainment, while the inline module (IWrp + EC) considers the variability in atmospheric condition over the mountain region better.
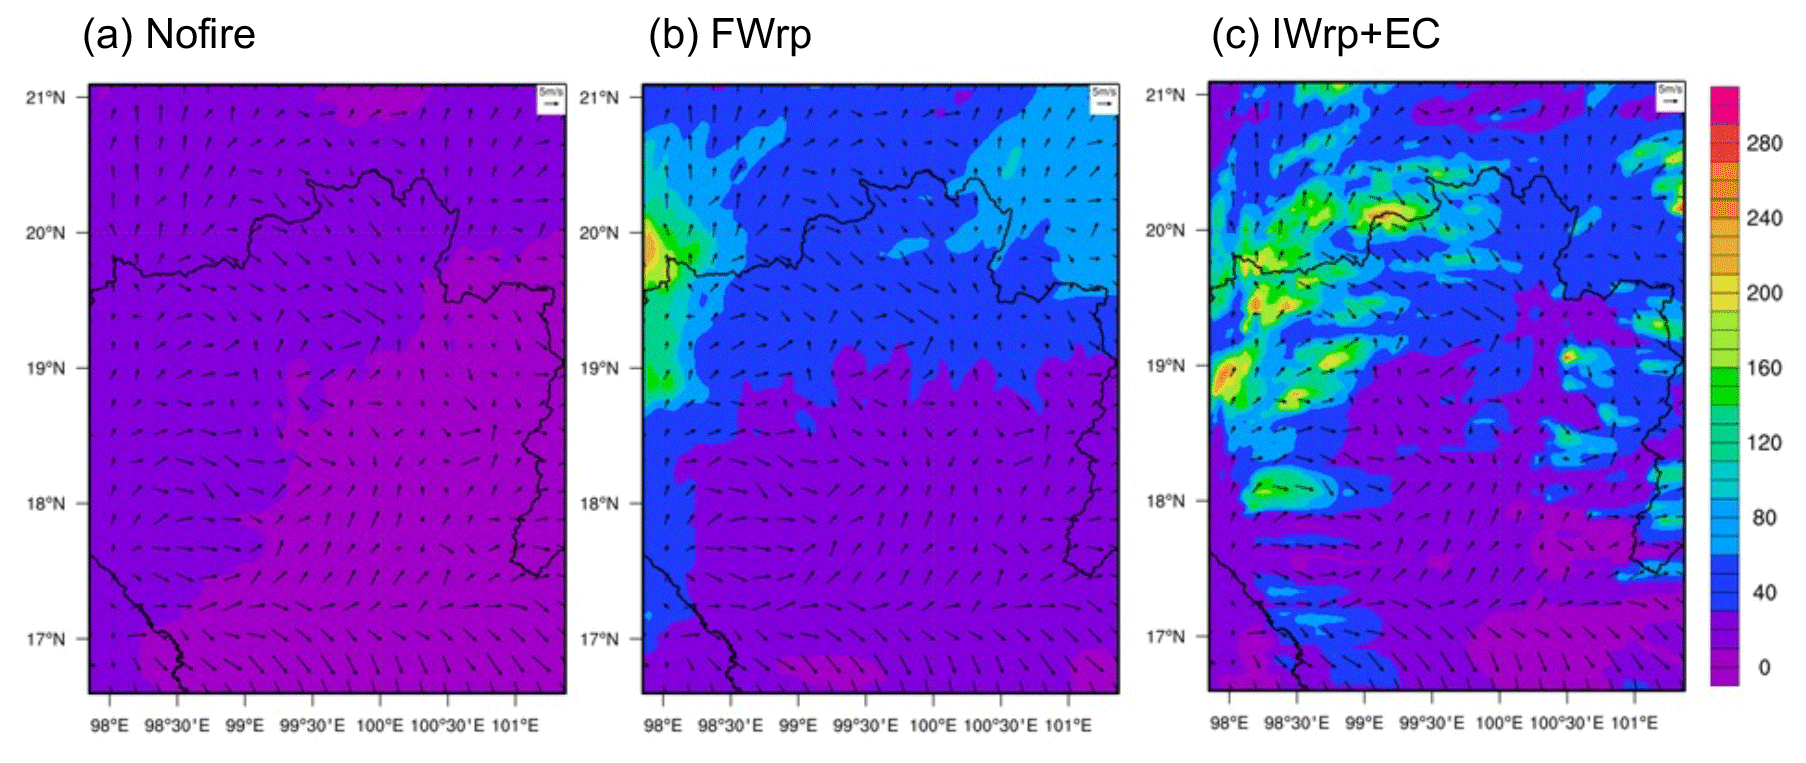
Figure 8Spatial distribution of near-surface PM10 concentration on 19 March 17:00 LST over burning regions of nPSEA for the fourth domain (d04).
The inaccuracy of the offline module is likely to be caused by the role of the complex terrain in uplifting the smoke plume and the nature of the fuel loadings. The connecting slopes (0.2–1.8 km, as seen in Fig. 1c) cause the complication to boundary layer physics that governs the dynamics to transport the plumes formed in the valley pockets. Due to the unique topographic structure in nPSEA, the lifting and breaking away of burning emission plumes from burning area occur during the evening to night period. Therefore, mountain meteorology played an important role in the distribution of higher-level plumes. Moreover, the ability of PLMRIM to capture the boundary layer physics becomes essential in the mountainous region. Through the inline module with the WRAP initial plume profile (IWrp + EC), the natural buoyancy of fire together with the convective interaction of the atmosphere can correctly distribute the BB emission. The spatial distribution of PM10 over burning regions in nPSEA is shown, with comparison made for the scenarios nofire (Fig. 8a), offline (Fig. 8b) and inline (Fig. 8c). Comparison of the figures shows that each sub-grid-scale fire hotspot more realistically represents the actual high concentration of emission emitted at the source (Fig. 8c) compared to the grid-following averaged-out effect in the offline method (Fig. 8b). Nevertheless, the current setting does not include the two-way aerosol–radiation and aerosol–radiation–cloud feedback. This will be further studied in future work looking at its importance in the cloud-laden SEA region (Tsay et al., 2016), as seen in the missing data due to the cloud cover in Fig. 6d.
The discussion below is performed using the model output of IWrp + EC and focuses on the high-pollution episodes observed at LABS during 13–28 March 2013, as seen in the gray shaded area of Fig. 3. In the source region of nPSEA, the complex land terrain has played a substantial role in the BB plume lifting. Figure 9 shows the evolution of the PM10 concentration on 13 March 2013 at DAK but over nPSEA through the cross-sectional profile (Fig. 1c). During the day when the fires are active, BB emission is released from the surface (Fig. 9a and b). Along with the rising of planetary boundary layer height (PBLH), the BB aerosol mixes into the entire boundary layer. The residue layer starts to form during the transitional period between the day and night around 17:00 LST (Fig. 9c), when the ground surface cools down. When the atmosphere becomes stable into the night, the aerosol layer remains as the residue layer and does not move down with the boundary layer (Fig. 9d). The plume starts to be advected by the shear of the upper-layer flow at night on the downwind lee side of the hills. The descent of the boundary layer also confines the aerosol and causes a high concentration near the surface. The detachment of the aerosol layer therefore explains the two-layer plume feature from evening into the night in Fig. 4b and c. The dispersion of emission from the pockets is subjected to at least three systems: (i) strong westerlies from Myanmar flowing over the top of valley pockets that confined the emission (terrain structure shown in gray in Fig. 9), (ii) diurnal mountain valley breeze that might trap or disperse the emission, and (iii) local heating caused by the solar cycle that affects the plume rise and disperses the emission. Therefore, the amount of burning emission lifted is greatly coherent with the populated hills along the transport path.

Figure 9The modeled vertical cross-section profile (BB' in Fig. 1c) up to 5 km over nPSEA on 13 March: PM10 concentration (contour; IWrp + EC; µg m−3), horizontal wind profile (vector; m s−1) in x direction and vertical wind profile in y direction (vector; cm s−1), boundary layer height (dotted lines; in meters), terrain (shaded).
Comparing the model output data of the inline (IWrp + EC) and nofire cases, Fig. 3 shows that BB from nPSEA contributes 68±18 % to PM10, 66±18 % to PM2.5, 41±13 % to O3 and 58±13 % to CO during the intense BB period (18–27 March) at LABS, while BB contributes 43±31 % to PM10, 41±32 % to PM2.5, 23±19 % to O3 and 39±23 % to CO at LABS for the entire month of March 2013. The transport pathway of BB from nPSEA to LABS coincides with the anthropogenic emissions from nPSEA as well as southeastern China; BB aerosols from such emission regions are also captured in the model. Therefore, the actual amount might indicate a slightly lower contribution by BB aerosol than the derived contribution. There are several mechanisms identified in March 2013 to bring BB smoke to Taiwan.
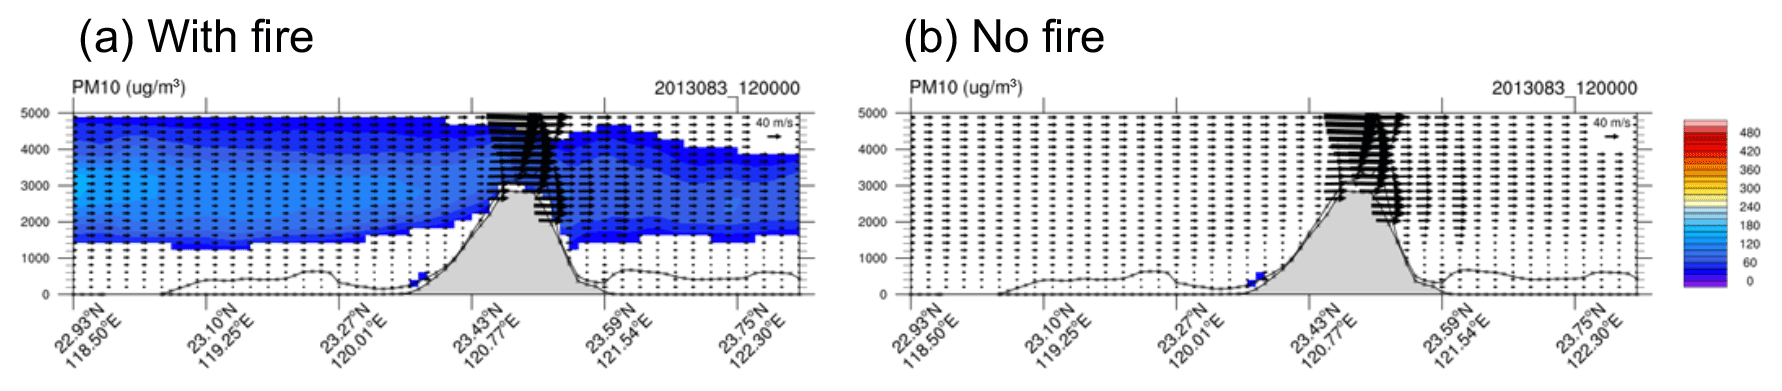
Figure 10Vertical cross-sectional AA' (Fig. 1b) profile for PM10 (contour), wind in x–z direction (vector), PBLH (dotted lines) and terrain height (gray shade) on 24 March at 20:00 LST (a) with fire and (b) with no fire.
4.1 Westerlies to carry BB emission to LABS
In this case, the BB aerosol lifted is further carried by strong westerlies in the upper layer, around heights between 2–4 km towards LABS. This usually occurred during the night, when the atmospheric boundary layer is low and stable, as shown in Fig. 10. This is the commonly known mechanism that carries the BB plumes to higher ground in Taiwan. This condition occurred on 19–20, 24–25 and 27–28 March 2013. This is the commonly known scenario that is well studied due to the availability of measurements collected at LABS (Lee et al., 2011; Ou-Yang et al., 2014).
4.2 Mixing of BB emission with local pollution on surface
The land surface is heated up, and the boundary layer during the day grows as high as 1.5–2 km a.m.s.l. in western Taiwan, around 1 km a.m.s.l. on the windward side of the central mountain range and up to ∼4 km a.m.s.l. at LABS. When the BB plumes overpass are as low as the PBLH, then the BB aerosol is brought into the boundary layer and mixed to the ground, as shown in Fig. 11. The interaction of BB plumes with local pollutants depends on the loading of local pollutants that are present. The latter are subjected to the local weather system and the occasional Asian continental cold surge that might clean the accumulated pollutants. Such cases usually occur during the morning to noontime, when the land surface heats up, and PBLH develops. This condition occurred on 18, 19, 20, 21 and 28 March 2013. This is the main mechanism where BB aerosol affects western Taiwan. The detection of BB intrusion into surface sites in southwestern Taiwan is not a rare occurrence (Huang et al., 2013; Tsai et al., 2012). It was pointed out that cold surges might be responsible for the downdraft of the BB smoke plumes to the surface (e.g., Lin et al., 2017).
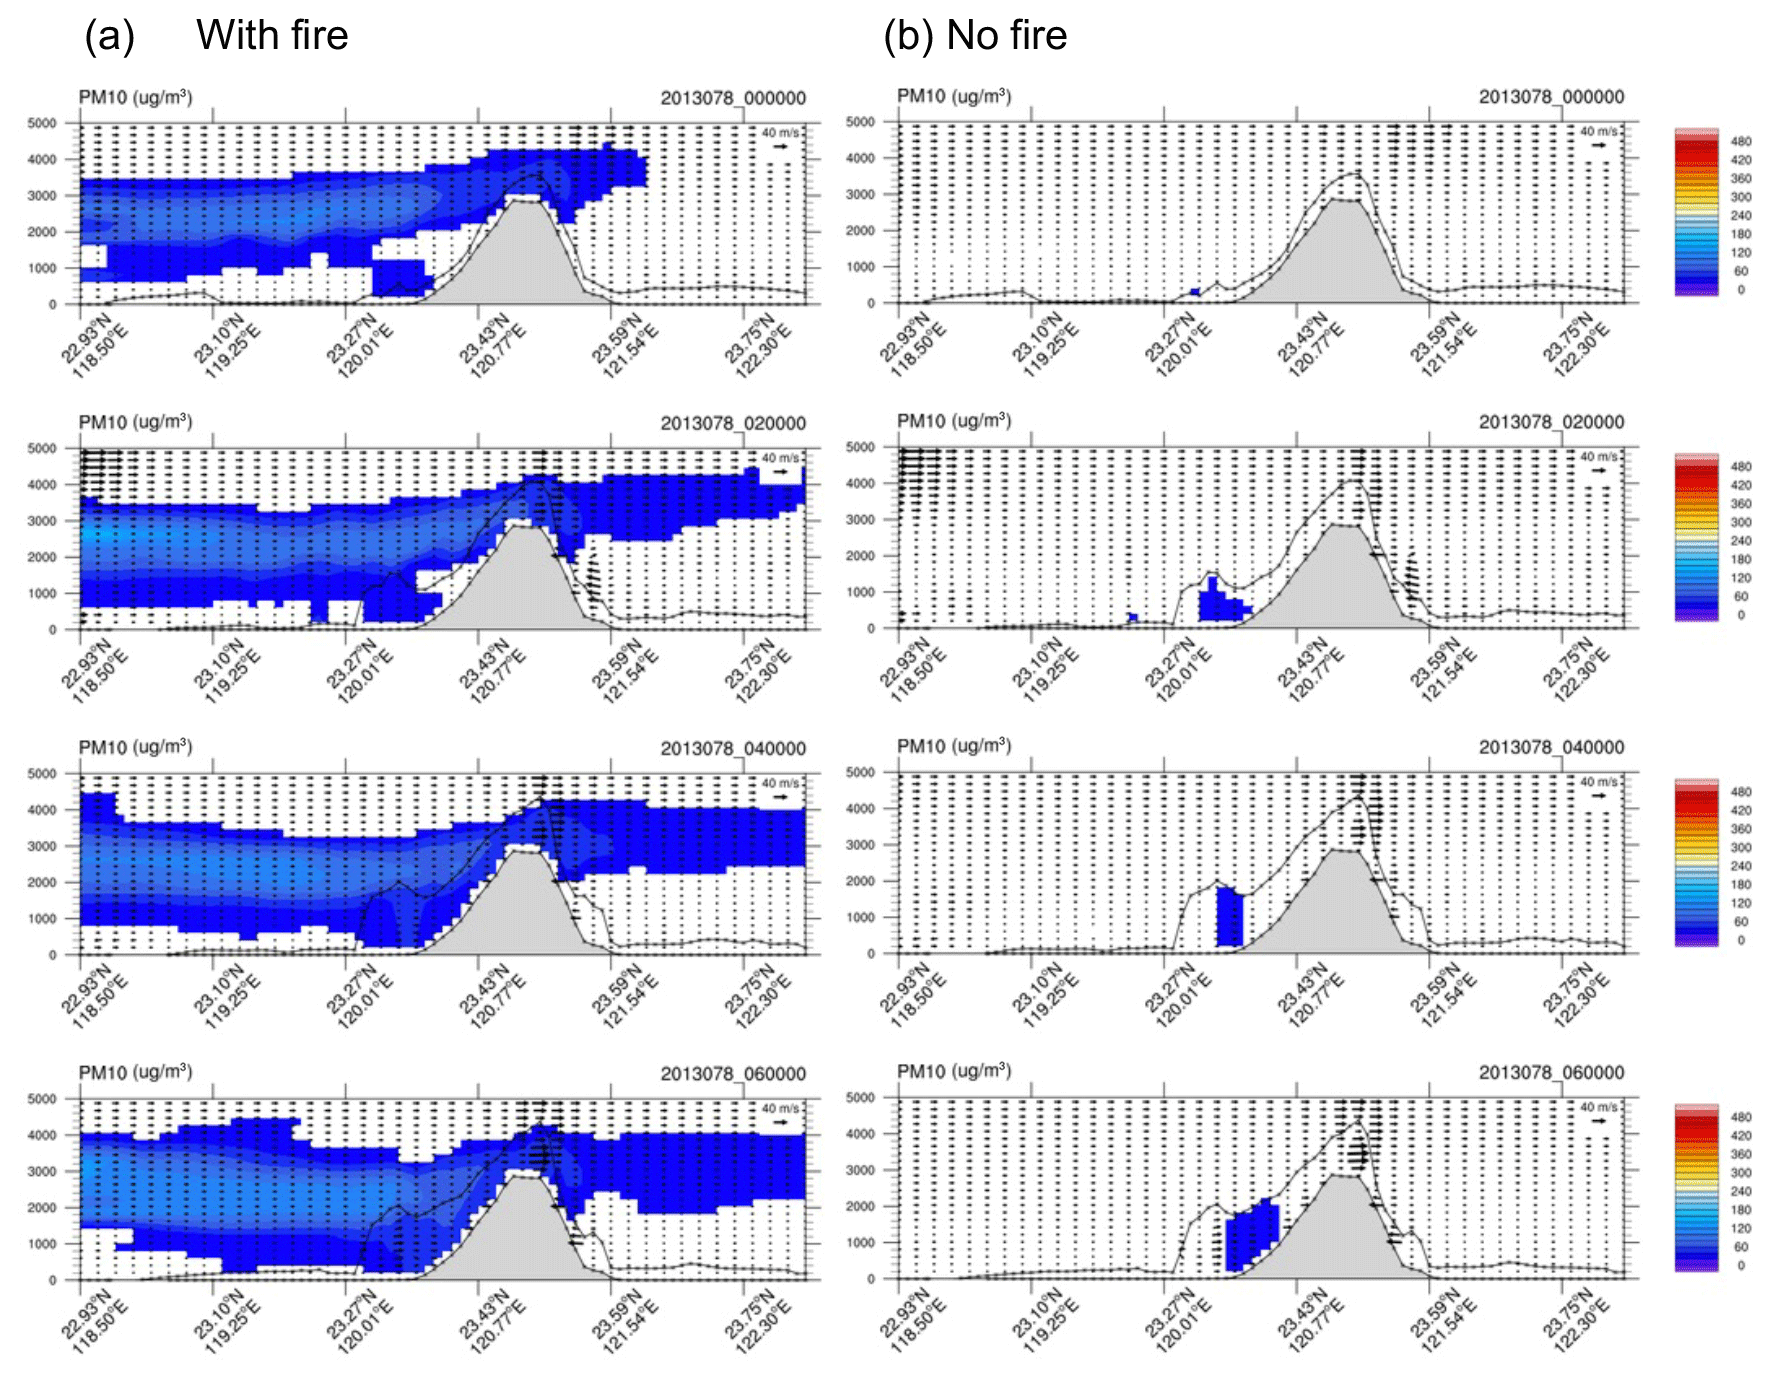
Figure 11Similar to Fig. 10 but on 19 March 2013 at 08:00, 10:00, 12:00 and 14:00 LST (a) with fire and (b) with no fire.
4.3 Mixing of BB emission with local pollution above surface
Along with the sea–land heat difference, the sea breeze and mountain breeze are formed and enhance the uphill movement of local pollution in western Taiwan. In such a case, the local pollution is brought up to a high elevation to interact with the BB smoke plumes, as shown in Fig. 12. The local pollutants also brought uphill detaches from the planetary boundary layer when the surface cools down quickly. This residue layer of pollutants is then mixed into the BB layers and carried towards the east. Such cases usually occur during midday, when the local pollution plumes have moved up to the hill. This condition occurred on 17, 23 and 25 March. A larger number of fine nanoparticles from local sources is measured at LABS, especially during the morning, even outside of the spring burning season (Chen et al., 2013). Therefore, it is possible that mixing does occur when the local pollutants are transported up the hill through the valley breeze.
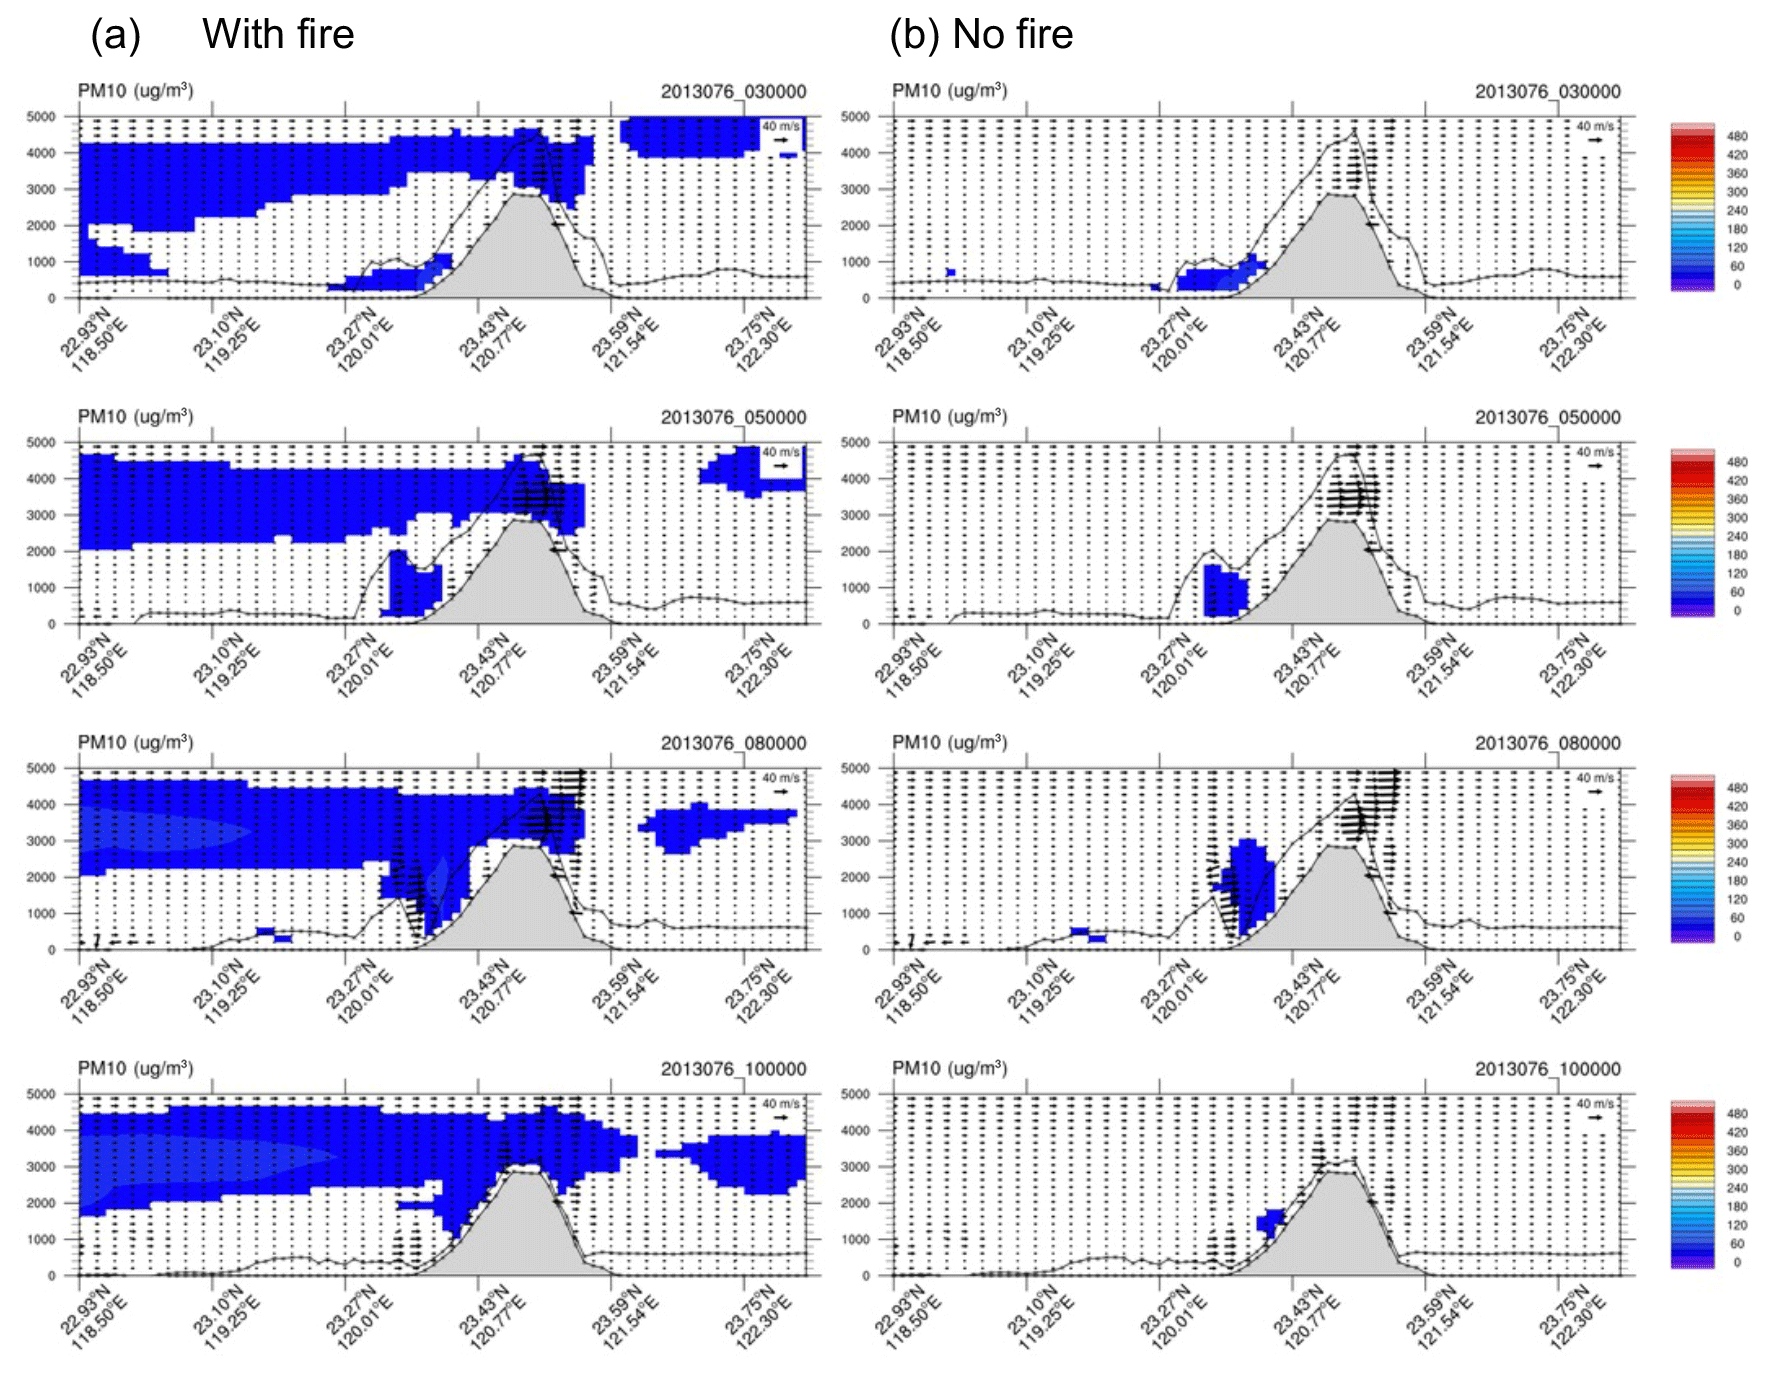
Figure 12Similar to Fig. 10 but on 22 March 2013 at 11:00, 13:00, 16:00 and 18:00 LST (a) with fire (b) with no fire.
Among the three mechanisms, the BB aerosols have a more direct influence on the surface site in western Taiwan under the second mechanism. Such conditions occurred due to an Asian continental cold surge that moved the high-pressure system southeastwards. Under favorable upwind weather conditions, the dust can be lifted and transported downwind and concurrently be present with the BB aerosols. Such a situation is shown by the co-existence of two major pollution events (dust and BB) that reduced the surface O3, NOx and SO2 aerosols over western Taiwan in 2006 (Dong et al., 2018). However, all three of these mechanisms are prone to altering the radiative forcing over western Taiwan. The future incorporations of the aerosol radiative forcing effect through one-way and two-way meteorology–chemistry processes of moisture detrainment and entrainment are necessary to understand the role of BB aerosol in the weather extremes in downwind regions. The cloud–aerosol interaction is particularly crucial to the study of the impact of BB aerosols in cloud-laden regions between nPSEA and Taiwan (Hsu et al., 2003; Tsay et al., 2016). The allocation of smoldering fraction in SEA will need to be improved to account for the tendency of small fires to smolder (Akingunola et al., 2018; Zhou et al., 2018).
In this study, several factors involved in the modeling of BB smoke plumes are tested in the WRF–CMAQ model, namely the injection height, initial vertical distribution profile of BB emission, inline PLMRIM and amount of anthropogenic emission. The conventional method used for the study region adopted the fixed-height allocation, which produces an excessive amount of emission over the entire transport route. The initial vertical allocation profile according to the WRAP empirical coefficient (IWrp) improves the surface concentration of the BB emission by the inclusion of the smoldering fraction compared to the default inline PLMRIM (IDef), while replacing the MIX (IWrp) emission in SEA countries with ECLIPSE (IWrp + EC) also improves the pollution concentration simulation at the downwind LABS, especially CO, which is the most important tracer of anthropogenic emission.
The model comparison shows that regardless of the injection height, the main deficiency of the fixed-height offline algorithm originates from its invariant vertical-layer allocation of BB concentration throughout the day. In the complex terrain over the nPSEA region, which is continuous and varies between 0.2 and 1.8 km, mountain meteorology played an important role in the distribution of higher-level plumes. The two-layer structure of the BB plumes observed in the MPLNET extinction coefficient profile at night is well captured by the inline PLMRIM (IWrp + EC), while the offline method (FWrp) gives a time-invariant large value over the entire layers. This highlights that the inline PLMRIM (IWrp + EC) is able to incorporate the diurnal boundary layer physics of the mountain to accurately represent the vertical distribution of the BB concentration in the source and downwind region. It is then clear that the amount of emission produced by the inline reasonably captures the columnar AOD distribution over the transport route between nPSEA and downwind Taiwan when compared to the MODIS columnar product. It is discovered that the inline module with the initial distribution profile of WRAP (IWrp + EC) is able to perform well at both the source and receptor sites compared to the offline module.
The model output shows that the BB plumes near nPSEA are emitted during the day within the BLH. Due to strong mountain valley wind, the smoke plume layers tend to detach from the BLH as residue layers when the surface cools down in the evening to night period. This is the layer of plumes that entered the free troposphere at approximately 1–3 km height and were further transported over to the western North Pacific and Taiwan. The plume layers clearly affect the Taiwan region via three conditions: (a) overpassing western Taiwan and entering the mountain area (LABS), (b) mixing down to western Taiwan, (c) transport of local pollutants upwards and mixing with BB plumes at LABS. The second condition involves the prevailing high-pressure system that is able to impact most of the population in Taiwan and would be an interesting case to explore in subsequent work.
However, care should be taken to select the BB emission inventory input when switching from the offline module to the inline module. The sub-grid-scale allocation of the BB emission requires fitting and testing of the BB emission inventory to make sure it reproduces the individual fires with distinct and realistic peaks. The work highlights the importance of atmospheric-stability-based PLMRIM and the accurate application of emission inventories to capture the plume rise variation at the source site with complex terrain. The correct representation at the nPSEA source site substantially affects the downwind BB concentration at mountain (LABS) and surface sites in Taiwan. It is also observed that the improved setting is able to represent the source site's vertical profile well; however, the height of the plume is reduced following the transport and evolution of the plume approaching Taiwan. This might be caused by the missing algorithm of the indirect and direct effect between aerosols and the high-cloud-cover region along the transport path. It leads to future exploration and incorporation of the effect of cloud–aerosol interaction over the cloud-laden region.
All the datasets presented in this study are available upon request from the corresponding author.
The supplement related to this article is available online at: https://doi.org/10.5194/acp-21-12521-2021-supplement.
MCGO carried out the model simulations, made most of the figures and analysed the data. MTC, JSF and NHL provided the supervision and conceptualization. SSK, WSH, SHW and SP helped with the data curation and investigation, while AC, SKP and NHL reviewed and edited the manuscript. NHL acquired the fund for this project.
The authors declare that they have no conflict of interest.
Publisher's note: Copernicus Publications remains neutral with regard to jurisdictional claims in published maps and institutional affiliations.
This article is part of the special issue “Regional assessment of air pollution and climate change over East and Southeast Asia: results from MICS-Asia Phase III”. It is not associated with a conference.
The authors gratefully acknowledge all assistants involved in the system installation, maintenance and site operation at Mt. Lulin and Doi Ang Khang stations. The 7-SEAS, MPLNET and AERONET projects were supported by the NASA Earth Observing System and Radiation Sciences Program. The authors would like to acknowledge EPA Taiwan, CWB Taiwan and PCD Thailand for the provision of the ground-based measurement datasets as well as MODIS and CALIPSO for satellite products and imagery.
This research has been supported by the Ministry of Science and Technology, Taiwan (grant no. MOST 107-2811-M-008-033), and the Environmental Protection Administration, Executive Yuan, R.O.C. Taiwan (grant no. 107D081).
This paper was edited by Yafang Cheng and reviewed by four anonymous referees.
Akingunola, A., Makar, P. A., Zhang, J., Darlington, A., Li, S.-M., Gordon, M., Moran, M. D., and Zheng, Q.: A chemical transport model study of plume-rise and particle size distribution for the Athabasca oil sands, Atmos. Chem. Phys., 18, 8667–8688, https://doi.org/10.5194/acp-18-8667-2018, 2018.
Byun, D. and Schere, K. L.: Review of the governing equations, computational algorithms, and other components of the models-3 Community Multiscale Air Quality (CMAQ) modeling system, Appl. Mech. Rev., 59, 51–76, https://doi.org/10.1115/1.2128636, 2006.
Chen, J., Li, C., Ristovski, Z., Milic, A., Gu, Y., Islam, M. S., Wang, S., Hao, J., Zhang, H., He, C., Guo, H., Fu, H., Miljevic, B., Morawska, L., Thai, P., Fat, Y., Pereira, G., Ding, A., Huang, X., and Dumka, U. C.: Science of the Total Environment A review of biomass burning: Emissions and impacts on air quality, health and climate in China, Sci. Total Environ., 579, 1000–1034, https://doi.org/10.1016/j.scitotenv.2016.11.025, 2017.
Chen, S. C., Hsu, S. C., Tsai, C. J., Chou, C. C. K., Lin, N. H., Lee, C. Te, Roam, G. D., and Pui, D. Y. H.: Dynamic variations of ultrafine, fine and coarse particles at the Lu-Lin background site in East Asia, Atmos. Environ., 78, 154–162, https://doi.org/10.1016/j.atmosenv.2012.05.029, 2013.
Cheng, F.-Y., Yang, Z.-M., Ou-Yang, C.-F., and Ngan, F.: A numerical study of the dependence of long-range transport of CO to a mountain station in Taiwan on synoptic weather patterns during the Southeast Asia biomass-burning season, Atmos. Environ., 78, 277–290, https://doi.org/10.1016/j.atmosenv.2013.03.020, 2013.
Chuang, M. T., Fu, J. S., Lin, N. H., Lee, C. Te, Gao, Y., Wang, S. H., Sheu, G. R., Hsiao, T. C., Wang, J. L., Yen, M. C., Lin, T. H., Thongboonchoo, N., and Chen, W. C.: Simulating the transport and chemical evolution of biomass burning pollutants originating from Southeast Asia during 7-SEAS/2010 Dongsha experiment, Atmos. Environ., 112, 294–305, https://doi.org/10.1016/j.atmosenv.2015.04.055, 2015.
Chuang, M. T., Lee, C. Te, Chou, C. C. K., Engling, G., Chang, S. Y., Chang, S. C., Sheu, G. R., Lin, N. H., Sopajaree, K., Chang, Y. J., and Hong, G. J.: Aerosol transport from Chiang Mai, Thailand to Mt. Lulin, Taiwan – Implication of aerosol aging during long-range transport, Atmos. Environ., 137, 101–112, https://doi.org/10.1016/j.atmosenv.2016.03.042, 2016a.
Chuang, M. T., Fu, J. S., Lee, C. Te, Lin, N. H., Gao, Y., Wang, S. H., Sheu, G. R., Hsiao, T. C., Wang, J. L., Yen, M. C., Lin, T. H., and Thongboonchoo, N.: The simulation of long-range transport of biomass burning plume and short-range transport of anthropogenic pollutants to a mountain observatory in east Asia during the 7-SEAS/2010 Dongsha experiment, Aerosol Air Qual. Res., 16, 2933–2949, https://doi.org/10.4209/aaqr.2015.07.0440, 2016b.
Chuang, M.-T., Ooi, M. C. G., Lin, N.-H., Fu, J. S., Lee, C.-T., Wang, S.-H., Yen, M.-C., Kong, S. S.-K., and Huang, W.-S.: Study on the impact of three Asian industrial regions on PM2.5 in Taiwan and the process analysis during transport, Atmos. Chem. Phys., 20, 14947–14967, https://doi.org/10.5194/acp-20-14947-2020, 2020.
Dong, X. and Fu, J. S.: Understanding interannual variations of biomass burning from Peninsular Southeast Asia, part I: Model evaluation and analysis of systematic bias, Atmos. Environ., 116, 293–307, https://doi.org/10.1016/j.atmosenv.2015.06.026, 2015a.
Dong, X. and Fu, J. S.: Understanding interannual variations of biomass burning from Peninsular Southeast Asia, part II: Variability and different influencesin lower and higher atmosphere levels, Atmos. Environ., 115, 9–18, https://doi.org/10.1016/j.atmosenv.2015.05.052, 2015b.
Dong, X., Fu, J. S., Huang, K., Lin, N. H., Wang, S. H., and Yang, C. E.: Analysis of the Co-existence of Long-range Transport Biomass Burning and Dust in the Subtropical West Pacific Region, Sci. Rep.-UK, 8, 1–10, https://doi.org/10.1038/s41598-018-27129-2, 2018.
Freitas, S. R., Longo, K. M., Trentmann, J., and Latham, D.: Technical Note: Sensitivity of 1-D smoke plume rise models to the inclusion of environmental wind drag, Atmos. Chem. Phys., 10, 585–594, https://doi.org/10.5194/acp-10-585-2010, 2010.
Fu, J. S., Hsu, N. C., Gao, Y., Huang, K., Li, C., Lin, N.-H., and Tsay, S.-C.: Evaluating the influences of biomass burning during 2006 BASE-ASIA: a regional chemical transport modeling, Atmos. Chem. Phys., 12, 3837–3855, https://doi.org/10.5194/acp-12-3837-2012, 2012.
Giglio, L., Randerson, J. T., and Van Der Werf, G. R.: Analysis of daily, monthly, and annual burned area using the fourth-generation global fire emissions database (GFED4), J. Geophys. Res.-Biogeo., 118, 317–328, https://doi.org/10.1002/jgrg.20042, 2013.
Gillani, N. V. and Godowitch, J. M.: Science Algorithms of the EPA Models-3 Community Multiscale Air Quality (CMAQ) Modelling System, in: EPA/600/R-99/030 (NTIS PB2000-100561), edited by: Byun, D. W. and Ching, J. S., US Environmental Protection Agency, Washington, DC, 1999.
Guenther, A. B., Jiang, X., Heald, C. L., Sakulyanontvittaya, T., Duhl, T., Emmons, L. K., and Wang, X.: The Model of Emissions of Gases and Aerosols from Nature version 2.1 (MEGAN2.1): an extended and updated framework for modeling biogenic emissions, Geosci. Model Dev., 5, 1471–1492, https://doi.org/10.5194/gmd-5-1471-2012, 2012.
Guevara, M., Soret, A., Arévalo, G., Martínez, F., and Baldasano, J. M.: Implementation of plume rise and its impacts on emissions and air quality modelling, Atmos. Environ., 99, 618–629, https://doi.org/10.1016/j.atmosenv.2014.10.029, 2014.
Hsiao, T. C., Ye, W. C., Wang, S. H., Tsay, S. C., Chen, W. N., Lin, N. H., Lee, C. Te, Hung, H. M., Chuang, M. T., and Chantara, S.: Investigation of the CCN activity, BC and UVBC mass concentrations of biomass burning aerosols during the 2013 BASELInE campaign, Aerosol Air Qual. Res., 16, 2742–2756, https://doi.org/10.4209/aaqr.2015.07.0447, 2016.
Hsu, N. C., Herman, J. R., and Tsay, S.-C.: Radiative impacts from biomass burning in the presence of clouds during boreal spring in southeast Asia, Geophys. Res. Lett., 30, 1224, https://doi.org/10.1029/2002gl016485, 2003.
Huang, H. Y., Wang, S. H., Huang, W. X., Lin, N. H., Chuang, M. T., da Silva, A. M., and Peng, C. M.: Influence of Synoptic-Dynamic Meteorology on the Long-Range Transport of Indochina Biomass Burning Aerosols, J. Geophys. Res. Atmos., 125, e2019JD031260, https://doi.org/10.1029/2019JD031260, 2020.
Huang, K., Fu, J. S., Hsu, N. C., Gao, Y., Dong, X., Tsay, S.-C., and Lam, Y. F.: Impact assessment of biomass burning on air quality in Southeast and East Asia during BASE-ASIA, Atmos. Environ., 78, 291–302, https://doi.org/10.1016/j.atmosenv.2012.03.048, 2013.
Huang, W.-R., Wang, S.-H., Yen, M.-C., Lin, N.-H., and Promchote, P.: Interannual variation of sprintime biomass burning in Indochina: Regional differences, associated atmospheric dynamical changes, and downwind impacts, J. Geophys. Res.-Atmos., 121, 1–13, https://doi.org/10.1002/2016JD025286, 2016.
Jian, Y. and Fu, T.-M.: Injection heights of springtime biomass-burning plumes over peninsular Southeast Asia and their impacts on long-range pollutant transport, Atmos. Chem. Phys., 14, 3977–3989, https://doi.org/10.5194/acp-14-3977-2014, 2014.
Khamkaew, C., Chantara, S., and Wiriya, W.: Atmospheric PM2.5 and Its Elemental Composition from near Source and Receptor Sites during Open Burning Season in Chiang Mai, Thailand, Int. J. Environ. Sci. Dev., 7, 436–440, https://doi.org/10.7763/ijesd.2016.v7.815, 2016.
Kim Oanh, N. T. and Leelasakultum, K.: Analysis of meteorology and emission in haze episode prevalence over mountain-bounded region for early warning, Sci. Total Environ., 409, 2261–2271, https://doi.org/10.1016/j.scitotenv.2011.02.022, 2011.
Klimont, Z., Kupiainen, K., Heyes, C., Purohit, P., Cofala, J., Rafaj, P., Borken-Kleefeld, J., and Schöpp, W.: Global anthropogenic emissions of particulate matter including black carbon, Atmos. Chem. Phys., 17, 8681–8723, https://doi.org/10.5194/acp-17-8681-2017, 2017.
Kong, S. S.-K., Fu, J. S., Dong, X., Chuang, M.-T., Ooi, M. C. G., Huang, W.-S., Griffith, S. M., Pani, S. K., and Lin, N.-H.: Sensitivity analysis of the dust emission treatment in CMAQv5.2.1 and its application to long-range transport over East Asia, Atmos. Environ., 257, 118441, https://doi.org/10.1016/j.atmosenv.2021.118441, 2021.
Kukkonen, J., Nikmo, J., Sofiev, M., Riikonen, K., Petäjä, T., Virkkula, A., Levula, J., Schobesberger, S., and Webber, D. M.: Applicability of an integrated plume rise model for the dispersion from wild-land fires, Geosci. Model Dev., 7, 2663–2681, https://doi.org/10.5194/gmd-7-2663-2014, 2014.
Kurokawa, J., Ohara, T., Morikawa, T., Hanayama, S., Janssens-Maenhout, G., Fukui, T., Kawashima, K., and Akimoto, H.: Emissions of air pollutants and greenhouse gases over Asian regions during 2000–2008: Regional Emission inventory in ASia (REAS) version 2, Atmos. Chem. Phys., 13, 11019–11058, https://doi.org/10.5194/acp-13-11019-2013, 2013.
Lee, C. Te, Chuang, M. T., Lin, N. H., Wang, J. L., Sheu, G. R., Chang, S. C., Wang, S. H., Huang, H., Chen, H. W., Liu, Y. L., Weng, G. H., Lai, H. Y., and Hsu, S. P.: The enhancement of PM2.5 mass and water-soluble ions of biosmoke transported from Southeast Asia over the Mountain Lulin site in Taiwan, Atmos. Environ., 45, 5784–5794, https://doi.org/10.1016/j.atmosenv.2011.07.020, 2011.
Lee, H.-H., Bar-Or, R. Z., and Wang, C.: Biomass burning aerosols and the low-visibility events in Southeast Asia, Atmos. Chem. Phys., 17, 965–980, https://doi.org/10.5194/acp-17-965-2017, 2017.
Li, M., Zhang, Q., Kurokawa, J.-I., Woo, J.-H., He, K., Lu, Z., Ohara, T., Song, Y., Streets, D. G., Carmichael, G. R., Cheng, Y., Hong, C., Huo, H., Jiang, X., Kang, S., Liu, F., Su, H., and Zheng, B.: MIX: a mosaic Asian anthropogenic emission inventory under the international collaboration framework of the MICS-Asia and HTAP, Atmos. Chem. Phys., 17, 935–963, https://doi.org/10.5194/acp-17-935-2017, 2017.
Li, M., Klimont, Z., Zhang, Q., Martin, R. V., Zheng, B., Heyes, C., Cofala, J., Zhang, Y., and He, K.: Comparison and evaluation of anthropogenic emissions of SO2 and NOx over China, Atmos. Chem. Phys., 18, 3433–3456, https://doi.org/10.5194/acp-18-3433-2018, 2018.
Lin, C. C., Chen, W. N., Loftus, A. M., Lin, C. Y., Fu, Y. T., Peng, C. M., and Yen, M. C.: Influences of the long-range transport of biomass-burning pollutants on surface air quality during 7-SEAS field campaigns, Aerosol Air Qual. Res., 17, 2595–2607, https://doi.org/10.4209/aaqr.2017.08.0273, 2017.
Lin, C. Y., Zhao, C., Liu, X., Lin, N. H., and Chen, W. N.: Modelling of long-range transport of Southeast Asia biomass-burning aerosols to Taiwan and their radiative forcings over East Asia, Tellus B, 66, 1–17, https://doi.org/10.3402/tellusb.v66.23733, 2014.
Lin, N.-H., Tsay, S.-C., Maring, H. B., Yen, M.-C., Sheu, G.-R., Wang, S.-H., Chi, K. H., Chuang, M.-T., Ou-Yang, C.-F., Fu, J. S., Reid, J. S., Lee, C.-T., Wang, L.-C., Wang, J.-L., Hsu, C. N., Sayer, A. M., Holben, B. N., Chu, Y.-C., Nguyen, X. A., Sopajaree, K., Chen, S.-J., Cheng, M.-T., Tsuang, B.-J., Tsai, C.-J., Peng, C.-M., Schnell, R. C., Conway, T., Chang, C.-T., Lin, K.-S., Tsai, Y. I., Lee, W.-J., Chang, S.-C., Liu, J.-J., Chiang, W.-L., Huang, S.-J., Lin, T.-H., and Liu, G.-R.: An overview of regional experiments on biomass burning aerosols and related pollutants in Southeast Asia: From BASE-ASIA and the Dongsha Experiment to 7-SEAS, Atmos. Environ., 78, 1–19, https://doi.org/10.1016/j.atmosenv.2013.04.066, 2013.
Liu, T., Mickley, L. J., Marlier, M. E., DeFries, R. S., Khan, M. F., Latif, M. T., and Karambelas, A.: Diagnosing spatial biases and uncertainties in global fire emissions inventories: Indonesia as regional case study, Remote Sens. Environ., 237, 111557, https://doi.org/10.1016/j.rse.2019.111557, 2020.
Mebust, M. R., Eder, B. K., Binkowshi, F. S., and Roselle, S. J.: Models-3 Community Multiscale Air Quality (CMAQ) model aerosol component 2. Model evaluation, J. Geophys. Res., 108, 1–18, https://doi.org/10.1029/2001jd001410, 2003.
Ohara, T., Akimoto, H., Kurokawa, J., Horii, N., Yamaji, K., Yan, X., and Hayasaka, T.: An Asian emission inventory of anthropogenic emission sources for the period 1980–2020, Atmos. Chem. Phys., 7, 4419–4444, https://doi.org/10.5194/acp-7-4419-2007, 2007.
NCEP-ds083.2, National Centers for Environmental Prediction/National Weather Service/NOAA/US Department of Commerce: NCEP FNL Operational Model Global Tropospheric Analyses, continuing from July 1999 (ds083.2), Research Data Archive at the National Center for Atmospheric Research, Computational and Information Systems Laboratory, https://doi.org/10.5065/D6M043C6, updated daily, 2000.
NCEP-ds351.0, Satellite Services Division/Office of Satellite Data Processing and Distribution/NESDIS/NOAA/US Department of Commerce, and National Centers for Environmental Prediction/National Weather Service/NOAA/US Department of Commerce: NCEP ADP Global Upper Air Observational Weather Data, October 1999 –continuing (ds351.0), Research Data Archive at the National Center for Atmospheric Research, Computational and Information Systems Laboratory, https://doi.org/10.5065/39C5-Z211, updated daily, 2000.
NCEP-ds461.0, National Centers for Environmental Prediction/National Weather Service/NOAA/US Department of Commerce: NCEP ADP Global Surface Observational Weather Data, October 1999 – continuing (ds461.0), Research Data Archive at the National Center for Atmospheric Research, Computational and Information Systems Laboratory, https://doi.org/10.5065/4F4P-E398, updated daily, 2004.
Oleson, K. W., Lawrence, D. M., Bonan, G. B., Flanner, M. G., Kluzek, E., Lawrence, P. J., Levis, S., Swenson, S. C., Thornton, P. E., Dai, A., Decker, M., Dickinson, R., Feddema, J., Heald, C. L., Hoffman, F., Lamarque, J.-F., Mahowald, N., Niu, G.-Y., Qian, T., Randerson, J., Running, S., Sakaguchi, K., Slater, A., Stockli, R., Wang, A., Yang, Z.-L., Zeng, X., and Zeng, X.: Technical Description of version 4.0 of the Community Land Model (CLM), NCAR Technical Note No. NCAR/TN-503+STR, NCAR, Boulder, CO, 434 pp., https://doi.org/10.5065/D6RR1W7M, 2010.
Ooi, M. C. G., Chan, A., Ashfold, M. J., Oozeer, M. Y., Morris, K. I., and Kong, S. S. K.: The role of land use on the local climate and air quality during calm inter-monsoon in a tropical city, Geosci. Front., 10, 405–415, https://doi.org/10.1016/j.gsf.2018.04.005, 2019.
Ou-Yang, C. F., Lin, N. H., Lin, C. C., Wang, S. H., Sheu, G. R., Lee, C. Te, Schnell, R. C., Lang, P. M., Kawasato, T., and Wang, J. L.: Characteristics of atmospheric carbon monoxide at a high-mountain background station in East Asia, Atmos. Environ., 89, 613–622, https://doi.org/10.1016/j.atmosenv.2014.02.060, 2014.
Pani, S. K., Wang, S. H., Lin, N. H., Lee, C. Te, Tsay, S. C., Holben, B. N., Janjai, S., Hsiao, T. C., Chuang, M. T., and Chantara, S.: Radiative effect of springtime biomass-burning aerosols over northern indochina during 7-SEAS/BASELInE 2013 campaign, Aerosol Air Qual. Res., 16, 2802–2817, https://doi.org/10.4209/aaqr.2016.03.0130, 2016.
Pani, S. K., Lin, N. H., Chantara, S., Wang, S. H., Khamkaew, C., Prapamontol, T., and Janjai, S.: Radiative response of biomass-burning aerosols over an urban atmosphere in northern peninsular Southeast Asia, Sci. Total Environ., 633, 892–911, https://doi.org/10.1016/j.scitotenv.2018.03.204, 2018.
Pani, S. K., Wang, S. H., Lin, N. H., Chantara, S., Lee, C. Te and Thepnuan, D.: Black carbon over an urban atmosphere in northern peninsular Southeast Asia: Characteristics, source apportionment, and associated health risks, Environ. Pollut., 259, 113871, https://doi.org/10.1016/j.envpol.2019.113871, 2020.
Paugam, R., Wooster, M., Freitas, S., and Val Martin, M.: A review of approaches to estimate wildfire plume injection height within large-scale atmospheric chemical transport models, Atmos. Chem. Phys., 16, 907–925, https://doi.org/10.5194/acp-16-907-2016, 2016.
Pimonsree, S. and Vongruang, P.: Impact of biomass burning and its control on particulate matter over a city in mainland Southeast Asia during a smog episode, Atmos. Environ., 195, 196–209, https://doi.org/10.1016/j.atmosenv.2018.09.053, 2018.
Platnick, S., Hubanks, P., Meyer, K., and King, M. D.: MODIS Atmosphere L3 Daily Product, NASA MODIS Adaptive Processing System, Goddard Space Flight Center, MD, USA, https://doi.org/10.5067/MODIS/MOD08_D3.006 (Terra and Aqua), 2015.
Reid, J. S., Hyer, E. J., Johnson, R. S., Holben, B. N., Yokelson, R. J., Zhang, J., Campbell, J. R., Christopher, S. A., Di Girolamo, L., Giglio, L., Holz, R. E., Kearney, C., Miettinen, J., Reid, E. A., Turk, F. J., Wang, J., Xian, P., Zhao, G., Balasubramanian, R., Chew, B. N., Janjai, S., Lagrosas, N., Lestari, P., Lin, N. H., Mahmud, M., Nguyen, A. X., Norris, B., Oanh, N. T. K., Oo, M., Salinas, S. V., Welton, E. J., and Liew, S. C.: Observing and understanding the Southeast Asian aerosol system by remote sensing: An initial review and analysis for the Seven Southeast Asian Studies (7SEAS) program, Atmos. Res., 122, 403–468, https://doi.org/10.1016/j.atmosres.2012.06.005, 2013.
Sofiev, M., Ermakova, T., and Vankevich, R.: Evaluation of the smoke-injection height from wild-land fires using remote-sensing data, Atmos. Chem. Phys., 12, 1995–2006, https://doi.org/10.5194/acp-12-1995-2012, 2012.
Takami, K., Shimadera, H., Uranishi, K., and Kondo, A.: Impacts of biomass burning emission inventories and atmospheric reanalyses on simulated PM10 over Indochina, Atmosphere-Basel, 11, 160, https://doi.org/10.3390/atmos11020160, 2020.
Tsai, J. H., Huang, K. L., Lin, N. H., Chen, S. J., Lin, T. C., Chen, S. C., Lin, C. C., Hsu, S. C., and Lin, W. Y.: Influence of an Asian dust storm and Southeast Asian biomass burning on the characteristics of seashore atmospheric aerosols in Southern Taiwan, Aerosol Air Qual. Res., 12, 1105–1115, https://doi.org/10.4209/aaqr.2012.07.0201, 2012.
Tsay, S. C., Hsu, N. C., Lau, W. K. M., Li, C., Gabriel, P. M., Ji, Q., Holben, B. N., Judd Welton, E., Nguyen, A. X., Janjai, S., Lin, N. H., Reid, J. S., Boonjawat, J., Howell, S. G., Huebert, B. J., Fu, J. S., Hansell, R. A., Sayer, A. M., Gautam, R., Wang, S. H., Goodloe, C. S., Miko, L. R., Shu, P. K., Loftus, A. M., Huang, J., Kim, J. Y., Jeong, M. J., and Pantina, P.: From BASE-ASIA toward 7-SEAS: A satellite-surface perspective of boreal spring biomass-burning aerosols and clouds in Southeast Asia, Atmos. Environ., 78, 20–34, https://doi.org/10.1016/j.atmosenv.2012.12.013, 2013.
Tsay, S. C., Maring, H. B., Lin, N. H., Buntoung, S., Chantara, S., Chuang, H. C., Gabriel, P. M., Goodloe, C. S., Holben, B. N., Hsiao, T. C., Christina Hsu, N., Janjai, S., Lau, W. K. M., Lee, C. Te, Lee, J., Loftus, A. M., Nguyen, A. X., Nguyen, C. M., Pani, S. K., Pantina, P., Sayer, A. M., Tao, W. K., Wang, S. H., Welton, E. J., Wiriya, W., and Yen, M. C.: Satellite-surface perspectives of air quality and aerosol-cloud effects on the environment: An overview of 7-SEAS/BASELInE, Aerosol Air Qual. Res., 16, 2581–2602, https://doi.org/10.4209/aaqr.2016.08.0350, 2016.
Val Martin, M., Kahn, R. A., Logan, J. A., Paugam, R., Wooster, M., and Ichoku, C.: Space-based observational constraints for 1-D fire smoke plume-rise models, J. Geophys. Res.-Atmos., 117, 1–18, https://doi.org/10.1029/2012JD018370, 2012.
Walter, C., Freitas, S. R., Kottmeier, C., Kraut, I., Rieger, D., Vogel, H., and Vogel, B.: The importance of plume rise on the concentrations and atmospheric impacts of biomass burning aerosol, Atmos. Chem. Phys., 16, 9201–9219, https://doi.org/10.5194/acp-16-9201-2016, 2016.
Wang, J., Ge, C., Yang, Z., Hyer, E. J., Reid, J. S., Chew, B. N., Mahmud, M., Zhang, Y., and Zhang, M.: Mesoscale modeling of smoke transport over the Southeast Asian Maritime Continent: Interplay of sea breeze, trade wind, typhoon, and topography, Atmos. Res., 122, 486–503, https://doi.org/10.1016/j.atmosres.2012.05.009, 2013.
Wang, S.-H., Tsay, S. C., Lin, N. H., Chang, S. C., Li, C., Welton, E. J., Holben, B. N., Hsu, N. C., Lau, W. K. M., Lolli, S., Kuo, C. C., Chia, H. P., Chiu, C. Y., Lin, C. C., Bell, S. W., Ji, Q., Hansell, R. A., Sheu, G. R., Chi, K. H., and Peng, C. M.: Origin, transport, and vertical distribution of atmospheric pollutants over the northern South China Sea during the 7-SEAS/Dongsha Experiment, Atmos. Environ., 78, 124–133, https://doi.org/10.1016/j.atmosenv.2012.11.013, 2013.
Wang, S.-H., Welton, E. J., Holben, B. N., Tsay, S.-C., Lin, N.-H., Giles, D., Stewart, S. A., Janjai, S., Nguyen, X. A., Hsiao, T.-C., Chen, W.-N., Lin, T.-H., Buntoung, S., Chantara, S., and Wiriya, W.: Vertical Distribution and Columnar Optical Properties of Springtime Biomass-Burning Aerosols over Northern Indochina during 2014 7-SEAS Campaign, Aerosol Air Qual. Res., 15, 2037–2050, https://doi.org/10.4209/aaqr.2015.05.0310, 2015.
Wang, W., Bruyère, C., Duda, M., Dudhia, J., Gill, D., Kavulich, M., Keene, K., Chen, M., Lin, H.-C., Michalakes, J., Rizvi, S., Zhang, X., Berner, J., Ha, S., and Fossell, K.: WRF-ARW V3.9: User's Guide, NCAR Tech. Note, 443, https://doi.org/10.5065/D68S4MVH, 2017.
Wang, Z., Li, Y., Chen, T., Zhang, D., Sun, F., Wei, Q., Dong, X., Sun, R., Huan, N., and Pan, L.: Ground-level ozone in urban Beijing over a 1-year period: Temporal variations and relationship to atmospheric oxidation, Atmos. Res., 164–165, 110–117, https://doi.org/10.1016/j.atmosres.2015.05.005, 2015.
Welton, E. J., Voss, K. J., Gordon, H. R., Maring, H., Smirnov, A., Holben, B., Schmid, B., Livingston, J. M., Durkee, P. A., Formenti, P., and Andreae, M. O.: Ground-based lidar measurements of aerosols during ACE-2: Instrument description, results, and comparisons with other ground-based and airborne measurements, Tellus B, 52B, 636–651, https://doi.org/10.3402/tellusb.v52i2.17124, 2000.
Wiedinmyer, C., Akagi, S. K., Yokelson, R. J., Emmons, L. K., Al-Saadi, J. A., Orlando, J. J., and Soja, A. J.: The Fire INventory from NCAR (FINN): a high resolution global model to estimate the emissions from open burning, Geosci. Model Dev., 4, 625–641, https://doi.org/10.5194/gmd-4-625-2011, 2011.
Winker, D. M., Pelon, J., Coakley Jr., J. A., Ackerman, S. A., Charlson, R. J., Colarco, P. R., Flamant, P., Fu, Q., Hoff, R. M., Kittaka, C., Kubar, T. L., Le Treut, H., Mccormick, M. P., Mégie, G., Poole, L., Powell, K., Trepte, C., Vaughan, M. A., and Wielicki, B. A.: The CALIPSO Mission – A Global 3D View of Aerosols and Clouds, B. Am. Meteorol. Soc., 91, 1211–1230, https://doi.org/10.1175/2010BAMS3009.1, 2010.
WRAP: 2002 fire emission inventory for the WRAP region: Phase I – Essential Documentation, available at: http://www.wrapair.org/forums/fejf/documents/emissions/WRAP_2002 EI Report_20050107.pdf (last access: 23 March 2019), 2004.
Yen, M. C., Peng, C. M., Chen, T. C., Chen, C. Sen, Lin, N. H., Tzeng, R. Y., Lee, Y. A., and Lin, C. C.: Climate and weather characteristics in association with the active fires in northern Southeast Asia and spring air pollution in Taiwan during 2010 7-SEAS/Dongsha Experiment, Atmos. Environ., 78, 35–50, https://doi.org/10.1016/j.atmosenv.2012.11.015, 2013.
Yuan, H., Dai, Y., Xiao, Z., Ji, D., and Shangguan, W.: Reprocessing the MODIS Leaf Area Index products for land surface and climate modelling, Remote Sens. Environ., 115, 1171–1187, https://doi.org/10.1016/j.rse.2011.01.001, 2011.
Zheng, B., Tong, D., Li, M., Liu, F., Hong, C., Geng, G., Li, H., Li, X., Peng, L., Qi, J., Yan, L., Zhang, Y., Zhao, H., Zheng, Y., He, K., and Zhang, Q.: Trends in China's anthropogenic emissions since 2010 as the consequence of clean air actions, Atmos. Chem. Phys., 18, 14095–14111, https://doi.org/10.5194/acp-18-14095-2018, 2018.
Zhou, L., Baker, K. R., Napelenok, S. L., Pouliot, G., Elleman, R., Neill, S. M. O., Urbanski, S. P., and Wong, D. C.: Modeling crop residue burning experiments to evaluate smoke emissions and plume transport, Sci. Total Environ., 627, 523–533, https://doi.org/10.1016/j.scitotenv.2018.01.237, 2018.