the Creative Commons Attribution 4.0 License.
the Creative Commons Attribution 4.0 License.
 | 16 Aug 2021
Measurement report: Saccharide composition in atmospheric fine particulate matter during spring at the remote sites of southwest China and estimates of source contributions
Zhenzhen Wang
Di Wu
Zhuoyu Li
Xiaona Shang
Qing Li
Xiang Li
Renjie Chen
Haidong Kan
Huiling Ouyang
Xu Tang
Based on source-specific saccharide tracers, the characteristics of biomass burning (BB) and biogenic emissions of saccharides were investigated in three rural sites at Lincang, which is 65 % covered with forest in the southwest border of China. The total saccharides accounted for 8.4 ± 2.7 % of organic carbon (OC) and 1.6 ± 0.6 % of PM2.5. The measured anhydrosugars accounted for 48.5 % of total saccharides, among which levoglucosan was the most dominant species. The high level of levoglucosan was both attributed to the local BB activities and biomass combustion smoke transported from the neighboring regions of Southeast Asia (Myanmar) and the northern Indian subcontinent. The measured mono- or disaccharides and sugar alcohols accounted for 24.9 ± 8.3 % and 26.6 ± 9.9 % of the total saccharides, respectively, and both proved to be mostly emitted by direct biogenic volatilization from plant material or surface soils rather than byproducts of polysaccharide breakdown during BB processes. Five sources of saccharides were resolved by non-negative matrix factorization (NMF) analysis, including BB, soil microbiota, plant senescence, airborne pollen, and plant detritus with contributions of 34.0 %, 16.0 %, 21.0 %, 23.7 %, and 5.3 %, respectively. The results provide information on the magnitude of levoglucosan and contributions of BB, as well as the characteristic of biogenic saccharides, at the remote sites of southwest China, which can be further applied to regional source apportionment models and global climate models.
- Article
(1437 KB) - Full-text XML
-
Supplement
(501 KB) - BibTeX
- EndNote


Biomass burning (BB) and biogenic aerosols are thought to play important roles in air quality, human health, and climate through direct or indirect effects (Jacobson et al., 2000; Christner et al., 2008; Pöschl et al., 2010; Després et al., 2012; Chen et al., 2017; Tang et al., 2019). Atmospheric saccharide components have been extensively reported to originate from natural or anthropogenic biomass burning (BB), suspended soil or dust, and primary biological aerosol particles (PBAPs), e.g., fungal and fern spores, pollens, algae, fungi, bacteria, plant debris, and biogenic secondary organic aerosol (SOA) (e.g., Rogge et al., 1993; Graham et al., 2003; Jaenicke, 2005; Medeiros et al., 2006; Elbert et al., 2007; Fu et al., 2013). As one of the major classes of water-soluble organic compounds, saccharides in atmospheric aerosols have been detected over urban areas, forests, mountains, and remote marine regions (Pashynska et al., 2002; Yttri et al., 2007; Fu et al., 2009; Burshtein et al., 2011; Jia and Fraser, 2011; Chen et al., 2013; Pietrogrande et al., 2014; Li et al., 2016a, b). It has been reported that saccharides account for 13–26 % of the total organic compound mass identified in continental aerosols and up to 63 % of oceanic aerosols (Simoneit et al., 2004).
Levoglucosan and related anhydrosugar isomers (mannosan and galactosan), produced from pyrolysis of cellulose and hemicellulose, are considered to be relatively stable in the atmosphere (Schkolnik et al., 2005; Puxbaum et al., 2007); thus, have been recognized as specific molecular markers for BB source emissions (Simoneit et al., 1999; Fraser and Lakshmanan, 2000; Sullivan et al., 2014). However, some studies have challenged this knowledge and proved that levoglucosan alone was unsuitable to be a distinct marker for BB in various regions and periods. This is because there is evidence that levoglucosan was also emitted from non-BB sources (Wu et al., 2021), such as coal burning (Rybicki et al., 2020; Yan et al., 2018), open waste burning (Kalogridis et al., 2018), incense burning (Tsai et al., 2010), and food cooking (Reyes-Villegas et al., 2018). It was reported that the levoglucosan emission contribution of BB sources ranged from 21.3 % to 95.9 % (Wu et al., 2021). Current studies in China have reported values of 2.6–289.1 and 11.6–1803.1 ng m−3, respectively, over Beijing and Wangdu in summer (Yan et al., 2019), 2.4–1064.1 ng m−3 over Shanghai all year round (Xiao et al., 2018), 15.6–472.9 ng m−3 over Guangzhou (Zhang et al., 2010), 21.1–91.5 ng m−3 over Hong Kong (Sang et al., 2011), 60.2–481.9 ng m−3 over Xi'an (Yang et al., 2012), 36.0–1820.9 ng m−3 over Chengdu (Yang et al., 2012), and 10.1–383.4 ng g−1 dry weight in cryoconites over the Tibetan Plateau (Li et al., 2019). In north China, the high concentration of levoglucosan was a serious problem due to the drastic enhancement of coal and BB for house heating in winter and autumn (Zhang et al., 2008; Zhu et al., 2016). The BB pollution might be exacerbated under unfavorable meteorological conditions, such as in the Chengdu Plain (Chen and Xie, 2014). In general, BB with a notable contribution to organic carbon (OC) was an important source of fine particulate matter in China (Zhang et al., 2008; Cheng et al., 2013; Chen et al., 2017). Controls on BB could be an effective method to reduce pollutant emissions. Recently, a study reported that total levoglucosan emissions in China exhibited a clear decreasing trend from 2014 (145.7 Gg) to 2018 (80.9 Gg) (Wu et al., 2021), suggesting BB activities might be reduced in China.
Saccharide compounds including a variety of primary saccharides (monosaccharides and disaccharides) and sugar alcohols (reduced sugars) have been measured to estimate the contribution of biogenic aerosols, including fungi, viruses, bacteria, pollen, and plant and animal debris (Simoneit et al., 2004; Jaenicke et al., 2007). For instance, arabitol and mannitol have been proposed as biomarkers for airborne fungal spores (Bauer et al., 2008; Zhang et al., 2010; Holden et al., 2011; Liang et al., 2013a, b), because both of them can function as storage or transport carbohydrates to regulate intracellular osmotic pressure (Bauer et al., 2008). Glucose and sucrose are thought to originate from natural biogenic detritus, including numerous microorganisms, plants, and animals (Simoneit et al., 2004; Tominaga et al., 2011). As the oxidation products of isoprene, methyltetrols (including 2-methylthreitol and 2-methylerythritol) have been suggested as tracers of isoprene-derived SOA (Claeys et al., 2004; Kleindienst et al., 2007; Ding et al., 2016). In a previous study, the contributions of fungal spores to OC were estimated to be 14.1 ± 10.5 % and 7.3 ± 3.3 %, respectively, at the rural and urban sites of Beijing (Liang et al., 2013b). Airborne pollen and fungal spores contributed 12 %–22 % to the total OC in ambient aerosols collected in Toronto (Womiloju et al., 2003). Jaenicke (2005) found that PBAPs could account for 20 %–30 % of the total atmospheric PM (>0.2 mm) from Lake Baikal (Russia) and Mainz (Germany). However, studies on quantifying the abovementioned biogenic aerosol contributions to ambient aerosol are inadequate.
Lincang, located on the southwest border of China, is a traditional agricultural area of Yunnan Province, where planting large areas of tea, sugar cane, rubber, macadamia nuts, etc. is common. It is the largest production base of black tea and macadamia nuts in China. Referring to the official website of Lincang Municipal People's Government, the forest coverage of Lincang reaches 65 %. It has a wide variety of plant species and has six nature reserves covering an area of ∼ 222 000 ha, accounting for 8.56 % of the total area. As a residential area for ethnic minorities, Lincang has unique culture, humanity and living habits. The proportion of houses that use wood burning for cooking is very high in villages in the vicinity as well as in a large area of Southeast Asia, and forest fires frequently occur in this area, especially in the dry season (March–April). These facts imply that there are abundant biogenic aerosols in Lincang, and BB pollution may be an essential potential source of air pollution. However, little information on the magnitude of biogenic and BB tracers in this area is available. The contributions of biogenic aerosol and BB, as well as BB types, are poorly understood.
In this study, the sampling was conducted from 8 March to 9 April 2019 at three mountaintop sites of Lincang, which is an ideal site for investigating the BB emission characteristics. BB tracers, including anhydrosugars and K+, as well as biogenic aerosol tracers (primary saccharides and sugar alcohols), were measured to gain the information on source and contributions of BB and biogenic emissions to PM2.5 over the rural Lincang. This study would be useful and valuable for providing reliable information on sources and magnitudes of saccharides involving rural BB and biological emissions in China.
2.1 Aerosol sampling
PM2.5 samples were simultaneously collected on three mountaintop sites in Lincang: Datian (24.11∘ N, 100.13∘ E; 1960 m a.s.l.), Dashu (24.12∘ N, 100.11∘ E; 1840 m a.s.l.), and Yakoutian (24.12∘ N, 100.09∘ E; 1220 m a.s.l.), which are located ∼ 300 km west of Kunming (the capital of Yunnan Province in China) and ∼ 120 km east from the Burma border (shown in Fig. S1 in the Supplement). These sites are surrounded by massive mountains and scattered villages without obvious nearby traffic or major industrial emissions. Each sampling was performed over a 23.5 h period every day, and was collected on quartz by high-volume air samplers (Thermo) equipped with a size-selective inlet to sample PM2.5 at a flow rate of 1.13 m3 min−1. Altogether, 91 samples were collected.
Quartz filters (Whatman, 20.32 × 25.40 cm) were prebaked at 550 ∘C for 4 h in a muffle furnace to remove organic material, and they were then stored in prebaked aluminum foils. The samples were stored at about −20 ∘C in a refrigerator until analysis. Field blanks were collected by mounting filters in the sampler without air flow to replicate the environmental exposure. The data reported were corrected by the blanks at the sampling sites.
2.2 Measurements
The concentrations of OC and elemental carbon (EC) were measured using a multiwavelength carbon analyzer (DRI model 2015; Aerosol Inc., USA). Typically, a 0.58 cm2 punch of the filter was placed on a boat inside the thermal desorption chamber of the analyzer, and then stepwise heating was applied. Carbon fractions were obtained following the Interagency Monitoring of PROtected Visual Environments (IMPROVE-A) thermal/optical reflectance (TOR) protocol (Chow et al., 2007). Replicate analyses were conducted once every 10 samples. A blank sample was also analyzed and used to correct the sample results.
A punch (4.7 cm2) of each quartz filter was ultrasonically extracted with 10.0 mL deionized water (resistivity = 18.2 MΩ cm−1) for 40 min. The aqueous extracts were filtrated through syringe filters (PTFE, 0.22 µm) to remove insoluble materials. Ion chromatography (Metrohm, Switzerland) coupled with Metrosep C6-150 and A6-150 columns was used to detect water-soluble ions (Cl−, NO, PO, SO, Na+, NH, K+, Mg2+, and Ca2+) with a detection limit (DL) range of 0.001–0.002 µg m−3.
Five saccharide alcohols (glycerol, erythritol, inositol, arabitol, and mannitol) and five primary saccharides (fructose, glucose, mannose, sucrose, and trehalose), together with three anhydrosugars (levoglucosan, mannosan, and galactosan), were quantified by an improved high-performance anion-exchange chromatograph coupled with a pulsed amperometric detector (Engling et al., 2006; Caseiro et al., 2007; Zhang et al., 2013). This method developed by Engling et al. (2006) was validated to be a powerful method for the detection of carbohydrates without derivatization techniques, and it has been successfully applied to the atmospheric tracers (e.g., Zhang et al., 2010; Holden et al., 2011; Liang et al., 2013a, b; Li et al., 2016a, b; Kalogridis et al., 2018; Yan et al., 2018). The separation of the saccharides was performed on an ion chromatograph (Metrohm, Switzerland) equipped with a Metrosep Carb 4–250 analytical column and a guard column. The aqueous eluent of sodium hydroxide and sodium acetate was pumped by a dual-pump module at a flow rate of 0.4 mL min−1. The low concentration of 50 mM sodium hydroxide and 10 mM sodium acetate (eluent A) was applied to pump 1, while the high concentration of 250 mM sodium hydroxide and 50 mM sodium acetate (eluent B) was applied to pump 2. The gradient generator was set as 0–10 min, 100 % of eluent A; 10–20 min, 50 % of eluent A and 50 % of eluent B; 20–50 min, 100 % of eluent B; and 50–60 min, 100 % of eluent A for equilibration. The extraction efficiency of this analytical method was determined to be better than 90 % based on analysis of quartz filters spiked with known amounts of mannitol. The method DL of the referred carbohydrate compounds was 0.005–0.01 mg L−1. All carbohydrate species were below detection limits in the field blanks.
2.3 Other data
The meteorological parameters, including temperature (T), relative humidity (RH), solar irradiation (W m−2), and rainfall (mm) were obtained from the Physical Sciences Laboratory of NOAA (https://psl.noaa.gov, last access: 8 September 2020). The temporal changes in meteorological variables over the observation sites during the sampling periods are shown in Fig. S2.
In order to characterize the origin and transport pathway of the air masses to the sampling sites, 72 h back-trajectories of the aerosol were calculated using the HYbrid Single-Particle Lagrangian Integrated Trajectory (HYSPLIT) model developed by NOAA/ARL (Draxler and Hess, 1998) via the NOAA ARL READY website (http://ready.arl.noaa.gov/HYSPLIT.php, last access: 6 September 2020) with an endpoint height of 1500 m. To investigate the influence of BB emissions, fire pixel counts were obtained from Moderate Resolution Imaging Spectroradiometer (MODIS) observations on NASA satellites (https://earthdata.nasa.gov/, last access: 3 September 2020).
2.4 Statistical analysis
A Pearson's correlation test was performed using the statistical product and service solutions software for the dataset containing ambient concentrations of the measured saccharides, inorganic ions, and solar irradiation. Non-negative matrix factorization (NMF) analysis was utilized to resolve potential emission source and estimate their contributions to atmospheric saccharides. NMF introduced by Lee and Seung (1999) was similar to positive matrix factorization (PMF). Both methods find two matrices (termed the contribution matrix of W and the source profile matrix of H) to reproduce the input data matrix (V) using the factorization approach (V=WH) as a positive constraint (W≥0 and H≥0). However, PMF forces the negative factors to be positive, but the NMF method only retains non-negative factors. NMF minimizes the conventional least-squares error and the generalized Kullback–Leibler divergence (Shang et al., 2018). Therefore, the results obtained from NMF are more responsive to the original characteristics of input dataset and fewer factors will be extracted (Zhang et al., 2019). Half of the DL was used for the value below the detection limit. In this study, galactosan, mannose, and inositol were excluded, because their concentration in most samples was below the DL. Concentrations of the other 10 saccharide species for a total of 91 samples were subjected to NMF analysis. The uncertainties in NMF analysis were estimated as 0.3 plus the analytical detection limit according to the method by Xie et al. (1999). The constant 0.3 corresponding to the log (geometric standard deviation) was calculated from the normalized concentrations for all measured species, and it was used to represent the variation of measurements.
3.1 Saccharide concentration and composition
The temporal variations of PM2.5 mass, OC, EC, and various saccharides measured in all samples are shown in Fig. 1. A statistical summary of all the data is listed in Table S1. During the sampling periods, the PM2.5 mass concentrations ranged between 13.7 and 87.8 µg m−3 with an average value of 41.8 µg m−3. The concentrations of OC and EC, respectively, were in the ranges of 2.5–22.4 and 0.3–4.3 µg m−3 with average values of 8.4 and 1.7 µg m−3. OC accounted for 19.9±3.7 % of total PM2.5 mass. The ambient concentrations of the total saccharides varied between 244.5 and 1291.6 ng m−3 with an average value of 638.4 ng m−3. The total saccharides quantified in PM2.5 accounted for 8.4 ± 2.7 % (range: 3.8 %–20.6 %) of the OC and accounted for 1.6 ± 0.6 % (range: 0.6 %–3.0 %) of the PM2.5. Figure 2 presents the average concentration levels of 12 measured saccharide compounds, categorized into anhydrosugar, mono- or disaccharide, and sugar alcohol, as well as the relative contribution of these saccharides for all samples. The values for each site are shown in Fig. S3.

Figure 1Temporal variations of OC, EC, PM2.5 and total sugars at the three sites during the sampling periods.
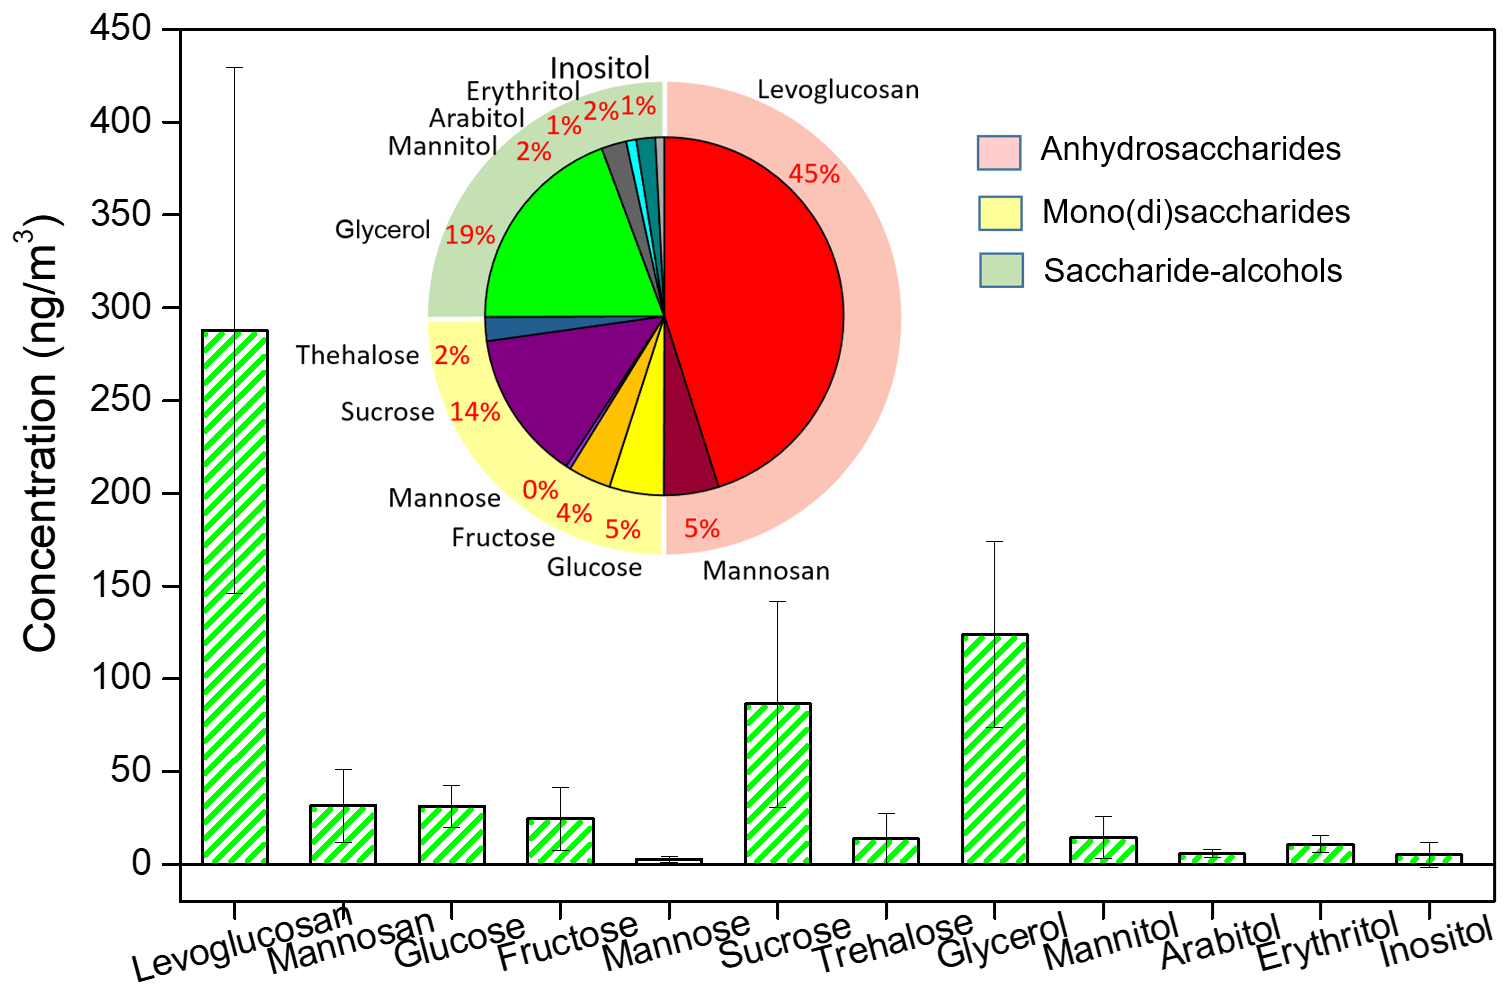
Figure 2The absolute concentration (bar chart) and the relative contribution (pie chart) of various saccharide compounds during the sampling periods.
3.1.1 Anhydrosugars
The average concentrations of levoglucosan and mannosan were 287.7 and 31.6 ng m−3, respectively, with respective ranges of 95.6–714.7 and 0–134.7 ng m−3 for all 91 samples. Galactosan was detected only in six samples, with a range of 2.5–5.5 ng m−3. The anhydrosugars accounted for 50.1 % of the total measured saccharides. Levoglucosan was the most dominant species among all the saccharides. The average levoglucosan concentration in this study was comparable to the value at urban Beijing collected in spring of 2012 (above 200 ng m−3) (Liang et al., 2016) and at urban Xi'an collected in winter of 2015 (268.5 ng m−3) (Wang et al., 2018). It was higher than the value at the rural Tengchong mountain site (193.8 ng m−3) (Sang et al., 2013), at urban Shanghai collected in spring of 2012 (66.0 ng m−3) (Li et al., 2016a), and at urban Hong Kong collected in spring of 2004 (36.0 ng m−3) (Sang et al., 2011), as well as at urban Beijing collected in summer of 2013 (49.4 ng m−3) (Yan et al., 2019), but it was lower than that at a rural site in Xi'an (0.93 mg m−3) (Zhu et al., 2017) and at a rural site in eastern central India (2258 ng m−3) (Nirmalkar et al., 2015). During the observation period, several instances of elevated levoglucosan occurred, peaking on 8, 16, 23 March and 1 April. It was thought that the ambient levoglucosan was primarily attributed to domestic biomass fuel burning; the high levoglucosan emission on these peak days might be from open BB events.
Regression analyses of levoglucosan and the other two anhydrosugars (mannosan, galactosan) are shown in Fig. 3a. Levoglucosan was highly correlated with mannosan and galactosan, with coefficients of determination (R) of 0.81 (P<0.01) and 0.89 (P<0.01), respectively, indicating similar combustion sources of them. The ratios of levoglucosan to mannosan () and mannosan to galactosan () had been employed to identify the specific types of BB, although these ratios were quite variable (Fabbri et al., 2009). Previous studies suggested that ratios for the burning of softwood were 3–10, hardwood ratios were 15–25, and those from crop residues were often above 40 (Cheng et al., 2013; Zhu et al., 2015; Kang et al., 2018). The average and ratios were statistically reported as 32.6 and 1.2 for crop residue combustion, 4.0 and 3.9 for softwood combustion, and 21.5 and 1.5 for hardwood combustion, respectively (Sang et al., 2013; Shen et al., 2018). In this study, the ratios of and ranged from 4.7 to 16.1 (average: 9.7, n=91) and from 3.9 to 6.1 (average: 4.8, n=6), respectively, crudely indicating major contribution from softwood burning. The samples collected from 31 March to 1 April and from 8 to 10 March, respectively, had considerably lower and higher concentrations of mannosan than predicted by the levoglucosan–mannosan regression model (Fig. 3a). The results suggested that BB aerosols collected from 31 March to 1 April ( = 11.52 ± 1.34) and from 8 to 10 March ( = 6.57 ± 0.53) originated from different types of BB compared with the remaining sampling periods ( = 9.34 ± 1.20). Therefore, the high levoglucosan emission from 31 March to 1 April and from 8 to 10 March might be from different open BB events, possibly an open agricultural waste burning event or a forest fire, while the BB of most sampling days originated from biomass fuel for domestic cooking and heating. It is worth noting that the peak days from 31 March to 1 April ( = 11.52 ± 1.34) neared the Qingming Festival. One possibility for BB events is that people burned joss paper as a sacrifice to their ancestors according to Chinese tradition.
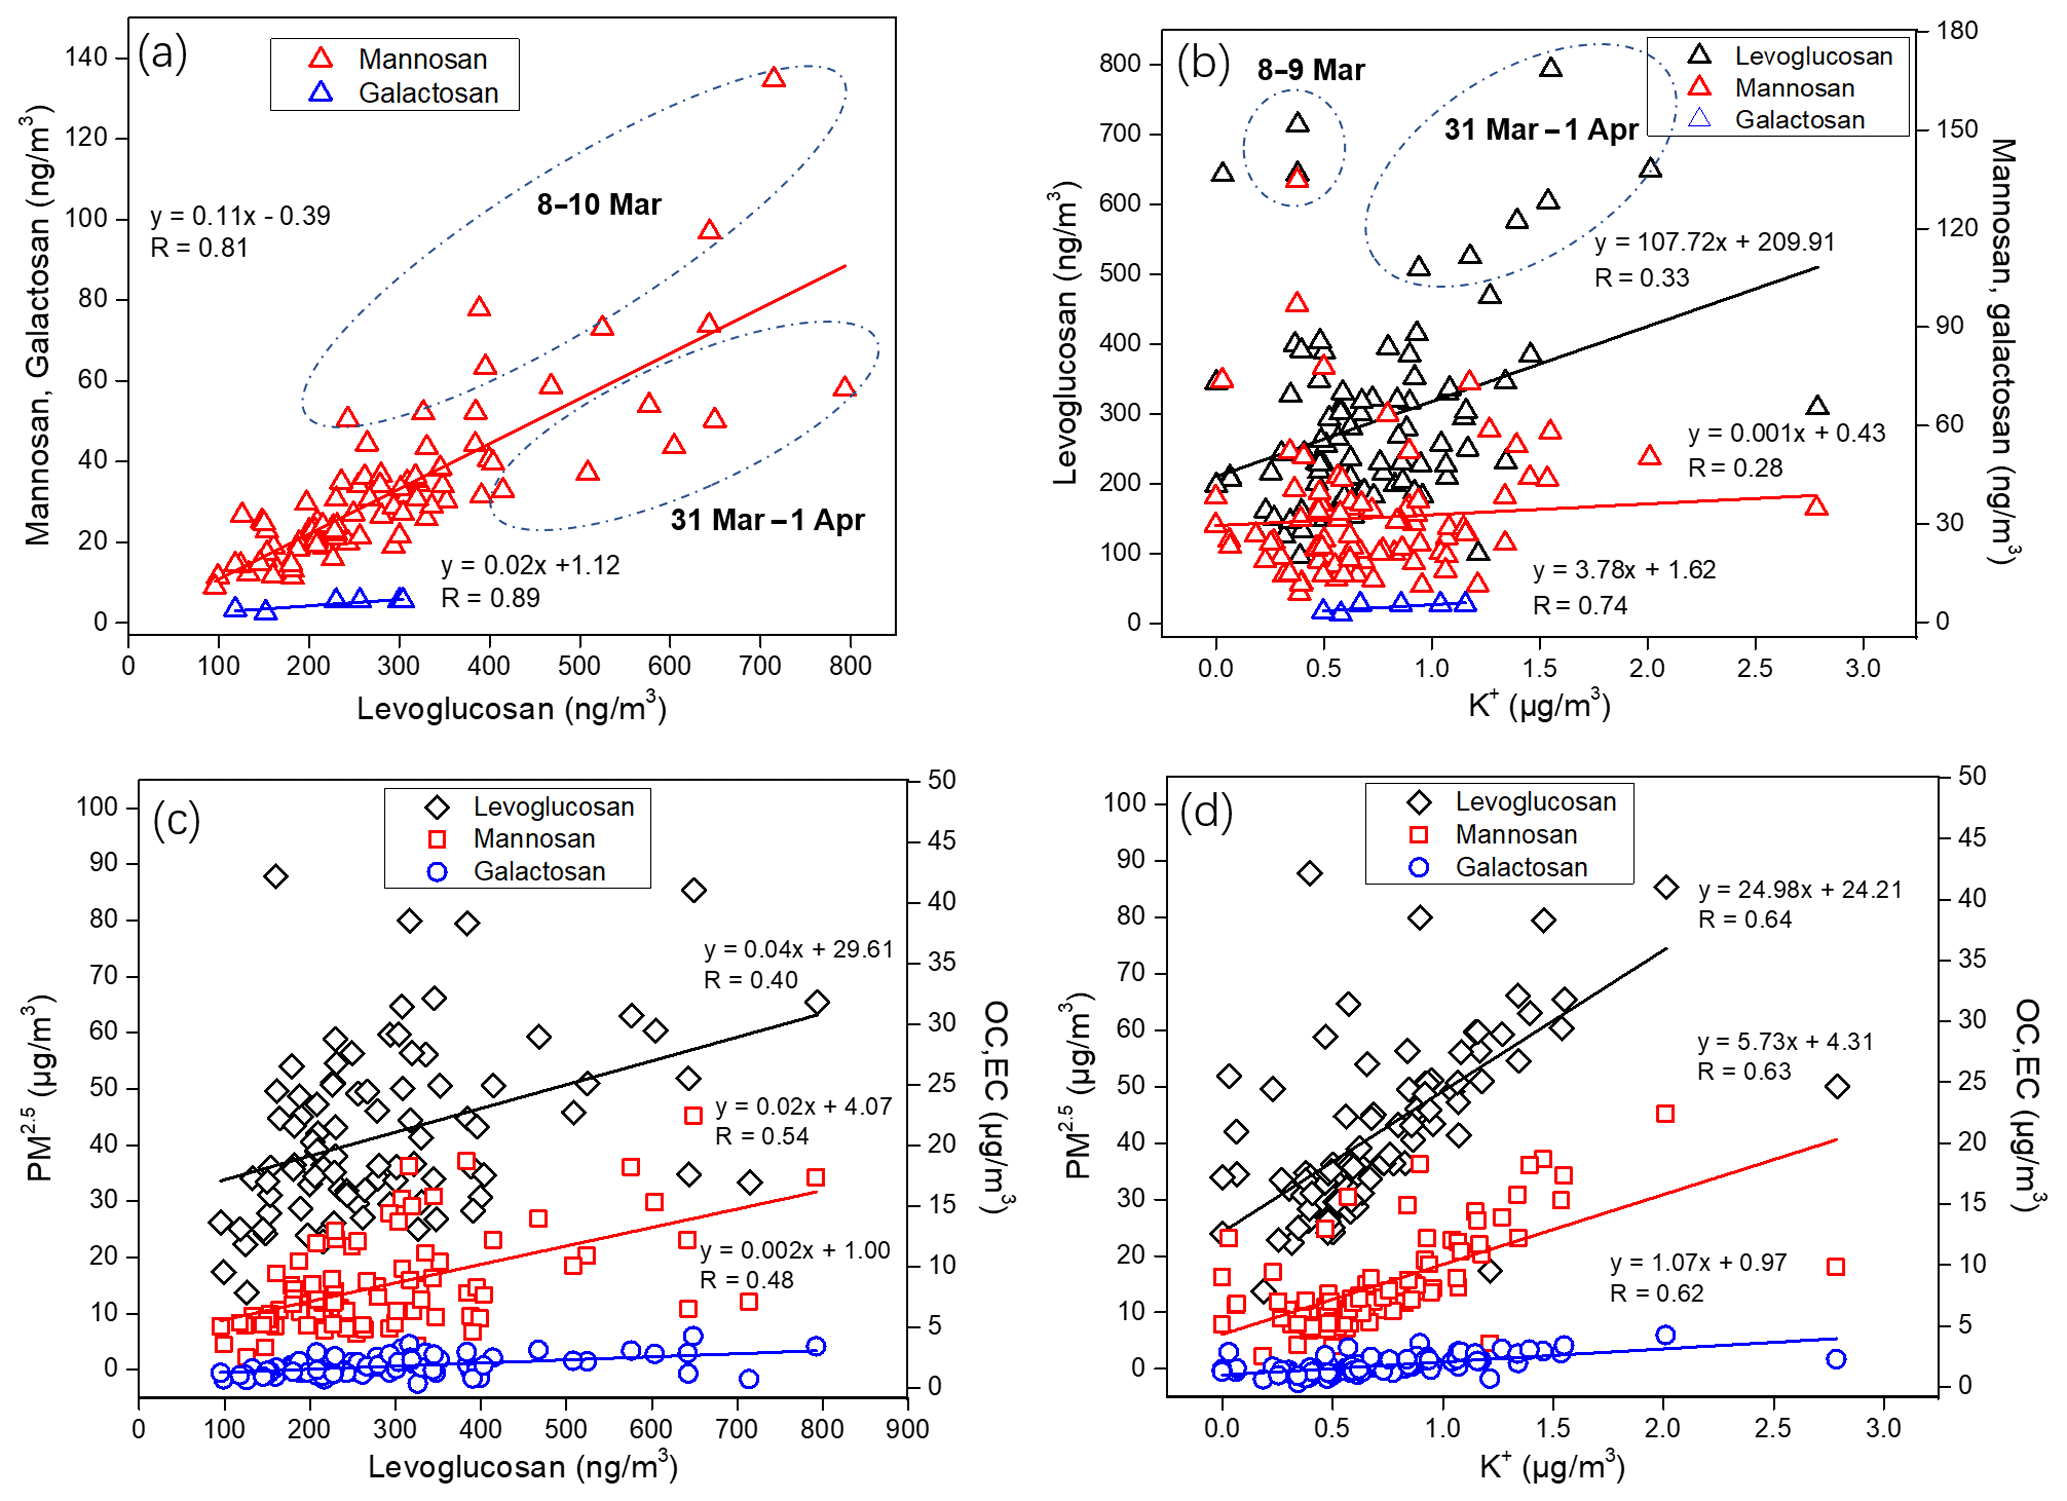
Figure 3(a) Regression analyses of levoglucosan versus the other two anhydrosugars; (b) K+ versus the other three anhydrosugars; (c) levoglucosan versus PM2.5, OC, and EC; and (d) K+ versus PM2.5, OC, and EC.
Both anhydrosugars and water-soluble potassium (K+) have been widely utilized as source tracers of BB emissions (e.g., Puxbaum et al., 2007; Wang et al., 2007; Zhang et al., 2008; Engling et al., 2011). The daily variations of concentrations of levoglucosan and K+ are shown in Fig. S4; the regression analysis of K+ and three anhydrosugars is shown in Fig. 3b. The K+ concentration was weakly correlated with levoglucosan, mannosan, and galactosan, with R values of 0.33, 0.28, and 0.74, respectively. This could be explained by the additional emissions of K+ from soil and seawater. Since Lincang is far from the coast, sea salt could be negligible. Because of the inhomogeneity of crustal K+ associated with soil types, it was difficult to fully account for crustal K+ contributions from soil (Harrison et al., 2012; Cheng et al., 2013). The ratio of levoglucosan to K+ () was also used to track possible sources of BB in the previous studies. The ratios of strongly depended on BB processes, namely, smoldering and flaming. Studies suggested that relatively high ratios were obtained from smoldering combustion at low temperatures compared with flaming combustion (Schkolnik et al., 2005; Lee et al., 2010). Previous results showed the emissions from the combustion of crop residuals such as rice straw, wheat straw, and corn straw exhibited comparable ratios, typically below 1.0. The average ratio in this study was 0.48 ± 0.20, which is higher than the ratio for wheat straw (0.10 ± 0.00) and corn straw (0.21 ± 0.08) but is lower than the ratio for Asian rice straw (0.62 ± 0.32) (Cheng et al., 2013). In this study, higher ratios were observed during 8–10 March (1.20 ± 0.19) compared to those from 31 March to 1 April (0.40 ± 0.13), which suggested that the open fire event from 8 to 10 March was more possibly due to smoldering combustion of residues at low temperatures.
Figure 3c and d show the scatterplots and regression analyses of K+ versus PM2.5, OC, and EC, and levoglucosan versus PM2.5, OC, and EC, respectively. Linear regression of K+ on PM2.5, OC, and EC resulted in R values of 0.64, 0.63, and 0.62, respectively, which were generally higher than those of levoglucosan on PM2.5, OC, and EC, with R values of 0.40, 0.54, and 0.48, respectively. This shows that K+ is more highly correlated with PM2.5, OC, and EC, which could be explained by either the photo-oxidative decay of levoglucosan (Hennigan et al., 2010) or different types of BB processes (Schkolnik et al., 2005; Lee et al., 2010). Even so, the results suggest that BB imposed a great impact on fine aerosols. The ratio of levoglucosan to PM2.5 () was also helpful in distinguishing the contributions of different levoglucosan sources (Wu et al., 2021). The ratio of in this study was 0.0041–0.0162 (average: 0.0072), indicating that the levoglucosan emission in the areas might mainly come from wood (0.01–0.09) and crop straw (0.001–0.008), not excluding incense burning (0.001–0.007), ritual item burning (0.004–0.086), and meat cooking (0.005–0.06). However, certainly, it was not from coal burning (0.0001–0.001) or waste incineration (0.0022).
An empirical ratio of levoglucosan to OC (8.2 %), calculated from main types of Chinese cereal straw (rice, wheat, and corn) based on combustion chamber experiments (Zhang et al., 2007), was used to estimate the BB-derived OC. The average mass concentration of BB-derived OC was 3534.4 ng m−3, whilst the contributions of BB to OC was 41.3 %, with a large range of 19.1 %–73.9 %. The contributions were higher than those previously reported, such as 6.5 %–11 % in Hong Kong (Sang et al., 2011), 18 %–38 % in Beijing (Zhang et al., 2008), 18.9 %–45.4 % over southeastern Tibetan Plateau (Sang et al., 2013), and 26.4 %–30.2 % in Xi'an (Zhang et al., 2014). The large range of 19.1 %–73.9 % revealed that the daily contribution of BB varied greatly, suggesting that an open BB event or forest fire happened occasionally. The contribution apportionment of primary BB might be underestimated due to the degradation of levoglucosan during atmospheric aging of BB-influenced air mass after long-range transport (Hennigan et al., 2010; Mochida et al., 2010; Lai et al., 2014). Moreover, Wu et al. (2021) have reported that the total levoglucosan emission exhibited a clear decreasing trend in China. However, it was noteworthy that the average concentration of levoglucosan (287.7 ng m−3) and the BB contributions to OC (41.3 %) at Lincang mountain site were both higher than the values of 191.8 ng m−3 and 28.4 % at Tengchong mountain site in 2004 in spring (Sang et al., 2013). This result suggests that there is no significant reduction in BB emissions in southwest Yunnan Province.
3.1.2 Mono- or disaccharides
The total concentrations of five mono- or disaccharides, including glucose, fructose, mannose, sucrose, and trehalose, were in the range of 25.2–373.7 ng m−3 (average: 158.9 ng m−3), which contributed 24.9 ± 8.3 % of the total measured saccharides. The average values of glucose, fructose, mannose, sucrose, and trehalose were 31.2, 24.6, 2.7, 86.4, and 13.8 ng m−3, respectively. Sucrose was the dominant species in the mono- or disaccharides group. The results agreed with those of previous studies (Yttri et al., 2007; Jia et al., 2010; Fu et al., 2012), which found that sucrose was one of the dominant species in fine aerosols in spring. Ruptured pollen may be an important source of sucrose, especially in the spring blossom season (Yttri et al., 2007; Fu et al., 2012; Miyazaki et al., 2012). In spring and early summer, farmland tilling after wheat harvest causes an enhanced exposure of soil containing wheat roots to the air, which is beneficial for the release of sucrose stored in roots (Medeiros et al., 2006), thus resulting in a sharply increased sucrose concentration.
It was reported that sugars, such as glucose, sucrose, and fructose, could be emitted from developing leaves (Graham et al., 2003). Glucose could be released from both soils and plant material (e.g., pollen, fruits, and their fragments) (Graham et al., 2003; Simoneit et al., 2004; Fu et al., 2012). Glucose and sucrose were rich in biologically active surface soils (Rogge et al., 2007). In this study, positive correlations were found between sucrose and glucose (R=0.52) (Table S2), suggesting a similar origin of glucose and sucrose in this study. Glucose and fructose have also been identified as a minor product of cellulose pyrolysis, because they were found to be enriched in BB emissions (Nolte et al., 2001), and they correlated well with K+ (Graham et al., 2002) and levoglucosan (Kang et al., 2018). Herein, no significant correlation was found between K+, levoglucosan, and these mono- or disaccharides. Therefore, the detected glucose, fructose, and sucrose might mostly be emitted by direct volatilization from plant material or surface soils rather than as products of polysaccharide breakdown during BB processes. The high abundance of sucrose, as well as glucose and fructose, was responsible for biogenic aerosols associated with developing leaves and flowers, as well as surface soil suspension.
Trehalose as a stress protectant of various microorganisms and plants (Medeiros et al., 2006; Jia and Fraser, 2011) was found to be abundant in the fine-mode soil, and has it been proposed as a marker compound for fugitive dust from biologically active surface soils (Simoneit et al., 2004; Medeiros et al., 2006; Rogge et al., 2007; Fu et al., 2012). A previous study found a positive correlation between trehalose and calcium (Nishikawa et al., 2000). In this study, there was no significant correlation between trehalose and calcium. Besides, mannose has been reported to be one of the major monosaccharide components in phytoplankton, which originated from marine biological fragments (Tanoue and Handa, 1987). Mannose was detected in only a few samples and presented with low concentrations in this study.
3.1.3 Sugar alcohols
Five sugar alcohol compounds, including glycerol, threitol, mannitol, arabitol, and inositol, were detected in PM2.5. These reduced sugars are often reported to be related to plant senescence and decay by microorganisms (Simoneit et al., 2004; Tsai et al., 2013); they are produced by fungi, lichens, soil biota, and algae (Elbert et al., 2007; Bauer et al., 2008). The average concentration of total sugar alcohols was 159.9 ng m−3 with a range of 53.1–254.0 ng m−3, which accounted for 25.1 ± 9.9 % of the total measured saccharides. Glycerol has been widely found in soil biota (Simoneit et al., 2004). Previous studies suggested that the source of glycerol was not specific to biological emissions, but the biomass combustion might increase atmospheric glycerol concentrations (Jia et al., 2010; Graham et al., 2002; Wang et al., 2011). Herein, glycerol was the second most abundant saccharide, with an average concentration of 123.7 ng m−3, accounting for 5.1 %–44.6 % (average: 22.6 %) of the total measured saccharides.
Mannitol and arabitol have been proposed as tracers for airborne fungal spores (Elbert et al., 2007; Bauer et al., 2008; Zhang et al., 2010; Burshtein et al., 2011). Mannitol and arabitol were detected with a concentration range of 0.0–38.6 ng m−3 (14.7 ng m−3) and 0.0–21.1 ng m−3 (5.8 ng m−3), respectively. The average concentrations of mannitol and arabitol were comparable to those (average: 11.3 and 9.1 ng m−3) reported in the Beijing spring aerosols (Liang et al., 2013b) but were lower than those (average: 21.9 and 8.43 ng m−3) in the Mediterranean summer aerosols (Burshtein et al., 2011) and (30 and 24 ng m−3) at Hyytiälä, Finland, in summer (Yttri et al., 2011). Poor correlations (r=0.38) were found among mannitol and arabitol in this study. Nevertheless, a positive correlation was found between trehalose and mannitol (r=0.79, P<0.05) (Table S2).
In the previous studies, the total measured mannitol has been measured and used for estimating the contribution of fungal spores to organic carbon (Elbert et al., 2007; Bauer et al., 2008; Zhang et al., 2010). A factor of mannitol per spore (0.49 ± 0.20 pg) was used to calculate the number concentrations of fungal spores (Liang et al., 2013a) and then the carbon content of fungal spores could be calculated using a conversion factor of 13 pg C per spore obtained earlier as the average carbon content of spores from nine airborne fungal species, with an uncertainty of 20 % (Bauer et al., 2008). The diagnostic tracer ratio of mannitol to OC was calculated to be 0.0377 according to this research (Bauer et al., 2008; Liang et al., 2013a) and then used to estimate the contribution of fungal spores to OC. The contribution of fungal spores might be underestimated, because previous results had indicated that mannitol and arabitol were mainly associated with the coarse PM fraction (Samaké et al., 2019). The average mannitol concentration was 14.7 ± 11.2 ng m−3 during the observation period. The average spore-derived OC was calculated to be 390.3 ng C m−3, which contributed to 4.9 % of the total OC.
Claeys et al. (2004) firstly identified two diastereoisomeric 2-methyltetrols as oxidation products of isoprene in the Amazonian rain forest aerosols. Henceforward, 2-methyltetrols have been used as tracers for isoprene-derived SOA (Liang et al., 2012; Fu et al., 2016; Yan et al., 2019). In the previous studies, erythritol was often quantified as a surrogate of 2-methyltetrols (2-methylthreitol and 2-methylerythritol) due to a lack of standards (Claeys et al., 2004; Ding et al., 2013, 2016). In this study, the concentration range of erythritol was 0.4–19.8 ng m−3 (average: 11.1 ng m−3). The values of inositol ranged from 0.0 to 22.8 ng m−3 with average values of 5.8 ng m−3. Moreover, the sugar alcohols not only originate from biological emissions but also from BB (Wan and Yu, 2007; Jia et al., 2010). Different levels of glycerol, arabitol, mannitol, erythritol, and inositol in fine particles have been found during the burning of crop residues and fallen leaves as well as indoor biofuel usage for heating and cooking (Graham et al., 2002; Burshtein et al., 2011; Wang et al., 2011; Yang et al., 2012; Kang et al., 2018). In this study, only inositol correlated with levoglucosan (R=0.42), suggesting that inositol might be linked to biomass combustion sources. Hence, the primary source of sugar alcohols associated with fine particles was biogenic aerosols at the observation sites.
3.2 Sources and transport
Since the distinct concentration of the studied compounds was due to different emission sources arising from different wind directions, the 72 h backward trajectories for the samples at the Dashu site (24.12∘ N, 100.11∘ E) and the spatial distribution of the fire spots (8 March to 9 April 2019) were calculated to understand the source of saccharides in aerosol (Fig. 4). The analysis of air-mass backward trajectories suggested that the air mass over Lincang was almost from the westerlies during the sampling periods and could be separated into two episodes of remote western source above 2000 m and local western source below 2000 m, as shown in wine red and green lines. Specifically, 51.6 % of air-mass backward trajectories were generally above 2000 m, whereas 48.4 % of them were below 2000 m.
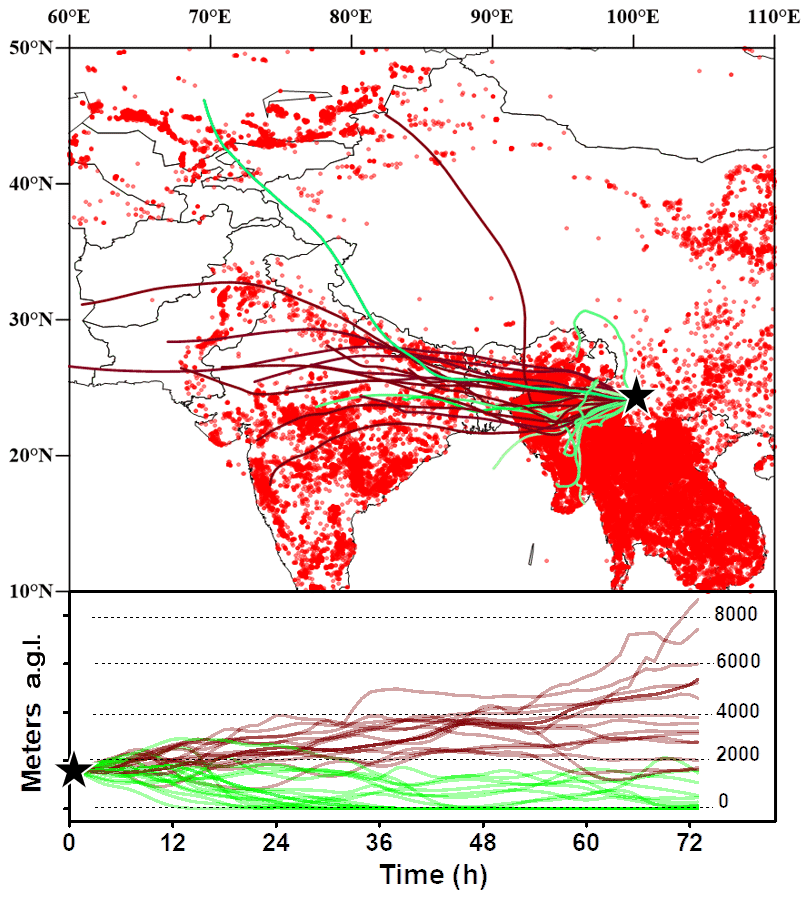
Figure 4Spatial distribution of the fire spots observed by MODIS, as well as the corresponding 72 h backward air-mass trajectory clusters arriving at 1500 m above ground level (a.g.l.) during the sampling periods for the collected samples. The backward trajectories were separated into two episodes of remote western source above 2000 m and local western source below 2000 m, as shown in wine red and green lines.
The average concentrations of saccharide compounds, as well as the contributions, for the episodes above and below 2000 m are shown in Fig. 5. The average concentrations of levoglucosan and mannosan for the above 2000 m samples (327.4 and 35.6 ng m−3) were higher than those for the below 2000 m samples (250.3 and 27.3 ng m−3). The anhydrosugars accounted for 49.2 % and 36.9 % of total saccharides, respectively, for the above and below 2000 m samples. This implied that the levoglucosan at the observation site was attributed to both the local BB activities and BB smoke transported from the neighboring regions of Southeast Asia (Myanmar) and the northern Indian subcontinent. The southwest wind from the Indian Ocean prevailed at Lincang all year round. In spring, the southwest wind was often affected by the low-temperature downhill wind blowing from the snow-covered Hengduan Mountains. The weather frequently alternated between hot and cold, with unstable air pressure and strong wind. Therefore, the lower air could be diluted by the relatively clean, cold air over the plateau. The upper air mainly came from the westerlies. These results were in agreement with the fact that residents across Southeast Asia use wood as an energy source to cook and generate heat.
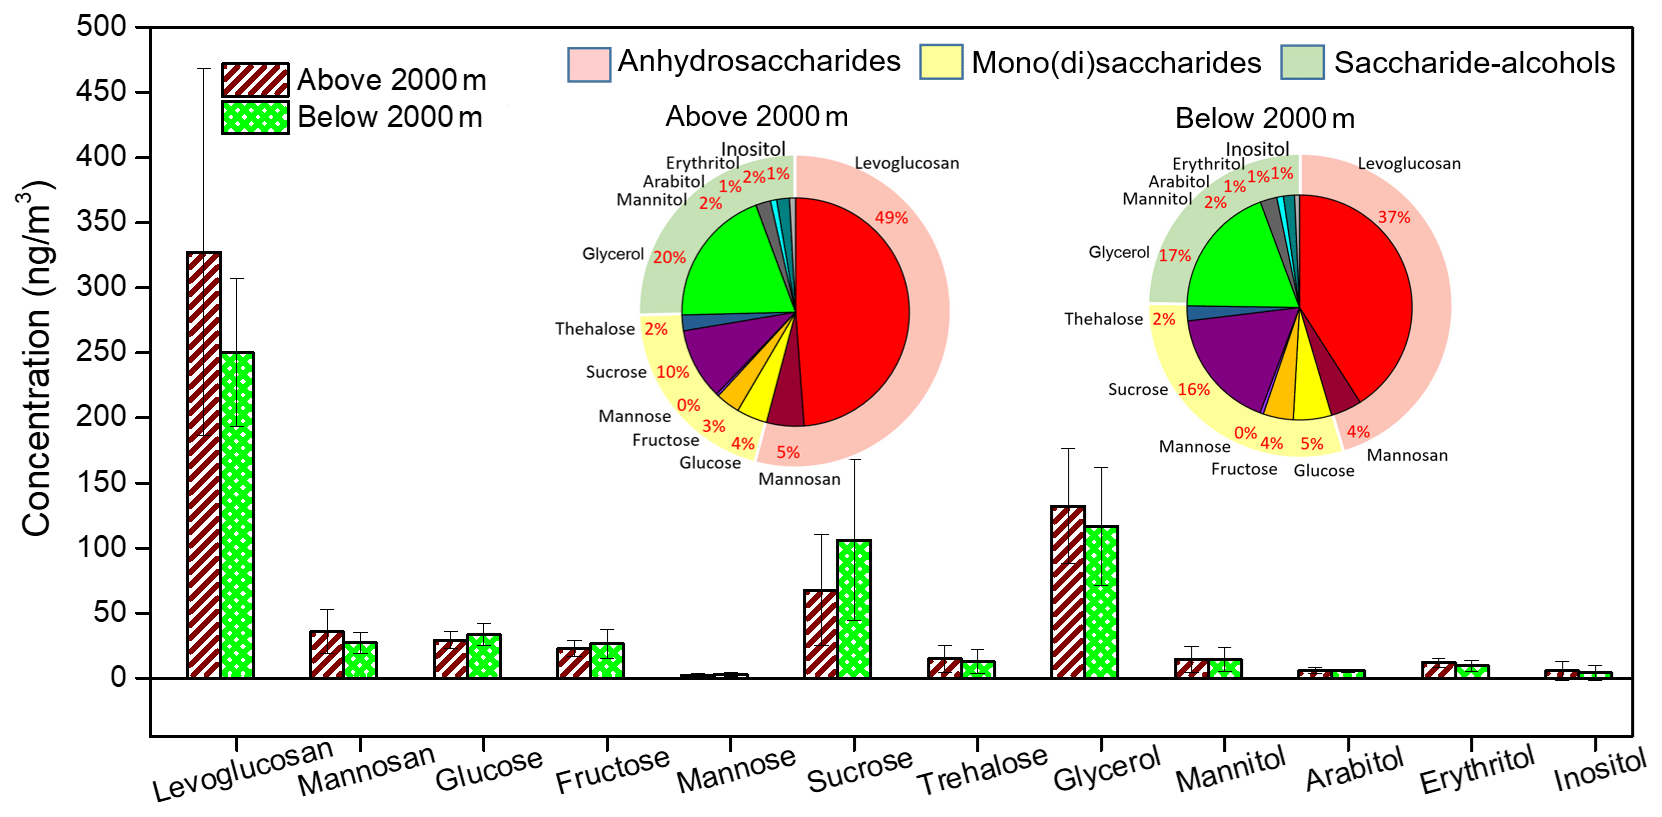
Figure 5Average concentrations and contributions of saccharide compounds for the aerosol samples separated above and below 2000 m.
For glucose, fructose, and sucrose, concentrations were a little higher in the below 2000 m samples (averages: 33.5, 26.4, and 106.2 ng m−3) than those in the above 2000 m samples (averages: 29.2, 22.9, and 67.8 ng m−3). This implied that biogenic aerosols (such as ruptured pollen) carrying sugars could cover long distance, which was supported by previous studies, which have observed long-range atmospheric transport of fine pollen from the Asian continent to the remote island Chichijima under the influence of the westerlies (Rousseau et al., 2008). Although the pollen grains are usually coarse with various shapes and hard shells; this results in a relatively short retention time in the atmosphere. Therefore, it could be concluded that, in addition to the local pollen, the concentration of sucrose in Lincang was also influenced by the transport of airborne pollen derived from South Asia.
3.3 Source apportionment of saccharides
Based on the compositional data of saccharides and key representative markers for difference sources, five factors associated with the emission sources of saccharides were finally resolved by NMF. As shown in Fig. 6a, factor 1 was characterized by high levels of levoglucosan (71.8 %) and mannosan (78.7 %), suggesting the source of BB (Simoneit et al., 1999; Nolte et al., 2001). Factor 2 was characterized by trehalose (99.9 %) and mannitol (100.0 %) and was enriched in the other saccharide components, i.e., arabitol (44.1 %), glucose (29.6 %), erythritol (18.2 %), glycerol (17.8 %), levoglucosan (14.7 %), and sucrose (8.6 %). These saccharide compounds had all been detected in the suspended soil particles and associated microbiota (e.g., fungi, bacteria, and algae) (Simoneit et al., 2004; Rogge et al., 2007). A recent study found that leaves were a major source of saccharide-associated microbial taxa in a rural area of France (Samaké et al., 2020). Hence, this factor was attributed to soil and leaf microbiota. Factor 3 had high levels of glycerol (71.4 %) and erythritol (58.2 %) and showed loadings of glucose (12.8 %) and fructose (11.8 %). Kang et al. (2018) reported that glycerol and erythritol presented large amounts in winter and autumn when vegetation is decomposed. This factor was attributed to plant senescence and decay by microorganisms. Factor 4 exhibited a predominance of sucrose (78.7 %) and showed loadings of glucose (17.2 %) and arabitol (11.8 %). This factor was regarded as the source of airborne pollen, because pollen was the reproductive unit of plants and contains these saccharides and saccharide alcohols as nutritional components (Bieleski, 1995; Miguel et al., 2006; Fu et al., 2012). Factor 5 characterized by the dominance of fructose (88.2 %) was resolved, and it was enriched in glucose (38.2 %) and arabitol (21.2 %); thus, it could be regarded as the source of plant detritus.
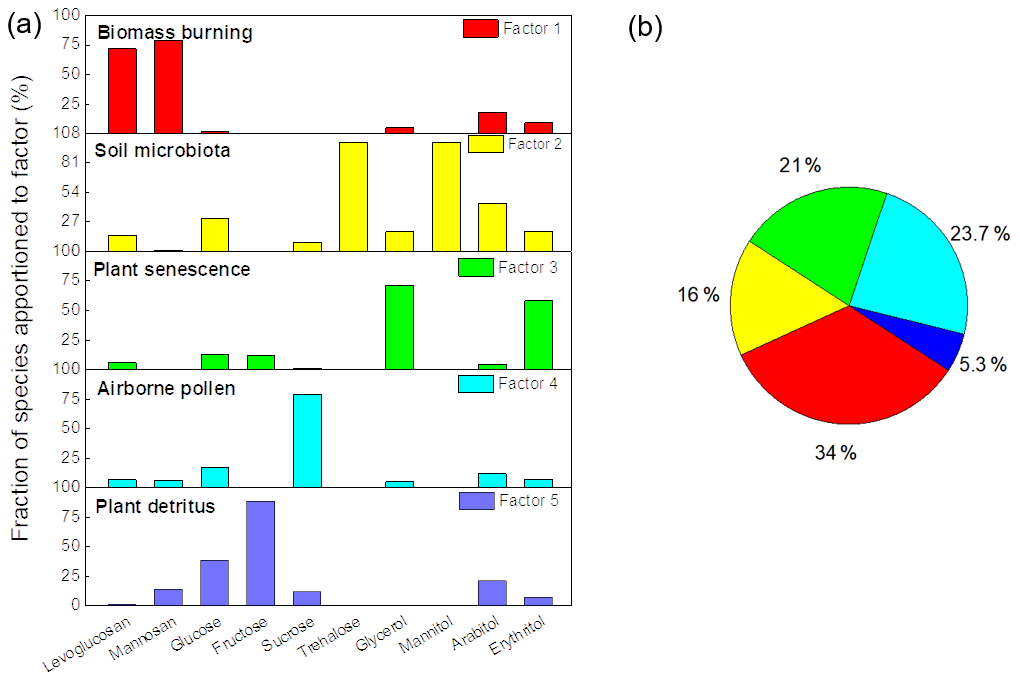
Figure 6(a) Factor profile obtained by NMF analysis. (b) Source contribution of the five factors to the total saccharides in PM2.5 samples.
The pie chart in Fig. 6b shows the contribution of each source to total saccharides. BB of factor 1 (34.0 %) was found as the dominant contributor to total saccharides. Factors 2–5 could all be associated with a biogenic source accounting for a total contribution of 66.0 %. The sources of soil microbiota (factor 2), plant senescence (factor 3), airborne pollen (factor 4), and plant detritus (factor 5), respectively, contributed 16.0 %, 21.0 %, 23.7 %, and 5.3 % to total saccharides. During the sampling periods, daily variations in the proportion of the five factors are shown in Fig. S5. Factor 2 soil microbiota emissions could be associated with soil reclamation and cultivation of farming periods, whereas factor 3 (plant senescence) and factor 5 (plant detritus) could be associated with the harvesting of vegetation or crops. During the observation period of a month, along with the weather warming as sunshine enhanced, humans left two obvious traces of cultivated soil from 9 to 17 March and from 27 March to 8 April and a trace of vegetation or crop harvest from 17 to 30 March. The stronger pollen discharge occurred in March, probably due to the flowering of certain plants. The BB emissions peaked on 9 and 16 March and 1 April were more prone to be open waste burnings.
Since there is still some uncertainty in the factor apportionment, the proportion of sources are only relative and uncertain. It is still difficult to distinguish the contributions of microorganisms and plants to biogenic aerosols. Furthermore, all the above speculations about farming and harvesting periods are based on only 1 month of observation, and long-term observations are needed to obtain more accurate and effective information.
With the help of various atmospheric saccharides, this study presents the characteristics of BB and various biogenic emissions to ambient aerosol in the rural sites of southwest China. Levoglucosan was the most dominant species among all the saccharides, with a concentration of 287.7 ng m−3. The ratios of levoglucosan OC were 1.9 %–8.9 % (average: 3.7 %). BB contributed to 19.1 %–73.9 % of OC (average: 41.3 %). The results indicated that domestic biomass fuel burning, open BB events, possibly open agricultural waste burning, forest fire, or sacrificial activity are significant during the spring in this area. The total concentrations of five mono- or disaccharides and five sugar alcohols respectively contributed 24.9 ± 8.3 % and 26.6 ± 9.9 % to the total measured saccharides. Based on the regression analysis, these mono- or disaccharides and sugar alcohols were mostly emitted by direct biogenic volatilization from plant material or surface soils rather than BB processes. The sampling sites suffered from both local emissions and BB via long-range transport from Southeast Asia (Myanmar, Bangladesh) and the northern Indian subcontinent. Five sources of saccharides were resolved by NMF analysis, including BB (34 %), soil microbiota (16.0 %), plant senescence (21.0 %), airborne pollen (23.7 %), and plant detritus (5.3 %) at rural Lincang in spring.
The data indicated that biofuel and open BB activities in rural southwest China and neighboring regions could have a significant impact on ambient aerosol levels. In addition to the residential biofuel usage, field burning of agricultural residues, fallen leaves, and forest fire were non-negligible. Some new technical measures of biomass resource utilization are urgently needed to improve the open-burning emission scenario in rural areas, along with strict prohibition policy of BB. Meanwhile, the characteristic analysis of saccharides in the region can serve as a valuable reference for future studies to evaluate temporal variations of biomass combustion and biogenic emission during modeling predictions and policy making.
At present, the URLs of the database in our lab are still being established. The code used in the non-negative matrix factorization (NMF) analysis is available upon request from the corresponding authors.
The meteorological parameters were obtained from the Physical Sciences Laboratory of NOAA (https://psl.noaa.gov/data/, last access: 8 September 2020, NOAA, 2020). 72 h backtrajectories of the aerosol were calculated via the NOAA ARL READY website (http://ready. arl.noaa.gov/HYSPLIT.php, last access: 6 September 2020, ARL, 2020). Fire pixel counts were obtained from Moderate Resolution Imaging Spectroradiometer (MODIS) observations on NASA satellites (https://earthdata.nasa.gov/, last access: 3 September 2020, NASA, 2020). The three websites have open-access data. At present, the URLs of the database in our lab are still being established. All data described in this study are available upon request from the corresponding authors.
The locations of the sampling sites are shown in Fig. S1. Temporal variations of RH, temperature, solar irradiation, and rainfall are shown in Fig. S2. Average concentrations of saccharide compounds and the contribution of them for the Datian, Dashu, and Yakoutian samples are shown in Fig. S3. Daily variation on average concentrations of levoglucosan and K+ (panel a), arabitol and mannitol (panel b), PM2.5, Ca2+ and trehalose (panel c) at the three sites throughout the sampling period are shown in Fig. S4. Figure S5 shows daily variations on the proportion of the five factors to the total saccharides in PM2.5 sampled at the three sites during the sampling periods. Table S1 lists the concentrations of the carbonaceous components and soluble inorganic ions in PM2.5 during the sampling periods of spring 2019. Correlation matrix for the dataset of the determined saccharide compounds in PM2.5 samples is shown in Table S2. The supplement related to this article is available online at: https://doi.org/10.5194/acp-21-12227-2021-supplement.
ZZW, JMC and QL designed the research; DW, ZZW and RJC conducted the sampling activities; ZZW and ZYL did the measurements; ZZW and XNS analyzed the results; JMC, HDK, XL and HLO made suggestions for this paper; and ZZW wrote the article with contributions from all co-authors.
The authors declare that they have no conflict of interest.
Publisher's note: Copernicus Publications remains neutral with regard to jurisdictional claims in published maps and institutional affiliations.
This article is part of the special issue “The role of fire in the Earth system: understanding interactions with the land, atmosphere, and society (ESD/ACP/BG/GMD/NHESS inter-journal SI)”. It is a result of the EGU General Assembly 2020, 3–8 May 2020.
This research has been supported by the National Natural Science Foundation of China (grant nos. 91843301, 91743202, 91843302).
This paper was edited by Ivan Kourtchev and reviewed by three anonymous referees.
ARL: (Air Resources Laboratory) of NOAA: HYSPLIT Model [data set], available at: http://ready. arl.noaa.gov/HYSPLIT.php, last access: 6 September 2020.
Bauer, H., Claeys, M., Vermeylen, R., Schueller, E., Weinke, G., Berger, A., and Puxbaum, H.: Arabitol and mannitol as tracers for the quantification of airborne fungal spores, Atmos. Environ., 42, 588–593, https://doi.org/10.1016/j.atmosenv.2007.10.013, 2008.
Bieleski, R. L.: Onset of phloem export from senescent petals of daylily, Plant. Physiol., 109, 557–565, https://doi.org/10.1104/pp.109.2.557, 1995.
Burshtein, N., Lang-Yona, N., and Rudich, Y.: Ergosterol, arabitol and mannitol as tracers for biogenic aerosols in the eastern Mediterranean, Atmos. Chem. Phys., 11, 829–839, https://doi.org/10.5194/acp-11-829-2011, 2011.
Caseiro, A., Marr, I. L., Claeys, M., Kasper-Giebl, A., Puxbaum, H., and Pio, C. A.: Determination of saccharides in atmospheric aerosol using anion-exchange high-performance liquid chromatography and pulsed-amperometric detection, J. Chromatogr. A, 1171, 37–45, https://doi.org/10.1016/j.chroma.2007.09.038, 2007.
Chen, J., Kawamura, K., Liu, C. Q., and Fu, P. Q.: Long-term observations of saccharides in remote marine aerosols from the western North Pacific: a comparison between 1990-1993 and 2006-2009 periods, Atmos. Environ., 67, 448–458, https://doi.org/10.1016/j.atmosenv.2012.11.014, 2013.
Chen, J. M., Li, C. L., Ristovski, Z., Milic, A., Gu, Y. T., Islam, M. S., Wang, S. X., Hao, J. M., Zhang, H. F., He, C. R., Guo, H., Fu, H. B., Miljevic, B., Morawska, L., Thai, P., Lam, Y. F., Pereira, G., Ding, A. J., Huang, X., and Dumka, U. C.: A review of biomass burning: emissions and impacts on air quality, health and climate in China, Sci. Total Environ., 579, 1000–1034, https://doi.org/10.1016/j.scitotenv.2016.11.025, 2017.
Chen, Y. and Xie, S.: Characteristics and formation mechanism of a heavy air pollution episode caused by biomass burning in Chengdu, Southwest China, Sci. Total Environ., 473–474, 507–517, https://doi.org/10.1016/j.scitotenv.2013.12.069, 2014.
Cheng, Y., Engling, G., He, K.-B., Duan, F.-K., Ma, Y.-L., Du, Z.-Y., Liu, J.-M., Zheng, M., and Weber, R. J.: Biomass burning contribution to Beijing aerosol, Atmos. Chem. Phys., 13, 7765–7781, https://doi.org/10.5194/acp-13-7765-2013, 2013.
Chow, J. C., Watson, J. G., Chen, L. W. A., Chang, M. C. O., Robinson, N. F., Trimble, D., and Kohl, S.: The IMPROVE_A temperature protocol for thermal/ optical carbon analysis: maintaining consistency with a long-term database, J. Air Waste Manag., 57, 1014–1023, https://doi.org/10.3155/1047-3289.57.9.1014, 2007.
Christner, B. C., Morris, C. E., Foreman, C. M., Cai, R., and Sands, D. C.: Ubiquity of biological ice nucleators in snowfall, Science, 319, 1214, https://doi.org/10.1126/science.1149757, 2008.
Claeys, M., Graham, B., Vas, G., Wang, W., Vermeylen, R., Pashynska, V., Cafmeyer, J., Guyon, P., Andreae, M. O., Artaxo, P., and Maenhaut, W.: Formation of secondary organic aerosols through photooxidation of isoprene, Science, 303, 1173–1176, https://doi.org/10.1126/science.1092805, 2004.
Després, V. R., Huffman, J. A., Burrows, S. M., Hoose, C., Safatov, A. S., Buryak, G., FroehlichNowoisky, J., Elbert, W., Andreae, M. O., Pöschl, U., and Jaenicke, R.: Primary biological aerosol particles in the atmosphere: a review, Tellus B, 64, 1–58, https://doi.org/10.3402/tellusb.v64i0.15598, 2012.
Ding, X., Wang, X. M., Xie, Z. Q., Zhang, X., and Sun, L. G.: Impacts of Siberian biomass burning on organic aerosols over the North Pacific Ocean and the Arctic: Primary and secondary organic tracers, Environ. Sci. Technol., 47, 3149–3157, https://doi.org/10.1021/es3037093, 2013.
Ding, X., He, Q. F., Shen, R. Q., Yu, Q. Q., Zhang, Y. Q., Xin, J. Y., Wen, T. X., and Wang, X. M.: Spatial and seasonal variations of isoprene secondary organic aerosol in China: significant impact of biomass burning during winter, Sci. Rep.-UK, 6, 20411, https://doi.org/10.1038/srep20411, 2016.
Draxler, R. R. and Hess, G. D.: An overview of the HYSPLIT-4 modelling system for trajectories, dispersion and deposition, Aust. Meteorol. Mag., 47, 295–308, 1998.
Elbert, W., Taylor, P. E., Andreae, M. O., and Pöschl, U.: Contribution of fungi to primary biogenic aerosols in the atmosphere: wet and dry discharged spores, carbohydrates, and inorganic ions, Atmos. Chem. Phys., 7, 4569–4588, https://doi.org/10.5194/acp-7-4569-2007, 2007.
Engling, G., Carrico, C. M., Kreindenweis, S. M., Collet, J. L., Day, D. E., Malm, W. C., Lincoln, E., Hao, W. M., Iinuma, Y., and Herrmann, H.: Determination of levoglucosan in biomass combustion aerosol by high-performance anion-exchange chromatography with pulsed amperometric detection, Atmos. Environ., 40, S299–S311, https://doi.org/10.1016/j.atmosenv.2005.12.069, 2006.
Engling, G., Zhang, Y. N., Chan, C. Y., Sang, X. F., Lin, M., Ho, K. F., Li, Y. S., Lin, C. Y., and Lee, J. J.: Characterization and sources of aerosol particles over the southeastern Tibetan Plateau during the Southeast Asia biomass-burning season, Tellus B, 63, 117–128, https://doi.org/10.1111/j.1600-0889.2010.00512.x, 2011.
Fabbri, D., Torri, C., Simoneit, B. R. T., Marynowski, L., Rushdi, A. I., and Fabiańska, M. J.: Levoglucosan and other cellulose and lignin markers in emissions from burning of Miocene lignites, Atmos. Environ., 43, 2286–2295, https://doi.org/10.1016/j.atmosenv.2009.01.030, 2009.
Fu, P. Q., Kawamura, K., and Barrie, L. A.: Photochemical and other sources of organic compounds in the Canadian high Arctic aerosol pollution during winter-spring, Environ. Sci. Technol., 43, 286–292, https://doi.org/10.1021/es803046q, 2009.
Fu, P. Q., Kawamura, K., Kobayashi, M., and Simoneit, B. R. T.: Seasonal variations of sugars in atmospheric particulate matter from Gosan, Jeju Island: significant contributions of airborne pollen and Asian dust in spring, Atmos. Environ., 55, 234–239, https://doi.org/10.1016/j.atmosenv.2012.02.061, 2012.
Fu, P. Q., Kawamura, K., Chen, J., Charrière, B., and Sempéré, R.: Organic molecular composition of marine aerosols over the Arctic Ocean in summer: contributions of primary emission and secondary aerosol formation, Biogeosciences, 10, 653–667, https://doi.org/10.5194/bg-10-653-2013, 2013.
Fu, P. Q., Zhuang, G. S., Sun, Y. L., Wang, Q. Z., Chen, J., Ren, L.J., Yang, F., Wang, Z. F., Pan, X. L., Li, X. D., and Kawamura, K.: Molecular markers of biomass burning, fungal spores and biogenic SOA in the Taklimakan desert aerosols, Atmos. Environ., 130, 64–73, https://doi.org/10.1016/j.atmosenv.2015.10.087, 2016.
Fraser, M. P. and Lakshmanan, K.: Using levoglucosan as a molecular marker for the long-range transport of biomass combustion aerosols, Environ. Sci. Technol., 34, 4560–4564, https://doi.org/10.1021/es991229l, 2000.
Graham, B., Mayol-Bracero, O. L., Guyon, P., Robert, G. C., Decesari, S., Facchini, M. C., Artaxo, P., Maenhaut, W., P, K., and Andreae, M. O.: Water-soluble organic compounds in biomass burning aerosols over Amazonia: 1. Characterization by NMR and GC-MS, J. Geophys. Res., 107, 8047, https://doi.org/10.1029/2001JD000336, 2002.
Graham, B., Guyon, P., Taylor, P. E., Artaxo, P., Maenhaut, W., Glovsky, M. M., Flagan, R. C., and Andreae, M. O.: Organic compounds present in the natural Amazonian aerosol: characterization by gas chromatography-mass spectrometry, J. Geophys. Res.-Atmos., 108, 4766, https://doi.org/10.1029/2003JD003990, 2003.
Harrison, R. M., Beddows, D. C. S., Hu, L., and Yin, J.: Comparison of methods for evaluation of wood smoke and estimation of UK ambient concentrations, Atmos. Chem. Phys., 12, 8271–8283, https://doi.org/10.5194/acp-12-8271-2012, 2012.
Hennigan, C. J., Sullivan, A. P., Collett Jr., J. L., and Robinson, A. L.: Levoglucosan stability in biomass burning particles exposed to hydroxyl radicals, Geophys. Res. Lett., 37, L09806, https://doi.org/10.1029/2010GL043088, 2010.
Holden, A. S., Sullivan, A. P., Munchak, L. A., Kreidenweis, S. M., Schichtel, B. A., Malm, W. C., and Collett Jr., J. L.: Determining contributions of biomass burning and other sources to fine particle contemporary carbon in the western United States, Atmos. Environ., 45, 1986–1993, https://doi.org/10.1016/j.atmosenv.2011.01.021, 2011.
Jacobson, M. C., Hansson, H. C., Noone, K. J., and Charlson, R. J.: Organic atmospheric aerosols: review and state of science, Rev. Geophys., 38, 267–294, https://doi.org/10.1029/1998RG000045, 2000.
Jaenicke, R.: Abundance of cellular material and proteins in the atmosphere, Science, 308, 73, https://doi.org/10.1126/science.1106335, 2005.
Jaenicke, R., Matthias-Maser, S., and Gruber, S.: Omnipresence of biological material in the atmosphere, Environ. Chem., 4, 217–220, https://doi.org/10.1071/EN07021, 2007.
Jia, Y. L. and Fraser, M.: Characterization of saccharides in size-fractionated ambient particulate matter and aerosol sources: the contribution of primary biological aerosol particles (PBAPs) and soil to ambient, Environ. Sci. Technol., 45, 930–936, https://doi.org/10.1021/es103104e, 2011.
Jia, Y. L., Bhat, S. G., and Fraser, M. P.: Characterization of saccharides and other organic compounds in fine particles and the use of saccharides to track primary biologically derived carbon sources, Atmos. Environ., 44, 724–732, https://doi.org/10.1016/j.atmosenv.2009.10.034, 2010.
Kalogridis, A. C., Popovicheva, O. B., Engling, G., Diapouli, E., Kawamura, K., Tachibana, E., Ono, K., Kozlov, V. S., and Eleftheriadis, K.: Smoke aerosol chemistry and aging of Siberian biomass burning emissions in a large aerosol chamber, Atmos. Environ., 185, 15–28, https://doi.org/10.1016/j.atmosenv.2018.04.033, 2018.
Kang, M. J., Ren, L. J., Ren, H., Zhao, Y., Kawamura, K., Zhang, H. L., Wei L. F., Sun. Y. L., Wang, Z. F., and Fu, P. Q.: Primary biogenic and anthropogenic sources of organic aerosols in Beijing, China: Insights from saccharides and n-alkanes, Environ. Pollut., 243, 1579–1587, https://doi.org/10.1016/j.envpol.2018.09.118, 2018.
Kleindienst, T. E., Jaoui, M., Lewandowski, M., Offenberg, J. H., Lewis, C. W., Bhave, P. V., and Edney, E. O.: Estimates of the contributions of biogenic and anthropogenic hydrocarbons to secondary organic aerosol at a southeastern US location, Atmos. Environ., 41, 8288–8300, https://doi.org/10.1016/j.atmosenv.2007.06.045, 2007.
Lai, C. Y., Liu, Y. C., Ma, J. Z., Ma, Q. X., and He, H.: Degradation kinetics of levoglucosan initiated by hydroxyl radical under different environmental conditions, Atmos. Environ., 91, 32–39, https://doi.org/10.1016/j.atmosenv.2014.03.054, 2014.
Lee, D. D. and Seung, H. S.: Learning the parts of objects by non-negative matrix factorization, Nature, 401, 788–791, 1999.
Lee, T., Sullivan, A. P., Mack, L., Jimenez, J. L., Kreidenweis, S. M., Onasch, T. B., Worsnop, D. R., Malm, W., Wold, C. E., and Hao, W. M.: Chemical smoke marker emissions during flaming and smoldering phases of laboratory open burning of wildland fuels, Aerosol Sci. Tech., 44, 1–5, https://doi.org/10.1080/02786826.2010.499884, 2010.
Li, Q. L., Wang, N. L., Barbante, C., Kang, S. C., Callegaro, A., Battistel, D., Argiriadis, E., Wan, X., Yao, P., Pu, T., Wu, X. B., Han, Y., and Huai, Y. P.: Biomass burning source identification through molecular markers in cryoconites over the Tibetan Plateau, Environ. Pollut., 244, 209–217, https://doi.org/10.1016/j.envpol.2018.10.037, 2019.
Li, X., Chen, M. X., Le, H. P., Wang, F. W., Guo, Z. G., Iinuma, Y., Chen, J. M., and Herrmann, H.: Atmospheric outflow of PM2.5 saccharides from megacity Shanghai to East China Sea: Impact of biological and biomass burning sources, Atmos. Environ., 143, 1–14, https://doi.org/10.1016/j.atmosenv.2016.08.039, 2016a.
Li, X., Jiang, L., Hoa, L. P., Lyu, Y., Xu, T. T., Yang, X., Iinuma, Y., Chen, J. M., and Herrmann, H.: Size distribution of particle-phase sugar and nitrophenol tracers during severe urban haze episodes in Shanghai, Atmos. Environ., 145, 115–127, https://doi.org/10.1016/j.atmosenv.2016.09.030, 2016b.
Liang, L. L., Engling, G., Duan, F. K., Cheng, Y., and He, K. B.: Characteristics of 2-methyltetrols in ambient aerosol in Beijing, China, Atmos. Environ., 59, 376–381, https://doi.org/10.1016/j.atmosenv.2012.05.052, 2012.
Liang, L., Engling, G., Cheng, Y., Duan, F. K., Du, Z. Y., and He, K. B.: Rapid detection and quantification of fungal spores in the urban atmosphere by flow cytometry, J. Aerosol Sci., 66, 179–186, https://doi.org/10.1016/j.jaerosci.2013.08.013, 2013a.
Liang, L. L., Engling, G., He, K. B., Du, Z. Y., Cheng, Y., and Duan, F. K.: Evaluation of fungal spore characteristics in Beijing, China, based on molecular tracer measurements, Environ. Res. Lett., 8, 014005, https://doi.org/10.1088/1748-9326/8/1/014005, 2013b.
Liang, L. L., Engling, G., Du, Z. Y., Cheng, Y., Duan, F. K., Liu, X. Y., and He, K. B.: Seasonal variations and source estimation of saccharides in atmospheric particulate matter in Beijing, China, Chemosphere, 150, 365–377, https://doi.org/10.1016/j.chemosphere.2016.02.002, 2016.
Medeiros, P. M., Conte, M. H., Weber, J. C., and Simoneit, B. R. T.: Sugars as source indicators of biogenic organic carbon in aerosols collected above the Howland Experimental Forest, Maine, Atmos. Environ., 40, 1694–1705, https://doi.org/10.1016/j.atmosenv.2005.11.001, 2006.
Miguel, A. G., Taylor, P. E., House, J., Glovsky, M. M., and Flagan, R. C.: Meteorological influences on respirable fragment release from Chinese elm pollen, Aerosol Sci. Tech., 40, 690–696, https://doi.org/10.1080/02786820600798869, 2006.
Miyazaki, Y., Fu, P. Q., Kawamura, K., Mizoguchi, Y., and Yamanoi, K.: Seasonal variations of stable carbon isotopic composition and biogenic tracer compounds of water-soluble organic aerosols in a deciduous forest, Atmos. Chem. Phys., 12, 1367–1376, https://doi.org/10.5194/acp-12-1367-2012, 2012.
Mochida, M., Kawamura, K., Fu, P. Q., and Takemura, T.: Seasonal variation of levoglucosan in aerosols over the western North Pacific and its assessment as a biomass-burning tracer, Atmos. Environ., 44, 3511–3518, https://doi.org/10.1016/j.atmosenv.2010.06.017, 2010.
NASA: EARTHDATA of NASA (National Aeronautics and Space Administration), Active Fire Data [data set], available at: https://earthdata.nasa.gov/, last access: 3 September 2020.
Nishikawa, M., Hao, Q., and Morita, M.: Preparation and evaluation of certified reference materials from Asian mineral dust, Global Environ. Res., 4, 103–113, 2000.
Nolte, C. G., Schauer, J. J., Cass, G. R., and Simoneit, B. R. T.: Highly polar organic compounds present in wood smoke and in the ambient atmosphere, Environ. Sci. Technol., 35, 1912–1919, https://doi.org/10.1021/es001420r, 2001.
Nirmalkar, J., Deshmukh, D. K., Deb, M. K., Tsai, Y. I., and Sopajaree, K.: Mass loading and episodic variation of molecular markers in PM2.5 aerosols over a rural area in eastern central India, Atmos. Environ., 117, 41–50, https://doi.org/10.1016/j.atmosenv.2015.07.003, 2015.
NOAA: Physical Sciences Laboratory (PSL) of NOAA (National Oceanic and Atmospheric Administration): Gridded Climate Datasets [data set], available at: https://psl.noaa.gov/data/, last access: 8 September 2020.
Pashynska, V., Vermeylen, R., Vas, G., Maenhaut, W., and Claeys, M.: Development of a gas chromatographic/ion trap mass spectrometric method for the determination of levoglucosan and saccharidic compounds in atmospheric aerosols, Application to urban aerosol, J. Mass Spectrom., 37, 1249–1257, https://doi.org/10.1002/jms.391, 2002.
Pietrogrande, M. C., Bacco, D., Visentin, M., Ferrari, S., and Casali, P.: Polar organic marker compounds in atmospheric aerosol in the Po Valley during the Supersito campaigns-Part 2: Seasonal variations of sugars, Atmos. Environ., 97, 215–225, https://doi.org/10.1016/j.atmosenv.2014.07.056, 2014.
Puxbaum, H., Caseiro, A., Sánchez-Ochoa, A., Kasper-Giebl, A., Claeys, M., Gelencsér, A., Legrand, M., Preunkert, S., and Pio, C.: Levoglucosan levels at background sites in Europe for assessing the impact of biomass combustion on the European aerosol background, J. Geophys. Res., 112, D23S05, https://doi.org/10.1029/2006JD008114, 2007.
Pöschl, U., Martin, S. T., Sinha, B., Chen, Q., Gunthe, S. S., Huffman, J. A., Borrmann, S., Farmer, D. K., Garland, R. M., Helas, G., Jimenez, J. L., King, S. M., Manzi, A., Mikhailov, E., Pauliquevis, T., Petters, M. D., Prenni, A. J., Roldin, P., Rose, D., Schneider, J., Su, H., Zorn, S. R., Artaxo, P., and Andreae, M.O.: Rainforest aerosols as biogenic nuclei of clouds and precipitation in the Amazon, Science, 329, 1513–1516, https://doi.org/10.1126/science.1191056, 2010.
Reyes-Villegas, E., Bannan, T., Le Breton, M., Mehra, A., Priestley, M., Percival, C., Coe, H., and Allan, J. D.: Online chemical characterization of food-cooking organic aerosols: Implications for source apportionment, Environ. Sci. Technol., 52, 5308–5318, https://doi.org/10.1021/acs.est.7b06278, 2018.
Rogge, W. F., Hildemann, L. M., Mazurek, M. A., Cass, G. R., and Simoneit, B. R. T.: Sources of fine organic aerosol. 4. Particulate abrasion products from leaf surfaces of urban plants, Environ. Sci. Technol., 27, 2700–2711, 1993.
Rogge, W. F., Medeiros, P. M., and Simoneit, B. R. T.: Organic marker compounds in surface soils of crop fields from the San Joaquin Valley fugitive dust characterization study, Atmos. Environ., 41, 8183–8204, https://doi.org/10.1016/j.atmosenv.2007.06.030, 2007.
Rousseau, D. D., Schevin, P., Ferrier, J., Jolly, D., Andreasen, T., Ascanius, S. E., Hendriksen, S. E., and Poulsen, U.: Long-distance pollen transport from North America to Greenland in spring, J. Geophys. Res., 113, G02013, https://doi.org/10.1029/2007JG000456, 2008.
Rybicki, M., Marynowski, L., and Simoneit, B. R. T.: Composition of organic compounds from low-temperature burning of lignite and their application as tracers in ambient air, Chemosphere, 249, 126087, https://doi.org/10.1016/j.chemosphere.2020.126087, 2020.
Samaké, A., Jaffrezo, J.-L., Favez, O., Weber, S., Jacob, V., Albinet, A., Riffault, V., Perdrix, E., Waked, A., Golly, B., Salameh, D., Chevrier, F., Oliveira, D. M., Bonnaire, N., Besombes, J.-L., Martins, J. M. F., Conil, S., Guillaud, G., Mesbah, B., Rocq, B., Robic, P.-Y., Hulin, A., Le Meur, S., Descheemaecker, M., Chretien, E., Marchand, N., and Uzu, G.: Polyols and glucose particulate species as tracers of primary biogenic organic aerosols at 28 French sites, Atmos. Chem. Phys., 19, 3357–3374, https://doi.org/10.5194/acp-19-3357-2019, 2019.
Samaké, A., Bonin, A., Jaffrezo, J.-L., Taberlet, P., Weber, S., Uzu, G., Jacob, V., Conil, S., and Martins, J. M. F.: High levels of primary biogenic organic aerosols are driven by only a few plant-associated microbial taxa, Atmos. Chem. Phys., 20, 5609–5628, https://doi.org/10.5194/acp-20-5609-2020, 2020.
Sang, X. F., Chan, C. Y., Engling, G., Chan, L. Y., Wang, X. M., Zhang, Y. N., Shi, S., Zhang, Z. S., Zhang, T., and Hu, M.: Levoglucosan enhancement in ambient aerosol during springtime transport events of biomass burning smoke to Southeast China, Tellus B, 63, 129–139, https://doi.org/10.1111/j.1600-0889.2010.00515.x, 2011.
Sang, X. F., Zhang, Z. S., Chan, C. Y., and Engling, G.: Source categories and contribution of biomass smoke to organic aerosol over the southeastern Tibetan Plateau, Atmos. Environ., 78, 113–123, https://doi.org/10.1016/j.atmosenv.2012.12.012, 2013.
Schkolnik, G., Falkovich, A.H., Rudich, Y., Maenhaut, W., and Artaxo, P.: New analytical method for the determination of levoglucosan, polyhydroxy compounds, and 2-methylerythritol and its application to smoke and rainwater samples, Environ. Sci. Technol., 39, 2744–2752, https://doi.org/10.1021/es048363c, 2005.
Shang, X., Zhang, K., Meng, F., Wang, S., Lee, M., Suh, I., Kim, D., Jeon, K., Park, H., Wang, X., and Zhao, Y.: Characteristics and source apportionment of fine haze aerosol in Beijing during the winter of 2013, Atmos. Chem. Phys., 18, 2573–2584, https://doi.org/10.5194/acp-18-2573-2018, 2018.
Shen, R. R., Liu, Z. R., Liu, Y. S., Wang, L. L., Dong, L., Wang, Y. S., Wang, G. A., Bai, Y., and Li, X. R.: Typical polar organic aerosol tracers in PM2.5 over the North China Plain: Spatial distribution, seasonal variations, contribution and sources, Chemosphere, 209, 758–766, https://doi.org/10.1016/j.chemosphere.2018.06.133, 2018
Simoneit, B. R. T., Schauer, J. J., Nolte, C. G., Oros, D. R., Elias, V. O., Fraser, M. P., Rogge, W. F., and Cass, G. R.: Levoglucosan, a tracer for cellulose in biomass burning and atmospheric particles, Atmos. Environ., 33, 173–182, https://doi.org/10.1016/S1352-2310(98)00145-9, 1999.
Simoneit, B. R. T., Elias, V. O., Kobayashi, M., Kawamura, K., Rushdi, A. I., Medeiros, P. M., Rogge, W. F., and Didyk, B. M.: Sugars-Dominant water-soluble organic compounds in soils and characterization as tracers in atmospheric particulate matter, Environ. Sci. Technol., 38, 5939–5949, https://doi.org/10.1021/es0403099, 2004.
Sullivan, A. P., May, A. A., Lee, T., McMeeking, G. R., Kreidenweis, S. M., Akagi, S. K., Yokelson, R. J., Urbanski, S. P., and Collett Jr., J. L.: Airborne characterization of smoke marker ratios from prescribed burning, Atmos. Chem. Phys., 14, 10535–10545, https://doi.org/10.5194/acp-14-10535-2014, 2014.
Tang, M., Gu, W., Ma, Q., Li, Y. J., Zhong, C., Li, S., Yin, X., Huang, R.-J., He, H., and Wang, X.: Water adsorption and hygroscopic growth of six anemophilous pollen species: the effect of temperature, Atmos. Chem. Phys., 19, 2247–2258, https://doi.org/10.5194/acp-19-2247-2019, 2019.
Tanoue, E. and Handa, N.: Monosaccharide composition of marine particles and sediments from the Bering Sea and Northern North Pacific, Oceanol. Acta, 10, 91–99, 1987.
Tominaga, S., Matsumoto, K., Kaneyasu, N., Shigihara, A., Katono, K., and Igawa, M.: Measurements of particulate sugars at urban and forested suburban sites, Atmos. Environ., 45, 2335–2339, https://doi.org/10.1016/j.atmosenv.2010.09.056, 2011.
Tsai, Y. I., Wu, P. L., Hsu, Y. T., and Yang, C. R.: Anhydrosugar and sugar alcohol organic markers associated with carboxylic acids in particulate matter from incense burning, Atmos. Environ., 44, 3708–3718, https://doi.org/10.1016/j.atmosenv.2010.06.030, 2010.
Tsai, Y. I., Sopajaree, K., Chotruksa, A., Wu, H. C., and Kuo, S. S.: Source indicators of biomass burning associated with inorganic salts and carboxylates in dry season ambient aerosol in Chiang Mai Basin, Thailand, Atmos. Environ., 78, 93–104, https://doi.org/10.1016/j.atmosenv.2012.09.040, 2013.
Wan, E. C. H. and Yu, J. Z.: Analysis of sugars and sugar polyols in atmospheric aerosols by chloride attachment in liquid chromatography/negative ion electrospray mass spectrometry, Environ. Sci. Technol., 41, 2459–2466, https://doi.org/10.1021/es062390g, 2007.
Wang, G., Chen, C., Li, J., Zhou, B., Xie, M., Hu, S., Kawamura, K., and Chen, Y.: Molecular composition and size distribution of sugars, sugar-alcohols and carboxylic acids in airborne particles during a severe urban haze event caused by wheat straw burning, Atmos. Environ., 45, 2473–2479, https://doi.org/10.1016/j.atmosenv.2011.02.045, 2011.
Wang, Q. Q., Shao, M., Liu, Y., William, K., Paul, G., Li, X. H., Liu, Y. A., and Lu, S. H.: Impact of biomass burning on urban air quality estimated by organic tracers: Guangzhou and Beijing as cases, Atmos. Environ., 41, 8380–8390, https://doi.org/10.1016/j.atmosenv.2007.06.048, 2007.
Wang, X., Shen, Z. X., Liu, F. B., Lu, D., Tao, J., Lei, Y. L., Zhang, Q., Zeng, Y. L., Xu, H. M., Wu, Y. F., Zhang, R. J., and Cao, J. J.: Saccharides in summer and winter PM2.5 over Xi'an, Northwestern China: Sources, and yearly variations of biomass burning contribution to PM2.5, Environ. Res., 214, 410–417, https://doi.org/10.1016/j.atmosres.2018.08.024, 2018.
Womiloju, T. O., Miller, J. D., Mayer, P. M., and Brook, J. R.: Methods to determine the biological composition of particulate matter collected from outdoor air, Atmos. Environ., 37, 4335–4344, https://doi.org/10.1016/S1352-2310(03)00577-6, 2003.
Wu, J., Kong, S. F., Zeng, X., Cheng, Y., Yan, Q., Zheng, H., Yan, Y. Y., Zheng, S. R. Liu, D. T., Zhang, X. Y., Fu, P. Q., Wang, S. X., and Qi, S. H.: First High-resolution emission inventory of levoglucosan for biomass burning and non-biomass burning sources in China, Environ. Sci. Technol., 55, 1497–1507, https://doi.org/10.1021/acs.est.0c06675, 2021.
Xiao, M. X., Wang, Q. Z., Qin, X. F., Yu, G. Y., and Deng, C. R.: Composition, sources, and distribution of PM2.5 saccharides in a coastal urban site of china, Atmosphere, 9, 274, https://doi.org/10.3390/atmos9070274, 2018.
Xie, Y. L., Hopke, P. K., Paatero, P., Barrie, L. A., and Li, S. M.: Identification of source nature and seasonal variations of Arctic aerosol by positive matrix factorization, J. Atmos. Sci., 56, 249–260, https://doi.org/10.1175/1520-0469(1999)056<0249:IOSNAS>2.0.CO;2, 1999.
Yan, C. Q., Zheng, M., Sullivan, A. P., Shen, G. F., Chen, Y. J., Wang, S. X., Zhao, B., Cai, S. Y., Desyaterik, Y., Li, X. Y., Zhou, T., Gustafsson, Ö., and Collett Jr., J. L.: Residential coal combustion as a source of levoglucosan in China, Environ. Sci. Technol., 52, 1665–1674, https://doi.org/10.1021/acs.est.7b05858, 2018.
Yan, C. Q., Sullivan, A. P., Cheng, Y., Zheng, M., Zhang, Y. H., Zhu, T., and Collett Jr., J. L.: Characterization of saccharides and associated usage in determining biogenic and biomass burning aerosols in atmospheric fine particulate matter in the North China Plain, Sci. Total Environ., 650, 2939–2950, https://doi.org/10.1016/j.scitotenv.2018.09.325, 2019.
Yang, Y., Chan, C. Y., Tao, J., Lin, M., Engling, G., Zhang, Z., Zhang, T., and Su, L.: Observation of elevated fungal tracers due to biomass burning in the Sichuan Basin at Chengdu City, China, Sci. Total Environ., 431, 68–77, https://doi.org/10.1016/j.scitotenv.2012.05.033, 2012.
Yttri, K. E., Dye, C., and Kiss, G.: Ambient aerosol concentrations of sugars and sugar-alcohols at four different sites in Norway, Atmos. Chem. Phys., 7, 4267–4279, https://doi.org/10.5194/acp-7-4267-2007, 2007.
Yttri, K. E., Simpson, D., Nøjgaard, J. K., Kristensen, K., Genberg, J., Stenström, K., Swietlicki, E., Hillamo, R., Aurela, M., Bauer, H., Offenberg, J. H., Jaoui, M., Dye, C., Eckhardt, S., Burkhart, J. F., Stohl, A., and Glasius, M.: Source apportionment of the summer time carbonaceous aerosol at Nordic rural background sites, Atmos. Chem. Phys., 11, 13339–13357, https://doi.org/10.5194/acp-11-13339-2011, 2011.
Zhang, K., Shang, X. N., Herrmann, H., Meng, F., Mo, Z. Y., Chen, J. H., and Lv, M. L.: Approaches for identifying PM2.5 source types and source areas at a remote background site of South China in spring, Sci. Total Environ., 691, 1320–1327, https://doi.org/10.1016/j.scitotenv.2019.07.178, 2019.
Zhang, T., Claeys, M., Cachier, H., Dong, S. P., Wang, W., Maenhaut, W., and Liu, X. D.: Identification and estimation of the biomass burning contribution to Beijing aerosol using levoglucosan as a molecular marker, Atmos. Environ., 42, 7013–7021, https://doi.org/10.1016/j.atmosenv.2008.04.050, 2008.
Zhang, T., Engling, G., Chan, C. Y., Zhang, Y. N., Zhang, Z. S., Lin, M., Sang, X. F., Li, Y. D., and Li, Y. S.: Contribution of fungal spores to particulate matter in a tropical rainforest, Environ. Res. Lett., 5, 024010, https://doi.org/10.1088/1748-9326/5/2/024010, 2010.
Zhang, Y., Obrist, D., Zielinska, B., and Gertler, A.: Particulate emissions from different types of biomass burning, Atmos. Environ., 72, 27–35, https://doi.org/10.1016/j.atmosenv.2013.02.026, 2013.
Zhang, Y. L., Wei, Q., Zhou, C. P., Ding, M. J., and Liu, L. S.: Spatial and temporal variability in the net primary production of alpine grassland on the Tibetan Plateau since 1982, J. Geogr. Sci., 24, 269–287, https://doi.org/10.1007/s11442-014-1087-1, 2014.
Zhang, Y. X., Shao, M., Zhang, Y. H., Zeng, L. M., He, L. Y., Zhu, B., Wei, Y. J., and Zhu, X. L.: Source profiles of particulate organic matters emitted from cereal straw burnings, J. Environ. Sci., 19, 167–175, https://doi.org/10.1016/S1001-0742(07)60027-8, 2007.
Zhu, C., Kawamura, K., and Kunwar, B.: Effect of biomass burning over the western North Pacific Rim: wintertime maxima of anhydrosugars in ambient aerosols from Okinawa, Atmos. Chem. Phys., 15, 1959–1973, https://doi.org/10.5194/acp-15-1959-2015, 2015.
Zhu, C. S., Cao, J. J., Tsai, C. J., Zhang, Z. S., and Tao, J.: Biomass burning tracers in rural and urban ultrafine particles in Xi'an China, Atmos. Pollution Res., 8, 614–618, https://doi.org/10.1016/j.apr.2016.12.011, 2017.
Zhu, Y., Yang, L., Chen, J., Wang, X., Xue, L., Sui, X., Wen, L., Xu, C., Yao, L., Zhang, J., Shao, M., Lu, S., and Wang, W.: Characteristics of ambient volatile organic compounds and the influence of biomass burning at a rural site in Northern China during summer 2013, Atmos. Environ., 124, 156–165, https://doi.org/10.1016/j.atmosenv.2015.08.097, 2016.