the Creative Commons Attribution 4.0 License.
the Creative Commons Attribution 4.0 License.
 | 13 Aug 2021
Gas–particle partitioning of polyol tracers at a suburban site in Nanjing, east China: increased partitioning to the particle phase
Chao Qin
Yafeng Gou
Yuhang Wang
Yuhao Mao
Hong Liao
Qin'geng Wang
Mingjie Xie
Gas–particle partitioning of water-soluble organic compounds plays a significant role in influencing the formation, transport, and lifetime of organic aerosols in the atmosphere, but is poorly characterized. In this work, gas- and particle-phase concentrations of isoprene oxidation products (C5-alkene triols and 2-methylterols), levoglucosan, and sugar polyols were measured simultaneously at a suburban site of the western Yangtze River Delta in east China. All target polyols were primarily distributed into the particle phase (85.9 %–99.8 %). Given the uncertainties in measurements and vapor pressure predictions, a dependence of particle-phase fractions on vapor pressures cannot be determined. To explore the impact of aerosol liquid water on gas–particle partitioning of polyol tracers, three partitioning schemes (Cases 1–3) were proposed based on equilibriums of gas vs. organic and aqueous phases in aerosols. If particulate organic matter (OM) is presumed as the only absorbing phase (Case 1), the measurement-based absorptive partitioning coefficients () of isoprene oxidation products and levoglucosan were more than 10 times greater than predicted values (). The agreement between and was substantially improved when solubility in a separate aqueous phase was included, whenever water-soluble and water-insoluble OM partitioned into separate (Case 2) or single (Case 3) liquid phases, suggesting that the partitioning of polyol tracers into the aqueous phase in aerosols should not be ignored. The measurement-based effective Henry's law coefficients () of polyol tracers were orders of magnitude higher than their predicted values in pure water (). Due to the moderate correlations between and molality of sulfate ions, the gap between and of polyol tracers could not be fully parameterized by the equation defining “salting-in” effects and might be ascribed to mechanisms of reactive uptake, aqueous phase reaction, “like-dissolves-like” principle, etc. These study results also partly reveal the discrepancy between observation and modeling of organic aerosols.
- Article
(3285 KB) - Full-text XML
-
Supplement
(2271 KB) - BibTeX
- EndNote


The water-soluble organic carbon (WSOC) in ambient aerosols can account for 20 %–80 % of particulate organic matter (OM) based on carbon mass (Saxena and Hildemann, 1996; Kondo et al., 2007). Field studies on the hygroscopic growth and cloud condensation nucleus (CCN) activity of aerosol extracts indicated that WSOC contributed significantly to aerosol hygroscopicity and modified the hydration behavior of inorganic species (e.g., sulfate, nitrate, and ammonium; Hallar et al., 2013; Taylor et al., 2017). Thus, WSOC plays an important role in changing radiative and cloud-nucleating properties of atmospheric particles. Particulate WSOC is a complex mixture of polar organic compounds containing oxygenated functional groups (e.g., hydroxyl, carboxyl, and carbonyl groups), among which a list of organic compounds with multiple hydroxyl (polyols) groups have been identified using gas chromatography–mass spectrometry (GC–MS) and linked with specific emission sources. For example, C5-alkene triols and 2-methyltetrols are isoprene oxidation products (Claeys et al., 2004; Wang et al., 2005; Surratt et al., 2006), levoglucosan is a typical pyrolysis product of cellulose (Simoneit et al., 1999), and primary saccharides (e.g., fructose and glucose) and saccharide polyols (e.g., arabitol and mannitol) are commonly associated with soil microbiota and fungal spores, respectively (Simoneit et al., 2004; Bauer et al., 2008).
To quantify the sources contributing to WSOC, concentrations of individual organic tracers are often used as inputs for receptor-based modeling (Zhang et al., 2009; Hu et al., 2010). Due to the influences of gas–particle partitioning on source apportionment, Xie et al. (2013, 2014c) suggested the involvement of gas-phase concentrations of organic makers through theoretical prediction or field measurements. The equilibrium absorptive partitioning theory outlined by Pankow (1994a, b) and laboratory measurements of secondary organic aerosol (SOA) yields (Odum et al., 1996) have been widely applied to predict SOA formation in traditional modeling studies (Heald et al., 2005; Volkamer et al., 2006; Hodzic et al., 2010). In addition to absorptive partitioning to particulate OM after the formation of oxygenated organic compounds in gas phase, other formation pathways (e.g., reactive uptake) have been identified and are responsible for the large discrepancy between modeled and observed SOA loadings (Jang et al., 2002; Kroll et al., 2005; Perraud et al., 2012). Unlike non-polar species (e.g., n-alkanes, polycyclic aromatic hydrocarbons) and alkanoic acids that are well simulated (Simcik et al., 1998; Xie et al., 2014a; Yatavelli et al., 2014; Isaacman-VanWertz et al., 2016), particle-phase concentrations of carbonyls were underestimated by several orders of magnitude when particulate OM is presumed as the only absorbing phase assuming ideal mixing conditions (Healy et al., 2008; Kampf et al., 2013; Shen et al., 2018). Zhao et al. (2013) observed a positive dependence of particle-phase pinonaldehyde on relative humidity (RH, %) and inferred that aerosol water played a role in the formation of pinonaldehyde in the atmosphere. However, very few studies have been performed on the measurement of gaseous polyols (Xie et al., 2014b; Isaacman-VanWertz et al., 2016), and their gas–particle partitioning was poorly understood.
Henry's law can describe the uptake of a compound into a liquid, highly dilute solution (e.g., cloud droplets) in the atmosphere (Ip et al., 2009; Compernolle and Müller, 2014a). Aerosol water is also a major component of atmospheric particles and accounts for 40 % by volume at 50 % RH in Europe (Tsyro, 2005). But the bulk aerosol solution is highly concentrated with inorganic ions and WSOC. An effective Henry's law coefficient (KH,e, ) can be used to account for the measured partitioning between the gas phase and aerosol liquid water (Volkamer et al., 2009). Both laboratory and field studies observed enhanced KH,e of carbonyl compounds with inorganic salt concentrations (in mol kg−1 aerosol liquid water content, ALWC; Kampf et al., 2013; Waxman et al., 2015; Shen et al., 2018). This “salting-in” effect (Setschenow, 1889) is not mechanistically understood and might be linked with the hydrophilic interactions (e.g., hydrogen bonding) between polar organic compounds and inorganic ions leading to an increase in entropy or decrease in Gibbs free energy (Almeida et al., 1983; Waxman et al., 2015). Polyol tracers are highly water-soluble, and their gas–particle partitioning is very likely driven by the aqueous phase containing substantial ionic species in ambient aerosols. In the southeastern US, the particle-phase fraction (F%) of WSOC is highly dependent on RH and ALWC (Hennigan et al., 2009).
In the present study, polyols related to specific emission sources in gaseous and particle phases were measured concurrently in northern Nanjing, China. The sampling and chemical analysis were performed in a similar manner as Xie et al. (2014b), while an additional step was added prior to GC–MS analysis to clean the extracts of gaseous samples. To explore the roles of aerosol liquid water on gas–particle partitioning of polyol tracers, three modes (Cases 1–3) were proposed based on equilibriums between gas and liquid aerosol phases, and the measurement-based and predicted partitioning coefficients were compared across individual cases. This work tends to explain the gas–particle partitioning of polyols at a suburban site in eastern China, where the estimated average mass concentration of aerosol liquid water is close to 20 µg m−3 (Yang et al., 2021).
2.1 Field sampling
Details of the sampling information were provided in Yang et al. (2021). Briefly, ambient air was sampled on the rooftop of a seven-story library building located in Nanjing University of Information Science and Technology (NUIST 32.21∘ N, 118.71∘ E), a suburban site in the western Yangtze River Delta of east China. A medium-volume sampler (PM-PUF-300, Mingye Environmental, Guangzhou, China) equipped with a 2.5 µm cut impactor was configured to collect particulate matter with aerodynamic diameter less than 2.5 µm (PM2.5) and gaseous organic compounds at a flow rate of 300 L min−1. After the impactor, the sampled air flowed through a filter pack containing two stacked pre-baked (550 ∘C, 4 h) quartz filters (20.3 cm × 12.6 cm, Munktell Filter AB, Sweden) and a polyurethane foam (PUF, 65 mm diameter × 37.5 mm length) cartridge in series. The top quartz filter (Qf) in the filter pack was loaded with PM2.5, gaseous organic compounds adsorbed on the backup quartz filter (Qb) were determined to evaluate sampling artifacts, and the PUF cartridge was used for the sampling of gaseous polyols. Filter and PUF samples were collected every sixth day during daytime (08:00–19:00 GMT+8) and nighttime (19:00–07:00 next day, GMT+8), respectively, from 28 September 2018 to 28 September 2019. Collection efficiency of gaseous polyols was examined by performing breakthrough experiments using two PUF plugs during nine sampling intervals. Prior to sampling, PUF adsorbents were cleaned and dried in the same way as Xie et al. (2014b). Field blank filter and PUF materials were collected every 10th sample for contamination adjustment. Filter and PUF samples were sealed in prebaked aluminum foil and glass jars, respectively, at −20 ∘C until analysis.
2.2 Chemical analysis
2.2.1 Bulk speciation
The accumulated PM2.5 mass and bulk components including water soluble ions (, , , Ca2+, Mg2+, and K+), organic (OC) and elemental carbon (EC), and WSOC were measured for each filter sample. Their final concentrations were determined by subtracting measurement results of Qb from those of Qf. Concentrations of aerosol liquid water were predicted by the ISORROPIA II model using ambient temperature, RH, and concentration data of , , and under the metastable state. The estimated water content contributed by hygroscopic WSOC was relatively small (< 1 µg m−3) and not accounted for in this work (Sect. S1 in the Supplement). Table S1 in the Supplement lists averages and ranges of ambient temperature, RH, measured PM2.5 components, and predicted aerosol liquid water from Yang et al. (2021).
2.2.2 Polyol analysis
Details of the analysis method for gaseous and particulate polyols are provided in the Supplement (Sect. S2). Briefly, one-eighth of each filter sample was pre-spiked with deuterated internal standard and extracted ultrasonically twice for 15 min in 10–15 mL of methanol and methylene chloride mixture (1:1, ). After filtration, rotary evaporation, N2 blown down to dryness, and reaction with 50 µL of N, O-bis(trimethylsilyl)trifluoroacetamide (BSTFA) containing 1 % trimethylchlorosilane (TMCS) and 10 µL of pyridine, the derivatives of polyols were diluted to 400 µL using pure hexane for GC–MS analysis. Pre-spiked PUF samples were Soxhlet extracted using a mixture of 225 mL of methylene chloride and 25 mL of methanol, followed by the same procedures of filter sample pretreatment. Prior to GC–MS analysis, 50 µL of pure water was added to precipitate PUF impurities from the final extract. As shown in Fig. S1e in the Supplement, all PUF residues are kept in aqueous phase at the bottom of the vial, while the derivatives of polyol tracers are supposed to be retained in the top clear hexane solution. An aliquot of 2 µL of the supernatant was injected for GC–MS analysis under splitless mode, and an internal standard method with a six-point calibration curve (0.05–5 ng µL−1) was performed to quantify polyol concentrations. In this work, isoprene SOA products, including three C5-alkene triols (cis-2-methyl-1,3,4-trihydroxy-1-butene, 3-methyl-2,3,4-trihydroxy-1-butene, and trans-2-methyl-1,3,4-trihydroxy-1-butene; abbreviated as C5-alkene 1, 2, and 3) and two 2-methyltetrols (2-methylthreitol and 2-methylerythritol) were quantified using meso-erythritol; other polyols were determined using authentic standards.
Analytical recoveries of target polyols were obtained by adding known amounts of standards to blank sampling materials (quartz filter and PUF), followed by extraction and instrumental analysis identically as ambient samples. Method detection limits (MDLs) of individual species were estimated as 3 times the standard deviation of their concentrations determined from six injections of the lowest calibration standard. Table S2 lists recovery and MDL values of authentic standard compounds. Concentrations of polyols in field blank samples were measured and subtracted from air samples if necessary. To obtain appropriate gas–particle distribution of polyol tracers, their field-blank-corrected concentrations in filter and PUF samples were adjusted by recoveries. Final concentrations of individual polyols in Qf, Qb, and PUF samples are summarized in Table S3.
2.3 Data analysis
2.3.1 Gas–particle separation and breakthrough calculation
Polyol tracers detected in Qb samples are contributed by both gaseous adsorption (“positive artifact”) and particle-phase evaporation from Qf samples (“negative artifact”), but their relative contributions are unknown. Xie et al. (2014b) adjusted particle- and gas-phase concentrations of levoglucosan and 2-methyltetrol based on Qb measurements in two different ways. One assumed that Qb values were completely attributed to gaseous adsorption; the other presumed equal contributions from gaseous adsorption and Qf evaporation. However, negligible difference in gas–particle distribution was observed due to the small Qb values. In Table S3, concentrations of polyol tracers on Qb are far below those on Qf, and it would be safe to presume equal positive and negative artifacts. In this study, particle-phase concentrations of polyols were represented by Qf values, and the gas phase was calculated as the sum of Qb and PUF measurements.
The sampling efficiency of target polyols was evaluated by collecting and analyzing tandemly installed PUF plugs during nine sampling intervals. The breakthrough of each polyol was calculated as
where B is the breakthrough of gaseous sampling, and [PUF] represents the concentration of a specific compound in the front or backup PUF sample. A value of 33 % was typically used to indicate excessive breakthrough (Peters et al., 2000; Ahrens et al., 2011).
2.3.2 Calculations of partitioning coefficients
Here, we defined three partitioning cases to explore the influence of dissolution in aerosol liquid water on gas–particle partitioning of polyol tracers in the atmosphere. Case 1 presumes instantaneous equilibrium between the gas phase and particulate OM based on the equilibrium absorptive partitioning theory. In this case, particulate OM is assumed to be the only absorbing phase and behaves as an ideal solution. Then the absorptive gas–particle partitioning coefficients (Kp,OM, m3 µg−1) were calculated from measurements () and predicted theoretically () as follows (Pankow, 1994a, b; Liang and Pankow, 1996; Liang et al., 1997; Mader and Pankow, 2002):
where MOM denotes the mass concentration of absorptive organic matter (OM = OC × 1.6; Turpin and Lim, 2001); F (ng m−3) and A (ng m−3) are particulate and gaseous concentrations of individual polyols, respectively. In Eq. (3), R () and T (K) are the ideal gas constant and ambient temperature; , average molecular weight of absorptive OM, is set at 200 g mol−1 for all samples (Barsanti and Pankow, 2004; Williams et al., 2010); ζOM denotes the mole fraction scale activity coefficient and is presumed to be unity for all species in each sample; (atm) is the vapor pressure of each pure compound and is predicted with several estimation tools and adjusted for each sampling interval based on the average temperature (Sect. S3 and Table S4).
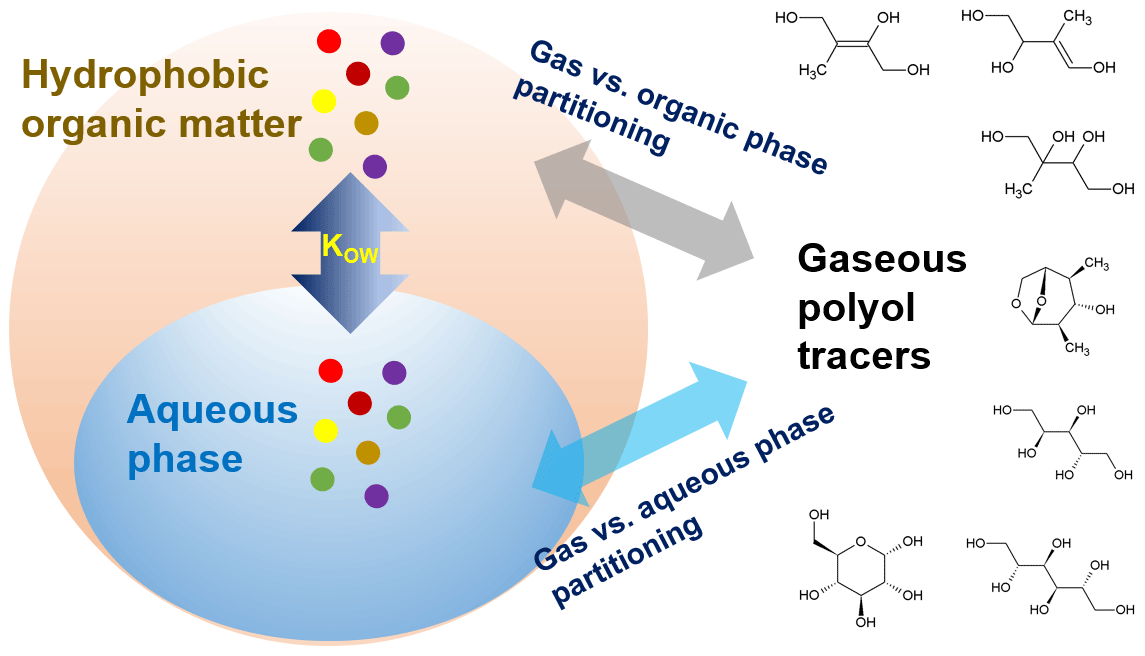
Due to the influence of mixing state and water content in aerosols, several studies modeled the gas–particle partitioning of oxygenated organic compounds by defining a liquid–liquid phase separation (LLPS) in the aerosol (Zuend and Seinfeld, 2012; Pye et al., 2018). The organic–inorganic interactions and changes of activity coefficients in aqueous mixtures were fully considered as well. In this study, we proposed a simplified LLPS partitioning mechanism (Case 2) in Fig. 1. First, aerosol water and water-insoluble OM (WIOM = OM − WSOC ⋅ 1.6) exist in two separate liquid phases, and WSOC and inorganic ions are totally dissolved in the aqueous phase. The distribution of polyol tracers between aqueous (FW, ng m−3) and WIOM (FWIOM, ng m−3) phases is simply depicted by their octanol–water partition coefficients (KOW):
where VWIOM and Vw are volumes (m3) of WIOM and water in aerosols per cubic meter air; cWIOM and cw are solution concentrations (ng m−3) of polyol concentrations in organic and aqueous phases; log KOW values of target polyols were estimated using the Estimation Programs Interface (EPI) Suite developed by the US Environmental Protection Agency and Syracuse Research Corporation (Table S4; US EPA, 2012). The density of organic matter and water (ρw) in aerosols is set at 1.4 and 1.0 g cm−3, respectively (Isaacman-VanWertz et al., 2016; Taylor et al., 2017). Second, gas-phase polyol tracers are in equilibrium with hydrophobic OM and the aqueous phase, respectively:
where () is the measurement-based effective Henry's law coefficient; MWIOM represents the mass concentration (µg m−3) of WIOM; Mi (g mol−1) is the molecular weight of a specific compound; cALW (µg m−3) is the mass concentration of aerosol liquid water predicted using the ISORROPIA II model. Case 3 is generally the same as Case 2, and the only difference is that water-soluble OM (WSOM) and WIOM exist in a single organic phase. Here total particulate OM was used instead of WIOM to assess the distribution of polyol tracers between aqueous and organic phases and calculate partitioning coefficients of gas vs. particulate organic () and aqueous () phases. Note that the polarity of particulate OM phase in Case 3 was expected to increase; then using KOW to calculate the distribution of polyols between organic and aqueous phases might lead to underestimated and overestimated . For comparison purposes, the Henry law coefficient in pure water at 25 ∘C () was estimated using EPI and SPARC (Hilal et al., 2008; http://archemcalc.com/sparc-web/calc, last access: 14 June 2021), respectively (Table S4), and was adjusted for each sampling interval due to the changes in ambient temperature using the van't Hoff equation (Sect. S4).
2.3.3 Uncertainty estimation
To obtain the uncertainty associated with the calculation of F% and partitioning coefficients ( and ), measurement uncertainties of polyol tracers in filter and PUF samples were estimated from their recoveries and breakthrough for gaseous sampling. The root sum of squares (RSS) method was applied to propagate uncertainties of gas- and particle-phase concentrations for F%, , and calculations. Details of the uncertainty estimation and propagation methods were provided in Sect. S5, and the average relative uncertainties were summarized in Table S5.
3.1 Method evaluation
In our previous study, PUF/XAD-4 resin/PUF and PUF/XAD-7 resin/PUF adsorbent sandwiches were tested for sampling gaseous 2-methyltetrols and levoglucosan (Xie et al., 2014b). The results of breakthrough experiments suggested that both the sandwiched composites had high sampling efficiency (close to 100 %). Moreover, individual parts of the two types of composites (top PUF, middle XAD-4/XAD-7 resin, and backup PUF) were analyzed for seven samples, and target compounds were only detected in the top PUF. It is therefore suitable to collect gaseous 2-methylterols and levoglucosan using PUF materials only.
Although PUF materials were pre-cleaned prior to sampling, a few short-chain polyurethanes or impurities could be dissolved during Soxhlet extraction of target compounds using the mixture of methanol and methylene chloride. These substances precipitated when sample extracts were concentrated (Fig. S1a and b) and re-dissolved in BSTFA:TMCS/pyridine and hexane after the derivatization step (Fig. S1c and d). In Xie et al. (2014b), an aliquot of 2 µL of the sample extract as shown in Fig. S1d was injected for GC–MS analysis. Since the dissolved PUF materials did not vaporize at ∼ 300 ∘C, the GC inlet liner had to be changed for cleaning every few samples. In this work, 50 µL of pure water was added to separate PUF materials from polyol derivatives in hexane solution. As shown in Fig. S1e, all PUF residues were retained in the aqueous solution after phase separation. This pretreatment step was added for the analysis of gaseous samples to save time for changing and cleaning GC inlet liners. However, the revised method did not improve the recoveries of meso-erythritol and levoglucosan in PUF samples (Table S2) compared to those in Xie et al. (2014b). This is because the dissolved PUF materials should have an impact on the derivatization efficiency of polyol species, and future work is warranted to remove dissolved PUF materials in sample extracts before the derivatization step.
Measurement results of breakthrough samples and the resulting B values were shown in Fig. S2. C5-alkene triols and 2-methyltetrols were mainly observed in summertime, and levoglucosan was only detected in three pairs of breakthrough samples. Their average B values (< 33 %) indicated no excessive breakthrough (Fig. S2a–c) but were higher than those reported by Xie et al. (2014b). This might be ascribed to the greater face velocity (1.5 cm s−1) for sampling gaseous polyols than that (0.61 cm s−1) in our previous study. Due to the limit in sample number for breakthrough tests and low detection rates, the dependence of breakthrough on ambient temperature or OM loadings cannot be evaluated. The breakthrough of an ideal sampling method is expected to be extremely low (e.g., < 10 %) and have no dependence on ambient temperature, OM loadings, etc. Unlike fructose which had low breakthrough (Fig. S2d), glucose and mannitol had comparable concentrations between front and backup PUF samples for several breakthrough experiments (Fig. S2e and f), indicating that PUF materials are not suitable for sampling gaseous glucose and mannitol. Mannose and arabitol were not detected or had values below detection limits for breakthrough samples, and their breakthrough was not provided. In the current work, concentrations of polyol tracers in filter and PUF samples were all reported, but the data of mannose, glucose, arabitol, and mannitol in PUF samples should be treated with caution due to high breakthrough or the lack of valid breakthrough results.
3.2 General description of measurement results
Total ambient concentrations (Qf + Qb + PUF) of individual polyols are depicted using boxplots in Fig. 2. Figure S3 presents temporal variations in total and Qf concentrations of individual polyols with daytime and nighttime measurements distinguished. In general, polyol tracers were predominantly observed on Qf with averages 1–3 orders of magnitude higher than those on Qb and PUF (Table S3). Levoglucosan had the highest average total concentration (66.1 ± 71.1 ng m−3), followed by fructose (15.0 ± 62.9 ng m−3) and mannose (14.3 ± 31.3 ng m−3). C5-alkene triols and 2-methyltetrols are formed from isoprene epoxydiols (IEPOX) under low-NOx conditions (Surratt et al., 2010). All five species on Qb were more frequently detected and had average concentrations 2–20 times higher than those in PUF samples. While in Xie et al. (2014b), the sum of 2-methyltetrols in Qb and adsorbent samples was up to 2.7 times higher than that on Qf in summer Denver, isoprene products are not similarly distributed between gas and aerosol phases across different regions. Moreover, isoprene-derived polyols exhibited prominent elevations in summer (Fig. S3a–e), and their daytime concentrations (2.02 ± 3.73–10.5 ± 29.3 ng m−3) were only slightly higher than those during nighttime (1.63 ± 4.40–9.65 ± 32.7 ng m−3). Previous field studies observed strong diurnal variations in isoprene SOA tracers with peak concentrations from afternoon till midnight (Fu and Kawamura, 2011; Isaacman-VanWertz et al., 2016). Although no IEPOX will be generated from the oxidation of isoprene by ⋅OH and HO2⋅ after sunset, the formations of C5-alkene triols and 2-methyltetrols might continue until pre-existing IEPOX is exhausted. In this work, neither the daytime (08:00–19:00 GMT+8) nor nighttime (07:00–07:00 next day, GMT+8) sample covered the whole period when isoprene SOA tracers had peak concentrations, and the strong diurnal variations in C5-alkene triols and 2-methyltetrols were not captured.
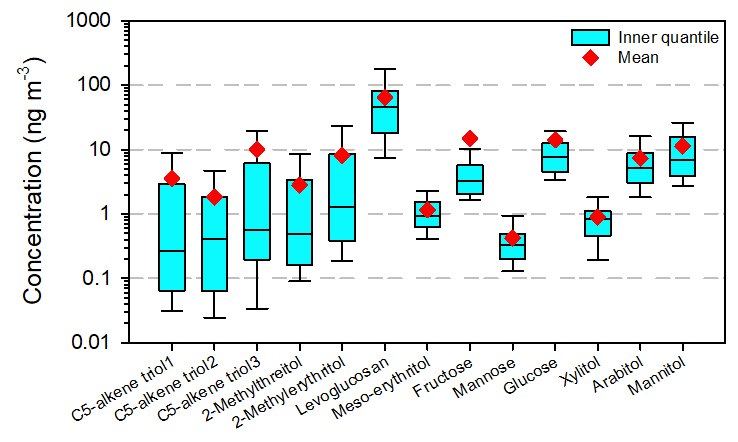
Figure 2Total concentrations of individual polyols (Qf + Qb + PUF) in the ambient atmosphere of northern Nanjing. The boxes depict the median (dark line), inner quantile range (box), 10th and 90th percentiles (whiskers), and mean (red diamond).
Levoglucosan was more frequently detected but far less concentrated in PUF than in Qb samples. Its total concentrations were comparable to those in urban Denver (average 65.3 ± 96.8 ng m−3, range 2.48–478 ng m−3), where an average of ∼ 20 % partitioned into the gas phase (Xie et al., 2014b). Due to the enhanced biomass burning activities in cold periods for domestic heating at night, levoglucosan showed a clear seasonal pattern (winter maxima and summer minima) and significant (p = 0.03) higher concentrations during nighttime (Fig. S3f). Sugars and sugar alcohols are commonly linked with soil/dust resuspension and associated microbial activities (Simoneit et al., 2004). They were frequently detected in Qb samples with comparable averages and ranges as those in PUF samples (Table S3). Total concentrations of fructose and glucose were strongly (r = 0.98) correlated peaking in middle spring (April 2019, Fig. S3h and j), when Ca2+ on Qf also reached its maximum of the year (Yang et al., 2021), indicating an influence from soil/dust resuspension. Arabitol and mannitol had an identical seasonal pattern (r = 0.89) with elevated total concentrations from May to October (Fig. S3i and m), which might be attributed to high levels of vegetation during growing seasons and autumn decomposition (Burshtein et al., 2011). Multiple peaks of mannose concentrations were observed from spring to autumn, suggesting a variety of contributing sources (e.g., microbial activity, vegetation). Xylitol is likely derived from biomass burning in northern Nanjing due to its strong correlation (r = 0.89) with levoglucosan.
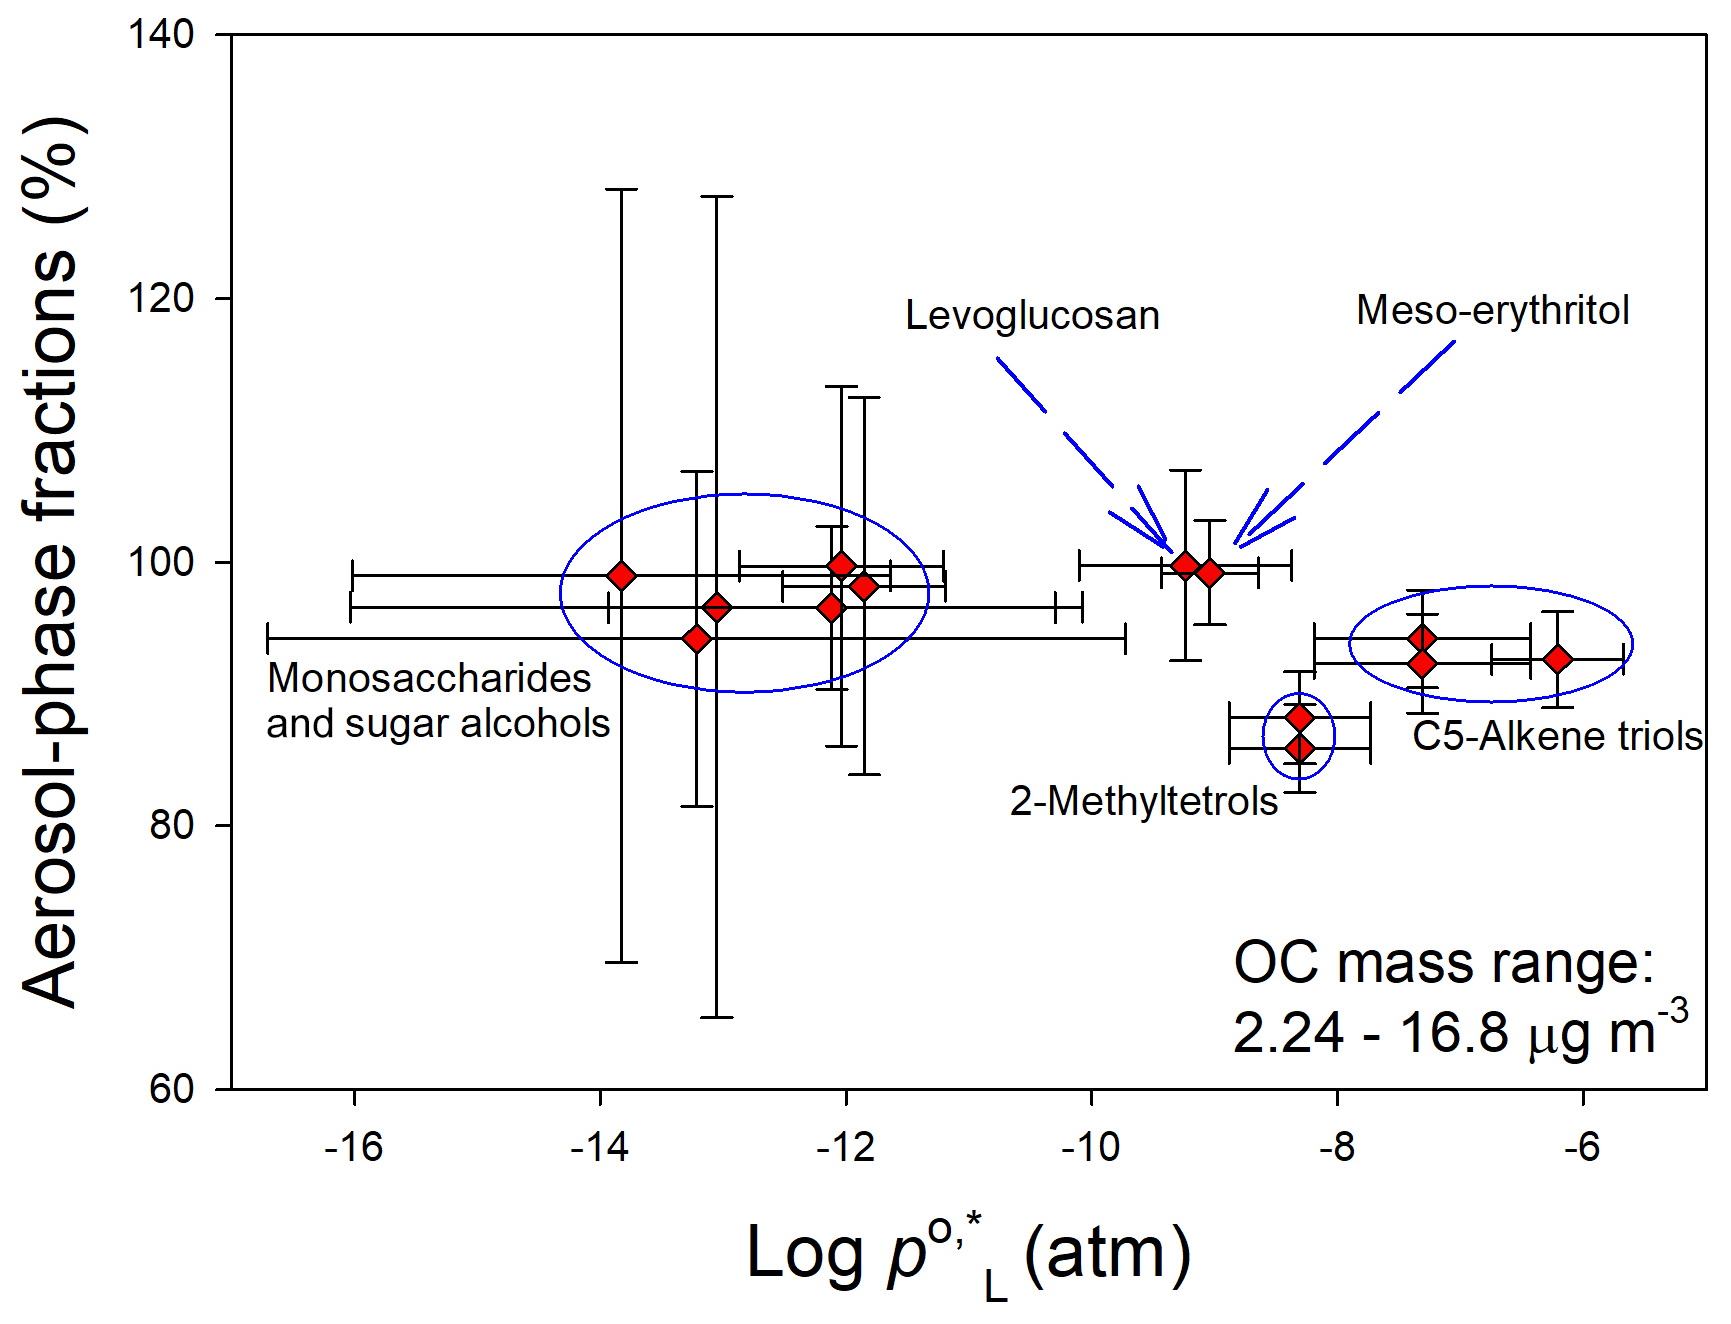
Figure 3Average particle-phase fractions and of individual polyol tracers. Whiskers represent uncertainties of F% and 1 standard deviation of derived from different estimation tools.
Table 1Comparisons of measurement-based log Kp,OM (m3 µg−1) at three proposed cases and predicted values.
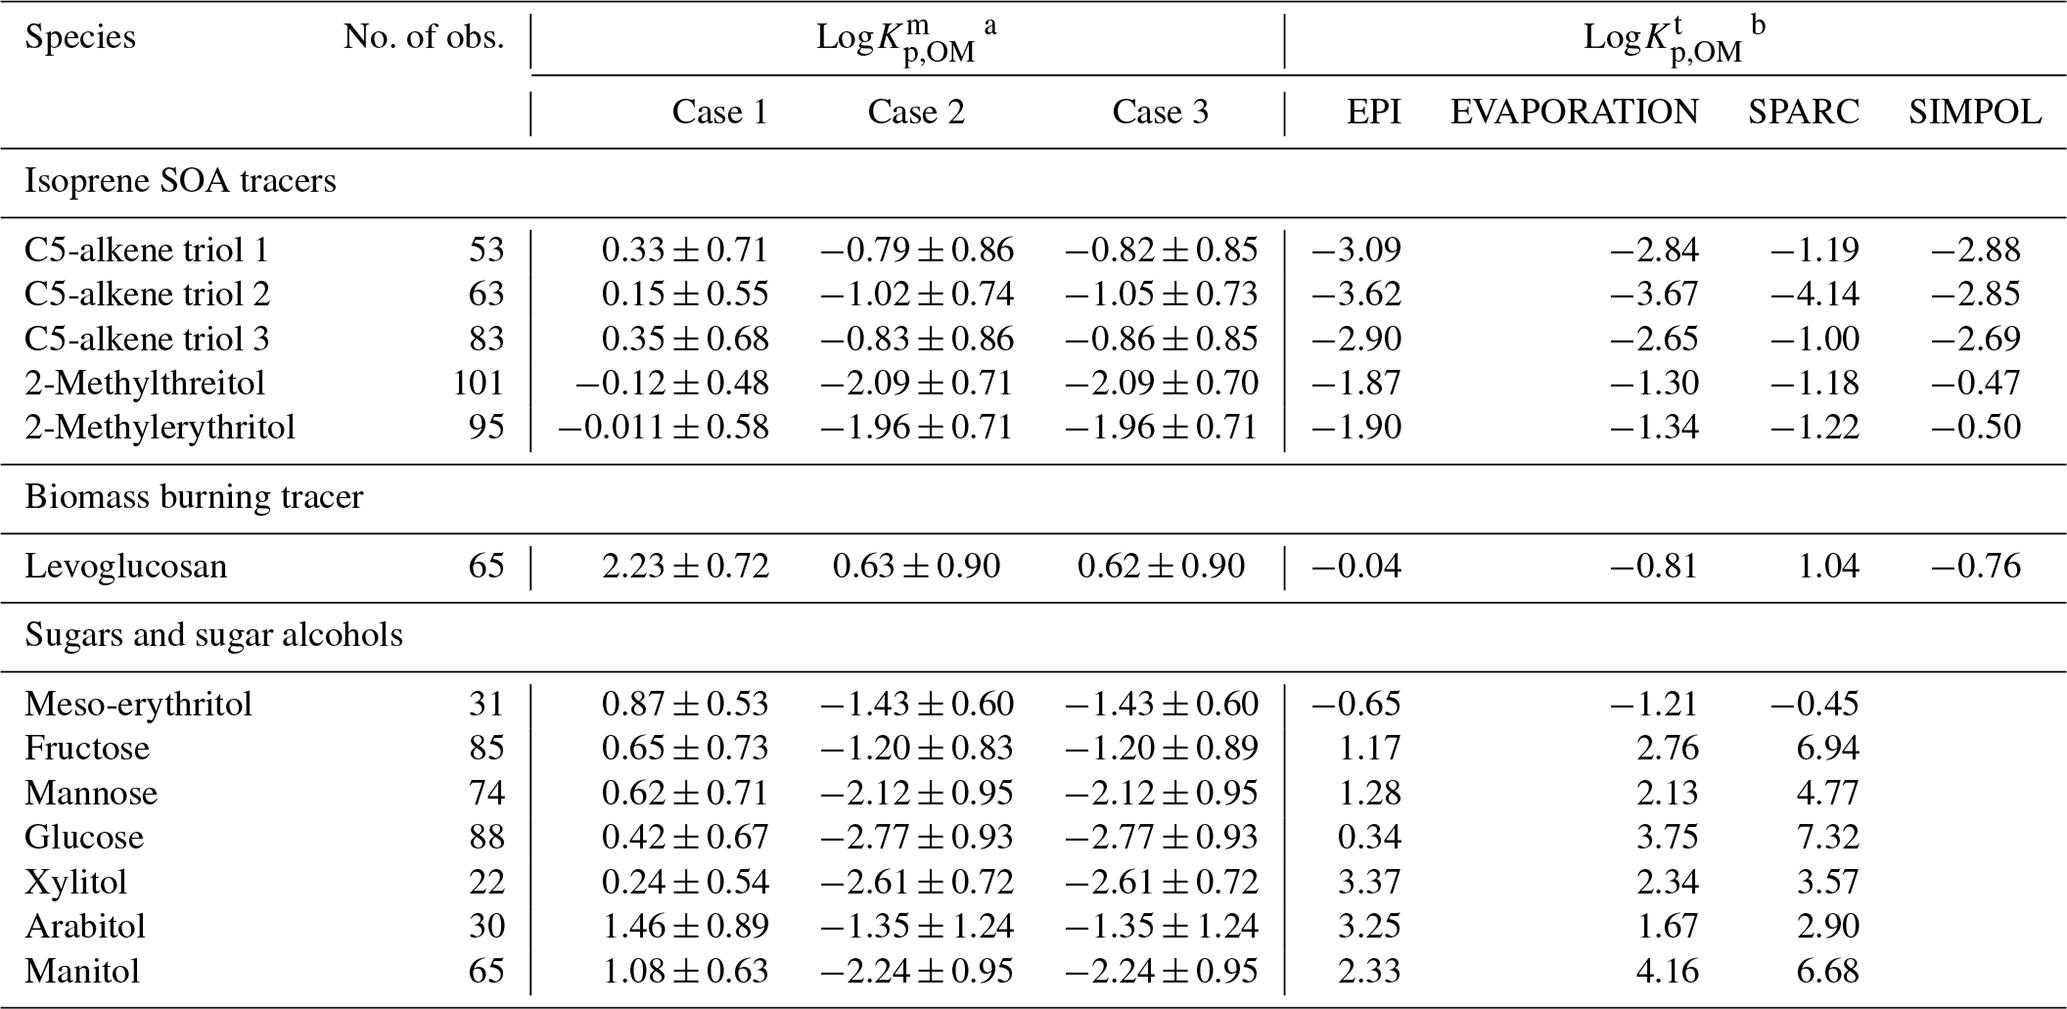
a Logarithms with base 10, average ± standard deviation. b Temperature range: −4 ∼ 36 ∘C.
3.3 Gas- and particle-phase distributions
As mentioned in Sect. 2.3, concentrations of particulate polyols were obtained directly from Qf measurements, and the gas phase was calculated as the sum of Qb and PUF values. Figure S4 shows the time series of gas-phase concentrations and particle-phase fractions (F%) of individual polyol tracers. The average F% values of measured species are plotted against the logarithms of their liquid-state vapor pressures at 25 ∘C () in Fig. 3. Gas-phase C5-alkene triols and 2-methyltetrols had maximum concentrations in summer and significant (p < 0.05) day–night variations (Fig. S4), while other polyols had extremely low concentrations in the gas phase, with F% (average ± standard deviation) ranging from 94.2 ± 8.02 %–99.8 ± 1.21 %. The average F% values of 2-methyltetrols (87.5 ± 10.6 %) and levoglucosan (99.8 ± 1.21 %) were greater than those in urban Denver (50 %–80 %; Xie et al., 2014b), where the average sampling temperature (12.5 ± 10.1 ∘C) was much lower. Thus, the changes in vapor pressures with the ambient temperature and/or particulate OM loadings might not be the main factors driving gas–particle partitioning of polyol tracers in Nanjing. In Fig. 3, the average F% uncertainties (6.16 %–31.2 %) of monosaccharides (e.g., fructose) and sugar alcohols (e.g., mannitol) were larger than those of isoprene SOA tracers and levoglucosan (3.33 %–7.24 %) due to their low and variable recoveries (Table S2) and excessive breakthrough (Fig. S2). However, the estimated uncertainties of F% for less volatile polyols ( ≲ 10−10 atm) were not physically meaningful, as more than 95 % of these compounds existed in the particle phase. Considering the uncertainties in F% and and high average F% (> 85 %) of target polyol tracers, a dependence of F% on the vapor pressure could not be determined, and the seasonality and day–night difference (p > 0.05) of F% were obscured.
3.4 Partitioning coefficients of gas vs. organic phases
To understand whether particulate OM is the only absorbing phase in aerosols for polyol tracers in Nanjing, the absorptive partitioning coefficients of gas vs. organic phases were calculated based on measurement results () for predefined Cases 1–3 and predicted theoretically () using Eq. (3) and vapor pressures listed in Table S4. In Table 1, ranges of isoprene SOA tracers, levoglucosan, and meso-erythritol are within 2 orders of magnitude, while those of monosaccharides and mannitol are larger (> 103). When particulate OM was assumed as the only absorbing phase (Case 1), the average of isoprene SOA tracers, levoglucosan, and meso-erythritol was more than 10 times greater than most of their (Table 1), and this difference was not likely susceptible to measurement uncertainties. As shown in Table S5, the average relative uncertainties of measurement-based partitioning coefficients are all < 50 %, leading to an uncertainty of less than ± 0.30. A gap comparable to or even greater than (up to 105) between and has been observed for carbonyls in a number of laboratory and field studies (Healy et al., 2008; Zhao et al., 2013; Shen et al., 2018), which could be ascribed to reactive uptake (e.g., hydration, oligomerization, and esterification) of organic gases into the condensed phase (Galloway et al., 2009). Oligomers, sulfate, and nitrate esters of 2-methyltetrols can be formed in the aerosol phase (Surratt et al., 2010; Lin et al., 2014), and their decomposition and hydrolysis during filter analysis will lead to an overestimation of particle-phase concentrations (Lin et al., 2013; Cui et al., 2018). However, the occurrence of oligomers, sulfate, or nitrate esters of levoglucosan was not ever reported in ambient aerosols, although it can be readily oxidized by ⋅OH in the aqueous phase of atmospheric particles (Hennigan et al., 2010; Hoffmann et al., 2010).
Table 2Comparisons of measurement-based log KH,e () and predicted log KH,w of individual polyol tracers.
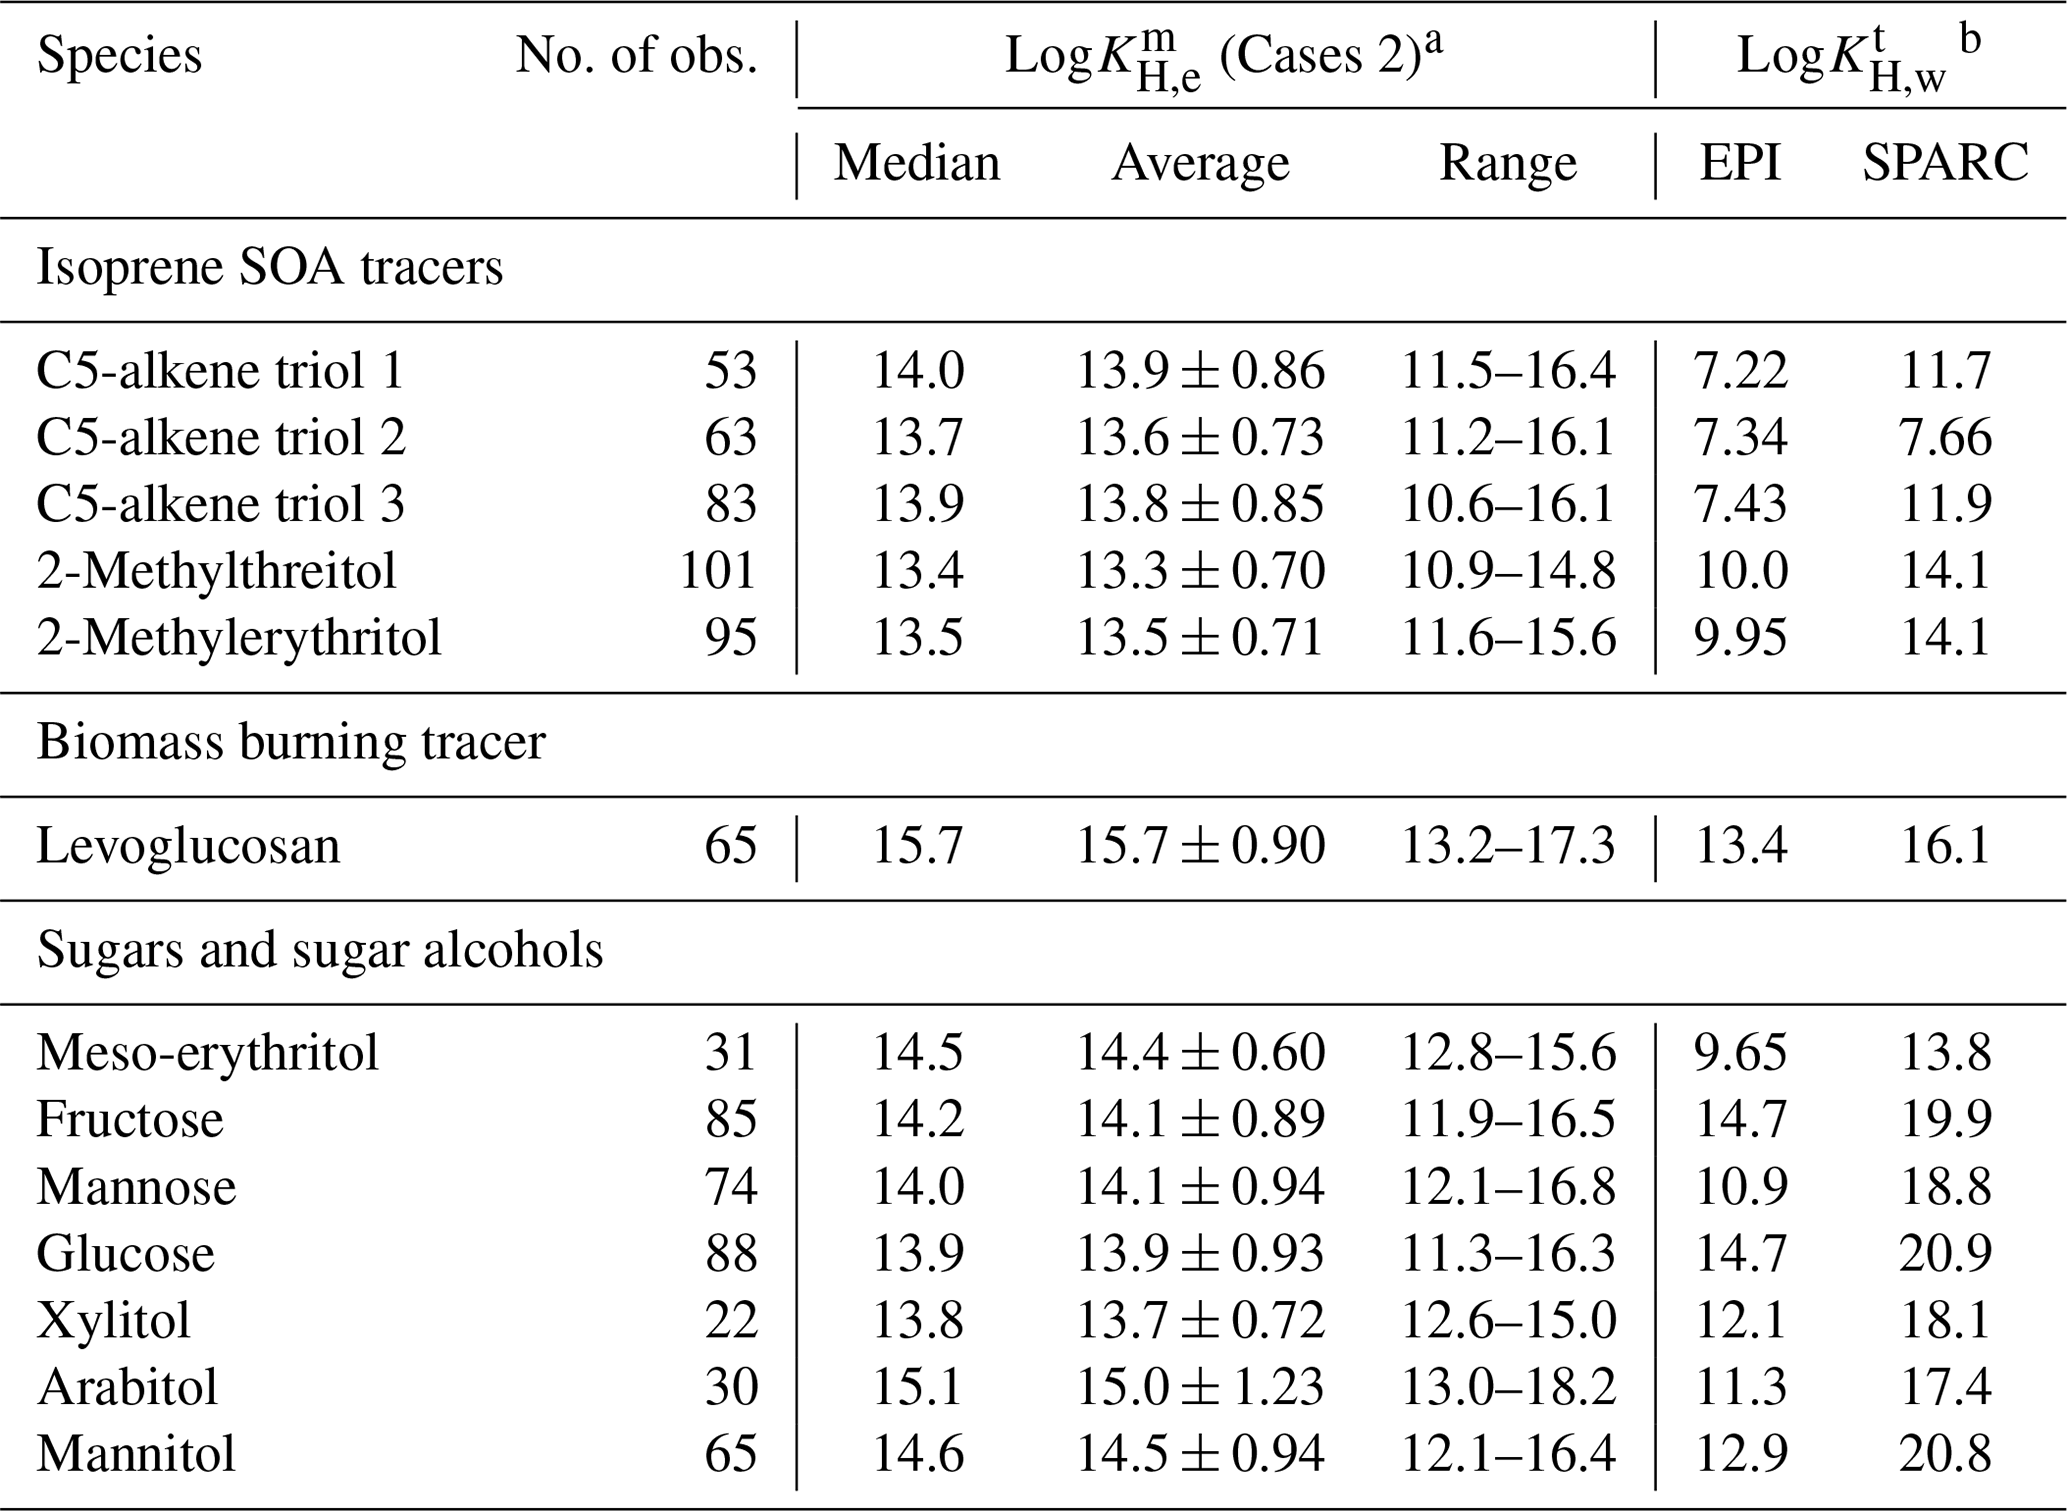
a Logarithms with base 10 ( values of Case 3 had ignorable difference and were not exhibited separately). b Temperature range: −4 ∼ 36 ∘C.
When solubility in aerosol liquid water was considered by assuming a LLPS in ambient aerosols, and whenever WSOM and WIOM partitioned into separate (Case 2) or single (Case 3) liquid phases, the average of the abovementioned compounds became much closer to or even lay within the range (e.g., levoglucosan) of (Table 1). These results indicated that the aerosol liquid water (21.3 ± 24.2 µg m−3; Table S1) is also an important absorbing phase of ambient polyol tracers in Nanjing. Similarly, the measured average F% of isoprene SOA tracers in southeastern US and central Amazonia was higher than predictions by assuming instantaneous equilibrium between the gas phase and particulate OM only, and the agreement was improved when parameterization of solubility was included for predictions (Isaacman-VanWertz et al., 2016). But neither of these two studies could reasonably predict the temporal variability of F% or . One possible explanation is that the activity coefficients of isoprene SOA tracers and levoglucosan deviate from unity (0.42–2.04; Pye et al., 2018) and vary with PM composition. Pye et al. (2018) re-analyzed the measurement data from Isaacman-VanWertz et al. (2016) using a thermodynamic equilibrium gas–particle partitioning model in two LLPS modes, which involved organic–inorganic interactions and estimations of activity coefficients as a function of liquid PM mixture composition. The resulting predictions captured both the average and diurnal variations in measured F% for polyol tracers, suggesting a necessity in obtaining time-resolved activity coefficients for the implementation of an absorptive equilibrium partitioning model.
Unlike isoprene SOA tracers and levoglucosan, the average values of monosaccharides (fructose, mannose, and glucose) and sugar alcohols (xylitol, arabitol, and mannitol) were orders of magnitude larger than their for Cases 2 and 3 (Table 1). This is probably caused by the overestimation of gas-phase concentrations of sugar polyols. The organic matter on Qb is mainly composed of volatile and semi-volatile organic compounds. If the concentrations of organic compounds on Qb were comparable to or higher than those on Qf, their Qf values should be dominated by a positive artifact. As the vapor pressure decreases, the evaporation loss from Qf samples becomes non-negligible. Note that the magnitude of negative artifacts is unknown and very difficult to assess, and the vapor pressures of monosaccharides and sugar alcohols are far below 10−10 atm (Table S4). Their concentrations in Qb and even PUF samples might contain more contributions from negative artifacts than isoprene SOA tracers and levoglucosan. As low-volatility sugar polyols had lower and less stable recoveries (Table S2) and greater breakthrough (Fig. S2e and f), caution is warranted in analyzing their values obtained in this study.
3.5 Partitioning coefficients of gas versus aqueous phases
The predicted Henry law coefficients in pure water (, ) from EPI and SPARC estimates differed by several orders of magnitude, but literature values of isoprene SOA and levoglucosan were closer to EPI estimates (Table S4). If SPARC values were used, the average of most polyol tracers would be lower than their average (Table 2), indicating that the aqueous phase of ambient aerosol is less hospitable to polyol tracers than pure water. This is in conflict with the fact that the interactions of organic compounds, water, and inorganic ions in aerosols will increase the partitioning of highly oxygenated compounds (O:C ≥ 0.6; e.g., isoprene SOA tracers and levoglucosan) into the particle phase (Pye et al., 2018). Several studies identified a close relationship between salt concentrations of aerosol water and enhanced uptake of very polar compounds (Almeida et al., 1983; Kroll et al., 2005; Ip et al., 2009; Kampf et al., 2013; Shen et al., 2018). Thus, values of EPI estimates were used for further data analysis.
In Table 2, the values of isoprene SOA tracers, levoglucosan, and meso-erythritols based on EPI estimations were 102 to 106 lower than their corresponding . Log values of Cases 2 and 3 had an ignorable difference and were not presented separately. Other polyol compounds exhibited less difference between and , which was very likely caused by the overestimation of their gas-phase concentrations. The average values of polyol tracers (1013–1015 ) in this study were several orders of magnitude larger than those of carbonyls derived from ambient measurements (1010–1012 ; Shen et al., 2018) and chamber simulations (∼ 1011 ; Kroll et al., 2005; Volkamer et al., 2006; Galloway et al., 2009). This is because low-molecular-weight carbonyls (e.g., glyoxal) are much more volatile ( > 10−2 atm) than our target polyols (Table S4). According to existing studies, the minimum concentrations of gas-phase glyoxal and methylglyoxal in Chinese cities (∼ 0.1 µg m−3) are magnitudes higher than the averages of polyol tracers in this work, while their particle-phase concentrations are of the same magnitude (Shen et al., 2018; Liu et al., 2020).
A number of previous studies observed enhanced KH,e of carbonyls with salt concentrations in aqueous solution (Ip et al., 2009; Kampf et al., 2013; Waxman et al., 2015; Shen et al., 2018) and described this “salting-in” effect using
where Ks (kg mol−1) is the salting constant, and csalt is the aqueous-phase concentration of salt in mol kg−1 ALWC. This equation is originally defined in Setschenow (1889) by plotting vs. the total salt concentration (mol L−1).
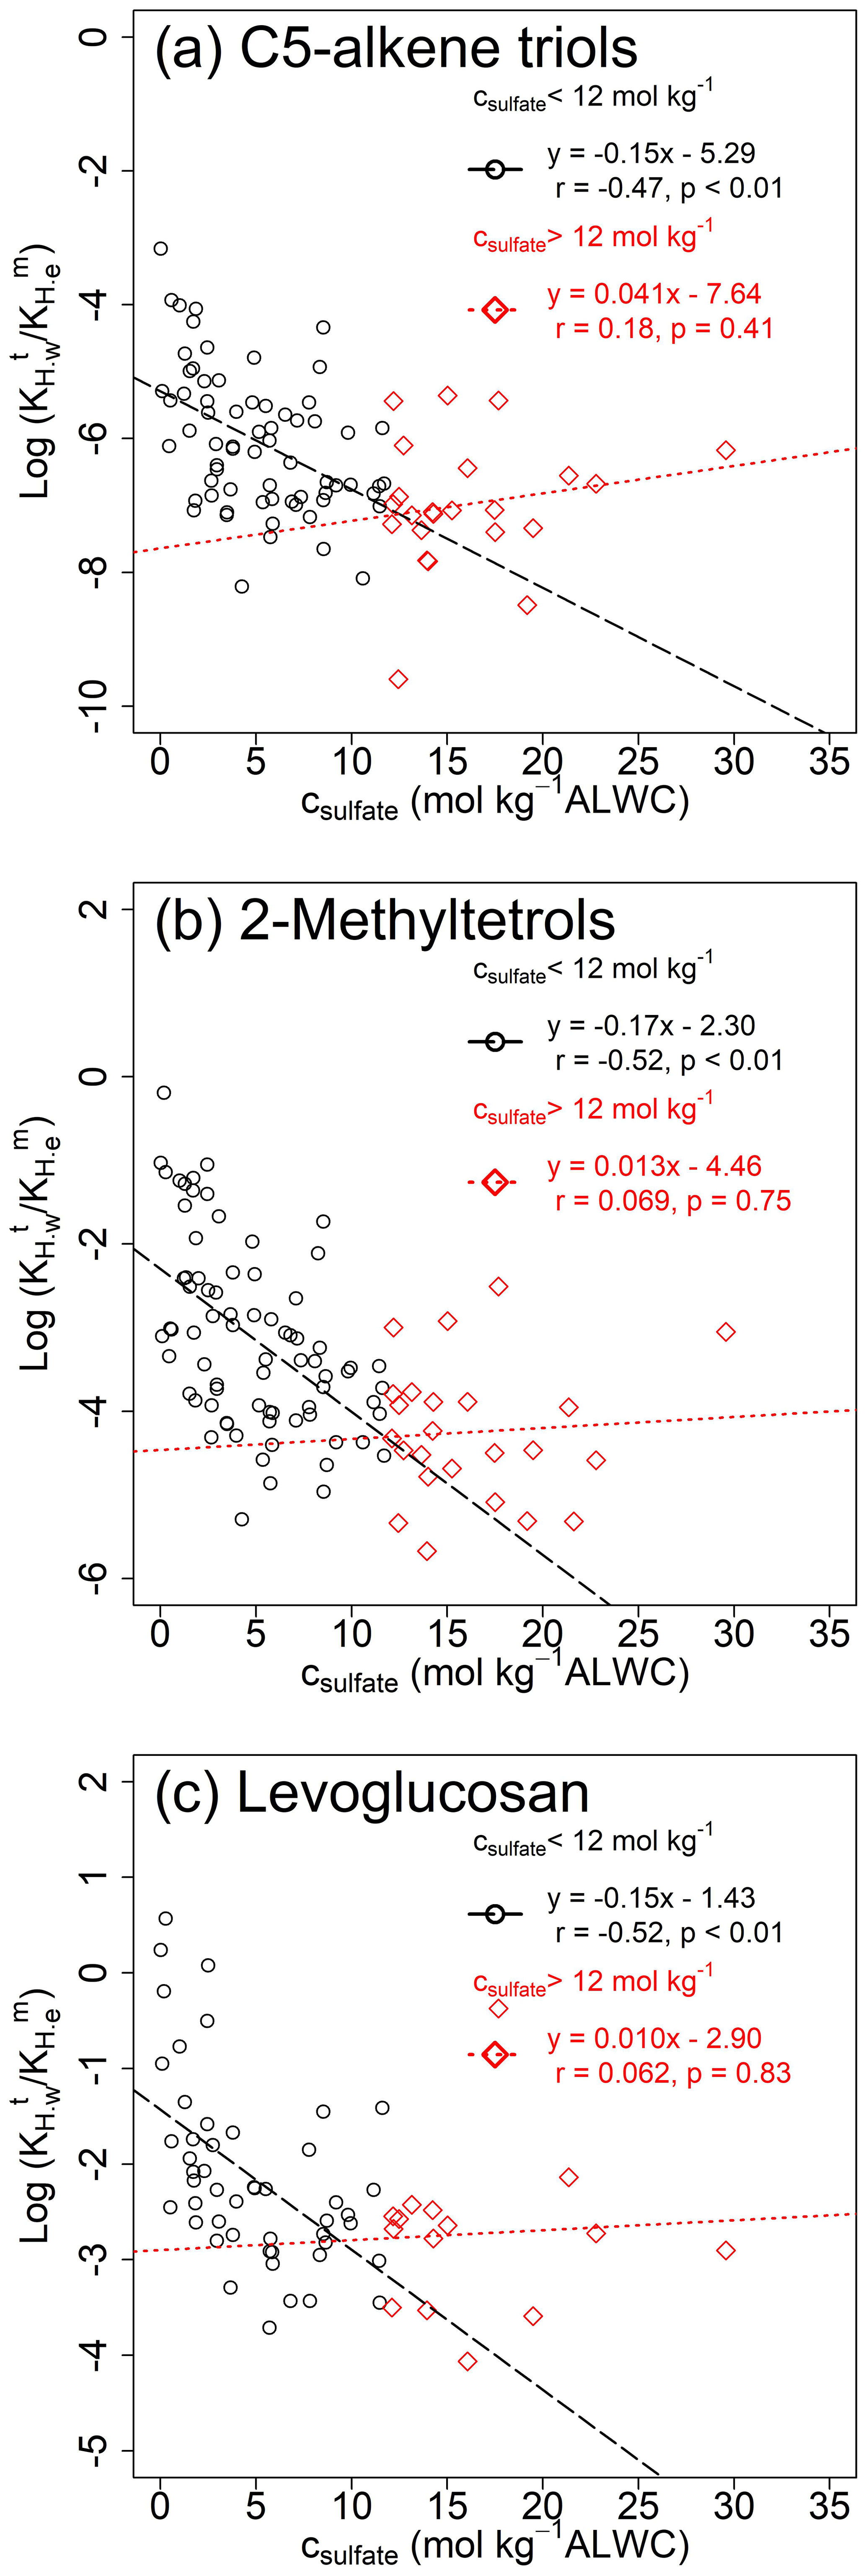
Figure 4Modified Setschenow plots of vs. csulfate for (a) C5-alkene triols, (b) 2-methyltetrols, and (c) levoglucosan.
As sulfate has been identified as the major factor influencing the salting effect of carbonyl species (Kroll et al., 2005; Ip et al., 2009), Fig. 4 shows modified Setschenow plots for C5-alkene triols, 2-methyltetrols, and levoglucosan, where values were regressed to the molality of sulfate ion in aerosol liquid water (csulfate, mol kg−1 ALWC). The data increased faster when csulfate approached 0 and deviated from their expected behavior with increased csulfate. Kampf et al. (2013) selected a threshold csulfate of 12 mol kg−1 ALWC to illustrate the deviation for chamber experiments and attributed it to elevated viscosity and slow particle-phase reactions at high csulfate. In Fig. 4, negative correlations (p < 0.01) are observed at csulfate < 12 mol kg−1 ALWC, and Fig. S5 exhibits significant negative correlations (p < 0.01) between and csulfate for individual polyols even without excluding the deviations at high csulfate. The Ks values of polyol tracers from Figs. 4 and S5 (−0.17– −0.037 kg mol−1) are in a similar range as that of glyoxal (−0.24– −0.04 kg mol−1; Kampf et al., 2013; Shen et al., 2018; Waxman et al., 2015). These results indicated that the shifting of gas–particle equilibrium toward the condensed phase might be partly parameterized by the equation defining salting-in effects.
However, the salting-in effect is a known phenomenon that is not likely linked with a specific physical or chemical mechanism. Quantum chemical calculation results indicated negative Gibbs free energy of water displacement for interactions between and glyoxal monohydrate (Waxman et al., 2015). The net salting-in effect of 1-nitro-2-naphthol in NaF solution was interpreted by postulating hydrogen bonding (Almeida et al., 1983). A direct binding of cations to ether oxygens was proposed to be responsible for the increased solubility of water-soluble polymers (Sadeghi and Jahani, 2012). Due to the moderate correlations and negative intercepts in Figs. 4 and S5, the gap between and cannot be closed by the “salting-in” effect alone. Shen et al. (2018) also obtained negative intercepts when plotting over csulfate for glyoxal and methylglyoxal in ambient atmosphere and attributed this to unknown gas–particle partitioning mechanisms. There is evidence showing that conventional GC/EI-MS analysis overestimates particle-phase 2-methyltetrols by 60 %–188 % due (in part) to the thermal degradation of less volatile oligomers and organosulfates (Cui et al., 2018). To fit the gas–particle distribution of 2-methyltetrols in the southeastern US, 50 % of particulate 2-methyltetrols was presumed to exist in chemical forms with much lower vapor pressures by Pye et al. (2018). So, the reactive uptake and aqueous phase chemistry could be explanations for the enhanced uptake of isoprene SOA tracers. Moreover, values of polyol tracers also negatively correlated with the aqueous-phase concentrations of WSOC (cWSOC, Fig. S6), but not or . This dependence might be associated with the “like-dissolves-like” rule or indicate the importance of aqueous-phase heterogeneous reactions (Hennigan et al., 2009; Volkamer et al., 2009). Although several studies have estimated Henry's law constants for a variety of polar organic compounds in pure water (e.g., polyols and polyacids; Compernolle and Müller, 2014a, b), more work is warranted to decrease the estimation uncertainty and explain their increased partitioning toward aerosol liquid water explicitly.
In this work, concentrations of gas- and particle-phase polyol tracers were measured simultaneously in northern Nanjing. The temporal variations in individual compounds were dominated by their particle-phase concentrations. Then gas–particle partitioning of polyol tracers should have little influence on source apportionment based on particle-phase data in Nanjing. An improved agreement between measurement-based and predicted Kp,OM of polyol tracers was observed when the solubility in aerosol liquid water was considered, indicating that the aqueous solution in aerosols is also an important absorbing phase. The large gaps of vs. could be partly parameterized using the equation defining salting-in effects. According to existing studies, reactive uptake, aqueous phase reactions, and chemical similarity between partitioning species and the absorbing phase might be responsible for increasing the partitioning of polyol tracers into the condensed phase. So, the results of this study have important implications on the prediction of gas–particle partitioning of water-soluble organics, and further studies are required to explain their enhanced aqueous-phase uptake mechanistically. Due to the hygroscopic properties of highly oxidized organic aerosols, this study also partly reveals the discrepancy between modeled and observed SOA in previous studies. However, several assumptions (e.g., LLPS) were made for proposed gas–particle partitioning schemes in this work, and more laboratory research is needed to understand the mixing state of inorganic salts, organic components, and aerosol liquid water in atmospheric particles.
Data used in the writing of this paper are available at Harvard Dataverse (https://doi.org/10.7910/DVN/U3IGQR, Qin et al., 2021).
The supplement related to this article is available online at: https://doi.org/10.5194/acp-21-12141-2021-supplement.
MX designed the research. CQ and YG performed the sampling and chemical analysis. CQ, YM, and MX analyzed the data. CQ and MX wrote the paper with significant contributions from YW, HL, and QW.
The authors declare that they have no conflict of interest.
Publisher's note: Copernicus Publications remains neutral with regard to jurisdictional claims in published maps and institutional affiliations.
This research was supported by the National Natural Science Foundation of China (NSFC, 41701551), Postdoctoral Research Foundation of China (2020M671519), and the Fundamental Research Funds for the Central Universities (KJQN202122). Yuhang Wang was supported by the National Science Foundation Atmospheric Chemistry Program.
This paper was edited by James Allan and reviewed by three anonymous referees.
Ahrens, L., Shoeib, M., Harner, T., Lane, D. A., Guo, R., and Reiner, E. J.: Comparison of annular diffusion denuder and high volume air samplers for measuring per- and polyfluoroalkyl substances in the atmosphere, Anal. Chem., 83, 9622–9628, https://doi.org/10.1021/ac202414w, 2011.
Almeida, M. B., Alvarez, A. M., Miguel, E. M. D., and Hoyo, E. S. D.: Setchenow coefficients for naphthols by distribution method, Can. J. Chem., 61, 244–248, https://doi.org/10.1139/v83-043, 1983.
Barsanti, K. C. and Pankow, J. F.: Thermodynamics of the formation of atmospheric organic particulate matter by accretion reactions—Part 1: aldehydes and ketones, Atmos. Environ., 38, 4371–4382, https://doi.org/10.1016/j.atmosenv.2004.03.035, 2004.
Bauer, H., Claeys, M., Vermeylen, R., Schueller, E., Weinke, G., Berger, A., and Puxbaum, H.: Arabitol and mannitol as tracers for the quantification of airborne fungal spores, Atmos. Environ., 42, 588–593, https://doi.org/10.1016/j.atmosenv.2007.10.013, 2008.
Burshtein, N., Lang-Yona, N., and Rudich, Y.: Ergosterol, arabitol and mannitol as tracers for biogenic aerosols in the eastern Mediterranean, Atmos. Chem. Phys., 11, 829–839, https://doi.org/10.5194/acp-11-829-2011, 2011.
Claeys, M., Graham, B., Vas, G., Wang, W., Vermeylen, R., Pashynska, V., Cafmeyer, J., Guyon, P., Andreae, M. O., Artaxo, P., and Maenhaut, W.: Formation of secondary organic aerosols through photooxidation of isoprene, Science, 303, 1173–1176, https://doi.org/10.1126/science.1092805, 2004.
Compernolle, S. and Müller, J.-F.: Henry's law constants of polyols, Atmos. Chem. Phys., 14, 12815–12837, https://doi.org/10.5194/acp-14-12815-2014, 2014a.
Compernolle, S. and Müller, J.-F.: Henry's law constants of diacids and hydroxy polyacids: recommended values, Atmos. Chem. Phys., 14, 2699–2712, https://doi.org/10.5194/acp-14-2699-2014, 2014b.
Cui, T., Zeng, Z., dos Santos, E. O., Zhang, Z., Chen, Y., Zhang, Y., Rose, C. A., Budisulistiorini, S. H., Collins, L. B., Bodnar, W. M., de Souza, R. A. F., Martin, S. T., Machado, C. M. D., Turpin, B. J., Gold, A., Ault, A. P., and Surratt, J. D.: Development of a hydrophilic interaction liquid chromatography (HILIC) method for the chemical characterization of water-soluble isoprene epoxydiol (IEPOX)-derived secondary organic aerosol, Environ. Sci. Proc. Imp., 20, 1524–1536, https://doi.org/10.1039/C8EM00308D, 2018.
Fu, P. and Kawamura, K.: Diurnal variations of polar organic tracers in summer forest aerosols: A case study of a Quercus and Picea mixed forest in Hokkaido, Japan, Geochem. J., 45, 297–308, https://doi.org/10.2343/geochemj.1.0123, 2011.
Galloway, M. M., Chhabra, P. S., Chan, A. W. H., Surratt, J. D., Flagan, R. C., Seinfeld, J. H., and Keutsch, F. N.: Glyoxal uptake on ammonium sulphate seed aerosol: reaction products and reversibility of uptake under dark and irradiated conditions, Atmos. Chem. Phys., 9, 3331–3345, https://doi.org/10.5194/acp-9-3331-2009, 2009.
Hallar, A. G., Lowenthal, D. H., Clegg, S. L., Samburova, V., Taylor, N., Mazzoleni, L. R., Zielinska, B. K., Kristensen, T. B., Chirokova, G., McCubbin, I. B., Dodson, C., and Collins, D.: Chemical and hygroscopic properties of aerosol organics at Storm Peak Laboratory, J. Geophys. Res.-Atmos., 118, 4767–4779, https://doi.org/10.1002/jgrd.50373, 2013.
Heald, C. L., Jacob, D. J., Park, R. J., Russell, L. M., Huebert, B. J., Seinfeld, J. H., Liao, H., and Weber, R. J.: A large organic aerosol source in the free troposphere missing from current models, Geophys. Res. Lett., 32, L18809, https://doi.org/10.1029/2005GL023831, 2005.
Healy, R. M., Wenger, J. C., Metzger, A., Duplissy, J., Kalberer, M., and Dommen, J.: Gas/particle partitioning of carbonyls in the photooxidation of isoprene and 1,3,5-trimethylbenzene, Atmos. Chem. Phys., 8, 3215–3230, https://doi.org/10.5194/acp-8-3215-2008, 2008.
Hennigan, C. J., Bergin, M. H., Russell, A. G., Nenes, A., and Weber, R. J.: Gas/particle partitioning of water-soluble organic aerosol in Atlanta, Atmos. Chem. Phys., 9, 3613–3628, https://doi.org/10.5194/acp-9-3613-2009, 2009.
Hennigan, C. J., Sullivan, A. P., Collett Jr, J. L., and Robinson, A. L.: Levoglucosan stability in biomass burning particles exposed to hydroxyl radicals, Geophys. Res. Lett., 37, L09806, https://doi.org/10.1029/2010GL043088, 2010.
Hilal, S. H., Ayyampalayam, S. N., and Carreira, L. A.: Air–liquid partition coefficient for a diverse set of organic compounds: Henry's Law constant in water and hexadecane, Environ. Sci. Technol., 42, 9231–9236, https://doi.org/10.1021/es8005783, 2008.
Hodzic, A., Jimenez, J. L., Madronich, S., Canagaratna, M. R., DeCarlo, P. F., Kleinman, L., and Fast, J.: Modeling organic aerosols in a megacity: potential contribution of semi-volatile and intermediate volatility primary organic compounds to secondary organic aerosol formation, Atmos. Chem. Phys., 10, 5491–5514, https://doi.org/10.5194/acp-10-5491-2010, 2010.
Hoffmann, D., Tilgner, A., Iinuma, Y., and Herrmann, H.: Atmospheric stability of levoglucosan: A detailed laboratory and modeling study, Environ. Sci. Technol., 44, 694–699, https://doi.org/10.1021/es902476f, 2010.
Hu, D., Bian, Q., Lau, A. K. H., and Yu, J. Z.: Source apportioning of primary and secondary organic carbon in summer PM2.5 in Hong Kong using positive matrix factorization of secondary and primary organic tracer data, J. Geophys. Res.-Atmos., 115, D16204, https://doi.org/10.1029/2009JD012498, 2010.
Ip, H. S. S., Huang, X. H. H., and Yu, J. Z.: Effective Henry's law constants of glyoxal, glyoxylic acid, and glycolic acid, Geophys. Res. Lett., 36, L01802, https://doi.org/10.1029/2008GL036212, 2009.
Isaacman-VanWertz, G., Yee, L. D., Kreisberg, N. M., Wernis, R., Moss, J. A., Hering, S. V., de Sá, S. S., Martin, S. T., Alexander, M. L., Palm, B. B., Hu, W., Campuzano-Jost, P., Day, D. A., Jimenez, J. L., Riva, M., Surratt, J. D., Viegas, J., Manzi, A., Edgerton, E., Baumann, K., Souza, R., Artaxo, P., and Goldstein, A. H.: Ambient gas-particle partitioning of tracers for biogenic oxidation, Environ. Sci. Technol., 50, 9952–9962, https://doi.org/10.1021/acs.est.6b01674, 2016.
Jang, M., Czoschke, N. M., Lee, S., and Kamens, R. M.: Heterogeneous atmospheric aerosol production by acid-catalyzed particle-phase reactions, Science, 298, 814, https://doi.org/10.1126/science.1075798, 2002.
Kampf, C. J., Waxman, E. M., Slowik, J. G., Dommen, J., Pfaffenberger, L., Praplan, A. P., Prévôt, A. S. H., Baltensperger, U., Hoffmann, T., and Volkamer, R.: Effective Henry's law partitioning and the salting constant of glyoxal in aerosols containing sulfate, Environ. Sci. Technol., 47, 4236–4244, https://doi.org/10.1021/es400083d, 2013.
Kondo, Y., Miyazaki, Y., Takegawa, N., Miyakawa, T., Weber, R. J., Jimenez, J. L., Zhang, Q., and Worsnop, D. R.: Oxygenated and water-soluble organic aerosols in Tokyo, J. Geophys. Res.-Atmos., 112, D01203, https://doi.org/10.1029/2006jd007056, 2007.
Kroll, J. H., Ng, N. L., Murphy, S. M., Varutbangkul, V., Flagan, R. C., and Seinfeld, J. H.: Chamber studies of secondary organic aerosol growth by reactive uptake of simple carbonyl compounds, J. Geophys. Res.-Atmos., 110, D23207, https://doi.org/10.1029/2005JD006004, 2005.
Liang, C. and Pankow, J. F.: Gas/particle partitioning of organic compounds to environmental tobacco smoke: Partition coefficient measurements by desorption and comparison to urban particulate material, Environ. Sci. Technol., 30, 2800–2805, https://doi.org/10.1021/es960050x, 1996.
Liang, C., Pankow, J. F., Odum, J. R., and Seinfeld, J. H.: Gas/particle partitioning of semivolatile organic compounds to model inorganic, organic, and ambient smog aerosols, Environ. Sci. Technol., 31, 3086–3092, https://doi.org/10.1021/es9702529, 1997.
Lin, Y.-H., Knipping, E. M., Edgerton, E. S., Shaw, S. L., and Surratt, J. D.: Investigating the influences of SO2 and NH3 levels on isoprene-derived secondary organic aerosol formation using conditional sampling approaches, Atmos. Chem. Phys., 13, 8457–8470, https://doi.org/10.5194/acp-13-8457-2013, 2013.
Lin, Y.-H., Budisulistiorini, S. H., Chu, K., Siejack, R. A., Zhang, H., Riva, M., Zhang, Z., Gold, A., Kautzman, K. E., and Surratt, J. D.: Light-absorbing oligomer formation in secondary organic aerosol from reactive uptake of isoprene epoxydiols, Environ. Sci. Technol., 48, 12012–12021, https://doi.org/10.1021/es503142b, 2014.
Liu, J., Li, X., Li, D., Xu, R., Gao, Y., Chen, S., Liu, Y., Zhao, G., Wang, H., Wang, H., Lou, S., Chen, M., Hu, J., Lu, K., Wu, Z., Hu, M., Zeng, L., and Zhang, Y.: Observations of glyoxal and methylglyoxal in a suburban area of the Yangtze River Delta, China, Atmos. Environ., 238, 117727, https://doi.org/10.1016/j.atmosenv.2020.117727, 2020.
Mader, B. T. and Pankow, J. F.: Study of the effects of particle-phase carbon on the gas/particle partitioning of semivolatile organic compounds in the atmosphere using controlled field experiments, Environ. Sci. Technol., 36, 5218–5228, https://doi.org/10.1021/es011048v, 2002.
Odum, J. R., Hoffmann, T., Bowman, F., Collins, D., Flagan, R. C., and Seinfeld, J. H.: Gas/particle partitioning and secondary organic aerosol yields, Environ. Sci. Technol., 30, 2580–2585, https://doi.org/10.1021/es950943+, 1996.
Pankow, J. F.: An absorption model of the gas/aerosol partitioning involved in the formation of secondary organic aerosol, Atmos. Environ., 28, 189–193, https://doi.org/10.1016/1352-2310(94)90094-9, 1994a.
Pankow, J. F.: An absorption model of gas/particle partitioning of organic compounds in the atmosphere, Atmos. Environ., 28, 185–188, https://doi.org/10.1016/1352-2310(94)90093-0, 1994b.
Perraud, V., Bruns, E. A., Ezell, M. J., Johnson, S. N., Yu, Y., Alexander, M. L., Zelenyuk, A., Imre, D., Chang, W. L., Dabdub, D., Pankow, J. F., and Finlayson-Pitts, B. J.: Nonequilibrium atmospheric secondary organic aerosol formation and growth, P. Natl. Acad. Sci. USA, 109, 2836–2841, https://doi.org/10.1073/pnas.1119909109, 2012.
Peters, A. J., Lane, D. A., Gundel, L. A., Northcott, G. L., and Jones, K. C.: A comparison of high volume and diffusion denuder samplers for measuring semivolatile organic compounds in the atmosphere, Environ. Sci. Technol., 34, 5001–5006, https://doi.org/10.1021/es000056t, 2000.
Pye, H. O. T., Zuend, A., Fry, J. L., Isaacman-VanWertz, G., Capps, S. L., Appel, K. W., Foroutan, H., Xu, L., Ng, N. L., and Goldstein, A. H.: Coupling of organic and inorganic aerosol systems and the effect on gas–particle partitioning in the southeastern US, Atmos. Chem. Phys., 18, 357–370, https://doi.org/10.5194/acp-18-357-2018, 2018.
Qin, C., Gou, Y., Wang, Y., Mao, Y., Liao, H., Wang, Q. G., and Xie, M.: Replication Data for: Gas-particle partitioning of polyol tracers in the western Yangtze River Delta, China, V2, Harvard Dataverse, https://doi.org/10.7910/DVN/U3IGQR, 2021.
Sadeghi, R. and Jahani, F.: Salting-in and salting-out of water-soluble polymers in aqueous salt solutions, J. Phys. Chem. B, 116, 5234–5241, https://doi.org/10.1021/jp300665b, 2012.
Saxena, P. and Hildemann, L.: Water-soluble organics in atmospheric particles: A critical review of the literature and application of thermodynamics to identify candidate compounds, J. Atmos. Chem., 24, 57–109, https://doi.org/10.1007/bf00053823, 1996.
Setschenow, J.: Über die Konstitution der Salzlösungen auf Grund ihres Verhaltens zu Kohlensäure, Z. Phys. Chem., 4U, 117–125, https://doi.org/10.1515/zpch-1889-0409, 1889.
Shen, H., Chen, Z., Li, H., Qian, X., Qin, X., and Shi, W.: Gas-particle partitioning of carbonyl compounds in the ambient atmosphere, Environ. Sci. Technol., 52, 10997–11006, https://doi.org/10.1021/acs.est.8b01882, 2018.
Simcik, M. F., Franz, T. P., Zhang, H., and Eisenreich, S. J.: Gas-particle partitioning of PCBs and PAHs in the Chicago urban and adjacent coastal atmosphere: States of equilibrium, Environ. Sci. Technol., 32, 251–257, https://doi.org/10.1021/es970557n, 1998.
Simoneit, B. R. T., Schauer, J. J., Nolte, C. G., Oros, D. R., Elias, V. O., Fraser, M. P., Rogge, W. F., and Cass, G. R.: Levoglucosan, a tracer for cellulose in biomass burning and atmospheric particles, Atmos. Environ., 33, 173–182, https://doi.org/10.1016/S1352-2310(98)00145-9, 1999.
Simoneit, B. R. T., Elias, V. O., Kobayashi, M., Kawamura, K., Rushdi, A. I., Medeiros, P. M., Rogge, W. F., and Didyk, B. M.: Sugars dominant water-soluble organic compounds in soils and characterization as tracers in atmospheric particulate matter, Environ. Sci. Technol., 38, 5939–5949, https://doi.org/10.1021/es0403099, 2004.
Surratt, J. D., Murphy, S. M., Kroll, J. H., Ng, N. L., Hildebrandt, L., Sorooshian, A., Szmigielski, R., Vermeylen, R., Maenhaut, W., Claeys, M., Flagan, R. C., and Seinfeld, J. H.: Chemical composition of secondary organic aerosol formed from the photooxidation of isoprene, J. Phys. Chem. A, 110, 9665–9690, https://doi.org/10.1021/jp061734m, 2006.
Surratt, J. D., Chan, A. W. H., Eddingsaas, N. C., Chan, M., Loza, C. L., Kwan, A. J., Hersey, S. P., Flagan, R. C., Wennberg, P. O., and Seinfeld, J. H.: Reactive intermediates revealed in secondary organic aerosol formation from isoprene, P. Natl. Acad. Sci. USA, 107, 6640–6645, https://doi.org/10.1073/pnas.0911114107, 2010.
Taylor, N. F., Collins, D. R., Lowenthal, D. H., McCubbin, I. B., Hallar, A. G., Samburova, V., Zielinska, B., Kumar, N., and Mazzoleni, L. R.: Hygroscopic growth of water soluble organic carbon isolated from atmospheric aerosol collected at US national parks and Storm Peak Laboratory, Atmos. Chem. Phys., 17, 2555–2571, https://doi.org/10.5194/acp-17-2555-2017, 2017.
Tsyro, S. G.: To what extent can aerosol water explain the discrepancy between model calculated and gravimetric PM10 and PM2.5, Atmos. Chem. Phys., 5, 515–532, https://doi.org/10.5194/acp-5-515-2005, 2005.
Turpin, B. J. and Lim, H.-J.: Species contributions to PM2.5 mass concentrations: Revisiting common assumptions for estimating organic mass, Aerosol Sci. Techn., 35, 602–610, https://doi.org/10.1080/02786820119445, 2001.
US EPA: Estimation Program Interface (EPI) Suite, Version v4.11, United States Environmental Protection Agency, Washington, DC, USA, available at: https://www.epa.gov/tsca-screening-tools/download-epi-suitetm-estimation-program-interface-v411 (last access: 12 January 2021), 2012.
Volkamer, R., Jimenez, J. L., San Martini, F., Dzepina, K., Zhang, Q., Salcedo, D., Molina, L. T., Worsnop, D. R., and Molina, M. J.: Secondary organic aerosol formation from anthropogenic air pollution: Rapid and higher than expected, Geophys. Res. Lett., 33, L17811, https://doi.org/10.1029/2006GL026899, 2006.
Volkamer, R., Ziemann, P. J., and Molina, M. J.: Secondary Organic Aerosol Formation from Acetylene (C2H2): seed effect on SOA yields due to organic photochemistry in the aerosol aqueous phase, Atmos. Chem. Phys., 9, 1907–1928, https://doi.org/10.5194/acp-9-1907-2009, 2009.
Wang, W., Kourtchev, I., Graham, B., Cafmeyer, J., Maenhaut, W., and Claeys, M.: Characterization of oxygenated derivatives of isoprene related to 2-methyltetrols in Amazonian aerosols using trimethylsilylation and gas chromatography/ion trap mass spectrometry, Rapid Commun. Mass Sp., 19, 1343–1351, https://doi.org/10.1002/rcm.1940, 2005.
Waxman, E. M., Elm, J., Kurtén, T., Mikkelsen, K. V., Ziemann, P. J., and Volkamer, R.: Glyoxal and methylglyoxal Setschenow salting constants in sulfate, nitrate, and chloride solutions: Measurements and Gibbs energies, Environ. Sci. Technol., 49, 11500–11508, https://doi.org/10.1021/acs.est.5b02782, 2015.
Williams, B. J., Goldstein, A. H., Kreisberg, N. M., and Hering, S. V.: In situ measurements of gas/particle-phase transitions for atmospheric semivolatile organic compounds, P. Natl. Acad. Sci. USA, 107, 6676–6681, https://doi.org/10.1073/pnas.0911858107, 2010.
Xie, M., Barsanti, K. C., Hannigan, M. P., Dutton, S. J., and Vedal, S.: Positive matrix factorization of PM2.5 – eliminating the effects of gas/particle partitioning of semivolatile organic compounds, Atmos. Chem. Phys., 13, 7381–7393, https://doi.org/10.5194/acp-13-7381-2013, 2013.
Xie, M., Hannigan, M. P., and Barsanti, K. C.: Gas/particle partitioning of n-alkanes, PAHs and oxygenated PAHs in urban Denver, Atmos. Environ., 95, 355–362, https://doi.org/10.1016/j.atmosenv.2014.06.056, 2014a.
Xie, M., Hannigan, M. P., and Barsanti, K. C.: Gas/particle partitioning of 2-methyltetrols and levoglucosan at an urban site in Denver, Environ. Sci. Technol., 48, 2835–2842, https://doi.org/10.1021/es405356n, 2014b.
Xie, M., Hannigan, M. P., and Barsanti, K. C.: Impact of gas/particle partitioning of semivolatile organic compounds on source apportionment with positive matrix factorization, Environ. Sci. Technol., 48, 9053–9060, https://doi.org/10.1021/es5022262, 2014c.
Yang, L., Shang, Y., Hannigan, M. P., Zhu, R., Wang, Q. g., Qin, C., and Xie, M.: Collocated speciation of PM2.5 using tandem quartz filters in northern nanjing, China: Sampling artifacts and measurement uncertainty, Atmos. Environ., 246, 118066, https://doi.org/10.1016/j.atmosenv.2020.118066, 2021.
Yatavelli, R. L. N., Stark, H., Thompson, S. L., Kimmel, J. R., Cubison, M. J., Day, D. A., Campuzano-Jost, P., Palm, B. B., Hodzic, A., Thornton, J. A., Jayne, J. T., Worsnop, D. R., and Jimenez, J. L.: Semicontinuous measurements of gas–particle partitioning of organic acids in a ponderosa pine forest using a MOVI-HRToF-CIMS, Atmos. Chem. Phys., 14, 1527–1546, https://doi.org/10.5194/acp-14-1527-2014, 2014.
Zhang, Y., Sheesley, R. J., Schauer, J. J., Lewandowski, M., Jaoui, M., Offenberg, J. H., Kleindienst, T. E., and Edney, E. O.: Source apportionment of primary and secondary organic aerosols using positive matrix factorization (PMF) of molecular markers, Atmos. Environ., 43, 5567–5574, https://doi.org/10.1016/j.atmosenv.2009.02.047, 2009.
Zhao, Y., Kreisberg, N. M., Worton, D. R., Isaacman, G., Weber, R. J., Liu, S., Day, D. A., Russell, L. M., Markovic, M. Z., VandenBoer, T. C., Murphy, J. G., Hering, S. V., and Goldstein, A. H.: Insights into secondary organic aerosol formation mechanisms from measured gas/particle partitioning of specific organic tracer compounds, Environ. Sci. Technol., 47, 3781–3787, https://doi.org/10.1021/es304587x, 2013.
Zuend, A. and Seinfeld, J. H.: Modeling the gas-particle partitioning of secondary organic aerosol: the importance of liquid-liquid phase separation, Atmos. Chem. Phys., 12, 3857–3882, https://doi.org/10.5194/acp-12-3857-2012, 2012.