the Creative Commons Attribution 4.0 License.
the Creative Commons Attribution 4.0 License.
 | 06 Aug 2021
The importance of sesquiterpene oxidation products for secondary organic aerosol formation in a springtime hemiboreal forest
Arttu Ylisirniö
Iida Pullinen
Angela Buchholz
Helina Lipp
Heikki Junninen
Urmas Hõrrak
Steffen M. Noe
Alisa Krasnova
Dmitrii Krasnov
Kaia Kask
Eero Talts
Ülo Niinemets
Jose Ruiz-Jimenez
Siegfried Schobesberger
Secondary organic aerosols (SOAs) formed from biogenic volatile organic compounds (BVOCs) constitute a significant fraction of atmospheric particulate matter and have been recognized to significantly affect the climate and air quality. Atmospheric SOA particulate mass yields and chemical composition result from a complex mixture of oxidation products originating from a diversity of BVOCs. Many laboratory and field experiments have studied SOA particle formation and growth in the recent years. However, a large uncertainty still remains regarding the contribution of BVOCs to SOA. In particular, organic compounds formed from sesquiterpenes have not been thoroughly investigated, and their contribution to SOA remains poorly characterized. In this study, a Filter Inlet for Gases and Aerosols (FIGAERO) combined with a high-resolution time-of-flight chemical ionization mass spectrometer (CIMS), with iodide ionization, was used for the simultaneous measurement of gas-phase and particle-phase oxygenated compounds. The aim of the study was to evaluate the relative contribution of sesquiterpene oxidation products to SOA in a springtime hemiboreal forest environment. Our results revealed that monoterpene and sesquiterpene oxidation products were the main contributors to SOA particles. The chemical composition of SOA particles was compared for times when either monoterpene or sesquiterpene oxidation products were dominant and possible key oxidation products for SOA particle formation were identified for both situations. Surprisingly, sesquiterpene oxidation products were the predominant fraction in the particle phase in some periods, while their gas-phase concentrations remained much lower than those of monoterpene products. This can be explained by favorable and effective partitioning of sesquiterpene products into the particle phase. The SOA particle volatility determined from measured thermograms increased when the concentration of sesquiterpene oxidation products in SOA particles was higher than that of monoterpenes. Overall, this study demonstrates that sesquiterpenes may have an important role in atmospheric SOA formation and oxidation chemistry, in particular during the spring recovery period.
- Article
(4648 KB) - Full-text XML
-
Supplement
(2574 KB) - BibTeX
- EndNote


Volatile organic compounds (VOCs) are ubiquitous constituents of Earth's atmosphere that are emitted from both biogenic and anthropogenic sources (e.g., Kansal, 2009). Anthropogenic VOCs (AVOCs) may predominate in urban areas, but the source strength of biogenic VOCs (BVOCs) exceeds that of AVOCs by an order of magnitude, implying that BVOCs dominate on the global scale (e.g., Guenther et al., 1995; Kansal, 2009) and often even in urban environments (e.g., Barreira et al., 2021). BVOCs are mostly emitted by vegetation in relation to temperature and/or light, but recently plant damages (e.g., due to herbivore attack), and the resulting wound emissions and de novo induced emissions, have been also recognized as important factors impacting emissions of BVOCs (e.g., Niinemets et al., 2013; Grote et al., 2013; Kari et al., 2019; Laothawornkitkul et al., 2009; Niinemets, 2018; Peñuelas and Staudt, 2010). BVOCs are vital in nature since they participate in several processes, such as the defense of plants against predators or communication between species (e.g., Peñuelas and Staudt, 2010). BVOCs also play an important role in atmospheric physics and chemistry. They react with atmospheric oxidants, which results in the formation of secondary products (e.g., Kavouras et al., 1999). Ultimately, these oxidation products can contribute to secondary organic aerosol (SOA) particle formation and growth (e.g., Riipinen et al., 2012). SOA influences the Earth's radiative balance by scattering and absorbing solar radiation and by acting as cloud condensation nuclei (e.g., Ezhova et al., 2018; Hallquist et al., 2009) and therefore affects the weather and climate on Earth. Aerosols in the atmosphere also have adverse effects on public health, since they cause or enhance respiratory, cardiovascular, infectious and allergic diseases (Pöschl, 2005).
The most abundantly emitted biogenic species are terpenes, a very heterogeneous compound class. Terpenes have high structural diversity, such as distinct ring structures and double bond amounts and positions. Due to their structural diversity, terpenes display a wide range of reactivities against atmospheric oxidants, and thus their lifetimes vary considerably between different species (Atkinson and Arey, 2003). For that reason, the distribution of terpene-derived oxidation products depends on their specific precursors and on the atmospheric abundance of a variety of reaction partners (O3, HOx, NO3 and NOx) (e.g., Atkinson and Arey, 2003; Jokinen et al., 2015). Isoprene and monoterpenes are the most studied SOA precursor terpenes in boreal environments, but the interest in the role of sesquiterpenes has recently grown with the increasing availability of measurement techniques suitable for detection and quantification of sesquiterpenes and their oxidation products. For example, a recent study has found that sesquiterpenes have a larger effect on ozone (O3) chemistry and higher production rates of condensable organic vapors when compared to monoterpenes (Hellén et al., 2018). As sesquiterpene oxidation products are generally expected to be less volatile than monoterpene oxidation products, they may play a stronger role in the local SOA formation and particle growth (Hellén et al., 2018). However, in comparison to monoterpenes, the contribution of sesquiterpenes to SOA has been often overlooked due to challenges in measuring these highly reactive atmospheric constituents.
In this study, comprehensive field measurements of atmospheric gas- and particle-phase composition were performed in the spring of 2018 at SMEAR (Station for Measuring Ecosystem-Atmosphere Relations) Estonia in Järvselja, Estonia. The study was part of the Järvselja 2018 campaign, which aimed to study both the new particle formation and SOA composition in a hemiboreal forest. As our measurements were performed during springtime, they covered a period of significant changes in biosphere activity. The aerosol composition was characterized by using both online and offline methods. The online measurements were performed by employing a Filter Inlet for Gases and Aerosols combined with high-resolution time-of-flight chemical ionization mass spectrometry (FIGAERO-CIMS). Aerosol particle samples were also collected on filters for offline analysis by liquid chromatography combined with electrospray ionization quadrupole time-of-flight mass spectrometry (LC-QToF-MS) and by gas chromatography combined with chemical ionization quadrupole time-of-flight mass spectrometry (GC-QToF-MS). The main aim of this study was to investigate the importance of sesquiterpenes for atmospheric SOA composition.
2.1 Measurement site
Comprehensive online measurements were performed in spring 2018 from 23 April to 29 May at SMEAR Estonia. This station is located in the Järvselja Experimental Forest (58.2776∘ N, 27.3083∘ E; 36 m a.s.l.), which consists of a hemiboreal forest stand comprising mostly Scots pine (Pinus sylvestris L.), Norway spruce (Picea abies (L.) Karst.), silver birch (Betula pendula Roth.) and downy birch (Betula pubescens Ehrh.). The dominant tree species are Scots pine, followed by Norway spruce and birch species. The mean canopy height was about 20 m, but within about 300 m around the station the oldest stands could reach up to 30 m. The main cities closest to the site are Tartu (about 100 000 inhabitants, 36 km west–northwest) and Pskov (about 205 000 inhabitants, 79 km southeast across Lake Peipus). The mean annual temperature in the area varies between 4 and 6 ∘C, with temperature ranging between −5 and 28 ∘C during the campaign period. May 2018 indicated record warmth and sunshine in Estonia. The annual precipitation is 500–750 mm, with about 40–80 mm as snow, and the growing season length is about 170–180 d. The location qualifies as a rural background monitoring site. A detailed description of the station with 130 m tall atmospheric measurement mast equipped with meteorological sensors and air trace-gas sampling system can be found in Noe et al. (2015). The online instruments used in this study were installed inside a measurement container located approximately 10 m from the nearest trees.
2.2 Measurement methods
2.2.1 FIGAERO-CIMS
Measurements of inorganic and organic compounds in both gas and particle phases were performed by FIGAERO-CIMS using iodide ionization (HR-ToF-CIMS, Aerodyne Research Inc.). The used FIGAERO unit had been custom built in early 2018 and differs slightly from other designs generally used (Ylisirniö et al., 2020), but the main operation principles are the same as in Lopez-Hilfiker et al. (2014). The overall sampling setup used in this study is presented in Fig. S1 in the Supplement. The FIGAERO-CIMS measurement cycle involved 45 min of gas-phase measurements and simultaneous particle collection, followed by 45 min of aerosol particle desorption and measurements. The gas-phase sampling line was operated with 15 L min−1 flow. This high flow limits vapor–wall interactions in the employed sampling line, such as wall losses for low-volatility compounds. The FIGAERO-CIMS instrument subsampled 2.1 L min−1 from close to its inlet. Teflon tubing (∼2 m of 9.4 mm inner diameter tubing followed by 3 cm of 4.7 mm inner diameter tubing closer to the instrument inlet) was used for the gas-phase inlet. For aerosol particle collection, a cyclone (BGI SCC 1.829, Mesa Laboratories Inc.) was used to selectively collect particles with an aerodynamic diameter below 1 µm (PM1). The particles were collected on PTFE filters (Zefluor, Pall Corp. 2 µm pore size). The total flow through the cyclone was 11 L min−1, which was then split into 5.5 L min−1 for the FIGAERO aerosol particle collection and 5.5 L min−1 for offline filter collection. The impactor cut-off size (D50) was 1 µm. Copper tubing (2 m with an inner diameter of 8 mm) was used for the sampling of aerosol particles. The aerosol sample desorption step consisted of a 30 min linear temperature increase from room temperature to 200 ∘C (approximately 5.8 ∘C min−1). The temperature was held at 200 ∘C for 15 additional minutes to ensure that all detectable organic material was removed from the filter. Gas- and particle-phase blanks (zero signal) were also measured. The gas-phase blanks were performed by introducing dry ultra-high-purity N2 a few centimeters away from the critical orifice to displace the incoming ambient air. The N2 flow was closed during sampling and only opened for blanks. These blanks were conducted for 10 s following a period of 50 s of gas-phase measurements. Particle-phase blanks were obtained by adding a high-efficiency particulate air (HEPA) filter in the sampling line to remove all particles before using the same collection and measurement method as for the samples. One particle-phase blank was collected after three particle samples. A detailed description of FIGAERO-CIMS data processing is presented in Sect. S2.
2.2.2 Offline filter analysis
For comparison purposes, particulate matter (PM1) was also collected on polytetrafluoroethylene (PTFE) filters (Zefluor, Pall Corp. 2 µm pore size) for offline analysis. The collection time was about 4 d at a sampling flow rate of 5.5 L min−1. A total of eight filters were collected during the campaign. The filters were stored in a freezer at −18 ∘C. For sample preparation, the filters were extracted in 10 mL of acetonitrile and sonicated for 30 min as in Duporté et al. (2016). Then, a gentle stream of nitrogen was used to reduce the remaining acetonitrile to 250 µL.
Half of the sample was kept in acetonitrile for liquid chromatography quadrupole time-of-flight mass spectrometry (LC-QToF-MS) analysis. The analytical method is described in Puurunen et al. (2016) and in the Supplement (see Sect. S3). Briefly, the LC-QToF-MS (Agilent Technologies, Waldbronn, Karlsruhe, Germany) consisted of a 1290 LC system, a jet stream electrospray ionization (ESI) source and a 6540 ultrahigh-definition accurate-mass quadrupole-time-of-flight (QToF) mass spectrometer. All samples were analyzed using reversed-phase (RP) chromatography. The data were acquired in both ionization polarities, i.e., ESI positive (ESI+) and ESI negative (ESI−). The resolution was between 12 000 and 25 000 (from 118 to 622).
The other half of the sample was reduced to 10 µL and reconstituted in 100 µL of dichloromethane for analysis with a 7200 accurate-mass GC-QToF-MS (gas chromatography quadrupole time-of-flight mass spectrometry) instrument (Agilent Technologies, Santa Clara, CA), operating in negative chemical ionization mode, to measure the volatile and/or semi-volatile fraction of the aerosol particles. The resolution was between 11 000 and 21 000 (from 185 to 517). A detailed description of the operational parameters used for GC-QToF-MS can be found in Sect. S3.
For both LC-QToF-MS and GC-QToF-MS analysis, the measured signal was normalized by the total volume of ambient air collected on the filter. For filter blanks, clean filters were extracted and analyzed with the same methods described above for the filters used in the PM1 sample collection.
2.2.3 Auxiliary measurements
To allow BVOC species distinction, ambient air was sampled into multi-bed stainless-steel cartridges (10.5 cm length, 3 mm inner diameter, Supelco, Bellefonte, PA, USA), which were filled with Carbotrap C 20/40 mesh (0.2 g), Carbopack C 40/60 mesh (0.1 g) and Carbotrap X 20/40 mesh (0.1 g) adsorbents (Supelco) (Kännaste et al., 2014). A volume of 6 L was sampled for 30 min intervals once or twice a day using flow-controlled pumps operating at 200 mL min−1 (1003-SKC, SKC Inc., Houston, TX, USA). A total of 24 samples were collected during the FIGAERO-CIMS measurement period. After sampling, the cartridges were kept in a freezer and transported to the laboratory for GC-MS analysis at least twice a week. Adsorbent cartridges were analyzed with a combined Shimadzu TD20 automated cartridge desorber system linked to a Shimadzu 2010 Plus GC-MS instrument. A more detailed description of the analytical method can be found in Noe et al. (2012).
A proton-transfer-reaction time-of-flight mass spectrometer (PTR-ToF-MS) was also used to monitor the VOC concentrations. The PTR-ToF-MS data were pre-processed (using 10 min averaging) with tofTools software (Junninen et al., 2010) for peak shape, mass calibration, unit mass resolution (UMR) stick integration and resolution function. In this software, a quadratic function with five masses (corresponding to NH3H+, H2[18O]H+, O[18O]+, C3H6OH+, C7H8H+ and C10H16H+) was used for mass calibration. Altogether, 238 peaks were identified in this study.
Additional PM1 size distribution measurements were performed at the measurement site using a scanning mobility particle sizer (SMPS, TSI Inc. model 3938, with electrostatic classifier 3082, differential mobility analyzer 3081A, aerosol neutralizer 3077A and condensation particle counter 3776). The impactor D50 was 800 nm. The scan time of size distribution in the range 14–737 nm was 5 min and the size resolution 64 channels per decade. For comparison purposes, the particle number concentration (PNC) measured by SMPS was converted into particle mass concentration (PMC), assuming a particle density of 1.3 g cm−3.
Meteorological data (temperature and relative humidity) and other relevant trace-gas concentrations (e.g., NOx, O3) were continuously measured at the sampling site at different heights (30, 50, 70, 90 and 110 m) of the SMEAR tower and meteorological data also at ground level (2 m) (Noe et al., 2015). Mixing height data were obtained from the NOAA website (ftp://arlftp.arlhq.noaa.gov/pub/archives/gdas1, last access: 13 October 2020). The sunrise and sunset times were obtained from the timeandate.com website (https://www.timeanddate.com/sun/estonia/tartu, last access: 7 December 2020).
2.3 FIGAERO-CIMS calibration
The FIGAERO-CIMS response function was determined by measuring known amounts of acetic acid (gas-phase mode) and glutaric acid aerosol (particle-phase mode). Threshold values for FIGAERO-CIMS concentrations were derived as 10 times the average values of 15 randomly chosen ions from the mass range of 800–1000 Th. More details can be found in the Supplement (Sect. S4).
The concentration of analytes was determined using the obtained calibration coefficients, with the assumption that all analytes have the same instrumental response and that sensitivity was close to the maximum (the sensitivity for glutaric acid in the particle phase corresponded to a gas-phase sensitivity of 11 normalized counts per second per pptv (ncps pptv−1); see additional information in Sect. S4). The main reason for this approach is the multitude of analytes that are measured in ambient air and the difficulty in finding authentic standards for most of those analytes. Besides molecular functionality, CIMS sensitivity depends on several instrumental factors, including the instrument parameters (e.g., inlet temperature and pressure), transmission efficiency, declustering strength and IMR (ion-molecule reaction unit) water vapor pressure (Lee et al., 2014); the latter may also change in response to environmental factors. In particular, for iodide-adduct CIMS, the instrument response depends on the analyte polarity (sensitivity increases with the addition of a polar group), hydrogen bonding capacity, molecular geometry and molecular size (Iyer et al., 2016; Lopez-Hilfiker et al., 2016). The ensuing considerable variations in sensitivity for compounds detectable in ambient samples and the susceptibility of some analytes to thermal decomposition are further reasons why we present results as semi-quantitative, even though we often report them as concentrations. Additional limitations associated with the analytical method used in this study are discussed in Sect. S5.
The volatility of organic aerosol components (expressed as saturation mass concentrations at 25 ∘C, C*) was obtained both based on the ion thermograms and by using a parameterization based on the elemental composition determined by soft-ionization high-resolution mass spectrometry techniques (Li et al., 2016). The thermogram-based volatility was determined as described by Ylisirniö et al. (2021). The temperature at the peak of the thermogram of each detected ion (Tmax) was converted to the corresponding saturation vapor pressure Psat using Eq. (1):
where a and b are fitted parameters from calibration measurements with atomized polyethylene glycols of known saturation vapor pressure (Krieger et al., 2018). The used calibration values for the fit are shown in Sect. S3. The calibration parameters were and (K−1). Psat values were converted to C* (µg m−3) by using the following:
where Mw is the molar mass of compound (in units of g mol−1) without iodide, R is the gas constant (8.3144 Pa m3 K−1 mol−1), and Tamb (K) is the ambient temperature (set to 298 K). As Psat can have significant uncertainties, an appropriate fitting method should be chosen that accounts for errors in both a and b variables. In our study, we used the bivariate least-squares method (York et al., 2004; Ylisirniö et al., 2021), which was implemented in MATLAB as shown in Pitkänen et al. (2016). The applied fit and its uncertainties are shown in Fig. S16.
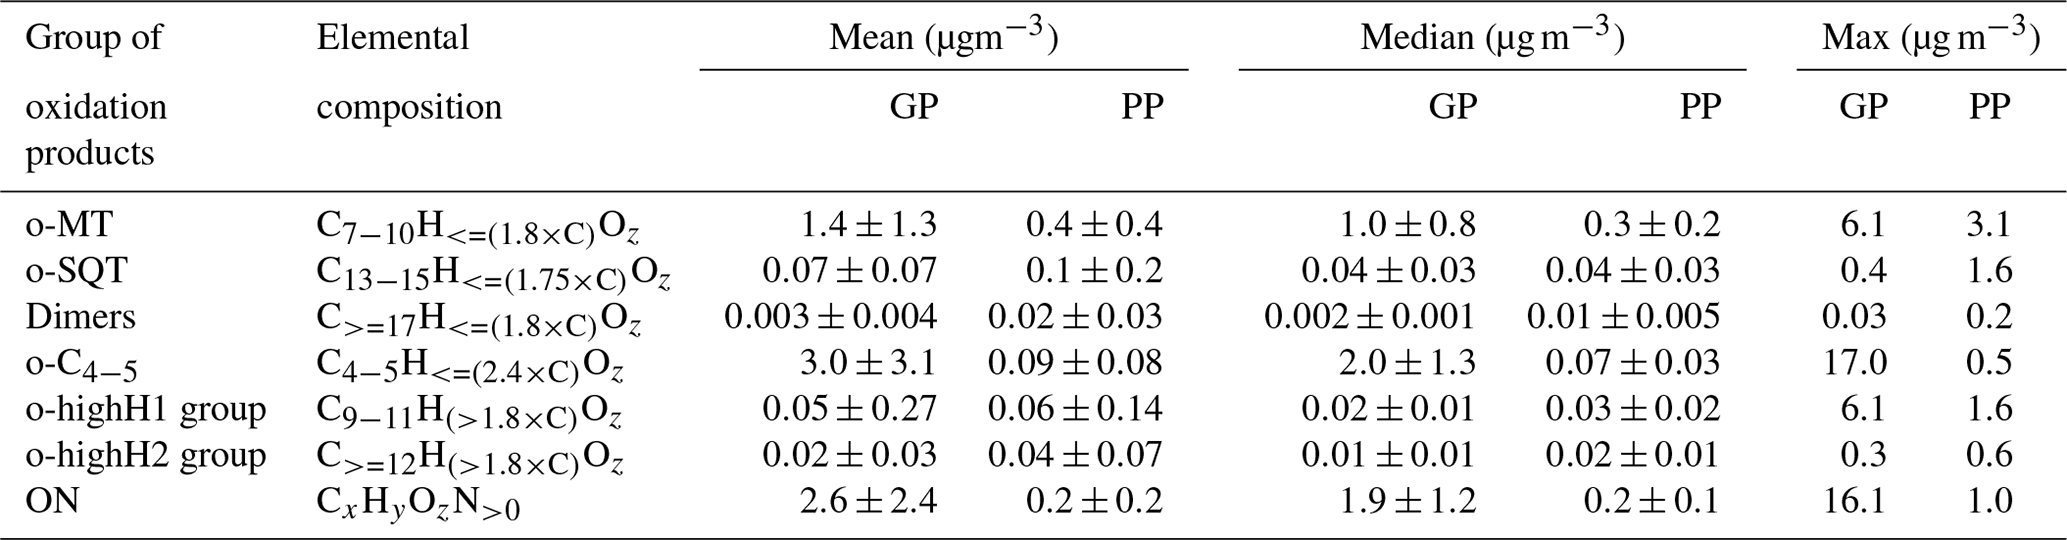
Table 1Groups of oxidation products defined for this study, based on elemental compositions, and their mean, median and maximum concentrations over the campaign period for gas-phase (GP) and particle-phase (PP) measurements. For details, see Sect. 2.4.
On the other hand, for the parameterization method, the volatility C0 was calculated for each detected compound by
where is the reference carbon number (25); nC, n0, nN and nS denote the numbers of carbon, oxygen, nitrogen and sulfur atoms, respectively; bC, bO, bN and bS denote the contribution of each atom to log 10C0, respectively; and bCO accounts for the carbon–oxygen non-ideality (Donahue et al., 2011; Li et al., 2016). The equation is based on a previous parameterization developed by Donahue et al. (2011) for CHO compounds but optimized in Li et al. (2016) to be applicable also for N- and S-containing compounds.
2.4 Grouping of chemical formulas to investigate terpene oxidation products
Since the purpose of this study was to investigate the role of different terpene oxidation products on SOA particle formation, the chemical formulas of identified compounds were grouped by their elemental composition according to the presumed precursor terpene classes (Table 1). Specifically, we presumed that compounds originated mostly from oxidation of monoterpenes (o-MT group) and compounds mostly from oxidation of sesquiterpenes (o-SQT group). This grouping was based on previous publications showing that the most characteristic and prevalent monoterpene and sesquiterpene oxidation products consist of C7−10 and C13−15, respectively (Yee et al., 2018; Chan et al., 2011; Kundu et al., 2017; Hammes et al., 2019; Hamilton et al., 2011; Zhang et al., 2015). For comparison purposes, other chemical formulas were also grouped, including , which include many conceivable dimers of monoterpene oxidation products but can also include diterpene oxidation products (dimer group), and (o-C4−5 group). These o-C4−5 compounds would presumably include many isoprene oxidation products but can as well comprise short-chained products from C–C bond scission reactions of mono- and sesquiterpenes, or, in the particle phase, products formed by thermal decomposition of larger, lower-volatility compounds during the desorption phase of the FIGAERO-CIMS analysis.

Figure 1Comparison between the total summed analytes (excluding reagent ions) measured in the particle phase by FIGAERO-CIMS and particle mass concentration (PM1) calculated from SMPS size distribution measurements (upper panel) and thermograms of the summed analytes during each FIGAERO cycle (lower panel). The black line represents the concentration-weighted Tmax for each measurement cycle.
The classification based on the number of H atoms (#H) was performed by considering the oxidative reactions of terpenes. For example, the oxidation of α-pinene, the prevailing emitted terpene at the sampling site (Fig. S2), has been found to generate oxidation products of up to #H = 18 (through a chain of reactions initialized by the OH/O3 attachment to the double bond) (e.g., X. Li et al., 2019). The same classification criterion was applied for other groups. However, the tentative identification of chemical formulas revealed the possible presence of compounds with an unusually high H:C ratio (higher than 18:10). Due to the limited CIMS resolution, their presence could not be definitely confirmed (Sect. S5), and thus these compounds were grouped and evaluated separately as (o-highH1 group) and (o-highH2 group). This division was performed to evaluate the possibility of these groups to represent monoterpene or sesquiterpene oxidation products, respectively, broadly based on their carbon numbers. However, the differentiation between monoterpene oxidation products, sesquiterpene oxidation products and monoterpene dimers is more challenging for these compounds since their mechanism of formation is unknown. Some of the major contributors to the o-highH1 group, such as C10H20O6, C10H20O7 and C10H22O7, have been previously connected to wet and acidic isoprene-derived SOA (Riva et al., 2016) and/or assigned as monoterpene SOA (Zhang et al., 2018). The major C11 species feature even more H, e.g., C11H24O7, and hence are more likely related to the high-H C10 species rather than products of sesquiterpene oxidation. Therefore these C11 species were also grouped into o-highH1. Provided that the species grouped into o-highH1 and o-highH2 were correctly identified, the chemical pathways to those highly to fully saturated compounds require more investigation in the future.
Organonitrates were classified as CxHyOzN>0 (ON group) and compounds that did not fit any of the afore-mentioned groups, such as inorganics (e.g., HNO3, H2SO4) and small thermal-decomposition products (but excluding reagent ions), were classified as “others”.
In this study, gas- and particle-phase chemical compositions and concentrations were measured to assess the contribution of sesquiterpene oxidation products to SOA formation. A campaign overview is firstly presented and an in-depth investigation of periods with high aerosol particle mass loadings, recorded during the period from 13 to 18 May 2018, is subsequently described.
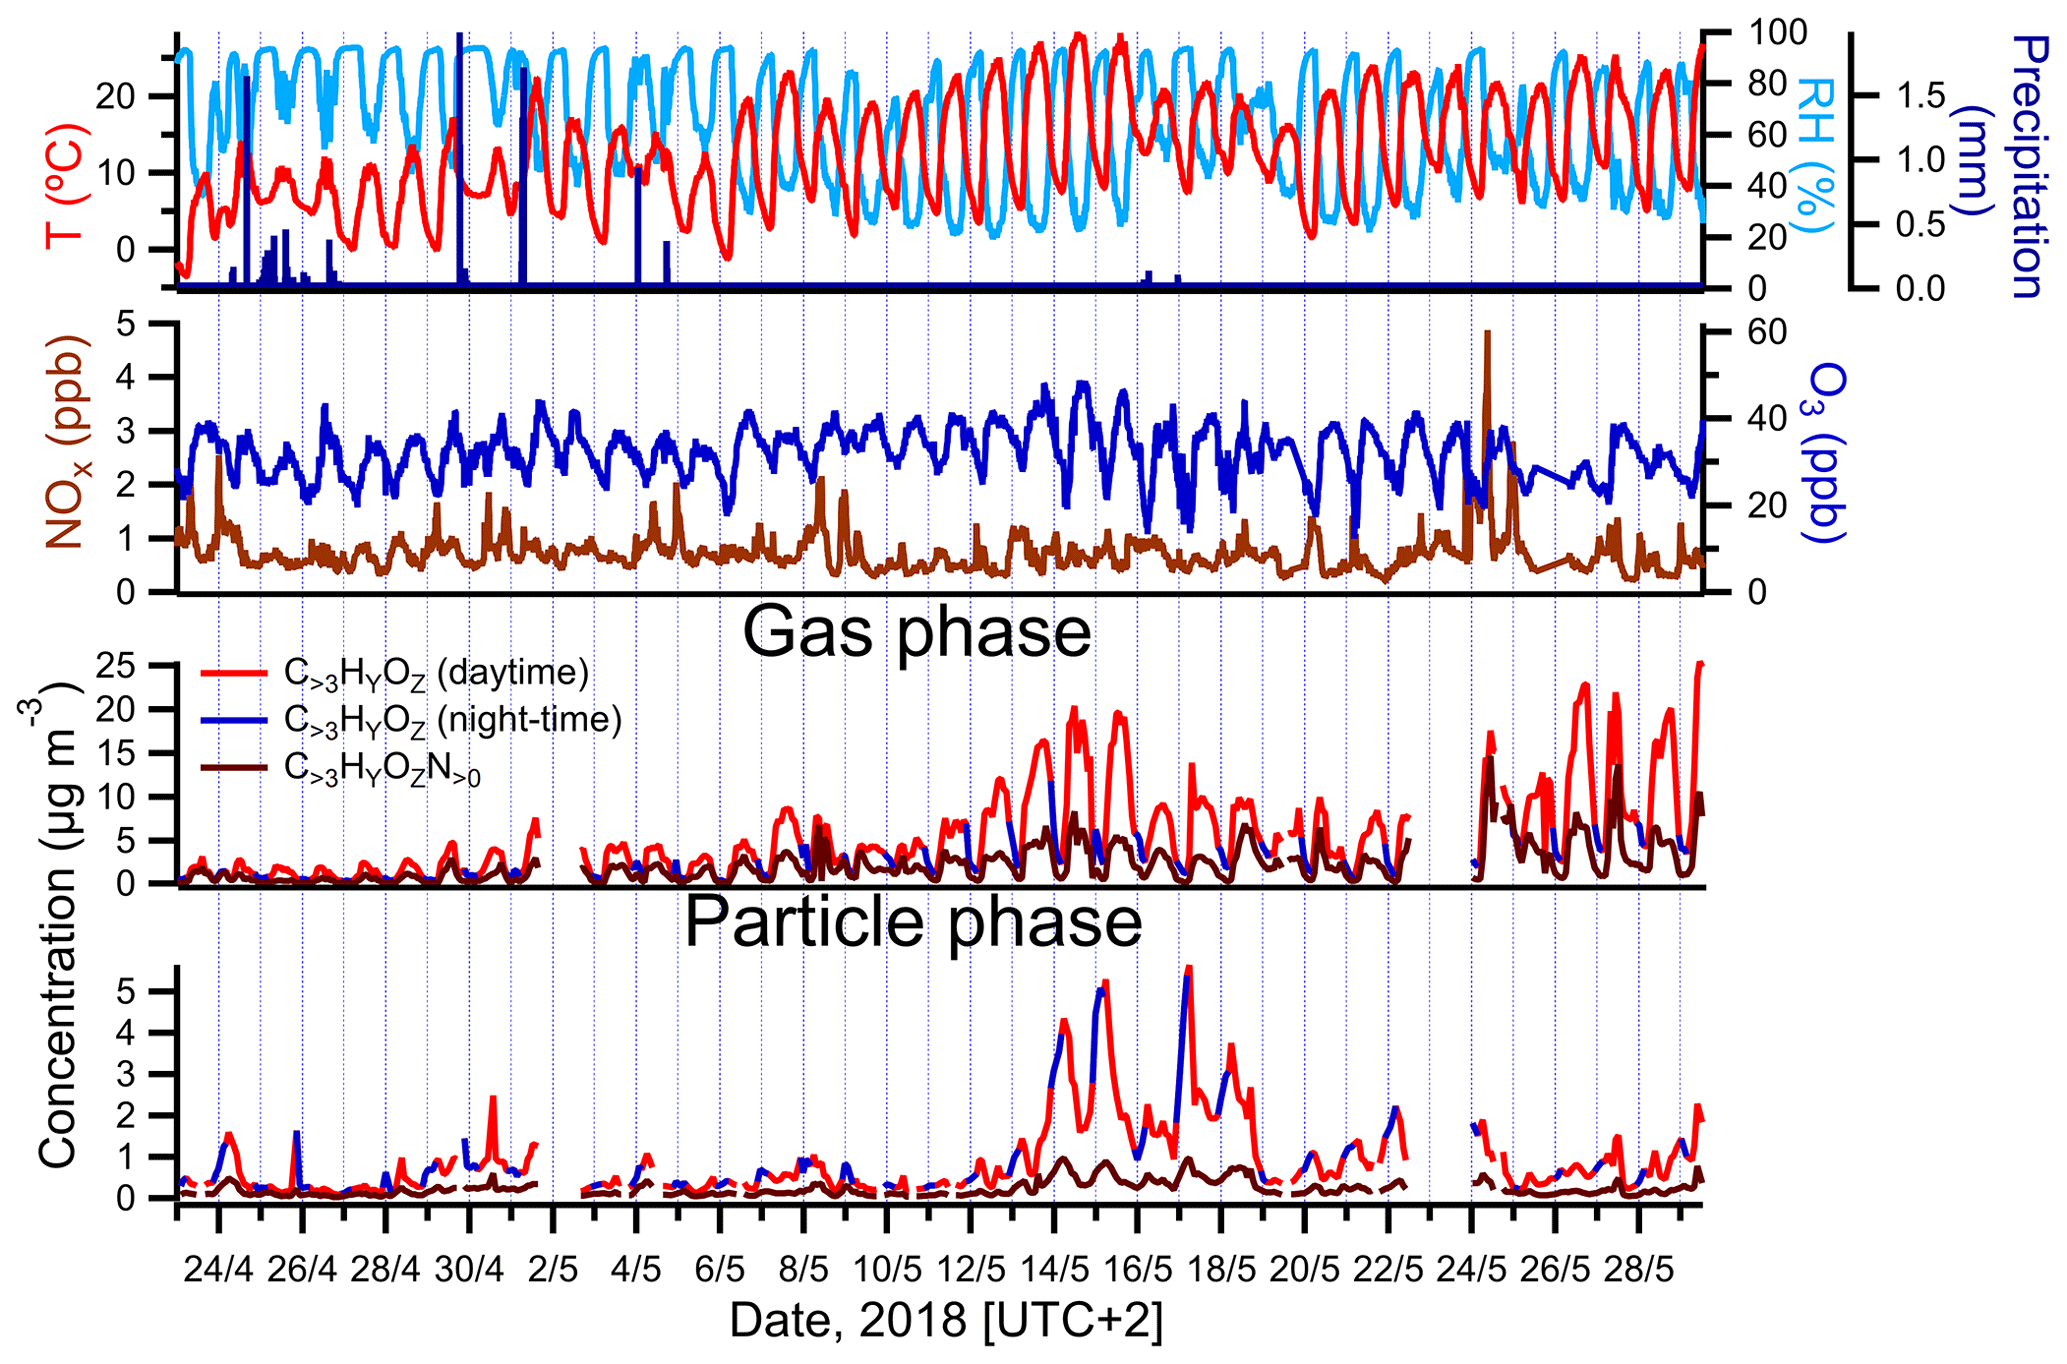
Figure 2Campaign-spanning comparison between concentrations of larger oxygenated organics measured in the gas and particle phases by FIGAERO-CIMS and colored by time periods of the day (daytime is indicated in red; nighttime is in blue). The evolution of air temperature, RH, precipitation, ozone (O3) and nitrogen oxides () is shown as well.
3.1 Campaign overview
3.1.1 Atmospheric particle- and gas-phase concentrations
The summed mass concentrations of analytes in the particle phase, measured by FIGAERO-CIMS, were compared with PM1 determined by SMPS. As seen in Fig. 1, the summed particle-phase analyte concentrations tracked the changes in SMPS-derived PM1, broadly validating our analytical method and suggesting that PM1 was dominated by organic aerosol (OA) throughout the campaign. The determination coefficient R2 between both techniques was 0.73 (Fig. S3; note that SMPS hourly median values were used for comparison with CIMS data). However, a significant difference in absolute concentrations was observed between the results obtained by the mentioned techniques, with PM1 measured by SMPS being about 4 times higher than the one measured by FIGAERO-CIMS. The differences may be attributed to the increasing selectivity of iodide CIMS with analyte polarity, the fact that detection with FIGAERO-CIMS is limited to analytes that can be thermally desorbed from the filter and uncertainties in the calibration procedure (see Sect. S4).
The highest PM1 concentrations occurred between 13 and 18 May (Fig. 1). The observed increase in particulate mass during that time period was consistent with an overall increase in temperature and photosynthetically active radiation (PAR), the chief drivers of BVOC emissions. A comparison between the sum of gas- and particle-phase concentrations of larger oxygenated organics (C>3HyOz) and organonitrates (), measured by FIGAERO-CIMS and presumably originated mostly from terpenes oxidation, and atmospheric parameters associated with BVOC emissions and/or SOA concentration (temperature, relative humidity (RH), precipitation, NOx and O3), is shown in Fig. 2. Particle-phase oxidation products were generally higher during the night, with concentrations starting to increase in the late evening and reaching the maximum during early morning (Fig. 2). On the other hand, gas-phase oxidation products peaked during daytime (Fig. 2). The high PM1 values during nighttime are likely explained by the decrease in mixing height of atmospheric boundary layer and temperature during that period of the day as commonly observed (e.g., Barreira et al., 2021). Although the production of oxidation products occurred predominantly during daytime, the decrease in mixing height during night causes a near-surface accumulation of VOCs, oxidants, oxidation products and aerosol particles, which in combination with the decrease in temperature enhances the partitioning of oxidized compounds and thus favors the formation of SOA particles (e.g., Hao et al., 2018).
The chemical composition measured by FIGAERO-CIMS appears to support an influence from locally produced BVOC oxidation products since a decrease in concentration-weighted O:C was generally observed in the particle phase (Fig. S4) during nighttime. However, the higher presence of low oxygenated products in the particle phase could be also caused by more volatile compounds partitioning into the particles due to cooler temperatures observed during that period of the day.
3.1.2 Chemical characterization of gas- and particle-phase atmospheric constituents
During this study, a total of 1375 formulas of chemical compounds were tentatively identified in gas-phase and 1380 in particle-phase measurements by FIGAERO-CIMS (above the threshold values, Sect. 2.3). Among those, CHO compounds clearly dominated, constituting 68 % of measured gas-phase and 78 % of particle-phase concentrations on a campaign-wide average (Fig. S5). The second largest group of aerosol constituents were organonitrate (CHON), molecules, with percentages of 9 % and 18 % in the gas and particle phases, respectively, while organosulfates (CHOS) and nitroxy organosulfates (CHONS) contributed less than 4 % to total measured concentrations for both gas and particle phases. Other compounds, excluding reagent ions, constituted 22 % of gas-phase (mostly HNO3) and 1 % of particle-phase concentrations. The predominance of CHO compounds was expected due to the specificity of iodide chemical ionization for oxygen-containing functional groups, especially those containing −O–H moieties (e.g., Lee et al., 2014).
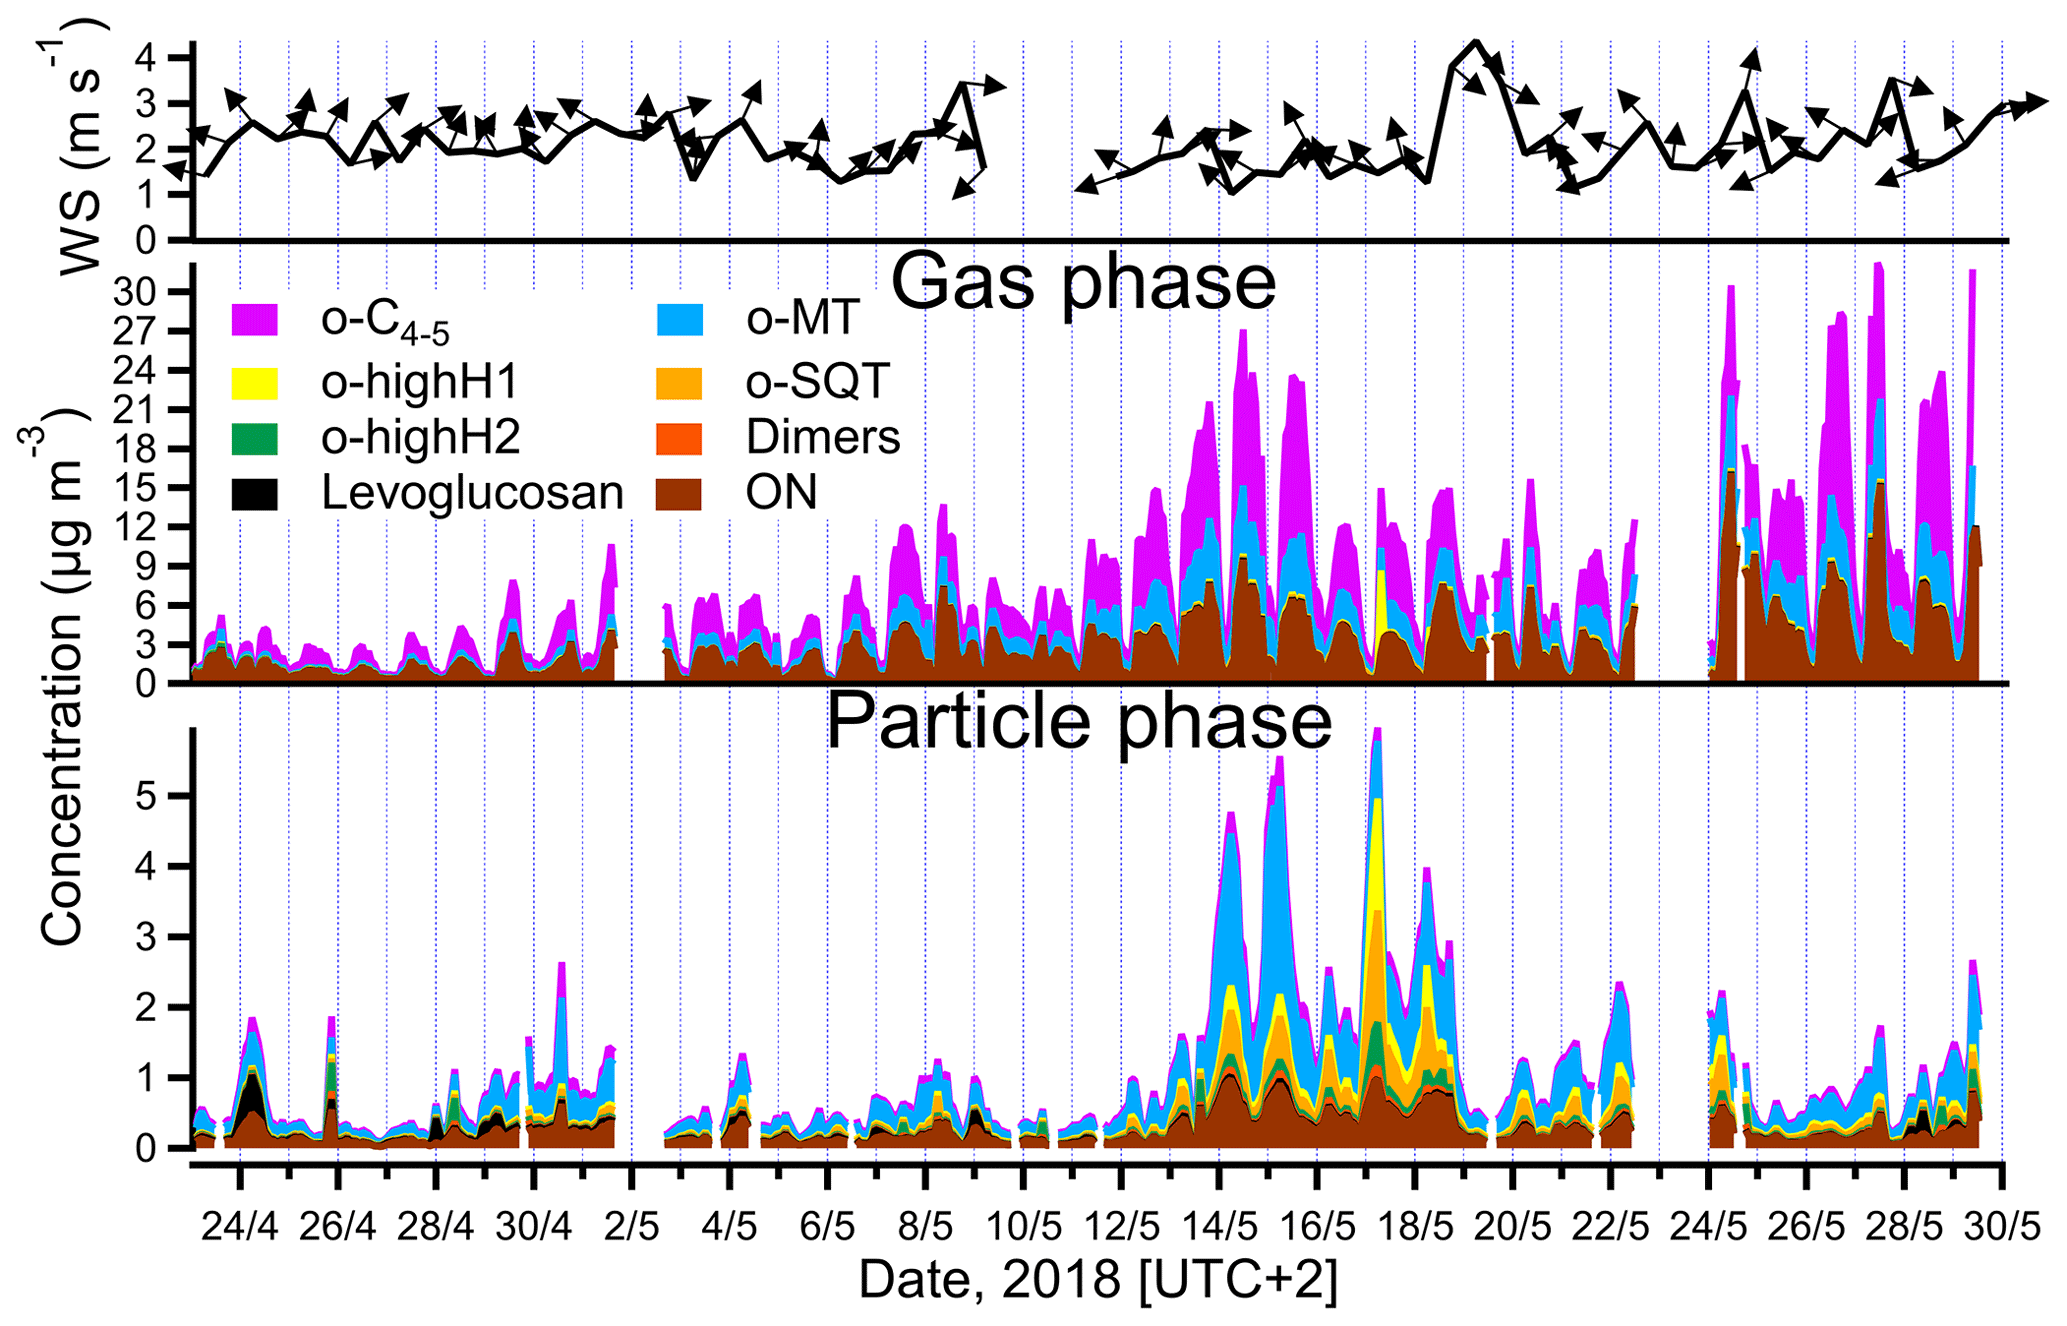
Figure 3Total mass concentrations of different groups of analytes measured in the gas and particle phases (middle and lower panels) by FIGAERO-CIMS and summed all over the groups listed in Table 1, and wind speed and wind direction (upper panel, 12 h averaged). The group of other measured compounds is excluded for clarity (note that o-highH1 and/or o-highH2 could be misidentified o-SQT/dimers; see text for details).
The time series of total concentration of compound groups (defined in Sect. 2.4 and listed in Table 1), obtained for particle- and gas-phase measurements, are shown in Fig. 3. The mean, median and maximum concentrations of the defined groups are presented in Table 1. Monoterpene oxidation product (o-MT) and sesquiterpene oxidation product (o-SQT) groups were the particle-phase constituents with highest concentrations during the full campaign period (Fig. 3). The o-MT was the dominant constituent during the campaign, reaching a maximum particle-phase concentration of 3.1 µg m−3 (Table 1, Fig. 3). However, important concentrations of particulate o-SQT were also measured during a significant period of the campaign (6.5–24.5), with maximum concentrations of 1.6 µg m−3. Interestingly, the highly hydrogenated groups also reached high concentrations in the particle phase, with concentrations of up to 1.6 and 0.6 µg m−3 for o-highH1 and o-highH2, respectively. Organonitrates reached concentrations of up to 1.0 µg m−3. The smaller contribution of organonitrates, when compared to the sum of CHO aerosol particle constituents, is expected due to the low anthropogenic influence (e.g., from traffic) at the measurement site, as confirmed by the relatively low NOx levels (Fig. 2 for NOx). The changes in ON concentration were then likely dependent on long-range transport or periodic episodes of anthropogenic pollution. The maximum particulate concentration of the o-C4−5 group was 0.5 µg m−3, while the particulate concentration of dimers was up to 0.2 µg m−3. The low dimer concentration in the particle phase indicates that the contribution of diterpene/monoterpene dimer products to atmospheric particulate mass was small or that those products were particularly susceptible to thermal decomposition or fragmentation in the measurement process. However, these high molecular weight constituents might still have played an important role in new particle formation due to their expected extremely low (or “ultra-low”) volatility and consequent potential to form aerosol nuclei (Lehtipalo et al., 2018; Schervish and Donahue, 2020). Other measured analytes had a contribution to aerosol particulate mass of up to 1.2 µg m−3.
For the gas phase, o-C4−5 were the dominant compounds with concentrations of up to 17.0 µg m−3 (3.6 ppbv), followed by ON with up to 16.1 µg m−3 (2.3 ppbv) and o-MT which reached 6.1 µg m−3 (0.8 ppbv). Although ON reached high concentrations in the gas phase, the higher concentrations occurred mostly during traffic pollution events since ON exhibited the same trends as NOx during those event periods (Fig. 2). All other constituent groups were present in gas-phase concentrations below or equal to 0.4 µg m−3 (0.04 ppbv). An exception was observed for o-highH1, which had few concentration spikes with a maximum of 6.1 µg m−3 (0.6 ppbv). However, these spikes occurred after high concentrations measured in particle-phase mode, and a carryover from previous aerosol measurements cannot be excluded since the volatility of these compounds is probably very low. As they only occur in brief spikes, they will not be captured by the regular blank measurements and cannot be accounted for.

Figure 4Amounts of sesquiterpenes (bottom left) and monoterpenes (bottom right) measured by PTR-ToF-MS, the total concentration of sesquiterpene and monoterpene oxidation products (o-SQT and o-MT), as well as o-highH1, o-highH2 and dimers, in the particle phase measured by FIGAERO-CIMS (middle), and meteorological parameters (temperature, PAR), mixing height (model-derived) and ozone mixing ratios (top) at the sampling site during the events. The 137 and 205 were used as proxies for monoterpenes (C10H16H+) and sesquiterpenes (C15H24H+), respectively. Note the different axes for sesquiterpenes and monoterpenes.
The particle-phase o-SQT concentrations were higher than in the gas phase. This result seems to indicate that, generally, sesquiterpene oxidation products partition favorably to the particle phase, which is corroborated by the theoretical equilibrium constants of these relatively large compounds that indicate essentially irreversible condensation (e.g., Joensuu et al., 2016). Vice versa, the o-C4−5 group of analytes was much lower in the particle phase than in the gas phase. These smaller compounds are expected to have higher volatility than monoterpene and sesquiterpene oxidation products, which makes the partitioning into the particle phase more difficult (Donahue et al., 2012). An exceptional increase of C6H10O5 in the particle phase was observed for some short (< 1 d) episodes, in particular in the beginning of the campaign, with a concentration of up to 0.5 µg m−3, contributing significantly to OA. This molecular formula is likely associated with levoglucosan, which is a well-known wood-burning tracer (e.g., Helin et al., 2018). Considering the high atmospheric stability of levoglucosan (e.g., Fraser and Lakshmanan, 2000), and since increased C6H10O5 concentrations were not observed in the gas phase, it is likely that a long-range transport episode of particulate matter was the cause of high measured concentrations of this constituent. The biomass burning aerosol particles likely originated in eastern Europe since the dominant wind direction was from southeast at the time of the episode (Fig. 3).
3.2 In-depth investigation of periods with high organic aerosol mass loadings (13–18 May)
As pointed out above, high aerosol particle loadings occurred between 13 and 18 May 2018. An in-depth analysis of the aerosol particle composition and volatility is performed in this section for this noteworthy period. Three distinct subperiods were chosen, involving times when monoterpene oxidation products were dominating over sesquiterpene products (event A), when sesquiterpene oxidation products were prevailing (event B) and when their concentrations were similar (event C) (Fig. 4). In Fig. 4 (middle panel), the total particulate concentrations of the entire groups of sesquiterpene and monoterpene oxidation products (o-SQT and o-MT), of compounds with an unusually high H:C ratio (o-highH1, o-highH2) and of dimers measured by FIGAERO-CIMS in the particle phase are given. The single FIGAERO-CIMS measurement cycles corresponding to the concentration maxima of each event were used for the following analysis.
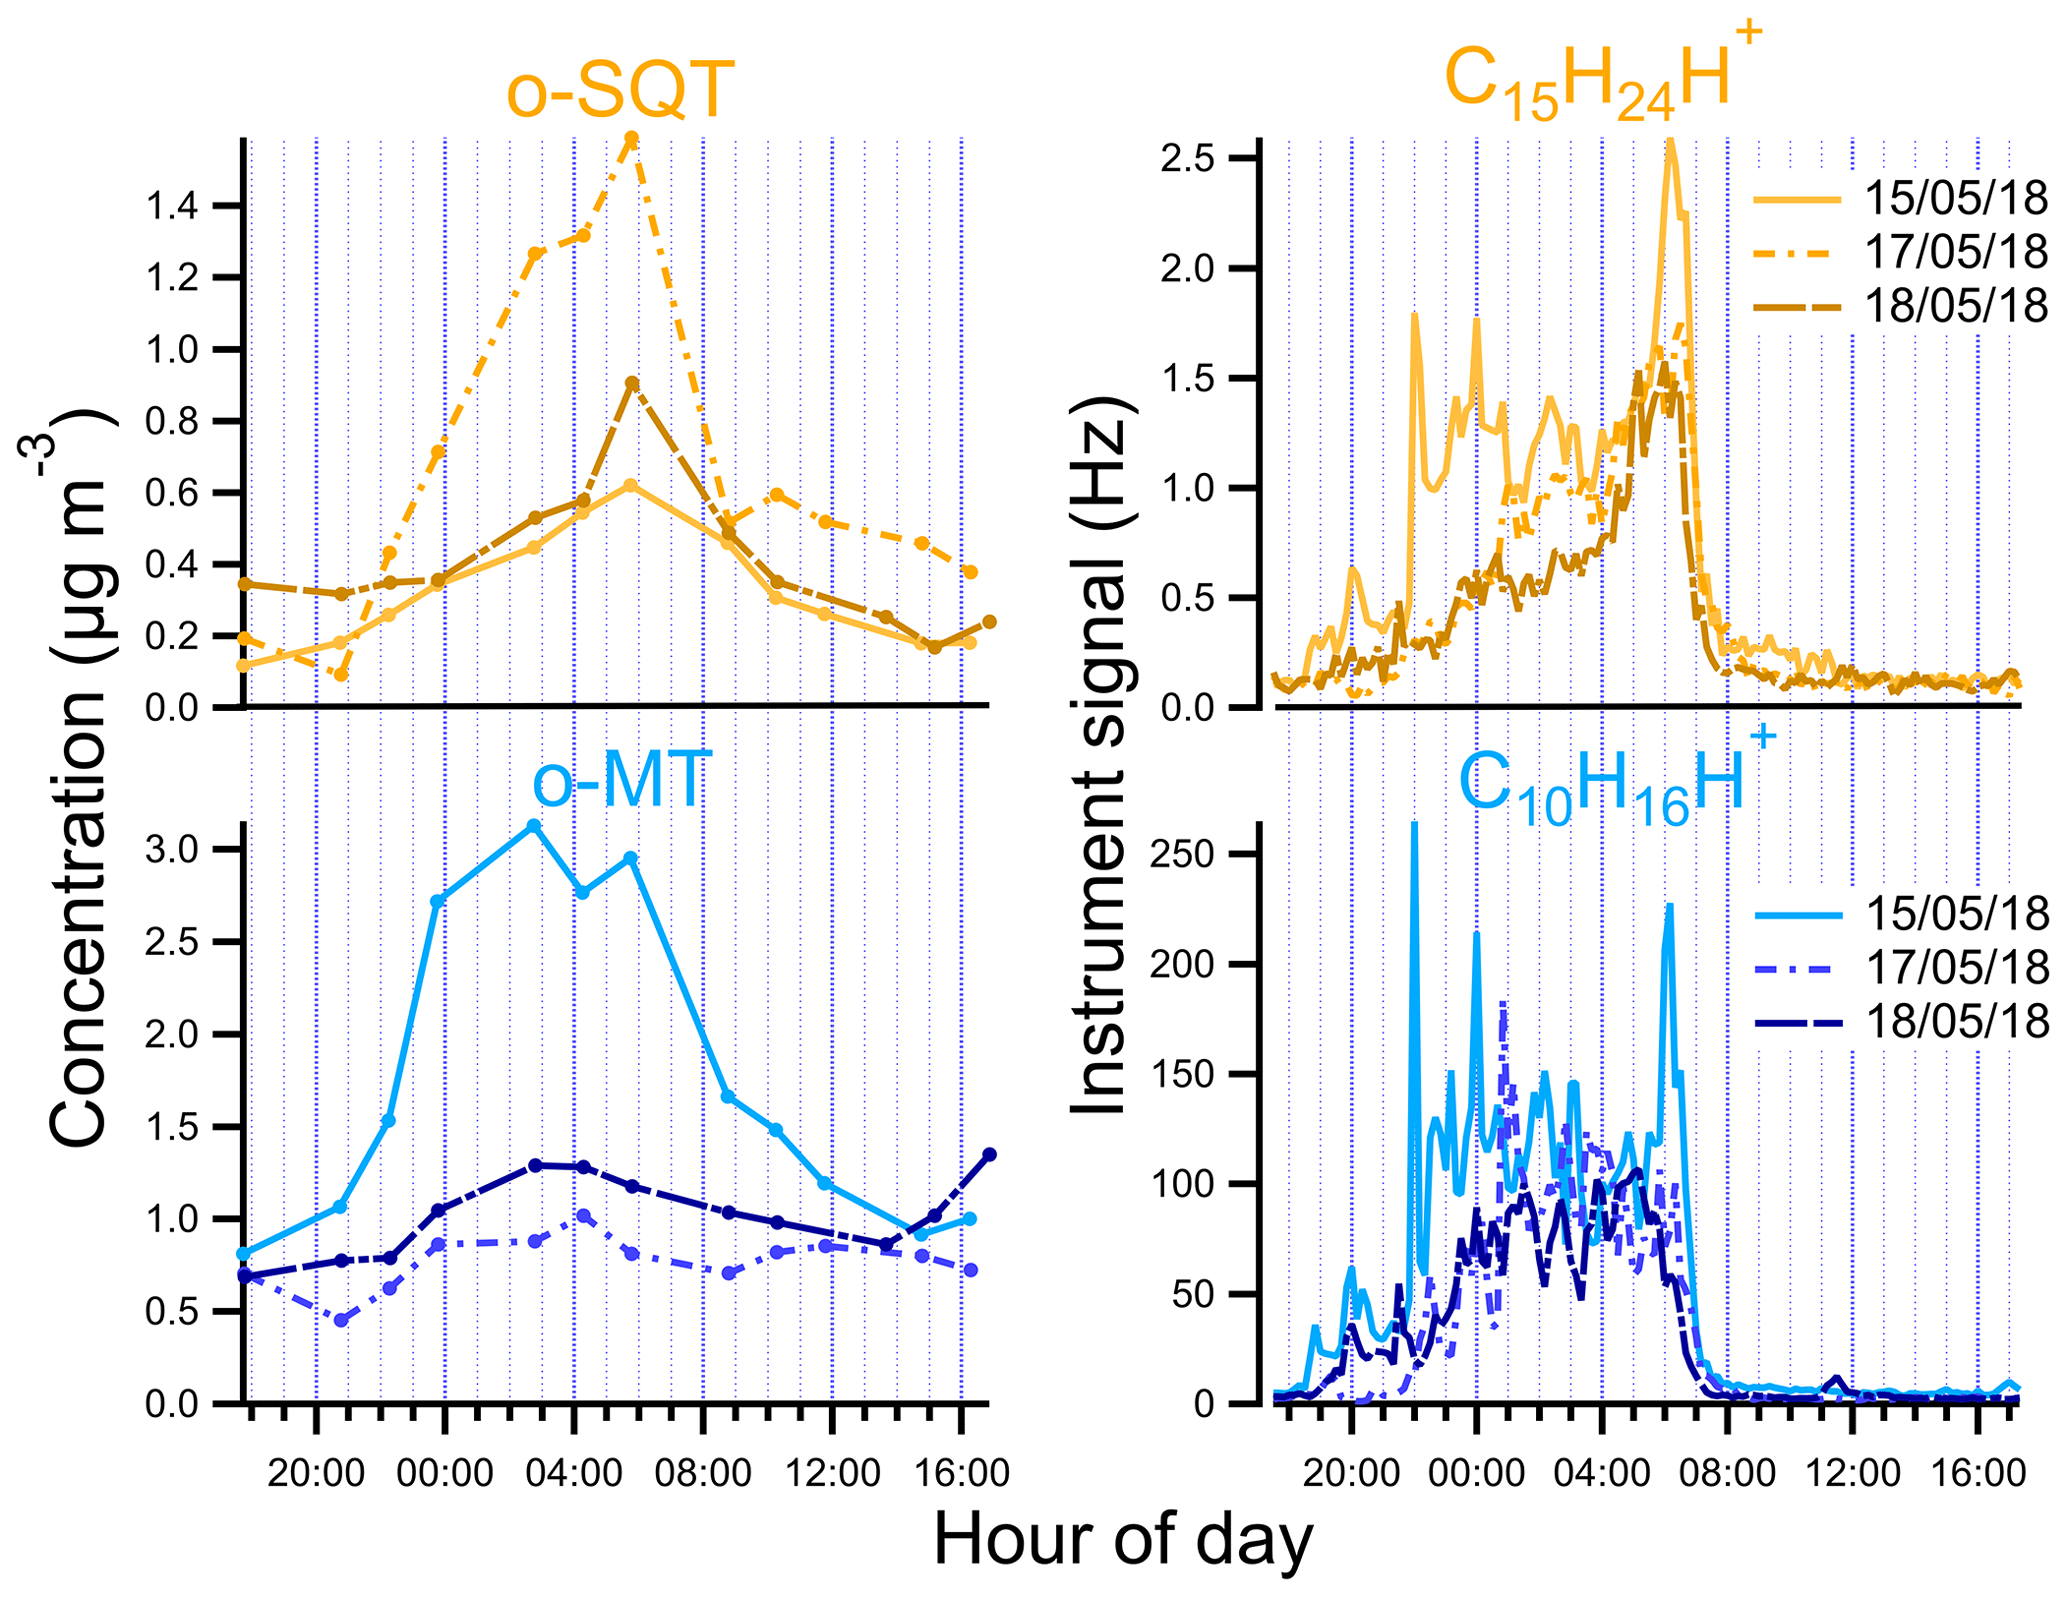
Figure 5Diurnal variation of o-SQT and o-MT in the particle phase measured by FIGAERO-CIMS and of sesquiterpenes (C15H24H+) and monoterpenes (C10H16H+) measured by PTR-ToF-MS during the events described in this study.
3.2.1 Early morning concentration maxima of sesquiterpene oxidation products
We looked in more detail at the time series of the presumed monoterpene and sesquiterpene oxidation products, as measured by FIGAERO-CIMS, during the period from 13 to 18 May, including a comparison with concomitant measurements of precursor VOCs by PTR-ToF-MS, O3 concentrations, air temperature, PAR and mixing height (Fig. 4; the same overview is shown for the whole campaign period in Fig. S6). For both monoterpenes and sesquiterpenes, a distinct diel pattern was observed (Fig. 5), somewhat similar to that of the aerosol particle mass loading (e.g., Fig. 1). The concentrations of these terpene classes started to increase during the evening (between 19:00 and 22:00 EET – Eastern European Time). This increase was driven by changes in both boundary layer and chemistry, since the mixing height decreases after sunset and enhances the reactivity between concentrated BVOCs and atmospheric oxidants (Praplan et al., 2019). The nocturnal decrease in mixing height also affects near-surface aerosol loadings. The particle-phase concentrations of monoterpene oxidation products increased with monoterpene concentrations, revealing the importance of nighttime oxidation for the formation of condensable vapors from monoterpenes. Furthermore, decreasing temperatures during nighttime enhance the partitioning of oxidation products from the gas to the particle phase (Z. Li et al., 2019). However, decoupling this range of concurring chemical, physical and meteorological mechanisms driving the overall SOA loadings is beyond the scope of our study.
The increase in monoterpenes was often followed by an increase in sesquiterpene amounts (Fig. S6), suggesting that they were subjected to similar sources and sinks for most time periods. Interestingly, unlike for the monoterpenes, the maxima of sesquiterpene concentrations were observed consistently around 06:00 EET between 13 and 18 May (Figs. 4 and 5). We are unaware of previously published observations of this phenomenon, although a dataset from a recent study of terpenes in the French Landes forest may suggest an increase in sesquiterpene emissions during early July mornings as well (H. Li et al., 2020). In our study, we observed sesquiterpene spikes during many mornings from 6 May until a break in PTR-ToF-MS measurements on 21 May, so these spikes may be a common phenomenon possibly related to a certain plant phase in spring. A possible reason for the general increase in sesquiterpene emissions observed in May could be related to plant growth. The active plant growth period (daily average air temperature consistently above 10 ∘C) in Jõgeva (75 km NW from the Järvselja SMEAR station) had started on 6 May (Keppart, 2018). This temperature increase was also observed in our data (e.g., Fig. S6), as expected due to the proximity of the Järvselja SMEAR station to Jõgeva. For that reason, it is likely that active plant growth in our study started at about the same time. Furthermore, the meteorological summer (daily average air temperature consistently above 13 ∘C) in Jõgeva had started on 10 May (Keppart, 2018). This consistent increase in temperature might have triggered the springtime recovery period. Nemecek-Marshall et al. (1995) have found morning emission bursts of methanol that were related to the leaf growth. Jardine et al. (2016) have also reported methanol and isoprene emissions related to growth processes from Amazonian tree species. Therefore, sesquiterpene emissions resulting from plant growth are also possible, especially since plant growth at the measurement site usually occurs during morning hours in mid-May. Since sesquiterpenes have a higher Henry's law constant than monoterpenes (Copolovici and Niinemets, 2015), one could also speculate that they are more efficiently retained in plants or on surfaces under stagnant nocturnal conditions, which might then trigger a more pronounced increase in concentrations at some distance from the canopy space (and to the PTR-ToF-MS inlet). The increase in sesquiterpenes coincided with the minimum in O3 concentration. In a study performed at a boreal forest site in Hyytiälä, Finland, Hellén et al. (2018) showed that, whereas the chemistry of monoterpenes is dominated by reactions with OH and NO3 radicals, sesquiterpenes react mostly with O3. Thus, the minimum in O3 concentrations may enhance the sesquiterpene concentration more strongly than the monoterpene one during the time around sunset.
The peak concentrations of particulate o-SQT compounds aligned with the maxima in sesquiterpene concentrations and dips in O3 levels, occurring later than the peak for particulate o-MT compounds. This practically immediate response of SOA particle loading and composition to the increase in sesquiterpene emissions reveals the importance of sesquiterpenes to SOA formation/production during spring and broadly verifies the classification applied in this study. The maximum SQT / MT ratio in the period of time when o-SQT increased was 0.018 for event A, 0.024 for event B and 0.018 for event C, with the maximum occurring close to the peak in o-SQT for events B and C (Figs. 4 and S7a). The increase in gas-phase SQT relative to MT started around 04:00 EET for events B and C, which coincided with the referred increase in o-SQT particulate concentrations (Figs. 4 and S7a, b). The concentrations of particle-phase o-highH1 and o-highH2 were increasing simultaneously with that of o-SQT, which suggests that these groups correspond at least partially to sesquiterpene oxidation products (either actually or resulting from misidentifying of chemical formulas of compounds; Sect. S5 and Fig. S8). For that reason, it is likely that the particle-phase concentration of o-SQT, and hence their contribution to the SOA particle composition, is still underestimated in this study. Similarly, the group of dimers followed the concentrations of presumable sesquiterpene oxidation products as well. Since this group may include diterpene oxidation products, it is possible that these compounds were produced by processes similar to those of the sesquiterpene oxidation products. However, misidentification in detriment of sesquiterpene oxidation products is possible for this group of compounds as well.
A comparison between isoprene measured by PTR-ToF-MS and particle-phase o-C4−5 was also performed, as most condensed isoprene oxidation products are expected to be found as o-C4−5. The particle-phase o-C4−5 increased with gas-phase isoprene concentrations, at least during the 13 to 18 May period (Fig. S6). Isoprene and o-C4−5 were high during event A when the particle-phase o-MT group dominated but were low during the sesquiterpene event (B). However, this group can significantly include decomposition products of both o-MT and o-SQT and for that reason the contribution of isoprene oxidation to the observed events cannot be determined with the methodology of this study.
3.2.2 Relative contributions of the different terpene oxidation product groups
During the selected events of the period from 13 to 18 May 2018 (Fig. 4), the relative significance of o-MT and o-SQT in the particle phase measured by FIGAERO-CIMS was evaluated by dividing the corresponding concentrations by the total sum of these two groups. In event A, the contribution of o-MT relatively to o-SQT was clearly higher, with a percentage of 83 %. However, this contribution changed significantly during event B when the o-SQT relative contribution increased sharply, from 17 % to 66 %. The levels of these two groups of oxidation products were similar in event C, with 56 % of o-MT and 44 % of o-SQT. The o-highH1 and o-highH2 concentrations increased during event B and were lower during event A, also suggesting that at least some of the analytes in these groups stem from sesquiterpene oxidation (see Sect. 3.2.1 and S5). On the other hand, the changes in contribution from the groups ON, o-C4−5 and “others” were less significant between events.
The contribution of monoterpene and sesquiterpene oxidation products to SOA particles was mostly dominated by only a few chemical compounds with respective formulas (Fig. 6; note that this analysis assumes that all analytes have similar instrument sensitivity – see Sect. 2). For o-SQT, the 10 most abundant chemical compounds constituted 58.7 % to 65.3 % of the total concentration of these oxidation products in SOA particles (109 chemical formulas identified in total) during events A–C, with higher contributions during events B and C when the total concentrations of sesquiterpene products were also higher. For o-MT, the 10 dominant chemical compounds contributed about 40 % to the sum of o-MT products by mass (170 different chemical formulas in total), with a higher percentage of 46.6 % being observed during event A when the monoterpene oxidation products prevailed.

Figure 6Mass-based contribution of the 10 most abundant chemical compounds (with respective formulas) to all sesquiterpene (o-SQT, upper row) or monoterpene oxidation products (o-MT, lower row), determined by FIGAERO-CIMS, during the studied events (A, B and C) (see Fig. 4). Note that the chemical formulas differ between the events. The percentages below each of the six subplots indicate the mass-based contribution of the remaining sesquiterpene and monoterpene oxidation products.
Another interesting observation is that most of the 10 prevailing compounds of particulate o-MT and o-SQT were present in all three events on 15, 17 and 18 May, although the particles were formed on different days and consequently under slightly different atmospheric conditions and reactant concentrations (see, e.g., Figs. 4 and S2). Apparently, those specific products (presented in Fig. 6) have either a particularly high atmospheric production or a high tendency to partition from the gas to the particle phase, or both. This observation particularly applies to the sesquiterpene products, as the relative contribution of the 10 most abundant chemical compounds was higher for o-SQT than for o-MT. This result is somewhat unexpected since, generally, the structural diversity of sesquiterpenes exceeds that of monoterpenes due to the many more types of cyclization that are possible with the five additional carbon atoms (Langenheim, 2003). However, the actual structure of the terpenes may also play an important role, since, e.g., cyclic terpenes have been shown to produce more SOA than acyclic ones (e.g., Ylisirniö et al., 2020).
The o-SQT compounds that contributed the most to the aerosol particle composition were C15H24O3 and C14H22O4. These compounds have been identified as the major primary oxidation products formed from β-caryophyllene ozonolysis in a laboratory study performed under atmospherically relevant conditions (Li et al., 2011). In fact, in Li et al. (2011), the first was found as a major first-generation ozonolysis product, which seems to indicate a recent atmospheric formation. Gas-phase samples at our sampling site suggested that the most abundant sesquiterpene specie during the sesquiterpene event (B) was longifolene-(V4) (Fig. S2). Note, however, that these GC-MS terpene speciation measurements used 30 min collections of VOCs at varying times of day, whereas our defined events (A–C) all occurred during nighttime/early morning. Also, no VOC samples were collected for GC-MS analysis during the actual day of event B (17 May). The species formed during atmospheric oxidative reactions of longifolene-(V4) are currently unknown but, with its cyclic structure and endocyclic double bond, products similar to those from β-caryophyllene might be formed. Interestingly, C15H24O3 seemed to have a particularly important role in the increase of sesquiterpene-dominated SOA particulate mass, since its relative contribution was highest during the sesquiterpene event (B).
Among the monoterpene oxidation products, C8H12O5 and C7H10O5 were the dominant ones for all three investigated periods. These compounds have been found in another study performed at a boreal forest site in Hyytiälä, Finland, by employing the same method of FIGAERO-I-CIMS (Lee et al., 2018). Both products have been also found in controlled laboratory studies on the oxidation of monoterpene species using FIGAERO-CIMS, such as from limonene (Hammes et al., 2019), α-pinene (D'Ambro et al., 2018), or Δ3-carene (Z. Li et al., 2020).
3.2.3 Evaluation of chemical compositions measured by FIGAERO-CIMS, GC-QToF-MS and LC-QToF-MS
Offline filter measurements of SOA particle composition by Q-ToF mass spectrometry provide higher mass resolution when compared to FIGAERO-CIMS. For that reason, offline measurements were also performed by GC-QToF-MS and LC-QToF-MS to support the investigations with chemical formulas attributed in the FIGAERO-CIMS analysis. The LC-QToF-MS measurements performed in negative ionization mode detect mostly acidic species, including many carboxylic acids. These compounds are also detected by FIGAERO-I-CIMS, which is highly sensitive to acidic oxygenated species and generally to most species with multiple -OH moieties (e.g., Lee et al., 2018). However, LC-QToF-MS measurements performed in positive ionization mode and GC-QToF-MS measurements performed in negative mode were also included in this study since, besides being capable to identify additional compounds measured by FIGAERO-CIMS, they can as well identify SOA constituents that FIGAERO-CIMS is less or not sensitive to. For example, LC-QToF-MS measurements in positive ionization mode are particularly suitable for the detection of basic compounds, while GC-QToF-MS performed in negative mode can measure several aromatic molecules in complex samples with high sensitivity. Therefore, the combination of the offline mass spectrometry techniques employed in this study allowed the sensitive ionization and detection of a wider range of compounds.
Figure S9 gives an overview of the chemical composition measured by the three techniques employed in this study for the chemical characterization of the SOA particle phase. The focus was on events A (o-MT dominant) and B (o-SQT dominant) and compounds were grouped as before (Table 1), and a time series of these groups is presented in Fig. S10. A change in the proportional contributions of the groups was observed between the different techniques. FIGAERO-CIMS and LC-QToF-MS (negative mode) seemed to be particularly sensitive to the o-MT and o-SQT products during the periods when the corresponding terpene concentrations increased. On the other hand, LC-QToF-MS (positive mode) was more sensitive to organonitrates (ONs) and dimers, since their fraction was the highest from all methods in both events. The o-MT greatly dominated the PM1 fraction measured by GC-QToF-MS (negative mode), suggesting a higher volatility of o-MT when compared to o-SQT products. These results show the importance of employing different analytical methods for a comprehensive characterization of aerosol particle composition.
The o-highH1 analytes were not found in offline samples, while the o-highH2 ones were only found in the LC-QToF-MS measurements. This result supports the notion that a significant fraction of these analytes might be misidentified o-SQT compounds or were created in the thermal desorption process. As explained above, such misidentification could have been a result from an insufficient resolution of the HR-ToF-CIMS for high ions (e.g., Fig. S8). The use of chromatographic separation and truly higher resolution instrumentation, such as the LC-QToF-MS used in this study, can possibly provide better chemical formula identification of compounds. However, offline techniques are also prone to sample modification; i.e., the analytes might undergo chemical decomposition/losses/transformations during sample collection, preparation or storage. These effects are likely to increase with the collection and storage time, and to influence the comparison between FIGAERO-CIMS and offline techniques. Also, for GC-QToF-MS, a direct analysis of larger oxygenated compounds is not suitable without employing a derivatization technique, since the polarity of these compounds can cause low volatility, poor thermal stability and/or their adsorption in the injector. The most dominant compounds measured by LC-QToF-MS and GC-QToF-MS during the periods when events A and B occurred are presented in Figs. S11 and S12. A comparison of those compositions with the ones obtained from FIGAERO-CIMS is discussed in Sect. S6.
3.2.4 Organic aerosol particle volatility
Particle-phase analytes were classified according to their volatility (expressed as C*, in µg m−3) as VOCs, intermediate volatile organic compounds (IVOCs), semi-volatile organic compounds (SVOCs), low volatile organic compounds (LVOCs) and extremely low volatile organic compounds (ELVOCs), following the criteria described in Donahue et al. (2012). C* values were derived using two different methods: one method based on the assigned elemental composition and another based on the measured thermograms (see Sect. 2.3). When deriving C* purely from the assigned elemental compositions by employing the parameterization method (Eq. 3; Li et al., 2016), the majority of measured SOA particle constituents were classified as SVOCs and IVOCs (Fig. 7, left), whereas when C* was derived from thermograms (Eq. 1) a clear dominance of LVOCs was observed (Fig. 7, center) with very little contribution from SVOCs and ELVOCs. The thermograms reflect mostly the volatility of aerosol composition based on their volatilization from the aerosol state (Lopez-Hilfiker et al., 2014), even though thermal decomposition also plays a role. Since thermal decomposition will lead to the detection of fragments of the original molecule, the parameterization method will then assign a higher volatility C* to these fragments than that derived from their thermograms. Furthermore, the estimation of volatility from parameterization method using Eq. (3) may be inaccurate for certain compounds whose properties are less studied and were not part of the parameter determination (e.g., some highly oxygenated compounds). The C* value derived from the thermogram will also tend to be higher than the true volatility of the decomposing compound, but it will be closer to the true value than the one derived from the composition of a possibly much smaller molecule fragment. For that reason, the thermogram-based method likely constitutes a more direct and realistic approach for determining C* (Lopez-Hilfiker et al., 2015; Schobesberger et al., 2018).
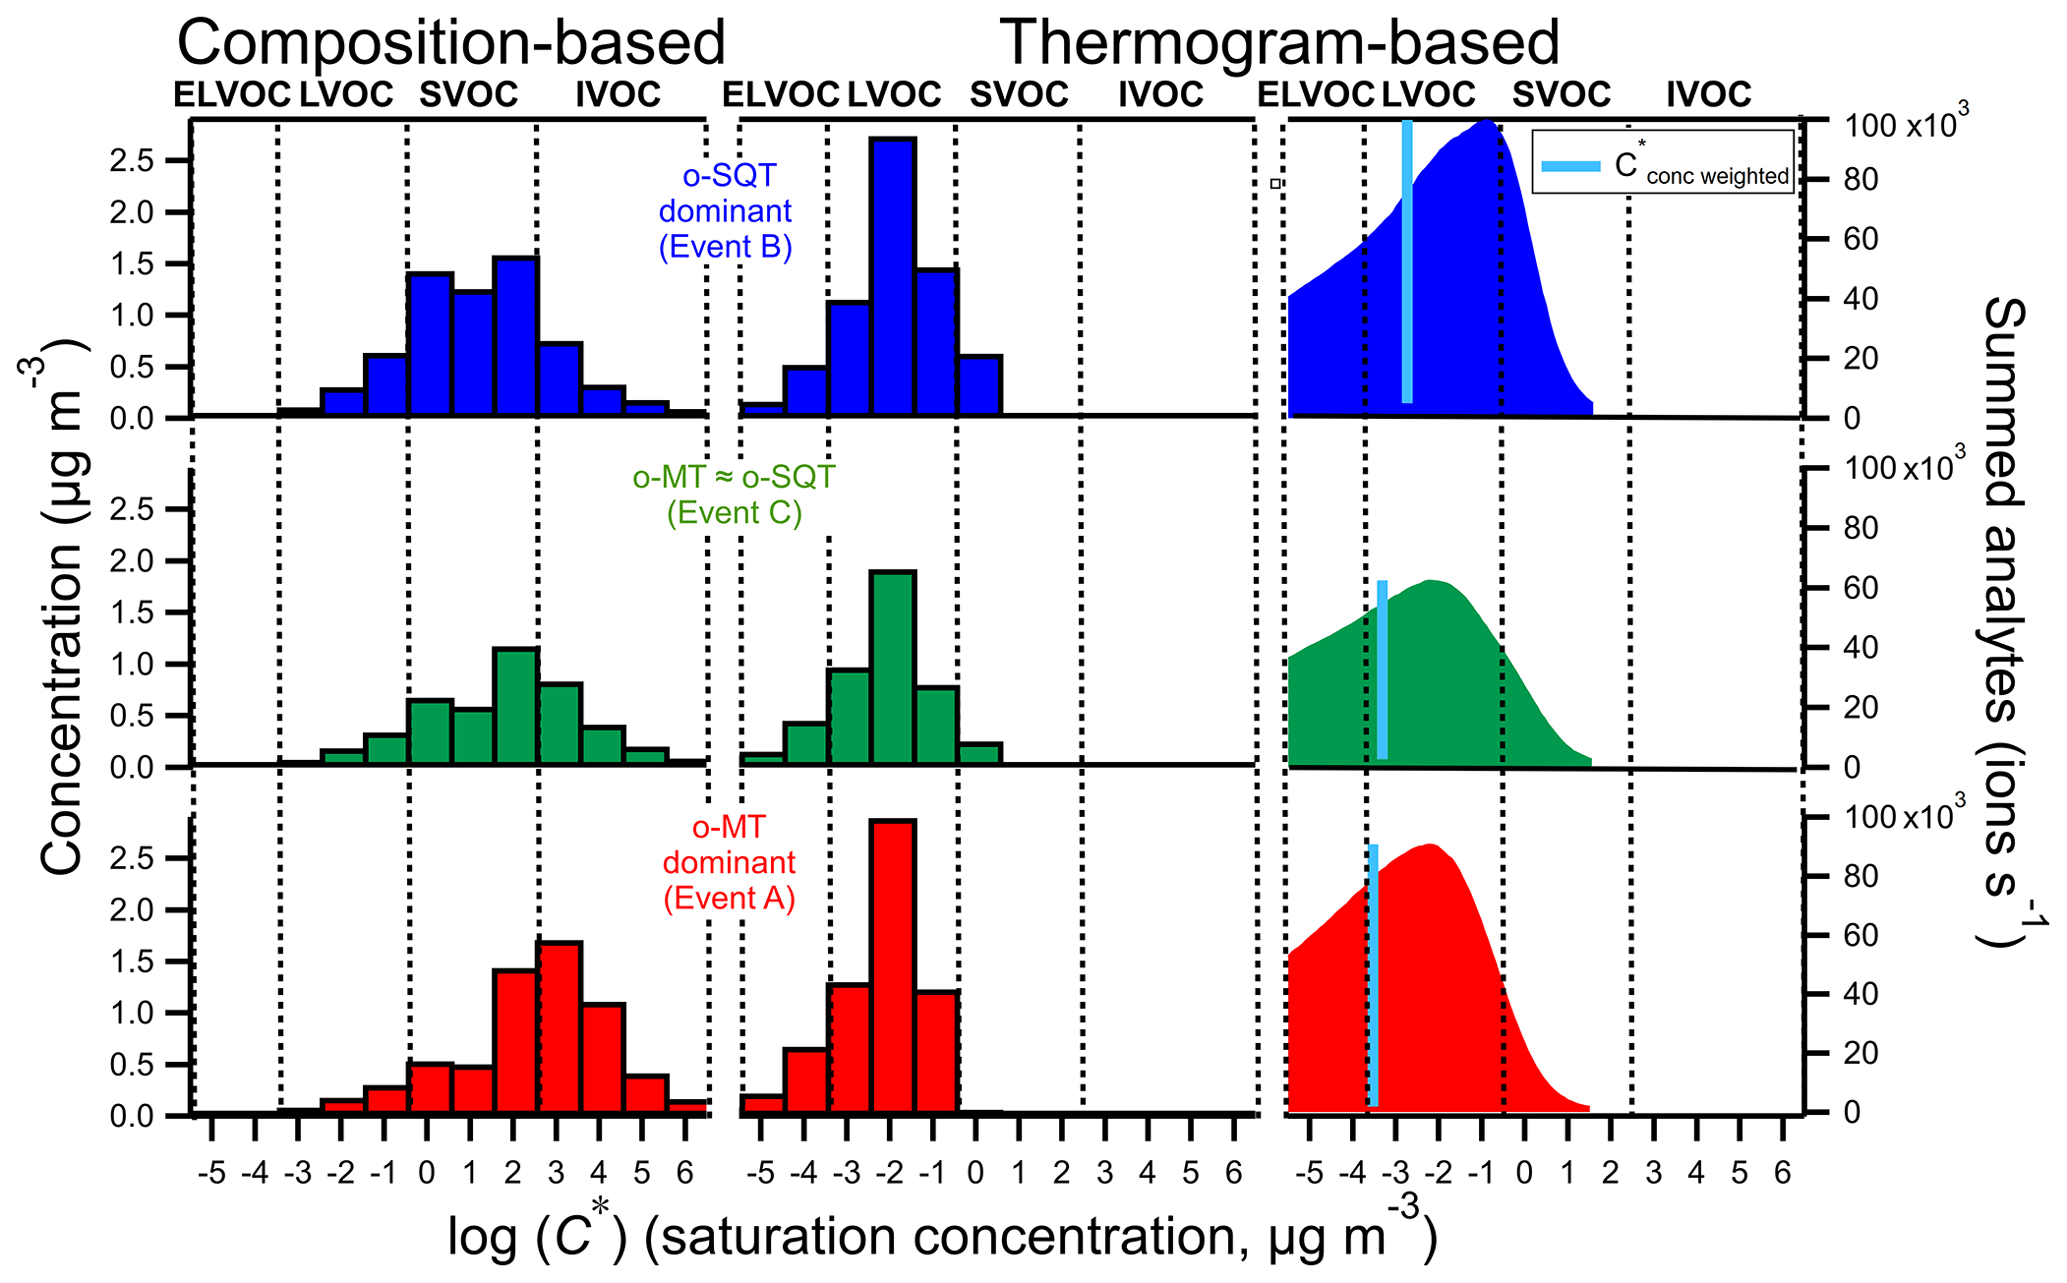
Figure 7Volatility distribution of analytes measured in the particle phase during the three event periods on 15–18 May 2018 (top: SQT event B; middle: mixed event C; bottom: MT event A), derived using two fundamentally different methods (based on tentatively assigned composition and based on thermograms (Tmax) as described in Sect. 2.3). The right plots were obtained by converting the desorption temperatures to C* (Sect. 3.2.4). The blue line indicates the C* weighted by the summed analytes.
The main difference between o-MT and o-SQT dominant events, respectively A and B, for the thermogram method was the higher fraction of SVOCs for o-SQT event. This can also possibly indicate that o-SQT oxidation products were “fresher” than those of o-MT, which would explain the higher weighted C* values during the o-SQT event. In fact, as stated previously in this publication, the o-SQT analytes with a molecular formula of C15H24O3, which have been found as a major first-generation sesquiterpene products in another study (Li et al., 2011), increased from 3.2 % on o-MT event A to 20.7 % on o-SQT event B. The presence of first-generation o-SQT products might explain why the o-SQT products were more volatile than the o-MT ones.
The ELVOC fraction was low in this study when compared to LVOC, also when considering the thermogram-based results. However, the following issues may cause a bias towards higher volatilities in FIGAERO-CIMS thermogram-based methods. First (a), aerosol chemical desorption may be limited by the maximum temperature reached by FIGAERO; i.e., eventually, the applied thermal energy may be insufficient for the desorption of ELVOC from the particles collected on the filter into the analytical instrument. Also (b), less volatile organic compounds are often highly functionalized and therefore generally more likely to decompose prior to evaporation. The same applies for highly functionalized organic compounds, the major cause for the low volatility of ELVOCs. Another issue (c) may be within the method itself. When determining Tmax values, it is assumed that each chemical formula represents a single compound whose volatility is described by the Tmax value. But it has been shown that there can be multiple isomers with different volatilities, creating multi-modal or broad thermograms (Lopez-Hilfiker et al., 2014; Schobesberger et al., 2018). Such isomers may evaporate or decompose at desorption temperatures different from the pronounced Tmax value. Their systematic omission by the Tmax method (Fig. 7, center) is avoided if Tmax values are ignored and the full desorption temperature axis of the total thermogram (Fig. 1), summed over all relevant chemical formulas, is simply translated to a C* axis using Eq. (1) (inserting desorption temperature instead of Tmax; Fig. 7, right). The resulting volatility distribution is substantially broader, with the concentration-weighted C* shifted towards lower volatilities. This method deals with issue (c), but as thermogram peak shapes are now ignored, biases are potentially added at both low and high volatilities, while potential high biases due to insufficient temperature (a) or due to decomposition occurring prior to evaporation (b) are still not dealt with.
The extension of fragmentation and its influence on volatility was evaluated by comparing some thermograms in more detail, namely the sum of constituents with different oxygen content (3 to ≥7) and the corresponding dominant signals contributing to the groups of presumed monoterpene and sesquiterpene oxidation products (groups o-MT and o-SQT, respectively; Fig. 8). The thermograms from o-MT seemed to exhibit more broadening compared to o-SQT, likely indicating a larger influence of thermal decomposition on the measured signals. The occurrence of thermal decomposition could contribute to higher Tmax, despite lower #C. But in the investigated cases, the change in the detailed peak shape (i.e., the degree of broadening or the peak to tail ratio) did not impact greatly on the Tmax values. Overall, the Tmax was increasing with the increase in oxygen content as expected for oxygen-containing functional groups, which generally decreases the volatility of a compound. Between the different events, the Tmax values of the presented ion thermograms were similar, but the importance of the peak tail varied significantly.
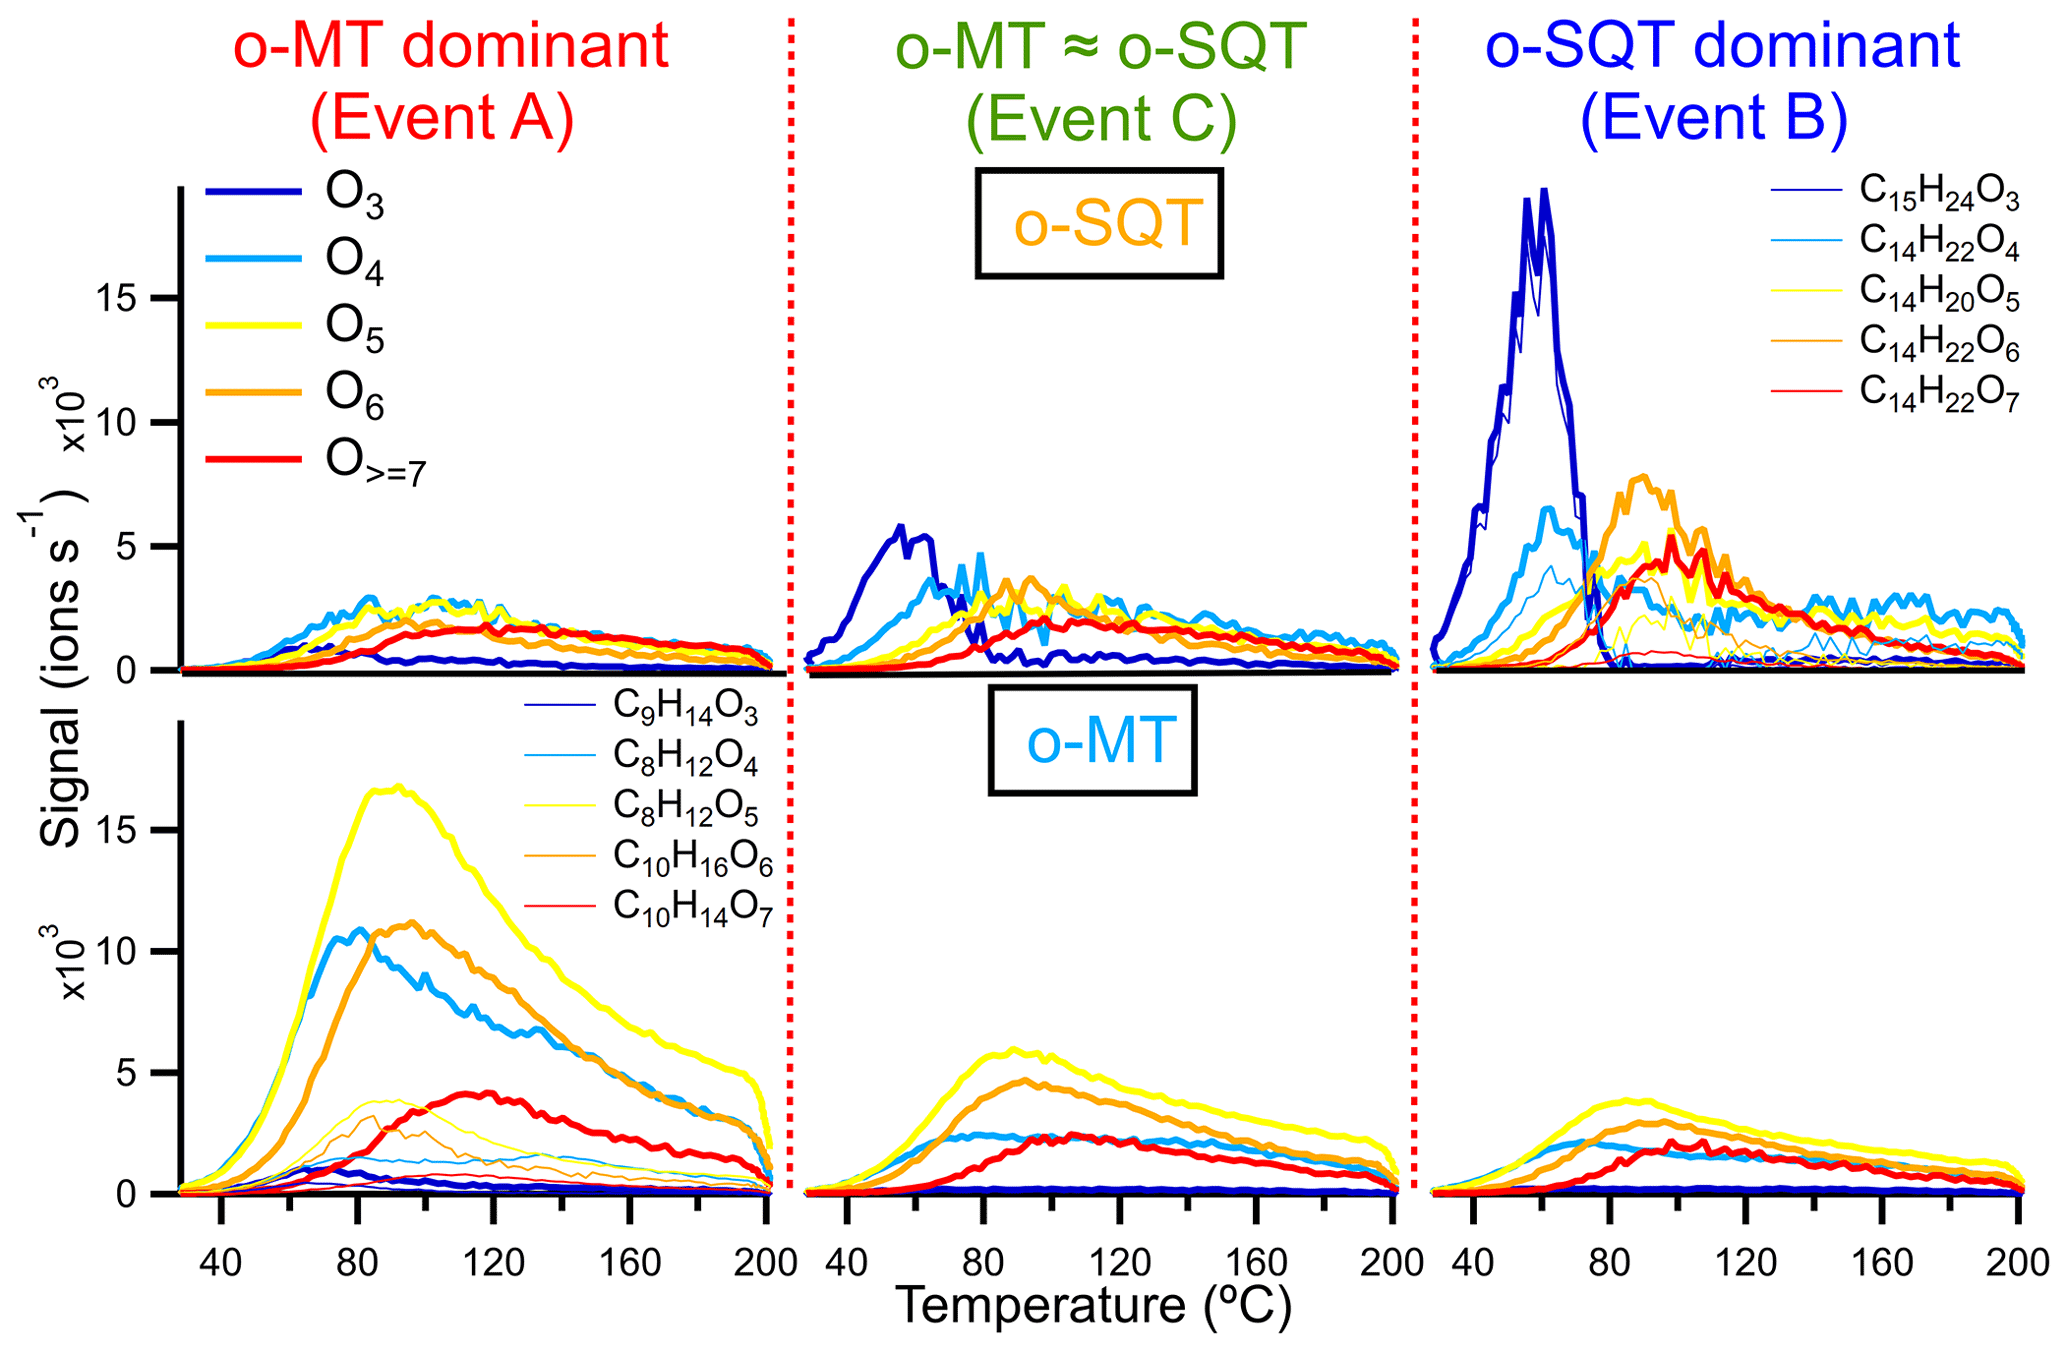
Figure 8Thermograms obtained from the sum of subsets of o-SQT (; top row) and o-MT (; bottom row) analytes during the events investigated in this study (A on the left, C in the center, B on the right). Each subset is the sum over chemical formulas with a certain number of oxygen atoms (indicated by colors). The thin lines represent the five most abundant o-SQT and o-MT compounds for each oxygen-containing subset (for clarity, only in the upper right and lower left panels, respectively) during the corresponding event periods.
Interestingly, the thermogram-based volatility was higher during the o-SQT event (B). This result may be explained by the low aging of o-SQT products comparatively to the ones from monoterpenes (Fig. 7). A more detailed look into composition- and thermogram-derived volatilities is provided in the Supplement, where Fig. S13 gives an overview of the range of identified chemical formulas and their C* derived with both methods. It also explores the influence of the O:C ratio on volatility during the different events. A significant fraction of the most dominant constituents had an O:C ratio between 0.5 and 1 during events A and B when monoterpene and sesquiterpene oxidation products dominated in aerosol composition, respectively. However, during event B, an increase in C13−15 analytes with low #O was observed, again suggesting the increased contribution of more recently formed (hence less oxygenated) sesquiterpene oxidation products. As expected from the results in Fig. 8, some trends in volatility follow expectations from the observed compositions, also for the thermogram-based C*, although they are lower throughout. The discrepancy between composition and thermogram-based volatilities was higher for o-MT than for o-SQT (Fig. S13). Considering that the tailing in Fig. 8 was broader for o-MT than o-SQT, thermal decomposition is the most probable cause of volatility differences between both methods. The plots from Fig. S13 also indicate generally high Tmax for small compounds (for example, with #C < 5), which is strong evidence for thermal decomposition as the origin of those analytes.
In this study, organic analytes were successfully measured online in a hemiboreal forest at the Järvselja SMEAR station by FIGAERO-CIMS. The study led to a comprehensive characterization of the secondary organic aerosol chemical composition at the measurement site. A range of terpene oxidation products was identified both in the gas and particle phases. The highest SOA particle loadings occurred typically during nighttime and early morning. Monoterpenes and sesquiterpenes were the main precursors to SOA particles, with mean concentrations for arguably monoterpene-derived (o-MT) and sesquiterpene-derived oxidation products (o-SQT) of 0.4 and 0.1 µg m−3, respectively. Even though the concentration of sesquiterpene oxidation products was low in the gas phase throughout the campaign, with mean concentrations of 0.07 µg m−3, they were important contributors to the aerosol particle phase during certain periods of time with maximum particle-phase concentrations of 1.6 µg m−3. The practically immediate presence of these products in SOA particles upon the early morning maximum in sesquiterpene gas-phase concentrations suggested their fast partitioning into the particle phase. The sesquiterpene products' concentration in aerosol particles exceeded that of monoterpene oxidation products on some of those occasions. These findings are supported by chromatography–mass spectrometry offline measurements that provided precursor VOC speciation and higher-resolution mass spectra of aerosol particle composition. An interesting phenomenon observed in this study was the presence of marked maxima in sesquiterpene mixing ratios in the early mornings, with increases starting at sunrise and ultimately decreases due to the onset of daytime convective mixing. Future studies are needed to elucidate the mechanism behind these increases in sesquiterpene mixing ratios. A combination of (a) an increase in specific plant emissions, (b) mixing-enhanced release from canopy storage and (c) a particularly suppressed oxidation rate by O3 depletion might explain the observed phenomenon.
More detailed analysis of the particle-phase composition and volatility gave additional indications that the observed sesquiterpene oxidation products are rapidly formed in significant amounts. Their relatively low O:C ratios also suggest that they have not been highly processed. It is plausible that a recent atmospheric formation is responsible for the relatively higher volatility of those products in our observations compared to the one from monoterpene products, whereas it is unlikely that particle-phase organic material that originates from sesquiterpene oxidation would generally be more volatile than material originating from monoterpene oxidation. A consequent conclusion would be that sesquiterpene-sourced SOA material may soon become unrecognizable as such, i.e., that aging may make that material undistinguishable from aged monoterpene SOA. However, the oxidation products formed are highly dependent on the original terpene structure.
Altogether, our results support a substantial contribution of sesquiterpenes to hemiboreal SOA formation during springtime, suggesting that both atmospheric measurements and models that focus on monoterpene oxidation may overlook a potentially large fraction of SOA particulate mass. We also saw evidence of the importance of considering the molecular structure of the involved terpenes on SOA formation instead of only their terpene class, as recently reported, e.g., by Ylisirniö et al. (2020). Clearly, more detailed and systematic studies are warranted to investigate the formation of SOA from the oxidation of a variety of sesquiterpenes and how sesquiterpene emissions vary both quantitatively (e.g., diel variations) and qualitatively (e.g., relative contributions of cyclic vs. acyclic species). The detailed chemical analysis of the expected range of particle-phase material would benefit greatly from the use of even-higher-resolution techniques and chromatographic methods since the compounds' separation and identification with the HR-ToF-CIMS employed here was challenging, and, as demonstrated, substantial ambiguities have remained. The use of devices that allow to decrease the sampling time (e.g., high-volume samplers) can also greatly reduce the occurrence of sample losses and/or modification and facilitate the comparison between online and offline techniques. In addition, future studies of ambient SOA using FIGAERO-CIMS (including the dataset obtained here) will likely benefit from the currently ongoing development of techniques to deconvolute and interpret thermogram datasets (Buchholz et al., 2020). The employment of analytical tools, such as the positive matrix factorization (PMF) method, could be beneficial for, e.g., improved source apportionment, and we intend to explore and report on its capabilities in future work.
The data shown in the paper are available on request from corresponding author.
The supplement related to this article is available online at: https://doi.org/10.5194/acp-21-11781-2021-supplement.
LMFB, AY, IP, HL, HJ, UH, SMN, AK, DK, KK, ET, UN and SS carried the experiments. LMFB, AY, IP, AB, ZL, HL, HJ, UH, SMN, AK, DK, KK, ET, UN, JRJ and SS contributed to the data analysis and interpretation. HJ, UH, SMN and SS contributed to the funding acquisition and supervision. LB wrote the manuscript. All authors participated in the interpretation of the results and paper editing.
The authors declare that they have no conflict of interest.
This research was supported by the Academy of Finland (310682), the European Regional Development Fund project MOBTT42 under Mobilitas Pluss program, Estonian Research Council (project PRG714) and Estonian Environmental Observatory (KKOBS, project 2014-2020.4.01.20-0281). We appreciate the help of Biocentre Finland and Biocentre Kuopio in supporting the LC-MS laboratory facility. We acknowledge Marja-Liisa Riekkola from the Department of Chemistry at the University of Helsinki for the opportunity to use the GC-QToF-MS. Steffen M. Noe acknowledges support from the European network for observing our changing planet project (ERA-PLANET, grant agreement no. 689443) under the European Union's Horizon 2020 research and innovation program and the Estonian Ministry of Sciences projects (grant nos. P180021, P180274), the Estonian Research Infrastructures Roadmap project Estonian Environmental Observatory (3.2.0304.11-0395) and the European Commission through the European Regional Fund (the Centre of Excellence ENVIRON).
Publisher's note: Copernicus Publications remains neutral with regard to jurisdictional claims in published maps and institutional affiliations.
This research has been supported by the Academy of Finland (grant no. 310682), the European Regional Development Fund project MOBTT42 under Mobilitas Pluss program, the Estonian Research Council (project PRG714), the Estonian Environmental Observatory (KKOBS, project 2014-2020.4.01.20-0281), the Horizon 2020 Framework Programme, H2020 Societal Challenges (grant no. ERAPLANET (689443), the Eesti Maaülikool (grant nos. P180021 and P180274), the Eesti Teadusagentuur (grant no. 3.2.0304.11-0395), and the European Commission through the European Regional Fund (the Centre of Excellence ENVIRON).
This paper was edited by Kelley Barsanti and reviewed by two anonymous referees.
Atkinson, R. and Arey, J.: Gas-phase tropospheric chemistry of biogenic volatile organic compounds: a review, Atmos. Environ., 37, 197–219, https://doi.org/10.1016/S1352-2310(03)00391-1, 2003.
Barreira, L. M. F., Helin, A., Aurela, M., Teinilä, K., Friman, M., Kangas, L., Niemi, J. V., Portin, H., Kousa, A., Pirjola, L., Rönkkö, T., Saarikoski, S., and Timonen, H.: In-depth characterization of submicron particulate matter inter-annual variations at a street canyon site in northern Europe, Atmos. Chem. Phys., 21, 6297–6314, https://doi.org/10.5194/acp-21-6297-2021, 2021.
Buchholz, A., Ylisirniö, A., Huang, W., Mohr, C., Canagaratna, M., Worsnop, D. R., Schobesberger, S., and Virtanen, A.: Deconvolution of FIGAERO–CIMS thermal desorption profiles using positive matrix factorisation to identify chemical and physical processes during particle evaporation, Atmos. Chem. Phys., 20, 7693–7716, https://doi.org/10.5194/acp-20-7693-2020, 2020.
Chan, M. N., Surratt, J. D., Chan, A. W. H., Schilling, K., Offenberg, J. H., Lewandowski, M., Edney, E. O., Kleindienst, T. E., Jaoui, M., Edgerton, E. S., Tanner, R. L., Shaw, S. L., Zheng, M., Knipping, E. M., and Seinfeld, J. H.: Influence of aerosol acidity on the chemical composition of secondary organic aerosol from β-caryophyllene, Atmos. Chem. Phys., 11, 1735–1751, https://doi.org/10.5194/acp-11-1735-2011, 2011.
Copolovici, L. and Niinemets, Ü.: Temperature dependencies of Henry's law constants for different plant sesquiterpenes, Chemosphere, 138, 751–757, https://doi.org/10.1016/j.chemosphere.2015.07.075, 2015.
D'Ambro, E. L., Schobesberger, S., Zaveri, R. A., Shilling, J. E., Lee, B. H., Lopez-Hilfiker, F. D., Mohr, C., and Thornton, J. A.: Isothermal Evaporation of α-Pinene Ozonolysis SOA: Volatility, Phase State, and Oligomeric Composition, ACS Earth Space Chem., 2, 1058–1067, https://doi.org/10.1021/acsearthspacechem.8b00084, 2018.
Donahue, N. M., Epstein, S., Pandis, S. N., and Robinson, A. L.: A two-dimensional volatility basis set: 1. organic-aerosol mixing thermodynamics, Atmos. Chem. Phys., 11, 3303–3318, https://doi.org/10.5194/acp-11-3303-2011, 2011.
Donahue, N. M., Kroll, J., Pandis, S. N., and Robinson, A. L.: A two-dimensional volatility basis set – Part 2: Diagnostics of organic-aerosol evolution, Atmos. Chem. Phys., 12, 615–634, https://doi.org/10.5194/acp-12-615-2012, 2012.
Duporté, G., Parshintsev, J., Barreira, L. M., Hartonen, K., Kulmala, M., and Riekkola, M.-L.: Nitrogen-containing low volatile compounds from pinonaldehyde-dimethylamine reaction in the atmosphere: A laboratory and field study, Environ. Sci. Technol., 50, 4693–4700, https://doi.org/10.1021/acs.est.6b00270, 2016.
Ezhova, E., Ylivinkka, I., Kuusk, J., Komsaare, K., Vana, M., Krasnova, A., Noe, S., Arshinov, M., Belan, B., Park, S.-B., Lavrič, J. V., Heimann, M., Petäjä, T., Vesala, T., Mammarella, I., Kolari, P., Bäck, J., Rannik, Ü., Kerminen, V.-M., and Kulmala, M.: Direct effect of aerosols on solar radiation and gross primary production in boreal and hemiboreal forests, Atmos. Chem. Phys., 18, 17863–17881, https://doi.org/10.5194/acp-18-17863-2018, 2018.
Fraser, M. P. and Lakshmanan, K.: Using Levoglucosan as a Molecular Marker for the Long-Range Transport of Biomass Combustion Aerosols, Environ. Sci. Technol., 34, 4560–4564, https://doi.org/10.1021/es991229l, 2000.
Grote, R., Monson, R. K., and Niinemets, Ü.: Leaf-Level Models of Constitutive and Stress-Driven Volatile Organic Compound Emissions, in: Biology, Controls and Models of Tree Volatile Organic Compound Emissions, Tree Physiology, vol. 5, edited by: Niinemets, Ü. and Monson, R., Springer, Dordrecht, https://doi.org/10.1007/978-94-007-6606-8_12, 2013.
Guenther, A., Hewitt, C. N., Erickson, D., Fall, R., Geron, C., Graedel, T., and McKay, W.: A global model of natural volatile organic compound emissions, J. Geophys. Res.-Atmos., 100, 8873–8892, https://doi.org/10.1029/94JD02950, 1995.
Hallquist, M., Wenger, J. C., Baltensperger, U., Rudich, Y., Simpson, D., Claeys, M., and Goldstein, A.: The formation, properties and impact of secondary organic aerosol: current and emerging issues, Atmos. Chem. Phys., 9, 5155–5236, https://doi.org/10.5194/acp-9-5155-2009, 2009.
Hamilton, J. F., Rami Alfarra, M., Wyche, K. P., Ward, M. W., Lewis, A. C., McFiggans, G. B., Good, N., Monks, P. S., Carr, T., White, I. R., and Purvis, R. M.: Investigating the use of secondary organic aerosol as seed particles in simulation chamber experiments, Atmos. Chem. Phys., 11, 5917–5929, https://doi.org/10.5194/acp-11-5917-2011, 2011.
Hammes, J., Lutz, A., Mentel, T., Faxon, C., and Hallquist, M.: Carboxylic acids from limonene oxidation by ozone and hydroxyl radicals: insights into mechanisms derived using a FIGAERO-CIMS, Atmos. Chem. Phys., 19, 13037–13052, https://doi.org/10.5194/acp-19-13037-2019, 2019.
Hao, L., Garmash, O., Ehn, M., Miettinen, P., Massoli, P., Mikkonen, S., Jokinen, T., Roldin, P., Aalto, P., Yli-Juuti, T., Joutsensaari, J., Petäjä, T., Kulmala, M., Lehtinen, K. E. J., Worsnop, D. R., and Virtanen, A.: Combined effects of boundary layer dynamics and atmospheric chemistry on aerosol composition during new particle formation periods, Atmos. Chem. Phys., 18, 17705–17716, https://doi.org/10.5194/acp-18-17705-2018, 2018.
Helin, A., Niemi, J. V., Virkkula, A., Pirjola, L., Teinilä, K., Backman, J., Aurela, M., Saarikoski, S., Rönkkö, T., Asmi, E., and Timonen, H.: Characteristics and source apportionment of black carbon in the Helsinki metropolitan area, Finland, Atmos. Environ., 190, 87–98, https://doi.org/10.1016/j.atmosenv.2018.07.022, 2018.
Hellén, H., Praplan, A. P., Tykkä, T., Ylivinkka, I., Vakkari, V., Bäck, J., Petäjä, T., Kulmala, M., and Hakola, H.: Long-term measurements of volatile organic compounds highlight the importance of sesquiterpenes for the atmospheric chemistry of a boreal forest, Atmos. Chem. Phys., 18, 13839–13863, https://doi.org/10.5194/acp-18-13839-2018, 2018.
Iyer, S., Lopez-Hilfiker, F., Lee, B. H., Thornton, J. A., and Kurtén, T.: Modeling the Detection of Organic and Inorganic Compounds Using Iodide-Based Chemical Ionization, J. Phys. Chem. A, 120, 576–587, https://doi.org/10.1021/acs.jpca.5b09837, 2016.
Jardine, K. J., Jardine, A. B., Souza, V. F., Carneiro, V., Ceron, J. V., Gimenez, B. O., Soares, C. P., Durgante, F. M., Higuchi, N., Manzi, A. O., Gonçalves, J. F. C., Garcia, S., Martin, S. T., Zorzanelli, R. F., Piva, L. R., and Chambers, J. Q.: Methanol and isoprene emissions from the fast growing tropical pioneer species Vismia guianensis (Aubl.) Pers. (Hypericaceae) in the central Amazon forest, Atmos. Chem. Phys., 16, 6441–6452, https://doi.org/10.5194/acp-16-6441-2016, 2016.
Joensuu, J., Altimir, N., Hakola, H., Rostás, M., Raivonen, M., Vestenius, M., Aaltonen, H., Riederer, M., and Bäck, J.: Role of needle surface waxes in dynamic exchange of mono- and sesquiterpenes, Atmos. Chem. Phys., 16, 7813–7823, https://doi.org/10.5194/acp-16-7813-2016, 2016.
Jokinen, T., Berndt, T., Makkonen, R., Kerminen, V.-M., Junninen, H., Paasonen, P., Stratmann, F., Herrmann, H., Guenther, A. B., Worsnop, D. R., Kulmala, M., Ehn, M., and Sipilä, M.: Production of extremely low volatile organic compounds from biogenic emissions: Measured yields and atmospheric implications, P. Natl. Acad. Sci. USA, 112, 7123–7128, https://doi.org/10.1073/pnas.1423977112, 2015.
Junninen, H., Ehn, M., Petäjä, T., Luosujärvi, L., Kotiaho, T., Kostiainen, R., and Kulmala, M.: A high-resolution mass spectrometer to measure atmospheric ion composition, Atmos. Meas. Tech., 3, 1039–1053, https://doi.org/10.5194/amt-3-1039-2010, 2010.
Kännaste, A., Copolovici, L., and Niinemets, Ü.: Gas Chromatography–Mass Spectrometry Method for Determination of Biogenic Volatile Organic Compounds Emitted by Plants, in: Plant Isoprenoids. Methods in Molecular Biology (Methods and Protocols), vol. 1153, edited by: Rodríguez-Concepción, M., Humana Press, New York, NY, https://doi.org/10.1007/978-1-4939-0606-2_11, 2014.
Kansal, A.: Sources and reactivity of NMHCs and VOCs in the atmosphere: A review, J. Hazard. Mater., 166, 17–26, https://doi.org/10.1016/j.jhazmat.2008.11.048, 2009.
Kari, E., Faiola, C. L., Isokääntä, S., Miettinen, P., Yli-Pirilä, P., Buchholz, A., Kivimäenpää, M., Mikkonen, S., Holopainen, J. K., and Virtanen, A.: Time-resolved characterization of biotic stress emissions from Scots pines being fed upon by pine weevil by means of PTR-ToF-MS, Boreal Environ. Res., 24, 25–49, 2019.
Kavouras, I. G., Mihalopoulos, N., and Stephanou, E.: Formation and gas/particle partitioning of monoterpenes photo-oxidation products over forests, Geophys. Res. Lett., 26, 55–58, https://doi.org/10.1029/1998GL900251, 1999.
Keppart, L.: Agrometeorological characterization of May (original title in Estonian: 2018. a maikuu agrometeoroloogiline iseloomustus), Estonian Crop Research Institute, Jõgeva, 2018.
Krieger, U. K., Siegrist, F., Marcolli, C., Emanuelsson, E. U., Gøbel, F. M., Bilde, M., Marsh, A., Reid, J. P., Huisman, A. J., Riipinen, I., Hyttinen, N., Myllys, N., Kurtén, T., Bannan, T., Percival, C. J., and Topping, D.: A reference data set for validating vapor pressure measurement techniques: homologous series of polyethylene glycols, Atmos. Meas. Tech., 11, 49–63, https://doi.org/10.5194/amt-11-49-2018, 2018.
Kundu, S., Fisseha, R., Putman, A. L., Rahn, T. A., and Mazzoleni, L. R.: Molecular formula composition of β-caryophyllene ozonolysis SOA formed in humid and dry conditions, Atmos. Environ., 154, 70–81, https://doi.org/10.1016/j.atmosenv.2016.12.031, 2017.
Langenheim, J. H.: Plant resins: chemistry, evolution, ecology, and ethnobotany, Timber Press, Oregon, USA, 587 pp., 2003.
Laothawornkitkul, J., Taylor, J. E., Paul, N. D., and Hewitt, C. N.: Biogenic volatile organic compounds in the Earth system, New Phytol., 183, 27–51, https://doi.org/10.1111/j.1469-8137.2009.02859.x, 2009.
Lee, B. H., Lopez-Hilfiker, F. D., Mohr, C., Kurtén, T., Worsnop, D. R., and Thornton, J. A.: An iodide-adduct high-resolution time-of-flight chemical-ionization mass spectrometer: Application to atmospheric inorganic and organic compounds, Environ. Sci. Technol., 48, 6309–6317, https://doi.org/10.1021/es500362a, 2014.
Lee, B. H., Lopez-Hilfiker, F. D., D'Ambro, E. L., Zhou, P., Boy, M., Petäjä, T., Hao, L., Virtanen, A., and Thornton, J. A.: Semi-volatile and highly oxygenated gaseous and particulate organic compounds observed above a boreal forest canopy, Atmos. Chem. Phys., 18, 11547–11562, https://doi.org/10.5194/acp-18-11547-2018, 2018.
Lehtipalo, K., Yan, C., Dada, L., Bianchi, F., Xiao, M., Wagner, R., Stolzenburg, D., Ahonen, L. R., Amorim, A., Baccarini, A., Bauer, P. S., Baumgartner, B., Bergen, A., Bernhammer, A.-K., Breitenlechner, M., Brilke, S., Buchholz, A., Mazon, S. B., Chen, D., Chen, X., Dias, A., Dommen, J., Draper, D. C., Duplissy, J., Ehn, M., Finkenzeller, H., Fischer, L., Frege, C., Fuchs, C., Garmash, O., Gordon, H., Hakala, J., He, X., Heikkinen, L., Heinritzi, M., Helm, J. C., Hofbauer, V., Hoyle, C. R., Jokinen, T., Kangasluoma, J., Kerminen, V.-M., Kim, C., Kirkby, J., Kontkanen, J., Kürten, A., Lawler, M. J., Mai, H., Mathot, S., Mauldin, R. L., Molteni, U., Nichman, L., Nie, W., Nieminen, T., Ojdanic, A., Onnela, A., Passananti, M., Petäjä, T., Piel, F., Pospisilova, V., Quéléver, L. L. J., Rissanen, M. P., Rose, C., Sarnela, N., Schallhart, S., Schuchmann, S., Sengupta, K., Simon, M., Sipilä, M., Tauber, C., Tomé, A., Tröstl, J., Väisänen, O., Vogel, A. L., Volkamer, R., Wagner, A. C., Wang, M., Weitz, L., Wimmer, D., Ye, P., Ylisirniö, A., Zha, Q., Carslaw, K. S., Curtius, J., Donahue, N. M., Flagan, R. C., Hansel, A., Riipinen, I., Virtanen, A., Winkler, P. M., Baltensperger, U., Kulmala, M., and Worsnop, D. R.: Multicomponent new particle formation from sulfuric acid, ammonia, and biogenic vapors, Sci. Adv., 4, eaau5363, https://doi.org/10.1126/sciadv.aau5363, 2018.
Li, H., Riva, M., Rantala, P., Heikkinen, L., Daellenbach, K., Krechmer, J. E., Flaud, P.-M., Worsnop, D., Kulmala, M., Villenave, E., Perraudin, E., Ehn, M., and Bianchi, F.: Terpenes and their oxidation products in the French Landes forest: insights from Vocus PTR-TOF measurements, Atmos. Chem. Phys., 20, 1941–1959, https://doi.org/10.5194/acp-20-1941-2020, 2020.
Li, X., Chee, S., Hao, J., Abbatt, J. P. D., Jiang, J., and Smith, J. N.: Relative humidity effect on the formation of highly oxidized molecules and new particles during monoterpene oxidation, Atmos. Chem. Phys., 19, 1555–1570, https://doi.org/10.5194/acp-19-1555-2019, 2019.
Li, Y., Chen, Q., Guzman, M., Chan, C., and Martin, S.: Second-generation products contribute substantially to the particle-phase organic material produced by β-caryophyllene ozonolysis, Atmos. Chem. Phys., 11, 121–132, https://doi.org/10.5194/acp-11-121-2011, 2011.
Li, Y., Pöschl, U., and Shiraiwa, M.: Molecular corridors and parameterizations of volatility in the chemical evolution of organic aerosols, Atmos. Chem. Phys., 16, 3327–3344, https://doi.org/10.5194/acp-16-3327-2016, 2016.
Li, Z., Tikkanen, O.-P., Buchholz, A., Hao, L., Kari, E., Yli-Juuti, T., and Virtanen, A.: Effect of Decreased Temperature on the Evaporation of α-Pinene Secondary Organic Aerosol Particles, ACS Earth Space Chem., 3, 2775–2785, https://doi.org/10.1021/acsearthspacechem.9b00240, 2019.
Li, Z., D'Ambro, E. L., Schobesberger, S., Gaston, C. J., Lopez-Hilfiker, F. D., Liu, J., Shilling, J. E., Thornton, J. A., and Cappa, C. D.: A robust clustering algorithm for analysis of composition-dependent organic aerosol thermal desorption measurements, Atmos. Chem. Phys., 20, 2489–2512, https://doi.org/10.5194/acp-20-2489-2020, 2020.
Lopez-Hilfiker, F., Mohr, C., Ehn, M., Rubach, F., Kleist, E., Wildt, J., and Worsnop, D.: A novel method for online analysis of gas and particle composition: description and evaluation of a Filter Inlet for Gases and AEROsols (FIGAERO), Atmos. Meas. Tech., 7, 983–1001, https://doi.org/10.5194/amt-7-983-2014, 2014.
Lopez-Hilfiker, F. D., Mohr, C., Ehn, M., Rubach, F., Kleist, E., Wildt, J., Mentel, T. F., Carrasquillo, A. J., Daumit, K. E., Hunter, J. F., Kroll, J. H., Worsnop, D. R., and Thornton, J. A.: Phase partitioning and volatility of secondary organic aerosol components formed from α-pinene ozonolysis and OH oxidation: the importance of accretion products and other low volatility compounds, Atmos. Chem. Phys., 15, 7765–7776, https://doi.org/10.5194/acp-15-7765-2015, 2015.
Lopez-Hilfiker, F. D., Iyer, S., Mohr, C., Lee, B. H., D'Ambro, E. L., Kurtén, T., and Thornton, J. A.: Constraining the sensitivity of iodide adduct chemical ionization mass spectrometry to multifunctional organic molecules using the collision limit and thermodynamic stability of iodide ion adducts, Atmos. Meas. Tech., 9, 1505–1512, https://doi.org/10.5194/amt-9-1505-2016, 2016.
Nemecek-Marshall, M., MacDonald, R. C., Franzen, J. J., Wojciechowski, C. L., and Fall, R.: Methanol Emission from Leaves (Enzymatic Detection of Gas-Phase Methanol and Relation of Methanol Fluxes to Stomatal Conductance and Leaf Development), Plant Physiol., 108, 1359–1368, https://doi.org/10.1104/pp.108.4.1359, 1995.
Niinemets, Ü.: What Are Plant-Released Biogenic Volatiles and How They Participate in Landscape- to Global-Level Processes?, in: Ecosystem Services from Forest Landscapes, edited by: Perera, A., Peterson, U., Pastur, G., and Iverson, L., Springer, Cham, 29–56, https://doi.org/10.1007/978-3-319-74515-2_3, 2018.
Niinemets, Ü., Kännaste, A., and Copolovici, L.: Quantitative patterns between plant volatile emissions induced by biotic stresses and the degree of damage, Front. Plant Sci., 4, 262, https://doi.org/10.3389/fpls.2013.00262, 2013.
Noe, S. M., Hüve, K., Niinemets, Ü., and Copolovici, L.: Seasonal variation in vertical volatile compounds air concentrations within a remote hemiboreal mixed forest, Atmos. Chem. Phys., 12, 3909–3926, https://doi.org/10.5194/acp-12-3909-2012, 2012.
Noe, S. M., Niinemets, Ü., Krasnova, A., Krasnov, D., Motallebi, A., Kängsepp, V., Jõgiste, K., Hõrrak, U., Komsaare, K., Mirme, S., Vana, M., Tammet, H., Bäck, J., Vesala, T., Kulmala, M., Petäjä, T., and Kangur, A.: SMEAR Estonia: Perspectives of a large-scale forest ecosystem – atmosphere research infrastructure, Forest. Stud., 63, 56–84, https://doi.org/10.1515/fsmu-2015-0009, 2015.
Peñuelas, J. and Staudt, M.: BVOCs and global change, Trends Plant Sci., 15, 133–144, https://doi.org/10.1016/j.tplants.2009.12.005, 2010.
Pitkänen, M. R. A., Mikkonen, S., Lehtinen, K. E. J., Lipponen, A., and Arola, A.: Artificial bias typically neglected in comparisons of uncertain atmospheric data, Geophys. Res. Lett., 43, 10003–10011, https://doi.org/10.1002/2016GL070852, 2016.
Pöschl, U.: Atmospheric Aerosols: Composition, Transformation, Climate and Health Effects, Angew. Chem., Int. Ed. Engl., 44, 7520–7540, https://doi.org/10.1002/anie.200501122, 2005.
Praplan, A. P., Tykkä, T., Chen, D., Boy, M., Taipale, D., Vakkari, V., Zhou, P., Petäjä, T., and Hellén, H.: Long-term total OH reactivity measurements in a boreal forest, Atmos. Chem. Phys., 19, 14431–14453, https://doi.org/10.5194/acp-19-14431-2019, 2019.
Puurunen, J., Tiira, K., Lehtonen, M., Hanhineva, K., and Lohi, H.: Non-targeted metabolite profiling reveals changes in oxidative stress, tryptophan and lipid metabolisms in fearful dogs, Behav. Brain Funct., 12, 7, https://doi.org/10.1186/s12993-016-0091-2, 2016.
Riipinen, I., Yli-Juuti, T., Pierce, J. R., Petäjä, T., Worsnop, D. R., Kulmala, M., and Donahue, N. M.: The contribution of organics to atmospheric nanoparticle growth, Nat. Geosci., 5, 453–458, https://doi.org/10.1038/NGEO1499, 2012.
Riva, M., Budisulistiorini, S. H., Chen, Y., Zhang, Z., D'Ambro, E. L., Zhang, X., Gold, A., Turpin, B. J., Thornton, J. A., Canagaratna, M. R., and Surratt, J. D.: Chemical Characterization of Secondary Organic Aerosol from Oxidation of Isoprene Hydroxyhydroperoxides, Environ. Sci. Technol., 50, 9889–9899, https://doi.org/10.1021/acs.est.6b02511, 2016.
Schervish, M. and Donahue, N. M.: Peroxy radical chemistry and the volatility basis set, Atmos. Chem. Phys., 20, 1183–1199, https://doi.org/10.5194/acp-20-1183-2020, 2020.
Schobesberger, S., D'Ambro, E. L., Lopez-Hilfiker, F. D., Mohr, C., and Thornton, J. A.: A model framework to retrieve thermodynamic and kinetic properties of organic aerosol from composition-resolved thermal desorption measurements, Atmos. Chem. Phys., 18, 14757–14785, https://doi.org/10.5194/acp-18-14757-2018, 2018.
Yee, L. D., Isaacman-VanWertz, G., Wernis, R. A., Meng, M., Rivera, V., Kreisberg, N. M., Hering, S. V., Bering, M. S., Glasius, M., Upshur, M. A., Gray Bé, A., Thomson, R. J., Geiger, F. M., Offenberg, J. H., Lewandowski, M., Kourtchev, I., Kalberer, M., de Sá, S., Martin, S. T., Alexander, M. L., Palm, B. B., Hu, W., Campuzano-Jost, P., Day, D. A., Jimenez, J. L., Liu, Y., McKinney, K. A., Artaxo, P., Viegas, J., Manzi, A., Oliveira, M. B., de Souza, R., Machado, L. A. T., Longo, K., and Goldstein, A. H.: Observations of sesquiterpenes and their oxidation products in central Amazonia during the wet and dry seasons, Atmos. Chem. Phys., 18, 10433–10457, https://doi.org/10.5194/acp-18-10433-2018, 2018.
Ylisirniö, A., Buchholz, A., Mohr, C., Li, Z., Barreira, L., Lambe, A., Faiola, C., Kari, E., Yli-Juuti, T., Nizkorodov, S. A., Worsnop, D. R., Virtanen, A., and Schobesberger, S.: Composition and volatility of secondary organic aerosol (SOA) formed from oxidation of real tree emissions compared to simplified volatile organic compound (VOC) systems, Atmos. Chem. Phys., 20, 5629–5644, https://doi.org/10.5194/acp-20-5629-2020, 2020.
Ylisirniö, A., Barreira, L. M. F., Pullinen, I., Buchholz, A., Jayne, J., Krechmer, J. E., Worsnop, D. R., Virtanen, A., and Schobesberger, S.: On the calibration of FIGAERO-ToF-CIMS: importance and impact of calibrant delivery for the particle-phase calibration, Atmos. Meas. Tech., 14, 355–367, https://doi.org/10.5194/amt-14-355-2021, 2021.
York, D., Evensen, N. M., Martínez, M. L., and De Basabe Delgado, J.: Unified equations for the slope, intercept, and standard errors of the best straight line, Am. J. Phys., 72, 367–375, https://doi.org/10.1119/1.1632486, 2004.
Zhang, H., Yee, L. D., Lee, B. H., Curtis, M. P., Worton, D. R., Isaacman-VanWertz, G., Offenberg, J. H., Lewandowski, M., Kleindienst, T. E., Beaver, M. R., Holder, A. L., Lonneman, W. A., Docherty, K. S., Jaoui, M., Pye, H. O. T., Hu, W., Day, D. A., Campuzano-Jost, P., Jimenez, J. L., Guo, H., Weber, R. J., de Gouw, J., Koss, A. R., Edgerton, E. S., Brune, W., Mohr, C., Lopez-Hilfiker, F. D., Lutz, A., Kreisberg, N. M., Spielman, S. R., Hering, S. V., Wilson, K. R., Thornton, J. A., and Goldstein, A. H.: Monoterpenes are the largest source of summertime organic aerosol in the southeastern United States, P. Natl. Acad. Sci. USA, 115, 2038–2043, https://doi.org/10.1073/pnas.1717513115, 2018.
Zhang, X., McVay, R. C., Huang, D. D., Dalleska, N. F., Aumont, B., Flagan, R. C., and Seinfeld, J. H.: Formation and evolution of molecular products in α-pinene secondary organic aerosol, P. Natl. Acad. Sci. USA, 112, 14168–14173, https://doi.org/10.1073/pnas.1517742112, 2015.