the Creative Commons Attribution 4.0 License.
the Creative Commons Attribution 4.0 License.
 | 06 Aug 2021
Estimating radiative forcing efficiency of dust aerosol based on direct satellite observations: case studies over the Sahara and Taklimakan Desert
Lin Tian
The direct radiative forcing efficiency of dust aerosol (DRFEdust) is an important indicator to measure the climate effect of dust. The DRFEdust is determined by the microphysical properties of dust, which vary with dust source regions. However, there are only sparse in situ measurements of them, such as the distribution of the dust aerosol particle size and the complex refractive index in the main dust source regions. Furthermore, recent studies have shown that the non-spherical effect of the dust particle is not negligible. The DRFEdust is often evaluated by estimating given microphysical properties of the dust aerosols in the radiative transfer model (RTM). However, considerable uncertainties exist due to the complex and variable dust properties, including the complex refractive index and the shape of the dust. The DRFEdust over the Taklimakan Desert and Sahara is derived from the satellite observations in this paper. The advantage of the proposed satellite-based method is that there is no need to consider the microphysical properties of the dust aerosols in estimating the DRFEdust. For comparison, the observed DRFEdust is compared with that simulated by the RTM. The differences in the dust microphysical properties in these two regions and their impacts on DRFEdust are analyzed.
The DRFEdust derived from the satellite observation is W m in March 2019 over Tamanrasset in the Sahara and W m in April 2019 over Kashi in the Taklimakan Desert. According to the analyses of their microphysical properties and optical properties, the dust aerosols from the Taklimakan Desert (Kashi) scatter strongly. The RTM-simulated results (−41.5 to −47.4 W m over Kashi and −32.2 to −44.3 W m over Tamanrasset) are in good agreement with the results estimated by satellite observations. According to previous studies, the results in this paper are proven to be reasonable and reliable. The results also show that the microphysical properties of the dust can significantly influence the DRFEdust. The satellite-derived results can represent the influence of the dust microphysical properties on the DRFEdust, which can also validate the direct radiative effect of the dust aerosol and the DRFEdust derived from the numerical model more directly.
- Article
(21249 KB) - Full-text XML
- BibTeX
- EndNote


Dust aerosols are considered to be one of the major components of the tropospheric aerosols (Huneeus et al., 2012; Textor et al., 2007). The dust aerosols affect the radiation balance of the earth–atmosphere system by scattering and absorbing solar radiation directly (Miller et al., 2014; Satheesh, 2002). Estimating the direct radiation effect of the dust aerosol (DREdust) is crucial for estimating climate forcing. The scattering of the dust influences the radiation in the shortwave (SW) spectrum at the top of atmosphere (TOA), which causes stronger SW DREdust over dust source regions (Slingo et al., 2006). Therefore, the evaluation of SW DREdust is important for climate modeling.
The variabilities of the mineral dust composition from soils in different source regions cause the differences in dust microphysical properties (e.g., refractive index, size, and particle shapes). The direct radiative forcing efficiency of the dust aerosol (DRFEdust) is defined to quantify the dust radiative effect (Anderson et al., 2005; Satheesh and Ramanathan, 2000). The DRFEdust represents the DREdust per unit aerosol optical depth (AOD), which means the efficiency of the dust aerosol that affects the net radiative flux of solar radiation. The DRFEdust is largely determined by the optical properties of the dust aerosols (Shi et al., 2005), which are strictly controlled by the microphysical properties of the particles (Di Biagio et al., 2014a, b, 2017; Zhang et al., 2006). Therefore, the DRFEdust is different concerning the dust aerosols from different source regions (Tanré et al., 2001; Che et al., 2012). Without considering the influence of the aerosol loading on the DREdust, the DRFEdust has unique advantages in evaluating the differences in dust microphysical properties and their impacts on the DREdust from different dust source regions (García et al., 2008).
The DRFEdust is often estimated by the general circulation model (GCM) and the radiative transfer model (RTM). Many studies have simulated the SW DRFEdust in different regions (Valenzuela et al., 2012; Che et al., 2009; Bi et al., 2014). However, there are sparse in situ measurements of the dust microphysical properties in the main source regions. The large spatial variability of aerosols and the lack of an adequate database on their properties make DREdust and DRFEdust very difficult to estimate (Satheesh and Srinivasan, 2006). To date, climate models have generally used temporal and spatial constant values to represent the dust microphysical properties (Di Biagio et al., 2017, 2014a; Bi et al., 2020). This may cause uncertainties in calculating the dust radiative effect. Moreover, the shape of the dust particle in the model needs to be assumed. Therefore, there are large uncertainties in estimating the DRFEdust with few measurements of the dust microphysical properties from different source regions (Bi et al., 2020; Colarco et al., 2014; Zhao et al., 2013).
Satellite observations can be used in estimating the DRFEdust because satellites can directly observe the radiation budget of the earth at the TOA (Wielicki et al., 1998; Satheesh and Ramanathan, 2000), and the remote-sensing technique for the AOD has been developed (Remer et al., 2005; Hsu et al., 2004). In the previous study, we developed a satellite-based method to estimate the DRFEdust over land without any assumptions about the microphysical properties of dust aerosols (Tian et al., 2019). In previous studies, performances of the models in simulating the dust radiative effect have been indirectly validated by comparing the observations of the AOD, the single scattering albedo (SSA), the distribution of the particle size, and the extinction profile of the aerosols with the simulated ones (Zhao et al., 2010; Chen et al., 2014). Therefore, the satellite-based method provides a direct way to validate the DREdust and the DRFEdust.
The Sahara and Taklimakan Desert are the main dust source regions, which influence many areas (Li et al., 2020; Mikami et al., 2006; Mbourou et al., 1997; Huang et al., 2014). Previous studies also estimated the DRFEdust in the Sahara and Taklimakan Desert (Li et al., 2004, 2020; García et al., 2012; Xia and Zong, 2009). García et al. (2012) evaluated the DRFEdust in the Sahara based on the Global Atmospheric ModEl (GAME) and the AERONET retrievals. Li et al. (2004) estimated DRFEdust in the Sahara based on the satellite data and the Santa Barbara DISORT Atmospheric Radiative Transfer (SBDART) model. For the Taklimakan Desert, Li et al. (2020) estimated the instantaneous SW DRFEdust based on the RTM and ground-based measurements of dust properties. Xia and Zong (2009) used both the satellite data and the SBDART model to represent the instantaneous SW DRFEdust at the TOA (Xia and Zong, 2009). The DRFEdust varies in these studies, and the differences may come from the different research conditions and the difference in dust aerosol microphysical properties in the Sahara and Taklimakan Desert. Thus, the assessment on the SW DRFEdust and dust microphysical properties over the Sahara and Taklimakan Desert is meaningful for evaluating regional and global climate changes.
In this paper, the DRFEdust at the TOA in dust storms over Tamanrasset in the Sahara and Kashi in the Taklimakan Desert are evaluated based on satellite observations and the RTM, separately. With the comparison of the dust microphysical properties and the DRFEdust at the TOA in these two regions, the differences in the dust microphysical properties are analyzed. Meanwhile, the influences of the dust microphysical properties on the DRFEdust at the TOA are investigated in this paper. The need for accurate information on the dust microphysical properties and dust sources for simulating the DRFEdust is emphasized, and the advantage of the satellite-based method in estimating the DRFEdust is revealed.
In the previous study (Tian et al., 2019), the equi-albedo method has been proposed to estimate the DREdust and the DRFEdust at the TOA over land based on satellite measurements directly. This method is based on the assumption that the SW radiative fluxes at the TOA of the clear sky (Fclr) are equal over the regions with similar land surface albedo (LSA) and solar zenith angle (SZA). Following this method, we estimated the DRFEdust based on the AOD and the SW radiative flux product from the same satellite platform.
Moreover, the DRFEdust in the RTM with dust aerosol microphysical properties is also evaluated. Based on the comparison between the DRFEdust results from the two methods, the differences in the dust microphysical properties over the Taklimakan Desert and the Sahara are analyzed, and the differences in the DRFEdust at the TOA are also discussed. The processing steps are shown in Fig. 1.

2.1 Methodology
2.1.1 The equi-albedo method
Previous studies have shown that Fclr is significantly influenced by the LSA and the SZA at the TOA (Di Biagio et al., 2012; Tegen et al., 2010). It is hard to assess the SW DREdust and the DRFEdust over land derived from satellite observations due to the large dynamic range of the LSA (Satheesh, 2002). In the previous study (Tian et al., 2019), we proposed an equi-albedo method to minimize the influence of the inhomogeneous LSA and SZA and directly derived the DREdust and the DRFEdust over land from satellite observations based on the assumption that the Fclr is equal over the regions with a similar LSA and SZA.
DREdust is defined as the upward radiative flux difference between clear (Fclr) and dust loading (Fdust) conditions (Garrett and Zhao, 2006; Christopher et al., 2000; Ramanathan et al., 1989).
Fdust is the shortwave radiative flux at the TOA under the cloud-free and dust aerosol loading conditions which is obtained directly from the Clouds and the Earth's Radiant Energy System (CERES). Fclr is the shortwave flux over the same region without aerosol. Fclr cannot be observed directly, and the estimation of Fclr must be on the basis of some realistic assumptions.
The equi-albedo method is based on the assumption that the upward SW radiative fluxes at the TOA of the clear sky (Fclr) are equal over the regions with similar land surface albedo (LSA) and solar zenith angle (SZA). In the equi-albedo method we set the cloud-free pixels with AOD smaller than 0.1 as the clear-sky pixels (Tian et al., 2019). Therefore, it can be considered to be in the same condition when the difference between LSA is less than 0.01 and the difference between SZA is less than 0.2∘. This keeps good consistency of Fclr between clear and dust storm areas and ensures that enough pixels could match the condition (Tian et al., 2019). Based on the assumption, the Fclr is estimated, and then DREdust can be derived following Eq. (1). According to the definition of DRFEdust, it represents the net flux of solar radiation perturbed by per unit dust AOD. Therefore, DRFEdust can be expressed as
where τdust is the AOD of dust aerosols, and τdust comes from the MODIS aerosol product. Thus, DRFEdust is estimated based on the AOD and the SW radiative flux product from the same satellite platform.
In the previous study (Tian et al., 2019), we estimated the DREdust and the DRFEdust of two dust storms in the Taklimakan Desert. The results were compared with the DREdust and the DRFEdust simulated by the RTM. The results indicated that the method is effective in estimating the SW DRFEdust over land. The microphysical properties of dust aerosols significantly influence the DREdust and the DRFEdust (Che et al., 2012; Li et al., 2018). The different microphysical properties of dust aerosols in various dust source regions cause uncertainties in estimating the SW DREdust and DRFEdust. Thus, the equi-albedo method is used to estimate the SW DRFEdust directly using satellite observations in this study. Based on the comparison of the DRFEdust in the Taklimakan Desert and the Sahara, the differences in dust microphysical properties in these two regions are analyzed, and the influences of the dust microphysical properties on estimating the DRFEdust are tested.
2.1.2 Calculating method of dust optical properties
Dust aerosols are often assumed to be spherical particles in the GCM and the RTM (Wang et al., 2013; Gao and Anderson, 2001). The Lorenz–Mie theory is used to calculate the optical properties of the dust particles (Gouesbet and Gréhan, 2011). However, observations and studies have shown that most dust aerosols are non-spherical in nature (Nakajima et al., 1989; Okada et al., 2001). Previous studies also suggested that assuming particles to be spherical or non-spherical has significant impacts on calculating the dust optical properties (Kalashnikova and Sokolik, 2004; Borghese et al., 2007). Therefore, the optical properties of dust aerosols are calculated using both the spherical and ellipsoidal methods for comparison to analyze the uncertainties caused by the assumption about dust shapes in estimating the DRFEdust in this study.
To make it more accurate, the light-scattering properties of spherical particles are generally calculated based on the Mie and Lorenz theory (Mishchenko and Travis, 2008). Among several methods for computing optical properties of non-spherical particles, the T-matrix method has been extensively developed to many versions for various applications (Hovenier, 1996; Mishchenko et al., 1996). These versions of the available T-matrix codes are accessed from the National Aeronautics and Space Administration (NASA) Goddard Institute for Space Studies (GISS) group. The T-matrix codes are accessed from the NASA GISS group (https://www.giss.nasa.gov/staff/mmishchenko/t_matrix.html, last access: 10 October 2020). The codes are directly applicable to spheroids and finite circular cylinders, and spheroids are formed by rotating an ellipse about its minor (oblate spheroid) or major (prolate spheroid) axis (Mishchenko and Travis, 1998). The shape and size of a spheroid can be conveniently specified by the aspect ratio. The aspect ratio is greater than 1 for oblate spheroids, smaller than 1 for prolate spheroids, and equal to 1 for spheres. Therefore, the Mie scattering method can be regarded as a special case of the T-matrix method. In this study, in order to calculate the dust aerosol optical properties, the dust particles are assumed to be a sphere (aspect ratio equals 1) and an ellipsoid (aspect ratio equals 0.8). Furthermore, the differences in aerosol optical properties between different shape assumptions are discussed.
2.1.3 RTM
SBDART is an RTM that calculates the plane-parallel radiative transfer of the earth–atmosphere system (Ricchiazzi et al., 1998a). The broadband radiative flux at the TOA and the surface in clear-sky and dusty conditions can be obtained. It is conducive to analyzing the radiative transfer theory in satellite remote sensing and atmospheric energy budget studies. Furthermore, the model can flexibly set up aerosol properties, which is well suited to calculating the radiative effect of different types of aerosols. The SBDART model has been widely used in estimating the DRFEdust due to its design (Chen et al., 2011; Li et al., 2020; Iftikhar et al., 2018).
In this paper, the dust aerosol optical properties (the SSA and the ASYmmetry parameter, abbreviated as ASY) are calculated using spherical and non-spherical methods. The Aerosol Robotic Network (AERONET) retrieves the physical properties of aerosols, including volume size distribution and the complex refractive index, and optical properties, including the SSA and the ASY (Dubovik and King, 2000; Dubovik et al., 2006). The LSA from the Moderate Resolution Imaging Spectroradiometer (MODIS) surface albedo product and the default atmospheric profile of SBDART (MID-LATITUDE WINTER) are used as the input parameters for the SBDART model in simulating the DRFEdust. In the SBDART model, users can define the aerosol spectral dependence by a few wavelength points, and the aerosol optical properties are extrapolated to other wavelengths by a power law (Ricchiazzi et al., 1998b). Therefore, aerosol properties measured at four wavelengths are extrapolated so that flux calculations can be made in any desired wavelength across the shortwave spectrum (McComiskey et al., 2005). Therefore, the DREdust changing with the AOD due to both dust aerosol microphysical properties (including the complex refractive index and the distribution of the size) and optical properties (including the SSA and the ASY) are simulated by the SBDART model. The impacts of the microphysical properties and the optical properties of the dust aerosol on the DRFEdust at the TOA are analyzed in this study.
2.2 Data
This paper aims to analyze the differences in dust microphysical properties and the DRFEdust at the TOA over the Taklimakan Desert and Sahara to confirm the influences of dust aerosol microphysical properties on simulating the DRFEdust. Also, the advantages of the satellite-based method in estimating the DRFEdust at the TOA are analyzed. Therefore, the DRFEdust over the Taklimakan Desert and Sahara is estimated by using both satellite observations and dust microphysical properties.
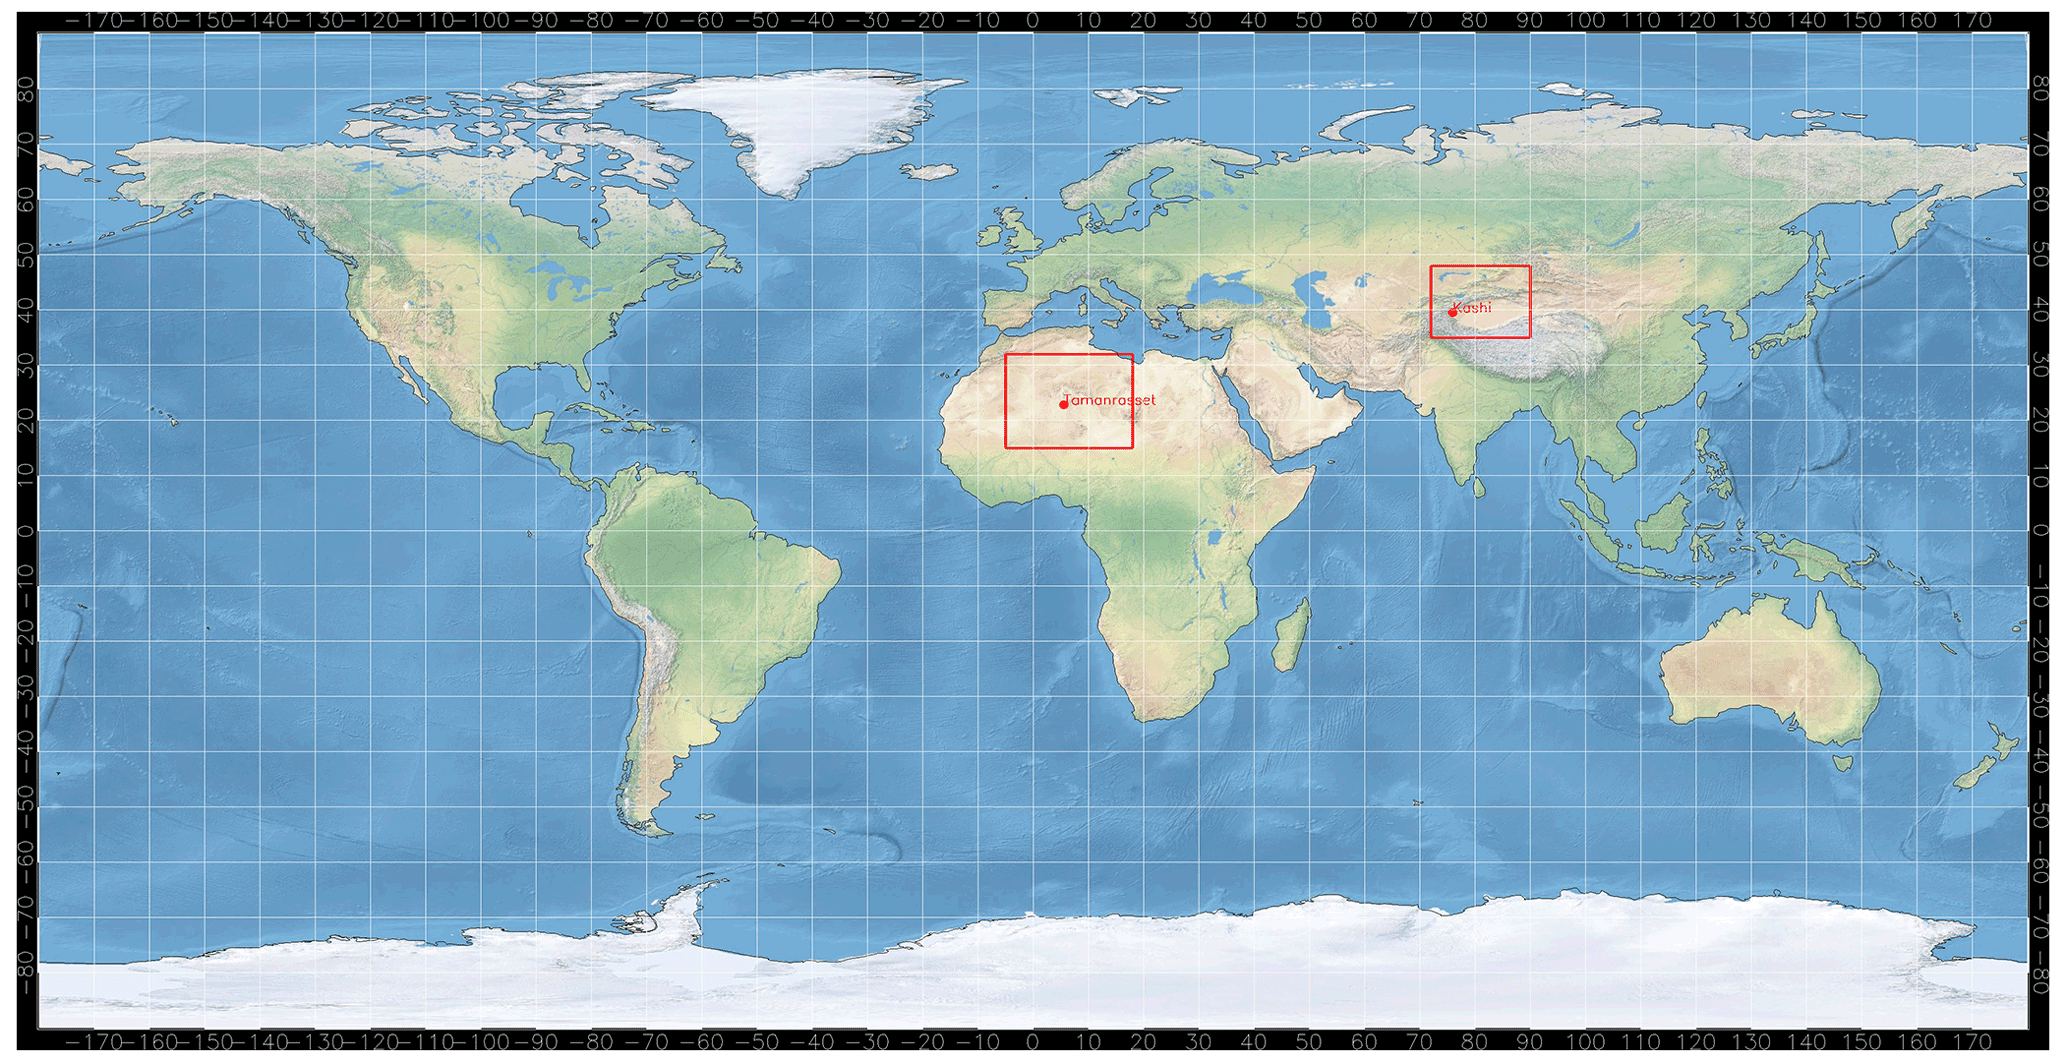
Figure 2The research regions and dust storms viewed by MODIS AQUA on 11 March and 9 April 2019.
Figure 2 shows the research regions (the red square areas) and the locations of in situ sites (Tamanrasset site and Kashi site, the red dots in the map and satellite images). Tamanrasset (22.79∘ N, 5.53∘ E; 1377 m above mean sea level) is located in southern Algeria, which is free of the influence of industrial activities. Thus, the aerosols measured in Tamanrasset can represent the pure dust aerosols from the Sahara around Tamanrasset (Guirado et al., 2014). Kashi (39.5∘ N, 75.9∘ E; 1320 m above mean sea level) is located in the vicinity of the Taklimakan Desert. Kashi represents a place affected by dust aerosols transported from the Taklimakan Desert (Li et al., 2020). Thus, dust aerosols observed in the Tamanrasset and Kashi sites are typical samples of the dust aerosols around these two sites in the Sahara and Taklimakan Desert. Moreover, the Tamanrasset and Kashi sites are similar in land surface type, altitude, and climate. As the LSA and the SZA have a great impact on the SW radiative effect, the regions with similar LSA and SZA are chosen to avoid the influence of different LSA and SZA on evaluating the differences in dust microphysical properties and dust radiative effect from different dust source regions.
Several dust storms occurred on 9, 11, and 14 March 2019 in the Sahara. In the Taklimakan Desert, dust storms occurred on 9, 23, and 25 April 2019. Figure 3 shows the LSA and the SZA observed by the AQUA satellite over the Sahara (Fig. 3a1–a3 and b1–b3) and Taklimakan Desert (Fig. 3c1–c3 and d1–d3) during dust storm episodes. In Fig. 3, the LSA and the SZA are similar in Tamanrasset and Kashi when the satellite passes through. The data around Tamanrasset and Kashi in March and April are suitable for analyzing the differences in dust microphysical properties and their influences on the DRFEdust.

Figure 3SW LSA and SZA over the Sahara and Taklimakan Desert derived from AQUA/MODIS.
Figure 4a1–a3 and c1–c3 present the true color images over the Sahara and Taklimakan Desert, respectively. Figure 4b1–b3 and d1–d3, respectively, present the cloud detections over the Sahara and Taklimakan Desert from AQUA/MODIS observations. The satellite crossed over the Sahara on 9 March (13:05 UTC), 11 March (12:55 UTC) and 14 March (13:20 UTC) 2019 and crossed over the Taklimakan Desert on 9 April (07:30), 23 April (07:40) and 25 April (07:30) 2019. The true color images and cloud detections clearly show that the Tamanrasset site and Kashi site were not covered by clouds during these dust storms. The satellite-observed and dust microphysical property data of the dust storms in March and April 2019 in Tamanrasset and Kashi are collected to analyze the dust microphysical properties and estimate the DRFEdust in the Sahara and Taklimakan Desert. Both the satellite data and synergy dust microphysical property data are collected around the Tamanrasset and Kashi sites for analyzing the differences in dust microphysical properties and estimating the DRFEdust.
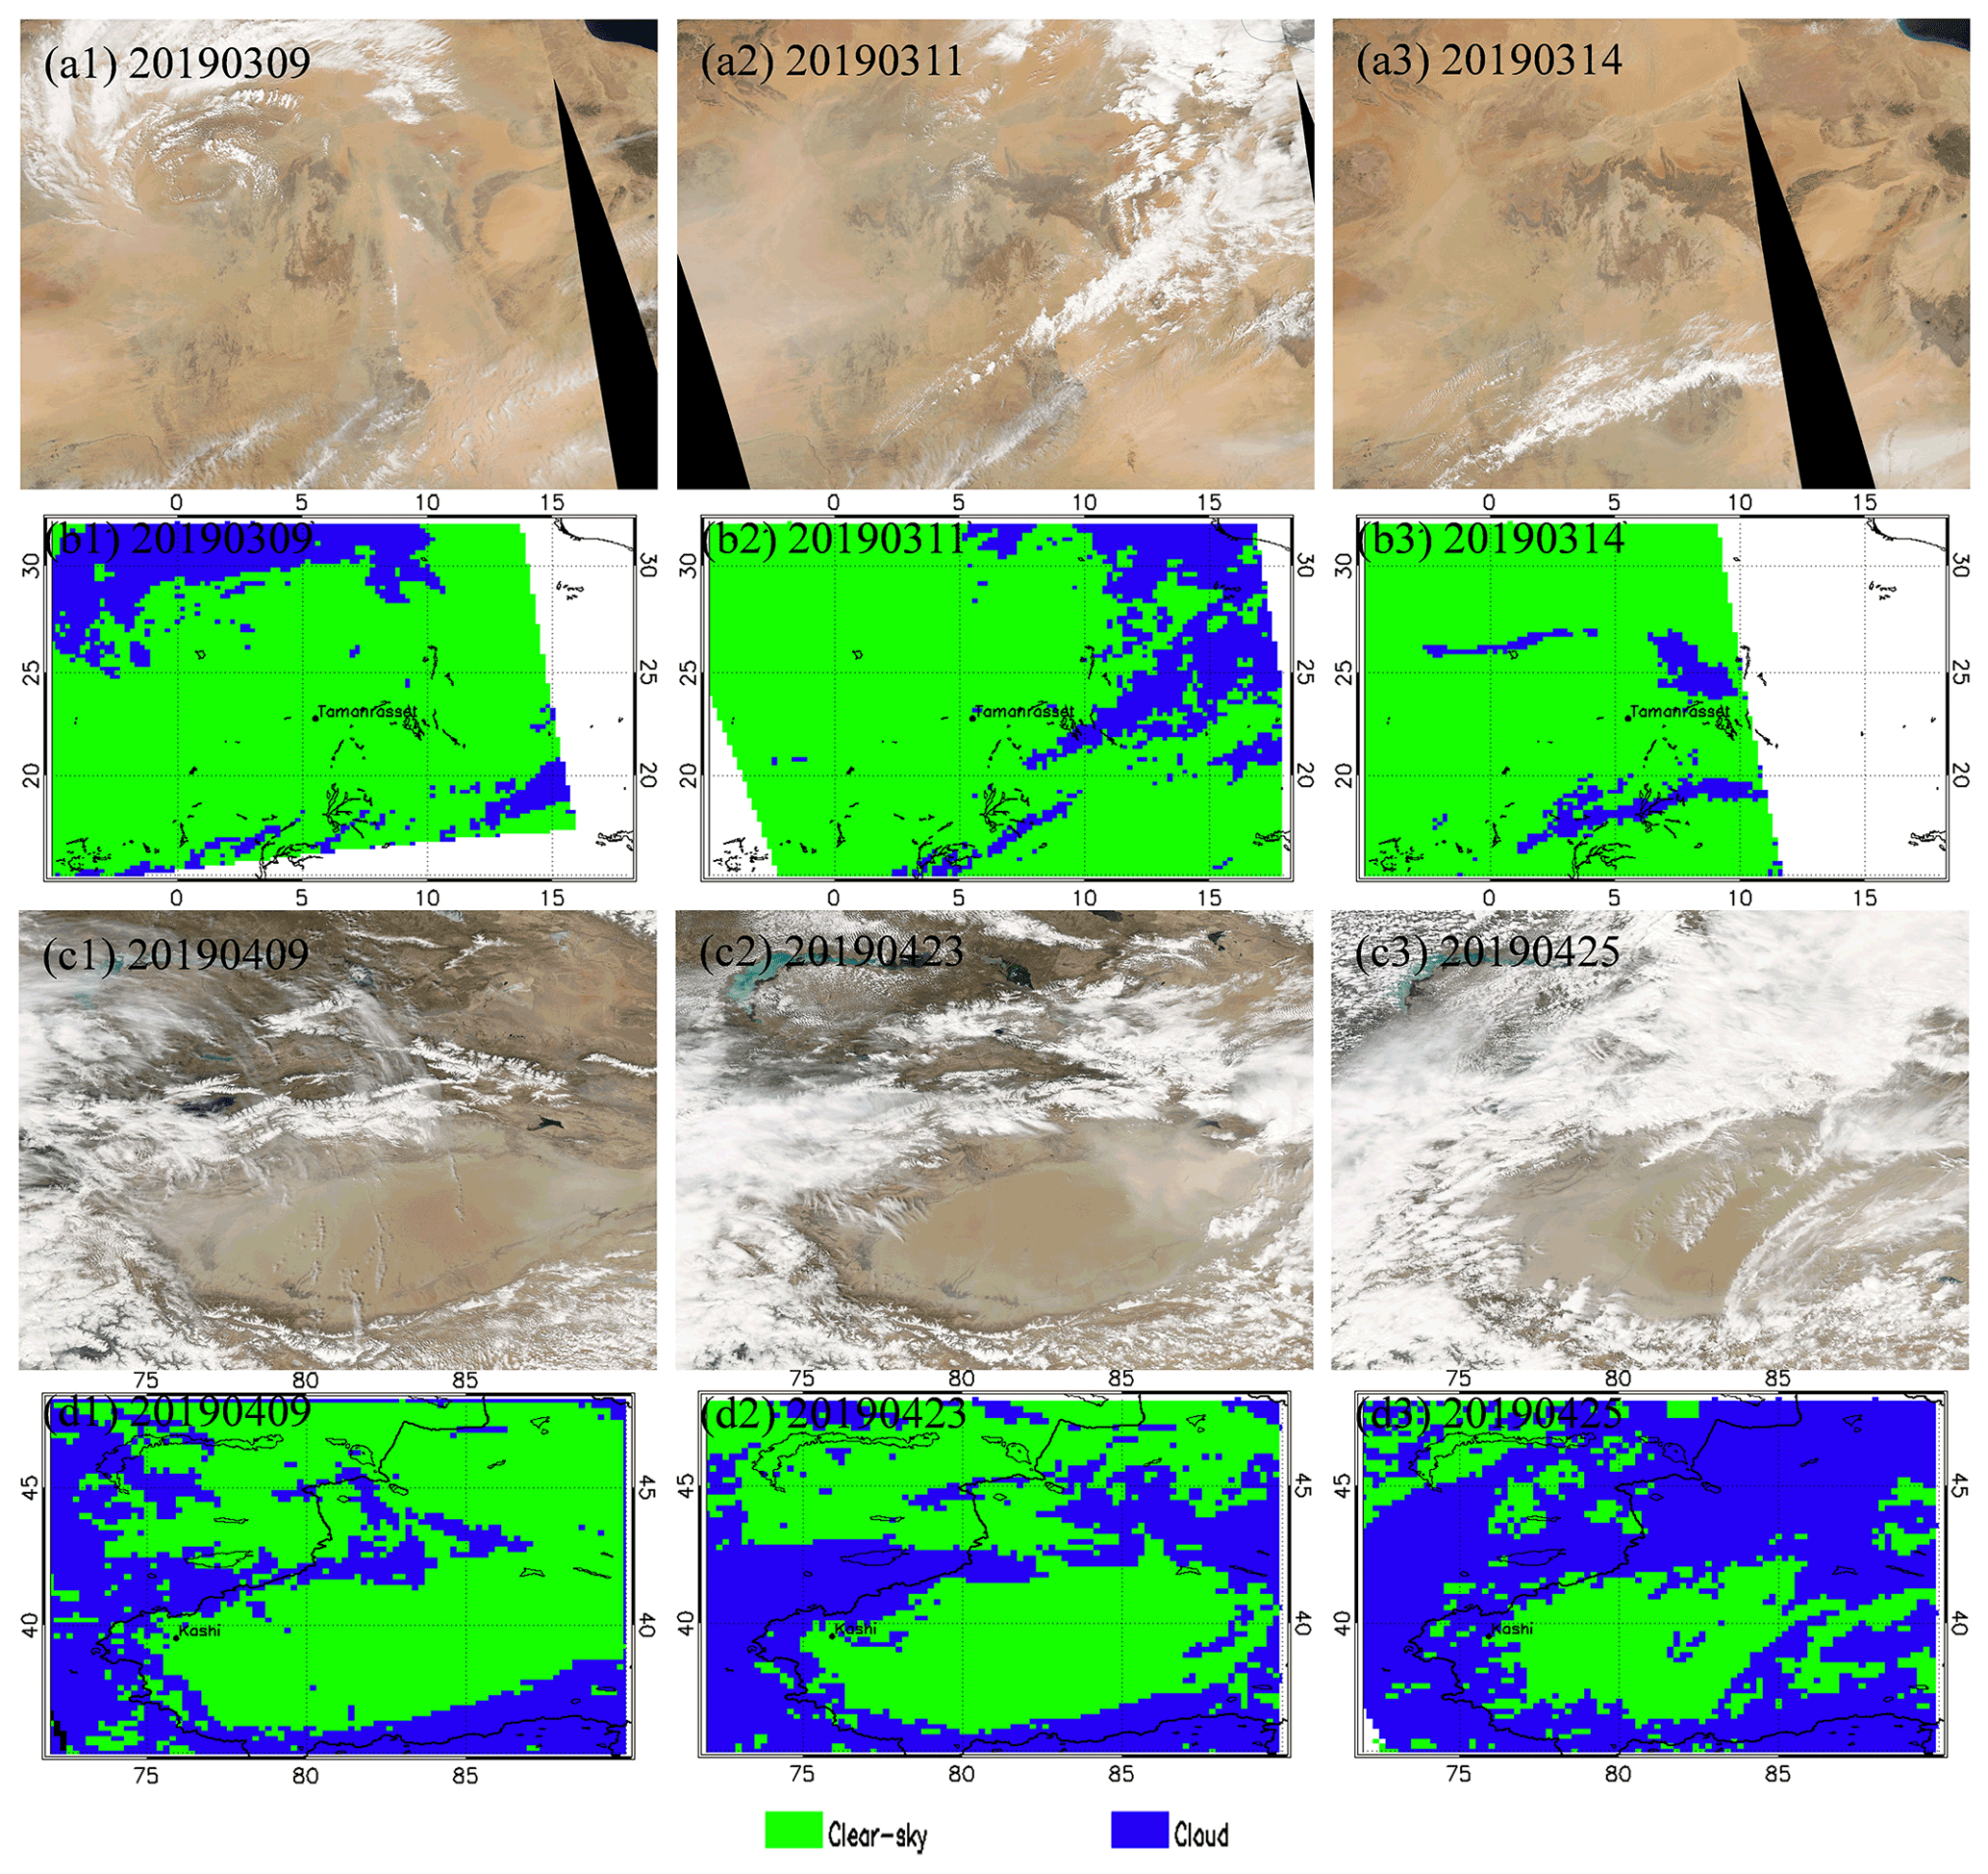
Figure 4True color images and cloud detections from AQUA/MODIS observations.
2.2.1 Satellite data
MODIS and CERES are the key instruments of the AQUA and TERRA satellites and are important in NASA's Earth Observing System (EOS). The AOD products from MODIS and the radiative flux products at the TOA from CERES can be synergistically used to estimate the DRFEdust directly.
Several algorithms were developed for MODIS AOD remote-sensing products after MODIS instruments were launched (Remer et al., 2005). Of these algorithms, the Deep Blue algorithm (Hsu et al., 2004) solved the problems in aerosol retrieval by satellite remote sensing for high-reflectance land surface types (such as arid, semi-arid, and desert areas) and retrieved the AOD over high-reflectance land surface types. In this paper, the Deep Blue AOD (0.55 µm) data are used to discriminate the dust storm regions. Since the Sahara and Taklimakan Desert are free of industrial activities, the major aerosol over the desert areas is dust aerosol, and the anthropogenic and marine aerosols have little contribution to the total AOD, especially during dust storm episodes. Thus, we directly use the AOD retrieved by MODIS to estimate DRFEdust during dust storms in this study. The LSA is also needed in both the satellite-based equi-albedo method and the RTM. The MODIS Collection6 albedo product dataset (MCD43C3) (Schaaf et al., 2002a, 2008, 2011) provides high-quality land surface reflectance and albedo data over various types of land surfaces by using an anisotropy retrieval algorithm (Jin et al., 2003; Liang et al., 2002; Liu et al., 2009; Román et al., 2010). The MCD43C3 product dataset is available from the Land Processes Distributed Active Archive Center (LP DAAC) of NASA. The SW white-sky albedo (WSA) and black-sky albedo (BSA) from the MCD43C3 product are used to get the SW broadband (0.3–5.0 µm) LSA. BSA and WSA mark the extreme cases of completely direct and completely diffuse illumination. Here, the LSA is calculated by interpolating from BSA and WSA (Lewis and Barnsley, 1994; Schaaf et al., 2002b).
The CERES Single Scanner Footprint (SSF) level-2 instantaneous SW flux data are available at http://ceres.larc.nasa.gov (last access: 10 October 2020). The CERES SSF is a unique product for studying the role of clouds, aerosols and radiation in climate. The CERES SSF level-2 dataset can provide the radiative flux at the TOA in three broadband channels. The radiative flux derived from CERES is co-located with the MODIS scene. Here the instantaneous SW channel (0.3–5.0 µm) radiative flux at the TOA from the CERES SSF level-2 dataset is used. MODIS and CERES are onboard in the same satellite platform (AQUA). The DREdust and the DRFEdust at the TOA are estimated by synergistically using MODIS and CERES products.
2.2.2 Dust microphysical property data
The Aerosol Robotic Network (AERONET) (Holben et al., 1998) is the largest ground-based network for measuring aerosols with more than 400 sites installed.
AERONET provides microphysical properties and optical properties of the aerosols at four wavelengths (440, 675, 870, and 1020 nm). The AOD product is directly measured by the sun photometer. The inversion algorithm retrieves the physical properties of aerosols, such as volume size distributions and the complex refractive index, and optical properties such as the SSA and the ASY (Dubovik and King, 2000; Dubovik et al., 2006).
Figure 5 shows the TOA SW radiative flux measured by CERES over the Sahara in March 2019 and that over the Taklimakan Desert in April 2019 during the dust storm episodes. The TOA SW radiative flux distribution shows the highest value over cloud conditions (the cloud regions can be found from Fig. 4). The values in dust storm regions are higher than those in clear-sky regions. It is due to the SW albedo of the dust aerosols, and cloud is higher than the land surface albedo.
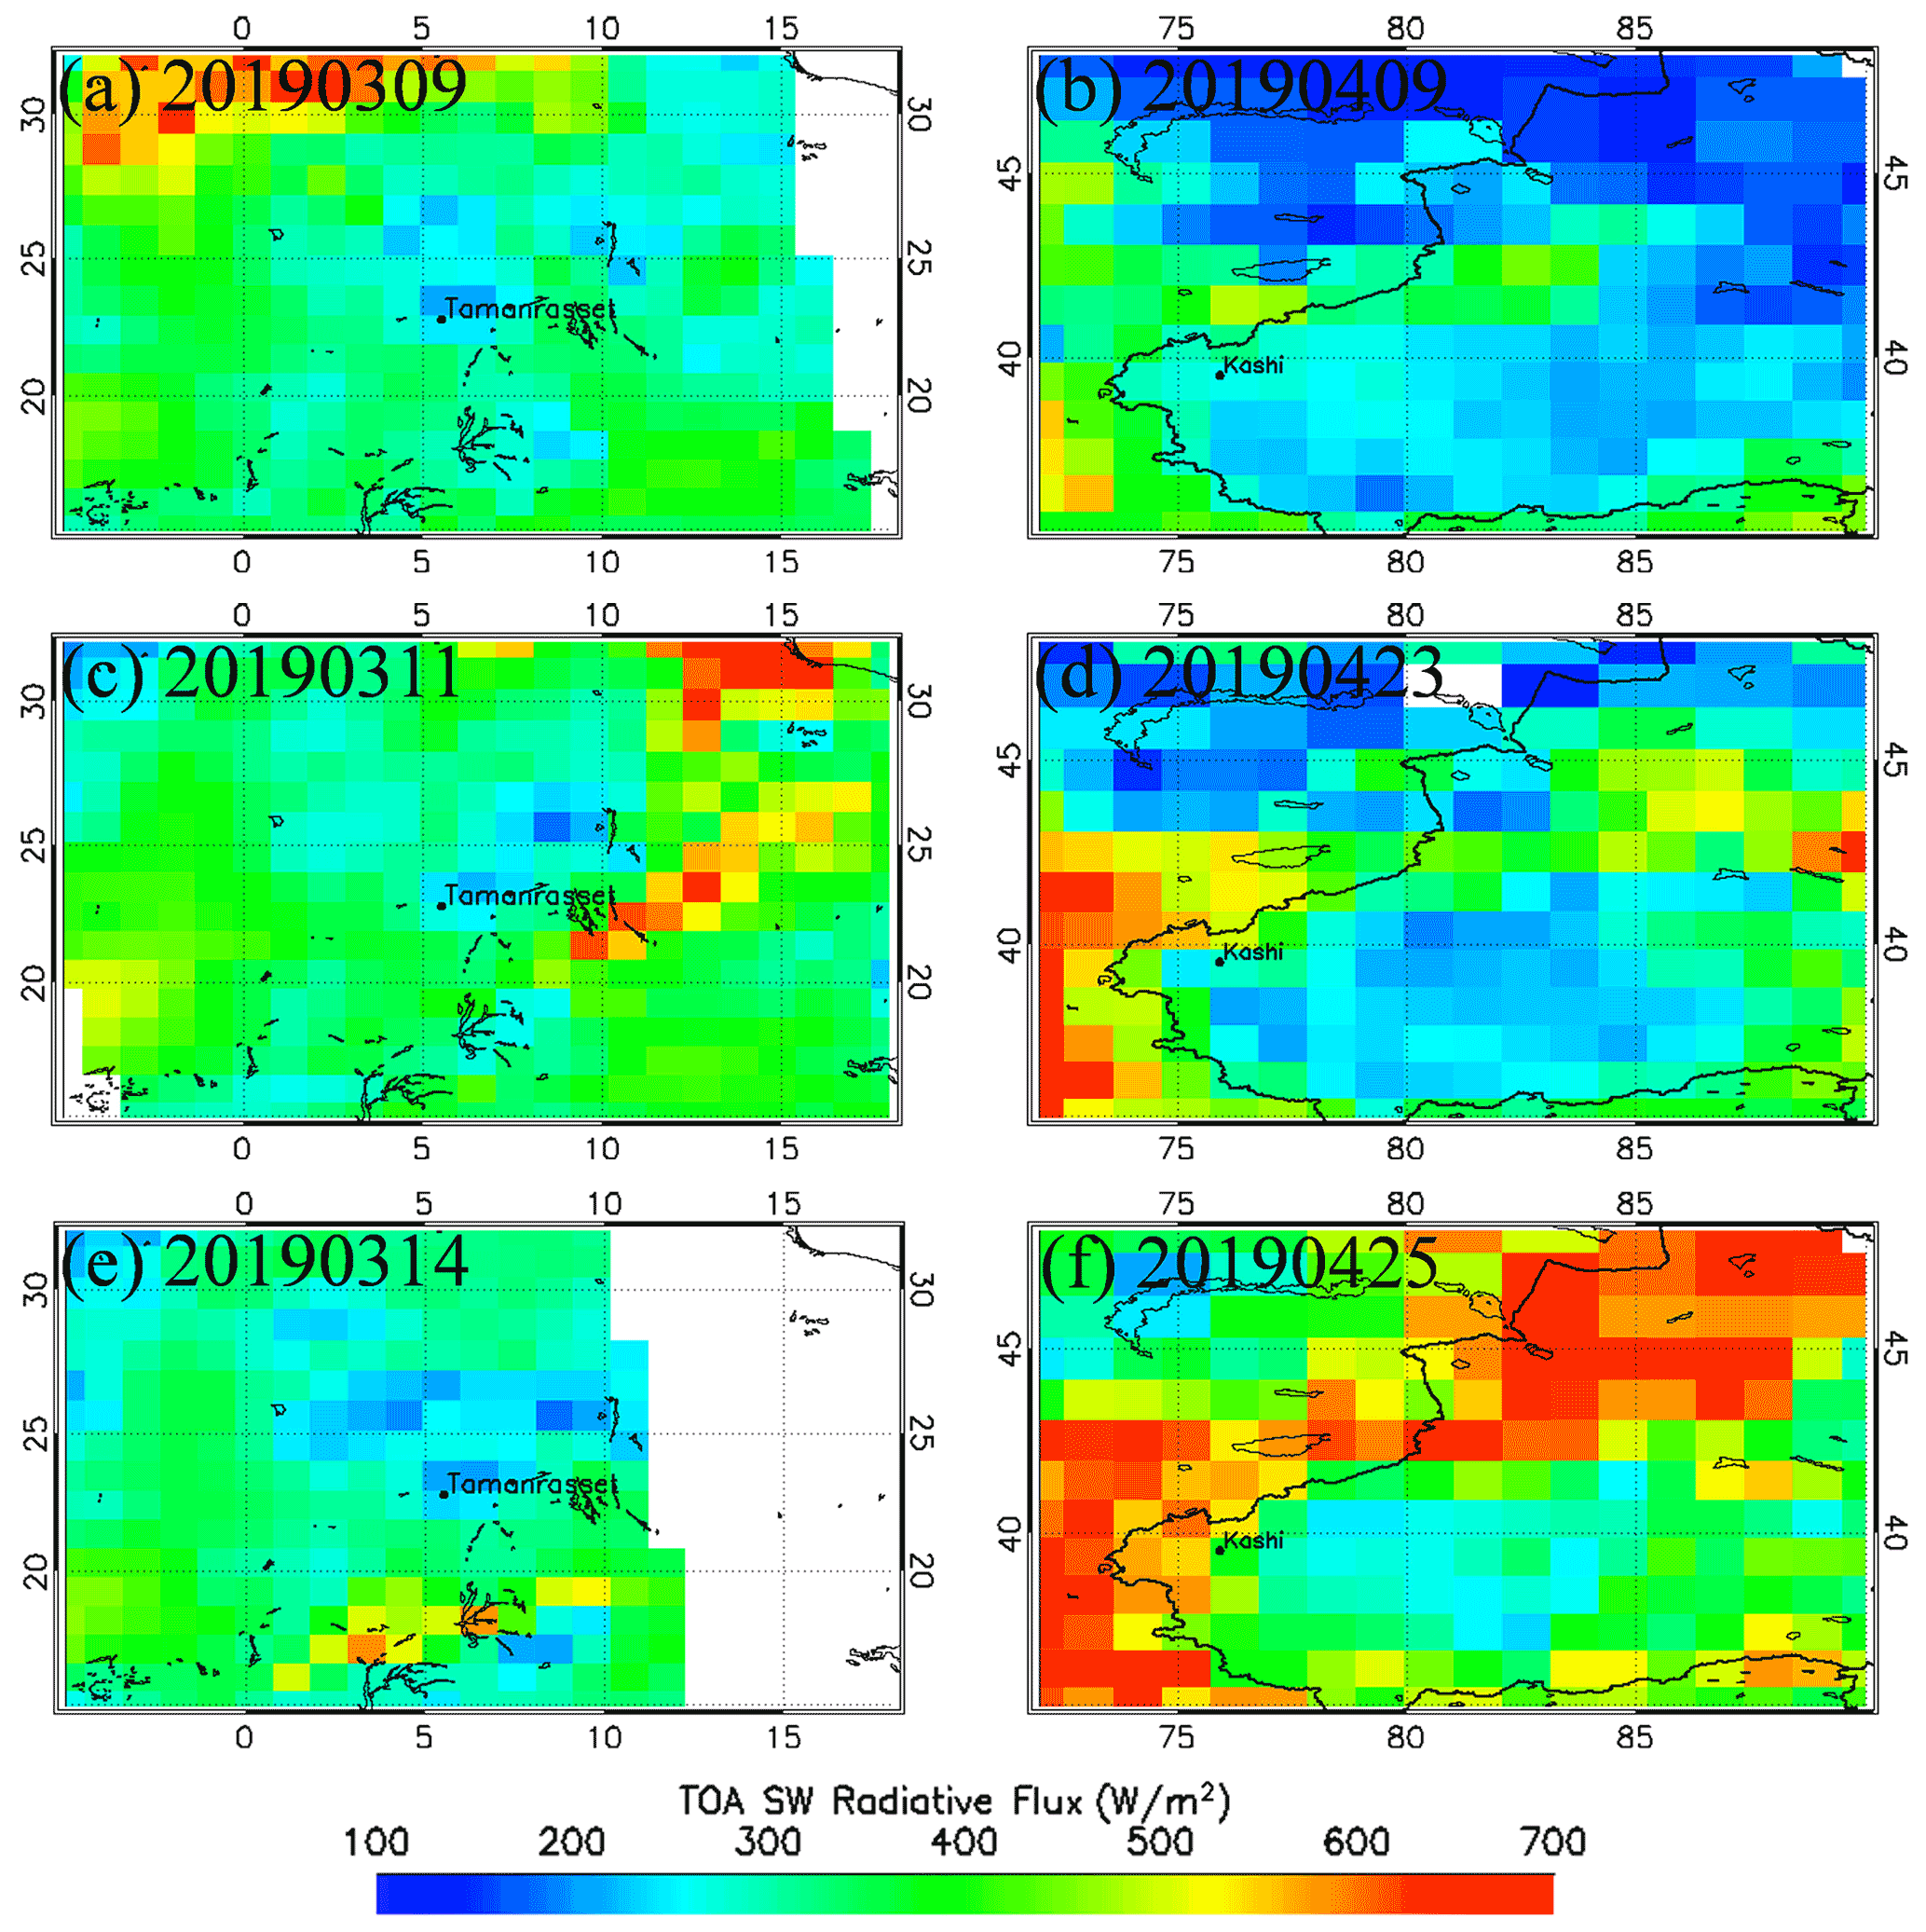
Figure 5TOA SW radiative flux derived from AQUA/CERES over the Sahara in March 2019 and over the Taklimakan Desert in April 2019.
As shown in Figs. 3, 5 and 6, the spatial resolution of TOA flux from the CERES/SSF product is , and LSA, SZA, and AOD data from satellites have different spatial resolutions. In order to match up LSA, SZA and AOD data with CERES TOA SW fluxes, we have resampled LSA, SZA and AOD data following the horizontal spatial resolution of CERES SSF products. Following the equi-albedo method (Tian et al., 2019), the Fclr and DREdust over the Sahara and Taklimakan Desert can be estimated based on the measurements from MODIS and CERES, both onboard the AQUA satellite.

Figure 6AOD and DREdust of dust storms over the Sahara in March 2019 and over the Taklimakan Desert in April 2019.
MODIS L2 Deep Blue AOD products of the dust storm over the Sahara in March 2019 and that over the Taklimakan Desert in April 2019 are shown in Fig. 6a1–a3 and 6c1–c3, respectively. The missing data are shown in white; the high dust-loading regions are shown in red; the low dust-loading regions are shown in blue. The AOD distribution maps show that there were heavy dust storms over the Sahara and Taklimakan Desert with AOD greater than 1.0 detected by MODIS.
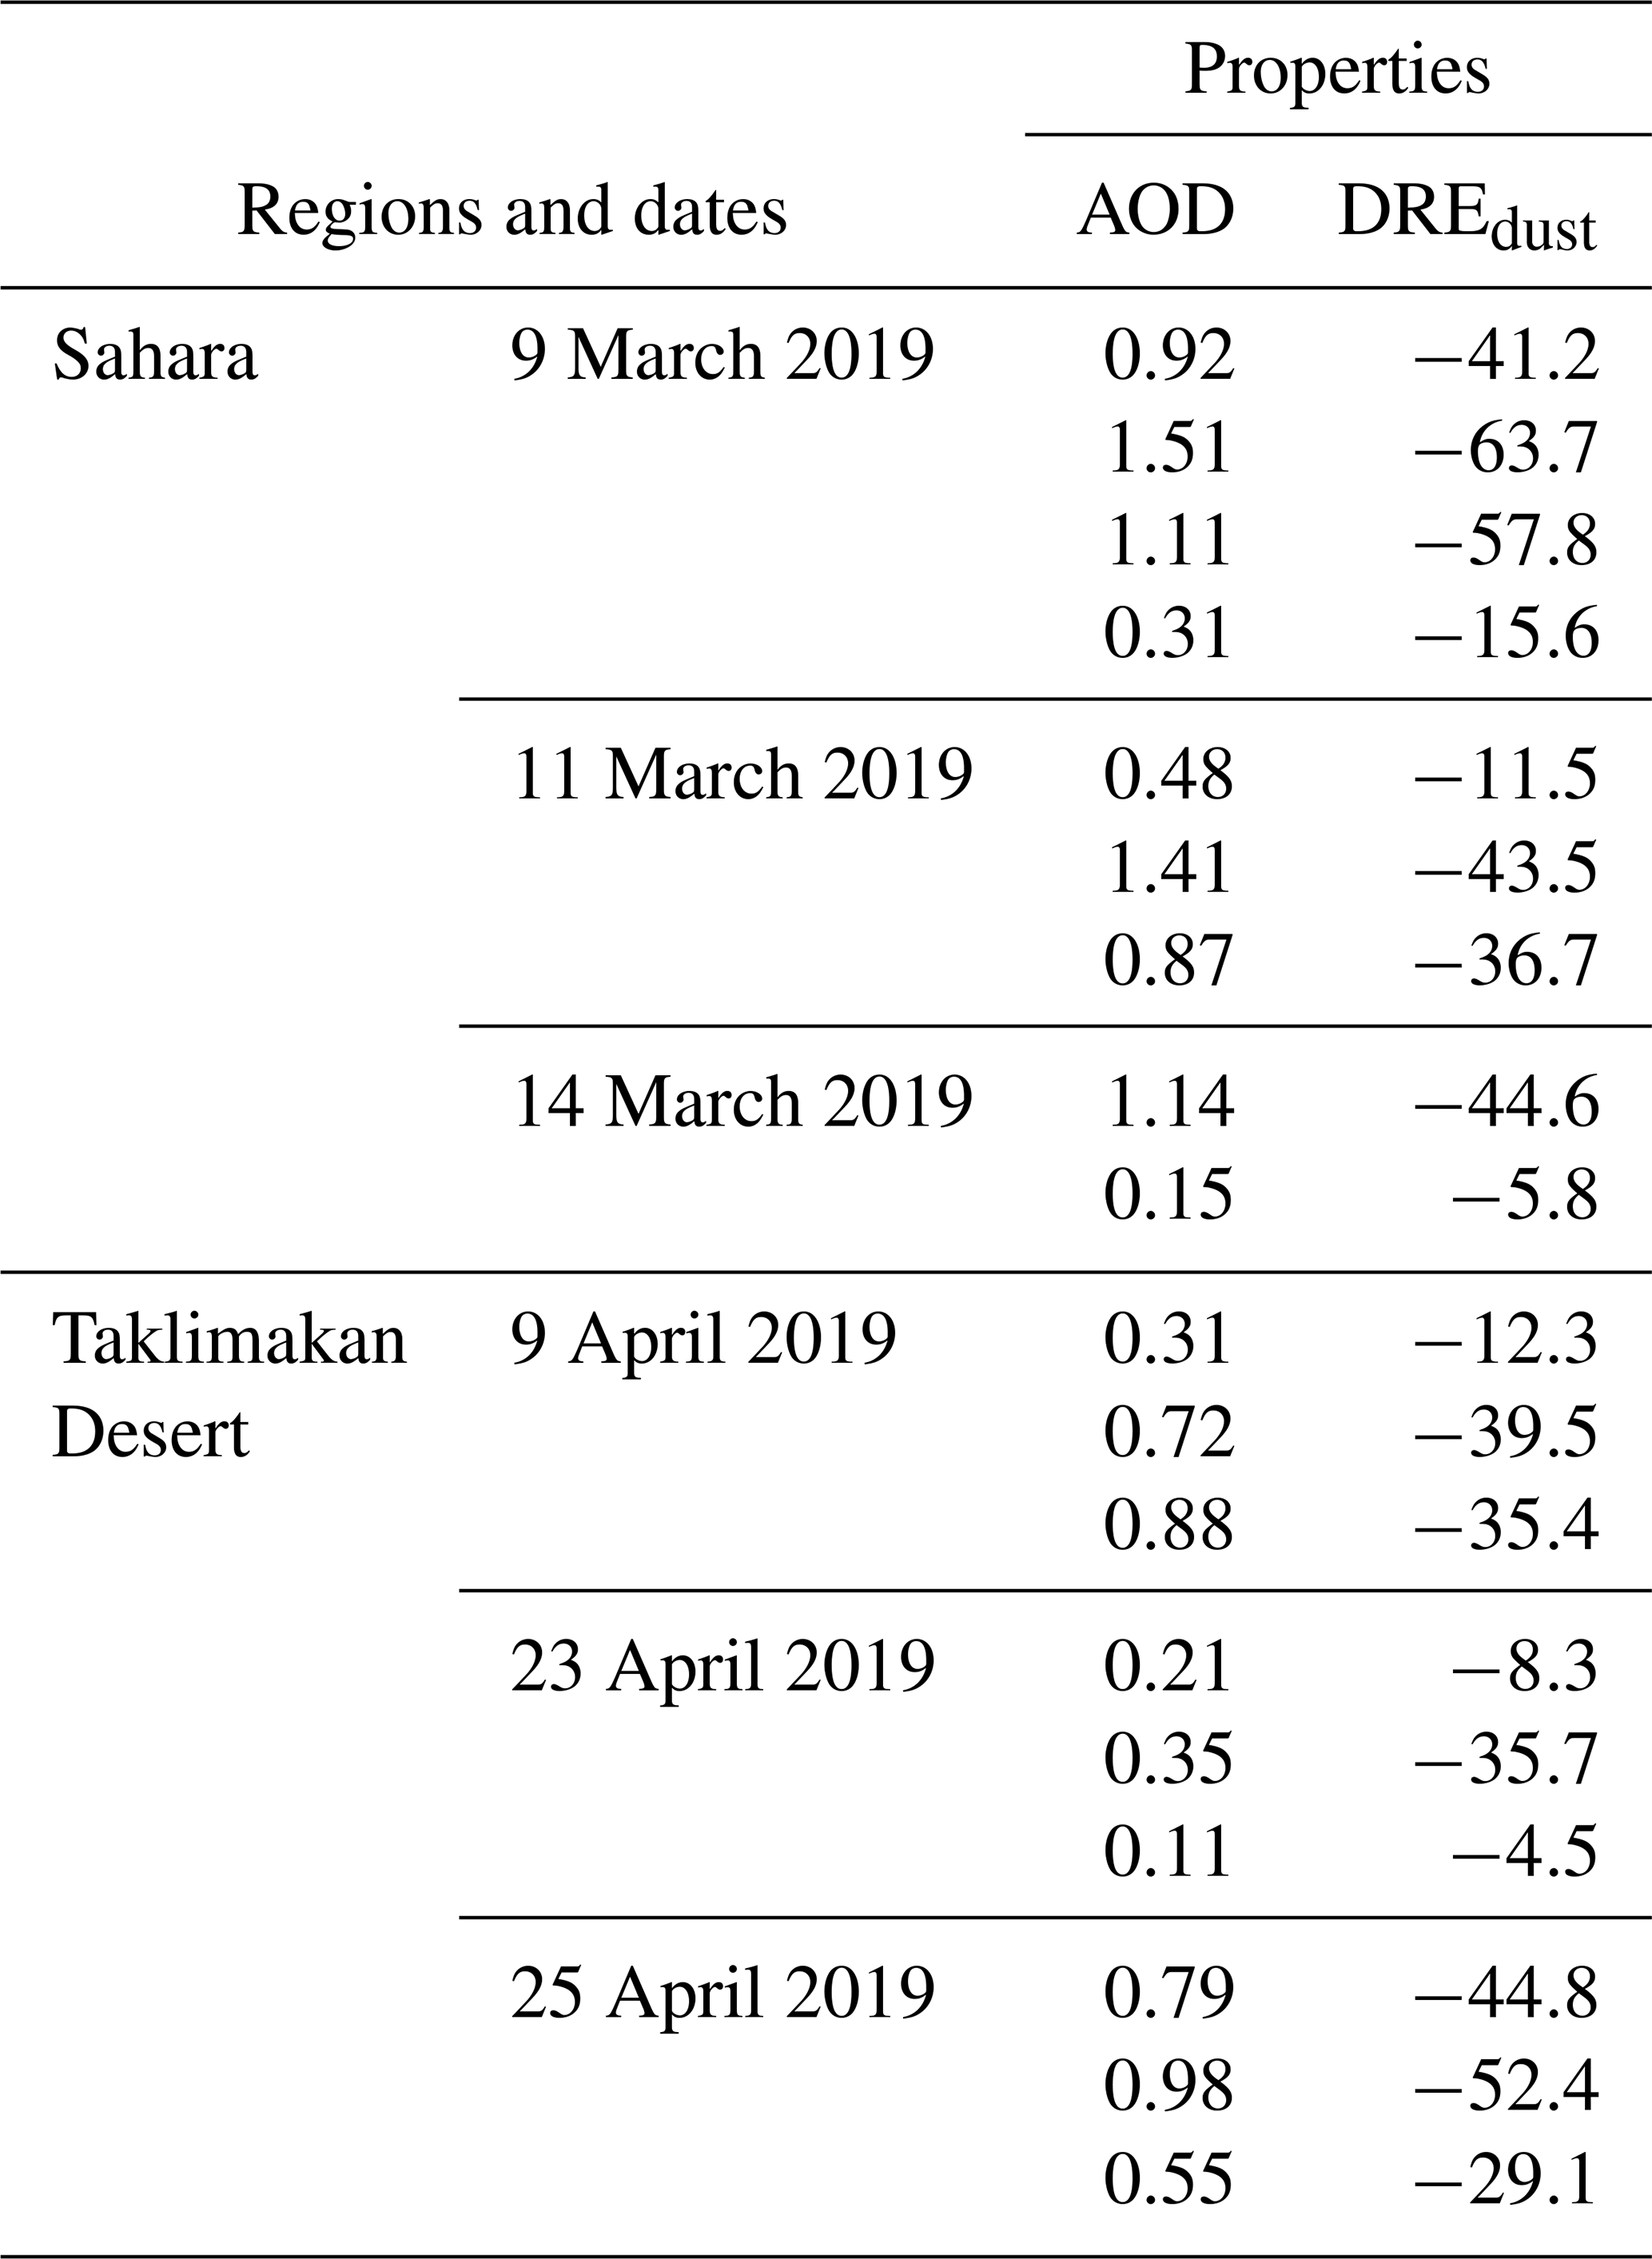
Figure 6b1–b3 and d1–d3 show the distribution maps of the DREdust at the TOA. The high dust aerosol-loading regions show significant negative radiative forcing. It indicates that the dust aerosol loading is negatively correlated with the DREdust in these dust storm events. Thus, dust aerosols have a negative radiative effect in the SW spectrum. The distribution maps of the LSA and the SZA (Fig. 3) show that the mean SW LSA measured by MODIS is around 0.18 and the mean SZA is around 35∘ in Tamanrasset and Kashi. The distribution maps also show that the LSA and SZA vary greatly in the same satellite scan image. In our previous study, we found that DREdust at the TOA was significantly influenced by LSA and SZA (Tian et al., 2019). To avoid the influence of the LSA and SZA in estimating the DRFEdust, we estimate DRFEdust using pixels with similar LSAs and SZAs. Furthermore, the values of AOD and cloud could also influence the regions we selected. The Deep Blue algorithm-retrieved AOD has large uncertainties in the small-value areas. The cloud-free pixels with AOD greater than 0.1 and with the LSA of 0.16–0.20 and the SZA of 32–38∘ are chosen to estimate the DRFEdust. Therefore, only a few pixels with similar values of the LSA and the SZA at Tamanrasset and Kashi are picked for estimating the DREdust and DRFEdust at the TOA. These chosen pixels are surrounded by black borders in Fig. 6b1–b3 and d1–d3. The influences of the dust microphysical properties on the DRFEdust are investigated. These pixels of the DREdust and its co-located AOD values are illustrated in Table 1.
Table 1DREdust at the TOA and AOD over the Sahara in March 2019 and that over the Taklimakan Desert in April 2019 during the dust storms.
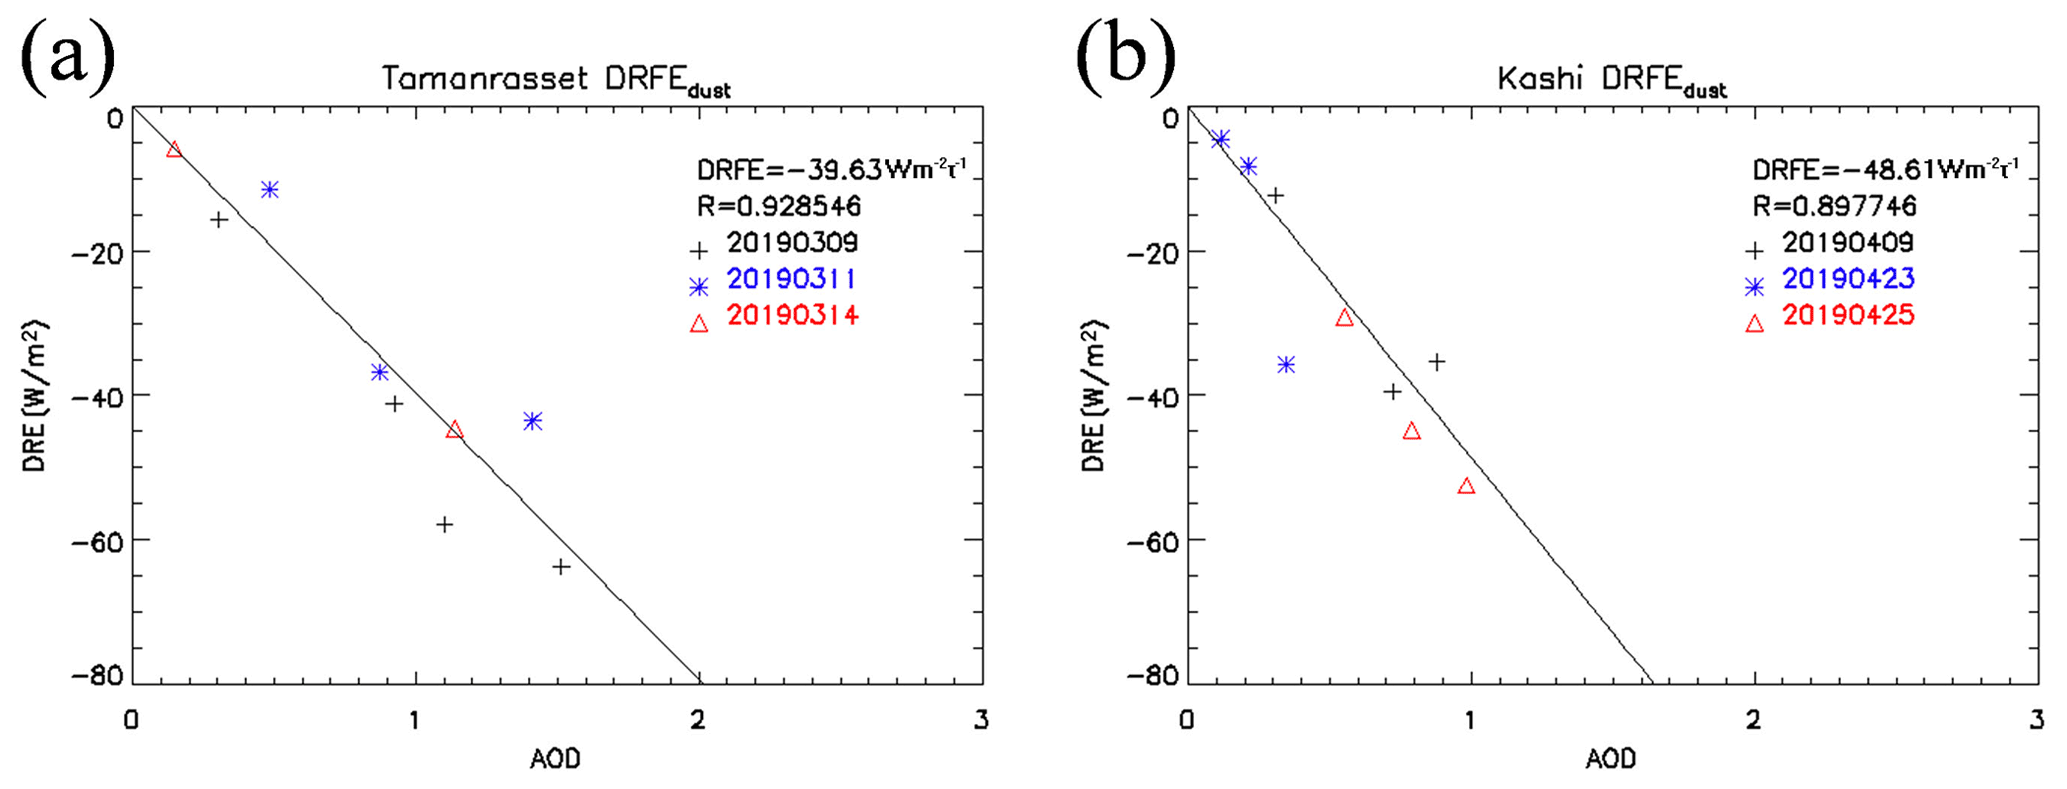
According to the definition, the DRFEdust represents the DREdust per unit AOD during these storms in the dust source regions. Therefore, the DRFEdust can be estimated by fitting the DREdust and the AOD.
The linear relationship between the DREdust and the AOD (0.55 µm) can be found during dust storms around Tamanrasset and Kashi, which is also investigated in previous studies (Kumar et al., 2015; Jose et al., 2016). Then, the DRFEdust can be estimated by regressing the DREdust and the AOD. In Fig. 7, the mean DRFEdust of the dust storms is −39.6 W m over Tamanrasset and −48.6 W m over Kashi. The correlation coefficients are high, with R=0.92 in March 2019 over Tamanrasset and R=0.89 in April 2019 over Kashi. The AOD and DREdust values are well correlated. Positive dust AOD is associated with negative DREdust.
The equi-albedo method directly estimates the DREdust and the DRFEdust based on the satellite observations. Therefore, the accuracy of the results (DREdust and DRFEdust) derived from the equi-albedo method is highly dependent on the accuracy of satellite observations. Therefore, the uncertainties of the DRFEdust derived from the equi-albedo method mainly include the instantaneous SW flux error from CERES measurements, the estimation uncertainties of the Fclr over the dust storm region, and the uncertainty in the Deep Blue AOD product. Besides, according to our sensitivity test in the previous study (Tian et al., 2019), the atmospheric profile, water vapor and height of the dust layer have a insignificant influence on SW radiative flux at the TOA. It is reasonable to use the same water vapor and pre-defined vertical distribution for dust aerosols in one scene of satellite data. However, the assumption about pixels having the same water vapor and the pre-defined aerosol vertical distribution over one scene of satellite data still cause small uncertainties.
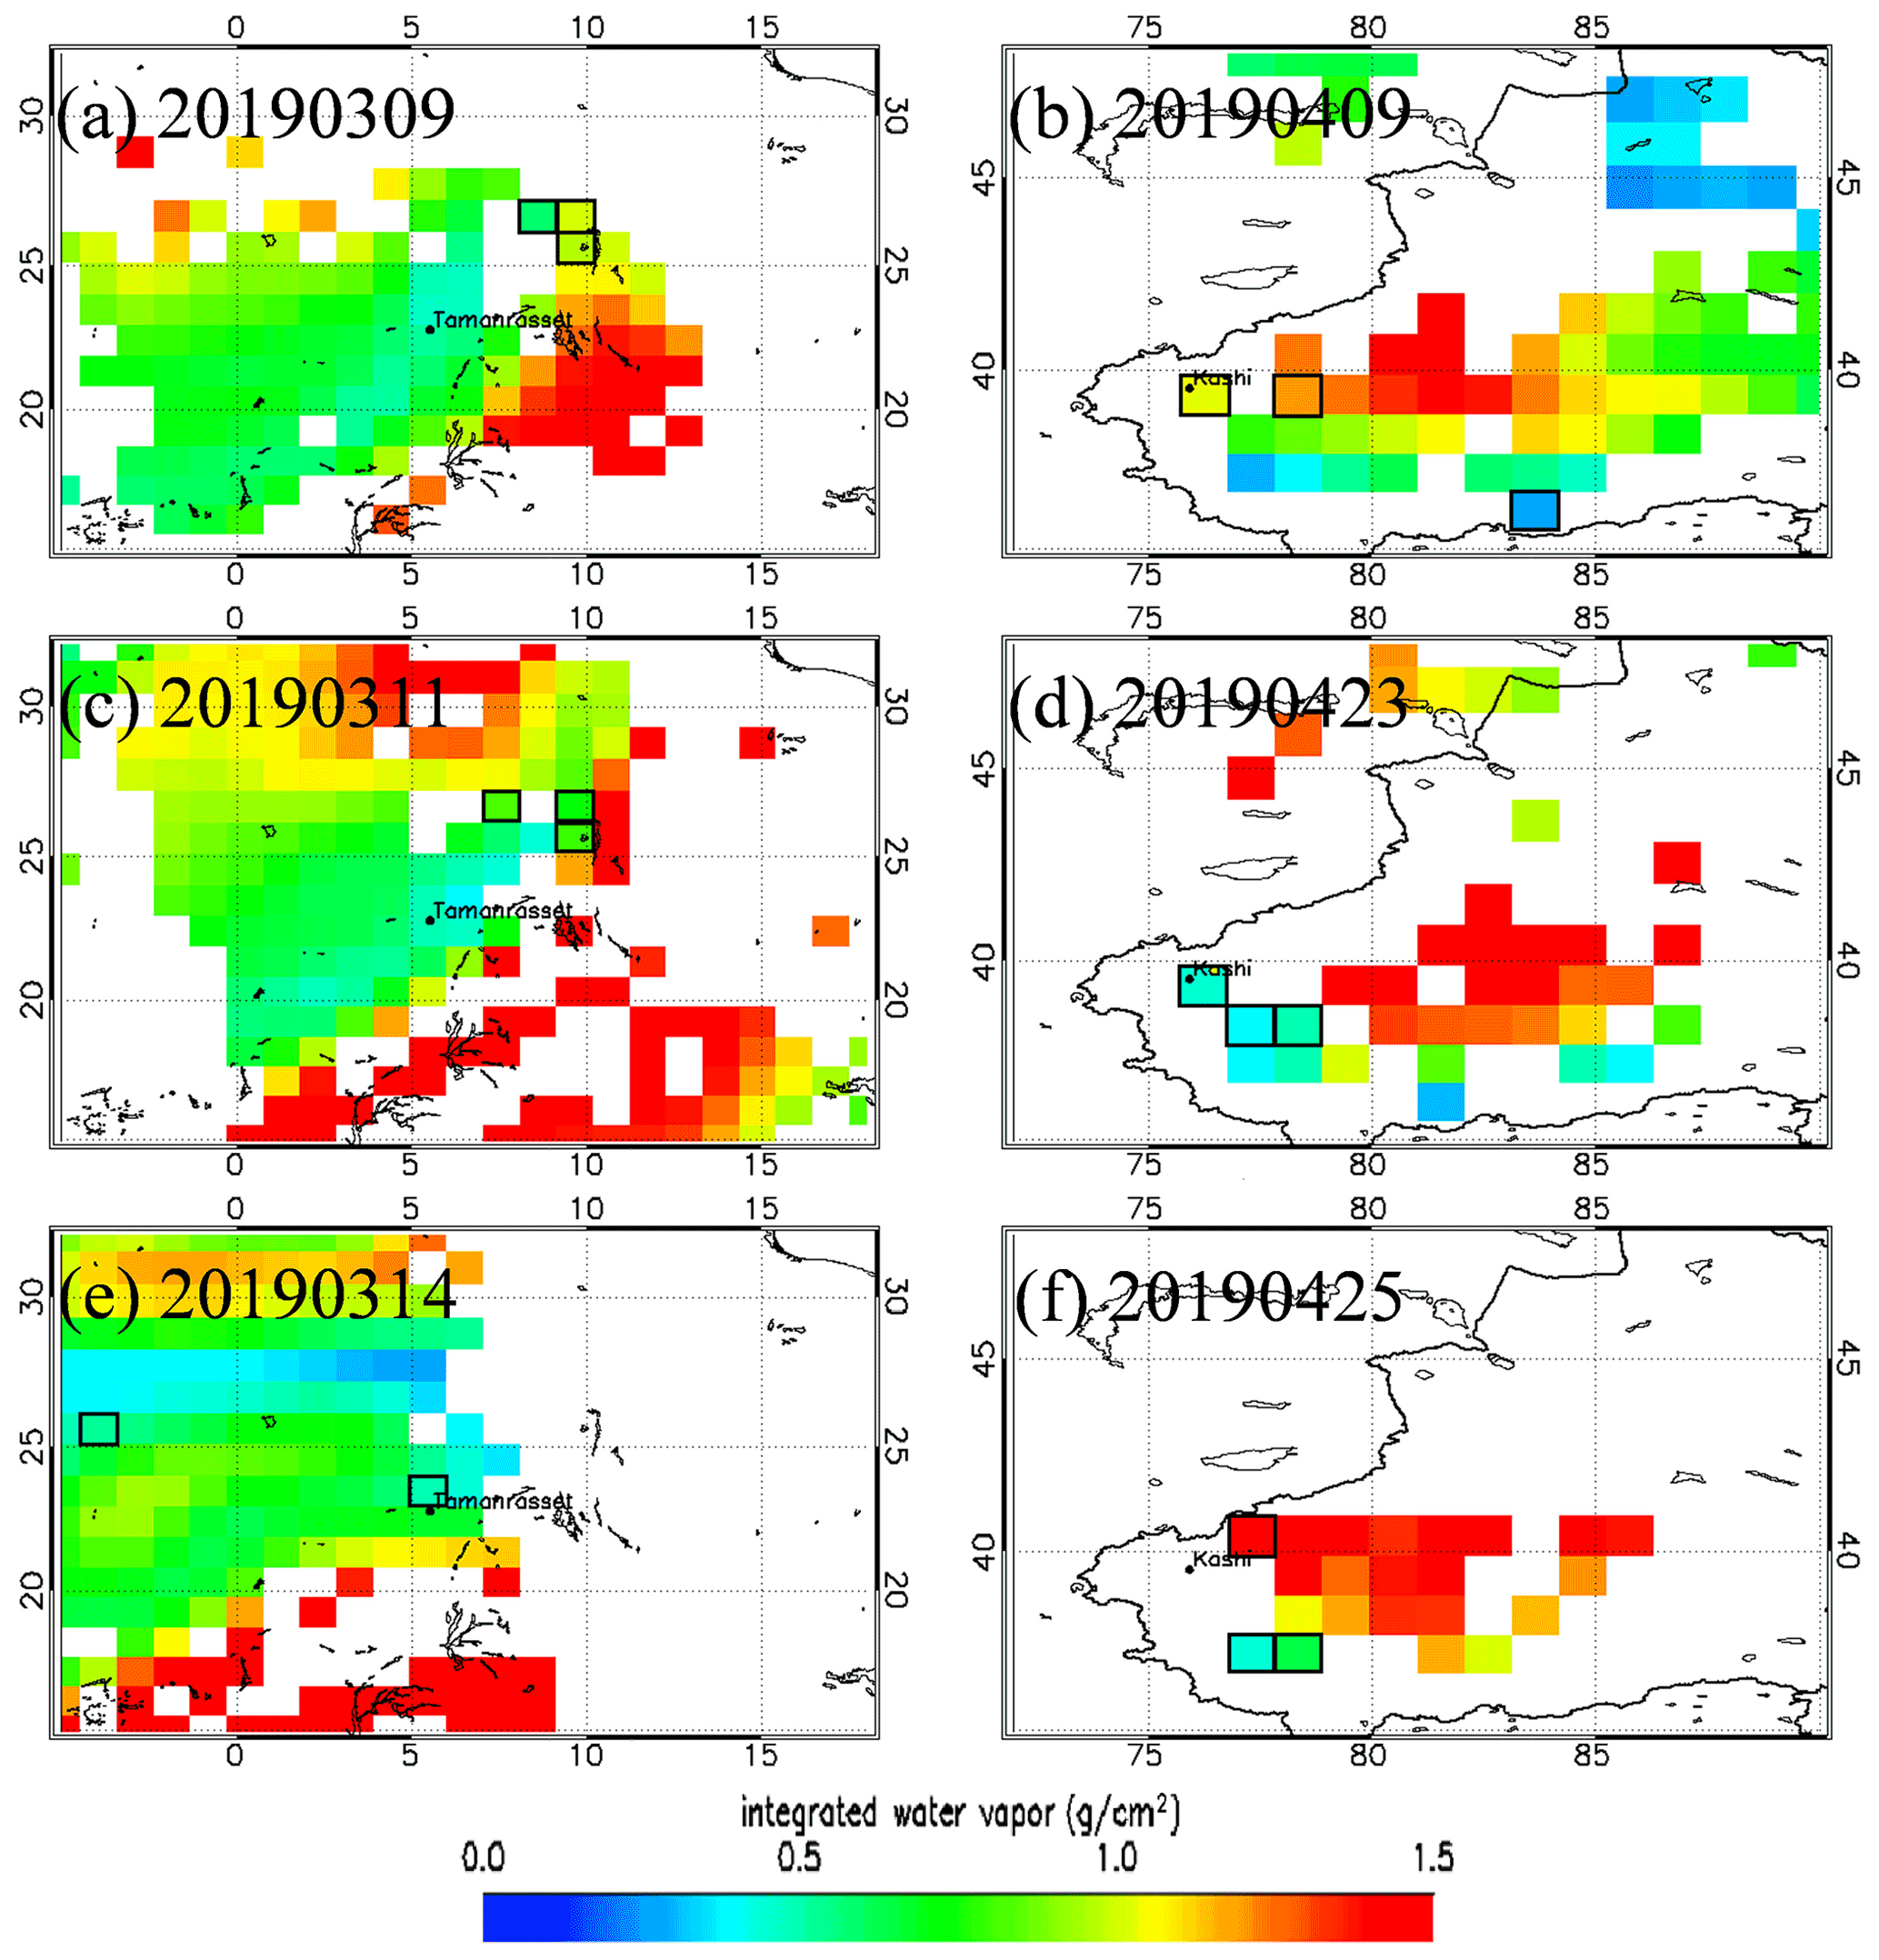
Figure 8Integrated water vapor (g/cm2) from the European Centre for Medium-Range Weather Forecasts (ECMWF) reanalysis dataset over the Sahara in March 2019 and over the Taklimakan Desert in April 2019.
Figure 8 shows the integrated water vapor from the ECMWF reanalysis dataset over the Sahara in March 2019 and over the Taklimakan Desert in April 2019. The grids surrounded by black borders are the chosen pixels to estimate the DRFEdust. The integrated water vapor varies little over different research areas, and the mean differences in chosen pixels are 0.51 and 0.18 g/cm2 over the Sahara and Taklimakan Desert, respectively. In order to estimate the uncertainties caused by the variation of integrated water vapor over the chosen pixels, we have calculated the SW radiative flux at the TOA under different integrated water vapor based on the SBDART model.
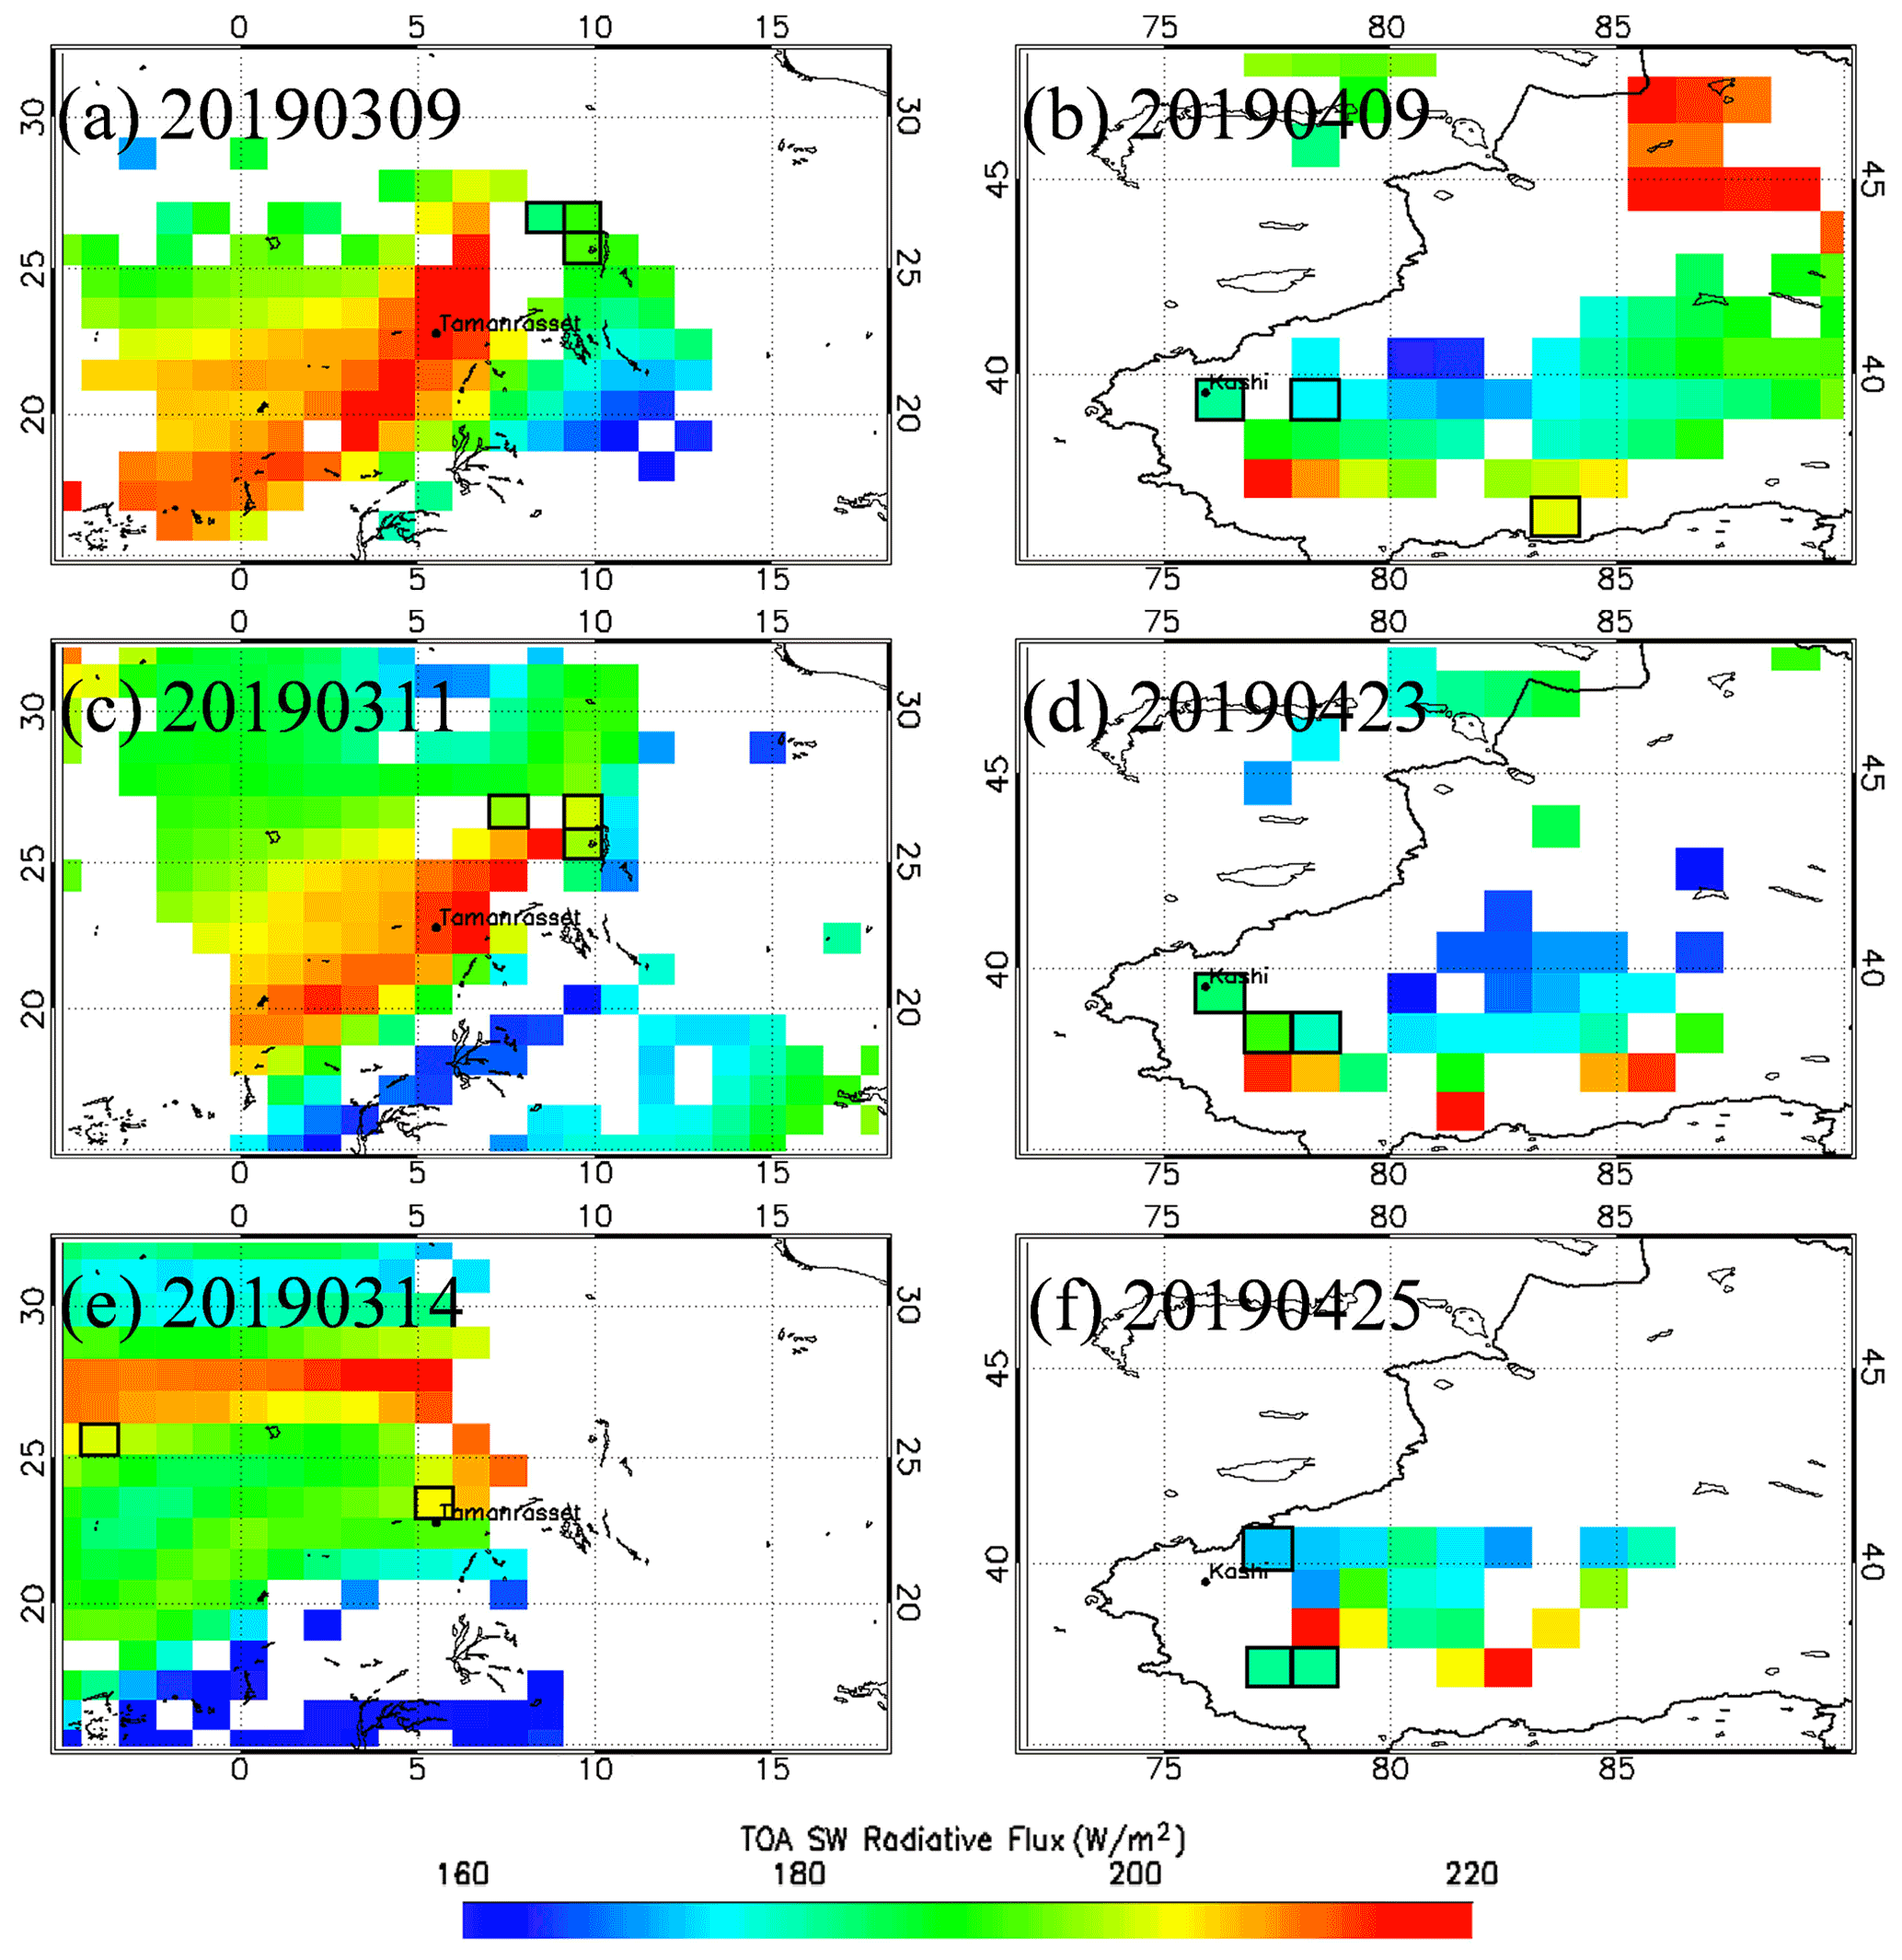
Figure 9SBDART-simulated clear-sky TOA radiative flux by using integrated water vapor (g/cm2) from the ECMWF reanalysis dataset over the Sahara in March 2019 and over the Taklimakan Desert in April 2019.
Figure 9 shows the SBDART-simulated clear-sky TOA radiative flux by using the integrated water vapor from the ECMWF reanalysis dataset over the Sahara in March 2019 and over the Taklimakan Desert in April 2019, and the grids surrounded by black borders are the chosen pixels to derive the DRFEdust. The regional mean differences in TOA radiative flux are 2.21 % and 0.85 % over the Sahara and Taklimakan Desert, respectively. This indicates that the variation of integrated water vapor cloud causes uncertainties in TOA radiative flux of 2.21 % and 0.85 % over the Sahara and Taklimakan Desert.
For the assumption of a vertical profile for dust aerosols, we have also tested the sensitivity of radiative flux at the TOA to various heights of the dust layer with the SBDART model.

Figure 10The sensitivity test of SW radiative flux at the TOA to various heights of the dust layer.
As shown in Fig. 10, the SW radiative flux at the TOA decreases with the increase in the height of the dust layer. However, the SW radiative flux changes little (within 1.5 W m−2, 0.47 %) with the increase in the height of the dust layer.
According to our previous study (Tian et al., 2019), the instantaneous SW flux error from CERES measurements is about 3.13 %, the estimation uncertainty of the Fclr is 3.15 %, and the uncertainty of the Deep Blue AOD retrieved by MODIS is about 15 % (Sayer et al., 2014). Over one scene of satellite data, the uncertainties of using the same water vapor in Kashi and Tamanrasset are 2.21 % and 0.85 %, respectively, and the uncertainty caused by pre-defined aerosol vertical distribution is also estimated, which is about 0.47 %. Then, the total uncertainties of the DRFEdust can be calculated by Eq. (3) (Zhang et al., 2005).
Us is the synthetical uncertainty factor of each source of the uncertainty (including the instantaneous SW flux error from CERES measurements, the estimation uncertainty of the Fclr, and the uncertainty of the Deep Blue AOD retrieved by MODIS). Ut is the total uncertainty of the DRFEdust, which is 25.37 % and 28.19 % (10.0 and 13.7 W m) in Tamanrasset and Kashi, respectively. Therefore, the DRFEdust are W m in March 2019 over Tamanrasset and W m in April 2019 over Kashi.
4.1 Dust microphysical properties
The inversion of sun-photometry optical data to obtain particle microphysical properties has been done through numerous approaches. Currently, the AERONET inversion algorithm makes use of direct sun and sky radiance measurements (Dubovik et al., 2006; Dubovik and King, 2000).
The focuses of this paper are the differences in the dust microphysical properties from different dust source regions and the impacts of the dust microphysical properties on the DRFEdust simulation. As important parameters concerning the radiative impacts, the volume size distribution and the refractive index of the dust aerosol are compared in the dust storms over Tamanrasset and Kashi.
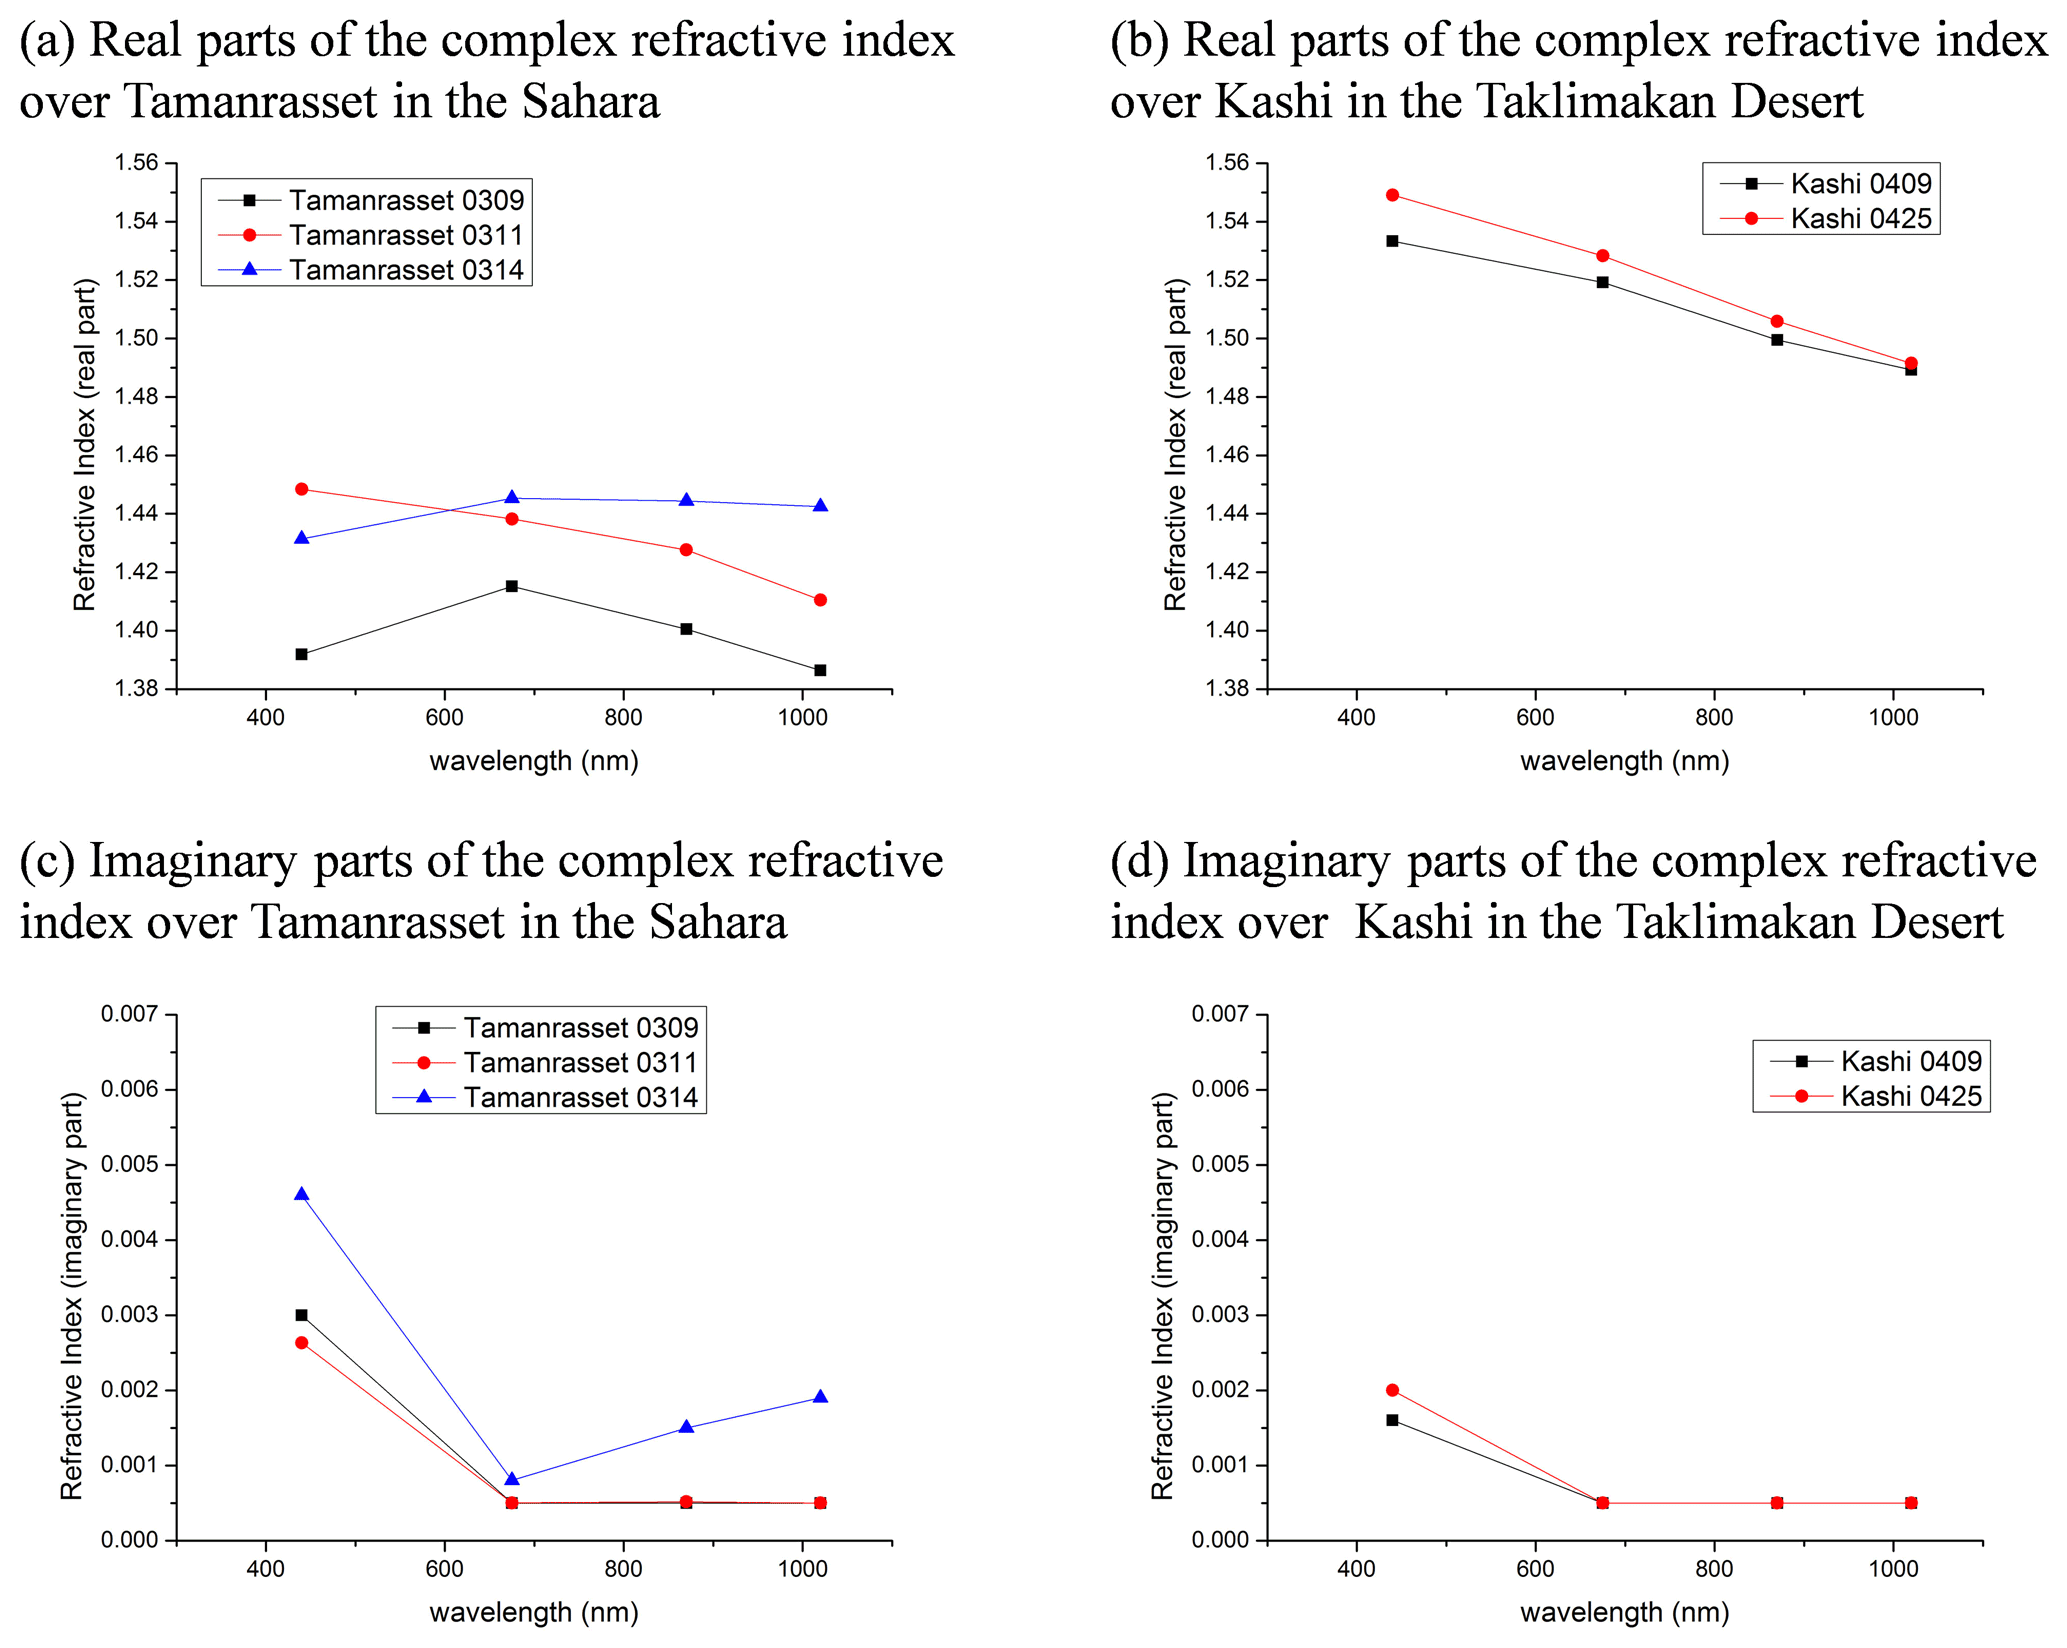
Figure 11Real and imaginary parts of the dust complex refractive index over Tamanrasset in the Sahara and Kashi in the Taklimakan Desert.
The refractive index is a measurement of the aerosol refraction and absorption efficiency. Aerosols with high real parts of the complex refractive index values are indicated to be scattering types. Conversely, aerosols with high imaginary parts are indicated to be absorbing types (Zhang et al., 2006). Figure 11 shows the real and imaginary parts of the dust complex refractive index over Tamanrasset in the Sahara and Kashi the Taklimakan Desert during the dust storms. In Fig. 11, dust aerosols over Kashi have higher real parts (Fig. 11b) and lower imaginary parts (Fig. 11d) than aerosols over Tamanrasset (Fig. 11a and c), showing that the dust aerosols over Kashi in the Taklimakan Desert have stronger scattering effects.
Figure 12 illustrates the variation of the dust aerosol size distribution during the dust storms over Tamanrasset in March 2019 and over Kashi in April 2019. Most maximum dust aerosol size distribution peaks at the radius of 1.71 µm in Tamanrasset and 2.24 µm in Kashi. Moreover, the peak values are higher in Kashi. It is indicated that the dust storm was stronger in Kashi in April 2019, and the coarse-mode aerosol particles increased in particle volume compared with those in the dust storm in Tamanrasset in March 2019.
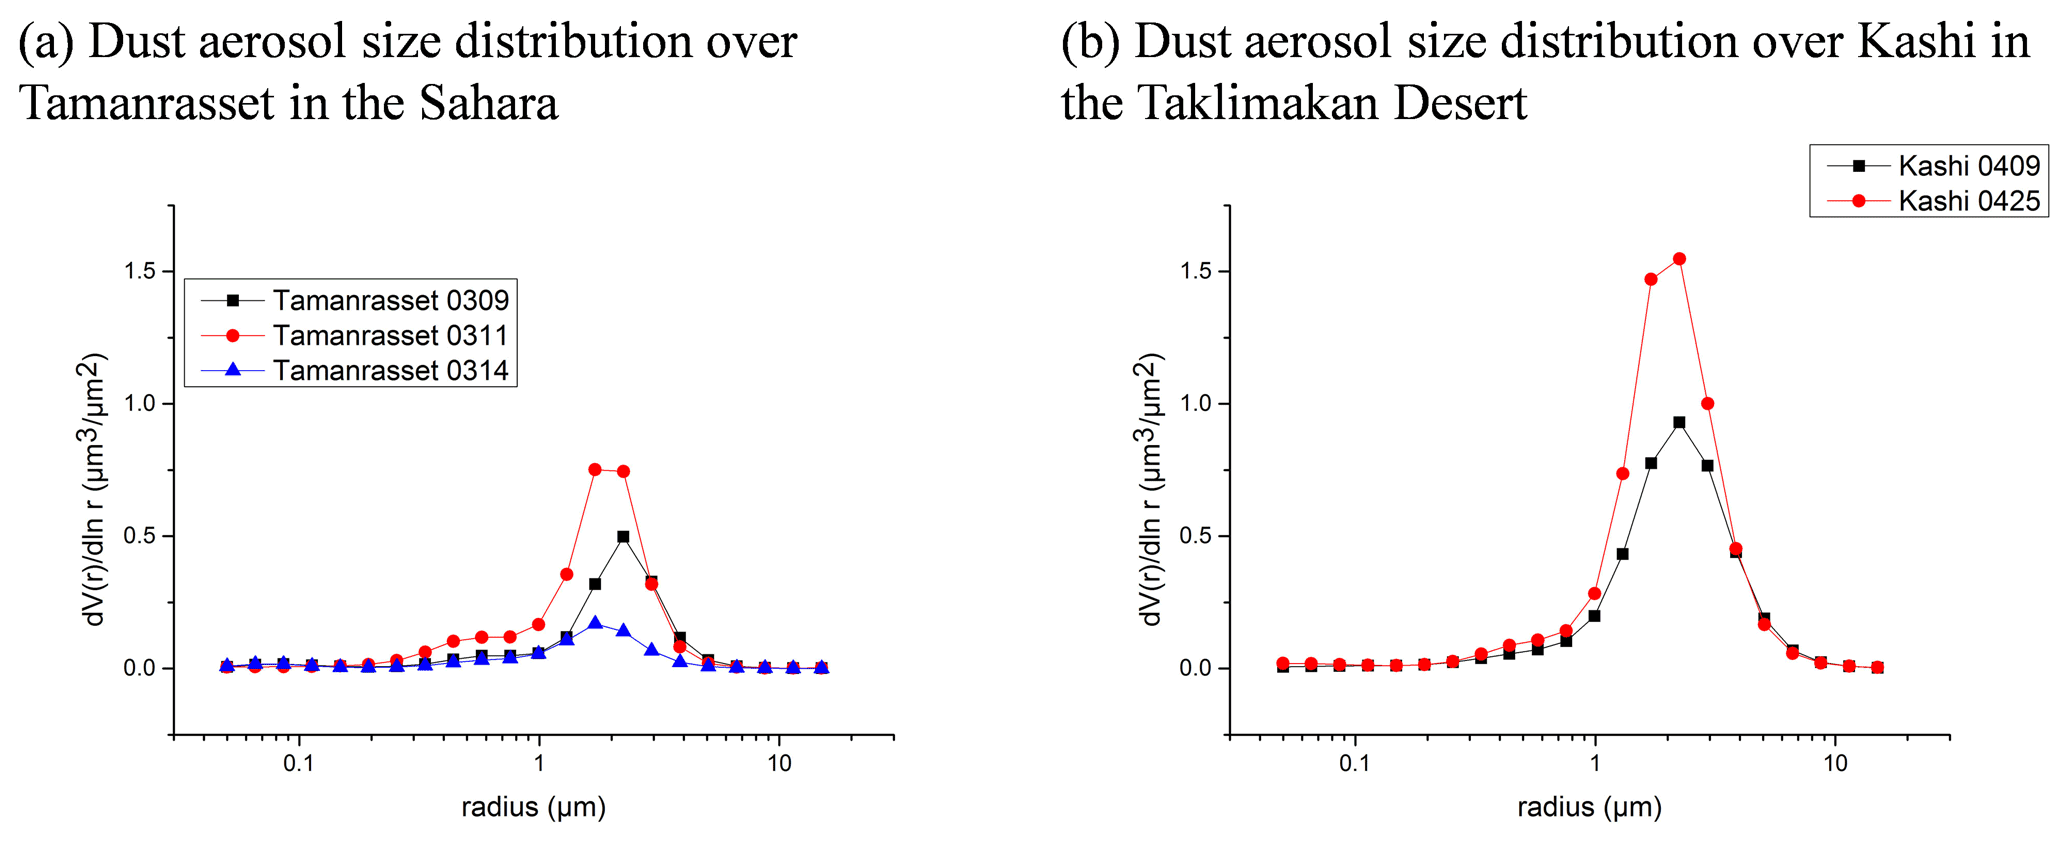
Figure 12Dust aerosol size distribution over (a) Tamanrasset in the Sahara and (b) Kashi in the Taklimakan Desert.

Figure 13Single scattering albedo of dust aerosols over (a) Tamanrasset in the Sahara and (b) Kashi in the Taklimakan Desert.
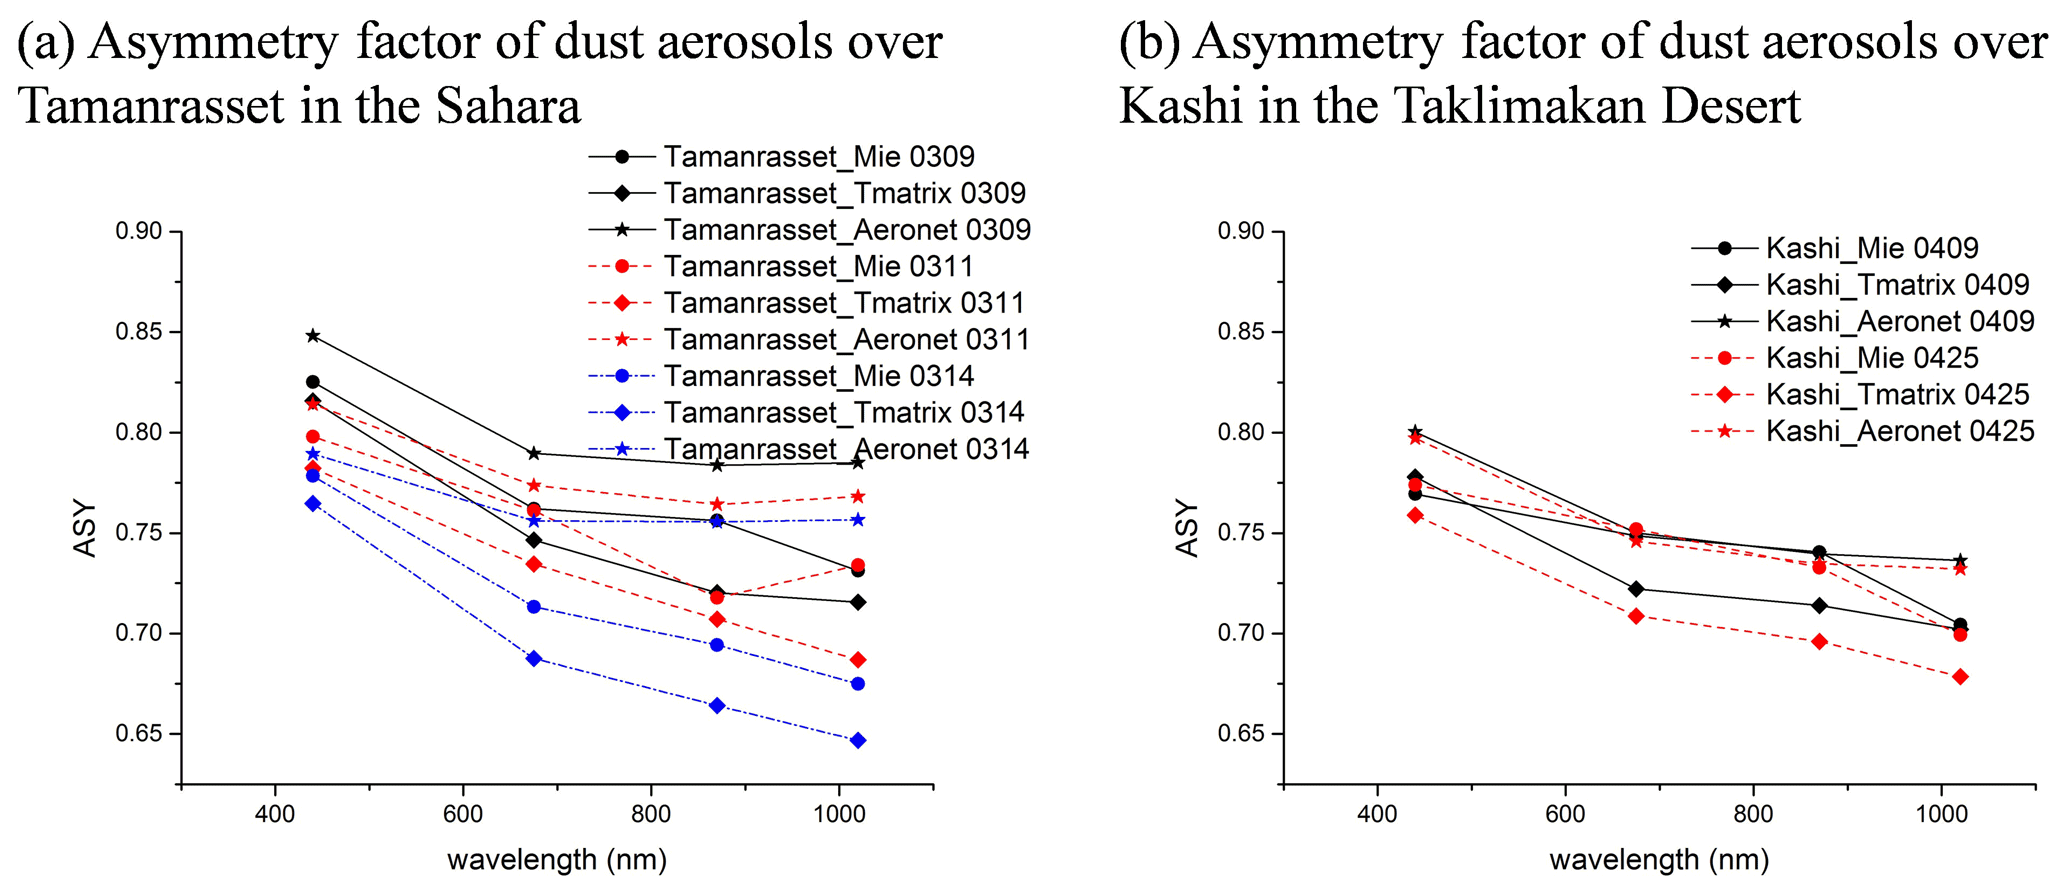
Figure 14Asymmetry factor of dust aerosols over (a) Tamanrasset in the Sahara and (b) Kashi in the Taklimakan Desert.
4.2 Dust optical properties
The dust optical properties can be calculated by synergistically using the real and imaginary parts of the dust complex refractive index and the dust aerosol size distribution.
The SSA and the ASY are two key parameters determining the DREdust and the DRFEdust. Accurate measurements of the SSA and the ASY are important for the assessment of the direct effect of aerosols on climate (Qie et al., 2018). The dust aerosol optical properties are calculated by using Mie theory, the T-matrix method, and the AERONET inversion products (Dubovik and King, 2000; Dubovik et al., 2006).
The SSA is presented as the ratio between the aerosol scattering and extinction coefficients. The dust SSA describes the scattering properties of the dust aerosols. The SSA can largely determine the magnitudes and signs of the DREdust and the DRFEdust. Strongly scattering dust aerosols (i.e., SSA=1) always cause negative DREdust. By contrast, low SSA aerosols often cause positive DREdust, especially over high LSA regions, as the light absorbed by the aerosols can reduce the cooling effect. The size distribution and the complex refractive index can co-determine the magnitude of the SSA.
Figure 13 shows the variabilities of the dust aerosol SSA between different dust source regions and different calculation methods. In Fig. 13, the maximum SSA value mostly occurs at a wavelength of 1020 nm, which indicates that the SSA is dependent on wavelength. Moreover, dust aerosols from the Taklimakan Desert (Kashi) in the figure have a higher SSA value using both Mie theory and the T-matrix method. The higher value of SSA shows that dust aerosol particles scatter more predominantly and strongly in the Taklimakan Desert (Kashi), which may cause a more significant negative radiative effect than the dust aerosols over Tamanrasset.
The ASY indicates the relative strength of the forward scattering, which determines the integrated fractions of the energy that scatter backward and forward. The dust aerosol particles with sharp peaks in the forward direction (0∘ scattering angle) have a positive ASY. The ASY value increases with the particle size.
The ASY in Fig. 14 shows marked spectral variation with higher values at shorter wavelengths. It can be found that the dust aerosols from the Sahara (Tamanrasset) have higher values of the ASY than those from the Taklimakan Desert (Kashi) in both Mie theory and the T-matrix method. The stronger backward-scattered energy may cause a higher negative radiative effect over Kashi.
According to the analyses of the microphysical properties and the optical properties, the dust aerosols over Kashi scatter strongly. The negative DRFEdust of Kashi should be more significant than those of Tamanrasset. The results are in good agreement with those estimated by the satellite observations.
4.3 DRFEdust derived from the RTM simulations
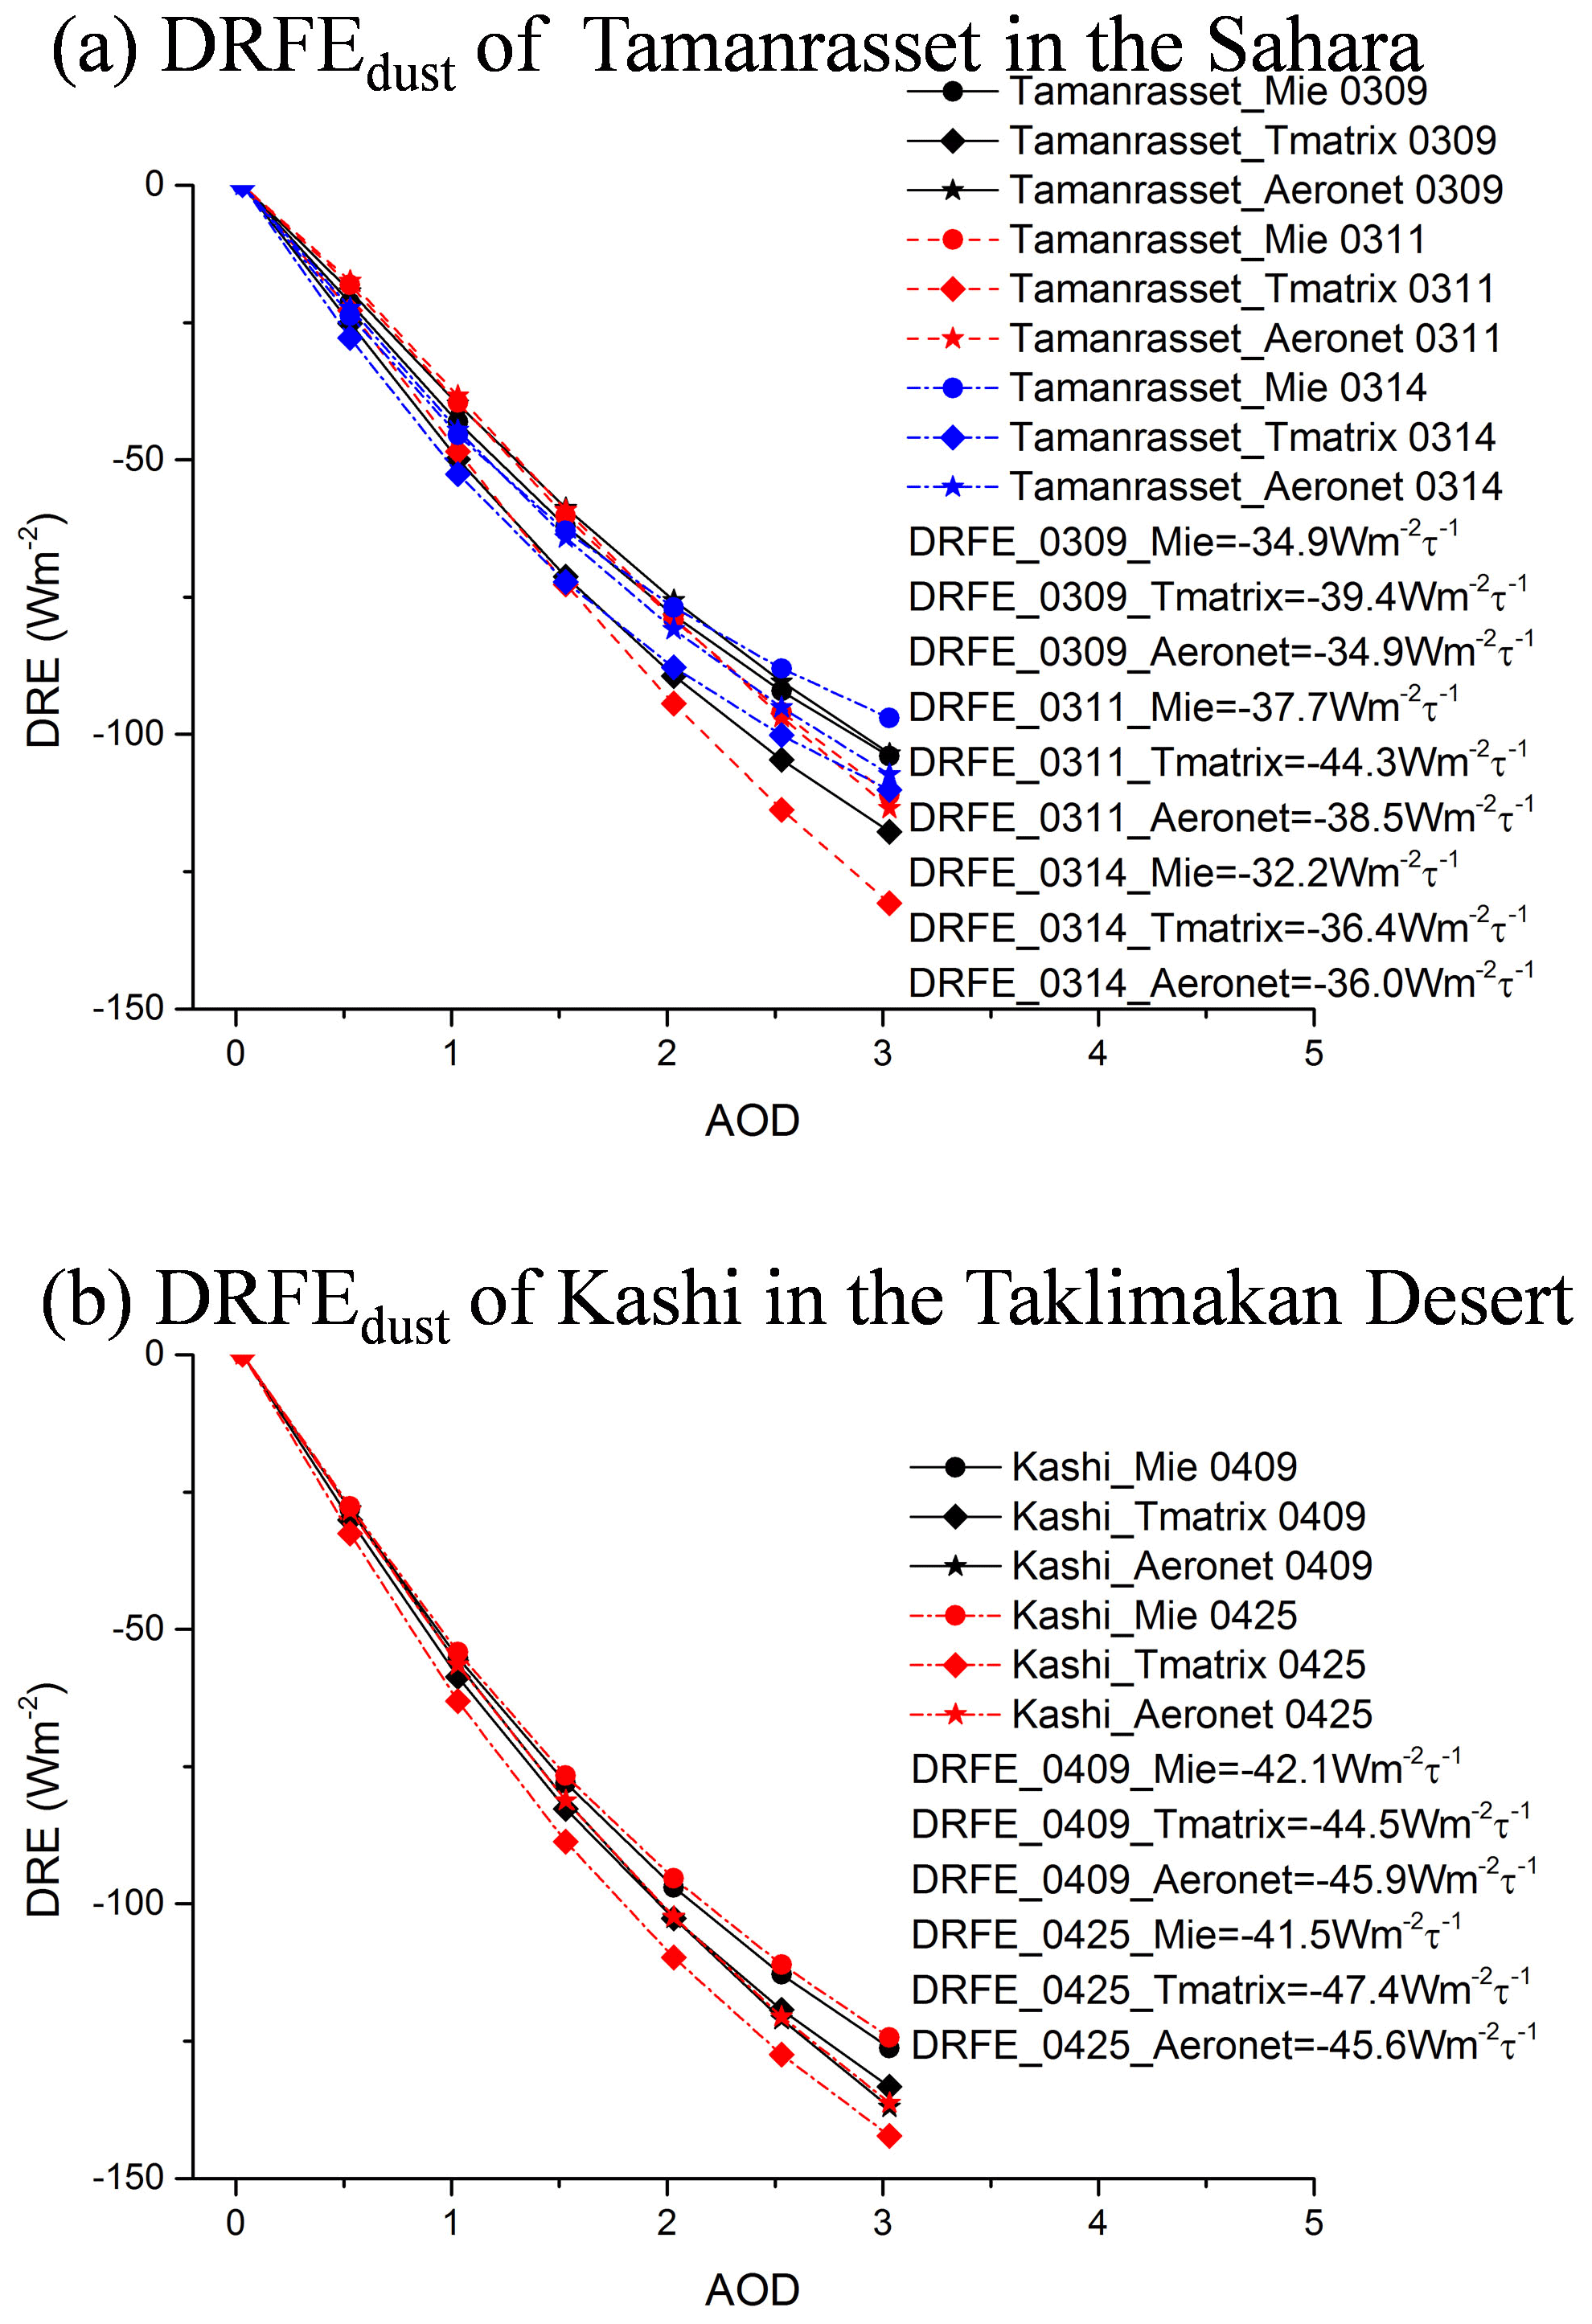
Figure 15DRFEdust simulated by SBDART over (a) Tamanrasset in the Sahara and (b) Kashi in the Taklimakan Desert.
The DRFEdust estimated directly by the satellite observation is compared with that simulated by SBDART to verify the reliability. As shown in Fig. 15, with higher aerosol scattering (higher SSA in Fig. 13) and higher backward scattering (lower ASY in Fig. 14), the negative DRFEdust from Kashi is more significant. The mean DRFEdust from Tamanrasset is −37.1 W m. The dust aerosols from Kashi have stronger cooling effects than those from Tamanrasset, in which the mean DRFEdust is −44.5 W m. The results are in good agreement with those estimated by the satellite observations. The DRFEdust estimated by the dust optical properties derived from the T-matrix method and AERONET is closer to those estimated by the satellite observations, which indicates that most dust aerosols are non-spherical in the natural environment.
The results also show that the dust microphysical properties can significantly influence the DRFEdust. The mean difference in the DRFEdust between Tamanrasset and Kashi (difference between the mean DRFEdust in Tamanrasset and in Kashi) is 18.14 % (7.4 W m). Even for the same size distributions and the complex refractive index of dust aerosol, the DRFEdust varies significantly according to whether the dust particles are considered spherical or non-spherical in different methods. For the differences in the DRFEdust estimated using different methods, the mean standard deviations are 7.6 % (2.8 W m) in Tamanrasset and 6.8 % (3.0 W m) in Kashi. Moreover, Li et al. (2020) pointed out that the atmospheric profile, LSA and SZA, can also influence the simulation of the instantaneous DRFEdust, which agrees with our previous study (Tian et al., 2019). Additionally, it is difficult for climate models or in situ measurements to get the real distribution of the aerosol properties at a large spatial extent. Also, it is hard to evaluate the uncertainties in radiative transfer simulations. It can cause significant errors in evaluating the modulating effects of the mineral dust aerosols on climate (Huang et al., 2009; Li et al., 2020).
According to the analyses of the dust aerosol microphysical properties and optical properties, the dust aerosols from the Taklimakan Desert (Kashi) should scatter strongly. The RTM simulation results are in good agreement with the results estimated by the satellite observation. Previous studies also estimated the DRFEdust in the Sahara and Taklimakan Desert (Li et al., 2004, 2020; García et al., 2012; Xia and Zong, 2009), which validates our results.
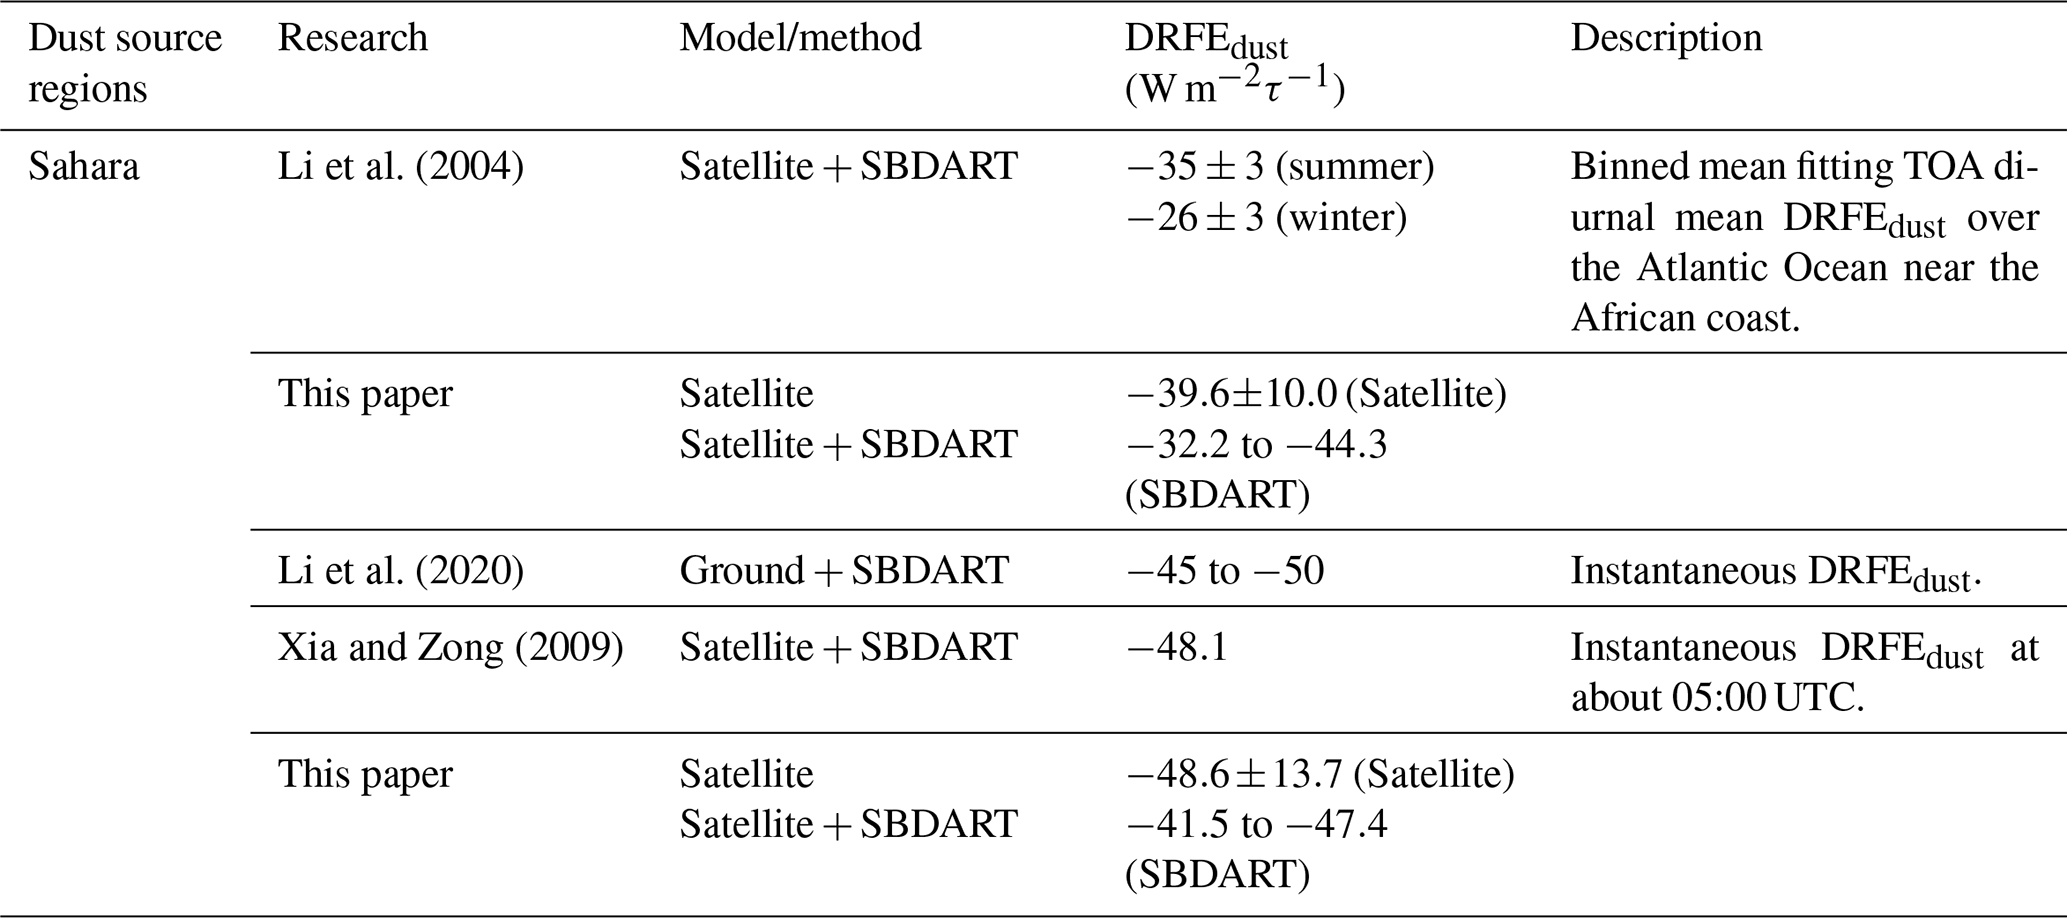
Table 2 illustrates the SW DRFEdust of the Sahara and Taklimakan Desert in previous studies. Li et al. (2004) estimated the diurnal mean DRFEdust at the TOA ( W m in summer; W m in winter) over the Atlantic Ocean near the African coast. The results indicated that lower uncertainties are derived from the standard deviation of the best-fit curve around the observed points due to the binned mean fitting. For the Taklimakan Desert, Li et al. (2020) estimated the instantaneous SW DRFEdust at the TOA of Kashi in April 2019. In this paper, the DRFEdust of the Taklimakan Desert is estimated with the same dust properties referring to the works of Li et al. (2020). Furthermore, Xia and Zong (2009) used both the satellite data and the SBDART model to represent the instantaneous (about 05:00 UTC) SW DRFEdust, which is −48.1 W m at the TOA (Xia and Zong, 2009). Through comparison, it is found that the satellite-based equi-albedo method and the SBDART model-derived SW DRFEdust are W m and −32.2 to −44.3 W m at the TOA over the Sahara, respectively, which are W m and −41.5 to −47.4 W m at the TOA over the Taklimakan Desert, respectively. The methods and results in these studies are comparable despite the differences. The results show that the negative DRFEdust from the Taklimakan Desert is more significant than those from the Sahara. As the SZA and LSA variations are considered in these studies, the results in this paper are reasonable and reliable. The compared results show that the DRFEdust derived from the satellite-based equi-albedo method is closer to that in previous studies. The DRFEdust estimated by the satellite-based equi-albedo method is obtained without the dust microphysical properties being assumed. The uncertainties are mostly caused by observation errors. Therefore, the uncertainties can be estimated objectively. It provides a direct way to validate the DREdust and the DRFEdust.
This study analyzes the differences in the dust microphysical properties and the DRFEdust over the Taklimakan Desert and Sahara during dust storms. The satellite-based equi-albedo method and the RTM are both used to estimate the DRFEdust in this study. By comparing the results from different methods and dust source regions, the DRFEdust differences caused by dust microphysical properties and particle shapes are discussed.
The results show that the dust aerosols from the Taklimakan Desert around Kashi have higher aerosol scattering (higher SSA) and backward scattering (lower ASY), and it causes more significant negative DRFEdust ( W m by the satellite; −41.5 to −47.4 W m by SBDART) than that in the Sahara around Tamanrasset ( W m by the satellite; −32.2 to −44.3 W m by SBDART). This indicates that the dust microphysical properties and particle shapes can significantly influence the DRFEdust. The information on the accurate dust microphysical properties and dust origins is highly required in the DRFEdust simulation. The scant measurements of dust microphysical properties can cause large uncertainties in simulating the DRFEdust. Previous studies proved that the results in this paper are reasonable and reliable. The DRFEdust derived from the satellite-based equi-albedo method is close to the results in previous studies.
However, there are still uncertainties in the simulation of the DRFEdust. In contrast, the DRFEdust can be estimated directly from the satellite observation using the equi-albedo method without any assumptions about the microphysical properties of dust aerosols. It has unique advantages in estimating the DRFEdust. Also, it can validate the DREdust and the DRFEdust derived from the numerical models more directly.
The CERES data can be accessed from the Atmospheric Sciences Data Center of NASA's Langley Research Center (https://ceres.larc.nasa.gov/order_data.php; Loeb, 2020). The AQUA/MODIS aerosol products (MYD04_L2) can be accessed from the NASA Level-1 and Atmosphere Archive and Distribution System (LAADS) Distributed Active Archive Center (DAAC) website (https://ladsweb.modaps.eosdis.nasa.gov/; Wolfe, 2020). The MODIS albedo products (MCD43C3 Version 6) can be accessed from the NASA LP DAAC website (https://lpdaac.usgs.gov/tools/data-pool/; Torbert, 2020). The AERONET data were obtained from the AERONET website (http://aeronet.gsfc.nasa.gov; Holben, 2020).
PZ and LC designed the study, and LT performed the study with suggestions from PZ and LC. LB improved the scattering calculating method of dust particles. Both authors contributed to the writing of this article.
The authors declare that they have no conflict of interest.
Publisher’s note: Copernicus Publications remains neutral with regard to jurisdictional claims in published maps and institutional affiliations.
This article is part of the special issue “Satellite and ground-based remote sensing of aerosol optical, physical, and chemical properties over China”. It is not associated with a conference.
We acknowledge the groups of MODIS, CERES, ECMWF, AERONET and GISS for providing the AOD, LSA, integrated water vapor, aerosol microphysical, optical properties products and T-matrix code. We also thank the SBDART group for making SBDART available. We thank Nanjing Hurricane Translation for reviewing the English language quality of this paper.
This research has been supported by the National Key R&D Program of China (grant nos. 2018YFB0504900 and 2018YFB0504905) and the National Natural Science Foundation of China (grant no. 41675036).
This paper was edited by Yves Balkanski and reviewed by four anonymous referees.
Anderson, T. L., Charlson, R. J., Bellouin, N., Boucher, O., Chin, M., Christopher, S. A., Haywood, J., Kaufman, Y. J., Kinne, S., Ogren, J. A., Remer, L. A., Takemura, T., Tanré, D., Torres, O., Trepte, C. R., Wielicki, B. A., Winker, D. M., and Yu, H.: An “A-Train” Strategy for Quantifying Direct Climate Forcing by Anthropogenic Aerosols, B. Am. Meteorol. Soc., 86, 1795–1810, https://doi.org/10.1175/bams-86-12-1795, 2005.
Bi, J., Shi, J., Xie, Y., Liu, Y., Takamura, T., and Khatri, P.: Dust Aerosol Characteristics and Shortwave Radiative Impact at a Gobi Desert of Northwest China during the Spring of 2012, J. Meteorol. Soc. Jpn. Ser. II, 92A, 33–56, https://doi.org/10.2151/jmsj.2014-A03, 2014.
Bi, L., Ding, S., Zong, R., and Yi, B.: Examining Asian dust refractive indices for brightness temperature simulations in the 650–1135 cm−1 spectral range, J. Quant. Spectrosc. Ra., 247, 106945, https://doi.org/10.1016/j.jqsrt.2020.106945, 2020.
Borghese, F., Denti, P., Saija, R., and Iatì, M. A.: Optical trapping of nonspherical particles in the T-matrix formalism, Opt. Express, 15, 11984–11998, https://doi.org/10.1364/OE.15.011984, 2007.
Che, H., Zhang, X., Alfraro, S., Chatenet, B., Gomes, L., and Zhao, J.: Aerosol optical properties and its radiative forcing over Yulin, China in 2001 and 2002, Adv. Atmos. Sci., 26, 564–576, https://doi.org/10.1007/s00376-009-0564-4, 2009.
Che, H., Wang, Y., Sun, J., Zhang, X., Zhang, X., and Guo, J.: Variation of Aerosol Optical Properties over Taklimakan Desert of China, Aerosol. Air Qual. Res., 13, 777–785, https://doi.org/10.4209/aaqr.2012.07.0200, 2012.
Chen, L., Shi, G., Qin, S., Yang, S., and Zhang, P.: Direct radiative forcing of anthropogenic aerosols over oceans from satellite observations, Adv. Atmos. Sci., 28, 973–984, https://doi.org/10.1007/s00376-010-9210-4, 2011.
Chen, S., Zhao, C., Qian, Y., Leung, L. R., Huang, J., Huang, Z., Bi, J., Zhang, W., Shi, J., Yang, L., Li, D., and Li, J.: Regional modeling of dust mass balance and radiative forcing over East Asia using WRF-Chem, Aeolian Res., 15, 15–30, https://doi.org/10.1016/j.aeolia.2014.02.001, 2014.
Christopher, S. A., Chou, J., Zhang, J., Li, X., Berendes, T. A., and Welch, R. M.: Shortwave direct radiative forcing of biomass burning aerosols estimated using VIRS and CERES data, Geophys. Res. Lett., 27, 2197–2200, https://doi.org/10.1029/1999gl010923, 2000.
Colarco, P. R., Nowottnick, E. P., Randles, C. A., Yi, B., Yang, P., Kim, K.-M., Smith, J. A., and Bardeen, C. G.: Impact of radiatively interactive dust aerosols in the NASA GEOS-5 climate model: Sensitivity to dust particle shape and refractive index, J. Geophys. Res.-Atmos., 119, 753–786, https://doi.org/10.1002/2013jd020046, 2014.
Di Biagio, C., di Sarra, A., Eriksen, P., Ascanius, S. E., Muscari, G., and Holben, B.: Effect of surface albedo, water vapour, and atmospheric aerosols on the cloud-free shortwave radiative budget in the Arctic, Clim. Dynam., 39, 953–969, https://doi.org/10.1007/s00382-011-1280-1, 2012.
Di Biagio, C., Boucher, H., Caquineau, S., Chevaillier, S., Cuesta, J., and Formenti, P.: Variability of the infrared complex refractive index of African mineral dust: experimental estimation and implications for radiative transfer and satellite remote sensing, Atmos. Chem. Phys., 14, 11093–11116, https://doi.org/10.5194/acp-14-11093-2014, 2014a.
Di Biagio, C., Formenti, P., Styler, S. A., Pangui, E., and Doussin, J.-F.: Laboratory chamber measurements of the longwave extinction spectra and complex refractive indices of African and Asian mineral dust, Geophys. Res. Lett., 41, 6289–6297, https://doi.org/10.1002/2014GL060213, 2014b.
Di Biagio, C., Formenti, P., Balkanski, Y., Caponi, L., Cazaunau, M., Pangui, E., Journet, E., Nowak, S., Caquineau, S., Andreae, M. O., Kandler, K., Saeed, T., Piketh, S., Seibert, D., Williams, E., and Doussin, J.-F.: Global scale variability of the mineral dust long-wave refractive index: a new dataset of in situ measurements for climate modeling and remote sensing, Atmos. Chem. Phys., 17, 1901–1929, https://doi.org/10.5194/acp-17-1901-2017, 2017.
Dubovik, O. and King, M. D.: A flexible inversion algorithm for retrieval of aerosol optical properties from Sun and sky radiance measurements, J. Geophys. Res.-Atmos., 105, 20673–20696, https://doi.org/10.1029/2000jd900282, 2000.
Dubovik, O., Sinyuk, A., Lapyonok, T., Holben, B. N., Mishchenko, M., Yang, P., Eck, T. F., Volten, H., Muñoz, O., Veihelmann, B., van der Zande, W. J., Leon, J.-F., Sorokin, M., and Slutsker, I.: Application of spheroid models to account for aerosol particle nonsphericity in remote sensing of desert dust, J. Geophys. Res.-Atmos., 111, D11208, https://doi.org/10.1029/2005jd006619, 2006.
Gao, Y. and Anderson, J. R.: Characteristics of Chinese aerosols determined by individual-particle analysis, J. Geophys. Res.-Atmos., 106, 18037–18045, https://doi.org/10.1029/2000jd900725, 2001.
García, O. E., Díaz, A. M., Expósito, F. J., Díaz, J. P., Dubovik, O., Dubuisson, P., Roger, J.-C., Eck, T. F., Sinyuk, A., Derimian, Y., Dutton, E. G., Schafer, J. S., Holben, B. N., and García, C. A.: Validation of AERONET estimates of atmospheric solar fluxes and aerosol radiative forcing by ground-based broadband measurements, J. Geophys. Res.-Atmos., 113, D21207, https://doi.org/10.1029/2008jd010211, 2008.
García, O. E., Díaz, J. P., Expósito, F. J., Díaz, A. M., Dubovik, O., Derimian, Y., Dubuisson, P., and Roger, J.-C.: Shortwave radiative forcing and efficiency of key aerosol types using AERONET data, Atmos. Chem. Phys., 12, 5129–5145, https://doi.org/10.5194/acp-12-5129-2012, 2012.
Garrett, T. J. and Zhao, C.: Increased Arctic cloud longwave emissivity associated with pollution from mid-latitudes, Nature, 440, 787–789, https://doi.org/10.1038/nature04636, 2006.
Gouesbet, G. and Gréhan, G.: Generalized Lorenz-Mie Theories, Springer Berlin Heidelberg, 2011.
Guirado, C., Cuevas, E., Cachorro, V. E., Toledano, C., Alonso-Pérez, S., Bustos, J. J., Basart, S., Romero, P. M., Camino, C., Mimouni, M., Zeudmi, L., Goloub, P., Baldasano, J. M., and de Frutos, A. M.: Aerosol characterization at the Saharan AERONET site Tamanrasset, Atmos. Chem. Phys., 14, 11753–11773, https://doi.org/10.5194/acp-14-11753-2014, 2014.
Holben, B.: Aerosol robotic Network (AERONET) Homepage,NASA, available at: http://aeronet.gsfc.nasa.gov/, last access: 10 October 2020.
Holben, B. N., Eck, T. F., Slutsker, I., Tanré, D., Buis, J. P., Setzer, A., Vermote, E., Reagan, J. A., Kaufman, Y. J., Nakajima, T., Lavenu, F., Jankowiak, I., and Smirnov, A.: AERONET – A Federated Instrument Network and Data Archive for Aerosol Characterization, Remote Sens. Environ., 66, 1–16, https://doi.org/10.1016/S0034-4257(98)00031-5, 1998.
Hovenier, J. W.: Preface Workshop on Light Scattering by Nonspherical Particles, J. Quant. Spectrosc. Ra., 55, v, https://doi.org/10.1016/s0022-4073(96)90003-5, 1996.
Hsu, N. C., Tsay, S. C., King, M. D., and Herman, J. R.: Aerosol properties over bright-reflecting source regions, IEEE T. Geosci. Remote, 42, 557–569, 2004.
Huang, J., Fu, Q., Su, J., Tang, Q., Minnis, P., Hu, Y., Yi, Y., and Zhao, Q.: Taklimakan dust aerosol radiative heating derived from CALIPSO observations using the Fu-Liou radiation model with CERES constraints, Atmos. Chem. Phys., 9, 4011–4021, https://doi.org/10.5194/acp-9-4011-2009, 2009.
Huang, J., Wang, T., Wang, W., Li, Z., and Yan, H.: Climate effects of dust aerosols over East Asian arid and semiarid regions, J. Geophys. Res.-Atmos., 119, 11398–311416, https://doi.org/10.1002/2014jd021796, 2014.
Huneeus, N., Chevallier, F., and Boucher, O.: Estimating aerosol emissions by assimilating observed aerosol optical depth in a global aerosol model, Atmos. Chem. Phys., 12, 4585–4606, https://doi.org/10.5194/acp-12-4585-2012, 2012.
Iftikhar, M., Alam, K., Sorooshian, A., Syed, W. A., Bibi, S., and Bibi, H.: Contrasting aerosol optical and radiative properties between dust and urban haze episodes in megacities of Pakistan, Atmos. Environ., 173, 157–172, https://doi.org/10.1016/j.atmosenv.2017.11.011, 2018.
Jin, Y., Schaaf, C. B., Woodcock, C. E., Gao, F., Li, X., Strahler, A. H., Lucht, W., and Liang, S.: Consistency of MODIS surface bidirectional reflectance distribution function and albedo retrievals: 2. Validation, J. Geophys. Res.-Atmos., 108, 4159, https://doi.org/10.1029/2002jd002804, 2003.
Jose, S., Gharai, B., Rao, P. V. N., and Dutt, C. B. S.: Satellite-based shortwave aerosol radiative forcing of dust storm over the Arabian Sea, Atmos. Sci. Lett., 17, 43–50, https://doi.org/10.1002/asl.597, 2016.
Kalashnikova, O. V. and Sokolik, I. N.: Modeling the radiative properties of nonspherical soil-derived mineral aerosols, J. Quant. Spectrosc. Ra., 87, 137–166, https://doi.org/10.1016/j.jqsrt.2003.12.026, 2004.
Kumar, S., Kumar, S., Kaskaoutis, D. G., Singh, R. P., Singh, R. K., Mishra, A. K., Srivastava, M. K., and Singh, A. K.: Meteorological, atmospheric and climatic perturbations during major dust storms over Indo-Gangetic Basin, Aeolian Res., 17, 15–31, https://doi.org/10.1016/j.aeolia.2015.01.006, 2015.
Lewis, P. and Barnsley, M.: Influence of the sky radiance distribution on various formulations of the Earth surface albedo, Proceedings of the Conference on Physical Measurements and Signatures in Remote Sensing, England, 1994.
Li, F., Vogelmann, A. M., and Ramanathan, V.: Saharan Dust Aerosol Radiative Forcing Measured from Space, J. Climate, 17, 2558–2571, https://doi.org/10.1175/1520-0442(2004)017<2558:SDARFM>2.0.CO;2, 2004.
Li, L., Li, Z., Chang, W., Ou, Y., Goloub, P., Li, C., Li, K., Hu, Q., Wang, J., and Wendisch, M.: Aerosol solar radiative forcing near the Taklimakan Desert based on radiative transfer and regional meteorological simulations during the Dust Aerosol Observation-Kashi campaign, Atmos. Chem. Phys., 20, 10845–10864, https://doi.org/10.5194/acp-20-10845-2020, 2020.
Li, Z. Q., Xu, H., Li, K. T., Li, D. H., Xie, Y. S., Li, L., Zhang, Y., Gu, X. F., Zhao, W., Tian, Q. J., Deng, R. R., Su, X. L., Huang, B., Qiao, Y. L., Cui, W. Y., Hu, Y., Gong, C. L., Wang, Y. Q., Wang, X. F., Wang, J. P., Du, W. B., Pan, Z. Q., Li, Z. Z., and Bu, D.: Comprehensive Study of Optical, Physical, Chemical, and Radiative Properties of Total Columnar Atmospheric Aerosols over China: An Overview of Sun–Sky Radiometer Observation Network (SONET) Measurements, B. Am. Meteorol. Soc., 99, 739–755, https://doi.org/10.1175/bams-d-17-0133.1, 2018.
Liang, S., Fang, H., Chen, M., Shuey, C. J., Walthall, C., Daughtry, C., Morisette, J., Schaaf, C., and Strahler, A.: Validating MODIS land surface reflectance and albedo products: methods and preliminary results, Remote Sens. Environ., 83, 149–162, https://doi.org/10.1016/S0034-4257(02)00092-5, 2002.
Liu, J., Schaaf, C., Strahler, A., Jiao, Z., Shuai, Y., Zhang, Q., Roman, M., Augustine, J. A., and Dutton, E. G.: Validation of Moderate Resolution Imaging Spectroradiometer (MODIS) albedo retrieval algorithm: Dependence of albedo on solar zenith angle, J. Geophys. Res.-Atmos., 114, D01106, https://doi.org/10.1029/2008jd009969, 2009.
Loeb, N.: CERES data Products – CERES, NASA, available at: https://ceres.larc.nasa.gov/data/, last access: 24 April 2020.
Mbourou, G. N. T., Bertrand, J. J., and Nicholson, S. E.: The Diurnal and Seasonal Cycles of Wind-Borne Dust over Africa North of the Equator, J. Appl. Meteorol., 36, 868–882, https://doi.org/10.1175/1520-0450(1997)036<0868:Tdasco>2.0.Co;2, 1997.
McComiskey, A., Ricchiazzi, P., Ogren, J., and Dutton, E.: SGPGET: AN SBDART Module for Aerosol Radiative Transfer, Fifteenth ARM Science Team Meeting Proceedings, Daytona Beach, Florida, 14–18 March, 2005.
Mikami, M., Shi, G. Y., Uno, I., Yabuki, S., Iwasaka, Y., Yasui, M., Aoki, T., Tanaka, T. Y., Kurosaki, Y., Masuda, K., Uchiyama, A., Matsuki, A., Sakai, T., Takemi, T., Nakawo, M., Seino, N., Ishizuka, M., Satake, S., Fujita, K., Hara, Y., Kai, K., Kanayama, S., Hayashi, M., Du, M., Kanai, Y., Yamada, Y., Zhang, X. Y., Shen, Z., Zhou, H., Abe, O., Nagai, T., Tsutsumi, Y., Chiba, M., and Suzuki, J.: Aeolian dust experiment on climate impact: An overview of Japan–China joint project ADEC, Global Planet. Change, 52, 142–172, https://doi.org/10.1016/j.gloplacha.2006.03.001, 2006.
Miller, R., Knippertz, P., Pérez García-Pando, C., Perlwitz, J., and Tegen, I.: Impact of Dust Radiative Forcing upon Climate, Mineral Dust, 327–357, https://doi.org/10.1007/978-94-017-8978-3_13, 327–357, 2014.
Mishchenko, M. I. and Travis, L. D.: Capabilities and limitations of a current FORTRAN implementation of the T-matrix method for randomly oriented, rotationally symmetric scatterers, J. Quant. Spectrosc. Ra., 60, 309–324, https://doi.org/10.1016/S0022-4073(98)00008-9, 1998.
Mishchenko, M. I. and Travis, L. D.: Gustav Mie and the Evolving Discipline of Electromagnetic Scattering by Particles, B. Am. Meteorol. Soc., 89, 1853–1862, https://doi.org/10.1175/2008bams2632.1, 2008.
Mishchenko, M. I., Travis, L. D., and Mackowski, D. W.: T-matrix computations of light scattering by nonspherical particles: A review, J. Quant. Spectrosc. Ra., 55, 535–575, https://doi.org/10.1016/0022-4073(96)00002-7, 1996.
Nakajima, T., Tanaka, M., Yamano, M., Shiobara, M., Arao, K., and Nakanishi, Y.: Aerosol Optical Characteristics in the Yellow Sand Events Observed in May, 1982 at Nagasaki-Part II Models, J. Meteorol. Soc. Jpn. Ser. II, 67, 279–291, https://doi.org/10.2151/jmsj1965.67.2_279, 1989.
Okada, K., Heintzenberg, J., Kai, K., and Qin, Y.: Shape of atmospheric mineral particles collected in three Chinese arid-regions, Geophys. Res. Lett., 28, 3123–3126, https://doi.org/10.1029/2000gl012798, 2001.
Qie, L., Li, L., Li, K., Li, D., and Xu, H.: Retrieval of aerosol optical properties from ground-based remote sensing measurements: Aerosol asymmetry factor and single scattering albedo, Int. Arch. Photogramm. Remote Sens. Spatial Inf. Sci., XLII-3, 1421–1426, https://doi.org/10.5194/isprs-archives-XLII-3-1421-2018, 2018.
Ramanathan, V., Cess, R., Harrison, E., Minnis, P., Barkstrom, B., Ahmad, E., and Hartmann, D.: Cloud-Radiative Forcing and Climate: Results from The Earth Radiation Budget Experiment, Science, 243, 57–63, https://doi.org/10.1126/science.243.4887.57, 1989.
Remer, L. A., Kaufman, Y. J., Tanré, D., Mattoo, S., Chu, D. A., Martins, J. V., Li, R. R., Ichoku, C., Levy, R. C., Kleidman, R. G., Eck, T. F., Vermote, E., and Holben, B. N.: The MODIS Aerosol Algorithm, Products, and Validation, J. Atmos. Sci., 62, 947–973, https://doi.org/10.1175/JAS3385.1, 2005.
Ricchiazzi, P., Yang, S., Gautier, C., and Sowle, D.: SBDART: A Research and Teaching Software Tool for Plane-Parallel Radiative Transfer in the Earth's Atmosphere, B. Am. Meteorol. Soc., 79, 2101–2114, https://doi.org/10.1175/1520-0477(1998)079<2101:SARATS>2.0.CO;2, 1998a.
Ricchiazzi, P., Yang, S., Gautier, C., and Sowle, D.: SBDART: A Research and Teaching Software Tool for Plane-Parallel Radiative Transfer in the Earth's Atmosphere, B. Am. Meteorol. Soc., 79, 2101, https://doi.org/10.1175/1520-0477(1998)079<2101:Sarats>2.0.Co;2, 1998b.
Román, M. O., Schaaf, C. B., Lewis, P., Gao, F., Anderson, G. P., Privette, J. L., Strahler, A. H., Woodcock, C. E., and Barnsley, M.: Assessing the coupling between surface albedo derived from MODIS and the fraction of diffuse skylight over spatially-characterized landscapes, Remote Sens. Environ., 114, 738–760, https://doi.org/10.1016/j.rse.2009.11.014, 2010.
Satheesh, S. K.: Letter to the Editor, Aerosol radiative forcing over land: effect of surface and cloud reflection, Ann. Geophys., 20, 2105–2109, https://doi.org/10.5194/angeo-20-2105-2002, 2002.
Satheesh, S. K. and Ramanathan, V.: Large differences in tropical aerosol forcing at the top of the atmosphere and Earth's surface, Nature, 405, 60–63, https://doi.org/10.1038/35011039, 2000.
Satheesh, S. K. and Srinivasan, J.: A Method to Estimate Aerosol Radiative Forcing from Spectral Optical Depths, J. Atmos. Sci., 63, 1082, https://doi.org/10.1175/jas3663.1, 2006.
Sayer, A. M., Munchak, L. A., Hsu, N. C., Levy, R. C., Bettenhausen, C., and Jeong, M.-J.: MODIS Collection 6 aerosol products: Comparison between Aqua's e-Deep Blue, Dark Target, and “merged” data sets, and usage recommendations, J. Geophys. Res.-Atmos., 119, 13965–913989, https://doi.org/10.1002/2014jd022453, 2014.
Schaaf, C., Martonchik, J., Pinty, B., Govaerts, Y., Gao, F., Lattanzio, A., Liu, J., Strahler, A., and Taberner, M.: Retrieval of Surface Albedo from Satellite Sensors, in: Advances in Land Remote Sensing: System, Modeling, Inversion and Application, edited by: Liang, S., Springer Netherlands, Dordrecht, 219–243, 2008.
Schaaf, C. B., Gao, F., Strahler, A. H., Lucht, W., Li, X., Tsang, T., Strugnell, N. C., Zhang, X., Jin, Y., Muller, J.-P., Lewis, P., Barnsley, M., Hobson, P., Disney, M., Roberts, G., Dunderdale, M., Doll, C., d'Entremont, R. P., Hu, B., Liang, S., Privette, J. L., and Roy, D.: First operational BRDF, albedo nadir reflectance products from MODIS, Remote Sens. Environ., 83, 135–148, https://doi.org/10.1016/S0034-4257(02)00091-3, 2002a.
Schaaf, C. B., Gao, F., Strahler, A. H., Lucht, W., Li, X., Tsang, T., Strugnell, N. C., Zhang, X., Jin, Y., Muller, J.-P., Lewis, P., Barnsley, M., Hobson, P., Disney, M., Roberts, G., Dunderdale, M., Doll, C., d'Entremont, R. P., Hu, B., Liang, S., Privette, J. L., and Roy, D.: First operational BRDF, albedo nadir reflectance products from MODIS, Remote Sens. Environ., 83, 135, https://doi.org/10.1016/s0034-4257(02)00091-3, 2002b.
Schaaf, C. B., Liu, J., Gao, F., and Strahler, A. H.: Aqua and Terra MODIS Albedo and Reflectance Anisotropy Products, in: Land Remote Sensing and Global Environmental Change: NASA's Earth Observing System and the Science of ASTER and MODIS, edited by: Ramachandran, B., Justice, C. O., and Abrams, M. J., Springer New York, New York, NY, 549–561, 2011.
Shi, G., Wang, H., Wang, B., Li, W., Gong, S., Zhao, T., and Aoki, T.: Sensitivity Experiments on the Effects of Optical Properties of Dust Aerosols on Their Radiative Forcing under Clear Sky Condition, J. Meteorol. Soc. Jpn., 83A, 333–346, https://doi.org/10.2151/jmsj.83A.333, 2005.
Slingo, A., Ackerman, T. P., Allan, R. P., Kassianov, E. I., McFarlane, S. A., Robinson, G. J., Barnard, J. C., Miller, M. A., Harries, J. E., Russell, J. E., and Dewitte, S.: Observations of the impact of a major Saharan dust storm on the atmospheric radiation balance, Geophys. Res. Lett., 33, https://doi.org/10.1029/2006gl027869, 2006.
Tanré, D., Kaufman, Y., Holben, B., Chatenet, B., Karnieli, A., Lavenu, F., Blarel, L., Dubovik, O., Remer, L., and Smirnov, A.: Climatology of dust aerosol size distribution and optical properties derived from remotely sensed data in the solar spectrum, J. Geophys. Res., 106, 18205–18217, https://doi.org/10.1029/2000JD900663, 2001.
Tegen, I., Bierwirth, E., Heinold, B., Helmert, J., and Wendisch, M.: Effect of measured surface albedo on modeled Saharan dust solar radiative forcing, J. Geophys. Res.-Atmos., 115, D24312, https://doi.org/10.1029/2009jd013764, 2010.
Textor, C., Schulz, M., Guibert, S., Kinne, S., Balkanski, Y., Bauer, S., Berntsen, T., Berglen, T., Boucher, O., Chin, M., Dentener, F., Diehl, T., Feichter, J., Fillmore, D., Ginoux, P., Gong, S., Grini, A., Hendricks, J., Horowitz, L., Huang, P., Isaksen, I. S. A., Iversen, T., Kloster, S., Koch, D., Kirkevåg, A., Kristjansson, J. E., Krol, M., Lauer, A., Lamarque, J. F., Liu, X., Montanaro, V., Myhre, G., Penner, J. E., Pitari, G., Reddy, M. S., Seland, Ø., Stier, P., Takemura, T., and Tie, X.: The effect of harmonized emissions on aerosol properties in global models – an AeroCom experiment, Atmos. Chem. Phys., 7, 4489–4501, https://doi.org/10.5194/acp-7-4489-2007, 2007.
Tian, L., Zhang, P., and Chen, L.: Estimation of the Dust Aerosol Shortwave Direct Forcing Over Land Based on an Equi-albedo Method From Satellite Measurements, J. Geophys. Res.-Atmos., 124, 8793–8807, https://doi.org/10.1029/2019JD030974, 2019.
Torbert, C.: Data pool, LP DAAC – Data Pool, USGS, available at: https://lpdaac.usgs.gov/tools/data-pool/, last access: 10 October 2020.
Valenzuela, A., Olmo, F. J., Lyamani, H., Antón, M., Quirantes, A., and Alados-Arboledas, L.: Aerosol radiative forcing during African desert dust events (2005–2010) over Southeastern Spain, Atmos. Chem. Phys., 12, 10331–10351, https://doi.org/10.5194/acp-12-10331-2012, 2012.
Wang, Z., Zhang, H., Jing, X., and Wei, X.: Effect of non-spherical dust aerosol on its direct radiative forcing, Atmos. Res., 120–121, 112–126, https://doi.org/10.1016/j.atmosres.2012.08.006, 2013.
Wielicki, B. A., Barkstrom, B. R., Baum, B. A., Charlock, T. P., Green, R. N., Kratz, D. P., Lee, R. B., Minnis, P., Smith, G. L., Takmeng, W., Young, D. F., Cess, R. D., Coakley, J. A., Crommelynck, D. A. H., Donner, L., Kandel, R., King, M. D., Miller, A. J., Ramanathan, V., Randall, D. A., Stowe, L. L., and Welch, R. M.: Clouds and the Earth's Radiant Energy System (CERES): algorithm overview, IEEE T. Geosci. Remote, 36, 1127–1141, 1998.
Wolfe, R.: LAADS DAAC, NASA, available at: https://ladsweb.modaps.eosdis.nasa.gov/, last access: 10 October 2020.
Xia, X. and Zong, X.: Shortwave versus longwave direct radiative forcing by Taklimakan dust aerosols, Geophys. Res. Lett., 36, L07803, https://doi.org/10.1029/2009gl037237, 2009.
Zhang, J., Christopher, S. A., Remer, L. A., and Kaufman, Y. J.: Shortwave aerosol radiative forcing over cloud-free oceans from Terra: 2. Seasonal and global distributions, J. Geophys. Res.-Atmos., 110, D10S24, https://doi.org/10.1029/2004JD005009, 2005.
Zhang, P., Lu, N., Hu, X., and Dong, C.: Identification and physical retrieval of dust storm using three MODIS thermal IR channels, Global Planet. Change, 52, 197–206, https://doi.org/10.1016/j.gloplacha.2006.02.014, 2006.
Zhao, C., Liu, X., Leung, L. R., Johnson, B., McFarlane, S. A., Gustafson Jr., W. I., Fast, J. D., and Easter, R.: The spatial distribution of mineral dust and its shortwave radiative forcing over North Africa: modeling sensitivities to dust emissions and aerosol size treatments, Atmos. Chem. Phys., 10, 8821–8838, https://doi.org/10.5194/acp-10-8821-2010, 2010.
Zhao, C., Chen, S., Leung, L. R., Qian, Y., Kok, J. F., Zaveri, R. A., and Huang, J.: Uncertainty in modeling dust mass balance and radiative forcing from size parameterization, Atmos. Chem. Phys., 13, 10733–10753, https://doi.org/10.5194/acp-13-10733-2013, 2013.
- Abstract
- Introduction
- Methodology and data
- DRFEdust estimated based on satellite observations
- Deriving DRFEdust from the RTM simulations
- DRFEdust in the satellite-based observation and the simulation of the RTM
- Discussion and conclusions
- Data availability
- Author contributions
- Competing interests
- Disclaimer
- Special issue statement
- Acknowledgements
- Financial support
- Review statement
- References