the Creative Commons Attribution 4.0 License.
the Creative Commons Attribution 4.0 License.
 | 27 Jul 2021
Secondary organic aerosols from anthropogenic volatile organic compounds contribute substantially to air pollution mortality
Duseong S. Jo
Brian C. McDonald
Pedro Campuzano-Jost
Douglas A. Day
Weiwei Hu
Jason C. Schroder
James Allan
Donald R. Blake
Manjula R. Canagaratna
Matthew M. Coggon
Peter F. DeCarlo
Glenn S. Diskin
Rachel Dunmore
Frank Flocke
Alan Fried
Jessica B. Gilman
Georgios Gkatzelis
Jacqui F. Hamilton
Thomas F. Hanisco
Patrick L. Hayes
Daven K. Henze
Alma Hodzic
James Hopkins
L. Greggory Huey
B. Thomas Jobson
William C. Kuster
Alastair Lewis
Jin Liao
M. Omar Nawaz
Ilana B. Pollack
Jeffrey Peischl
Bernhard Rappenglück
Claire E. Reeves
Dirk Richter
James M. Roberts
Thomas B. Ryerson
Min Shao
Jacob M. Sommers
James Walega
Carsten Warneke
Petter Weibring
Glenn M. Wolfe
Dominique E. Young
Qiang Zhang
Joost A. de Gouw
Jose L. Jimenez
Anthropogenic secondary organic aerosol (ASOA), formed from anthropogenic emissions of organic compounds, constitutes a substantial fraction of the mass of submicron aerosol in populated areas around the world and contributes to poor air quality and premature mortality. However, the precursor sources of ASOA are poorly understood, and there are large uncertainties in the health benefits that might accrue from reducing anthropogenic organic emissions. We show that the production of ASOA in 11 urban areas on three continents is strongly correlated with the reactivity of specific anthropogenic volatile organic compounds. The differences in ASOA production across different cities can be explained by differences in the emissions of aromatics and intermediate- and semi-volatile organic compounds, indicating the importance of controlling these ASOA precursors. With an improved model representation of ASOA driven by the observations, we attribute 340 000 PM2.5-related premature deaths per year to ASOA, which is over an order of magnitude higher than prior studies. A sensitivity case with a more recently proposed model for attributing mortality to PM2.5 (the Global Exposure Mortality Model) results in up to 900 000 deaths. A limitation of this study is the extrapolation from cities with detailed studies and regions where detailed emission inventories are available to other regions where uncertainties in emissions are larger. In addition to further development of institutional air quality management infrastructure, comprehensive air quality campaigns in the countries in South and Central America, Africa, South Asia, and the Middle East are needed for further progress in this area.
- Article
(4201 KB) - Full-text XML
-
Supplement
(4211 KB) - BibTeX
- EndNote


Poor air quality is one of the leading causes of premature mortality worldwide (Cohen et al., 2017; Landrigan et al., 2018). Roughly 95 % of the world's population live in areas where PM2.5 (fine particulate matter with a diameter smaller than 2.5 µm) exceeds the World Health Organization's 10 µg m−3 annual average guideline (Shaddick et al., 2018). This is especially true for urban areas, where high population density is co-located with increased emissions of PM2.5 and its gas-phase precursors from human activities. It is estimated that PM2.5 leads to 3 to 4 million premature deaths per year, higher than the deaths associated with other air pollutants (Cohen et al., 2017). More recent analysis using concentration–response relationships derived from studies of populations' exposure to high levels of ambient PM2.5 suggest that the global premature death burden could be up to twice this value (Burnett et al., 2018).
The main method to estimate premature mortality with PM2.5 is to use measured PM2.5 from ground observations along with derived PM2.5 from satellites to fill in missing ground-based observations (van Donkelaar et al., 2015, 2016). To go from total PM2.5 to species-dependent and even sector-dependent associated premature mortality from PM2.5, chemical transport models (CTMs) are used to predict the fractional contribution of species and/or sector (e.g., Lelieveld et al., 2015; van Donkelaar et al., 2015, 2016; Silva et al., 2016). However, although CTMs may get total PM2.5 or even total species (e.g., organic aerosol – OA), correct, the model may be getting the values right for the wrong reason (e.g., de Gouw and Jimenez, 2009; Woody et al., 2016; Murphy et al., 2017; Baker et al., 2018; Hodzic et al., 2020). This is especially important for OA in urban areas, where models have a long-standing issue with underpredicting secondary OA (SOA) with some instances of overpredicting primary OA (POA) (de Gouw and Jimenez, 2009; Dzepina et al., 2009; Hodzic et al., 2010b; Woody et al., 2016; B. Zhao et al., 2016; Janssen et al., 2017; Jathar et al., 2017). Further, this bias has even been observed for highly aged aerosols in remote regions (Hodzic et al., 2020). As has been found in prior studies for urban areas (e.g., Zhang et al., 2007; Kondo et al., 2008; Jimenez et al., 2009; DeCarlo et al., 2010; Hayes et al., 2013; Freney et al., 2014; Hu et al., 2016; Nault et al., 2018; Schroder et al., 2018) and highlighted here (Fig. 1), a substantial fraction of the observed submicron PM is OA, and a substantial fraction of the OA is composed of SOA (approximately a factor of 2 to 3 higher than POA). Thus, to better understand the sources and apportionment of PM2.5 that contributes to premature mortality, CTMs must improve their prediction of SOA versus POA, as the sources of SOA precursors and POA can be different.
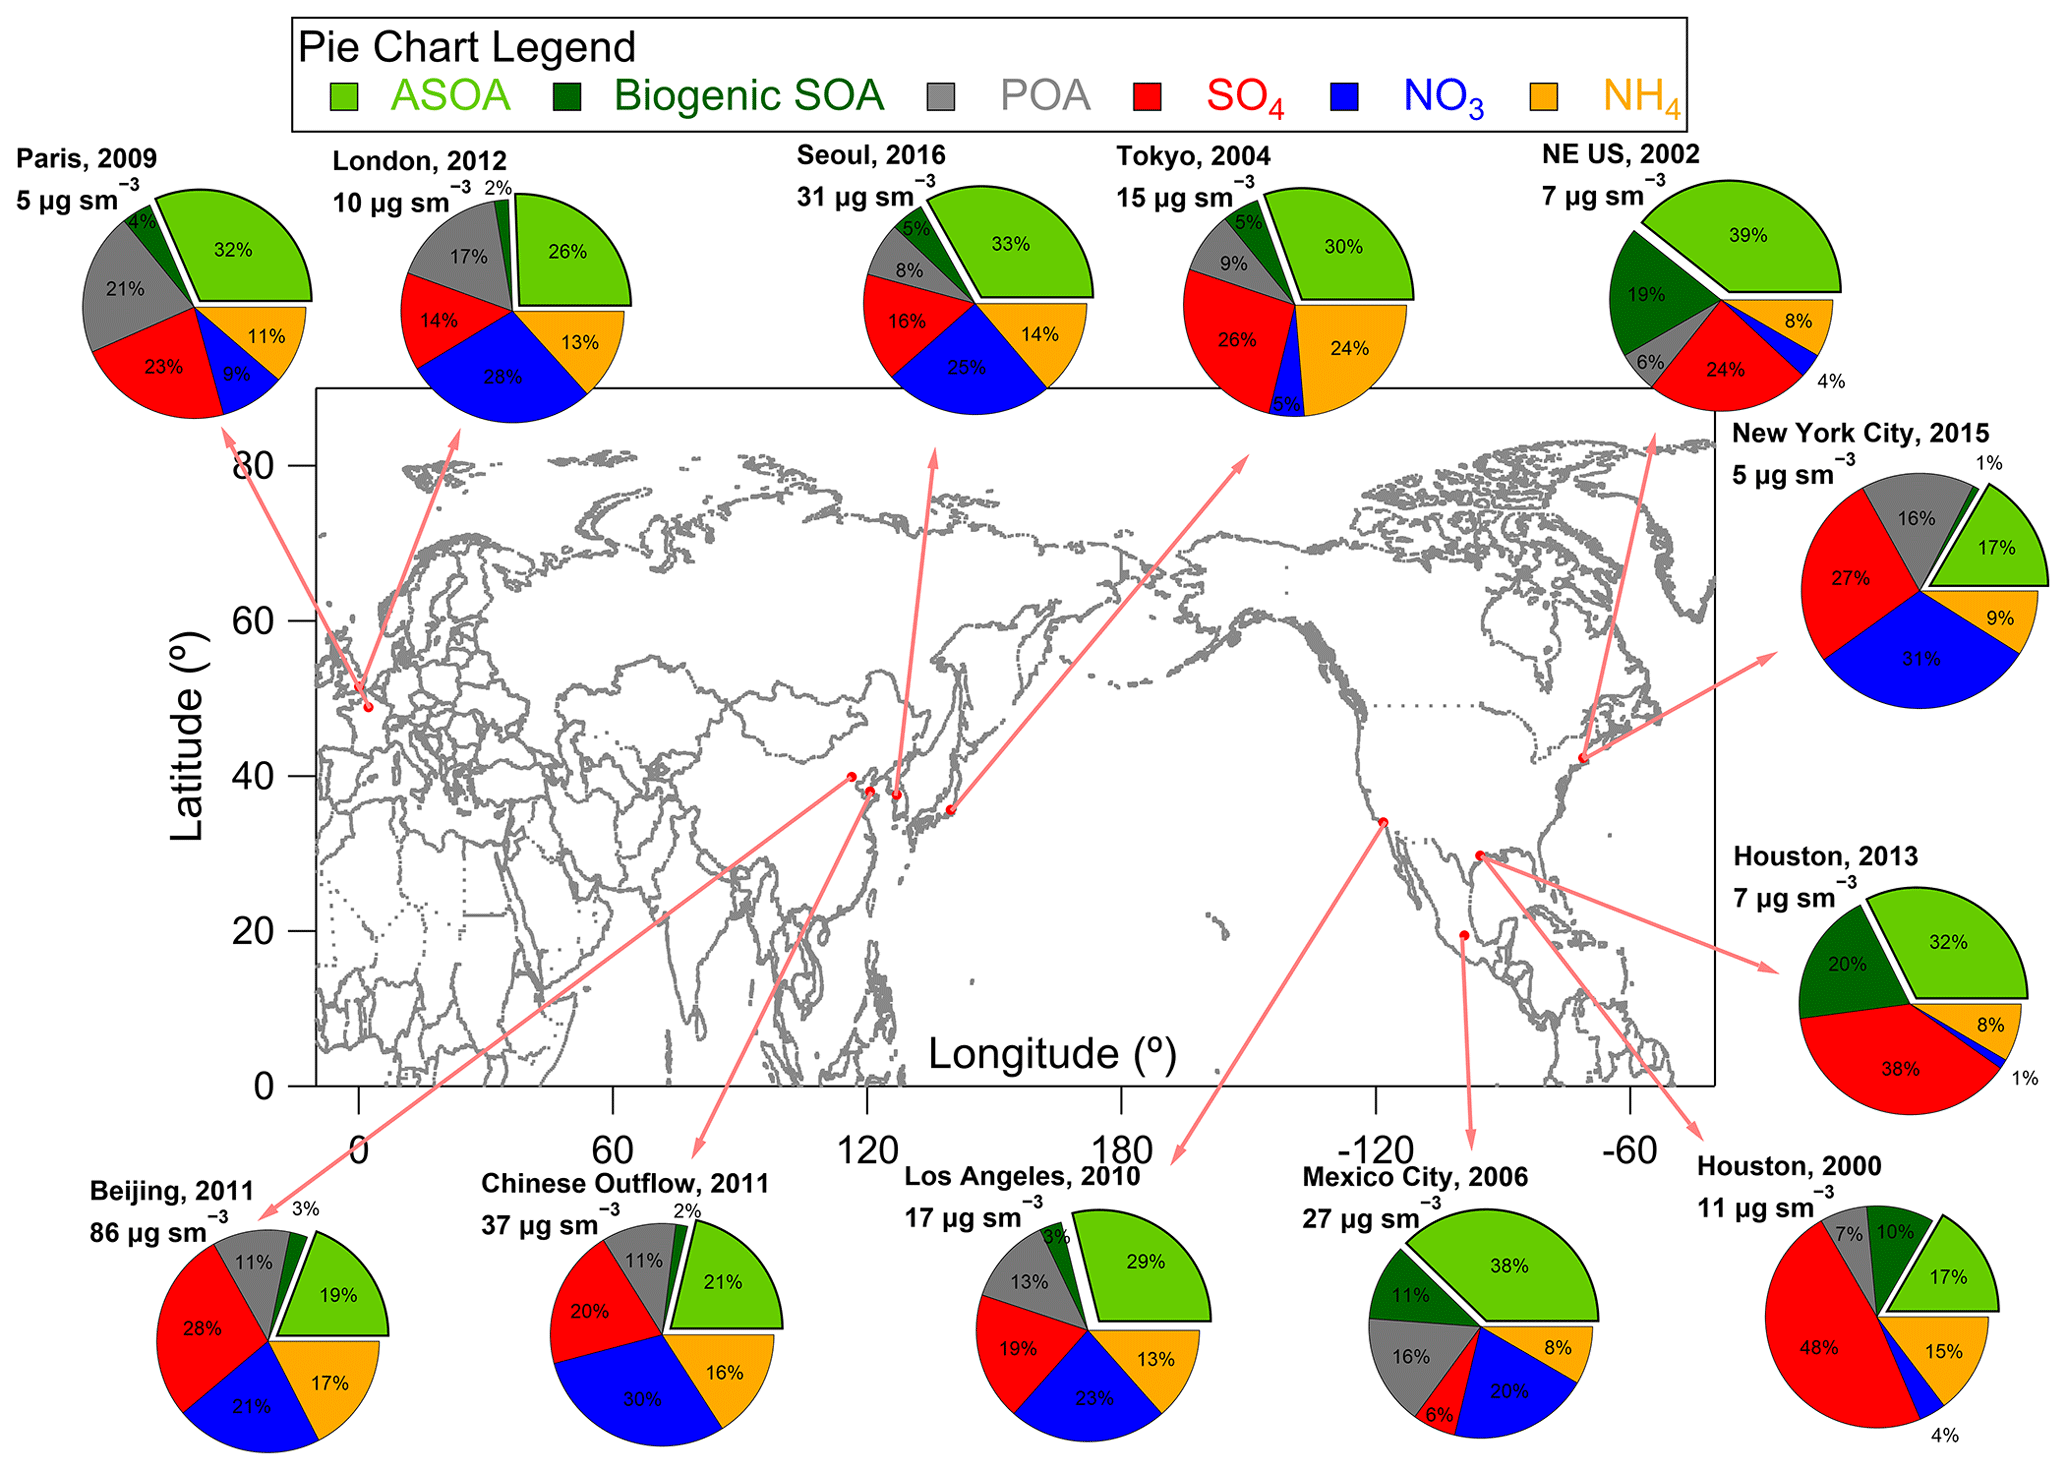
Figure 1Non-refractory submicron aerosol composition measured in urban and urban outflow regions from field campaigns used in this study (all in units of µg m−3) at standard temperature (273 K) and pressure (1013 hPa) (sm−3). See Sect. S3 and Table 1 for further information on measurements, studies, and apportionment of SOA into ASOA and BSOA.
However, understanding the gas-phase precursors of photochemically produced anthropogenic SOA – ASOA, defined as the photochemically produced SOA formed from the photooxidation of anthropogenic volatile organic compounds (AVOCs) (de Gouw et al., 2005; DeCarlo et al., 2010) – quantitatively is challenging (Hallquist et al., 2009). Note, for the rest of the paper, unless explicitly stated otherwise, ASOA refers to SOA produced from the photooxidation of AVOCs, as there are potentially other relevant paths for the production of SOA in urban environments (e.g., Petit et al., 2014; Kodros et al., 2018, 2020; Stavroulas et al., 2019). Although the enhancement of ASOA is largest in large cities, these precursors and the production of ASOA should be important in any location impacted by anthropogenic emissions (e.g., Fig. 1). ASOA comprises a wide range of condensable products generated by numerous chemical reactions involving AVOC precursors (Hallquist et al., 2009; Hayes et al., 2015; Shrivastava et al., 2017). The number of AVOC precursors, as well as the role of “nontraditional” AVOC precursors, along with the condensable products and chemical reactions, compound to lead to differences in the observed versus predicted ASOA for various urban environments (e.g., de Gouw and Jimenez, 2009; Dzepina et al., 2009; Hodzic et al., 2010b; Woody et al., 2016; Janssen et al., 2017; Jathar et al., 2017; McDonald et al., 2018). One solution to improve the prediction in CTMs is to use a simplified model, where lumped ASOA precursors react, non-reversibly, at a given rate constant, to produce ASOA (Hodzic and Jimenez, 2011; Hayes et al., 2015; Pai et al., 2020). This simplified model has been found to reproduce the observed ASOA from some urban areas (Hodzic and Jimenez, 2011; Hayes et al., 2015) but has issues in other urban areas (Pai et al., 2020). This may stem from the simplified model being parameterized to two urban areas (Hodzic and Jimenez, 2011; Hayes et al., 2015). These inconsistencies impact the model-predicted fractional contribution of ASOA to total PM2.5 and, thus, the ability to understand the source attribution to PM2.5 and premature deaths.
The main categories of gas-phase precursors that dominate ASOA have been the subject of intensive research. The debate on what dominates can, in turn, impact the understanding of what precursors to regulate in order to reduce ASOA, to improve air quality, and to reduce premature mortality associated with ASOA. Transportation-related emissions (e.g., tailpipe, evaporation, refueling) were assumed to be the major precursors of ASOA, which was supported by field studies (Parrish et al., 2009; Gentner et al., 2012; Warneke et al., 2012; Pollack et al., 2013). However, budget closure of observed ASOA mass concentrations could not be achieved with transportation-related VOCs (Ensberg et al., 2014). The contribution of urban-emitted biogenic precursors to SOA in urban areas is typically small. Biogenic SOA (BSOA) in these regions typically results from advection of regional background concentrations rather than processing of locally emitted biogenic VOCs (e.g., Hodzic et al., 2009, 2010a; Hayes et al., 2013; Janssen et al., 2017). BSOA is thought to dominate globally (Hallquist et al., 2009), but as shown in Fig. 1, the contribution of BSOA (1 % to 20 %) to urban concentrations, while often substantial, is typically smaller than that of ASOA (17 % to 39 %) (see Sect. S3.1).
Many of these prior studies generally investigated AVOC with high volatility, where volatility here is defined as the saturation concentration, C* (in µg m−3) (de Gouw et al., 2005; Volkamer et al., 2006; Dzepina et al., 2009; Freney et al., 2014; Woody et al., 2016). More recent studies have identified lower-volatility compounds in transportation-related emissions (e.g., Y. Zhao et al., 2014, 2016; Lu et al., 2018). These compounds have been broadly identified as intermediate-volatility organic compounds (IVOCs) and semi-volatile organic compounds (SVOCs). IVOCs generally have a C* of 103 to 106 µg m−3, whereas SVOCs generally have a C* of 1 to 102 µg m−3. Due to their lower volatility and functional groups, these classes of compounds generally form ASOA more efficiently than traditional, higher-volatility AVOCs; however, S/IVOCs (SVOCs and IVOCs) have also been more difficult to measure (e.g., Zhao et al., 2014; Pagonis et al., 2017; Deming et al., 2019). IVOCs have generally been the more difficult of the two classes to measure and identify, as these compounds cannot be collected onto filters to be sampled off-line (Lu et al., 2018) and generally show up as an unresolved complex mixture for in situ measurements using gas chromatography (GC) (Zhao et al., 2014). SVOCs, on the other hand, can be more readily collected onto filters and sampled off-line due to their lower volatility (Lu et al., 2018). Another potential issue has been an underestimation of the S/IVOC aerosol production as well as an underestimation in the contribution of photochemically produced S/IVOC from photooxidized “traditional” VOCs, due to partitioning of these low-volatility compounds to chamber walls and tubing (Krechmer et al., 2016; Ye et al., 2016; Liu et al., 2019). Accounting for this underestimation increases the predicted ASOA (Ma et al., 2017). The inclusion of these classes of compounds has led to improvement in some urban SOA budget closure; however, many more recent studies have still indicated a general shortfall in the ASOA budget, even when including these compounds from transportation-related emissions (Dzepina et al., 2009; Tsimpidi et al., 2010; Hayes et al., 2015; Cappa et al., 2016; Ma et al., 2017; McDonald et al., 2018).
Recent studies have indicated that emissions from volatile chemical products (VCPs), defined as pesticides, coatings, inks, adhesives, personal care products, and cleaning agents (McDonald et al., 2018), as well as cooking emissions (Hayes et al., 2015), asphalt emissions (Khare et al., 2020), and solid-fuel emissions from residential wood burning and/or cookstoves (e.g., Hu et al., 2013, 2020; Schroder et al., 2018), are important. While the total amounts of ASOA precursors released in cities have dramatically declined (largely due to three-way catalytic converters in cars; Warneke et al., 2012; Pollack et al., 2013; Zhao et al., 2017; Khare and Gentner, 2018), VCPs have not declined as quickly (Khare and Gentner, 2018; McDonald et al., 2018). Besides a few cities in the USA (Coggon et al., 2018; Khare and Gentner, 2018; McDonald et al., 2018), extensive VCP emission quantification has not yet been published.
Due to the uncertainty on the emissions of ASOA precursors and on the amount of ASOA formed from them, the number of premature deaths associated with urban organic emissions is largely unknown. Since numerous studies have shown the importance of VCPs and other nontraditional VOC emission sources, efforts have been made to try to improve the representation and emissions of VCPs (Seltzer et al., 2021), which can reduce the uncertainty in ASOA precursors and the associated premature death estimations. Currently, most studies have not treated ASOA explicitly (e.g., Lelieveld et al., 2015; Silva et al., 2016; Ridley et al., 2018) in source apportionment calculations of the premature deaths associated with long-term exposure of PM2.5. Most models represented total OA as non-volatile POA and “traditional” ASOA precursors (transportation-based VOCs), which largely underpredict ASOA (Ensberg et al., 2014; Hayes et al., 2015; Nault et al., 2018; Schroder et al., 2018) while overpredicting POA (e.g., Hodzic et al., 2010b; B. Zhao et al., 2016; Jathar et al., 2017). This does not reflect the current understanding that POA is volatile and contributes to ASOA mass concentration (e.g., Grieshop et al., 2009; Lu et al., 2018). Although the models are estimating total OA correctly (Ridley et al., 2018; Hodzic et al., 2020; Pai et al., 2020), the attribution of premature deaths to POA instead of SOA formed from traditional and nontraditional sources, including IVOCs from both sources, could lead to regulations that may not target the emissions that would reduce OA in urban areas. As PM1 and SOA mass are highest in urban areas (Fig. 1), also shown in Jimenez et al. (2009), it is necessary to quantify the amount and identify the sources of ASOA to target future emission standards that will optimally improve air quality and the associated health impacts. As these emissions are from human activities, they will contribute to SOA mass outside urban regions and to potential health impacts outside urban regions as well. Although there are potentially other important exposure pathways to PM that may increase premature mortality, such as exposure to solid-fuel emissions indoors (e.g., Kodros et al., 2018), the focus of this paper is on exposure to outdoor ASOA and its associated impacts on premature mortality.
Here, we investigate the factors that control ASOA using 11 major urban (including megacities) field studies (Fig. 1 and Table 1). The empirical relationships and numerical models are then used to quantify the attribution of premature mortality to ASOA around the world, using the observations to improve the modeled representation of ASOA. The results provide insight into the importance of ASOA to global premature mortality due to PM2.5 and further understanding of the precursors and sources of ASOA in urban regions.
Here, we introduce the ambient observations from various campaigns used to constrain ASOA production (Sect. 2.1), a description of the simplified model used in CTMs to better predict ASOA (Sect. 2.2), and a description of how premature mortality was estimated for this study (Sect. 2.3). In the Supplement, the following can be found: a description of the emissions used to calculate the ASOA budget for five different locations (Sect. S1), a description of how the ASOA budget was calculated for the five different locations (Sect. S2), a description of the CTM (GEOS-Chem, or the Goddard Earth Observing System Chemistry model) used in this study (Sects. S3–S4), and an error analysis for the observations (Sect. S5).
2.1 Ambient observations
For values not previously reported in the literature (Table S4), observations taken between 11:00 and 16:00 LT (local time) were used to determine the slopes of SOA versus formaldehyde (HCHO) (Fig. S1), peroxy acetyl nitrate (PAN) (Fig. S2), and Ox (Ox= O3+ NO2) (Fig. S3). For the California Research at the Nexus of Air Quality and Climate Change (CalNex) campaign, there was an approximate 48 % difference between the two HCHO measurements (Fig. S4). Therefore, the average between the two measurements was used in this study, similar to what has been done in other studies for other gas-phase species (Bertram et al., 2007). All linear fits, unless otherwise noted, use the orthogonal distance regression (ODR) fitting method.
For values in Table S4 through Table S8 not previously reported in the literature, the following procedure was applied to determine the emissions ratios, similar to the methods of Nault et al. (2018). An OH exposure (OHexp= [OH] × Δt), which is also the photochemical age (PA), was estimated by using the ratio of NOx NOy (Eq. 1) or the ratio of m+p-xylene ethylbenzene (Eq. 2). For the m+p-xylene/ethylbenzene, the emission ratio (Table S5) was established by determining the average ratio during minimal photochemistry, similar to prior studies (de Gouw et al., 2017). This was done for only one study, Texas Air Quality Study 2000 (TexAQS 2000). This method could be applied in that case as it was a ground campaign that operated both day and night; therefore, a ratio at night could be determined when there was minimal loss of both VOCs. The average emission ratio for the other VOCs was determined using Eq. (3) after the OHexp was calculated in Eq. (1) or Eq. (2). The rate constants used for determining OHexp and emission ratios are found in Table S12.
Table 1List of campaigns used here, and the values previously reported for these campaigns. “W” denotes winter, “Sp” denotes spring, and “Su” denotes summer.

a Reference used for PM1 composition. b Reference used for SOA Ox slope. c Reference used for ΔOA ΔCO value. d Reference used for SOA/HCHO and SOA/PAN slopes.
2.2 Updates to the SIMPLE model
With the combination of the new dataset, which expands across urban areas on three continents, the SIMPLE parameterization for ASOA (Hodzic and Jimenez, 2011) is updated in the standard GEOS-Chem model to reproduce observed ASOA in Fig. 2a. The parameterization operates as represented by Eq. (4).
SOAP represents the lumped precursors of ASOA, k is the reaction rate coefficient with OH (1.25 × 10⁻¹¹ cm3 molec.−1 s−1), and [OH] is the OH concentration (in molec. cm−3). This rate constant is also consistent with observed ASOA formation timescale of ∼ 1 d that has been observed across numerous studies (e.g., de Gouw et al., 2005; DeCarlo et al., 2010; Hayes et al., 2013; Nault et al., 2018; Schroder et al., 2018).
SOAP emissions were calculated based on the relationship between ΔSOA ΔCO and CO in Fig. 2a. First, we calculated CO (Eq. 5) for each grid cell and time step as follows:
where E and k stand for the emission rate and reaction rate coefficient with OH, respectively, for benzene (B), toluene (T), and xylenes (X, here all three isomers). Ethylbenzene was not included in this calculation because its emission was not available in version 2 of the Hemispheric Transport of Air Pollution (HTAPv2) emission inventory. However, ethylbenzene contributed a minor fraction of the mixing ratio (∼ 7 %, Table S5) and reactivity (∼ 6 %) of the total BTEX across the campaigns. Reaction rate constants used in this study were 1.22 × 10⁻¹², 5.63 × 10⁻¹², and 1.72 × 10⁻¹¹ cm3 molec.−1 s−1 for benzene, toluene, and xylenes, respectively (Atkinson and Arey, 2003; Atkinson et al., 2006). CO allows a dynamic calculation of the E(VOC) E(CO) = SOA ΔCO. Hodzic and Jimenez (2011) and Hayes et al. (2015) used a constant value of 0.069 g g−1, which worked well for the two cities investigated but not for the expanded dataset studied here. Thus, both the aromatic emissions and CO emissions are used in this study to better represent the variable emissions of ASOA precursors (Fig. S5).
Second, can be obtained from the result of Eq. (6), using the slope and intercept in Fig. 2a, with a correction factor (F) to consider additional SOA production after 0.5 PA equivalent days, as Fig. 2a shows the comparison at 0.5 PA equivalent days.
where the slope is 24.8 and the intercept is −1.7 from Fig. 2a. F (Eq. 7) can be calculated as follows:
F was calculated as 1.8 by using [OH] = 1.5 × 10⁶ molec. cm−3, which was used in the definition of 0.5 PA equivalent days for Fig. 2a.
Finally, ESOAP can be computed by multiplying CO emissions (ECO) for every grid point and time step in GEOS-Chem by the ratio.
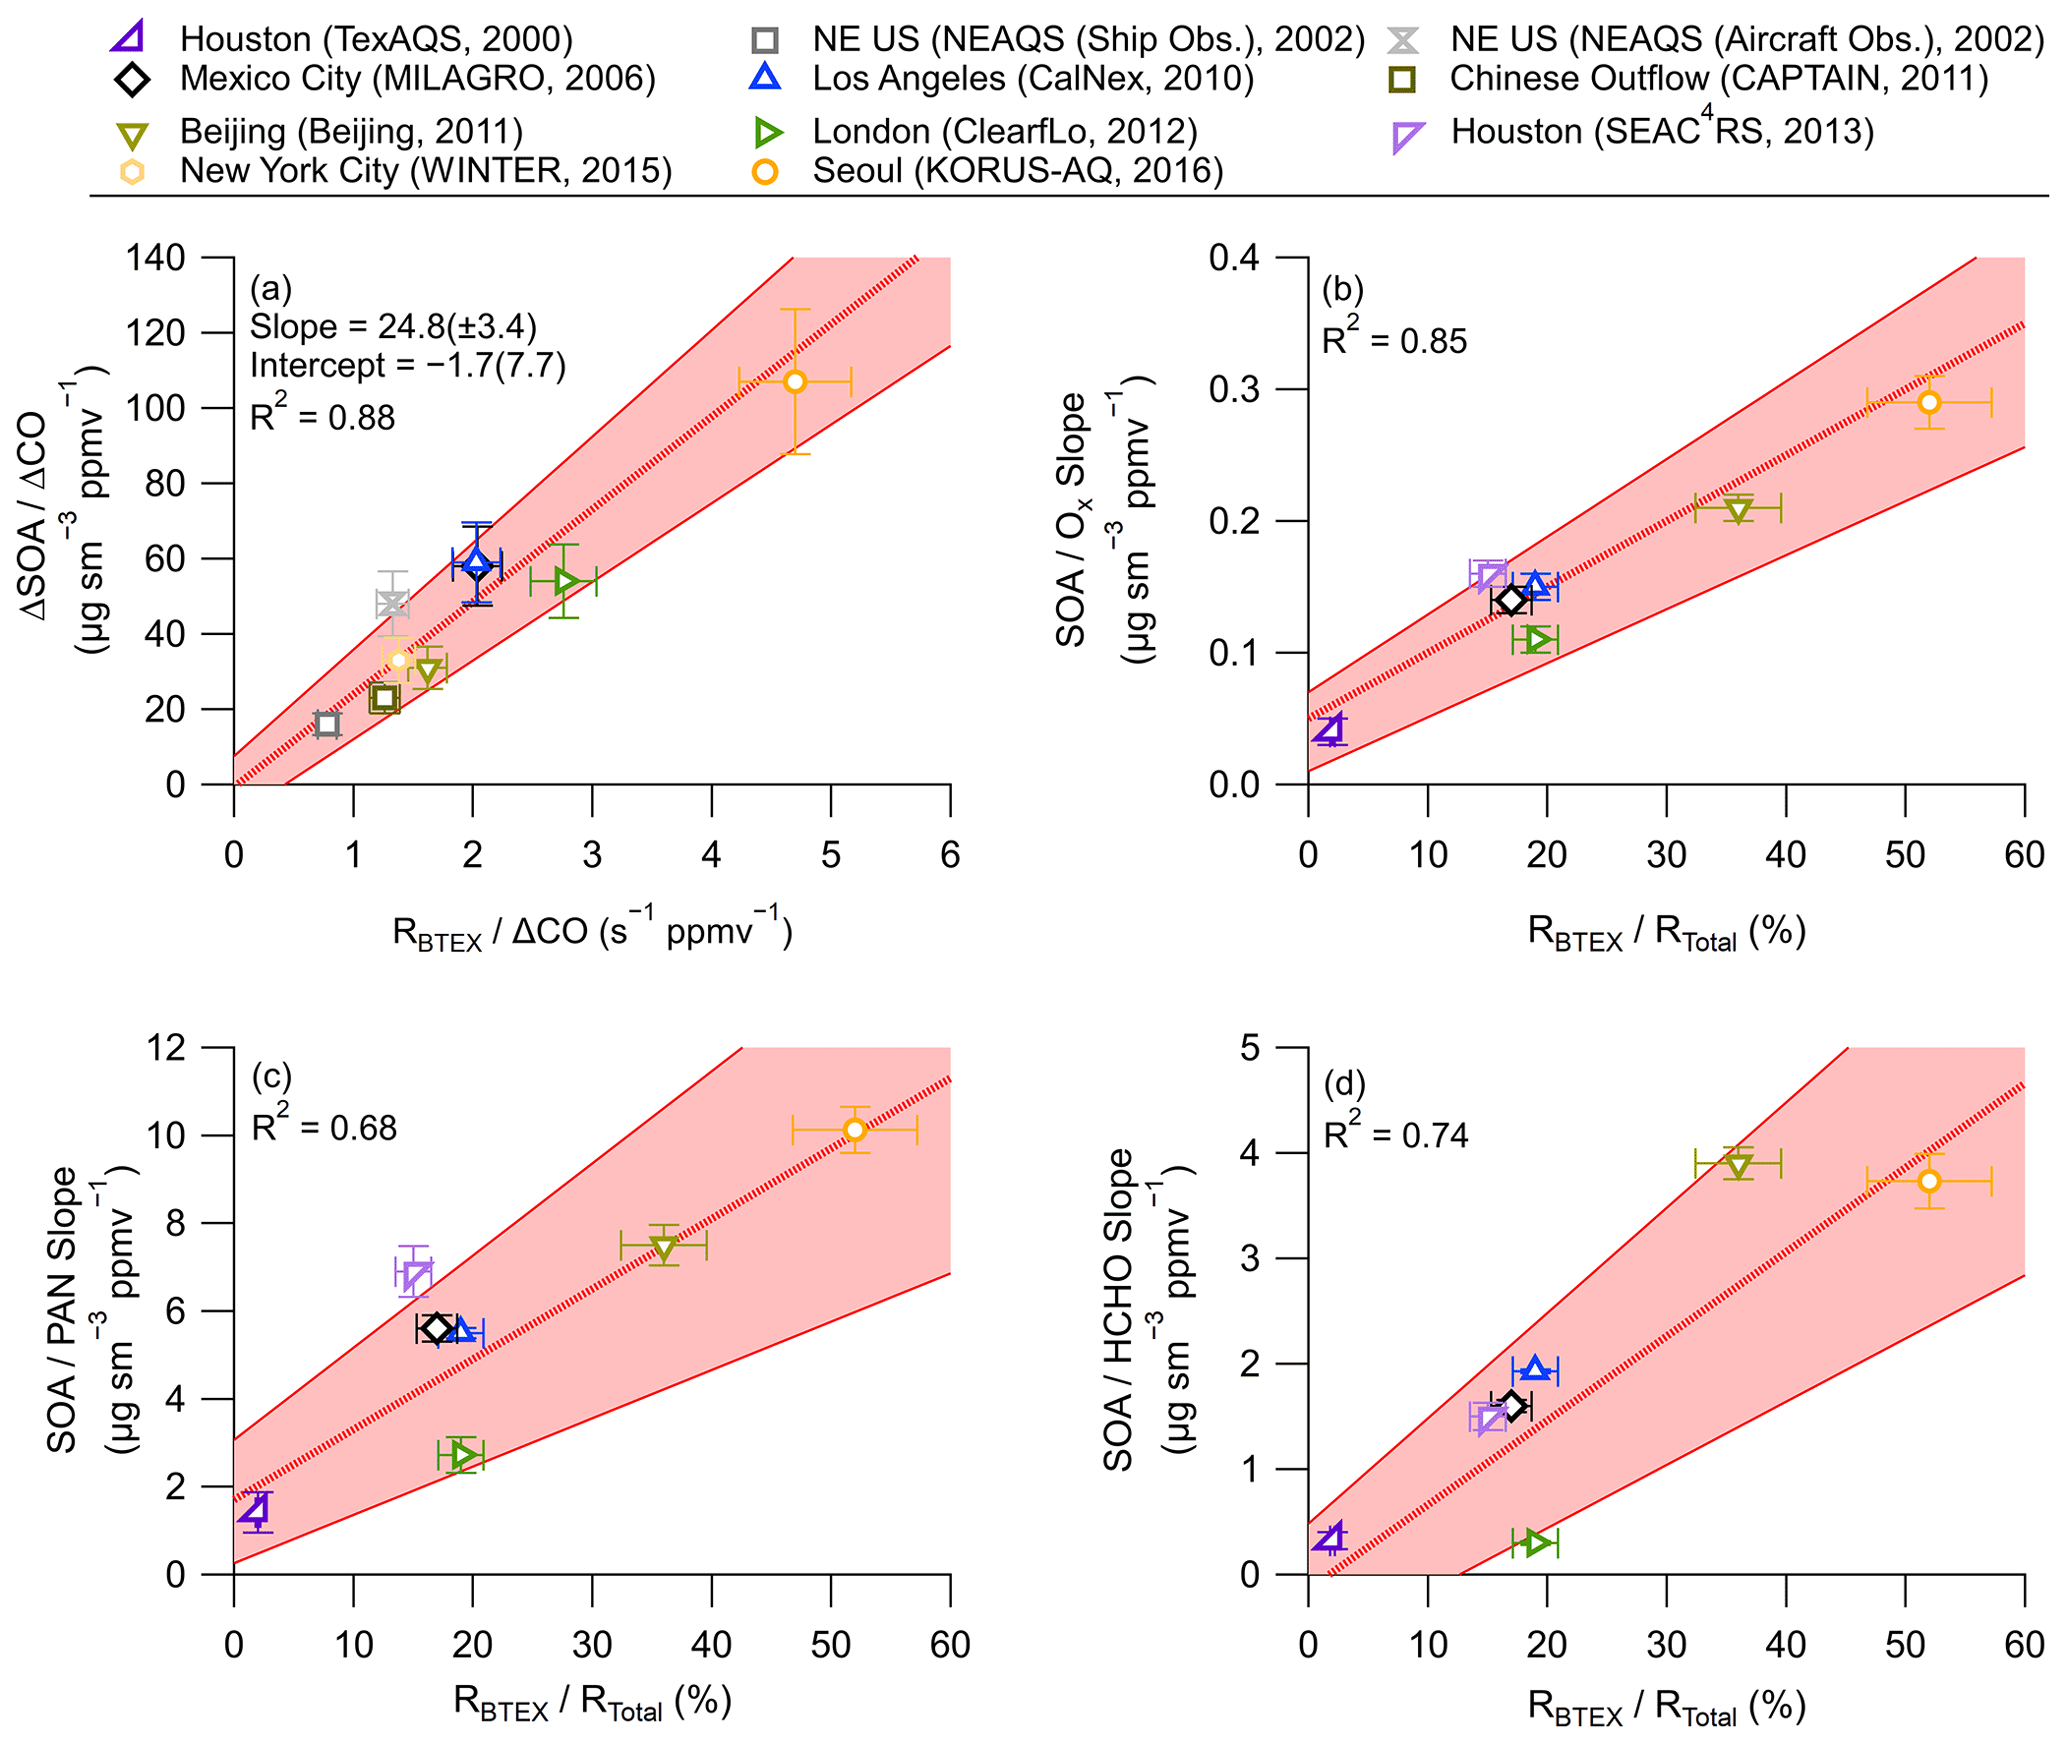
Figure 2(a) Scatterplot of background and dilution-corrected ASOA concentrations (ΔSOA/ΔCO at PA = 0.5 equivalent days) versus BTEX (benzene, toluene, ethylbenzene, and xylenes) emission reactivity ratio () for multiple major field campaigns on three continents. Comparison of ASOA versus (b) Ox, (c) PAN, and (d) HCHO slopes versus the ratio of the BTEX total emission reactivity, where total is the OH reactivity for the emissions of BTEX + C2−3 alkenes + C2−6 alkanes (Tables S5–S7), for the campaigns studied here. For all figures, red shading is the ± 1σ uncertainty of the slope, and the bars are ± 1σ uncertainty of the data (see Sect. S5).
2.3 Estimation of premature mortality attribution
Premature deaths were calculated for five disease categories: ischemic heart disease (IHD), stroke, chronic obstructive pulmonary disease (COPD), acute lower respiratory illness (ALRI), and lung cancer (LC). We calculated premature mortality for the population aged more than 30 years, using Eq. (8).
Mortality rate, y0, varies according to the particular disease category and geographic region, which is available from the Global Burden of Disease Study 2015 database – GBD 2015 (IHME, 2016). Population (Pop) was obtained from the Columbia University Center for International Earth Science Information Network (CIESIN) for 2010 (CIESIN, 2017). Relative risk, RR, can be calculated as shown in Eq. (9).
α, β, and ρ values depend on disease category and are calculated from Burnett et al. (2014) (see Table S14 and the associated file). If the PM2.5 concentrations are below the PM2.5 threshold value (Table S14), premature deaths were computed as zero. However, there could be some health impacts at concentrations below the PM2.5 threshold values (Krewski et al., 2009); following the methods of the GBD studies, these can be viewed as lower bounds on estimates of premature deaths.
We performed an additional sensitivity analysis using the Global Exposure Mortality Model (GEMM) (Burnett et al., 2018). For the GEMM analysis, we also used age stratified population data from GPWv3. Premature death is calculated the same as shown in Eq. (8); however, the relative risk differs. For the GEMM model, the relative risk can be calculated as shown in Eq. (10).
Here z= max (0, PM2.5–PM2.5,Threshold); θ, π, , α, and PM2.5,Threshold depend on disease category and are from Burnett et al. (2018). Similar to the Eq. (9), if the concentrations are below the threshold (2.4 µg m−3; Burnett et al., 2018), premature deaths are computed as zero; however, the GEMM has a lower threshold than the GBD method.
For GBD, we do not consider age-specific mortality rates or risks. For GEMM, we calculate age-specific health impacts with age-specific parameters in the exposure response function (Table S15). We combine the age-specific results of the exposure-response function with age-distributed population data from GPW (Gridded Population of the World; CIESIN, 2017) and a national mortality rate across all ages to assess age-specific mortality.
We calculated total premature deaths using annual average total PM2.5 concentrations derived from satellite-based estimates at the resolution of 0.1∘ × 0.1∘ from van Donkelaar et al. (2016). Application of the remote-sensing-based PM2.5 at the 0.1∘ × 0.1∘ resolution rather than direct use of the GEOS-Chem model concentrations at the 2∘ × 2.5∘ resolution helps reduce uncertainties in the quantification of PM2.5 exposure inherent in coarser estimates (Punger and West, 2013). We also calculated deaths by subtracting the total annual average ASOA concentrations derived from GEOS-Chem from this amount (Fig. S11). To reduce uncertainties related to spatial gradients and total concentration magnitudes in our GEOS-Chem simulations of PM2.5, our modeled ASOA was calculated as the fraction of ASOA to total PM2.5 in GEOS-Chem, multiplied by the satellite-based PM2.5 concentrations (Eq. 11).
Finally, this process for estimating PM2.5 health impacts considers only PM2.5 mass concentration and does not distinguish toxicity by composition, consistent with the current US EPA position expressed in Sacks et al. (2019).
3.1 Observational constraints of ASOA production across three continents
Measurements during intensive field campaigns in large urban areas better constrain the concentrations and atmospheric formation of ASOA because the scale of ASOA enhancement is large compared with SOA from a regional background. Generally, ASOA increased with the amount of urban precursor VOCs and with atmospheric PA (de Gouw et al., 2005; de Gouw and Jimenez, 2009; DeCarlo et al., 2010; Hayes et al., 2013; Nault et al., 2018; Schroder et al., 2018; Shah et al., 2018). In addition, ASOA correlates strongly with gas-phase secondary photochemical species, including Ox, HCHO, and PAN (Herndon et al., 2008; Wood et al., 2010; Hayes et al., 2013; Zhang et al., 2015; Nault et al., 2018; Liao et al., 2019) (Table S4; Figs. S1–S3), which are indicators of photochemical processing of emissions.
However, as initially discussed by Nault et al. (2018) and shown in Fig. 3, there is large variability in these various metrics across the urban areas evaluated here. To the best of the authors' knowledge, this variability has not been explored and its physical meaning has not been interpreted. However, as shown in Fig. 3, the trends in ΔSOA ΔCO are similar to the trends in the slopes of SOA versus Ox, PAN, or HCHO. For example, Seoul is the highest for nearly all metrics and is approximately a factor of 6 higher than the urban area, Houston, that generally showed the lowest photochemical metrics. This suggests that the variability is related to a physical factor, including emissions and chemistry.

Figure 3(a) A comparison of the ΔSOA ΔCO for the urban campaigns on three continents. Comparison of (b) SOA Ox, (c) SOA HCHO, and (d) SOA PAN slopes for the urban areas (Table S4). For panels (b) through (d), cities marked with * have no HCHO, PAN, or hydrocarbon data.
The VOC concentration, together with how quickly the emitted VOCs react (Σki × [VOC]i, i.e., the hydroxyl radical, or OH, reactivity of VOCs), where k is the OH rate coefficient for each VOC, are a determining parameter for ASOA formation over urban spatial scales (Eq. 12). ASOA formation is normalized here to the excess CO mixing ratio (ΔCO) to account for the effects of meteorology, dilution, and nonurban background levels as well as allow for easier comparison between different studies:
where Y is the aerosol yield for each compound (mass of SOA formed per unit mass of precursor reacted), and [OH] × Δt is the PA.
BTEX are one group of known ASOA precursors (Gentner et al., 2012; Hayes et al., 2013), and their emission ratio (to CO) was determined for all campaigns (Table S5). Thus, BTEX can provide insight into ASOA production. Fig. 2a shows that the variation in ASOA (at PA = 0.5 equivalent days) is highly correlated with the emission reactivity ratio of BTEX (RBTEX, ) across all of the studies. However, BTEX alone cannot account for much of the ASOA formation (see budget closure discussion below), and instead, BTEX may be better thought of as both partial contributors and also as indicators for the co-emission of other (unmeasured) organic precursors that are also efficient at forming ASOA.
Ox, PAN, and HCHO are produced from the oxidation of a much wider set of VOC precursors (including small alkenes, which do not appreciably produce SOA when oxidized). These alkenes have similar reaction rate constants with OH as the most reactive BTEX compounds (Table S12); however, their emissions and concentration can be higher than BTEX (Table S7). Thus, alkenes would dominate RTotal, leading to Ox, HCHO, and PAN being produced more rapidly than ASOA (Fig. 2b–d). When RBTEX becomes more important for RTotal, the emitted VOCs are more efficient in producing ASOA. Thus, the ratio of ASOA to gas-phase photochemical products shows a strong correlation with (Fig. 2b–d).
An important aspect of this study is that most of these observations occurred during spring and summer, when solid-fuel emissions are expected to be lower (e.g., Chafe et al., 2015; Lam et al., 2017; Hu et al., 2020). Further, the most important observations used here are during the afternoon, specifically investigating the photochemically produced ASOA. These results might partially miss any ASOA produced through nighttime aqueous chemistry or oxidation by nitrate radical (Kodros et al., 2020). However, two of the studies included in our analysis, Chinese outflow (Campaign of Air Pollution at Typical Coastal Areas IN Eastern China, CAPTAIN 2011; Hu et al., 2013) and New York City (Wintertime INvestigation of Transport, Emissions, and Reactivity, WINTER 2015; Schroder et al., 2018), occurred in late winter/early spring, when solid-fuel emissions were important. We find that these observations lie within the uncertainty in the slope between ASOA and RBTEX (Fig. 2a). Their photochemically produced ASOA observed under strong impact from solid-fuel emissions shows similar behavior to the ASOA observed during spring and summer time. Thus, given the limited datasets currently available, photochemically produced ASOA is expected to follow the relationship shown in Fig. 2a and is also expected to follow this relationship for regions impacted by solid-fuel burning. Future comprehensive studies in regions strongly impacted by solid-fuel burning are needed to further investigate photochemical ASOA production under those conditions.
3.2 Budget closure of ASOA for four urban areas on three continents indicates reasonable understanding of ASOA sources
To investigate the correlation between ASOA and RBTEX, a box model using the emission ratios from BTEX (Table S5), other aromatics (Table S8), IVOCs (Sect. S1), and SVOCs (Sect. S1) was run for five urban areas: New York City, 2002; Los Angeles; Beijing; London; and New York City, 2015 (see Sects. S1 and S3 for more information). The differences in the results shown in Fig. 4 are due to differences in the emissions for each city. We show that BTEX alone cannot explain the observed ASOA budget for urban areas around the world. Figure 4a shows that approximately 25 ± 6 % of the observed ASOA originates from the photooxidation of BTEX. The fact that BTEX only explains 25 % of the observed ASOA is similar to prior studies that have undertaken budget analysis of precursor gases and observed SOA (e.g., Dzepina et al., 2009; Ensberg et al., 2014; Hayes et al., 2015; Ma et al., 2017; Nault et al., 2018). Therefore, other precursors must account for most of the ASOA produced.
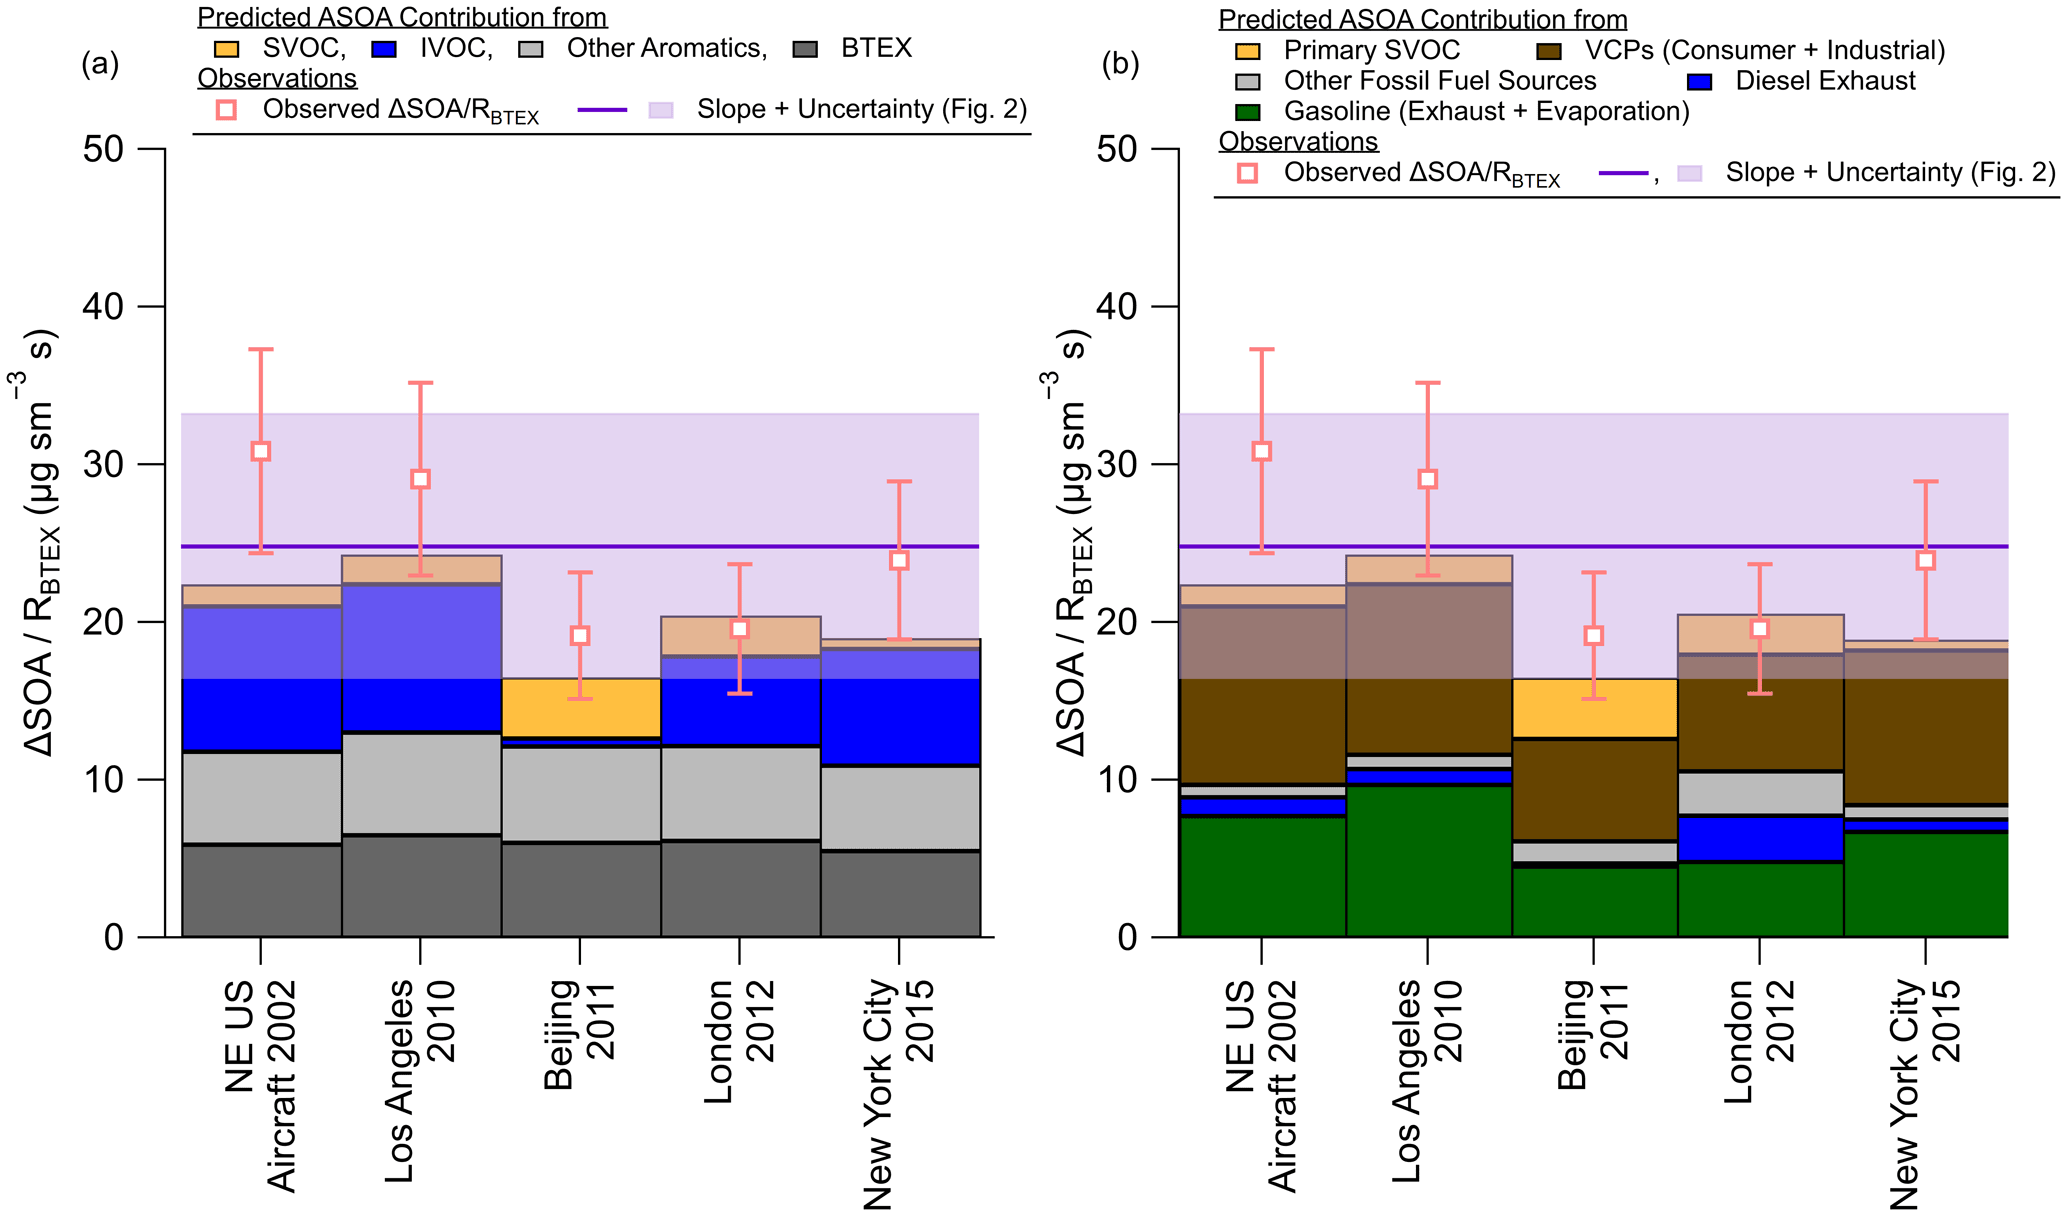
Figure 4(a) Budget analysis for the contribution of the observed ΔSOA RBTEX (Fig. 2) for cities with known emissions inventories for different volatility classes (see Fig. 5 and Fig. S6 in the Supplement). Panel (b) is the same as panel (a) but for sources of emissions. For panels (a) and (b), SVOC is the contribution from both vehicle and other (cooking, etc.) sources. See the Supplement for information about the emissions, ASOA precursor contribution, error analysis, and a discussion about the sensitivity of emission inventory IVOC/BTEX ratios for different cities and years in the USA.
Because alkanes, alkenes, and oxygenated compounds with carbon numbers less than six are not significant ASOA precursors, we focus on emissions and sources of BTEX, other mono-aromatics, IVOCs, and SVOCs. These three classes of VOCs, aromatics, IVOCs, and SVOCs, have been suggested to be significant ASOA precursors in urban atmospheres (Robinson et al., 2007; Hayes et al., 2015; Ma et al., 2017; McDonald et al., 2018; Nault et al., 2018; Schroder et al., 2018; Shah et al., 2018), originating from both fossil fuel and VCP emissions.
Using the best available emission inventories from cities on three continents (EMEP/EEA, 2016; McDonald et al., 2018; Li et al., 2019) and observations, we quantify the emissions of BTEX, other mono-aromatics, IVOCs, and SVOCs for both fossil fuel (e.g., gasoline, diesel, and kerosene), VCPs (e.g., coatings, inks, adhesives, personal care products, and cleaning agents), and cooking sources (Fig. 5). This builds off the work of McDonald et al. (2018) for urban regions on three different continents.
Note that the emissions investigated here ignore any oxygenated VOC emissions not associated with IVOCs and SVOCs due to the challenge in estimating the emission ratios for these compounds (de Gouw et al., 2018). Further, SVOC emission ratios are estimated from the average POA observed by the Aerodyne aerosol mass spectrometer (AMS) during the specific campaign and scaled by profiles from the literature for a given average temperature and average OA (Robinson et al., 2007; Worton et al., 2014; Lu et al., 2018). As most of the campaigns had an average OA between 1 and 10 µg m−3 and a temperature of ∼ 298 K, this led to the majority of the estimated emitted SVOC gases being in the highest SVOC bin. However, as discussed later, this does not lead to SVOCs dominating the predicted ASOA due to the fact the fragmentation and overall yield from the photooxidation of SVOC to ASOA are taken into account.
Combining these inventories and observations for the various locations provides the following insights about the potential ASOA precursors not easily measured or quantified in urban environments (e.g., Zhao et al., 2014; Lu et al., 2018):
-
Aromatics from fossil fuel account for 14 %–40 % (mean 22 %) of the total BTEX and IVOC emissions for the five urban areas investigated in-depth (Fig. 5), agreeing with prior studies that have shown that the observed ASOA cannot be reconciled by the observations or emission inventory of aromatics from fossil fuels (e.g., Ensberg et al., 2014; Hayes et al., 2015).
-
BTEX from both fossil fuels and VCPs account for 25 %–95 % (mean 43 %) of BTEX and IVOC emissions (Fig. 5). China has the lowest contribution of IVOCs, potentially due to differences in chemical make-up of the solvents used daily (Li et al., 2019), but more research is needed to investigate the differences in IVOCs / BTEX from Beijing versus the USA and UK emission inventories. Nonetheless, this shows the importance of IVOCs for both emissions and ASOA precursors.
-
IVOCs are generally equal to, if not greater than, the emissions of BTEX in four of the five urban areas investigated here (Fig. 5).
-
Overall, VCPs account for a large fraction of the BTEX and IVOC emissions for all five cities.
-
Finally, SVOCs account for 27 %–88 % (mean 53 %) of VOCs generally considered ASOA precursors (VOCs with volatility saturation concentrations ≤ 107 µg m−3) (Fig. S6). Beijing has the highest contribution of SVOCs to ASOA precursors due to the use of solid fuels and cooking emissions (Hu et al., 2016). Also, this indicates the large contribution of a class of VOCs that are difficult to measure (Robinson et al., 2007) and are an important ASOA precursor (e.g., Hayes et al., 2015), showing that further emphasis should be placed in quantifying the emissions of this class of compounds.
These results provide the ability to further investigate the mass balance of predicted and observed ASOA for these urban locations (Fig. 4). The inclusion of IVOCs, other aromatics not including BTEX, and SVOCs leads to the ability to explain, on average, 85 ± 12 % of the observed ASOA for these urban locations around the world (Fig. 4a). Further, the VCP contribution to ASOA is important for all of these urban locations, accounting for, on average, 37 ± 3 % of the observed ASOA (Fig. 4b).
This bottom-up mass budget analysis provides important insights to further explain the correlation observed in Fig. 2. First, IVOCs are generally co-emitted from similar sources to those for BTEX for the urban areas investigated in-depth (Fig. 5). The oxidation of these co-emitted species leads to the ASOA production observed across the urban areas around the world. Second, S/IVOCs generally have similar rate constants to toluene and xylenes (≥1 × 10⁻¹¹ cm3 molec.−1 s−1) (Zhao et al., 2014, 2017), the compounds that contribute the most to RBTEX, explaining the rapid ASOA production that has been observed in various studies (de Gouw and Jimenez, 2009; DeCarlo et al., 2010; Hayes et al., 2013; Hu et al., 2013, 2016; Nault et al., 2018; Schroder et al., 2018) and the correlation (Fig. 2). Finally, the contribution of VCPs and fossil fuel sources to ASOA is similar across the cities, expanding upon and further supporting the conclusion of McDonald et al. (2018) in the importance of identifying and understanding VCP emissions in order to explain ASOA.
This investigation shows that the bottom-up calculated ASOA agrees with observed top-down ASOA within 15 %. As highlighted above, this ratio is explained by the co-emissions of IVOCs with BTEX from traditional sources (diesel, gasoline, and other fossil fuel emissions) and VCPs (Fig. 5) along with similar rate constants for these ASOA precursors (Table S12). Thus, the ASOA RBTEX ratio obtained from Fig. 2 results in accurate predictions of ASOA for the urban areas evaluated here, and this value can be used to better estimate ASOA with chemical transport models (Sect. 4).
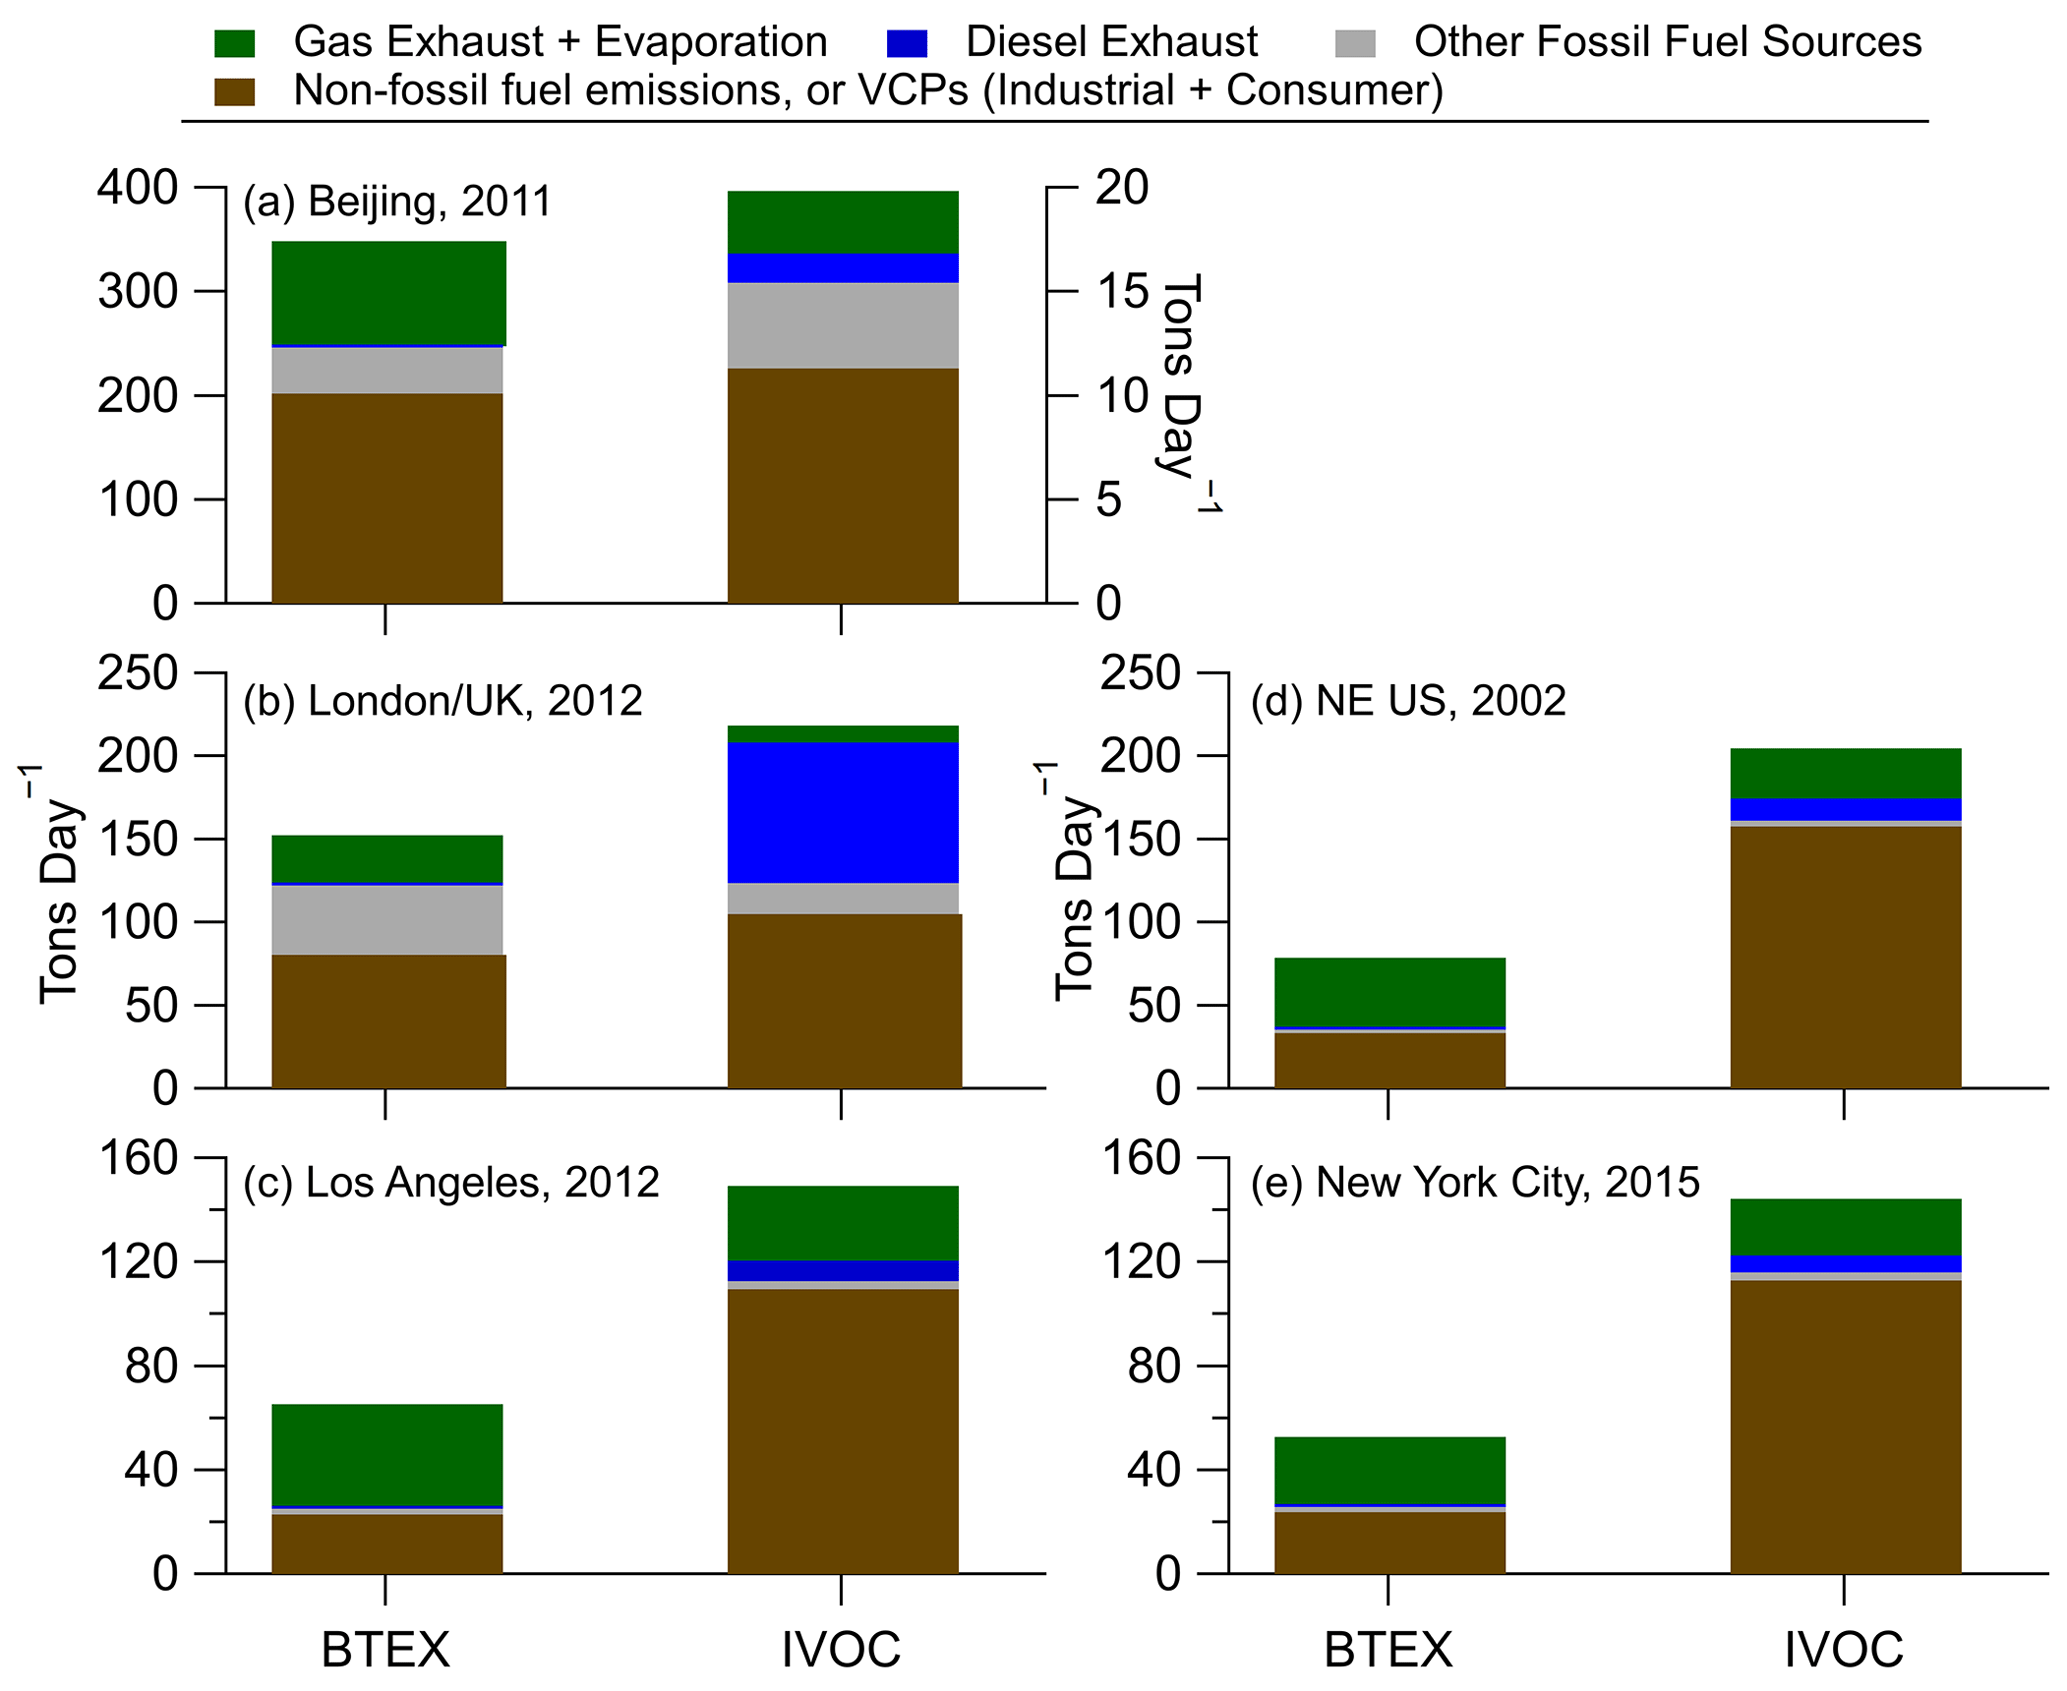
Figure 5Comparison of BTEX and IVOC sources for (a) Beijing (see the Supplement section about the Beijing emission inventory), (b) London (see the Supplement section about the London/UK emission inventory), and (c) Los Angeles, (d) Northeast USA, and (e) New York City (see the Supplement section about the USA for panels c–e). For panel (a), BTEX is on the left axis and IVOC is on the right axis, due to the small emissions per day for IVOC.
The SIMPLE (SIMPLifiEd parameterization of combustion SOA) model was originally designed and tested against the observations collected around Mexico City (Hodzic and Jimenez, 2011). It was then tested against observations collected in Los Angeles (Hayes et al., 2015; Ma et al., 2017). As both datasets have nearly identical ΔSOA ΔCO and RBTEX (Figs. 2, 3), it is not surprising that the SIMPLE model did well in predicting the observed ΔSOA ΔCO for these two urban regions with consistent parameters. Although the SIMPLE model generally performed better than more explicit models, it generally had lower skill in predicting the observed ASOA in urban regions outside of Mexico City and Los Angeles (Shah et al., 2019; Pai et al., 2020).
This may stem from the original SIMPLE model, with constant parameters, missing the ability to change the amount and reactivity of the emissions, which are different for the various urban regions, versus the ASOA precursors being emitted proportionally to only CO (Hodzic and Jimenez, 2011; Hayes et al., 2015). For example, in the HTAP emissions inventory, the CO emissions for Seoul, Los Angeles, and Mexico City are all similar (Fig. S8); thus, the original SIMPLE model would suggest similar ΔSOA ΔCO for all three urban locations. However, as shown in Figs. 2 and 3, the ΔSOA ΔCO is different by nearly a factor of 2. The inclusion of the emissions and reactivity, where RBTEX for Seoul is approximately a factor of 2.5 higher than Los Angeles and Seoul, into the “improved” SIMPLE model better accounts for the variability in SOA production, as shown in Fig. 2. Thus, the inclusion and use of this improved SIMPLE model refines the simplified representation of ASOA in chemical transport models and/or box models.
The improved SIMPLE model shows higher ASOA compared with the default volatility basis set (VBS) GEOS-Chem (Fig. 6a, b). In areas strongly impacted by urban emissions, e.g., Europe, East Asia, India, the east and west coast of the USA, and regions impacted by Santiago (Chile), Buenos Aires (Argentina), Sāo Paulo (Brazil), Durban and Cape Town (South Africa), and Melbourne and Sydney (Australia), the improved SIMPLE model predicts up to 14 µg m−3 more ASOA, or ∼ 30 to 60 times more ASOA than the default scheme (Fig. 6c, d). As shown in Fig. 1, during intensive measurements, the ASOA composed 17 %–39 % of PM1, with an average contribution of ∼ 25 %. The default ASOA scheme in GEOS-Chem greatly underestimates the fractional contribution of ASOA to total PM2.5 (<2 %; Fig. 6e). The improved SIMPLE model greatly improves the predicted fractional contribution, showing that ASOA in the urban regions ranges from 15 % to 30 %, with an average of ∼ 15 % for the grid cells corresponding to the urban areas investigated here (Fig. 6f). Thus, the improved SIMPLE model predicts the fractional contribution of ASOA to total PM2.5 far more realistically, compared with observations. As discussed in Sect. 2.3 and Eq. (11), having the model accurately predict the fractional contribution of ASOA to the total PM is very important, as the total PM2.5 is derived from satellite-based estimates (van Donkelaar et al., 2015), and the model fractions are then applied to those total PM2.5 estimates. The ability of the improved SIMPLE model to better represent the ASOA composition provides confidence attributing the ASOA contribution to premature mortality.
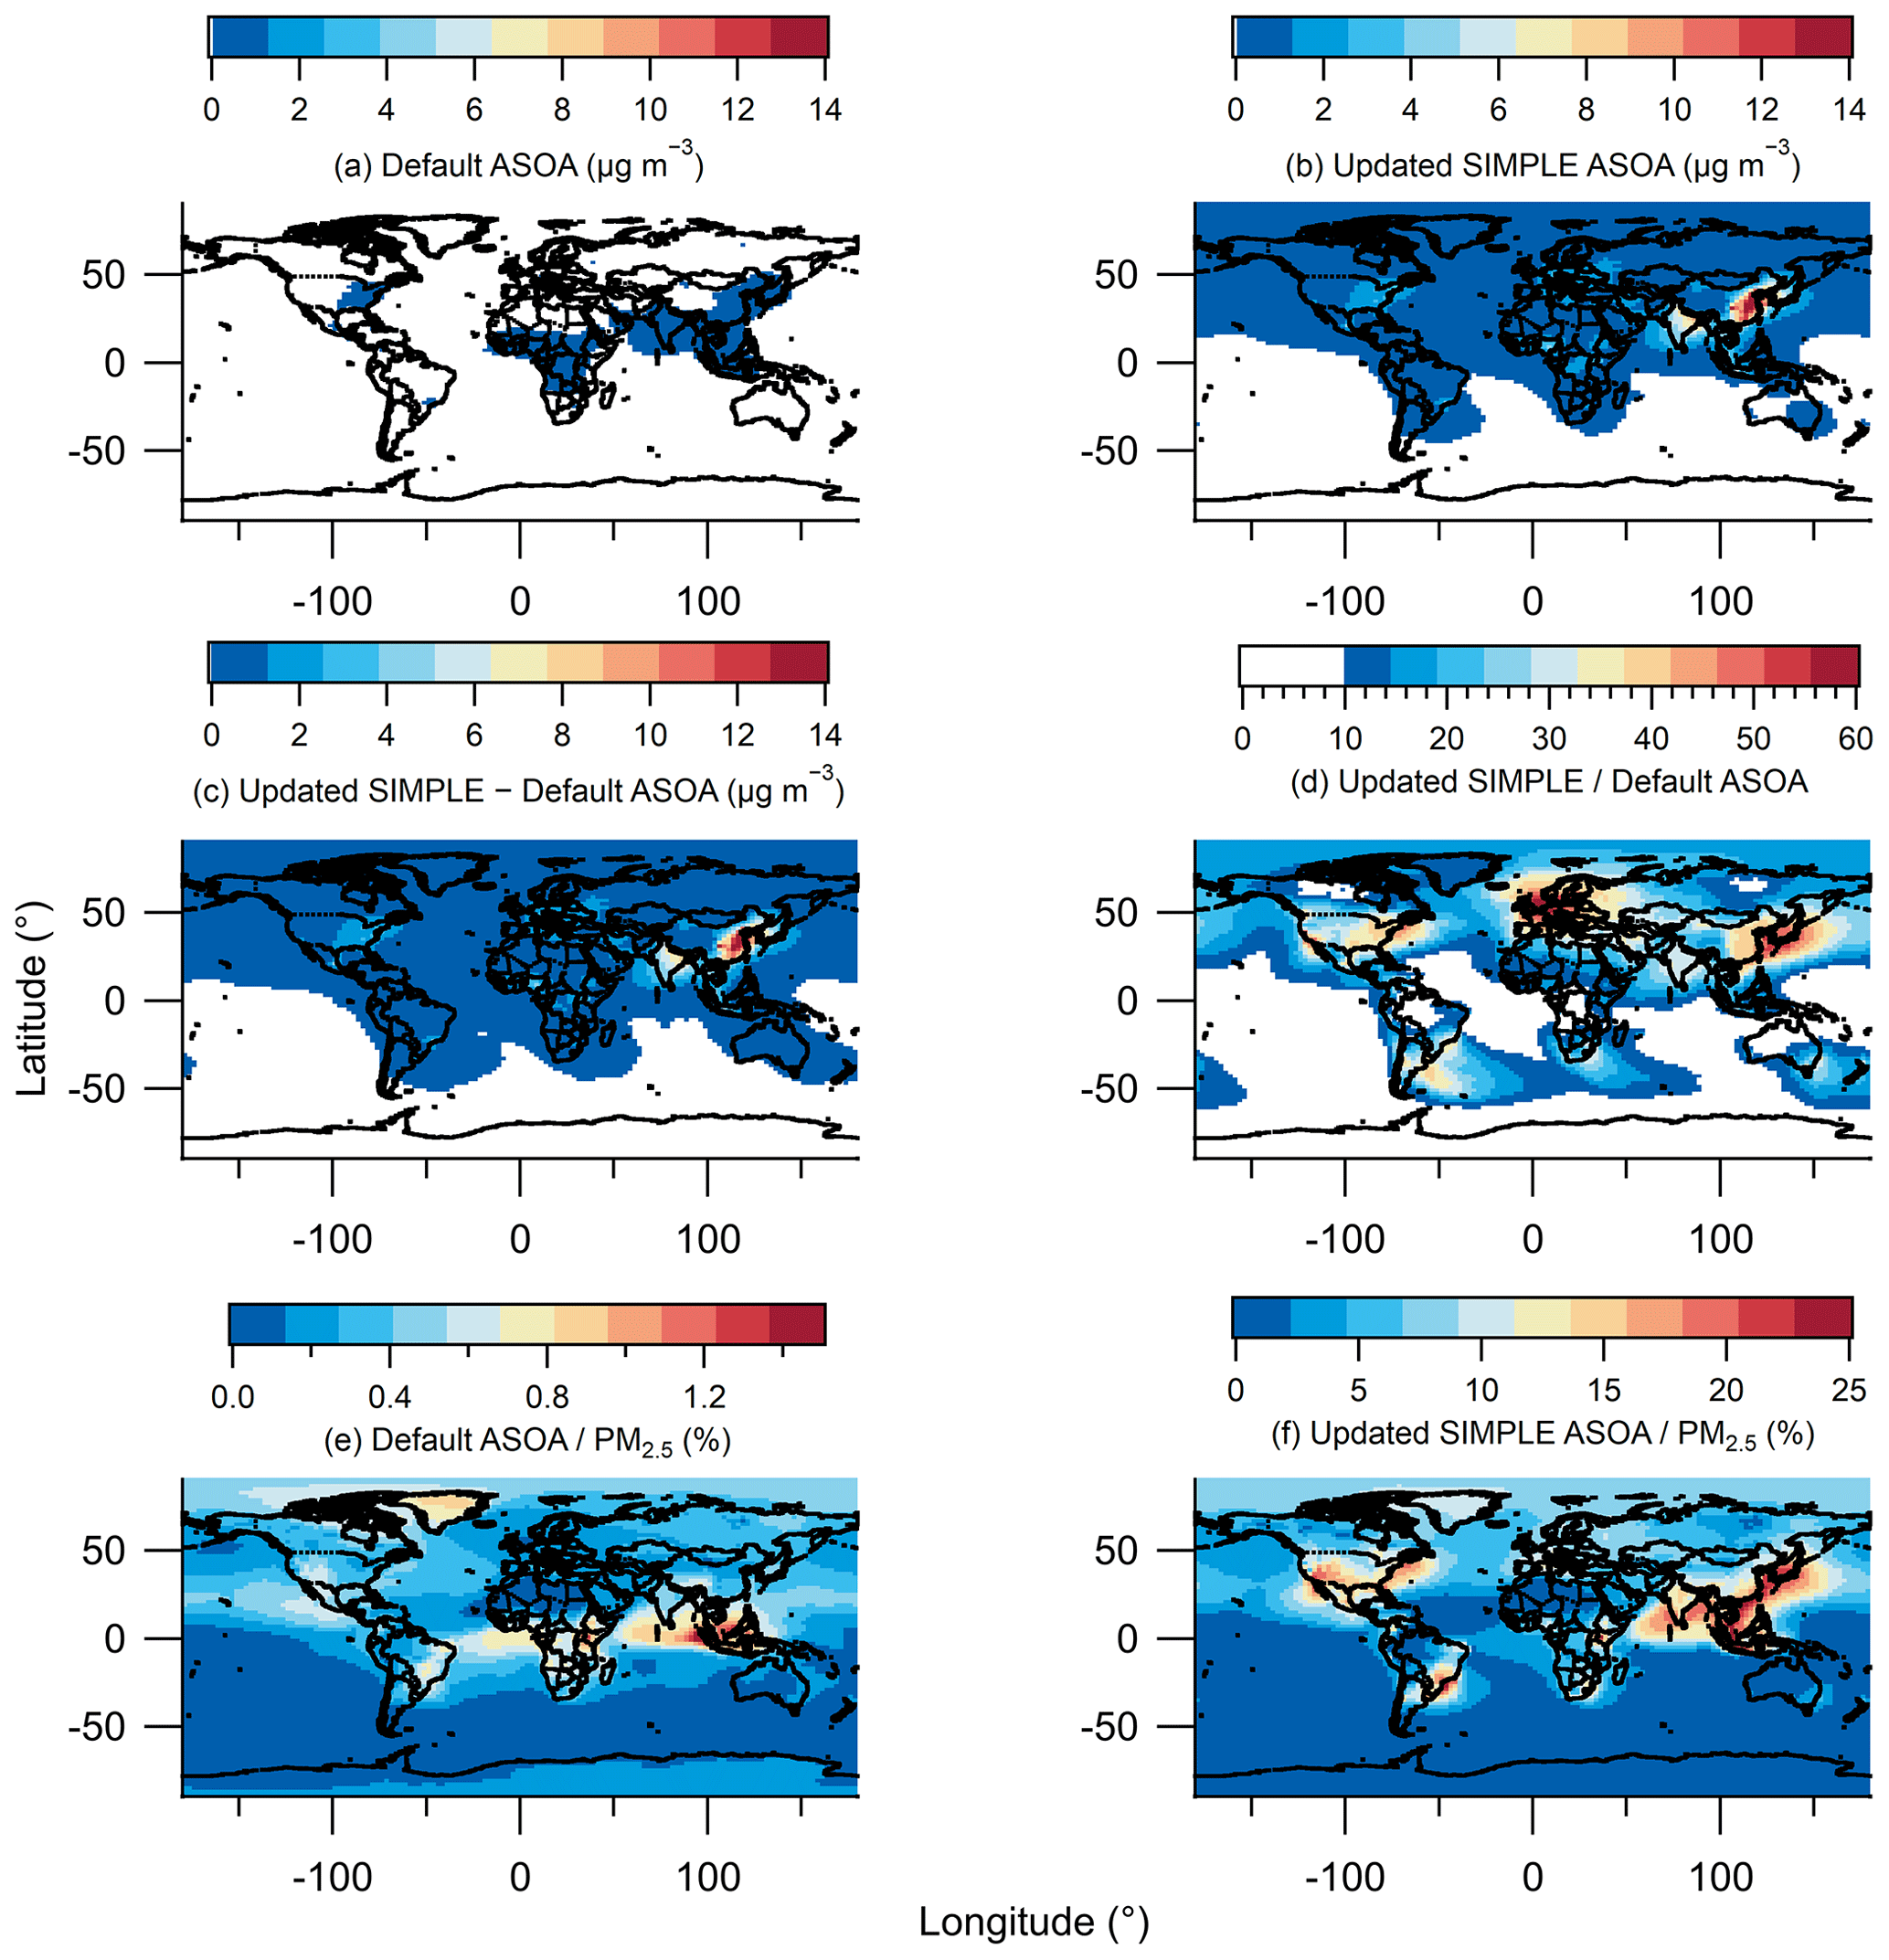
Figure 6(a) Annual average modeled ASOA using the default VBS. (b) Annual average modeled ASOA using the updated SIMPLE model. (c) Difference between the annual average modeled updated SIMPLE and default VBS. Note that values less than 0.05 µg m−3 are white in panels (a) and (b), and values less than 0.02 µg m−3 are white in panel (c). (d) The ratio between the annual average modeled updated SIMPLE (b) and default VBS (a). (e) The percent contribution of annual average modeled ASOA using default VBS to total modeled PM2.5. (f) The percent contribution of the annual average modeled ASOA using updated SIMPLE to total modeled PM2.5.
The improved SIMPLE parameterization is used along with GEOS-Chem to provide an accurate estimation of ASOA formation in urban areas worldwide and provide the ability to obtain realistic simulations of ASOA based on measurement data. We use this model to quantify the attribution of PM2.5 ASOA to premature deaths. Analysis up to this point has been for PM1; however, both the chemical transport model and epidemiological studies utilize PM2.5. For ASOA, this will not impact the discussion or results here because the mass of OA (typically 80 %–90 %) is dominated by PM1 (e.g., Bae et al., 2006; Seinfeld and Pandis, 2006), and ASOA is formed mostly through condensation of oxidized species, which favors partitioning onto smaller particles (Seinfeld and Pandis, 2006).
The procedure for this analysis is described in Fig. 7 and Sects. 2.3 and S3. Briefly, we combine high-resolution satellite-based PM2.5 estimates (for exposure) and a chemical transport model (GEOS-Chem, for fractional composition) to estimate ASOA concentrations and various sensitivity analysis (van Donkelaar et al., 2015). We calculated that ∼ 3.3 million premature deaths (using the integrated exposure-response, IER, function) are due to long-term exposure to ambient PM2.5 (Fig. S9, Table S16), consistent with recent literature (Cohen et al., 2017).
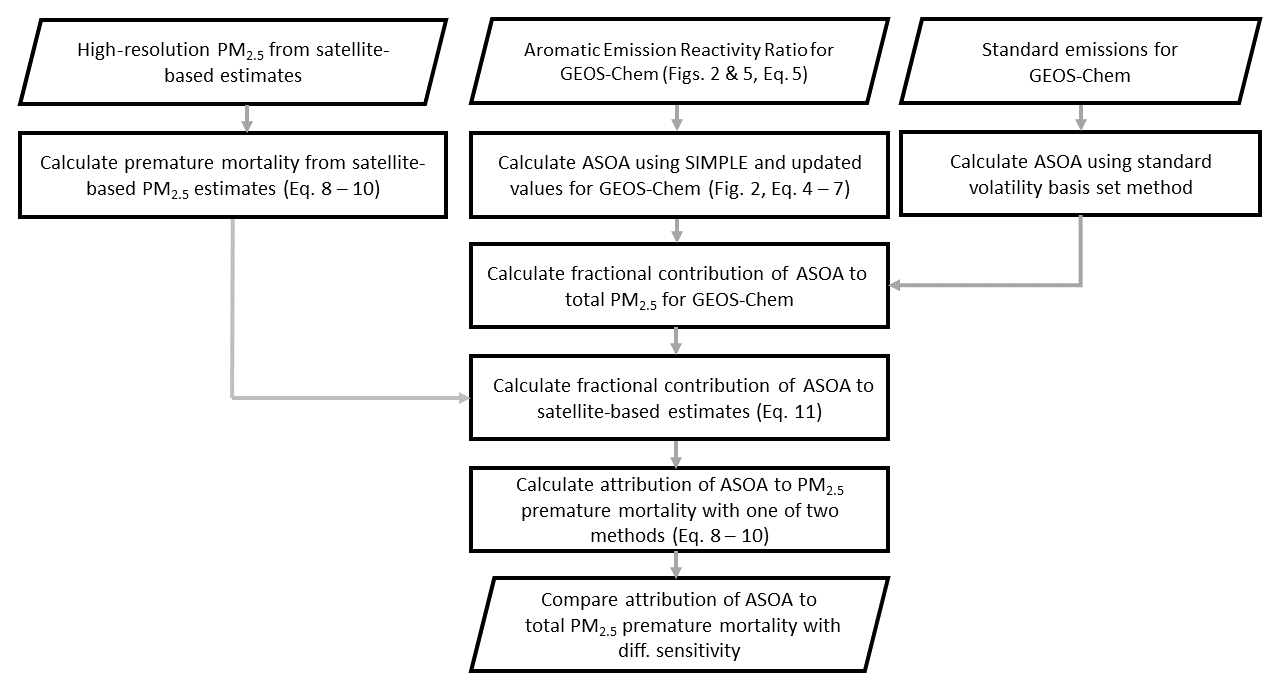
Figure 7Flowchart describing how observed ASOA production was used to calculate ASOA in GEOS-Chem, and how the satellite-based PM2.5 estimates and GEOS-Chem PM2.5 speciation were used to estimate the premature mortality and the attribution of premature mortality by ASOA. See Sect. 2 and the Supplement for further information about the details in the figure. SIMPLE is described in Eq. (4) and by Hodzic and Jimenez (2011) and Hayes et al. (2015). The one of two methods mentioned include either the integrated exposure-response (IER) (Burnett et al., 2014) with Global Burden of Disease (GBD) dataset (IHME, 2016) or the new Global Exposure Mortality Model (GEMM) (Burnett et al., 2018) methods. For both IER and GEMM, the marginal method (Silva et al., 2016) or the attributable fraction method (Anenberg et al., 2019) are used.
The attribution of ASOA PM2.5 premature deaths can be calculated in one of two ways: (a) the marginal method (Silva et al., 2016) or (b) the attributable fraction method (Anenberg et al., 2019). For method (a), it is assumed that a fraction of the ASOA is removed, keeping the rest of the PM2.5 components approximately constant, and the change in deaths is calculated from the deaths associated with the total concentration minus the deaths calculated using the reduced total PM2.5 concentrations. For method (b), the health impact is attributed to each PM2.5 component by multiplying the total deaths by the fractional contribution of each component to total PM2.5. For method (a), the deaths attributed to ASOA are ∼ 340 000 people per year (Fig. 8); whereas, for method (b), the deaths are ∼ 370 000 people per year. Both of these are based on the IER response function (Cohen et al., 2017).
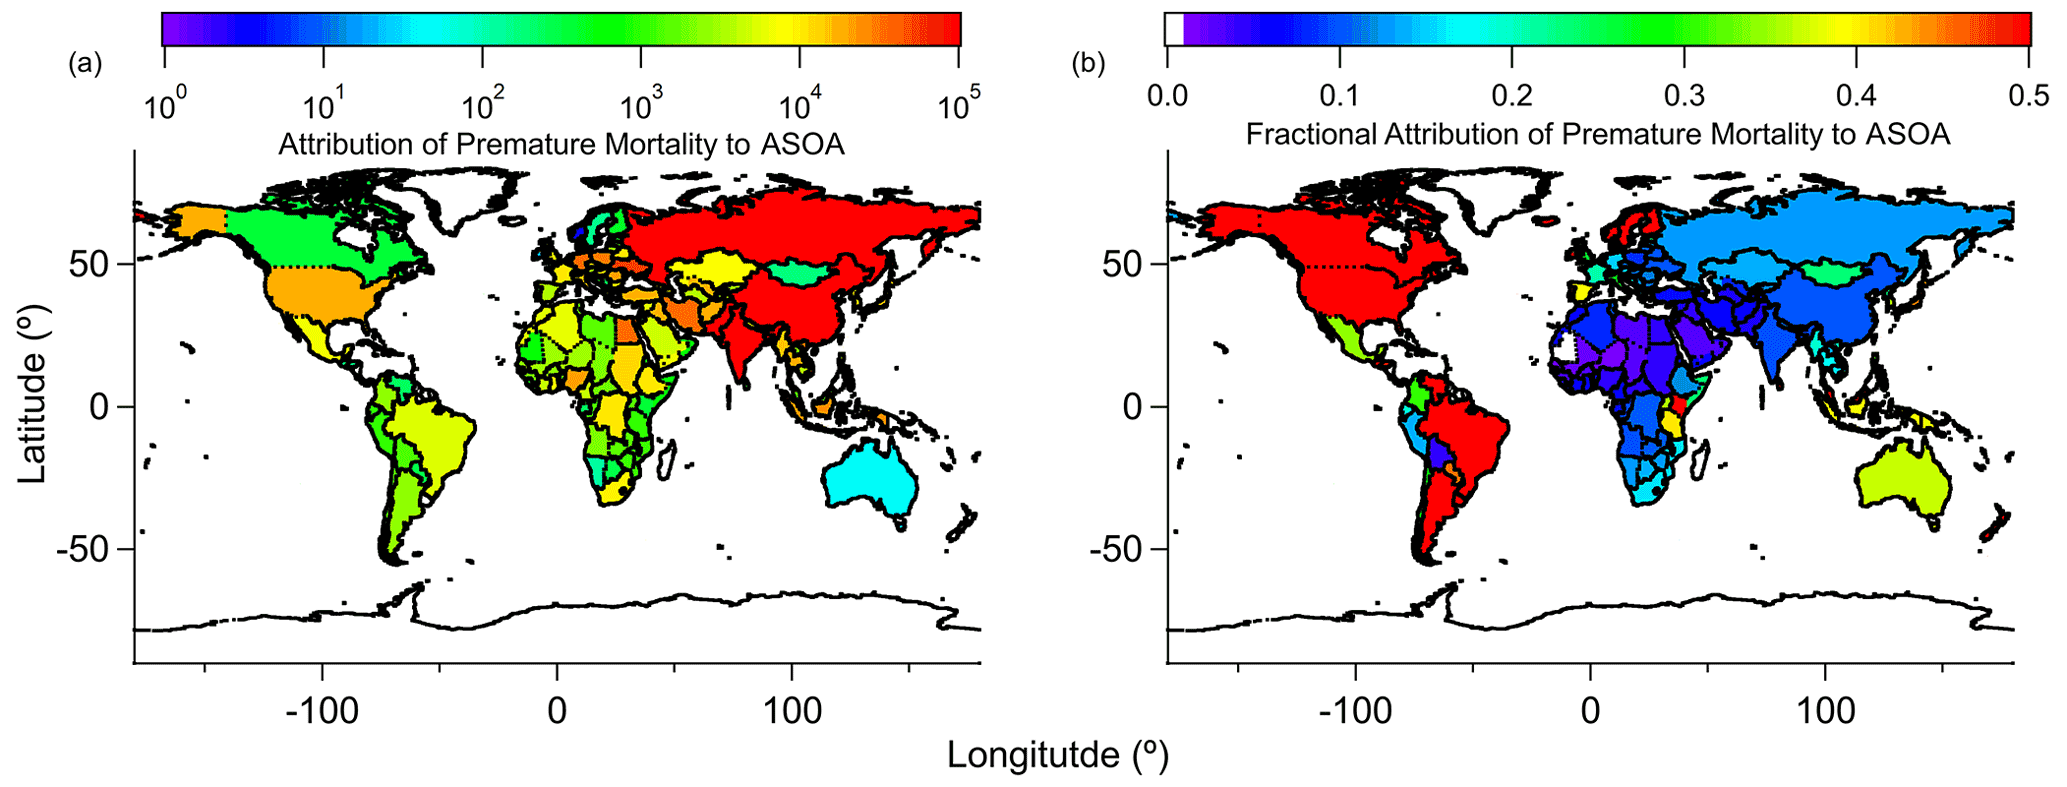
Figure 8The 5-year average (a) estimated reduction in PM2.5-related premature deaths, by country, upon removing ASOA from total PM2.5, and (b) the fractional reduction (reduction in PM2.5 premature deaths/total PM2.5 premature deaths) in PM2.5-related premature deaths, by country, upon removing ASOA from GEOS-Chem. The IER methods are used here. See Figs. S9 and S12 for results using GEMM. See Fig. S10 for the 10 km × 10 km area results in comparison with country-level results.
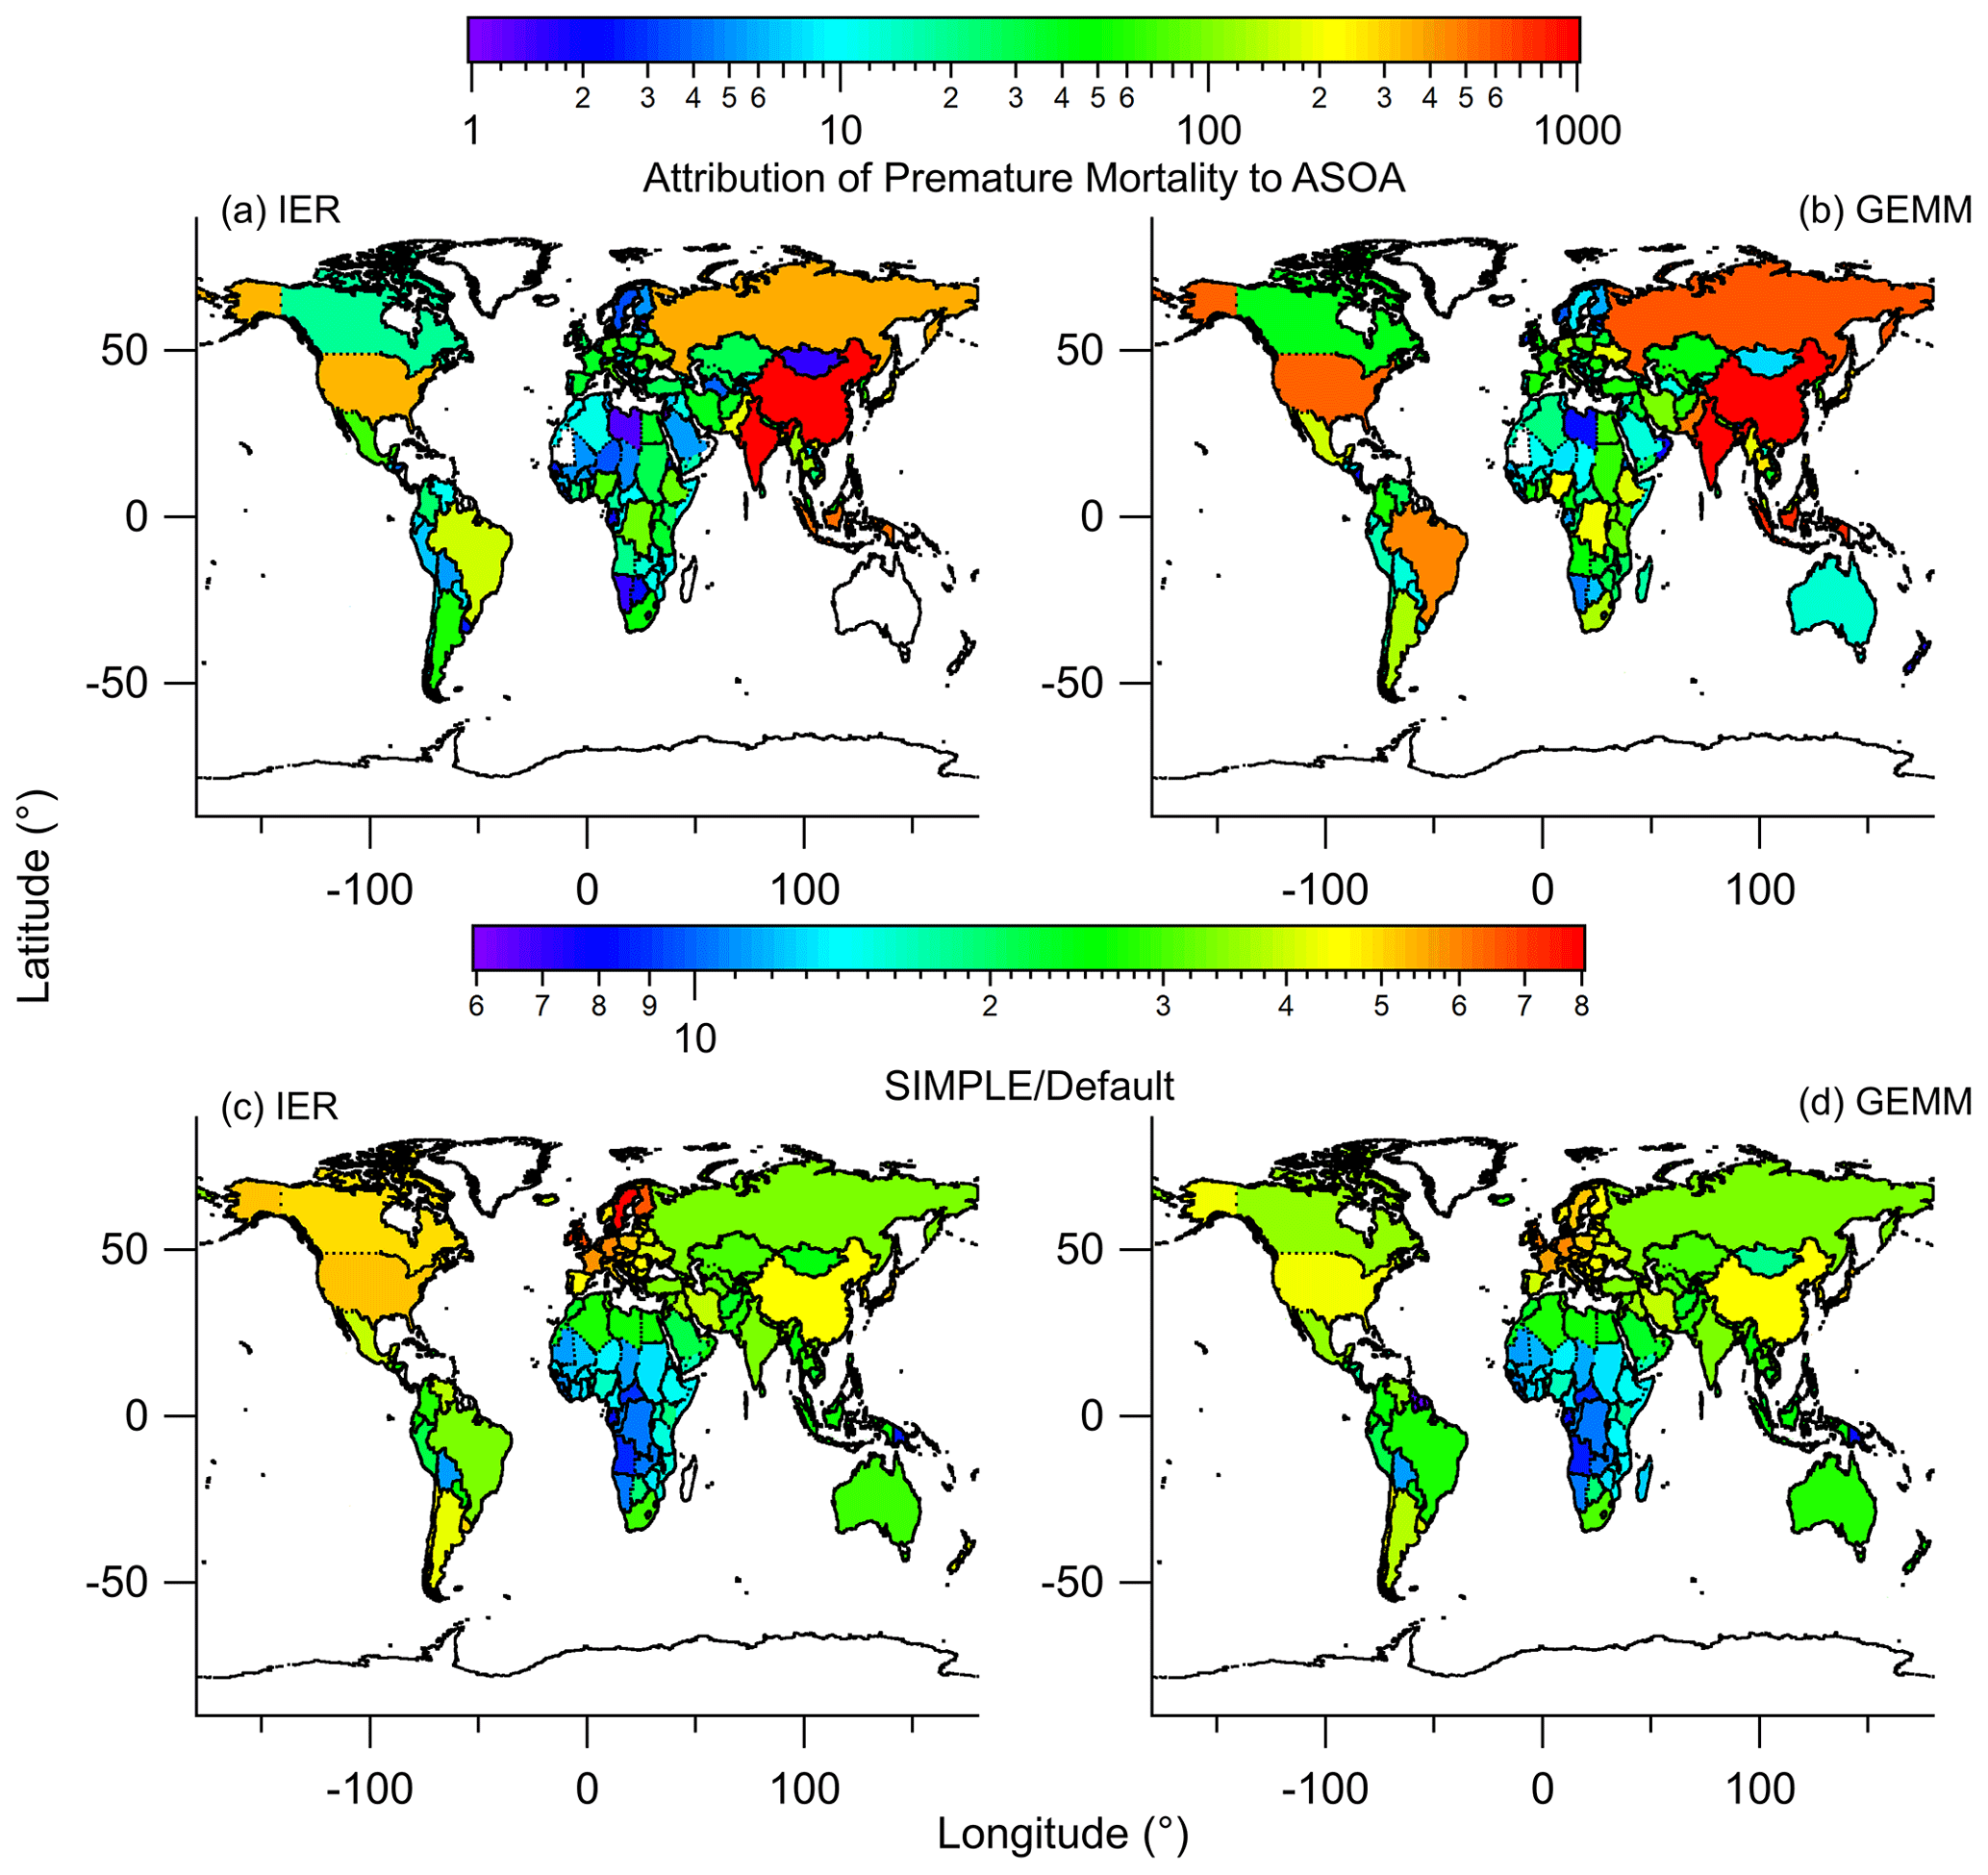
Figure 9Attribution of premature mortality to ASOA with (a) IER or (b) GEMM, using the non-volatile primary OA and traditional SOA precursors method from prior studies (e.g., Ridley et al., 2018). The increase in the attribution of premature mortality to ASOA for the SIMPLE model (Fig. 8) versus the non-volatile primary OA and traditional SOA precursor method (default), for (c) IER and (d) GEMM.
Additional recent work (Burnett et al., 2018) has suggested less reduction in the premature deaths versus PM2.5 concentration relationship at higher PM2.5 concentrations, and lower concentration limits for the threshold below which this relationship is negligible, both of which lead to much higher estimates of PM2.5-related premature deaths. This is generally termed the Global Exposure Mortality Model (GEMM). Using the two attribution methods described above (a and b), the ASOA PM2.5-related premature deaths are estimated to be ∼ 640 000 (method a) and ∼ 900 000 (method b) (Figs. S9, S12; Table S17).
Compared with prior studies using chemical transport models to estimate premature deaths associated with ASOA (e.g., Silva et al., 2016; Ridley et al., 2018), which assumed non-volatile POA and traditional ASOA precursors, the attribution of premature mortality due to ASOA is over an order of magnitude higher in this study (Fig. 9). This occurs using either the IER or the GEMM approach for estimating premature mortality (Fig. 9). For regions with larger populations and more PM2.5 pollution, the attribution is between a factor of 40 and 80 higher. This stems from the non-volatile POA and traditional ASOA precursors overestimating POA and underestimating ASOA compared with observations (Schroder et al., 2018). These offsetting errors will lead to model-predicted total OA values similar to observations (Ridley et al., 2018; Schroder et al., 2018), although different conclusions on whether POA versus SOA is more important for reducing PM2.5-related premature mortality. Using a model constrained to daytime atmospheric observations (Figs. 2, 4; see Sect. 4) leads to a more accurate estimation than earlier estimation of the contribution of photochemically produced ASOA to PM2.5-related premature mortality than those available in prior studies. We note that ozone concentrations change little as we change the ASOA simulation (see Sect. S4 and Fig. S14).
A limitation in this study is the lack of sufficient measurements in South and Southeast Asia, eastern Europe, Africa, and South America (Fig. 1), although these areas account for 44 % of the predicted reduction in premature mortality for the world (Table S16). However, as highlighted in Table S18, these regions likely still consume both transportation fuels and VCPs, although in lower per capita amounts than more industrialized countries. This consumption is expected to lead to the same types of emissions as for the cities studied here, although more field measurements are needed to validate global inventories of VOCs and the resulting oxidation products in the developing world. Transportation emissions of VOCs are expected to be more dominant in the developing world due to higher VOC emission factors associated with inefficient combustion engines, such as two-stroke scooters (Platt et al., 2014) and auto rickshaws (e.g., Goel and Guttikunda, 2015).
Solid fuels are used for residential heating and cooking, which impact the outdoor air quality as well (Hu et al., 2013, 2016; Lacey et al., 2017; Stewart et al., 2021), and also lead to SOA (Heringa et al., 2011). As discussed in Sect. 3.1, although the majority of the studies evaluated here occurred in spring to summer time, when solid-fuel emissions are decreased, two studies occurred during the winter/early spring time, during which time solid-fuel emissions are important (Hu et al., 2013; Schroder et al., 2018). These studies still follow the same relationship between ASOA and RBTEX as the studies that focused on spring/summer photochemistry. Thus, the limited datasets available indicate that photochemically produced ASOA from solid fuels follow a similar relationship to that from other ASOA sources.
Also, solid-fuel sources are included in the inventories used in our modeling. For the HTAP emission inventory used here (Janssens-Maenhout et al., 2015), small-scale combustion, which includes heating and cooking (e.g., solid-fuel use), is included in the residential emission sector. Both CO and BTEX are included in this source and can account for a large fraction of the total emissions where solid fuel use may be important (Fig. S15). Thus, as CO and BTEX are used in the updated SIMPLE model, and campaigns that observed solid-fuel emissions fall within the trend for all urban areas, the solid-fuel contribution to photochemically produced ASOA is accounted for (as accurately as allowed by current datasets) in the estimation of ASOA with respect to the attribution to premature mortality.
Note that recent work has observed potential nighttime aqueous chemistry and/or oxidation by nitrate radicals from solid-fuel emissions to produce ASOA (Kodros et al., 2020). Thus, missing this source of ASOA may lead to an underestimation of total ASOA versus the photochemically produced ASOA that we discuss here, leading to a potential underestimation in the attribution of ASOA to premature mortality. From the studies that investigated “nighttime aging” of solid-fuel emissions to form SOA, we predict that the total ASOA may be underestimated by 1 to 3 µg m−3 (Kodros et al., 2020). However, this potential underestimation is less than the current underestimation in ASOA in GEOS-Chem (default versus updated SIMPLE).
Recently, emission factors from Abidjan, Côte d'Ivoire, a developing urban area, showed the dominance of emissions from transportation and solid-fuel burning, with BTEX being an important fraction of the total emissions, and that all the emissions were efficient with respect to producing ASOA (Dominutti et al., 2019). Further, investigation of emissions in the New Delhi region of India demonstrated the importance of both transportation and solid-fuel emissions (Stewart et al., 2021; Wang et al., 2020), whereas model comparisons with observations show an underestimation of OA compared with observations due to a combination of emissions and OA representation (Jena et al., 2020). Despite emission source differences, SOA is still an important component of PM2.5 (e.g., Singh et al., 2019) and, thus, will impact air quality and premature mortality in developing regions. Admittedly, though, our estimates will be less accurate for these regions.
In summary, ASOA is an important – although inadequately constrained – component of air pollution in megacities and urban areas around the world. This stems from the complexity associated with the numerous precursor emission sources, chemical reactions, and oxidation products that lead to observed ASOA concentrations. We have shown here that the variability in observed ASOA across urban areas is correlated with RBTEX, a marker for the co-emissions of IVOC from both transportation and VCP emissions. Global simulations indicate that ASOA contributes to a substantial fraction of the premature mortality associated with PM2.5. Reductions in the ASOA precursors will decrease the premature deaths associated with PM2.5, indicating the importance of identifying and reducing exposure to sources of ASOA. These sources include both traditional emissions (transportation) and nontraditional emissions of emerging importance (VCPs) to ambient PM2.5 concentrations in cities around the world. Further investigation of speciated IVOCs and SVOCs for urban areas around the world along with SOA mass concentration and other photochemical products (e.g., Ox, PAN, and HCHO) for other urban areas, especially in South Asia, throughout Africa, and throughout South America, would provide further constraints to improve the SIMPLE model and our understanding of the emission sources and chemistry that leads to the observed SOA and its impact on premature mortality.
TexAQS measurements are available at https://esrl.noaa.gov/csl/groups/csl7/measurements/2000TexAQS/LaPorte/DataDownload/ (TexAQS 2000 Science Team, 2000) and upon request. NEAQS measurements are available at https://www.esrl.noaa.gov/csl/groups/csl7/measurements/2002NEAQS/ (NEAQS 2002 Science Team, 2002). MILAGRO measurements are available at http://doi.org/10.5067/Aircraft/INTEXB/Aerosol-TraceGas (MILAGRO Science Team, 2006). CalNex measurements are available at https://esrl.noaa.gov/csl/groups/csl7/measurements/2010calnex/Ground/DataDownload/ (CalNex Science Team, 2010). ClearfLo measurements are available at https://catalogue.ceda.ac.uk/uuid/6a5f9eedd68f43348692b3bace3eba45 (ClearfLo Science Team, 2012). SEAC4RS measurements are available at http://doi.org/10.5067/Aircraft/SEAC4RS/Aerosol-TraceGas-Cloud (SEAC4RS Science Team, 2013). WINTER measurements are available at https://data.eol.ucar.edu/master_lists/generated/winter/ (WINTER Science Team, 2015). KORUS-AQ measurements are available at http://doi.org/10.5067/Suborbital/KORUSAQ/DATA01 (KORUS-AQ Science Team, 2015). Data from Chinese campaigns are available upon request, and the rest of the data used are located in the papers cited in the text. GEOS-Chem data are available upon request. Figures will be made available at https://cires1.colorado.edu/jimenez/group_pubs.html (Jimenez, 2021).
The supplement related to this article is available online at: https://doi.org/10.5194/acp-21-11201-2021-supplement.
BAN, DSJ, BCM, JAdG, and JLJ designed the experiment and wrote the paper. BAN, PC-J, DAD, WH, JCS, JA, DRB, MRC, HC, MMC, PFD, GSD, RD, FF, AF, JBG, GG, JFH, TFH, PLH, JH, MH, LGH, BTJ, WCK, JL, IBP, JP, BR, CER, DR, JMR, TBR, MS, JW, CW, PW, GMW, DEY, BY, JAdG, and JLJ collected and analyzed the data. DSJ and AH ran the GEOS-Chem model, and BAN, DSJ, and JLJ analyzed the model output. BAN, PLH, JMS, and JLJ ran and analyzed the 0-D model used for the ASOA budget analysis of ambient observations. BCM, AL, ML, and QZ analyzed and provided the emission inventories used for the 0-D box model. DSJ, DKH, and MON conducted the ASOA attribution to mortality calculation, and BAN, DSJ, DKH, MON, JAdG, and JLJ analyzed the results. All authors reviewed the paper.
The authors declare that they have no conflict of interest.
This article has not been formally reviewed by EPA. The views expressed in
this document are solely those of the authors and do not necessarily reflect
those of the Agency. EPA does not endorse any products or commercial
services mentioned in this publication.
Publisher’s note: Copernicus Publications remains neutral with regard to jurisdictional claims in published maps and institutional affiliations.
We thank Katherine Travis for useful discussions. We acknowledge Brian J. Bandy, James Lee, Graham P. Mills, Denise D. Montzka, Jochen Stutz, Andrew J. Weinheimer, Eric J. Williams, Ezra C. Wood, Douglas R. Worsnop for use of their data.
This research has been supported by the National Aeronautics and Space Administration (grant nos. NNX15AT96G and NNX16AQ26G), the Alfred P. Sloan Foundation (grant no. 2016-7173), the National Science Foundation (grant no. AGS-1822664), the U.S. Environmental Protection Agency (grant no. STAR 83587701-0), the Natural Environment Research Council (grant nos. NE/H003510/1, NE/H003177/1, and NE/H003223/1), the National Oceanic and Atmospheric Administration (grant no. NA17OAR4320101), the National Centre for Atmospheric Science (grant no. R8/H12/83/037), the Natural Sciences and Engineering Research Council of Canada (grant no. RGPIN/05002-2014), and the Fonds de recherche du Québec – Nature et technologies (grant no. 2016-PR-192364).
This paper was edited by Maria Kanakidou and reviewed by three anonymous referees.
Anenberg, S., Miller, J., Henze, D., and Minjares, R.: A global snapshot of the air pollution-related health impacts of transportation sector emissions in 2010 and 2015, ICCT, Clim. Clean Air Coal., 1–55, 2019.
Atkinson, R. and Arey, J.: Atmospheric Degradation of Volatile Organic Compounds, Chem. Rev., 103, 4605–4638, 2003.
Atkinson, R., Baulch, D. L., Cox, R. A., Crowley, J. N., Hampson, R. F., Hynes, R. G., Jenkin, M. E., Rossi, M. J., Troe, J., and IUPAC Subcommittee: Evaluated kinetic and photochemical data for atmospheric chemistry: Volume II – gas phase reactions of organic species, Atmos. Chem. Phys., 6, 3625–4055, https://doi.org/10.5194/acp-6-3625-2006, 2006.
Bae, M.-S., Demerjian, K. L., and Schwab, J. J.: Seasonal estimation of organic mass to organic carbon in PM2.5 at rural and urban locations in New York state, Atmos. Environ., 40, 7467–7479, 2006.
Baker, K. R., Woody, M. C., Valin, L., Szykman, J., Yates, E. L., Iraci, L. T., Choi, H. D., Soja, A. J., Koplitz, S. N., Zhou, L., Campuzano-Jost, P., Jimenez, J. L., and Hair, J. W.: Photochemical model evaluation of 2013 California wild fire air quality impacts using surface, aircraft, and satellite data, Sci. Total Environ., 637/638, 1137–1149, 2018.
Bertram, T. H., Perring, A. E., Wooldridge, P. J., Crounse, J. D., Kwan, A. J., Wennberg, P. O., Scheuer, E., Dibb, J., Avery, M., Sachse, G., Vay, S. A., Crawford, J. H., McNaughton, C. S., Clarke, A., Pickering, K. E., Fuelberg, H., Huey, G., Blake, D. R., Singh, H. B., Hall, S. R., Shetter, R. E., Fried, A., Heikes, B. G., and Cohen, R. C.: Direct Measurements of the Convective Recycling of the Upper Troposphere, Science, 315, 816–820, 2007.
Bohnenstengel, S. I., Belcher, S. E., Aiken, A., Allan, J. D., Allen, G., Bacak, A., Bannan, T. J., Barlow, J. F., Beddows, D. C. S., Bloss, W. J., Booth, A. M., Chemel, C., Coceal, O., Di Marco, C. F., Dubey, M. K., Faloon, K. H., Fleming, Z. L., Furger, M., Gietl, J. K., Graves, R. R., Green, D. C., Grimmond, C. S. B., Halios, C. H., Hamilton, J. F., Harrison, R. M., Heal, M. R., Heard, D. E., Helfter, C., Herndon, S. C., Holmes, R. E., Hopkins, J. R., Jones, A. M., Kelly, F. J., Kotthaus, S., Langford, B., Lee, J. D., Leigh, R. J., Lewis, A. C., Lidster, R. T., Lopez-Hilfiker, F. D., McQuaid, J. B., Mohr, C., Monks, P. S., Nemitz, E., Ng, N. L., Percival, C. J., Prévôt, A. S. H., Ricketts, H. M. A., Sokhi, R., Stone, D., Thornton, J. A., Tremper, A. H., Valach, A. C., Visser, S., Whalley, L. K., Williams, L. R., Xu, L., Young, D. E., Zotter, P., Bohnenstengel, S. I., Belcher, S. E., Aiken, A., Allan, J. D., Allen, G., Bacak, A., Bannan, T. J., Barlow, J. F., Beddows, D. C. S., Bloss, W. J., Booth, A. M., Chemel, C., Coceal, O., Marco, C. F. D., Dubey, M. K., Faloon, K. H., Fleming, Z. L., Furger, M., Gietl, J. K., Graves, R. R., Green, D. C., Grimmond, C. S. B., Halios, C. H., Hamilton, J. F., Harrison, R. M., Heal, M. R., Heard, D. E., Helfter, C., Herndon, S. C., Holmes, R. E., Hopkins, J. R., Jones, A. M., Kelly, F. J., Kotthaus, S., Langford, B., Lee, J. D., Leigh, R. J., Lewis, A. C., Lidster, R. T., Lopez-Hilfiker, F. D., McQuaid, J. B., Mohr, C., Monks, P. S., Nemitz, E., Ng, N. L., Percival, C. J., Prévôt, A. S. H., Ricketts, H. M. A., Sokhi, R., Stone, D., Thornton, J. A., Tremper, A. H., Valach, A. C., Visser, S., Whalley, L. K., Williams, L. R., Xu, L., Young, D. E., and Zotter, P.: Meteorology, Air Quality, and Health in London: The ClearfLo Project, Bull. Am. Meteorol. Soc., 96, 779–804, 2015.
Burnett, R., Chen, H., Szyszkowicz, M., Fann, N., Hubbell, B., Pope, C. A., Apte, J. S., Brauer, M., Cohen, A., Weichenthal, S., Coggins, J., Di, Q., Brunekreef, B., Frostad, J., Lim, S. S., Kan, H., Walker, K. D., Thurston, G. D., Hayes, R. B., Lim, C. C., Turner, M. C., Jerrett, M., Krewski, D., Gapstur, S. M., Diver, W. R., Ostro, B., Goldberg, D., Crouse, D. L., Martin, R. V., Peters, P., Pinault, L., Tjepkema, M., van Donkelaar, A., Villeneuve, P. J., Miller, A. B., Yin, P., Zhou, M., Wang, L., Janssen, N. A. H., Marra, M., Atkinson, R. W., Tsang, H., Quoc Thach, T., Cannon, J. B., Allen, R. T., Hart, J. E., Laden, F., Cesaroni, G., Forastiere, F., Weinmayr, G., Jaensch, A., Nagel, G., Concin, H., and Spadaro, J. V.: Global estimates of mortality associated with long-term exposure to outdoor fine particulate matter, P. Natl. Acad. Sci. USA, 115, 9592–9597, 2018.
Burnett, R. T., Pope, C. A., Ezzati, M., Olives, C., Lim, S. S., Mehta, S., Shin, H. H., Singh, G., Hubbell, B., Brauer, M., Anderson, H. R., Smith, K. R., Balmes, J. R., Bruce, N. G., Kan, H., Laden, F., Prüss-Ustün, A., Turner, M. C., Gapstur, S. M., Diver, W. R., and Cohen, A.: An integrated risk function for estimating the global burden of disease attributable to ambient fine particulate matter exposure, Environ. Health Perspect., 122, 397–403, 2014.
CalNex Science Team: CalNex Data, NOAA Earth System Research Laboratory [data set], available at: https://esrl.noaa.gov/csl/groups/cls7/measurements/2010calnex/Ground/DataDownload (last access: 16 July 2021), 2010.
Cappa, C. D., Jathar, S. H., Kleeman, M. J., Docherty, K. S., Jimenez, J. L., Seinfeld, J. H., and Wexler, A. S.: Simulating secondary organic aerosol in a regional air quality model using the statistical oxidation model – Part 2: Assessing the influence of vapor wall losses, Atmos. Chem. Phys., 16, 3041–3059, https://doi.org/10.5194/acp-16-3041-2016, 2016.
Chafe, Z., Brauer, M., Heroux, M.-E., Klimont, Z., Lanki, T., Salonen, R. O., and Smith, K. R.: Residential heating with wood and coal: Health impacts and policy options in Europe and North America, WHO/UNECE LRTAP, 1–49, 2015.
CIESIN: Gridded Population of the World (GPW), v4, SEDAC [data set], available at: https://sedac.ciesin.columbia.edu/data/collection/gpw-v4 (last access: 12 May 2020), 2017.
ClearfLo Science Team: ClearfLo Data, Natural Environment Research Council Environmental Data Service CEDA Archive [data set], available at: https://catalogue.ceda.ac.uk/uuid/6a5f9eedd68f43348692b3bace3eba45 (last access: 16 July 2021), 2012.
Coggon, M. M., McDonald, B. C., Vlasenko, A., Veres, P. R., Bernard, F., Koss, A. R., Yuan, B., Gilman, J. B., Peischl, J., Aikin, K. C., DuRant, J., Warneke, C., Li, S.-M., and de Gouw, J. A.: Diurnal Variability and Emission Pattern of Decamethylcyclopentasiloxane (D5) from the Application of Personal Care Products in Two North American Cities, Environ. Sci. Technol., 52, 5610–5618, 2018.
Cohen, A. J., Brauer, M., Burnett, R., Anderson, H. R., Frostad, J., Estep, K., Balakrishnan, K., Brunekreef, B., Dandona, L., Dandona, R., Feigin, V., Freedman, G., Hubbell, B., Jobling, A., Kan, H., Knibbs, L., Liu, Y., Martin, R., Morawska, L., Pope, C. A., Shin, H., Straif, K., Shaddick, G., Thomas, M., van Dingenen, R., van Donkelaar, A., Vos, T., Murray, C. J. L., and Forouzanfar, M. H.: Estimates and 25-year trends of the global burden of disease attributable to ambient air pollution: an analysis of data from the Global Burden of Diseases Study 2015, Lancet, 389, 1907–1918, 2017.
DeCarlo, P. F., Dunlea, E. J., Kimmel, J. R., Aiken, A. C., Sueper, D., Crounse, J., Wennberg, P. O., Emmons, L., Shinozuka, Y., Clarke, A., Zhou, J., Tomlinson, J., Collins, D. R., Knapp, D., Weinheimer, A. J., Montzka, D. D., Campos, T., and Jimenez, J. L.: Fast airborne aerosol size and chemistry measurements above Mexico City and Central Mexico during the MILAGRO campaign, Atmos. Chem. Phys., 8, 4027–4048, https://doi.org/10.5194/acp-8-4027-2008, 2008.
DeCarlo, P. F., Ulbrich, I. M., Crounse, J., de Foy, B., Dunlea, E. J., Aiken, A. C., Knapp, D., Weinheimer, A. J., Campos, T., Wennberg, P. O., and Jimenez, J. L.: Investigation of the sources and processing of organic aerosol over the Central Mexican Plateau from aircraft measurements during MILAGRO, Atmos. Chem. Phys., 10, 5257–5280, https://doi.org/10.5194/acp-10-5257-2010, 2010.
de Gouw, J. A. and Jimenez, J. L.: Organic Aerosols in the Earth's Atmosphere, Environ. Sci. Technol., 43, 7614–7618, 2009.
de Gouw, J. A., Middlebrook, A. M., Warneke, C., Goldan, P. D., Kuster, W. C., Roberts, J. M., Fehsenfeld, F. C., Worsnop, D. R., Canagaratna, M. R., Pszenny, A. A. P., Keene, W. C., Marchewka, M., Bertman, S. B., and Bates, T. S.: Budget of organic carbon in a polluted atmosphere: Results from the New England Air Quality Study in 2002, J. Geophys. Res.-Atmos., 110, 1–22, 2005.
de Gouw, J. A., Gilman, J. B., Kim, S.-W., Lerner, B. M., Isaacman-VanWertz, G., McDonald, B. C., Warneke, C., Kuster, W. C., Lefer, B. L., Griffith, S. M., Dusanter, S., Stevens, P. S., and Stutz, J.: Chemistry of Volatile Organic Compounds in the Los Angeles basin: Nighttime Removal of Alkenes and Determination of Emission Ratios, J. Geophys. Res.-Atmos., 122, 11843–11861, 2017.
de Gouw, J. A., Gilman, J. B., Kim, S.-W., Alvarez, S. L., Dusanter, S., Graus, M., Griffith, S. M., Isaacman-VanWertz, G., Kuster, W. C., Lefer, B. L., Lerner, B. M., McDonald, B. C., Rappenglück, B., Roberts, J. M., Stevens, P. S., Stutz, J., Thalman, R., Veres, P. R., Volkamer, R., Warneke, C., Washenfelder, R. A., and Young, C. J.: Chemistry of volatile organic compounds in the Los Angeles basin: Formation of oxygenated compounds and determination of emission ratios, J. Geophys. Res., 123, 2298–2319, 2018.
Deming, B. L., Pagonis, D., Liu, X., Day, D. A., Talukdar, R., Krechmer, J. E., de Gouw, J. A., Jimenez, J. L., and Ziemann, P. J.: Measurements of delays of gas-phase compounds in a wide variety of tubing materials due to gas–wall interactions, Atmos. Meas. Tech., 12, 3453–3461, https://doi.org/10.5194/amt-12-3453-2019, 2019.
Dominutti, P., Keita, S., Bahino, J., Colomb, A., Liousse, C., Yoboué, V., Galy-Lacaux, C., Morris, E., Bouvier, L., Sauvage, S., and Borbon, A.: Anthropogenic VOCs in Abidjan, southern West Africa: from source quantification to atmospheric impacts, Atmos. Chem. Phys., 19, 11721–11741, https://doi.org/10.5194/acp-19-11721-2019, 2019.
Dzepina, K., Volkamer, R. M., Madronich, S., Tulet, P., Ulbrich, I. M., Zhang, Q., Cappa, C. D., Ziemann, P. J., and Jimenez, J. L.: Evaluation of recently-proposed secondary organic aerosol models for a case study in Mexico City, Atmos. Chem. Phys., 9, 5681–5709, https://doi.org/10.5194/acp-9-5681-2009, 2009.
EMEP/EEA: EMEP/EEA Air Pollutant Emission Inventory Guidebook 2016, EEA, Luxembourg, available at: https://www.eea.europa.eu/publications/emep-eea-guidebook-2016 (last access:16 July 2021), 2016.
Ensberg, J. J., Hayes, P. L., Jimenez, J. L., Gilman, J. B., Kuster, W. C., de Gouw, J. A., Holloway, J. S., Gordon, T. D., Jathar, S., Robinson, A. L., and Seinfeld, J. H.: Emission factor ratios, SOA mass yields, and the impact of vehicular emissions on SOA formation, Atmos. Chem. Phys., 14, 2383–2397, https://doi.org/10.5194/acp-14-2383-2014, 2014.
Freney, E. J., Sellegri, K., Canonaco, F., Colomb, A., Borbon, A., Michoud, V., Doussin, J.-F., Crumeyrolle, S., Amarouche, N., Pichon, J.-M., Bourianne, T., Gomes, L., Prevot, A. S. H., Beekmann, M., and Schwarzenböeck, A.: Characterizing the impact of urban emissions on regional aerosol particles: airborne measurements during the MEGAPOLI experiment, Atmos. Chem. Phys., 14, 1397–1412, https://doi.org/10.5194/acp-14-1397-2014, 2014.
Gentner, D. R., Isaacman, G., Worton, D. R., Chan, A. W. H., Dallmann, T. R., Davis, L., Liu, S., Day, D. A., Russell, L. M., Wilson, K. R., Weber, R., Guha, A., Harley, R. A., and Goldstein, A. H.: Elucidating secondary organic aerosol from diesel and gasoline vehicles through detailed characterization of organic carbon emissions, P. Natl. Acad. Sci. USA, 109, 18318–18323, 2012.
Goel, R. and Guttikunda, S. K.: Evolution of on-road vehicle exhaust emissions in Delhi, Atmos. Environ., 105, 78–90, 2015.
Grieshop, A. P., Logue, J. M., Donahue, N. M., and Robinson, A. L.: Laboratory investigation of photochemical oxidation of organic aerosol from wood fires 1: measurement and simulation of organic aerosol evolution, Atmos. Chem. Phys., 9, 1263–1277, https://doi.org/10.5194/acp-9-1263-2009, 2009.
Hallquist, M., Wenger, J. C., Baltensperger, U., Rudich, Y., Simpson, D., Claeys, M., Dommen, J., Donahue, N. M., George, C., Goldstein, A. H., Hamilton, J. F., Herrmann, H., Hoffmann, T., Iinuma, Y., Jang, M., Jenkin, M. E., Jimenez, J. L., Kiendler-Scharr, A., Maenhaut, W., McFiggans, G., Mentel, Th. F., Monod, A., Prévôt, A. S. H., Seinfeld, J. H., Surratt, J. D., Szmigielski, R., and Wildt, J.: The formation, properties and impact of secondary organic aerosol: current and emerging issues, Atmos. Chem. Phys., 9, 5155–5236, https://doi.org/10.5194/acp-9-5155-2009, 2009.
Hayes, P. L., Ortega, A. M., Cubison, M. J., Froyd, K. D., Zhao, Y., Cliff, S. S., Hu, W. W., Toohey, D. W., Flynn, J. H., Lefer, B. L., Grossberg, N., Alvarez, S., Rappenglück, B., Taylor, J. W., Allan, J. D., Holloway, J. S., Gilman, J. B., Kuster, W. C., de Gouw, J. A., Massoli, P., Zhang, X., Liu, J., Weber, R. J., Corrigan, A. L., Russell, L. M., Isaacman, G., Worton, D. R., Kreisberg, N. M., Goldstein, A. H., Thalman, R., Waxman, E. M., Volkamer, R., Lin, Y. H., Surratt, J. D., Kleindienst, T. E., Offenberg, J. H., Dusanter, S., Griffith, S., Stevens, P. S., Brioude, J., Angevine, W. M., and Jimenez, J. L.: Organic aerosol composition and sources in Pasadena, California, during the 2010 CalNex campaign, J. Geophys. Res.-Atmos., 118, 9233–9257, 2013.
Hayes, P. L., Carlton, A. G., Baker, K. R., Ahmadov, R., Washenfelder, R. A., Alvarez, S., Rappenglück, B., Gilman, J. B., Kuster, W. C., de Gouw, J. A., Zotter, P., Prévôt, A. S. H., Szidat, S., Kleindienst, T. E., Offenberg, J. H., Ma, P. K., and Jimenez, J. L.: Modeling the formation and aging of secondary organic aerosols in Los Angeles during CalNex 2010, Atmos. Chem. Phys., 15, 5773–5801, https://doi.org/10.5194/acp-15-5773-2015, 2015.
Heringa, M. F., DeCarlo, P. F., Chirico, R., Tritscher, T., Dommen, J., Weingartner, E., Richter, R., Wehrle, G., Prévôt, A. S. H., and Baltensperger, U.: Investigations of primary and secondary particulate matter of different wood combustion appliances with a high-resolution time-of-flight aerosol mass spectrometer, Atmos. Chem. Phys., 11, 5945–5957, https://doi.org/10.5194/acp-11-5945-2011, 2011
Herndon, S. C., Onasch, T. B., Wood, E. C., Kroll, J. H., Canagaratna, M. R., Jayne, J. T., Zavala, M. A., Knighton, W. B., Mazzoleni, C., Dubey, M. K., Ulbrich, I. M., Jimenez, J. L., Seila, R., de Gouw, J. A., de Foy, B., Fast, J., Molina, L. T., Kolb, C. E., and Worsnop, D. R.: Correlation of secondary organic aerosol with odd oxygen in Mexico City, Geophys. Res. Lett., 35, L15804, https://doi.org/10.1029/2008GL034058, 2008.
Hodzic, A. and Jimenez, J. L.: Modeling anthropogenically controlled secondary organic aerosols in a megacity: a simplified framework for global and climate models, Geosci. Model Dev., 4, 901–917, https://doi.org/10.5194/gmd-4-901-2011, 2011.
Hodzic, A., Jimenez, J. L., Madronich, S., Aiken, A. C., Bessagnet, B., Curci, G., Fast, J., Lamarque, J.-F., Onasch, T. B., Roux, G., Schauer, J. J., Stone, E. A., and Ulbrich, I. M.: Modeling organic aerosols during MILAGRO: importance of biogenic secondary organic aerosols, Atmos. Chem. Phys., 9, 6949–6981, https://doi.org/10.5194/acp-9-6949-2009, 2009.
Hodzic, A., Jimenez, J. L., Prévôt, A. S. H., Szidat, S., Fast, J. D., and Madronich, S.: Can 3-D models explain the observed fractions of fossil and non-fossil carbon in and near Mexico City?, Atmos. Chem. Phys., 10, 10997–11016, https://doi.org/10.5194/acp-10-10997-2010, 2010a.
Hodzic, A., Jimenez, J. L., Madronich, S., Canagaratna, M. R., DeCarlo, P. F., Kleinman, L., and Fast, J.: Modeling organic aerosols in a megacity: potential contribution of semi-volatile and intermediate volatility primary organic compounds to secondary organic aerosol formation, Atmos. Chem. Phys., 10, 5491–5514, https://doi.org/10.5194/acp-10-5491-2010, 2010b.
Hodzic, A., Campuzano-Jost, P., Bian, H., Chin, M., Colarco, P. R., Day, D. A., Froyd, K. D., Heinold, B., Jo, D. S., Katich, J. M., Kodros, J. K., Nault, B. A., Pierce, J. R., Ray, E., Schacht, J., Schill, G. P., Schroder, J. C., Schwarz, J. P., Sueper, D. T., Tegen, I., Tilmes, S., Tsigaridis, K., Yu, P., and Jimenez, J. L.: Characterization of organic aerosol across the global remote troposphere: a comparison of ATom measurements and global chemistry models, Atmos. Chem. Phys., 20, 4607–4635, https://doi.org/10.5194/acp-20-4607-2020, 2020.
Hu, W., Hu, M., Hu, W., Jimenez, J. L., Yuan, B., Chen, W., Wang, M., Wu, Y., Chen, C., Wang, Z., Peng, J., Zeng, L., and Shao, M.: Chemical composition, sources, and aging process of submicron aerosols in Beijing: Contrast between summer and winter, J. Geophys. Res.-Atmos., 121, 1955–1977, 2016.
Hu, W., Downward, G., Wong, J. Y. Y., Reiss, B., Rothman, N., Portengen, L., Li, J., Jones, R. R., Huang, Y., Yang, K., Chen, Y., Xu, J., He, J., Bassig, B., Seow, W. J., Hosgood, H. D., Zhang, L., Wu, G., Wei, F., Vermeulen, R., and Lan, Q.: Characterization of outdoor air pollution from solid fuel combustion in Xuanwei and Fuyuan, a rural region of China, Sci. Rep., 10, 11335, 2020.
Hu, W. W., Hu, M., Yuan, B., Jimenez, J. L., Tang, Q., Peng, J. F., Hu, W., Shao, M., Wang, M., Zeng, L. M., Wu, Y. S., Gong, Z. H., Huang, X. F., and He, L. Y.: Insights on organic aerosol aging and the influence of coal combustion at a regional receptor site of central eastern China, Atmos. Chem. Phys., 13, 10095–10112, https://doi.org/10.5194/acp-13-10095-2013, 2013.
IHME: Global Burden of Disease Study 2015 (GBD 2015) Data Resources, GHDx [data set], available at: http://ghdx.healthdata.org/record/ihme-data/gbd-2015-life-expectancy-all-cause-and-cause-specific-mortality-1980-2015 (last access: 18 July 2021), 2016.
Janssen, R. H. H., Tsimpidi, A. P., Karydis, V. A., Pozzer, A., Lelieveld, J., Crippa, M., Prévôt, A. S. H., Ait-Helal, W., Borbon, A., Sauvage, S., and Locoge, N.: Influence of local production and vertical transport on the organic aerosol budget over Paris, J. Geophys. Res.-Atmos., 122, 8276–8296, 2017.
Janssens-Maenhout, G., Crippa, M., Guizzardi, D., Dentener, F., Muntean, M., Pouliot, G., Keating, T., Zhang, Q., Kurokawa, J., Wankmüller, R., Denier van der Gon, H., Kuenen, J. J. P., Klimont, Z., Frost, G., Darras, S., Koffi, B., and Li, M.: HTAP_v2.2: a mosaic of regional and global emission grid maps for 2008 and 2010 to study hemispheric transport of air pollution, Atmos. Chem. Phys., 15, 11411–11432, https://doi.org/10.5194/acp-15-11411-2015, 2015.
Jathar, S. H., Woody, M., Pye, H. O. T., Baker, K. R., and Robinson, A. L.: Chemical transport model simulations of organic aerosol in southern California: model evaluation and gasoline and diesel source contributions, Atmos. Chem. Phys., 17, 4305–4318, https://doi.org/10.5194/acp-17-4305-2017, 2017.
Jena, C., Ghude, S. D., Kulkarni, R., Debnath, S., Kumar, R., Soni, V. K., Acharja, P., Kulkarni, S. H., Khare, M., Kaginalkar, A. J., Chate, D. M., Ali, K., Nanjundiah, R. S., and Rajeevan, M. N.: Evaluating the sensitivity of fine particulate matter (PM2.5) simulations to chemical mechanism in Delhi, Atmos. Chem. Phys. Discuss. [preprint], https://doi.org/10.5194/acp-2020-673, in review, 2020.
Jimenez, J. L.: Jimenez Group Peer-Reviewed Journal Publications, University of Colorado, Boulder, available at: http://cires1.colorado.edu/jimenez/group_pubs.html, last access: 16 July 2021.
Jimenez, J. L., Canagaratna, M. R., Donahue, N. M., Prevot, A. S. H., Zhang, Q., Kroll, J. H., DeCarlo, P. F., Allan, J. D., Coe, H., Ng, N. L., Aiken, A. C., Docherty, K. S., Ulbrich, I. M., Grieshop, A. P., Robinson, A. L., Duplissy, J., Smith, J. D., Wilson, K. R., Lanz, V. A., Hueglin, C., Sun, Y. L., Tian, J., Laaksonen, A., Raatikainen, T., Rautiainen, J., Vaattovaara, P., Ehn, M., Kulmala, M., Tomlinson, J. M., Collins, D. R., Cubison, M. J., Dunlea, E. J., Huffman, J. A., Onasch, T. B., Alfarra, M. R., Williams, P. I., Bower, K., Kondo, Y., Schneider, J., Drewnick, F., Borrmann, S., Weimer, S., Demerjian, K., Salcedo, D., Cottrell, L., Griffin, R., Takami, A., Miyoshi, T., Hatakeyama, S., Shimono, A., Sun, J. Y., Zhang, Y. M., Dzepina, K., Kimmel, J. R., Sueper, D., Jayne, J. T., Herndon, S. C., Trimborn, A. M., Williams, L. R., Wood, E. C., Middlebrook, A. M., Kolb, C. E., Baltensperger, U., and Worsnop, D. R.: Evolution of organic aerosols in the atmosphere, Science, 326, 1525–1529, 2009.
Khare, P. and Gentner, D. R.: Considering the future of anthropogenic gas-phase organic compound emissions and the increasing influence of non-combustion sources on urban air quality, Atmos. Chem. Phys., 18, 5391–5413, https://doi.org/10.5194/acp-18-5391-2018, 2018.
Khare, P., Machesky, J., Soto, R., He, M., Presto, A. A., and Gentner, D. R.: Asphalt-related emissions are a major missing nontraditional source of secondary organic aerosol precursors, Sci. Adv., 6, eabb9785, https://doi.org/10.1126/sciadv.abb9785, 2020.
Kleinman, L. I., Daum, P. H., Lee, Y.-N., Senum, G. I., Springston, S. R., Wang, J., Berkowitz, C., Hubbe, J., Zaveri, R. A., Brechtel, F. J., Jayne, J., Onasch, T. B., and Worsnop, D.: Aircraft observations of aerosol composition and ageing in New England and Mid-Atlantic States during the summer 2002 New England Air Quality Study field campaign, J. Geophys. Res.-Atmos., 112, D09310, https://doi.org/10.1029/2006JD007786, 2007.
Kodros, J. K., Carter, E., Brauer, M., Volckens, J., Bilsback, K. R., L'Orange, C., Johnson, M., and Pierce, J. R.: Quantifying the Contribution to Uncertainty in Mortality Attributed to Household, Ambient, and Joint Exposure to PM2.5 From Residential Solid Fuel Use, Geohealth, 2, 25–39, 2018.
Kodros, J. K., Papanastasiou, D. K., Paglione, M., Masiol, M., Squizzato, S., Florou, K., Skyllakou, K., Kaltsonoudis, C., Nenes, A., and Pandis, S. N.: Rapid dark aging of biomass burning as an overlooked source of oxidized organic aerosol, P. Natl. Acad. Sci. USA, 117, 33028–33033, 2020.
Kondo, Y., Morino, Y., Fukuda, M., Kanaya, Y., Miyazaki, Y., Takegawa, N., Tanimoto, H., McKenzie, R., Johnston, P., Blake, D. R., Murayama, T., and Koike, M.: Formation and transport of oxidized reactive nitrogen, ozone, and secondary organic aerosol in Tokyo, J. Geophys. Res.-Atmos., 113, D21310, https://doi.org/10.1029/2008JD010134, 2008.
KORUS-AQ Science Team: KORUS-AQ Data, NASA Langley Research Center [data set], available at: https://doi.org/10.5067/Aircraft/KORUSAQ/DATA01 (last access: 16 July 2021), 2015.
Krechmer, J. E., Pagonis, D., Ziemann, P. J., and Jimenez, J. L.: Quantification of Gas-Wall Partitioning in Teflon Environmental Chambers Using Rapid Bursts of Low-Volatility Oxidized Species Generated in Situ, Environ. Sci. Technol., 50, 5757–5765, 2016.
Krewski, D., Jerrett, M., Burnett, R. T., Ma, R., Hughes, E., Shi, Y., Turner, M. C., Arden, C., Thurston, G., Calle, E. E., Thun, M. J., Beckerman, B., Deluca, P., Finkelstein, N., Ito, K., Moore, D. K., Newbold, K. B., Ramsay, T., Ross, Z., Shin, H., and Tempalski, B.: Extended Follow-Up and Spatial Analysis of the American Cancer Society Study Linking Particulate Air Pollution and Mortality Number 140 May 2009 PRESS VERSION, 2009.
Lacey, F. G., Henze, D. K., Lee, C. J., van Donkelaar, A., and Martin, R. V.: Transient climate and ambient health impacts due to national solid fuel cookstove emissions, P. Natl. Acad. Sci. USA, 114, 1269–1274, 2017.
Lam, N. L., Upadhyay, B., Maharjan, S., Jagoe, K., Weyant, C. L., Thompson, R., Uprety, S., Johnson, M. A., and Bond, T. C.: Seasonal fuel consumption, stoves, and end-uses in rural households of the far-western development region of Nepal, Environ. Res. Lett., 12, 125011, https://doi.org/10.1088/1748-9326/aa98cc, 2017.
Landrigan, P. J., Fuller, R., Acosta, N. J. R., Adeyi, O., Arnold, R., Basu, N., Baldé, A. B., Bertollini, R., Bose-O'Reilly, S., Boufford, J. I., Breysse, P. N., Chiles, T., Mahidol, C., Coll-Seck, A. M., Cropper, M. L., Fobil, J., Fuster, V., Greenstone, M., Haines, A., Hanrahan, D., Hunter, D., Khare, M., Krupnick, A., Lanphear, B., Lohani, B., Martin, K., Mathiasen, K. V., McTeer, M. A., Murray, C. J. L., Ndahimananjara, J. D., Perera, F., Potočnik, J., Preker, A. S., Ramesh, J., Rockström, J., Salinas, C., Samson, L. D., Sandilya, K., Sly, P. D., Smith, K. R., Steiner, A., Stewart, R. B., Suk, W. A., van Schayck, O. C. P., Yadama, G. N., Yumkella, K., and Zhong, M.: The Lancet Commission on pollution and health, Lancet, 391, 462–512, 2018.
Lelieveld, J., Evans, J. S., Fnais, M., Giannadaki, D., and Pozzer, A.: The contribution of outdoor air pollution sources to premature mortality on a global scale, Nature, 525, 367–371, 2015.
Liao, J., Hanisco, T. F., Wolfe, G. M., St. Clair, J., Jimenez, J. L., Campuzano-Jost, P., Nault, B. A., Fried, A., Marais, E. A., Gonzalez Abad, G., Chance, K., Jethva, H. T., Ryerson, T. B., Warneke, C., and Wisthaler, A.: Towards a satellite formaldehyde – in situ hybrid estimate for organic aerosol abundance, Atmos. Chem. Phys., 19, 2765–2785, https://doi.org/10.5194/acp-19-2765-2019, 2019.
Li, M., Zhang, Q., Zheng, B., Tong, D., Lei, Y., Liu, F., Hong, C., Kang, S., Yan, L., Zhang, Y., Bo, Y., Su, H., Cheng, Y., and He, K.: Persistent growth of anthropogenic non-methane volatile organic compound (NMVOC) emissions in China during 1990–2017: drivers, speciation and ozone formation potential, Atmos. Chem. Phys., 19, 8897–8913, https://doi.org/10.5194/acp-19-8897-2019, 2019.
Liu, X., Deming, B., Pagonis, D., Day, D. A., Palm, B. B., Talukdar, R., Roberts, J. M., Veres, P. R., Krechmer, J. E., Thornton, J. A., de Gouw, J. A., Ziemann, P. J., and Jimenez, J. L.: Effects of gas–wall interactions on measurements of semivolatile compounds and small polar molecules, Atmos. Meas. Tech., 12, 3137–3149, https://doi.org/10.5194/amt-12-3137-2019, 2019.
Lu, Q., Zhao, Y., and Robinson, A. L.: Comprehensive organic emission profiles for gasoline, diesel, and gas-turbine engines including intermediate and semi-volatile organic compound emissions, Atmos. Chem. Phys., 18, 17637–17654, https://doi.org/10.5194/acp-18-17637-2018, 2018.
Ma, P. K., Zhao, Y., Robinson, A. L., Worton, D. R., Goldstein, A. H., Ortega, A. M., Jimenez, J. L., Zotter, P., Prévôt, A. S. H., Szidat, S., and Hayes, P. L.: Evaluating the impact of new observational constraints on P-S/IVOC emissions, multi-generation oxidation, and chamber wall losses on SOA modeling for Los Angeles, CA, Atmos. Chem. Phys., 17, 9237–9259, https://doi.org/10.5194/acp-17-9237-2017, 2017.
McDonald, B. C., de Gouw, J. A., Gilman, J. B., Jathar, S. H., Akherati, A., Cappa, C. D., Jimenez, J. L., Lee-Taylor, J., Hayes, P. L., McKeen, S. A., Cui, Y. Y., Kim, S.-W., Gentner, D. R., Isaacman-VanWertz, G., Goldstein, A. H., Harley, R. A., Frost, G. J., Roberts, J. M., Ryerson, T. B., and Trainer, M.: Volatile chemical products emerging as largest petrochemical source of urban organic emissions, Science, 359, 760–764, 2018.
MILAGRO Science Team: MILAGRO Data, NASA Langley Research Center [data set], available at: https://doi.org/10.5067/Aircraft/INTEXB/Aerosol-TraceGas (last access: 16 July 2021), 2006.
Miyakawa, T., Takegawa, N., and Kondo, Y.: Photochemical evolution of submicron aerosol chemical composition in the Tokyo megacity region in summer, J. Geophys. Res.-Atmos., 113, D14304, https://doi.org/10.1029/2007JD009493, 2008.
Molina, L. T., Kolb, C. E., de Foy, B., Lamb, B. K., Brune, W. H., Jimenez, J. L., Ramos-Villegas, R., Sarmiento, J., Paramo-Figueroa, V. H., Cardenas, B., Gutierrez-Avedoy, V., and Molina, M. J.: Air quality in North America's most populous city – overview of the MCMA-2003 campaign, Atmos. Chem. Phys., 7, 2447–2473, https://doi.org/10.5194/acp-7-2447-2007, 2007.
Molina, L. T., Madronich, S., Gaffney, J. S., Apel, E., de Foy, B., Fast, J., Ferrare, R., Herndon, S., Jimenez, J. L., Lamb, B., Osornio-Vargas, A. R., Russell, P., Schauer, J. J., Stevens, P. S., Volkamer, R., and Zavala, M.: An overview of the MILAGRO 2006 Campaign: Mexico City emissions and their transport and transformation, Atmos. Chem. Phys., 10, 8697–8760, https://doi.org/10.5194/acp-10-8697-2010, 2010.
Morino, Y., Tanabe, K., Sato, K., and Ohara, T.: Secondary organic aerosol model intercomparison based on secondary organic aerosol to odd oxygen ratio in Tokyo, J. Geophys. Res.-Atmos., 119, 13489–13505, 2014.
Murphy, B. N., Woody, M. C., Jimenez, J. L., Carlton, A. M. G., Hayes, P. L., Liu, S., Ng, N. L., Russell, L. M., Setyan, A., Xu, L., Young, J., Zaveri, R. A., Zhang, Q., and Pye, H. O. T.: Semivolatile POA and parameterized total combustion SOA in CMAQv5.2: impacts on source strength and partitioning, Atmos. Chem. Phys., 17, 11107–11133, https://doi.org/10.5194/acp-17-11107-2017, 2017.
Nault, B. A., Campuzano-Jost, P., Day, D. A., Schroder, J. C., Anderson, B., Beyersdorf, A. J., Blake, D. R., Brune, W. H., Choi, Y., Corr, C. A., de Gouw, J. A., Dibb, J., DiGangi, J. P., Diskin, G. S., Fried, A., Huey, L. G., Kim, M. J., Knote, C. J., Lamb, K. D., Lee, T., Park, T., Pusede, S. E., Scheuer, E., Thornhill, K. L., Woo, J.-H., and Jimenez, J. L.: Secondary organic aerosol production from local emissions dominates the organic aerosol budget over Seoul, South Korea, during KORUS-AQ, Atmos. Chem. Phys., 18, 17769–17800, https://doi.org/10.5194/acp-18-17769-2018, 2018.
NEAQS 2002 Science Team: NEAQS 2002 Data, NOAA Earth System Research Laboratory [data set], available at: https://esrl.noaa.gov/csl/groups/cls7/measurements/2002NEAQS (last access: 16 July 2021), 2002.
Pagonis, D., Krechmer, J. E., de Gouw, J., Jimenez, J. L., and Ziemann, P. J.: Effects of gas–wall partitioning in Teflon tubing and instrumentation on time-resolved measurements of gas-phase organic compounds, Atmos. Meas. Tech., 10, 4687–4696, https://doi.org/10.5194/amt-10-4687-2017, 2017.
Pai, S. J., Heald, C. L., Pierce, J. R., Farina, S. C., Marais, E. A., Jimenez, J. L., Campuzano-Jost, P., Nault, B. A., Middlebrook, A. M., Coe, H., Shilling, J. E., Bahreini, R., Dingle, J. H., and Vu, K.: An evaluation of global organic aerosol schemes using airborne observations, Atmos. Chem. Phys., 20, 2637–2665, https://doi.org/10.5194/acp-20-2637-2020, 2020.
Parrish, D. D., Kuster, W. C., Shao, M., Yokouchi, Y., Kondo, Y., Goldan, P. D., de Gouw, J. A., Koike, M., and Shirai, T.: Comparison of air pollutant emissions among mega-cities, Atmos. Environ., 43, 6435–6441, 2009.
Petit, J.-E., Favez, O., Sciare, J., Canonaco, F., Croteau, P., Močnik, G., Jayne, J., Worsnop, D., and Leoz-Garziandia, E.: Submicron aerosol source apportionment of wintertime pollution in Paris, France by double positive matrix factorization (PMF2) using an aerosol chemical speciation monitor (ACSM) and a multi-wavelength Aethalometer, Atmos. Chem. Phys., 14, 13773–13787, https://doi.org/10.5194/acp-14-13773-2014, 2014.
Platt, S. M., Haddad, I. E., Pieber, S. M., Huang, R.-J., Zardini, A. A., Clairotte, M., Suarez-Bertoa, R., Barmet, P., Pfaffenberger, L., Wolf, R., Slowik, J. G., Fuller, S. J., Kalberer, M., Chirico, R., Dommen, J., Astorga, C., Zimmermann, R., Marchand, N., Hellebust, S., Temime-Roussel, B., Baltensperger, U., and Prévôt, A. S. H.: Two-stroke scooters are a dominant source of air pollution in many cities, Nat. Commun., 5, 3749, https://doi.org/10.1038/ncomms4749, 2014.
Pollack, I. B., Ryerson, T. B., Trainer, M., Neuman, J. A., Roberts, J. M., and Parrish, D. D.: Trends in ozone, its precursors, and related secondary oxidation products in Los Angeles, California: A synthesis of measurements from 1960 to 2010, J. Geophys. Res.-Atmos., 118, 5893–5911, 2013.
Punger, E. M. and West, J. J.: The effect of grid resolution on estimates of the burden of ozone and fine particulate matter on premature mortality in the USA, Air Qual. Atmos. Health, 6, 563–573, 2013.
Ridley, D. A., Heald, C. L., Ridley, K. J., and Kroll, J. H.: Causes and consequences of decreasing atmospheric organic aerosol in the United States, P. Natl. Acad. Sci. USA, 115, 290–295, 2018.
Robinson, A. L., Donahue, N. M., Shrivastava, M. K., Weitkamp, E. A., Sage, A. M., Grieshop, A. P., Lane, T. E., Pierce, J. R., and Pandis, S. N.: Rethinking Organic Aerosols: Semivolatile Emissions and Photochemical Aging, Science, 315, 1259–1262, 2007.
Ryerson, T. B., Andrews, A. E., Angevine, W. M., Bates, T. S., Brock, C. A., Cairns, B., Cohen, R. C., Cooper, O. R., de Gouw, J. A., Fehsenfeld, F. C., Ferrare, R. A., Fischer, M. L., Flagan, R. C., Goldstein, A. H., Hair, J. W., Hardesty, R. M., Hostetler, C. A., Jimenez, J. L., Langford, A. O., McCauley, E., McKeen, S. A., Molina, L. T., Nenes, A., Oltmans, S. J., Parrish, D. D., Pederson, J. R., Pierce, R. B., Prather, K., Quinn, P. K., Seinfeld, J. H., Senff, C. J., Sorooshian, A., Stutz, J., Surratt, J. D., Trainer, M., Volkamer, R., Williams, E. J., and Wofsy, S. C.: The 2010 California Research at the Nexus of Air Quality and Climate Change (CalNex) field study, J. Geophys. Res.-Atmos., 118, 5830–5866, 2013.
Sacks, J., Buckley, B., Alexis, N., Angrish, M., Beardslee, R., Benson, A., Brown, J., Buckley, B., Campen, M., Chan, E., Coffman, E., Davis, A., Dutton, S. J., Eftim, S., Gandy, J., Hemming, B. L., Hines, E., Holliday, K., Kerminen, V.-M., Kiomourtzoglou, M.-A., Kirrane, E., Kotchmar, D., Koturbash, I., Kulmala, M., Lassiter, M., Limaye, V., Ljungman, P., Long, T., Luben, T., Malm, W., McDonald, J. F., McDow, S., Mickley, L., Mikati, I., Mulholland, J., Nichols, J., Patel, M. M., Pinder, R., Pinto, J. P., Rappazzo, K., Richomond-Bryant, J., Rosa, M., Russell, A., Schichtel, B., Stewart, M., Stanek, L. W., Turner, M., Van Winkle, L., Wagner, J., Weaver, Christopher, Wellenius, G., Whitsel, E., Yeckel, C., Zanobetti, A., and Zhang, M.: Integrated Science Assessment (ISA) for Particulate Matter (Final Report, December 2019), Environmental Protection Agency, available at: https://cfpub.epa.gov/ncea/isa/recordisplay.cfm?deid=347534 (last access: 20 October 2020), 2019.
Schroder, J. C., Campuzano-Jost, P., Day, D. A., Shah, V., Larson, K., Sommers, J. M., Sullivan, A. P., Campos, T., Reeves, J. M., Hills, A., Hornbrook, R. S., Blake, N. J., Scheuer, E., Guo, H., Fibiger, D. L., McDuffie, E. E., Hayes, P. L., Weber, R. J., Dibb, J. E., Apel, E. C., Jaeglé, L., Brown, S. S., Thronton, J. A., and Jimenez, J. L.: Sources and Secondary Production of Organic Aerosols in the Northeastern US during WINTER, J. Geophys. Res.-Atmos., 123, 7771–7796, https://doi.org/10.1029/2018JD028475, 2018.
SEAC4RS Science Team: SEAC4RS Data, NASA Langley Research Center [data set], available at: https://doi.org/10.5067/Aircraft/SEAC4RS/Aerosol-TraceGas-Cloud (last access: 16 July 2021), 2013.
Seinfeld, J. H. and Pandis, S. N.: Atmospheric Chemistry and Physics: From Air Pollution to Climate Change, 2nd Edn., John Wiley & Sons, Inc., Hoboken, NJ USA, 2006.
Seltzer, K. M., Pennington, E., Rao, V., Murphy, B. N., Strum, M., Isaacs, K. K., and Pye, H. O. T.: Reactive organic carbon emissions from volatile chemical products, Atmos. Chem. Phys., 21, 5079–5100, https://doi.org/10.5194/acp-21-5079-2021, 2021.
Shaddick, G., Thomas, M. L., Amini, H., Broday, D., Cohen, A., Frostad, J., Green, A., Gumy, S., Liu, Y., Martin, R. V., Pruss-Ustun, A., Simpson, D., van Donkelaar, A., and Brauer, M.: Data Integration for the Assessment of Population Exposure to Ambient Air Pollution for Global Burden of Disease Assessment, Environ. Sci. Technol., 52, 9069–9078, 2018.
Shah, V., Jaeglé, L., Thornton, J. A., Lopez-Hilfiker, F. D., Lee, B. H., Schroder, J. C., Campuzano-Jost, P., Jimenez, J. L., Guo, H., Sullivan, A. P., Weber, R. J., Green, J. R., Fiddler, M. N., Bililign, S., Campos, T. L., Stell, M., Weinheimer, A. J., Montzka, D. D., and Brown, S. S.: Chemical feedbacks weaken the wintertime response of particulate sulfate and nitrate to emissions reductions over the eastern United States, P. Natl. Acad. Sci. USA, 115, 8110–8115, 2018.
Shah, V., Jaeglé, L., Jimenez, J. L., Schroder, J. C., Campuzano-Jost, P., Campos, T. L., Reeves, J. M., Stell, M., Brown, S. S., Lee, B. H., Lopez-Hilfiker, F. D., and Thornton, J. A.: Widespread Pollution from Secondary Sources of Organic Aerosols during Winter in the Northeastern United States, Geophys. Res. Lett., 46, 2974–2983, https://doi.org/10.1029/2018GL081530, 2019.
Shrivastava, M., Cappa, C. D., Fan, J., Goldstein, A. H., Guenther, A. B., Jimenez, J. L., Kuang, C., Laskin, A., Martin, S. T., Ng, N. L., Petaja, T., Pierce, J. R., Rasch, P. J., Roldin, P., Seinfeld, J. H., Shilling, J., Smith, J. N., Thornton, J. A., Volkamer, R., Wang, J., Worsnop, D. R., Zaveri, R. A., Zelenyuk, A., and Zhang, Q.: Recent advances in understanding secondary organic aerosol: Implications for global climate forcing, Rev. Geophys., 55, 509–559, 2017.
Silva, R. A., Adelman, Z., Fry, M. M., and West, J. J.: The Impact of Individual Anthropogenic Emissions Sectors on the Global Burden of Human Mortality due to Ambient Air Pollution, Environ. Health Perspect., 124, 1776–1784, 2016.
Singh, A., Satish, R. V., and Rastogi, N.: Characteristics and sources of fine organic aerosol over a big semi-arid urban city of western India using HR-ToF-AMS, Atmos. Environ., 208, 103–112, 2019.
Stavroulas, I., Bougiatioti, A., Grivas, G., Paraskevopoulou, D., Tsagkaraki, M., Zarmpas, P., Liakakou, E., Gerasopoulos, E., and Mihalopoulos, N.: Sources and processes that control the submicron organic aerosol composition in an urban Mediterranean environment (Athens): a high temporal-resolution chemical composition measurement study, Atmos. Chem. Phys., 19, 901–919, https://doi.org/10.5194/acp-19-901-2019, 2019.
Stewart, G. J., Nelson, B. S., Acton, W. J. F., Vaughan, A. R., Farren, N. J., Hopkins, J. R., Ward, M. W., Swift, S. J., Arya, R., Mondal, A., Jangirh, R., Ahlawat, S., Yadav, L., Sharma, S. K., Yunus, S. S. M., Hewitt, C. N., Nemitz, E., Mullinger, N., Gadi, R., Sahu, L. K., Tripathi, N., Rickard, A. R., Lee, J. D., Mandal, T. K., and Hamilton, J. F.: Emissions of intermediate-volatility and semi-volatile organic compounds from domestic fuels used in Delhi, India, Atmos. Chem. Phys., 21, 2407–2426, https://doi.org/10.5194/acp-21-2407-2021, 2021.
TexAQS 2000 Science Team: TexAQS 2000 Data, NOAA Earth System Research Laboratory [data set], available at: https://esrl.noaa.gov/csl/groups/cls7/measurements/2000TexAQS/LaPorte/DataDownload, 2000.
Toon, O. B., Maring, H., Dibb, J., Ferrare, R., Jacob, D. J., Jensen, E. J., Luo, Z. J., Mace, G. G., Pan, L. L., Pfister, L., Rosenlof, K. H., Redemann, J., Reid, J. S., Singh, H. B., Thompson, A. M., Yokelson, R., Minnis, P., Chen, G., Jucks, K. W., and Pszenny, A.: Planning, implementation, and scientific goals of the Studies of Emissions and Atmospheric Composition, Clouds and Climate Coupling by Regional Surveys (SEAC4RS) field mission, J. Geophys. Res.-Atmos., 121, 4967–5009, 2016.
Tsimpidi, A. P., Karydis, V. A., Zavala, M., Lei, W., Molina, L., Ulbrich, I. M., Jimenez, J. L., and Pandis, S. N.: Evaluation of the volatility basis-set approach for the simulation of organic aerosol formation in the Mexico City metropolitan area, Atmos. Chem. Phys., 10, 525–546, https://doi.org/10.5194/acp-10-525-2010, 2010.
van Donkelaar, A., Martin, R. V., Brauer, M., and Boys, B. L.: Use of Satellite Observations for Long-Term Exposure Assessment of Global Concentrations of Fine Particulate Matter, Environ. Health Perspect., 123, 135–143, 2015.
van Donkelaar, A., Martin, R. V., Brauer, M., Hsu, N. C., Kahn, R. A., Levy, R. C., Lyapustin, A., Sayer, A. M., and Winker, D. M.: Global Estimates of Fine Particulate Matter using a Combined Geophysical-Statistical Method with Information from Satellites, Models, and Monitors, Environ. Sci. Technol., 50, 3762–3772, 2016.
Volkamer, R., Jimenez, J. L., San Martini, F., Dzepina, K., Zhang, Q., Salcedo, D., Molina, L. T., Worsnop, D. R., and Molina, M. J.: Secondary organic aerosol formation from anthropogenic air pollution: Rapid and higher than expected, Geophys. Res. Lett., 33, L17811, https://doi.org/10.1029/2006GL026899, 2006.
Wang, L., Slowik, J. G., Tripathi, N., Bhattu, D., Rai, P., Kumar, V., Vats, P., Satish, R., Baltensperger, U., Ganguly, D., Rastogi, N., Sahu, L. K., Tripathi, S. N., and Prévôt, A. S. H.: Source characterization of volatile organic compounds measured by proton-transfer-reaction time-of-flight mass spectrometers in Delhi, India, Atmos. Chem. Phys., 20, 9753–9770, https://doi.org/10.5194/acp-20-9753-2020, 2020.
Warneke, C., de Gouw, J. A., Holloway, J. S., Peischl, J., Ryerson, T. B., Atlas, E., Blake, D., Trainer, M., and Parrish, D. D.: Multiyear trends in volatile organic compounds in Los Angeles, California: Five decades of decreasing emissions, J. Geophys. Res.-Atmos., 117, D00V17, https://doi.org/10.1029/2012JD017899, 2012.
WINTER Science Team: WINTER Data, NCAR [data set], available at: https://data.eol.ucar.edu/master_lists/generated/winter (last access: 16 July 2021), 2015.
Wood, E. C., Canagaratna, M. R., Herndon, S. C., Onasch, T. B., Kolb, C. E., Worsnop, D. R., Kroll, J. H., Knighton, W. B., Seila, R., Zavala, M., Molina, L. T., DeCarlo, P. F., Jimenez, J. L., Weinheimer, A. J., Knapp, D. J., Jobson, B. T., Stutz, J., Kuster, W. C., and Williams, E. J.: Investigation of the correlation between odd oxygen and secondary organic aerosol in Mexico City and Houston, Atmos. Chem. Phys., 10, 8947–8968, https://doi.org/10.5194/acp-10-8947-2010, 2010.
Woody, M. C., Baker, K. R., Hayes, P. L., Jimenez, J. L., Koo, B., and Pye, H. O. T.: Understanding sources of organic aerosol during CalNex-2010 using the CMAQ-VBS, Atmos. Chem. Phys., 16, 4081–4100, https://doi.org/10.5194/acp-16-4081-2016, 2016.
Worton, D. R., Isaacman, G., Gentner, D. R., Dallmann, T. R., Chan, A. W. H., Ruehl, C., Kirchstetter, T. W., Wilson, K. R., Harley, R. A., and Goldstein, A. H.: Lubricating Oil Dominates Primary Organic Aerosol Emissions from Motor Vehicles, Environ. Sci. Technol., 48, 3698–3706, 2014.
Ye, P., Ding, X., Hakala, J., Hofbauer, V., Robinson, E. S., and Donahue, N. M.: Vapor wall loss of semi-volatile organic compounds in a Teflon chamber, Aerosol Sci. Technol., 50, 822–834, 2016.
Zhang, Q., Jimenez, J. L., Canagaratna, M. R., Allan, J. D., Coe, H., Ulbrich, I., Alfarra, M. R., Takami, A., Middlebrook, A. M., Sun, Y. L., Dzepina, K., Dunlea, E., Docherty, K., DeCarlo, P. F., Salcedo, D., Onasch, T., Jayne, J. T., Miyoshi, T., Shimono, A., Hatakeyama, S., Takegawa, N., Kondo, Y., Schneider, J., Drewnick, F., Borrmann, S., Weimer, S., Demerjian, K., Williams, P., Bower, K., Bahreini, R., Cottrell, L., Griffin, R. J., Rautiainen, J., Sun, J. Y., Zhang, Y. M., and Worsnop, D. R.: Ubiquity and dominance of oxygenated species in organic aerosols in anthropogenically-influenced Northern Hemisphere midlatitudes, Geophys. Res. Lett., 34, L13801, https://doi.org/10.1029/2007GL029979, 2007.
Zhang, Q. J., Beekmann, M., Freney, E., Sellegri, K., Pichon, J. M., Schwarzenboeck, A., Colomb, A., Bourrianne, T., Michoud, V., and Borbon, A.: Formation of secondary organic aerosol in the Paris pollution plume and its impact on surrounding regions, Atmos. Chem. Phys., 15, 13973–13992, https://doi.org/10.5194/acp-15-13973-2015, 2015.
Zhao, B., Wang, S., Donahue, N. M., Jathar, S. H., Huang, X., Wu, W., Hao, J., and Robinson, A. L.: Quantifying the effect of organic aerosol aging and intermediate-volatility emissions on regional-scale aerosol pollution in China, Sci. Rep., 6, 28815, https://doi.org/10.1038/srep28815, 2016.
Zhao, Y., Hennigan, C. J., May, A. A., Daniel, S., Gouw, J. A. D., Gilman, J. B., Kuster, W. C., and Robinson, A. L.: Intermediate-Volatility Organic Compounds: A Large Source of Secondary Organic Aerosol, Environ. Sci. Technol, 48, 13743–13750, 2014.
Zhao, Y., Nguyen, N. T., Presto, A. A., Hennigan, C. J., May, A. A., and Robinson, A. L.: Intermediate Volatility Organic Compound Emissions from On-Road Gasoline Vehicles and Small Off-Road Gasoline Engines, Environ. Sci. Technol., 50, 4554–4563, 2016.
Zhao, Y., Saleh, R., Saliba, G., Presto, A. A., Gordon, T. D., Drozd, G. T., Goldstein, A. H., Donahue, N. M., and Robinson, A. L.: Reducing secondary organic aerosol formation from gasoline vehicle exhaust, P. Natl. Acad. Sci. USA, 114, 6984–6989, 2017.
- Abstract
- Introduction
- Methods
- Observations of ASOA production across three continents
- Improved urban SIMPLE model using multi-cities to constrain
- Preliminary evaluation of worldwide premature deaths due to ASOA with the updated SIMPLE parameterization
- Conclusions
- Data availability
- Author contributions
- Competing interests
- Disclaimer
- Acknowledgements
- Financial support
- Review statement
- References
- Supplement