the Creative Commons Attribution 4.0 License.
the Creative Commons Attribution 4.0 License.
 | 12 Jul 2021
Empirical evidence for deep convection being a major source of stratospheric ice clouds over North America
Ling Zou
Lars Hoffmann
Sabine Griessbach
Reinhold Spang
Lunche Wang
Ice clouds in the lowermost stratosphere affect stratospheric water vapour and the Earth's radiation budget. The knowledge of its occurrence and driving forces is limited. To assess the distribution and possible formation mechanisms of stratospheric ice clouds (SICs) over North America, we analysed SIC occurrence frequencies observed by the Cloud-Aerosol Lidar and Infrared Pathfinder Satellite Observations (CALIPSO) instrument during the years 2006 to 2018. Possible driving forces such as deep convection are assessed based on Atmospheric Infrared Sounder (AIRS) observations during the same time. Results show that at nighttime, SICs are most frequently observed during the thunderstorm season over the Great Plains from May to August (MJJA) with a maximum occurrence frequency of 6.2 %. During the months from November to February (NDJF), the highest SICs occurrence frequencies are 5.5 % over the north-eastern Pacific and western Canada and 4.4 % over the western North Atlantic. Occurrence frequencies of deep convection from AIRS, which includes storm systems, fronts, mesoscale convective systems, and mesoscale convective complexes at midlatitude and high latitude, show similar hotspots like the SICs, with highest occurrence frequencies being observed over the Great Plains in MJJA (4.4 %) and over the north-eastern Pacific, western Canada, and the western North Atlantic in NDJF (∼ 2.5 %). Both, seasonal patterns and daily time series of SICs and deep convection show a high degree of spatial and temporal relation. Further analysis indicates that the maximum fraction of SICs related to deep convection is 74 % over the Great Plains in MJJA and about 50 % over the western North Atlantic, the north-eastern Pacific, and western Canada in NDJF. We conclude that, locally and regionally, deep convection is the leading factor related to the occurrence of SICs over North America. In this study, we also analysed the impact of gravity waves as another important factor related to the occurrence of SICs, as the Great Plains is a well-known hotspot for stratospheric gravity waves. In the cases where SICs are not directly linked to deep convection, we found that stratospheric gravity wave observations correlate with SICs with as much as 30 % of the cases over the Great Plains in MJJA, about 50 % over the north-eastern Pacific and western Canada, and up to 90 % over eastern Canada and the north-west Atlantic in NDJF. Our results provide a better understanding of the physical processes and climate variability related to SICs and will be of interest for modellers as SIC sources such as deep convection and gravity waves are small-scale processes that are difficult to represent in global general circulation models.
- Article
(2561 KB) - Full-text XML
- BibTeX
- EndNote


Ice clouds have been identified as an important uncertainty component in weather and climate research, with optically thin ice clouds covering about 20 %– 40 % of the globe (Wylie et al., 1994, 2005; Zhou et al., 2014). The wide distribution of ice clouds and their radiative properties makes them a crucial factor for understanding the physical composition, dynamic structure, and radiative budget of the atmosphere (Liou, 1986). This is especially true for those ice clouds in the stratosphere (SICs), which greatly regulate the water vapour budget in the atmosphere, impact the exchange processes between the troposphere and stratosphere, and affect the surface energy balance (Roewe and Liou, 1978; Berry and Mace, 2014; Dessler et al., 2016). Although difficult to observe, the presence of SICs has been found and discussed in a number of studies (Clodman, 1957; Sandhya et al., 2015). However, due to the intricacy of atmospheric processes, the precise mechanisms for the formation and existence of SICs under different atmospheric conditions are not fully understood.
Ice clouds in the tropical tropopause layer (TTL) draw a lot of attention as the TTL is the primary entrance of water vapour from the troposphere to the stratosphere (Boehm and Lee, 2003; Schoeberl et al., 2019). Most tropical cirrus clouds in the lower stratosphere are detected over the western Pacific, South and Southeast Asia, Equatorial Africa, and South America (Massie et al., 2013; Dauhut et al., 2020). However, as shown by Dessler et al. (2013), two-thirds of the stratospheric water vapour feedback was actually from water vapour increasing in the stratosphere in the extratropics. Ice clouds in the extratropical lower stratosphere play an important role for the global radiative budget by regulating water vapour in the upper troposphere and lower stratosphere (Sherwood and Dessler, 2001; Lelieveld et al., 2007). Furthermore, ice clouds in the middleworld potentially affect variations in the stratospheric chemical composition, such as the distributions of nitric acid, chlorine, and ozone (Borrmann et al., 1996, 1997; Clapp and Anderson, 2019). Therefore, investigating the formation and distribution of extratropical lowermost SICs is of importance.
Empirical evidence for the existence of SICs at midlatitudes was found from in situ measurements (Murgatroyd and Goldsmith, 1956; Clodman, 1957; Bartolome Garcia et al., 2021), ground-based lidar observations (Keckhut et al., 2005; Noël and Haeffelin, 2007), and satellite data (Spang et al., 2015; Homeyer et al., 2017). Sassen and Campbell (2001) showed that about 5 %– 7.5 % of cirrus cloud tops are located above the tropopause over Salt Lake City, Utah, in the winter season based on a 10-year high cloud data set at the University of Utah Facility for Atmospheric Remote Sensing. About 2.5 % of cirrus clouds with tops above the first thermal tropopause were found over France based on ground-based lidar measurements (Noël and Haeffelin, 2007). Regarding satellite observations, about 5 % of the observed cirrus clouds at 40–60∘ N were detected above the tropopause driven by ERA-Interim based on 2 weeks of infrared limb emission measurements in boreal summer 1997 by the Cryogenic Infrared Spectrometers and Telescopes for the Atmosphere (CRISTA) instrument (Spang et al., 2015). Pan and Munchak (2011) found ∼ 2 % cirrus cloud with tops 0.5 km above the tropopause from Cloud-Aerosol Lidar and Infrared Pathfinder Satellite Observations (CALIPSO) measurements in both southern and northern midlatitudes based on tropopause heights derived from the National Centers for Environmental Prediction Global Forecast System (GFS), while about 4 % stratospheric cirrus cloud with tops 0.5 km above ERA-Interim first tropopause over latitudes between 40– 60∘ were estimated from Michelson Interferometer for Passive Atmospheric Sounding (MIPAS) observations (Zou et al., 2020). Even though the actual numbers of occurrence frequency are different from study to study, the occurrence of SICs at midlatitudes is generally notable.
Considering the pathways of air into the midlatitude stratosphere, deep convection, especially tropopause-penetrating convection, could produce direct injection of water vapour and ice particles into the middleworld and even the overworld stratosphere (Weinstock et al., 2007). Based on 1 year (March 2014 to February 2015) (Liu and Liu, 2016) and 4 years (April 2014 to March 2018) (Liu et al., 2020) of Global Precipitation Measurement (GPM) Precipitation Feature (PF) data, a larger area and higher occurrence of 20 dBZ radar reflectivity at and above the tropopause were observed in northern middle and high latitudes than over tropics. As the 20 dBZ radar reflectivity above the tropopause is defined as overshooting convection in Liu and Liu (2016) and Liu et al. (2020), the high occurrence of it means lots of air and ice particles were directly injected above the tropopause in midlatitudes. Smith et al. (2017) observed the amount of water vapour with a depth of ∼ 2 km in the stratospheric overworld (380 to 415 K) in the south of the Great Lakes on 27 August 2013; then they found that the detrainment and mixing of water in the stratosphere could likely be traced back to the tropopause-penetrating storm system. On the base of the National Oceanic and Atmospheric Administration Next Generation Weather Radar (NEXRAD) network over the continental United States, Cooney et al. (2018) and Solomon et al. (2016) found that the overshooting events are most common in the north-central part of the United States. Cooney et al. (2018) discovered about 45 % of the overshooting events with echo tops at least 1 km above the tropopause extended above the 380 K level into the stratosphere. Yu et al. (2020) also found ∼ 1 ppmv moister air in the stratosphere in summer time when deep convection occurs over the North American region based on Microwave Limb Sounder data. The tropopause-penetrating injections and the lower-stratospheric moistening related to deep convection indicate a strong link between deep convection and the occurrence of stratospheric ice clouds.
Gravity-wave-generated temperature perturbations are important for the formation of ice clouds (Haag and Kärcher, 2004; Jensen and Pfister, 2004). Kim et al. (2016) and Podglajen et al. (2018) observed the formation and existence of high-altitude ice clouds in cold phases of upward-propagating waves in the TTL based on the Airborne Tropical TRopopause EXperiment (ATTREX) measurements. In midlatitudes, the formation of cirrus cloud caused by mesoscale gravity waves was found and simulated by Kärcher and Podglajen (2019). For gravity-wave-induced ice clouds in the stratosphere, Hoffmann et al. (2017) investigated the gravity waves from the Atmospheric Infrared Sounder (AIRS) observations and found that the temperature fluctuations yielded by gravity waves triggered the formation of polar stratospheric clouds. The turbulence and mixing generated by breaking gravity waves would influence the occurrence of ice clouds in the lower stratosphere. Homeyer et al. (2017) found gravity wave breaking was the primary source for above-anvil cirrus plumes, which could reach to 1–6 km above the tropopause in extratropical convective systems. According to Wang (2003), turbulent mixing and advection downwind at the top of overshooting were potentially contributing to the formation of cirrus plumes above anvil, in which gravity wave breaking sets up strong vertical motions at the cloud top, injects the water vapour into the stratosphere, and leads to cirrus plumes above the anvils. The relation between gravity waves and the formation and occurrence of stratospheric ice clouds is noteworthy.
Moreover, other factors may contribute to the occurrence of high-altitude ice clouds, such as poleward transport of water vapour from the TTL to the extratropics (Dessler et al., 1995; Pittman et al., 2007). Spang et al. (2015) found a significant amount of cirrus clouds in the lowermost stratosphere at midlatitudes and high latitudes based on CRISTA satellite observations, and it turned out that poleward isentropic transport from the upper tropical troposphere to the extratropical stratosphere leads to the occurrence of SICs in these observations. Deep convection associated with double tropopause events contributed to the presence of stratospheric cirrus at altitudes of 1–2 km above the tropopause (Homeyer et al., 2014b). Petzold et al. (2020) found potential relations between cirrus and the North Atlantic Oscillation (NAO) index in the extratropical upper troposphere and lowermost stratosphere at northern midlatitudes over the eastern North American, North Atlantic, and European regions for the time period from 1995 to 2010. Furthermore, freezing aerosol particles in the upper troposphere and lower stratosphere (UTLS) might also influence the formation of subvisible cirrus at midlatitudes (Gierens et al., 2000). Above all, the mechanisms leading to the formation of ice clouds are manifold and complicated. Specifying the relations of driving factors and SICs is crucial for understanding better the potential effects of SICs in different regions and seasons.
Considering the relevance of SICs regarding their impact on the Earth's radiation budget and climate change, we analysed a nearly 13-year record (2006 to 2018) of satellite observations of SICs and deep convection over North America. The study area of North America was mainly selected to enable comparison of the results with other studies focusing on that region. The main objectives of our work are (i) to quantify the occurrence and distribution of SICs over North America, (ii) to quantify the contribution of deep convection as a primary force for the formation of SICs in that region, and (iii) to discuss potential driving factors related to the presence of SICs, in particular gravity wave events and atmospheric transport. Note that, in this study, SICs include both cirrus clouds as well as the optically thick ice clouds from deep convection, with a cloud top located above the tropopause.
Further information on the CALIPSO and AIRS instruments, the ERA-Interim tropopause data and the detection methods for SICs, deep convection, and gravity waves are presented in Sect. 2. In Sect. 3, we discuss occurrence frequencies of SICs, deep convection, gravity waves, and their relationships, as well as the contribution of deep convection and gravity waves to the formation of SICs over North America. In Sect. 4, we further discuss the role of deep convection, gravity waves, and transport from deep convection in the formation and maintenance of SICs. A summary and conclusions are presented in Sect. 5.
2.1 Tropopause data
The subdivision of different atmospheric layers is often based on the vertical temperature structure of the atmosphere. The lapse rate tropopause (LRT) is the lowest level at which the lapse rate decreases to 2 ∘C/km or less, provided the average lapse rate between this level and all higher levels within 2 km does not exceed 2 ∘C/km (WMO, 1957). The LRT is a globally applicable tropopause definition to identify the transition between the troposphere and stratosphere (Munchak and Pan, 2014; Spang et al., 2015; Xian and Homeyer, 2019). Here, ERA-Interim (Dee et al., 2011) has been used to derive LRT geopotential heights (Hoffmann, 2020a). ERA-Interim is a global meteorological reanalysis with approximately 0.75∘ horizontal grid resolution on 60 vertical levels from the surface up to 0.1 hPa, which is available 6-hourly from January 1979 to August 2019. The vertical resolution of the data is about 600–1000 m for tropopause heights ranging from 9 to 18 km. However, the ERA-Interim data have been interpolated to a much finer vertical grid using cubic spline interpolation in order to improve the vertical resolution of the geopotential height estimates of the tropopause. This cubic spline interpolation method has also been applied in Spang et al. (2015) to produce an ERA-Interim-based “high-resolution” tropopause height data set.
In this study, we use a threshold of 500 m between the Cloud-Aerosol Lidar with Orthogonal Polarization (CALIOP) cloud top and the ERA-Interim tropopause to identify an ice cloud as being stratospheric. The 500 m threshold for stratospheric cloud detection from CALIOP observations was also applied in previous studies (Homeyer et al., 2010; Pan and Munchak, 2011; Zou et al., 2020). Based on the uncertainty estimates of the data and for consistency with earlier work, we consider the value of 500 m to be a valid threshold to detect stratospheric ice clouds also in this study.
2.2 CALIPSO observations of SICs
The CALIOP is a near-nadir-viewing two-wavelength (532 and 1064 nm) polarization-sensitive lidar instrument (Winker et al., 2007, 2009), which is carried by the Cloud-Aerosol Lidar and Infrared Pathfinder Satellite Observations (CALIPSO) satellite. CALIOP probes high-resolution vertical structures and properties of clouds and aerosols on a nearly global scale. CALIPSO was launched on 28 April 2006 and remained part of NASA's “A-Train” satellite constellation until September 2018. The A-Train satellite constellation operates at a nominal altitude of 705 km with 98∘ inclination and has equatorial crossing times at 01:30 and 13:30 local time (LT).
The latest released CALIPSO version 4.x (V4.x) data products provide significantly improved Level-2 data by using a new cloud–aerosol discrimination algorithm and improved extinction retrieval algorithms (Liu et al., 2019; Young et al., 2018). Those improved algorithms provide a more reliable identification of aerosol and cloud layers and higher lidar ratios for ice clouds, which make the data product more suitable for studying ice cloud. To reliably estimate ice cloud top heights, only high-feature-type-quality cirrus cloud and deep-convection data from the CALIPSO V4.x Level-2 vertical feature mask data product are used in this study. Daytime and nighttime data need to be analysed separately due to their different signal-to-noise ratios and detection sensitivity (Getzewich et al., 2018).
Factoring in the uncertainties of the tropopause and cloud top heights, we identify clouds, both cirrus clouds and deep-convective clouds, with top heights of more than 500 m above the ERA-Interim LRT tropopause as SICs in this study. As cloud layers near the tropopause can extend horizontally over hundreds to thousands of kilometres (Winker and Trepte, 1998), a grid size of 4∘ × 6∘ (latitude × longitude), which may involve those large-scale SICs and deep-convection systems and also provide less noisy signals in figures, is used in our study to investigate occurrence frequencies of SICs.
2.3 AIRS observations of deep convection and gravity waves
The Atmospheric Infrared Sounder (AIRS) (Aumann et al., 2003; Chahine et al., 2006) is one of the six instruments aboard NASA's Aqua satellite. Being the first satellite in the A-Train constellation, Aqua also has a nominal orbital altitude of 705 km and inclination of 98∘. It shares the same equatorial crossing time with other A-Train members for the descending (01:30 LT) and ascending (13:30 LT) orbit sections. AIRS measures the thermal emissions of atmospheric constituents in the nadir- and sublimb-viewing geometry. The AIRS infrared spectrometer has a total of 2378 spectral channels with a spectral coverage of 3.74 to 4.61, 6.20 to 8.22, and 8.8 to 15.4 µm. Over the full dynamic range from 190 to 325 K, the absolute accuracy of each spectral channel is better than 3 % and noise is less than 0.2 at 250 K scene temperature (Aumann et al., 2000). The AIRS Level-1B (version 5.x) radiance data have been used to extract information of deep convection (Aumann et al., 2006; Hoffmann and Alexander, 2010) and gravity waves (Hoffmann et al., 2013, 2014) in this study.
As optically thick clouds at upper altitudes show lower brightness temperatures than clouds at lower altitudes or the surface at clear-sky conditions, particularly low brightness temperatures in spectral window regions can be used to detect deep convection and strong storm systems from infrared nadir sounder observations. To detect deep convection at latitudes below ±60∘ from AIRS measurements, Aumann et al. (2003) used a brightness temperature threshold of 210 K for the 1231 cm−1 (8.1 µm) radiance channel. Hoffmann and Alexander (2010) increased the threshold to 220 K to better identify convective systems at midlatitudes, which appear at higher tropopause temperatures at these latitudes. Later, Hoffmann et al. (2013) pointed out that ambiguous detections at different latitudes and seasons are likely caused by using a constant threshold for detection. Therefore, varying thresholds, which are based on monthly and latitudinally mean tropopause temperatures from the NCAR/NCEP reanalysis, have been used in their work.
Following the approach of Hoffmann et al. (2013), we use co-located tropopause temperatures from ERA-Interim to further improve the identification of deep-convective events. By considering the vertical grid spacing of ERA-Interim and based on a sensitivity test (Appendix A), an offset of +7 K on top of the tropopause temperature (TTP) was selected as the threshold to detect deep-convection events from AIRS brightness temperature measurements (BTAIRS) at 1231 cm−1 here:
The choice of the temperature threshold to detect deep convection typically does not affect the spatial and temporal patterns fundamentally, but it is quite important in determining the specific numbers of the occurrence frequencies of deep convection. For example, low values of the temperature threshold would act well in identifying convection reaching close to the tropopause but might miss those events with cloud tops located deep in the stratosphere or well below the tropopause. A larger temperature threshold would include more events, but it may overestimate the occurrence of deep convection by including many events that are actually limited to the upper troposphere and do not cross the tropopause. With different detection thresholds, the specific occurrence frequencies of deep convection are therefore different.
Sensitivity tests regarding the threshold used to detect deep convection can be found in Appendix A. By comparing the results from Appendix A and Fig. 5 (presented in Sect. 3.3), we find that even though the specific occurrence frequencies vary with the threshold, the spatial patterns of deep convection are rather consistent and the hypothesis that deep convection is the primary force related to the occurrence of SICs over North America is robust. Therefore, by considering the uncertainties of the ERA-Interim vertical resolution and the tropopause heights, +7 K is applied in this work to detect deep-convection events. Note that the term “deep convection” used in this work not only refers to convection from tropical storms, but also includes strong convective events from various other sources such as storm systems and fronts, mesoscale convective systems, and mesoscale convective complexes at midlatitudes and high latitudes.
Mean brightness temperatures in the carbon dioxide 4.3 µm waveband have previously been used to detect stratospheric gravity wave signals from AIRS observations (e.g. Hoffmann and Alexander, 2010; Hoffmann et al., 2013; Yue et al., 2013; Hoffmann et al., 2018). In order to reduce noise and to improve the detection sensitivity, we averaged measurements of 42 AIRS channels from 2322.6 to 2345.9 and 2352.5 to 2366.9 cm−1. In the next step, background signals from planetary waves and large-scale temperature gradients are removed by means of a low-pass filter. To identify gravity wave events, a variance filter was then applied to the 4.3 µm brightness temperature perturbations. Gravity wave events are detected based on a threshold of 0.05 K2 for the noise-corrected 4.3 µm brightness temperature variances. The detection method described here is sensitive to a broad range of gravity wave horizontal wavelengths (50 to 1000 km) but limited to vertical wavelengths of about 15 km or longer. The method can be used to detect gravity waves in the middle and upper stratosphere (30–40 km of altitude) (Hoffmann and Alexander, 2010; Hoffmann et al., 2013, 2018). However, as gravity waves typically propagate upward from their tropospheric sources into the stratosphere, the detections also provide information about gravity waves at tropopause levels.
3.1 Occurrence frequencies of SICs and deep convection
Figure 1 presents a nighttime observation of SICs above a thunderstorm on 12 June 2018 over the North American Great Plains. Brightness temperatures as low as ∼ 192 K indicate low cloud top temperatures related to deep convection, and red dots show SICs along the CALIPSO orbits (Fig. 1, upper panel). The corresponding 532 nm total attenuated backscatter (bottom panel) indicates that the top of the convection overshoots the tropopause into the lower stratosphere by up to ∼ 2.7 km and ice clouds are present at the top of the convective centre and above anvils. The observations of deep convection by AIRS and SICs by CALIOP show a high degree of consistency regarding occurrence time and location. Figure 1 shows a typical example of co-located stratospheric ice clouds and deep convection, a situation which can be frequently observed over the Great Plains during the thunderstorm season. Investigating the relationships between SICs and deep convection will provide further insights into the potential mechanism of SIC formation and water vapour transport into the stratosphere over North America.

Figure 1SICs observed above deep convection on 12 June 2018. Panel (a) shows 8.1 µm brightness temperatures (BT) derived from AIRS overlaid with CALIPSO orbits (black lines). The red circles along the orbits indicate cirrus with cloud top heights being at least 500 m above the tropopause. Panel (b) shows total attenuated backscatter for a whole CALIPSO orbit from (a); the region of interest lies within the red dashed region only. The dashed black line indicates the tropopause height derived from ERA-Interim. Panel (c) shows the cloud type from the CALIPSO V4.x Level-2 vertical feature mask data, and the red curve shows the ERA-Interim tropopause height.
The occurrence frequencies of SIC and deep convection for the summer season, i.e. May to August (MJJA), and the winter season, i.e. November to February (NDJF), were calculated from CALIPSO measurements between 2006 and 2018 as the ratio of the number of detections to the total number of profiles in 4∘ × 6∘ (latitude × longitude) grid boxes (Fig. 2a, b, e, f). As the CALIPSO measurements have a better signal-to-noise ratio at nighttime than at daytime (Winker et al., 2009; Hunt et al., 2009), which has a significant impact on the detection of SICs (Pan et al., 2009; Zou et al., 2020), we focus on the analysis of nighttime data in this study.
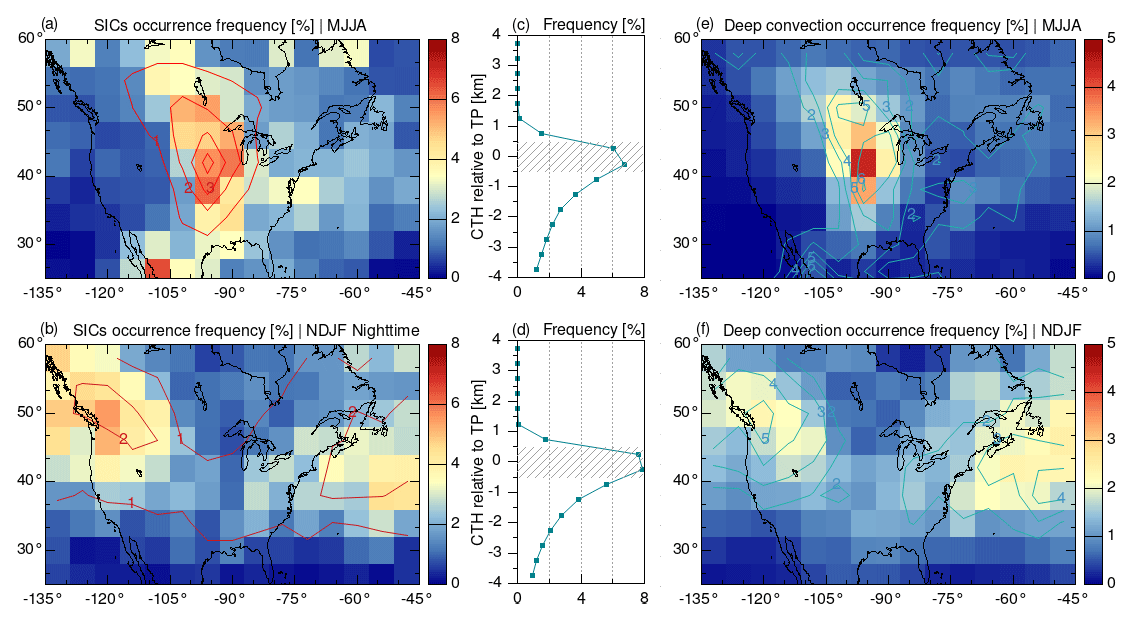
Figure 2Nighttime seasonal mean occurrence frequencies of SIC from 2006 to 2018 in (a) MJJA and (b) NDJF on a (latitude × longitude) grid size. SICs detected by CALIPSO are cirrus clouds that have a cloud top height at least 500 m above the tropopause derived from ERA-Interim. Panels (c) and (d) are the corresponding occurrence frequencies of ice cloud top heights in the altitude range from −4 to 4 km with respect to the tropopause over North America. Occurrence frequencies of deep convection are shown in (e) MJJA and (f) NDJF. Deep-convection events measured by AIRS are defined as a difference between the 8.1 µm brightness temperature and the ERA-Interim tropopause temperature below 7 K. The red contour lines in (a) and (b) show the occurrence frequencies of deep convection, and blue contour lines in (e) and (f) are occurrence frequencies of SIC.
Over North America and the neighbouring ocean regions, SICs are most often detected over the Great Plains during the Midwest thunderstorm season (MJJA) with maximum occurrence frequencies of 6.2 % (Fig. 2a), and in the winter season (NDJF) high SIC occurrence frequencies are found over the north-eastern Pacific and western Canada (up to 5.5 %) and the western North Atlantic with maximum occurrence frequencies of 4.4 % (Fig. 2b). These occurrence frequencies are in agreement with results reported for a shorter time span (2006 to 2012) of CALIPSO measurements (Zou et al., 2020), in which the SICs were retrieved with the same detection method and tropopause data. The vertical occurrence frequencies of ice cloud top heights with respect to the tropopause in Fig. 2c and d show that most ice cloud top heights over North America are observed around the tropopause (7 %– 8 %). The occurrence frequencies of SIC over North America are about 2 % both in summer and winter.
The patterns of the occurrence frequencies of deep convection from AIRS, which were calculated as the ratio between the number of deep-convection pixels and the total number of pixels in each grid box, are quite similar to the CALIPSO SIC observations (Fig. 2). High occurrence frequencies of deep convection occur over the Great Plains in MJJA with maximum value of 4.4 % (Fig. 2e) and over the north-eastern Pacific, western Canada, and the western North Atlantic in NDJF reaching 2.5 % (Fig. 2f). The patterns and absolute values of nighttime occurrence frequencies of deep convection found here are in line with the results of Hoffmann and Alexander (2010), Hoffmann et al. (2013), and de Groot-Hedlin et al. (2017) using AIRS data for different ranges of years.
Even though at midlatitudes the SIC occurrence maxima are shifted slightly downwind (eastward) compared to the deep-convection maxima, the occurrence frequencies overall indicate a high degree of relation between SICs and deep convection.
3.2 Temporal correlations of SICs and deep convection
The results from Sect. 3.1 show that the hotspots of SICs and deep convection spatially overlap over the Great Plains in MJJA and over the north-eastern Pacific, western Canada, and western North Atlantic in NDJF. To further analyse the spatial relations, yearly nighttime mean occurrence frequencies of SICs and deep convection in MJJA from 2007 to 2018 are presented in Fig. 3. This analysis shows that hotspots of SICs and deep convection are often simultaneously detected over the Great Plains, even though the magnitude of the occurrence frequencies of SICs and deep convection changes significantly from year to year. The maximum occurrence frequency of SICs reaches up to 15 % in 2011 with the largest occurrence frequency of deep convection being more than 6 %. In the years 2012, 2016, and 2017, occurrence frequencies of SICs are as low as 3 %– 6 %, with weaker frequencies of deep convection of 3 %– 4 %. In all years, the peak frequencies of SICs usually appear around the centre of deep convection.
The temporal correlations between SICs and deep convection are further analysed based on time series of daily detection numbers (nobs) over the Midwest United States (35–45∘ N, 90–100∘ W) from May to August (Fig. 4). Data from 3 years (2010, 2013, 2015) which have Pearson linear correlation coefficients (rSIC-DC) of 0.66, 0.52, and 0.3, respectively, between the number of CALIPSO SIC observations and AIRS deep-convection observations, are shown here as representative examples to illustrate the temporal correlation between SICs and deep convection. A visual inspection of the time series in Fig. 4 shows that individual events or episodes of SICs and deep convection often occur simultaneously.
However, as the rate at which SICs are formed depends on several parameters, such as the intensity, the spatial extent, and the duration of the deep-convection events, the simple linear correlation coefficient of the nobs of SICs and deep convection is not necessarily the best indicator of correlation. Additionally, we considered the number of days (NOD) with SICs and deep-convection detections as a proxy for identifying possible correlations. In Fig. 4, we see that even in 2015, which has the lowest linear correlation coefficient, 87 % of the days with SIC observations are related to days with deep convection. SICs generally co-occur with deep convection (> 80 % for each single year from 2007 to 2018, not shown), which indicates a high degree of correlation between deep convection and SICs on the temporal scale over the Great Plains in summertime.
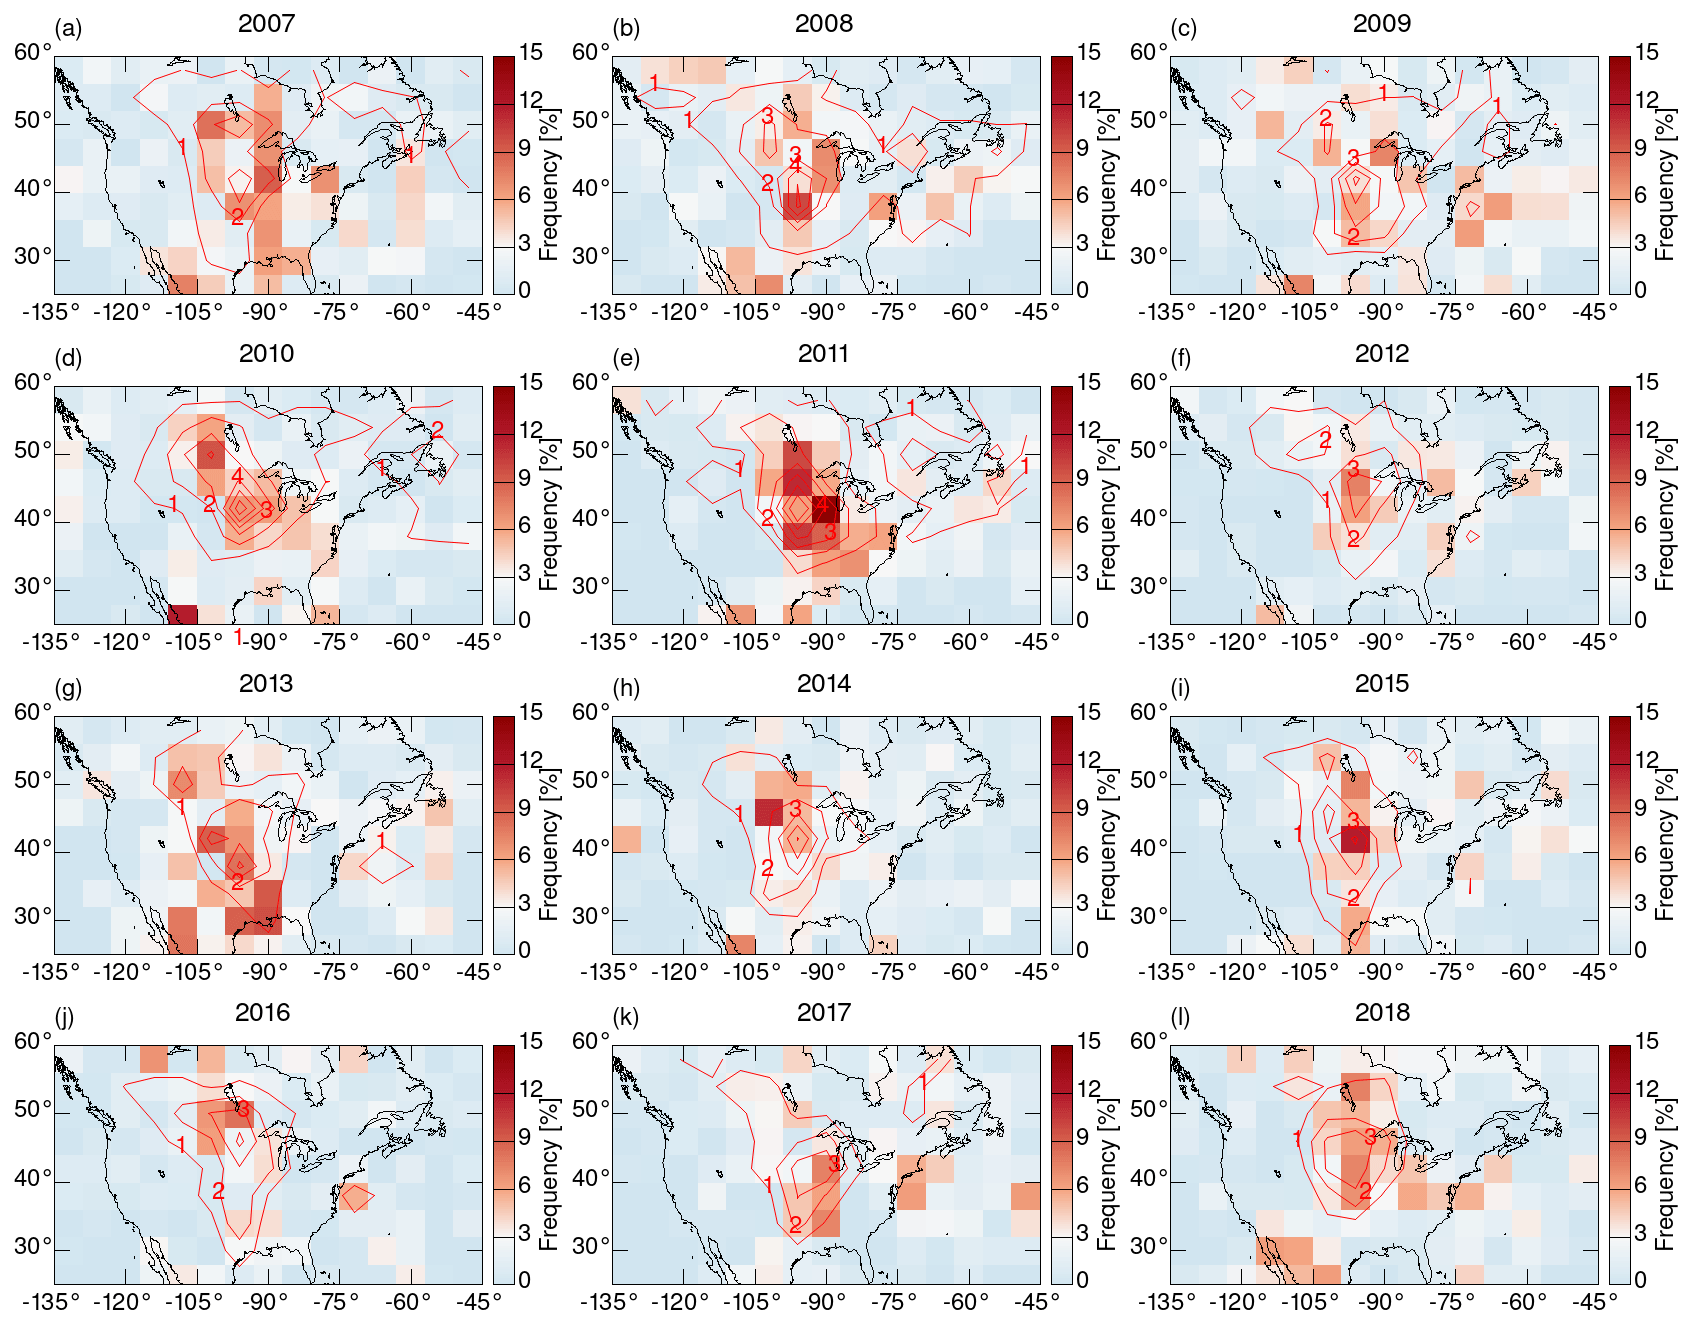
Figure 3Nighttime mean occurrence frequencies of SICs from CALIPSO (shown as coloured boxes) and deep convection from AIRS (shown as red contour lines) in MJJA from 2007 to 2018.
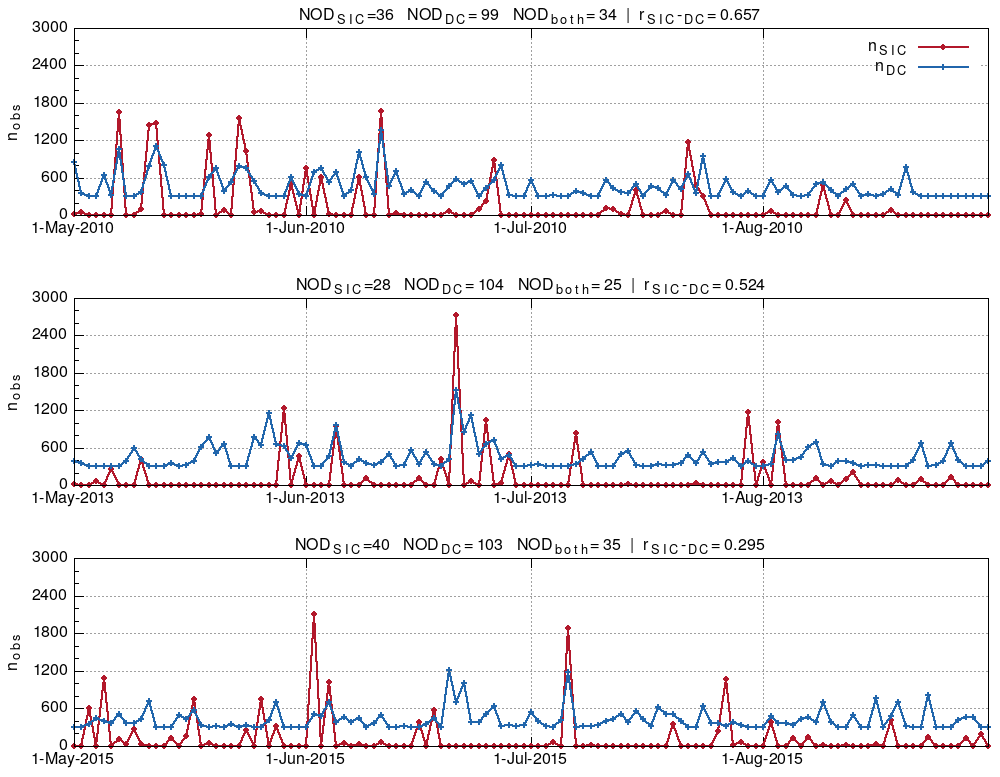
Figure 4Daily numbers of nighttime observations of SICs (red line with no offset) and deep convection (blue line with offset of 300) over the Midwest United States (35– 45∘ N, 90–100∘ W) in MJJA in 2010, 2013, and 2015. Number of days with occurrences of SICs (NODSIC), deep convection (NODDC), or both (NODboth) are counted. Total detection numbers of SICs (nSIC), deep convection (nDC) on each day, and their Pearson linear correlation coefficients (rSIC-DC) are also shown above the plots.
3.3 SICs related to deep convection
In this section, the relations between SICs and deep convection are investigated in more detail by analysing the fraction of SIC observations occurring in the same grid box with deep convection on the same day at nearly the same time, considering that both AIRS and CALIPSO are in the A-Train (Fig. 5). The fraction of SICs related to deep convection is defined as the ratio of day numbers with SICs and deep convection both detected to the total number of days with SIC detections. In MJJA, most SIC observations are directly related to deep convection over the Great Plains with the highest fraction up to 74 % (Fig. 5a). In NDJF, the SIC observations over the western Atlantic Ocean (up to 50 %) and secondly over the north-eastern Pacific and western Canada with a maximum fraction of 44 % are mostly related to deep convection. Regions with a high degree of relation between SICs and deep convection agree best with the regions with large occurrence frequencies of deep convection, indicating that deep convection is the main factor related to the formation of SICs in the study area.
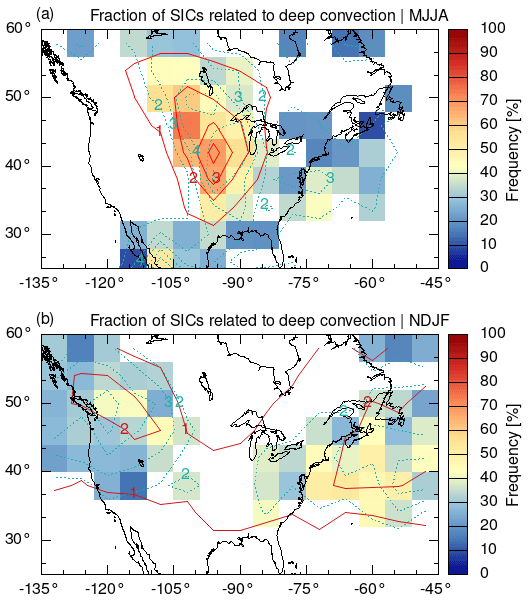
Figure 5Coloured boxes indicate the fraction of SICs related to deep convection. Blank grid cells are regions with SIC occurrence frequencies less than 2 %. Regions with SIC occurrence frequencies of ≥ 2 % are shown with dotted blue contour lines, and regions with deep-convection occurrence frequencies of ≥ 1 % are shown with red contour lines.
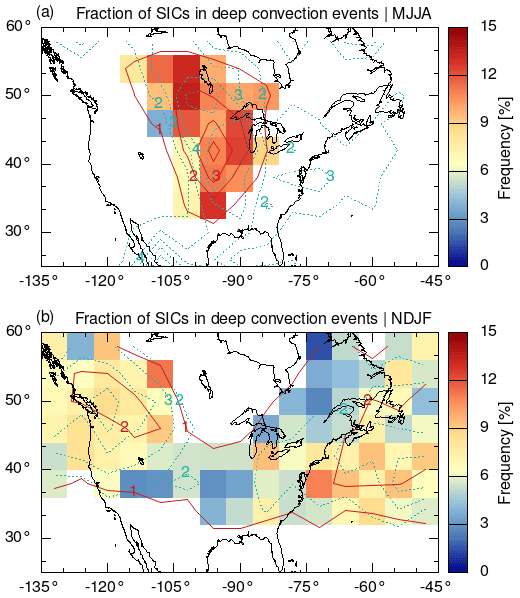
Figure 6Fraction of deep-convection events related to SICs. The red contour lines indicate the occurrence frequencies of deep convection, and blue dotted contour lines show the occurrence frequencies of SICs.
While the majority of the SICs is directly related to deep convection in the investigation area, only about 12 % of the deep-convection events co-occur on average with SICs over the Great Plains in MJJA and less than 10 % over the north-eastern Pacific, western Canada, and the western North Atlantic in NDJF (Fig. 6).
After removing the SIC observations directly related to deep convection, SIC occurrence frequencies as large as 3 % over the Great Plains in MJJA (Fig. 7a) and 3.6 % over the north-eastern Pacific and western Canada and 3 % over the western North Atlantic in NDJF (Fig. 7b) remain. Vertically, the highest fractions of ice cloud top heights unrelated to deep convection are also located in the tropopause region (Fig. 7c, d). The fractions of SIC are about 1 % over North America and decrease by 50 % compared to Fig. 2. Spatially, the maximum is located to the east of the deep-convection hotspot over the Great Plains in summer (MJJA). To a lesser extent, the NDJF maximum is located to the east of the convection hotspot. The downwind shift of SICs to deep convection is apparent, especially in summer time. This indicates that other mechanisms such as atmospheric transport need to be further investigated.
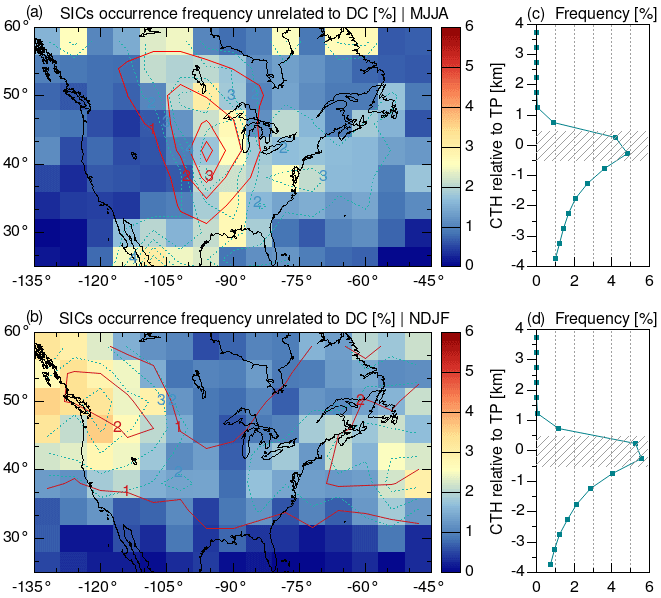
Figure 7Occurrence frequencies of SIC observations that are not directly related to deep convection for MJJA (a) and NDJF (b). The red contour lines show the occurrence frequencies of deep convection, and blue dotted contour lines are the occurrence frequencies of SIC. Panels (c) and (d) are the fractions of ice cloud top heights relative to the tropopause, which are not directly related to deep convection.
3.4 SICs and atmospheric transport
A group of SICs detected on 12 May 2011 over the Great Plains, which is unrelated to local deep convection, is shown in Fig. 8a. To trace the potential origin of those SICs, the highly scalable Massive-Parallel Trajectory Calculations (MPTRAC) model driven by ERA5 (Hoffmann et al., 2016, 2019; Hoffmann, 2020b) was used to calculate 3 d backward trajectories. The red triangles in Figs. 8c and d indicate the location of the SIC observation, and blue triangles mark the position of the air parcels at local time 13:30 and 01:30 on 11 May 2011. Convection systems are observed along the trajectory by AIRS and are possibly the origin of the SIC. In this case, the SICs formed from the convective system and were transported to the north-east by the jet stream.
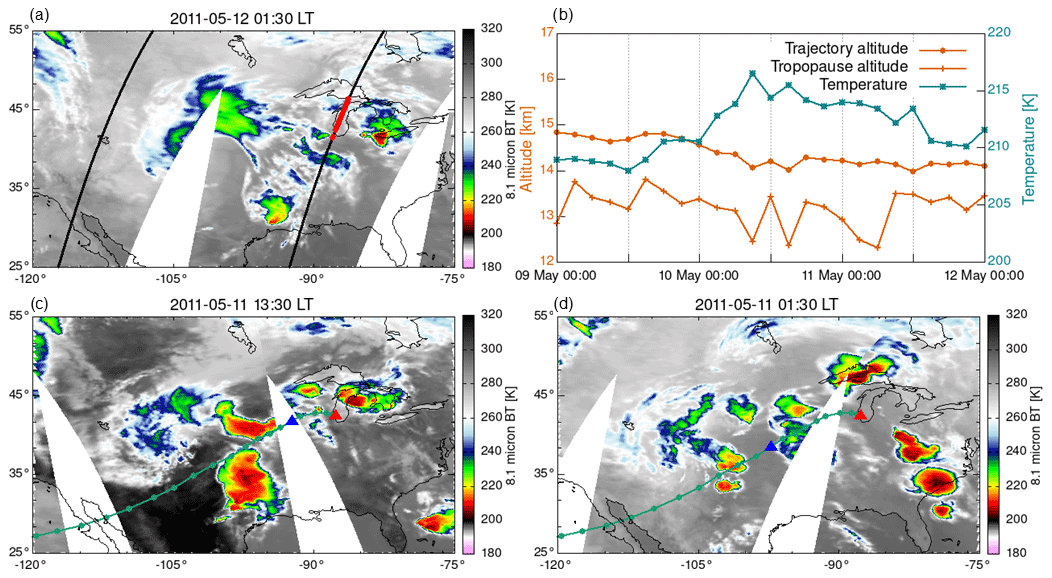
Figure 8CALIPSO SIC (red dots) and AIRS deep convection (colours) observations. (a) The observed SICs on 12 May 2011 are unrelated to local deep convection. (b) The trajectory height, tropopause height, and trajectory temperature along a 3 d backward trajectory. (c, d) The trajectory (green dotted line with a time interval of 3 h) starting at an SIC observation (red triangle) passes deep-convection systems approximately several hours earlier on 11 May 2011. The blue triangles indicate the position of the air parcel at local time 13:30 and 01:30 on 11 May 2011.
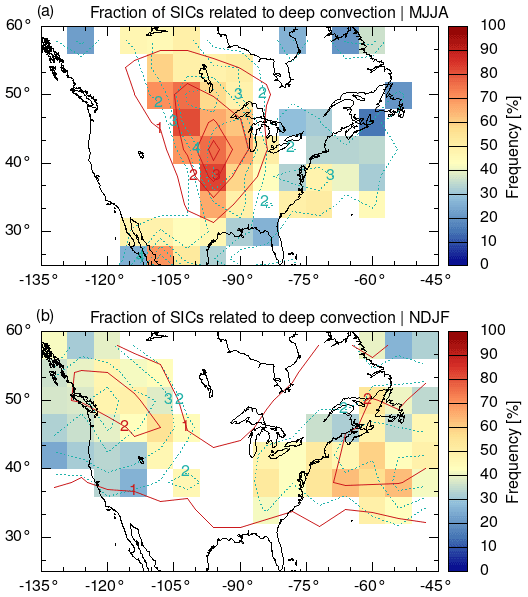
Figure 9Fraction of SICs related to deep convection with a larger search radius of 6∘ × 8∘ (latitude × longitude) for deep-convection detection. The red contour lines are the occurrence frequencies of deep convection, and blue dotted contour lines are the occurrence frequencies of SICs.
The example further supports the finding in Sect. 3.3 that SICs are also observed downwind of deep-convection regions. This may in particular explain some of the high occurrence frequencies of SICs over the Great Plains in Fig. 7, as they are located downwind of a deep-convection hotspot. To enable a more detailed atmospheric transport analysis, a practical method of simply enlarging the search radius for deep convection in the grid box is applied in our work, which enlarges the search radius from 4∘ × 6∘ to 6∘ × 8∘ (latitude × longitude). The fractions of SICs related to a larger search radius' deep convection are presented in Fig. 9. Although the patterns are very similar, the fractions of SICs related to deep convection now increase up to 83 % over the Great Plains in MJJA, 55 % over the north-eastern Pacific and western Canada, and 62 % over the western North Atlantic in NDJF. These values are generally 10 % larger than the results shown in Fig. 5. This suggests that transport from deep-convective sources is another important factor for the occurrence of SICs in the study area.
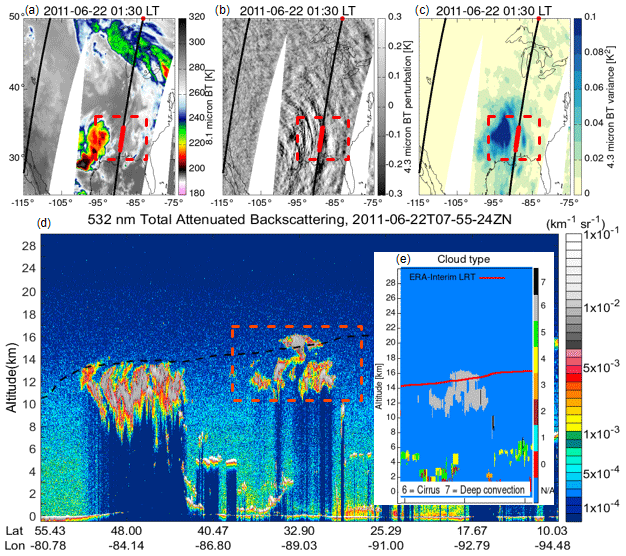
Figure 10Example of relations between gravity waves and SICs. Panels (a–c) show brightness temperature, brightness temperature perturbations, and variances from AIRS measurements; brightness temperature variances in (c) with a threshold of 0.05 K2 identify stratospheric gravity waves. Red dots indicate SIC detections along CALIPSO orbits. Panel (d) shows vertical features of clouds from CALIPSO backscatter data. Panel (e) shows cloud type in the region of interest. The red curve shows the ERA-Interim tropopause.
3.5 SICs related to gravity waves
The summertime deep convection over the Great Plains is known to induce gravity waves (Hoffmann and Alexander, 2010), and gravity waves are known to contribute to cirrus formation (Jensen et al., 2016). To address potential sources for the SICs not directly related to deep convection as found in Fig. 7, we analysed the SIC relation with gravity waves. An example of SICs induced by gravity waves is shown in Fig. 10. The top of the SICs is located about 1.2 km above the tropopause according to the CALIPSO observations. The AIRS 4.3 µm brightness temperature variances around the SICs are about 0.06 K2, which exceeds the significance level of AIRS to detect stratospheric gravity waves. The stratospheric gravity waves were likely caused by a convective system to the west of the SICs as indicated by the propagation direction of the waves patterns (Fig. 10).
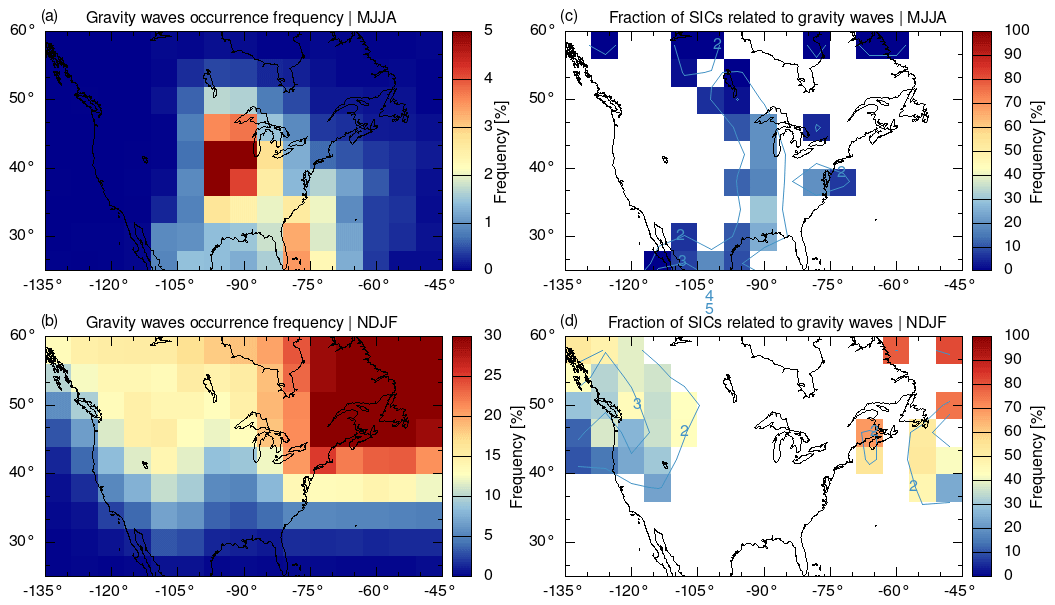
Figure 11Mean occurrence frequency of gravity waves derived from AIRS measurements between 2006 and 2018 in MJJA (a) and NDJF (b). Fraction of SICs related to gravity waves in MJJA (c) and NDJF (d); here SICs are those indirectly related to deep convection as found in Fig. 7.The blue contour lines show the occurrence frequencies of SICs.
Counting only SICs connected with gravity waves in the absence of deep convection in the same grid box, Fig. 11 shows the occurrence frequencies of gravity waves as well as the fraction of SICs related to gravity waves. In contrast to deep convection, gravity waves are more often detected in NDJF over eastern Canada and the north-west Atlantic (> 30 %) (Fig. 11b). In MJJA, the maximum is located over the Great Plains (∼ 5 %) (Fig. 11a). Frequencies and locations of gravity waves found here are consistent with the results of Hoffmann and Alexander (2010), Hoffmann et al. (2013), and de Groot-Hedlin et al. (2017). In NDJF, gravity waves may explain as much as 50 % of the remaining SIC observations over the north-eastern Pacific and western Canada and 90 % over eastern Canada and the north-west Atlantic (Fig. 11d). In MJJA, the influence of gravity waves on the occurrence of SICs is weaker (maximally 30 % over the Great Plains, Fig. 11c), as deep convection plays a more important role.
The result that up to 74 % of SICs in MJJA over the Great Plains and about 50 % in NDJF over the western Atlantic Ocean, the north-eastern Pacific, and western Canada are correlated with deep convection implies that deep convection is the major source for SICs in these regions for the respective seasons. This finding appears plausible, as for tropical SICs, there is a clear relation with the seasonally varying deep convection (Pan and Munchak, 2011). During the thunderstorm season in MJJA, the region over the Great Plains is known to produce extraordinarily strong convection at midlatitudes. Their tropopause-reaching cloud occurrence frequency is comparable with (daytime) or even higher than in (nighttime) the tropical deep-convection hotspots (Hoffmann et al., 2013). Also in NDJF the occurrence frequencies of convective tropopause-reaching clouds over the western Atlantic Ocean, the north-eastern Pacific, and western Canada are comparable to tropical hotspots (Hoffmann et al., 2013). Moreover, deep convection as a source for SICs is supported by studies reporting measurements of enhanced water vapour in the lowermost stratosphere over North America that were attributed to overshooting convection (Barrett et al., 1950; Hanisco et al., 2007; Herman et al., 2017). For the extratropics, Spang et al. (2015) identified quasi-isentropic transport of water-vapour-rich air from the subtropical upper troposphere into the lowermost extratropical stratosphere as a source for SICs based on 2 selected days out of 8 d of CRISTA2 measurements in August 1997. Their findings were more for SICs located over Scandinavia and the Baltic Sea, both not known for strong convection and outside the region of our investigation. Given the different regions, times, and time frames investigated, we assume that at midlatitudes the dominating SIC formation mechanisms may also depend on the longitude, orography, land–sea distribution, or temperature contrasts.
In this study, we found that ∼ 10 % of all deep-convection events were correlated with SICs (Fig. 6). As CALIPSO underestimates the occurrence frequencies of SICs by a factor of 2 at midlatitudes (Zou et al., 2020), there would probably be even more deep-convection events correlated with SICs. As convection injections reach 2–4 km above the tropopause (Homeyer et al., 2014a), deep convection is a vital pathway for transporting ice particles, water vapour, and other pollutants into the lowermost stratosphere. Cooney et al. (2018) and Solomon et al. (2016) found that the tropopause-penetrating convection is common over the central United States in later spring and summertime. For example, at 00:00 UTC, the average fraction of total monthly overshoots is about 8 % (Cooney et al., 2018) and the total annual overshooting fraction is about 12 % (Solomon et al., 2016) based on NEXRAD radar data. Deep convection would therefore play a significant role in transporting ice particles and regulating water vapour in the lower stratosphere, thus affecting stratosphere and troposphere exchange over North America, especially in the summer season.
The occurrence of SICs is also affected by the transport from deep convection. We found that fractions of SICs due to deep convection increase by ∼ 10 % over North America with a larger search radius (6∘ × 8∘ at latitude × longitude) for deep convection (Fig. 9 compared with Fig. 5). However it is not entirely clear if the SICs in the example above (Fig. 8) observed more than 12 h and several hundred kilometres away from the deep-convection source were directly injected or if the SICs formed in situ from injected water vapour. Nearly the same SIC occurrence frequencies in MIPAS daytime and nighttime measurements (∼ 10:30 local Equator overpass time) (Zou et al., 2020) suggest that SICs may have a life time longer than 12 h and exceeding those of the convective cells. While a microphysical simulation study shows that the conditions at the midlatitude tropopause limit the cirrus cloud life time to less than 9 h due to fast sedimentation (Jensen et al., 1996), and hence suggest that these SICs away from the deep convection centres may have formed later. Further investigation of the lifetime of SICs and the temporal offsets between the occurrence of convection and the detection of SICs by means of Lagrangian trajectory models would help to identify the sources of some unexplained SICs. As the trajectory analyses with large input data would be complex and rather computationally expensive, we foresee it for future work.
As more than 95 % of the gravity waves over the Great Plains (36 to 46∘ N, 98 to 88∘ W) are triggered by deep convection in MJJA (Hoffmann and Alexander, 2010), it is difficult to clearly disentangle the relations of gravity waves and deep convection with the SICs occurrences. In this work, we counted only SICs related to gravity waves in the absence of deep convection in the same grid box resulting in up to 50 % over the north-eastern Pacific and western Canada in NDJF and 30 % over the Great Plains in MJJA (Fig. 11). The fraction of SICs related to gravity waves would be higher (to 60 %– 70 % over the Great Plain in MJJA and 90 % over the north-eastern Pacific and western Canada in NDJF) if data above convective systems were included. As gravity waves propagate away from the centre of convection and induce temperature perturbations, they play a role in the formation and maintenance of the SICs as they have an impact on the particle size distribution by favouring the formation of more but smaller ice particles that consequently sediment slower (Haag and Kärcher, 2004). Ueyama et al. (2015) found about 4 % more ice clouds are enhanced by waves at tropical cold point tropopause from trajectory model. The gravity wave breaking at overshooting deep convection cloud tops induces strong upward motion in the lower stratosphere (Qu et al., 2020) that may counteract the sedimentation of the SIC ice particles (Podglajen et al., 2018). The relationship between SICs and gravity waves is complex and intricate and requires further investigation.

Figure 12Maximum contribution fraction of deep convection, gravity waves, and other factors related to the occurrence of SICs over the Great Plains in MJJA (a), over the north-eastern Pacific and western Canada in NDJF (b), and over the western North Atlantic in NDJF (c). Note that the maximum occurrence frequencies of SICs are about 6 % over the Great Plains in MJJA, 4.4 % over the north-eastern Pacific and western Canada, and 5.5 % over the western North Atlantic in NDJF.
The mechanisms associated with SIC observations are manifold. Figure 12 summarizes our findings regarding the maximum fraction of SICs related to deep convection and gravity waves in the summer season over the Great Plains and winter season over north-eastern Pacific and western Canada and western North Atlantic. The occurrence of SICs is mainly associated with deep convection, which coincides with nearly half of the CALIOP SIC observations over winter season hotspots and more than 70 % over summer season hotspots. For those SICs unrelated to deep convection we identified a strong relation with gravity waves over the north-eastern Pacific and western Canada, and the western North Atlantic in NDJF with fractions of 28 % and 45 % to the total number of SICs. The fraction correlated with gravity waves is relatively small over the Great Plains in MJJA, about 7.8 % of the total fraction of SICs. As mentioned above, due to the high degree of correlations of gravity waves and deep convection, it is difficult to distinguish their contributions clearly. The fractions of SICs related to deep convection and gravity waves presented above are based on the prioritization of deep convection in this study. Different methods on disentangling contributions of deep convection and gravity waves would produce differences on statistics, but the conclusion that deep convection and gravity waves are two main factors related to the occurrence of SICs in North America will not change. The remaining (a) 18 %, (b) 28 %, (c) 5 % SIC observations in Fig. 12 may be related to quasi-isentropic transport (Spang et al., 2015), double tropopauses (Noël and Haeffelin, 2007; Homeyer et al., 2014b) or baroclinic instabilities connected with upward transport via warm conveyor belts (WCBs) (Eckhardt et al., 2004) and other factors, but these were not investigated in this study.
Ice clouds in the lowermost stratosphere are of importance for understanding the water vapour budget and the chemical composition of the stratosphere, and their long-term influences on the radiation budget of the Earth's atmosphere will potentially affect climate change. In this work, we quantified the occurrence frequency of SICs over North America from 13 years (2006 to 2018) of CALIPSO measurements and studied the relations of SICs with deep convection and stratospheric gravity wave observations from AIRS measurements.
Hotspots of SICs are observed at nighttime over the North American Great Plains in MJJA with a maximum occurrence frequency of up to 6.2 % and over the north-eastern Pacific, western Canada, and the western North Atlantic in NDJF with frequencies of up to 5.5 % and 4.4 %. The deep-convection observations from AIRS show similar hotspots as the SICs, even in individual years. The seasonal distributions and daily time series of SICs and deep convection show a high degree of relation for the Great Plains hotspot. By analysing the location and time of the SIC and deep-convection observations, we found that up to 74 % of SICs can be attributed to deep convection over the Great Plains in MJJA and about 50 % over the western Atlantic Ocean, the north-eastern Pacific, and western Canada in NDJF (Fig. 5).
After filtering the SIC events related to local deep convection, there still remain up to 3 % of SIC observations over the Great Plains in MJJA and over the north-eastern Pacific, western Canada, and the western North Atlantic in NDJF. An example of backward trajectories from SIC observations calculated with a Lagrangian model particularly points to the role of transport processes. Following this, we found the contribution of deep convection to SIC occurrence to have increased by ∼ 10 % when enlarging the search radius for deep convection.
Other processes can be related to SIC observations as well. By correlating the CALIOP SIC observations with AIRS observations of stratospheric gravity waves, we found that about 30 % of the SIC events that are unrelated to deep convection over the Great Plains in MJJA are correlated with gravity wave observations. In NDJF the fractions are even larger, i.e. 50 % over the north-eastern Pacific and western Canada as well as up to 90 % over eastern Canada and the north-west Atlantic. Gravity waves also show close relation with SICs over North America. However, due to the high relation between gravity waves and deep convection, it's difficult to separate the contributions of them precisely.
In this study, we analysed the distribution of ice clouds in the lowermost stratosphere and the meteorological phenomena associated with SICs over North America. We found that, locally and seasonally, deep convection is the leading factor related to the occurrence of SICs over North America. Gravity waves and transport from deep-convective sources also have high relations with SICs. In this work we focused on the region of North America, where deep convection takes a dominating role in affecting the SIC presence and distribution. For a wider and deeper knowledge of the formation mechanism and distribution of SICs, we will look at global observations of SICs and try to identify the relevant sources and processes in future work.
A brightness temperature threshold of 7 K with respect to the tropopause temperature was used to identify deep-convection events or mesoscale convective systems from AIRS observations in this work. By changing the threshold to 5 or 10 K, we will obtain different values of deep-convection occurrence frequency and corresponding fractions of SICs related to deep convection (Fig. A1). It should be considered that smaller temperature thresholds (5 K) may miss overshooting convection and larger thresholds (10 K) will include some convection events that are restricted to the troposphere. The maximum fractions of SICs related to deep convection in MJJA over the Great Plains are about 65 % and 80 % with temperature thresholds of 5 and 10 K, respectively. No matter whether the temperature threshold is larger or smaller than 7 K, the conclusion that deep convection is the primary force related to the occurrence of SICs over North America is rather robust.

Figure A1Fraction of SICs related to deep convection with temperature thresholds of 5 K (a, b) and 10 K (c, d); red contour lines are the occurrence frequency of deep convection, and blue dotted contour lines are the occurrence frequency of SICs.
Convection and gravity wave data from AIRS used in this study are available at https://doi.org/10.17616/R34J42 (Hoffmann, 2020c). ERA-Interim tropopause data are available at https://doi.org/10.17616/R31NJMOH (Hoffmann, 2020a). Cirrus cloud top heights from CALIPSO are available upon request from the contact author, Ling Zou (l.zou@fz-juelich.de; cheryl_zou@whu.edu.cn).
LZ, LH, and SG conceived the study design. LH provided the AIRS data and the ERA-Interim/ERA5 tropopause data. LZ processed the CALIPSO data and compiled all results. RS provided useful discussion and valuable comments on paper. LCW provided helpful discussion about the CALIPSO data processing. LZ wrote the paper with contributions from LH and SG.
The authors declare that they have no conflict of interest.
Publisher’s note: Copernicus Publications remains neutral with regard to jurisdictional claims in published maps and institutional affiliations.
Ling Zou was supported by the National Natural Science Foundation of China under grant no. 41801021 and the International Postdoctoral Exchange Fellowship Program 2018 under grant no. 20181010.
We thank Olaf Stein from the Forschungszentrum Jülich for useful feedback. We gratefully acknowledge the computing time granted on the supercomputers JURECA and JUWELS at Forschungszentrum Jülich.
CALIPSO data are obtained from the NASA Langley Research Center Atmospheric Science Data Center. The AIRS data were distributed by the NASA Goddard Earth Sciences Data Information and Services Center. The ERA-Interim data were obtained from the European Centre for Medium-Range Weather Forecasts.
This research has been supported by the Deutsche Forschungsgemeinschaft (grant no. DFG HO5102/1-1).
The article processing charges for this open-access publication were covered by the Forschungszentrum Jülich.
This paper was edited by Timothy J. Dunkerton and reviewed by two anonymous referees.
Aumann, H. H., Gregorich, D., Gaiser, S., Hagan, D., Pagano, T., Strow, L., and Ting, D.: AIRS Algorithm Theoretical Basis Document Level 1B Part 1: Infrared Spectrometer, Tech. rep., NASA Jet Propulsion Laboratory, Pasadena, California, 2000. a
Aumann, H. H., Chahine, M. T., Gautier, C., Goldberg, M. D., Kalnay, E., McMillin, L. M., Revercomb, H., Rosenkranz, P. W., Smith, W. L., Staelin, D. H., Strow, L. L., and Susskind, J.: AIRS/AMSU/HSB on the aqua mission: Design, science objectives, data products, and processing systems, IEEE T. Geosci. Remote, 41, 253–263, https://doi.org/10.1109/TGRS.2002.808356, 2003. a, b
Aumann, H. H., Gregorich, D., and De Souza-Machado, S. M.: AIRS observations of deep convective clouds, in: Atmospheric and Environmental Remote Sensing Data Processing and Utilization II: Perspective on Calibration/Validation Initiatives and Strategies, SPIE, 6301, 63010J, https://doi.org/10.1117/12.681201, 2006. a
Barrett, E. W., Herndon Jr., L. R., and Carter, H. J.: Some Measurements of the Distribution of Water Vapor in the Stratosphere, Tellus, 2, 302–311, https://doi.org/10.3402/tellusa.v2i4.8602, 1950. a
Bartolome Garcia, I., Spang, R., Ungermann, J., Griessbach, S., Krämer, M., Höpfner, M., and Riese, M.: Observation of cirrus clouds with GLORIA during the WISE campaign: detection methods and cirrus characterization, Atmos. Meas. Tech., 14, 3153–3168, https://doi.org/10.5194/amt-14-3153-2021, 2021. a
Berry, E. and Mace, G. G.: Cloud properties and radiative effects of the Asian summer monsoon derived from A-Train data, J. Geophys. Res., 119, 9492–9508, https://doi.org/10.1002/2014JD021458, 2014. a
Boehm, M. T. and Lee, S.: The Implications of Tropical Rossby Waves for Tropical Tropopause Cirrus Formation and for the Equatorial Upwelling of the Brewer–Dobson Circulation, J. Atmos. Sci., 60, 247–261, https://doi.org/10.1175/1520-0469(2003)060<0247:TIOTRW>2.0.CO;2, 2003. a
Borrmann, S., Solomon, S., Dye, J. E., and Luo, B.: The potential of cirrus clouds for heterogeneous chlorine activation, Geophys. Res. Lett., 23, 2133–2136, https://doi.org/10.1029/96GL01957, 1996. a
Borrmann, S., Solomon, S., Avallone, L., Toohey, D., and Baumgardner, D.: On the occurrence of ClO in cirrus clouds and volcanic aerosol in the tropopause region, Geophys. Res. Lett., 24, 2011–2014, https://doi.org/10.1029/97GL02053, 1997. a
Chahine, M. T., Pagano, T. S., Aumann, H. H., Atlas, R., Barnet, C., Blaisdell, J., Chen, L., Divakarla, M., Fetzer, E. J., Goldberg, M., Gautier, C., Granger, S., Hannon, S., Irion, F. W., Kakar, R., Kalnay, E., Lambrigtsen, B. H., Lee, S. Y., Le Marshall, J., Mcmillan, W. W., Mcmillin, L., Olsen, E. T., Revercomb, H., Rosenkranz, P., Smith, W. L., Staelin, D., Strow, L. L., Susskind, J., Tobin, D., Wolf, W., and Zhou, L.: Improving weather forecasting and providing new data on greenhouse gases, B. Am. Meteorol. Soc., 87, 911–926, https://doi.org/10.1175/BAMS-87-7-911, 2006. a
Clapp, C. E. and Anderson, J. G.: Modeling the Effect of Potential Nitric Acid Removal During Convective Injection of Water Vapor Over the Central United State-Atmos., 124, 9743–9770, https://doi.org/10.1029/2018JD029703, 2019. a
Clodman, J.: Some statistical aspects of cirrus cloud, Mon. Weather Rev., 85, 37–41, https://doi.org/10.1175/1520-0493(1957)085<0037:SSAOCC>2.0.CO;2, 1957. a, b
Cooney, J. W., Bowman, K. P., Homeyer, C. R., and Fenske, T. M.: Ten Year Analysis of Tropopause-Overshooting Convection Using GridRad Data, J. Geophys. Res.-Atmos., 123, 329–343, https://doi.org/10.1002/2017JD027718, 2018. a, b, c, d
Dauhut, T., Noel, V., and Dion, I.-A.: The diurnal cycle of the clouds extending above the tropical tropopause observed by spaceborne lidar, Atmos. Chem. Phys., 20, 3921–3929, https://doi.org/10.5194/acp-20-3921-2020, 2020. a
de Groot-Hedlin, C. D., Hedlin, M. A. H., Hoffmann, L., Alexander, M. J., and Stephan, C. C.: Relationships Between Gravity Waves Observed at Earth's Surface and in the Stratosphere Over the Central and Eastern United States, J. Geophys. Res.-Atmos., 122, 11482–11498, https://doi.org/10.1002/2017JD027159, 2017. a, b
Dee, D. P., Uppala, S. M., Simmons, A. J., Berrisford, P., Poli, P., Kobayashi, S., Andrae, U., Balmaseda, M. A., Balsamo, G., Bauer, P., Bechtold, P., Beljaars, A. C. M., van de Berg, L., Bidlot, J., Bormann, N., Delsol, C., Dragani, R., Fuentes, M., Geer, A. J., Haimberger, L., Healy, S. B., Hersbach, H., Hólm, E. V., Isaksen, L., Kållberg, P., Köhler, M., Matricardi, M., McNally, A. P., Monge-Sanz, B. M., Morcrette, J.-J., Park, B.-K., Peubey, C., de Rosnay, P., Tavolato, C., Thépaut, J.-N., and Vitart, F.: The ERA-Interim reanalysis: configuration and performance of the data assimilation system, Q. J. Roy. Meteor. Soc., 137, 553–597, https://doi.org/10.1002/qj.828, 2011. a
Dessler, A., Ye, H., Wang, T., Schoeberl, M., Oman, L., Douglass, A., Butler, A., Rosenlof, K., Davis, S., and Portmann, R.: Transport of ice into the stratosphere and the humidification of the stratosphere over the 21st century, Geophys. Res. Lett., 43, 2323–2329, https://doi.org/10.1002/2016GL067991, 2016. a
Dessler, A. E., Hintsa, E. J., Weinstock, E. M., Anderson, J. G., and Chan, K. R.: Mechanisms controlling water vapor in the lower stratosphere: “A tale of two stratospheres”, J. Geophys. Res.-Atmos., 100, 23167–23172, https://doi.org/10.1029/95JD02455, 1995. a
Dessler, A. E., Schoeberl, M. R., Wang, T., Davis, S. M., and Rosenlof, K. H.: Stratospheric water vapor feedback, P. Natl. Acad. Sci. USA, 110, 18087–18091, https://doi.org/10.1073/pnas.1310344110, 2013. a
Eckhardt, S., Stohl, A., Wernli, H., James, P., Forster, C., and Spichtinger, N.: A 15-Year Climatology of Warm Conveyor Belts, J. Climate, 17, 218–237, https://doi.org/10.1175/1520-0442(2004)017<0218:AYCOWC>2.0.CO;2, 2004. a
Getzewich, B. J., Vaughan, M. A., Hunt, W. H., Avery, M. A., Powell, K. A., Tackett, J. L., Winker, D. M., Kar, J., Lee, K.-P., and Toth, T. D.: CALIPSO lidar calibration at 532 nm: version 4 daytime algorithm, Atmos. Meas. Tech., 11, 6309–6326, https://doi.org/10.5194/amt-11-6309-2018, 2018. a
Gierens, K., Schumann, U., Helten, M., Smit, H., and Wang, P.-H.: Ice-supersaturated regions and subvisible cirrus in the northern midlatitude upper troposphere, J. Geophys. Res.-Atmos., 105, 22743–22753, https://doi.org/10.1029/2000JD900341, 2000. a
Haag, W. and Kärcher, B.: The impact of aerosols and gravity waves on cirrus clouds at midlatitudes, J. Geophys. Res.-Atmos., 109, D12202, https://doi.org/10.1029/2004JD004579, 2004. a, b
Hanisco, T. F., Moyer, E. J., Weinstock, E. M., St. Clair, J. M., Sayres, D. S., Smith, J. B., Lockwood, R., Anderson, J. G., Dessler, A. E., Keutsch, F. N., Spackman, J. R., Read, W. G., and Bui, T. P.: Observations of deep convective influence on stratospheric water vapor and its isotopic composition, Geophys. Res. Lett., 34, L04814, https://doi.org/10.1029/2006GL027899, 2007. a
Herman, R. L., Ray, E. A., Rosenlof, K. H., Bedka, K. M., Schwartz, M. J., Read, W. G., Troy, R. F., Chin, K., Christensen, L. E., Fu, D., Stachnik, R. A., Bui, T. P., and Dean-Day, J. M.: Enhanced stratospheric water vapor over the summertime continental United States and the role of overshooting convection, Atmos. Chem. Phys., 17, 6113–6124, https://doi.org/10.5194/acp-17-6113-2017, 2017. a
Hoffmann, L.: Reanalysis Tropopause Data Repository, re3data.org – Registry of Research Data Repositories, https://doi.org/10.17616/R31NJMOH, 2020a. a, b
Hoffmann, L.: slcs-jsc/mptrac: v2.0 (Version v2.0), Zenodo, https://doi.org/10.5281/zenodo.4401297, 2020b. a
Hoffmann, L.: AIRS/Aqua Observations of Gravity Waves, re3data.org – Registry of Research Data Repositories, https://doi.org/10.17616/R34J42, 2020c. a
Hoffmann, L. and Alexander, M. J.: Occurrence frequency of convective gravity waves during the North American thunderstorm season, J. Geophys. Res.-Atmos., 115, 20111, https://doi.org/10.1029/2010JD014401, 2010. a, b, c, d, e, f, g, h
Hoffmann, L., Xue, X., and Alexander, M. J.: A global view of stratospheric gravity wave hotspots located with Atmospheric Infrared Sounder observations, J. Geophys. Res.-Atmos., 118, 416–434, https://doi.org/10.1029/2012JD018658, 2013. a, b, c, d, e, f, g, h, i
Hoffmann, L., Alexander, M. J., Clerbaux, C., Grimsdell, A. W., Meyer, C. I., Rößler, T., and Tournier, B.: Intercomparison of stratospheric gravity wave observations with AIRS and IASI, Atmos. Meas. Tech., 7, 4517–4537, https://doi.org/10.5194/amt-7-4517-2014, 2014. a
Hoffmann, L., Rößler, T., Griessbach, S., Heng, Y., and Stein, O.: Lagrangian transport simulations of volcanic sulfur dioxide emissions: Impact of meteorological data products, J. Geophys. Res.-Atmos., 121, 4651–4673, https://doi.org/10.1002/2015JD023749, 2016. a
Hoffmann, L., Spang, R., Orr, A., Alexander, M. J., Holt, L. A., and Stein, O.: A decadal satellite record of gravity wave activity in the lower stratosphere to study polar stratospheric cloud formation, Atmos. Chem. Phys., 17, 2901–2920, https://doi.org/10.5194/acp-17-2901-2017, 2017. a
Hoffmann, L., Wu, X., and Alexander, M. J.: Satellite Observations of Stratospheric Gravity Waves Associated With the Intensification of Tropical Cyclones, Geophys. Res. Lett., 45, 1692–1700, https://doi.org/10.1002/2017GL076123, 2018. a, b
Hoffmann, L., Günther, G., Li, D., Stein, O., Wu, X., Griessbach, S., Heng, Y., Konopka, P., Müller, R., Vogel, B., and Wright, J. S.: From ERA-Interim to ERA5: the considerable impact of ECMWF's next-generation reanalysis on Lagrangian transport simulations, Atmos. Chem. Phys., 19, 3097–3124, https://doi.org/10.5194/acp-19-3097-2019, 2019. a
Homeyer, C. R., Bowman, K. P., and Pan, L. L.: Extratropical tropopause transition layer characteristics from high-resolution sounding data, J. Geophys. Res.-Atmos., 115, D13108, https://doi.org/10.1029/2009JD013664, 2010. a
Homeyer, C. R., Pan, L. L., and Barth, M. C.: Transport from convective overshooting of the extratropical tropopause and the role of large-scale lower stratosphere stability, J. Geophys. Res.-Atmos., 119, 2220–2240, https://doi.org/10.1002/2013JD020931, 2014a. a
Homeyer, C. R., Pan, L. L., Dorsi, S. W., Avallone, L. M., Weinheimer, A. J., O'Brien, A. S., DiGangi, J. P., Zondlo, M. A., Ryerson, T. B., Diskin, G. S., and Campos, T. L.: Convective transport of water vapor into the lower stratosphere observed during double-tropopause events, J. Geophys. Res.-Atmos., 119, 10941–10958, https://doi.org/10.1002/2014JD021485, 2014b. a, b
Homeyer, C. R., McAuliffe, J. D., and Bedka, K. M.: On the Development of Above-Anvil Cirrus Plumes in Extratropical Convection, J. Atmos. Sci., 74, 1617–1633, https://doi.org/10.1175/JAS-D-16-0269.1, 2017. a, b
Hunt, W. H., Vaughan, M. A., Powell, K. A., and Weimer, C.: CALIPSO lidar description and performance assessment, J. Atmos. Ocean. Tech., 26, 1214–1228, https://doi.org/10.1175/2009JTECHA1223.1, 2009. a
Jensen, E. and Pfister, L.: Transport and freeze-drying in the tropical tropopause layer, J. Geophys. Res.-Atmos., 109, D02207, https://doi.org/10.1029/2003JD004022, 2004. a
Jensen, E. J., Toon, O. B., Selkirk, H. B., Spinhirne, J. D., and Schoeberl, M. R.: On the formation and persistence of subvisible cirrus clouds near the tropical tropopause, J. Geophys. Res.-Atmos., 101, 21361–21375, https://doi.org/10.1029/95JD03575, 1996. a
Jensen, E. J., Ueyama, R., Pfister, L., Bui, T. V., Alexander, M. J., Podglajen, A., Hertzog, A., Woods, S., Lawson, R. P., Kim, J.-E., and Schoeberl, M. R.: High-frequency gravity waves and homogeneous ice nucleation in tropical tropopause layer cirrus, Geophys. Res. Lett., 43, 6629–6635, https://doi.org/10.1002/2016GL069426, 2016. a
Keckhut, P., Hauchecorne, A., Bekki, S., Colette, A., David, C., and Jumelet, J.: Indications of thin cirrus clouds in the stratosphere at mid-latitudes, Atmos. Chem. Phys., 5, 3407–3414, https://doi.org/10.5194/acp-5-3407-2005, 2005. a
Kim, J.-E., Alexander, M. J., Bui, T. P., Dean-Day, J. M., Lawson, R. P., Woods, S., Hlavka, D., Pfister, L., and Jensen, E. J.: Ubiquitous influence of waves on tropical high cirrus clouds, Geophys. Res. Lett., 43, 5895–5901, https://doi.org/10.1002/2016GL069293, 2016. a
Kärcher, B. and Podglajen, A.: A Stochastic Representation of Temperature Fluctuations Induced by Mesoscale Gravity Waves, J. Geophys. Res.-Atmos., 124, 11506–11529, https://doi.org/10.1029/2019JD030680, 2019. a
Lelieveld, J., Brühl, C., Jöckel, P., Steil, B., Crutzen, P. J., Fischer, H., Giorgetta, M. A., Hoor, P., Lawrence, M. G., Sausen, R., and Tost, H.: Stratospheric dryness: model simulations and satellite observations, Atmos. Chem. Phys., 7, 1313–1332, https://doi.org/10.5194/acp-7-1313-2007, 2007. a
Liou, K.-N.: Influence of Cirrus Clouds on Weather and Climate Processes: A Global Perspective, Mon. Weather Rev., 114, 1167–1199, https://doi.org/10.1175/1520-0493(1986)114<1167:ioccow>2.0.co;2, 1986. a
Liu, N. and Liu, C.: Global distribution of deep convection reaching tropopause in 1 year GPM observations, J. Geophys. Res.-Atmos., 121, 3824–3842, https://doi.org/10.1002/2015JD024430, 2016. a, b
Liu, N., Liu, C., and Hayden, L.: Climatology and Detection of Overshooting Convection From 4 Years of GPM Precipitation Radar and Passive Microwave Observations, J. Geophys. Res.-Atmos., 125, e2019JD032003, https://doi.org/10.1029/2019JD032003, 2020. a, b
Liu, Z., Kar, J., Zeng, S., Tackett, J., Vaughan, M., Avery, M., Pelon, J., Getzewich, B., Lee, K.-P., Magill, B., Omar, A., Lucker, P., Trepte, C., and Winker, D.: Discriminating between clouds and aerosols in the CALIOP version 4.1 data products, Atmos. Meas. Tech., 12, 703–734, https://doi.org/10.5194/amt-12-703-2019, 2019. a
Massie, S. T., Khosravi, R., and Gille, J. C.: A multidecadal study of cirrus in the tropical tropopause layer, J. Geophys. Res.-Atmos., 118, 7938–7947, https://doi.org/10.1002/jgrd.50596, 2013. a
Munchak, L. A. and Pan, L. L.: Separation of the lapse rate and the cold point tropopauses in the tropics and the resulting impact on cloud top-tropopause relationships, J. Geophys. Res.-Atmos., 119, 7963–7978, https://doi.org/10.1002/2013JD021189, 2014. a
Murgatroyd, R. J. and Goldsmith, P.: High cloud over southern England, Nature, 178, 788, https://doi.org/10.1038/178788a0, 1956. a
Noël, V. and Haeffelin, M.: Midlatitude cirrus clouds and multiple tropopauses from a 2002–2006 climatology over the SIRTA observatory, J. Geophys. Res.-Atmos., 112, D13206, https://doi.org/10.1029/2006JD007753, 2007. a, b, c
Pan, L. L. and Munchak, L. A.: Relationship of cloud top to the tropopause and jet structure from CALIPSO data, J. Geophys. Res.-Atmos., 116, 1–17, https://doi.org/10.1029/2010JD015462, 2011. a, b, c
Pan, L. L., Randel, W. J., Gille, J. C., Hall, W. D., Nardi, B., Massie, S., Yudin, V., Khosravi, R., Konopka, P., and Tarasick, D.: Tropospheric intrusions associated with the secondary tropopause, J. Geophys. Res.-Atmos., 114, D10302, https://doi.org/10.1029/2008JD011374, 2009. a
Petzold, A., Neis, P., Rütimann, M., Rohs, S., Berkes, F., Smit, H. G. J., Krämer, M., Spelten, N., Spichtinger, P., Nédélec, P., and Wahner, A.: Ice-supersaturated air masses in the northern mid-latitudes from regular in situ observations by passenger aircraft: vertical distribution, seasonality and tropospheric fingerprint, Atmos. Chem. Phys., 20, 8157–8179, https://doi.org/10.5194/acp-20-8157-2020, 2020. a
Pittman, J. V., Weinstock, E. M., Oglesby, R. J., Sayres, D. S., Smith, J. B., Anderson, J. G., Cooper, O. R., Wofsy, S. C., Xueref, I., Gerbig, C., Daube, B. C., Richard, E. C., Ridley, B. A., Weinheimer, A. J., Loewenstein, M., Jost, H.-J., Lopez, J. P., Mahoney, M. J., Thompson, T. L., Hargrove, W. W., and Hoffman, F. M.: Transport in the subtropical lowermost stratosphere during the Cirrus Regional Study of Tropical Anvils and Cirrus Layers–Florida Area Cirrus Experiment, J. Geophys. Res.-Atmos., 112, D08304, https://doi.org/10.1029/2006JD007851, 2007. a
Podglajen, A., Plougonven, R., Hertzog, A., and Jensen, E.: Impact of gravity waves on the motion and distribution of atmospheric ice particles, Atmos. Chem. Phys., 18, 10799–10823, https://doi.org/10.5194/acp-18-10799-2018, 2018. a, b
Qu, Z., Huang, Y., Vaillancourt, P. A., Cole, J. N. S., Milbrandt, J. A., Yau, M.-K., Walker, K., and de Grandpré, J.: Simulation of convective moistening of the extratropical lower stratosphere using a numerical weather prediction model, Atmos. Chem. Phys., 20, 2143–2159, https://doi.org/10.5194/acp-20-2143-2020, 2020. a
Roewe, D. and Liou, K.-N.: Influence of Cirrus Clouds on the Infrared Cooling Rate in the Troposphere and Lower Stratosphere, J. Appl. Meteorol., 17, 92–106, https://doi.org/10.1175/1520-0450(1978)017<0092:IOCCOT>2.0.CO;2, 1978. a
Sandhya, M., Sridharan, S., Indira Devi, M., Niranjan, K., and Jayaraman, A.: A case study of formation and maintenance of a lower stratospheric cirrus cloud over the tropics, Ann. Geophys., 33, 599–608, https://doi.org/10.5194/angeo-33-599-2015, 2015. a
Sassen, K. and Campbell, J. R.: A Midlatitude Cirrus Cloud Climatology from the Facility for Atmospheric Remote Sensing. Part I: Macrophysical and Synoptic Properties, J. Atmos. Sci., 58, 481–496, https://doi.org/10.1175/1520-0469(2001)058<0481:AMCCCF>2.0.CO;2, 2001. a
Schoeberl, M. R., Jensen, E. J., Pfister, L., Ueyama, R., Wang, T., Selkirk, H., Avery, M., Thornberry, T., and Dessler, A. E.: Water Vapor, Clouds, and Saturation in the Tropical Tropopause Layer, J. Geophys. Res.-Atmos., 124, 3984–4003, https://doi.org/10.1029/2018JD029849, 2019. a
Sherwood, S. C. and Dessler, A. E.: A Model for Transport across the Tropical Tropopause, J. Atmos. Sci., 58, 765–779, https://doi.org/10.1175/1520-0469(2001)058<0765:AMFTAT>2.0.CO;2, 2001. a
Smith, J. B., Wilmouth, D. M., Bedka, K. M., Bowman, K. P., Homeyer, C. R., Dykema, J. A., Sargent, M. R., Clapp, C. E., Leroy, S. S., Sayres, D. S., Dean-Day, J. M., Paul Bui, T., and Anderson, J. G.: A case study of convectively sourced water vapor observed in the overworld stratosphere over the United States, J. Geophys. Res.-Atmos., 122, 9529–9554, https://doi.org/10.1002/2017JD026831, 2017. a
Solomon, D. L., Bowman, K. P., and Homeyer, C. R.: Tropopause-Penetrating Convection from Three-Dimensional Gridded NEXRAD Data, J. Appl. Meteorol. Clim., 55, 465–478, https://doi.org/10.1175/JAMC-D-15-0190.1, 2016. a, b, c
Spang, R., Günther, G., Riese, M., Hoffmann, L., Müller, R., and Griessbach, S.: Satellite observations of cirrus clouds in the Northern Hemisphere lowermost stratosphere, Atmos. Chem. Phys., 15, 927–950, https://doi.org/10.5194/acp-15-927-2015, 2015. a, b, c, d, e, f, g
Ueyama, R., Jensen, E. J., Pfister, L., and Kim, J.-E.: Dynamical, convective, and microphysical control on wintertime distributions of water vapor and clouds in the tropical tropopause layer, J. Geophys. Res.-Atmos., 120, 10483–10500, https://doi.org/10.1002/2015JD023318, 2015. a
Wang, P. K.: Moisture plumes above thunderstorm anvils and their contributions to cross-tropopause transport of water vapor in midlatitudes, J. Geophys. Res.-Atmos., 108, 4194, https://doi.org/10.1029/2002JD002581, 2003. a
Weinstock, E. M., Pittman, J. V., Sayres, D. S., Smith, J. B., Anderson, J. G., Wofsy, S. C., Xueref, I., Gerbig, C., Daube, B. C., Pfister, L., Richard, E. C., Ridley, B. A., Weinheimer, A. J., Jost, H.-J., Lopez, J. P., Loewenstein, M., and Thompson, T. L.: Quantifying the impact of the North American monsoon and deep midlatitude convection on the subtropical lowermost stratosphere using in situ measurements, J. Geophys. Res.-Atmos., 112, D18310, https://doi.org/10.1029/2007JD008554, 2007. a
Winker, D. M. and Trepte, C. R.: Laminar cirrus observed near the tropical tropopause by LITE, Geophys. Res. Lett., 25, 3351–3354, https://doi.org/10.1029/98GL01292, 1998. a
Winker, D. M., Hunt, W. H., and McGill, M. J.: Initial performance assessment of CALIOP, Geophys. Res. Lett., 34, L19803, https://doi.org/10.1029/2007GL030135, 2007. a
Winker, D. M., Vaughan, M. A., Omar, A., Hu, Y., Powell, K. A., Liu, Z., Hunt, W. H., and Young, S. A.: Overview of the CALIPSO mission and CALIOP data processing algorithms, J. Atmos. Ocean. Tech., 26, 2310–2323, https://doi.org/10.1175/2009JTECHA1281.1, 2009. a, b
WMO: Meteorology-a three-dimensional science:Second session for the commisstion for aerology, WMO Bulletin, 6, 134–138, 1957. a
Wylie, D., Jackson, D. L., Menzel, W. P., and Bates, J. J.: Trends in global cloud cover in two decades of HIRS observations, J. Climate, 18, 3021–3031, https://doi.org/10.1175/JCLI3461.1, 2005. a
Wylie, D. P., Menzel, W. P., Woolf, H. M., and Strabala, K. I.: Four years of global cirrus cloud statistics using HIRS, J. Climate, 7, 1972–1986, https://doi.org/10.1175/1520-0442(1994)007<1972:FYOGCC>2.0.CO;2, 1994. a
Xian, T. and Homeyer, C. R.: Global tropopause altitudes in radiosondes and reanalyses, Atmos. Chem. Phys., 19, 5661–5678, https://doi.org/10.5194/acp-19-5661-2019, 2019. a
Young, S. A., Vaughan, M. A., Garnier, A., Tackett, J. L., Lambeth, J. D., and Powell, K. A.: Extinction and optical depth retrievals for CALIPSO's Version 4 data release, Atmos. Meas. Tech., 11, 5701–5727, https://doi.org/10.5194/amt-11-5701-2018, 2018. a
Yu, W., Dessler, A. E., Park, M., and Jensen, E. J.: Influence of convection on stratospheric water vapor in the North American monsoon region, Atmos. Chem. Phys., 20, 12153–12161, https://doi.org/10.5194/acp-20-12153-2020, 2020. a
Yue, J., Hoffmann, L., and Joan Alexander, M.: Simultaneous observations of convective gravity waves from a ground-based airglow imager and the AIRS satellite experiment, J. Geophys. Res.-Atmos., 118, 3178–3191, https://doi.org/10.1002/jgrd.50341, 2013. a
Zhou, C., Dessler, A. E., Zelinka, M. D., Yang, P., and Wang, T.: Cirrus feedback on interannual climate fluctuations, Geophys. Res. Lett., 41, 9166–9173, https://doi.org/10.1002/2014GL062095, 2014. a
Zou, L., Griessbach, S., Hoffmann, L., Gong, B., and Wang, L.: Revisiting global satellite observations of stratospheric cirrus clouds, Atmos. Chem. Phys., 20, 9939–9959, https://doi.org/10.5194/acp-20-9939-2020, 2020. a, b, c, d, e, f