the Creative Commons Attribution 4.0 License.
the Creative Commons Attribution 4.0 License.
Precipitation enhancement in stratocumulus clouds through airborne seeding: sensitivity analysis by UCLALES-SALSA
Ali Afzalifar
Harri Kokkola
Tomi Raatikainen
Hannele Korhonen
Sami Romakkaniemi
Artificial enhancement of precipitation via hygroscopic cloud seeding is investigated with a numerical large-eddy simulation model coupled with a spectral aerosol–cloud microphysics module. We focus our investigation on marine stratocumulus clouds and evaluate our model results by comparing them with recently published results from field observations. Creating multiple realizations of a single cloud event with the model provides a robust method to detect and attribute the seeding effects, which reinforces the analysis based on experimental data. Owing to the detailed representation of aerosol–cloud interactions, our model successfully reproduces the microphysical signatures attributed to the seeding, which were also seen in the observations. Moreover, the model simulations show up to a 2–3-fold increase in the precipitation flux due to the seeding, depending on the seeding rate and injection strategy. However, our simulations suggest that a relatively high seeding particle emission rate is needed for a substantial increase in the precipitation yield, compared with the estimated seeding concentrations from the field campaign. In practical applications, the seeding aerosol is often produced by flare burning. It is speculated that the required number of large seeding particles suggested by our results could pose a technical challenge to the flare-based approach.
- Article
(3270 KB) - Full-text XML
- BibTeX
- EndNote
Water scarcity is a cause for increasing concern in arid and semi-arid regions (WWAP, 2019). This has revived the interest in research and investments in weather modification efforts, particularly those related to precipitation enhancement (Flossmann et al., 2019). One of the prominent methods is to purposely introduce large hygroscopic particles into a cloud, which act as cloud condensation nuclei (CCN) and are expected to enhance the growth of droplets and therefore the production of drizzle and precipitation (Bruintjes, 1999; Kuba and Murakami, 2010; Rosenfeld et al., 2010). In spite of numerous experiments on hygroscopic cloud seeding (e.g. Cotton, 1982; Bigg, 1997; Ghate et al., 2007; Jung et al., 2015), estimates of its effect on rainfall are still very uncertain. Given the present consumption rate, the problem of water shortage will most likely become worse, urging for more systematic research efforts to improve the scientific basis for understanding the effects of seeding with hygroscopic particles.
Attribution of observed effects to artificial perturbations is an intrinsic issue in most field experiments investigating weather modification methods, which makes it difficult to reach a consensus about their applicability. In the case of precipitation enhancement, it is often problematic to detect the precipitation response to seeding and, in particular, to distinguish it from meteorological variations (Flossmann et al., 2019). Field experiments only provide a single realization of an event: as soon as the cloud is seeded, the reference point is lost, causing it to be very difficult to estimate the unperturbed precipitation rate. This challenges the reproducibility of results from cloud seeding field experiments. Instead, modelling studies provide the advantage of generating multiple realizations of each scenario, and, with a carefully planned setup, the experiments are reproducible. Cloud-resolving models comprise an important source of information to complement field campaign studies, as they provide a highly controlled environment for repeatable experiments to estimate the seeding effects, which helps to tackle the attribution issue. In this paper, we employ a cloud-resolving large-eddy model with sophisticated representation of aerosol–cloud microphysics to study the effects of seeding in marine stratocumulus clouds, which arguably provide the simplest environment to untangle the governing microphysical processes.
The way in which hygroscopic cloud seeding is expected to influence precipitation is closely related to the effects of naturally occurring giant CCN (GCCN; diameter larger than 1 µm) and can therefore be considered as being part of the ongoing efforts to understand the aerosol–cloud interactions. In marine boundary layers, GCCN consisting of sea salt are a prominent feature (Jensen and Lee, 2008; Bian et al., 2019). Due to their initial size and the large amount of soluble material, GCCN grow relatively fast in saturated conditions by water condensation and may continue to grow even in a slightly sub-saturated environment (Jensen and Nugent, 2017). The presence of GCCN in a cloudy boundary layer has been noted for increasing the mean droplet size and producing higher amounts of precipitation in both experimental (e.g. Lehahn et al., 2011; Dadashazar et al., 2017) and modelling studies (Feingold et al., 1999; Jensen and Lee, 2008; Jensen and Nugent, 2017). The effect of GCCN is caused by two different microphysical mechanisms. First, they suppress the maximum supersaturation during droplet formation due to their water uptake and thus decrease the total number of cloud droplets. This will yield on average larger droplets and potentially faster precipitation formation. Second, hydrated GCCN increase the width of the cloud droplet size distribution and are thus expected to enhance the collision–coalescence process, leading to an increase in precipitation. Additionally, very large wetted GCCN particles may directly contribute to precipitation by acting as raindrop embryos. These processes lay the basic foundation for the hypothesis of hygroscopic cloud seeding to enhance rainfall as well (Kuba and Murakami, 2010; Rosenfeld et al., 2010). The seeding particles, most often delivered to the cloud layer via an aircraft, are typically released by burning flares or from containers with pre-manufactured milled salt powder (e.g. Jung et al., 2015). It is generally agreed that the seeding particles need to be in the size range of several micrometres in order to be effective in warm clouds (Segal et al., 2004; Rosenfeld et al., 2010). However, the specific outcome will presumably also depend on the properties of the background aerosol as well as on the turbulence characteristics of the cloud (Chen et al., 2020).
In the current work we explore the sensitivity of drizzle and precipitation in marine stratocumulus to hygroscopic cloud seeding using the UCLALES-SALSA (Tonttila et al., 2017) large-eddy model. This modelling package combines the UCLA Large-Eddy Simulation code (UCLALES; Stevens et al., 2005) with the highly detailed microphysical representation by the Sectional Aerosol module for Large-Scale Applications (SALSA; Kokkola et al., 2008). We will investigate the seeding effects in a marine stratocumulus setting based on measurements from a recent field campaign study (Jung et al., 2015). The results serve the purpose of evaluating the ability of our modelling platform to reproduce the observed microphysical effects as well as to map the importance of the seeding injection strategy and emission rate in terms of the precipitation yield. The remainder of this article continues with the description of the current version of the UCLALES-SALSA model in Sect. 2. The experimental setup for the model and the specific settings applied in the simulations are summarized in Sect. 3 followed by a description of the results in Sect. 4. Conclusions are drawn together with some further discussion in Sect. 5.
UCLALES-SALSA (Tonttila et al., 2017) is built around the well-established UCLALES (Stevens et al., 2005) large-eddy simulation (LES) code, which comprises a modelling platform for idealized cloud simulations. The model uses a three-dimensional computational mesh with cyclic lateral boundary conditions, including a prognostic description of the three Cartesian wind components. The advection of momentum is based on fourth-order difference equations with a time stepping scheme based on the leapfrog method. The prognostic scalar variables include the liquid water potential temperature and variables describing water vapour and condensate amounts, depending on the model configuration. The scalar advection uses a second-order flux-limited scheme, and the time integration is performed with a simple Eulerian forward time stepping method.
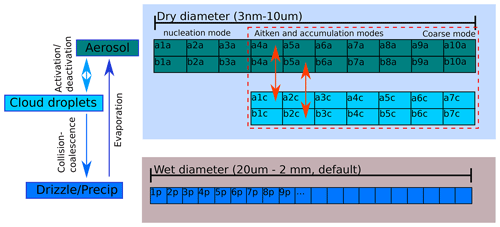
Figure 1Schematic illustration of the microphysical interactions between the binned size distributions of different particle categories implemented in SALSA.
The aerosol and cloud microphysics are represented by the SALSA module. The design of SALSA is described in detail in Kokkola et al. (2008) and Tonttila et al. (2017), but key features are also summarized below, including a description of some important updates. The general layout of the current SALSA module is illustrated in Fig. 1. SALSA is a bin microphysics model, describing the size distribution and composition of particles in up to four different categories: aerosol particles, two sets of liquid hydrometeors (cloud droplets and a separate regime dedicated for droplets and precipitation dominated by collision–coalescence growth) and ice (not used in the current work and thus not shown in Fig. 1). For aerosol particles and cloud droplets, it is possible to use two parallel sets of bins in order to describe externally mixed aerosol populations with separate size distributions.
For particle composition (in all categories), the model uses up to five different aerosol constituents (sulfate, sea salt, organic carbon, black carbon, dust) plus water. Each parameter (particle number and mass of each constituent) in each bin comprises a prognostic scalar variable in UCLALES-SALSA. The model solves all the key microphysical processes for all particle categories, including cloud activation, coagulation and collection processes as well as the condensation of water vapour on both aerosol particles and hydrometeors (see Tonttila et al., 2017, for further details).
The design of SALSA is an attempt (1) to find a compromise between computational cost and model accuracy and, in particular, (2) to be able to track both the non-activated and activated particle populations. The latter is fulfilled by setting both the aerosol and cloud droplet bin limits according to the dry aerosol or CCN particle diameter, as illustrated in Fig. 1. This allows the preservation of the characteristics of the aerosol size distribution at the aerosol–cloud droplet interface. As seen in past model experiments (Tonttila et al., 2017; Boutle et al., 2018), it also provides an adequate description of the droplet size in order to solve the in-cloud microphysical processes. The ability to track the aerosol size distribution inside and outside of clouds brings the model a step further from more straight-forward 1D bin model designs, where information about activated aerosol is not explicitly tracked. This is also a very important feature for this study, since tracking the evolution of the seeding particles within the cloud is key in order to capture their influence on cloud microphysics and rain formation as well as to analyse and understand the underlying processes.
An important upgrade not described in previous papers concerns the description of precipitation. In the current version, the size distribution for drizzle and rain is described by 20 mass-doubling bins (in the wet diameter space) starting from 20 µm. Moreover, instead of a parameterized autoconversion process, we now determine the transition from cloud droplet to drizzle regime directly from the coagulation code. If the droplet diameter resulting from the collision–coalescence between two cloud droplets exceeds the 20 µm limit, the outcome is moved to a drizzle bin with appropriate diameter range. Obviously, the 20 µm limit separating cloud droplets and drizzle is quite small. The decision for this limit was made in favour of more accurate resolution of the droplet size in wet diameter space, where the droplet growth begins to be dominated by collision–coalescence. This helps to ensure a smooth transition from cloud droplets through intermediately sized drizzle (Glienke et al., 2017) to full sized drizzle drops and eventually rain. It also provides a more accurate method to describe the growth and transport of GCCN particles within the diameter space than what was possible with the previously used parameterized autoconversion method (Tonttila et al., 2017).
Marine stratocumulus clouds have been used as the setting for numerous field experiments looking into aerosol–cloud interactions. In a recent study (Jung et al., 2015, henceforward J15), precipitation enhancement by hygroscopic cloud seeding was investigated from airborne observations that took place southwest of Monterey, California, on 3 August 2011. We will use this case as the basis for the model experiments in this paper. The meteorological data and aerosol characteristics presented in J15 are used to provide the initial conditions for UCLALES-SALSA. We exploit this setup to investigate the ability of UCLALES-SALSA to simulate the cloud microphysical response to hygroscopic seeding in a series of experiments, consisting of a control run and three cloud seeding runs with different seeding strategies, whose details are outlined below.
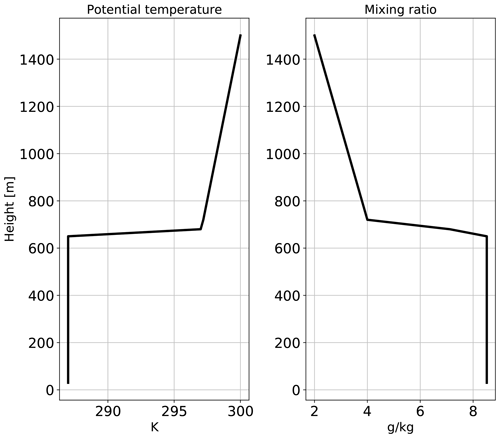
Figure 2Input profiles of potential temperature and total water mixing ratio. The layer from approximately 300 to 650 m is saturated.
3.1 Initial conditions
The measurements reported in J15 took place starting from 16:00 UTC. We match the model time with this period, which mainly affects the radiative budget at cloud top via the solar zenith angle. The initial profiles of potential temperature and the total water mixing ratio are shown in Fig. 2, where the moisture profile is saturated between the levels of approximately 300 and 650 m. The strength of the potential temperature inversion at the top of the cloud (after condensation of the excess moisture from Fig. 2) is approximately 8.5 K. For simplicity, the horizontal wind is initialized to m s−1 and v=0 m s−1, following the standard meteorological notation, which corresponds to the observed wind speed in J15. Surface energy fluxes and the large-scale subsidence are prescribed as constants according to Ackerman et al. (2009) based on stratocumulus clouds observed in comparable conditions in a similar regime. The fluxes of latent and sensible heat are set as 93 and 16 W m−2, respectively, while the subsidence is described by the divergence of horizontal winds set as s−1. The model grid resolution is set to 50 m (10 m in the vertical) and the domain size is 5 km across laterally, extending up to 1400 m in the vertical. A damping layer is applied in the top 100 m of the model grid to prevent unwanted wave propagation. The model time step is 1 s.
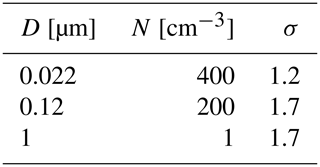
The initial aerosol size distribution is described in the model as a sum of lognormal modes. J15 reported the accumulation mode aerosol concentration in the range of 200 to 800 cm−3, with cloud droplet number concentration (CDNC) of approximately 150–200 cm−3. Therefore, we set the initial accumulation mode concentration to 200 cm−3. An additional 400 cm−3 particles were allocated in the Aitken mode, which can be viewed as a typical feature in the marine boundary layer (e.g. Zheng et al., 2018). However, for the current setup, the Aitken mode particles reside mostly below the critical size for droplet activation – pilot test runs showed little sensitivity in the results for the Aitken mode number concentration. In addition, natural GCCN particles consisting of sea salt, which are virtually omnipresent in marine boundary layers (Jensen and Nugent, 2017) and also seen by J15, were assigned to the background aerosol, with a mode diameter at 1 µm and concentration at 1 cm−3. The lognormal size distribution parameters for the initial model aerosol population are summarized in Table 1.
3.2 Cloud seeding
For the seeding aerosol, we use sea salt as a proxy for the particle composition. We use SALSA’s parallel bin regimes to describe the seeding aerosol initially as externally mixed from the background. The seeding aerosol is then allowed to interact with the background particles through coagulation and cloud collection. We will assume two modes for the seeding particles, with mean diameters at 1.5 and 8 µm, which roughly correspond to the mode mean diameters shown in J15, but they are also more generally representative of the powdered salt size ranges presumed effective in terms of precipitation enhancement (Rosenfeld et al., 2010).
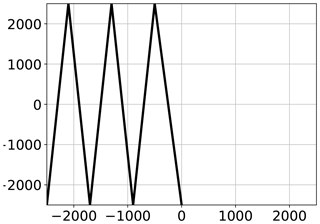
In the model experiments, the seeding emissions are performed in cloud, near the cloud-top altitude, at approximately 580 m, as in J15. Two methods for the release of the seeding particles are considered: (i) a domain-wide instantaneous injection of the aerosol at the specified layer and (ii) an explicit Lagrangian point source emission. In the former, the particles are assumed to occupy a layer of 50 m in depth. This seeding method does not represent a realistic scenario and serves to provide additional information about the importance of the total emitted mass in terms of the magnitude of the seeding effect. For the latter, the trajectory and speed of the emission source are prescribed for a more realistic seeding scenario. We assume the seeding aerosol plume to immediately occupy a vertical cross section of 50×50 m2. Further dilution of the plume is controlled dominantly by grid-scale mixing. To mimic the airborne emissions, we assume a speed of 60 m s−1 for the source, whose trajectory is illustrated in Fig. 3. The seeding source propagates towards the positive x direction along a trajectory that covers the entire extent of the domain in the y direction. Since the seeding proceeds against the horizontal wind (in the x direction), the seeding is stopped at the middle of the domain. This is to avoid seeding the same plume twice, because the rear of the plume is advected back into the domain from the right due to the cyclic boundary conditions.
3.3 Model experiments
Our experimental strategy is to create two parallel sets of realizations: a control simulation without seeding (referred to as Ctrl) and a set of experiments with seeding particle emissions. This allows us to account for both the direct microphysical effects and the dynamical feedbacks potentially caused by the aerosol perturbation. We must take care that the initial states for the control simulations and seeding experiments are identical. Therefore, a “master” model run is performed, from which the model state is saved to a “restart” file prior to the time of the seeding procedure. The length of the master run is 4 h, to allow the boundary-layer mixing and precipitation process to settle in a quasi-steady state (i.e. spinup). All our model experiments, including both the control and seeding experiments, are initialized from this restart file, which ensures that any differences in the experiments can be attributed directly to the seeding.
Table 2List of model experiments, including the seeding particle injection method and the lognormal size distribution parameters for seeding. Subscripts 1 and 2 refer to the two lognormal modes used for the seeding aerosol. D is the mode mean diameter, N is the mode concentration and σ is the geometric standard deviation.

n/a: not applicable
The main model experiments performed in this study are summarized in Table 2. The seeding experiments Seed1 and Seed2 use the moving point emission source along the trajectory shown in Fig. 3. The total seeding rate in the former experiment is set as and in the latter as . With the assumed injection plume cross section and the aircraft speed, this yields initial concentrations of approximately 1 and 10 cm−3, respectively, which will be rather quickly diluted by in-cloud mixing and drizzle formation. These settings were chosen in terms of the seeding particle concentrations in the mixed plume, as it depends strongly on the assumed injection cross section. We set the target concentration after mixing to be similar to the estimated range in J15 (10−4 to ), as shown in Sect. 4. Please note that while the injection procedure in Seed1 and Seed2 tries to mimic the aircraft emission, we do not consider the possible aerodynamic effects caused by the aircraft. In the experiment Seed3 the seeding particles are injected instantaneously in a domain-wide slab at the same altitude as the point emissions in Seed1 and Seed2. The initial concentration in Seed3 is set as 1 cm−3.
In addition to the main experiments, a small ensemble of sensitivity tests are performed based on the Ctrl and Seed2 configurations, where we vary the boundary-layer moisture content and the large-scale divergence settings between the ensemble members randomly within ±10 % of the values used in the corresponding main experiments. The ensemble has 20 members (i.e. pairs of simulations with the Ctrl and Seed2 configurations), whose purpose is to characterize the sensitivity of the seeding results to the model initial conditions. The data are used to investigate process rate statistics as well, which tend to be highly variable in space and time. However, these sensitivity tests obviously do not provide an exhaustive representation of the different sensitivities of the seeding process, which should be tackled with dedicated research.
3.4 Sensitivity of precipitation
The precipitation rate in the simulated case is overall rather low in both the model and observations: the observed estimate reported in J15 is about 0.04 mm h−1 on average, sampled around the cloud base height. In order to estimate the significance of the seeding effects in UCLALES-SALSA relative to the findings in J15, we want to match the simulated precipitation rate as closely as possible to the measurements. We find that in the current case, the precipitation rate is strongly controlled by three key aspects in the model setup: the background aerosol, the vertical resolution and the prescribed subsidence rate. For the former, we focus here on the role of natural GCCN, due to their overall small concentration but potentially strong impact on drizzle formation. For the middle, the vertical resolution of the model is known to have a substantial influence on the representation of entrainment mixing at cloud top (Stevens et al., 2005). This is expected to modulate the rate of evaporation of cloud droplets due to the entrained dry air from above the cloud, which affects the mean droplet size and the size distribution width and, therefore, drizzle formation via the collision–coalescence process. Lastly, the subsidence rate is known to impact precipitation formation due to effects on cloud thickness and, thus, droplet growth (Chen et al., 2011). Pilot model simulations are performed to test the corresponding choices made in our simulation setup.
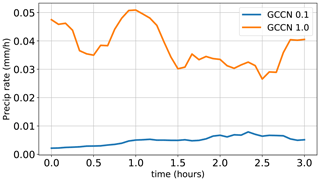
Figure 4Effect of GCCN on precipitation rate close to cloud base (300 m). Precipitation rate is shown for low (0.1 cm−3; blue) and high (1.0 cm−3; orange) GCCN concentrations as a function of time (since the end of spinup).
First, Fig. 4 illustrates the effect of GCCN concentration on the simulated precipitation in pilot experiments. With 1 cm−3 (used in the experiments), we obtain a precipitation rate much closer to the observed estimate than with a lower concentration (0.1 cm−3). Similar concentrations of GCCN were also measured in the field campaign according to J15, and the good agreement with the observed precipitation rate (0.04 mm h−1) warrants the use of the background aerosol size distribution detailed in Table 1.
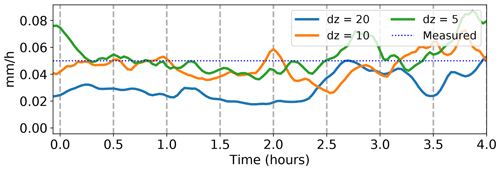
Figure 5Effect of vertical resolution on the mean precipitation flux close to cloud base (300 m) as a function of time (since the end of spinup). The dashed blue line shows the corresponding precipitation rate estimated in J15.
Second, Fig. 5 shows the effect of vertical resolution on the simulated precipitation rate. It is evident that 20 m spacing in the model vertical grid yields a lower precipitation rate, than the simulations with 5 or 10 m grid spacings. That said, the difference seen between 5 and 10 m grid spacings is minor. Even though 10 m resolution has been shown to be inadequate to fully represent the effects of entrainment mixing (Stevens et al., 2005), considering this result and the fact that the UCLALES-SALSA is computationally a rather expensive model, we find that the 10 m vertical grid spacing is justified.
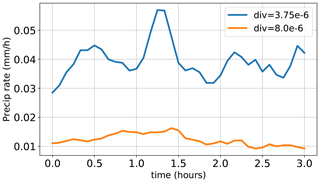
Figure 6Effect of large-scale divergence on the mean precipitation rate close to cloud base (300 m) as a function of time (since the end of spinup).
Third, Fig. 6 presents the precipitation rate with the large-scale divergence rate selected for our simulations (; Ackerman et al., 2009) and a higher value representing stronger subsidence (, as in Chen et al., 2011). The results indeed indicate that the precipitation rate is quite sensitive to the subsidence, similar to Chen et al. (2011), and that the lower setting yields precipitation rates much closer to the measurements reported in J15.
4.1 Seeding effects on precipitation and cloud properties
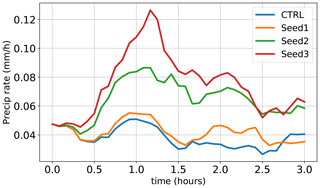
Figure 7 shows the flux of precipitating water sampled at an altitude of 300 m, which is close to the cloud base height (around 250 m after the seeding). In the control case, the precipitation rate is approximately 0.03–0.05 mm h−1, which agrees well with the corresponding measured precipitation rate in J15. It is evident that the seeding emission rate and seeding strategy have a strong influence on the seeding efficiency. The experiment Seed1 (with a low emission rate) yields a positive but rather weak signal in terms of the precipitation flux. Instead, Seed2 (with high emission rate) approximately doubles the precipitation flux within an hour after the start of the seeding, compared to the control run. Likewise, an even stronger (by a factor of 3) increase in precipitation is shown by Seed3, where the initial seeding concentration is the same as in Seed1, but the total injected mass is much larger because it is applied to all grid points across the target layer. Therefore, it is important to consider the impact of the seeding strategy on the mixed plume concentration.
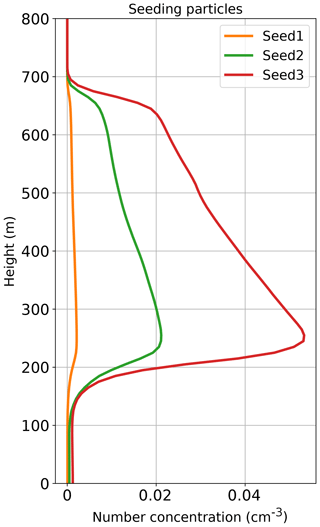
Figure 8Domain mean profile of seeding particle concentrations 15 min after their release in the seeding experiments. The concentrations are estimated using the number of cloud droplets activated by the seeding particles.
Figure 8 shows the estimated domain mean profiles of the seeding particle concentration. Since the seeding takes place in cloud, practically all the particles are activated very quickly. Therefore, the concentration is analysed using the number of cloud droplets activated by the seeding particles, 15 min after the seeding. This gives the plumes some time to mix; with further delay, the plume concentration starts to be more and more affected by precipitation, after which it is difficult to robustly distinguish the particles associated with seeding in our modelling setup. Moreover, taking the profile as domain average is justified because the trajectory of the source in Seed1 and Seed2 is set to cover the entire width of the domain in the y direction, as depicted in Fig. 3, and it takes approximately 10–15 min after the seeding injection for the turbulent diffusion to spread the seeding particles across the domain area. As indicated in Fig. 8, clearly the highest average concentration is seen for Seed3 and the lowest for Seed1, which indeed emphasizes the connection between the plume concentration and the seeding effects. The mean of the Seed2 profile in Fig. 8 suggests that in order to produce an approximately 2-fold precipitation yield, the concentration of seeding particles mixed in the cloud layer should be on the order of 0.01 cm−3.
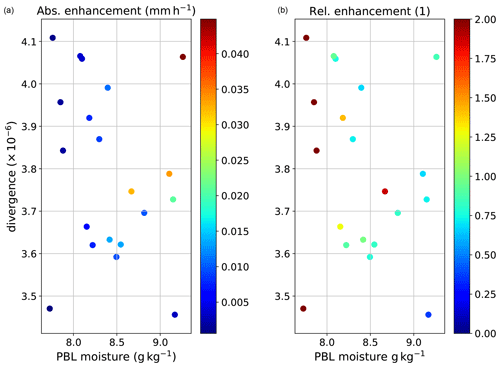
Figure 9Precipitation enhancement (between the Ctrl and Seed2 configurations) in a simulation ensemble as a function of the prescribed large-scale subsidence and initial boundary-layer moisture content. Panel (a) shows the absolute enhancement, while panel (b) shows the relative enhancement in the precipitation rate. The dots correspond to a domain mean in each ensemble member.
As briefly discussed in Sect. 3.4, modelling precipitation is sensitive to various aspects of the model setup and the initial conditions, which yield uncertainties in the simulations. These uncertainties are thus part of the estimated seeding effects as well, which we test based on the ensemble simulations performed using the Ctrl and Seed2 configurations, varying the input boundary-layer moisture content and the large-scale subsidence rate. Figure 9 shows the absolute and relative precipitation enhancements between the two model configurations for each ensemble member. The seeding effects are somewhat sensitive to the boundary-layer moisture content, with the absolute precipitation enhancement increasing with increasing moisture (and the overall precipitation rate). In terms of the relative enhancement, the conclusion is nearly opposite, with the largest relative enhancement seen with the driest boundary layer (associated with low precipitation rates). Considerably less sensitivity is found to varying subsidence within the ±10 % range, although the precipitation rate did show sensitivity to larger changes in subsidence (Fig. 6).
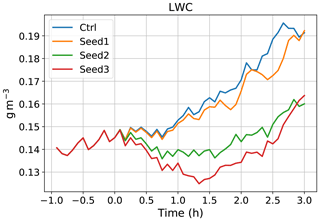
Figure 10Evolution of the mean LWC in the Ctrl simulation and the seeding experiments sampled at 300 m height. The time on the x axis is relative to the seeding injection time.
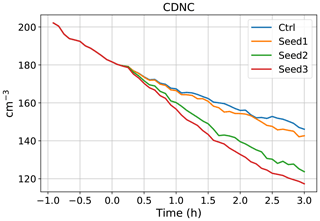
Figure 11Evolution of CDNC in the Ctrl simulation and seeding experiments in a similar presentation to Fig. 10.
The model simulations tend to overestimate the liquid water content (LWC) compared to the observed values: as indicated in Fig. 10, the simulated LWC is around the 0.14–0.15 g m−3 range near the cloud base, while the corresponding estimate in J15 is 0.09 g m−3. However, both our simulations and the reports in J15 indicate quite substantial variability in these values, and the result varies strongly depending on how deep into the cloud layer the sampling is performed. The layer at 300 m is chosen for sampling, which is close to cloud base but remains consistently in cloud. Figure 10 suggests an increasing reduction in LWC with increasing seeding emission, which is qualitatively in agreement with the findings in J15. Further, the simulated CDNC shown in Fig. 11 is within the range, albeit slightly above the mean, reported by J15 around the time of the seeding (simulated mean approximately 180 cm−3 vs. the observed mean 162 cm−3), although again the variability is substantial in both estimates. The model CDNC shows a decreasing slope, which we attribute mainly to cloud processing and the gradual scavenging of the CCN particles (there is no replenishment of aerosol in our simulations). The seeding experiments show a clear decrease in CDNC compared to the Ctrl configuration. However, in the model the effect is not as strong as the decrease reported in J15 (i.e. from 162 to 77 cm−3 near cloud base).
4.2 Microphysical signatures
The main hypothesized pathways to precipitation enhancement via hygroscopic seeding in warm low-level clouds include (1) the reduction of CDNC due to increased competition for water vapour induced by the large seeding particles and (2) enhanced collision–coalescence (Segal et al., 2004; Rosenfeld et al., 2010). Thus, to better understand the reasons for the simulated precipitation enhancement shown in Fig. 7, we will analyse more closely the cloud microphysical effects induced by the seeding.
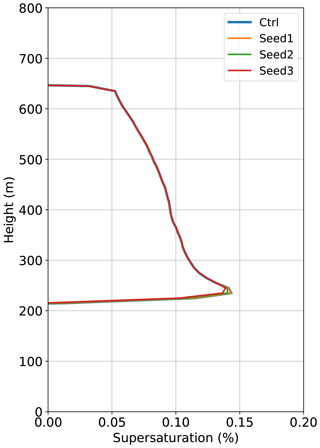
Figure 12Vertical profiles of supersaturation averaged over areas of positive vertical velocity in the Ctrl simulation and seeding experiments 15 min after the seeding.
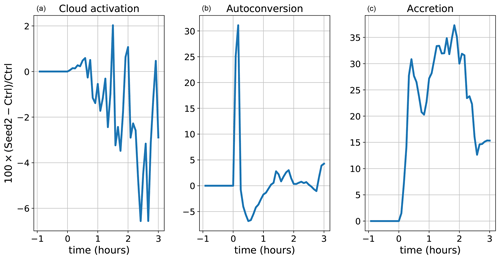
Figure 13Relative change in process rates between the Ctrl and Seed2 configurations in percent, calculated from the mean values taken across the ensemble simulations as a function of time (since the seeding injection). Starting from the left, the panels show (a) the change in cloud activation, (b) autoconversion (drizzle formation) and (c) accretion rates.
To start with, our model shows very little change in the in-cloud supersaturation between the experiments, as shown in Fig. 12, sampled 15 min after seeding. As most of the ambient aerosol is activated close to the cloud base at the level of the peak supersaturation, Fig. 12 gives the first indication that the seeding effect through water vapour competition is likely of minor importance in our simulations. In order to find proof for this, we analyse the microphysical process rates. The process rates exhibit substantial spatial and temporal variability, so they are analysed using the ensemble simulations, taking the mean across the ensemble members. Figure 13 shows the ensemble mean relative changes between the Ctrl and Seed2 configurations for the rates of cloud activation, autoconversion and accretion. Note that the latter two are calculated directly by the coagulation scheme of UCLALES-SALSA and therefore the rates are diagnosed during model runtime as the water mass transferred from cloud droplet bins to drizzle/precipitation bins and as the mass collected by the drizzle and raindrops from other liquid droplet size classes. Consequently, since these processes are not described by dedicated parameterizations in our model, the corresponding rates are most likely not directly comparable with results from other microphysics schemes that do employ dedicated parameterizations. Nevertheless, Fig. 13 generally corroborates the interpretation suggested by the supersaturation profiles: the cloud activation rate shows only a modest decrease (by up to 6 %), which is gradually enhanced over the course of 2–3 h (almost until the end of the simulation). The gradual change hints that instead of a direct seeding effect via the water vapour competition, the difference is most likely caused by the enhanced scavenging of CCN particles between the Ctrl and Seed2 configurations. In contrast, the autoconversion rate shows a substantial and sharp increase at the time of the seeding (up to 30 %), which lasts for about half an hour. Afterwards, the accretion rate shows an increase in comparable magnitude, which indicates that after the peaked autoconversion rate, the effect of seeding is shifted from the collision–coalescence mode between cloud droplets to more of a droplet collection type of growth mode controlled by the existing drizzle-sized droplets and rain. The latter also shows a prolonged effect seen until the end of the simulation. Therefore, enhanced collision rate between droplets is most likely the main pathway for the seeding-induced precipitation enhancement according to the model results.
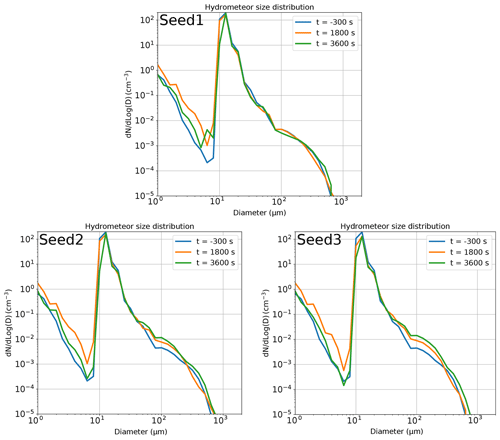
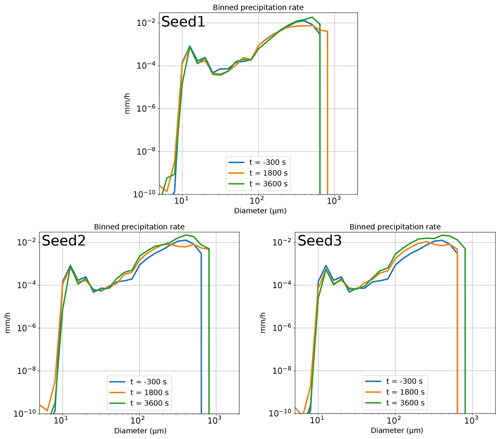
Figure 14Hydrometeor size distributions close to cloud base (300 m altitude) before (−300 s) and after (1800 and 3600 s) the particle injection in the seeding experiments.
More details on the effects of seeding on the cloud microphysical properties are obtained by plotting the hydrometeor size distributions in the seeding experiments before and after the time of the seeding emission in Fig. 14. The size distributions are sampled in cloud at 300 m altitude, close to the cloud base height. While the size distributions show negligible changes in the experiment Seed1, in Seed2 and Seed3 there is clearly an increase in the concentration of droplets around the 100–200 µm size range after seeding. After 1 h, there is also a definite increase in the concentration of larger hydrometeors (>500 µm), pointing out the time needed for the seeding-induced drizzle drops to grow to raindrop sizes by collection processes. These features are similar to the corresponding observed size distributions presented in J15: similar to Fig. 14, the observed size distributions showed a clear increase in concentrations around the 100–200 µm range as well as in the sub-millimetre diameters after the seeding. The former corresponds to the expected size range for the transition between cloud droplets and drizzle. This is accompanied by a shoulder in the decreasing slope of the distribution both in the model and in the observations in J15. Here we find slight differences between the model and observations: in UCLALES-SALSA the transition range is found just below 100 µm whereas in J15 it appears to be closer to 200 µm. This also yields a difference in the magnitude of the seeding effect, which seems to be larger in J15. In addition, looking at the distribution slope for cloud droplets, UCLALES-SALSA indicates a slightly more peaked distribution shape than the observations in J15. The more peaked shape is speculated to arise from the strategy for the cloud droplet bin representation chosen in UCLALES-SALSA (described in Sect. 2). Nevertheless, the marked qualitative similarity between the model seeding effects and the results in J15 is a very encouraging result and provides strong support for UCLALES-SALSA being able to capture the primary microphysical pathway for the hygroscopic seeding effects on precipitation in the case examined.
To close the connection between the microphysical effects and precipitation, Fig. 15 shows the contribution to the overall precipitation flux as a function of size. The data in Fig. 15 are obtained from the same height level as in Fig. 14. As expected, enhanced precipitation due to seeding first takes place by the drizzle size ranges (about 100 µm) and later by the growth of the larger raindrops. The latter is strongly associated with the peak precipitation flux seen 1–1.5 h after the seeding emission in Fig. 7, especially in the experiment Seed3.
The coupled LES–aerosol–cloud model UCLALES-SALSA was used to study precipitation enhancement by hygroscopic seeding in marine stratocumulus clouds. Results from field observations reported in J15 were used as the basis for a series of model experiments performed to map the dependency between precipitation enhancement and the rate of seeding aerosol emission and the injection strategy. The simulation time period was matched with the observations together with the initial thermodynamic profiles and the ambient aerosol size distributions.
Our approach to estimate the effects of seeding was to compare the results between a control run (without seeding) and experiments with seeding, in which the seeding emissions were described both by a moving point emission source and by direct injection of particles to a domain-wide slab. Care was taken to keep the model initial state and the boundary conditions identical between the control run and seeding experiments, so that differences between the simulations could be attributed directly to the seeding aerosol. The overall simulated precipitation rates in the control run were in good agreement with the results reported in J15 with the mean of approximately 0.04 mm h−1 sampled close to the cloud base. Cloud properties produced by the model were also found mostly in the observed range according to J15, although some overestimation was seen in the mean LWC before the seeding. For CDNC the model indicated a decreasing trend in the domain mean during the simulation, which we attributed mainly to cloud processing and scavenging, since the aerosol was not replenished during the simulation. The clouds (and precipitation) were seen to be somewhat sensitive to model initial and boundary conditions, some of which were prescribed as fixed values (e.g. surface fluxes and large-scale subsidence), which adds a degree of uncertainty in the model results. Nevertheless, the values chosen for the simulations produced a consistent set of cloud properties that was in reasonable agreement with the results in J15.
Regarding the seeding effects, the model produced up to 2–3-fold enhancement in the precipitation flux, where the magnitude was found to scale with the total emitted mass of the seeding aerosol. This enhancement is slightly weaker than that reported by J15 (up to 4-fold enhancement). The model seeding produced a somewhat sustained effect lasting until the end of the simulations, with the peak enhancement visible within approximately 1–1.5 h in Seed3 and around 2 h in Seed1 and Seed2. However, it was determined that the minimum concentration in the seeding particle plume, after allowing it to mix within the cloud layer, should be rather high, on the order of , in order to generate an approximately 2-fold precipitation enhancement. This concentration is on the high end of the diluted plume concentration range estimated by J15 (from 10−4 to ).
It was determined that the seeding effects in the model mainly arise via the enhanced collision–coalescence and droplet collection rates. Support for this interpretation was found by analysing the cloud microphysical properties and process rates. The model showed only minor effects on the relative humidity (RH) after the seeding and minor changes in the cloud droplet activation rate, which suggests that the hypothesized seeding effect via water vapour competition affecting the cloud droplet number is of minor importance in the simulated case. This agrees with the conclusions in Rosenfeld et al. (2010), although their work focused on more convective cloud types. In contrast, the drizzle production (i.e. autoconversion) and accretion rates showed a more significant enhancement emerging immediately after the seeding injection (the latter sustained until the end of the simulation, i.e. 3 h after seeding) by up to 30 %–35 %. Thus, the results suggest a dominant role for the enhanced collision processes in this case. The seeding aerosol was released close to cloud top in the model simulations, following the experimental approach in J15. It is possible this would act to reduce the seeding effects via water vapour competition and cloud activation compared to a different strategy of injecting the particles at cloud base, even though the seeding particles are getting mixed and sedimented to the lower parts of the cloud in the current experiments as well. Moreover, since UCLALES-SALSA solves the condensation equations in a size-resolving framework, the model has the technical ability to describe the competition for water vapour due to particle growth between the seeding aerosol and the ambient cloud droplets not only at cloud base, but also in other parts of the cloud as well. Since we do not find clear signs of such effects in the model data, they are likely limited by the relatively low seeding particle concentrations and masked by other in-cloud variability, although being theoretically feasible. The significance of the different seeding effects potentially also depends on the presence of natural GCCN aerosol in the background, as suggested by parcel model calculations (Segal et al., 2004). GCCN are expected to be found in marine boundary layers (Bian et al., 2019) and were thus included in the model experiments in the current work.
Further analysis of the cloud microphysics showed that the model simulations reproduced the main features of the observed seeding effects on the hydrometeor size distribution, compared with J15. The model size distributions indicated a temporal propagation of increased concentrations first in the drizzle size range and later towards the larger raindrop sizes, which was expected as the result of an enhanced collision growth of droplets. While assessing the process pathways for seeding effects represented by UCLALES-SALSA, the similarities seen in the droplet size distributions between the model and observations was found particularly encouraging.
The impact of seeding on other cloud properties was qualitatively similar to the results in J15; i.e. both LWC and CDNC were decreased. The magnitude of the effect increased with the total mass of the injected seeding aerosol. However, as with the precipitation rate, the seeding effects on the cloud properties in the model were clearly weaker than those reported for the observations. Arguably, analysing the seeding effects from the model by comparing multiple realizations provides a more robust estimate (in terms of the data sampling) than estimating the effects of seeding aerosol from temporally consecutive sets of observations. Given the qualitatively very similar seeding effects between the observations and our model, but a larger decrease in CDNC in the observations than in our model, we speculate that other factors than the seeding alone might be playing a role in the observed cloud layer. An example would be the aforementioned gradual decrease in CDNC seen in the model simulations, which was further enhanced by seeding. One can speculate that a single model realization would therefore have resulted in an overestimation of the seeding effect. Unfortunately however, we can not prove that the decreasing trend in CDNC is a realistic feature for this particular case. The model experiments are also subject to a number of other uncertainties that may enhance or suppress the seeding effects and therefore contribute to the differences seen with the observations. The uncertainties arise from both the description of initial and boundary conditions and the model numerics. In particular, tests with varying initial and boundary conditions indeed showed that the model seeding effects are quite sensitive to parameters such as the initial thermodynamic profiles and the prescribed large-scale subsidence. Physically, this reflects the impact of changing the boundary-layer and cloud dynamics on the susceptibility of stratocumulus clouds to changes in CDNC and aerosol, in this case particularly the seeding particles. Since turbulence has been shown to strongly influence the collision–coalescence process and thus the formation of drizzle (e.g. Chen et al., 2020), potential deficiencies in the description of the dynamical and thermodynamical environment may therefore result in the weaker seeding effects compared to observations. Moreover, by the same argument, the results presented here are most likely not well generalized to different environments. From a more technical perspective, the variability in the seeding effects illustrated by the sensitivity tests reflects the model uncertainties in UCLALES-SALSA that arise from the numerical representation of the particle size distributions as well as from deficiencies in the parameterized process descriptions. In addition, some specific aspects of the simulated case are not included in the model: we did not account for possible aerodynamic effects from the aircraft used for seeding. This effect has been studied in the context of ice and mixed-phase clouds (Kärcher, 2018; Moisseev et al., 2019), but in terms of warm cloud seeding, a dedicated study would be required.
Despite the uncertainties, which are not unique to UCLALES-SALSA but present in all modelling studies, the results of this work give a quite consistent view into the seeding process pathways, with several characteristics at least qualitatively very similar to the observations in J15. Therefore, the highly detailed description of microphysics by the SALSA module in conjunction with the cloud-resolving framework by UCLALES provides a useful tool for continued investigation of the potential for precipitation enhancement by cloud seeding. Flare burning is a commonly used and cost-effective method to produce the seeding particles, but it has the tendency to produce particles in a wide range of sizes, with a significant contribution from sub-micrometre particles. Our results highlight the importance of the seeding plume concentrations. Even though the plume concentration can be controlled to an extent by both the emission rate and the seeding strategy (e.g. flight plan, use of multiple aircraft), the results corroborate the view presented in literature (Rosenfeld et al., 2010), that obtaining a high enough concentration of large (>1 µm) CCN from flares in terms of efficient precipitation enhancement might be challenging with currently used practical applications.
The UCLALES-SALSA model source code used in this study is freely available at https://doi.org/10.5281/zenodo.4451735 (Tonttila et al., 2020).
JT and AA share an equal contribution in performing and analysing model experiments and writing most of the paper. JT, TR, SR and HarK are the main contributors in developing the UCLALES-SALSA code. HanK, HarK and SR took part in evaluating the model results and writing the paper.
The authors declare that they have no conflict of interest.
This material is based on work supported by the National Center of Meteorology, Abu Dhabi, UAE, under the UAE Research Program for Rain Enhancement Science. The work was also supported by the Academy of Finland (project numbers 283031, 309127 and 322532 and the Centre of Excellence in Atmospheric Science, 272041) and the European Research Council (project ECLAIR, 646857).
This research has been supported by the UAE Research Program for Rain Enhancement Science, the Academy of Finland (projects 283031, 309127, 322532 and 272041) and the European Research Council (project 646857).
This paper was edited by Patrick Chuang and reviewed by two anonymous referees.
Ackerman, A. S., van Zanten, M. C., Stevens, B., Savic-Jovcic, V., Bretherton, C. S., Chlond, A., Golaz, J.-C., Jiang, H., Khairoutdinov, M., Krueger, S. K., Lewellen, D. C., Lock, A., Moeng,C.-H., Nakamura, K., Petters, M. D., Snider, J. R., Weinbrecht, S., and Zulauf, M.: Large-Eddy Simulations of a Drizzling, Stratocumulus-Topped Marine Boundary Layer, Mon. Weather Rev., 137, 1083–1110, https://doi.org/10.1175/2008MWR2582.1, 2009. a, b
Bian, H., Froyd, K., Murphy, D. M., Dibb, J., Darmenov, A., Chin, M., Colarco, P. R., da Silva, A., Kucsera, T. L., Schill, G., Yu, H., Bui, P., Dollner, M., Weinzierl, B., and Smirnov, A.: Observationally constrained analysis of sea salt aerosol in the marine atmosphere, Atmos. Chem. Phys., 19, 10773–10785, https://doi.org/10.5194/acp-19-10773-2019, 2019. a, b
Bigg, E. K.: An independent evaluation of a South African hygroscopic cloud seeding experiment, 1991–1995, Atmos. Res., 43, 111–127, 1997. a
Boutle, I., Price, J., Kudzotsa, I., Kokkola, H., and Romakkaniemi, S.: Aerosol–fog interaction and the transition to well-mixed radiation fog, Atmos. Chem. Phys., 18, 7827–7840, https://doi.org/10.5194/acp-18-7827-2018, 2018. a
Bruintjes, R. T.: A Review of Cloud Seeding Experiments to Enhance Precipitation and Some New Prospects, B. Am. Meteorol. Soc., 80, 805–820, https://doi.org/10.1175/1520-0477(1999)080<0805:AROCSE>2.0.CO;2, 1999. a
Chen, S., Xue, L., and Yau, M.-K.: Impact of aerosols and turbulence on cloud droplet growth: an in-cloud seeding case study using a parcel–DNS (direct numerical simulation) approach, Atmos. Chem. Phys., 20, 10111–10124, https://doi.org/10.5194/acp-20-10111-2020, 2020. a, b
Chen, Y.-C., Xue, L., Lebo, Z. J., Wang, H., Rasmussen, R. M., and Seinfeld, J. H.: A comprehensive numerical study of aerosol-cloud-precipitation interactions in marine stratocumulus, Atmos. Chem. Phys., 11, 9749–9769, https://doi.org/10.5194/acp-11-9749-2011, 2011. a, b, c
Cotton, W. R.: Modification of Precipitation from Warm Clouds – A Review, B. Am. Meteorol. Soc., 63, 146–160, https://doi.org/10.1175/1520-0477(1982)063<0146:MOPFWC>2.0.CO;2, 1982. a
Dadashazar, H., Wang, Z., Crosbie, E., Brunke, M., Zeng, X., Jonsson, H., Woods, R. K., Flagan, R. C., Seinfeld, J. H., and Sorooshian, A.: Relationships between giant sea salt particles and clouds inferred from aircraft physicochemical data, J. Geophys. Res.-Atmos., 122, 3421–3434, https://doi.org/10.1002/2016JD026019, 2017. a
Feingold, G., Cotton, W. R., Kreidenweis, S. M., and Davis, J. T.: the impact of giant cloud condensation nuclei on drizzle formation in stratocumulus: implications for cloud radiative properties, J. Atmos. Sci., 56, 4100–4117, https://doi.org/10.1175/1520-0469(1999)056<4100:TIOGCC>2.0.CO;2, 1999. a
Flossmann, A. I., Manton, M., Abshaev, A., Bruintjes, R., Murakami, M., Prabhakaran, T., and Yao, Z.: Review of advances in precipitation enhancement research, B. Am. Meteorol. Soc., 100, 1465–1480, https://doi.org/10.1175/BAMS-D-18-0160.1, 2019. a, b
Ghate, V. P., Albrecht, B. A., Kollias, P., Jonsson, H., and Breed, D. W.: Cloud seeding as a technique for studying aerosol-cloud interactions in marine stratocumulus, Geophys. Res. Lett., 34, L14807, https://doi.org/10.1029/2007GL029748, 2007. a
Glienke, S., Kostinski, A., Fugal, J., Shaw, R. A., Borrmann, S., and Stith, J.: Cloud droplets to drizzle: Contribution of transition drops to microphysical and optical properties of marine stratocumulus clouds, Geophys. Res. Lett., 44, 8002–8010, https://doi.org/10.1002/2017GL074430, 2017. a
Jensen, J. B. and Lee, S.: Giant sea-salt aerosols and warm rain formations in marine stratocumulus, J. Atmos. Sci., 65, 3678–3694, https://doi.org/10.1175/2008JAS2617.1, 2008. a, b
Jensen, J. B. and Nugent, A. D.: Condensational growth of drops formed on giant sea-salt aerosol particles, J. Atmos. Sci., 74, 679–697, https://doi.org/10.1175/JAS-D-15-0370.1, 2017. a, b, c
Jung, E., Albrecht, B. A., Jonsson, H. H., Chen, Y.-C., Seinfeld, J. H., Sorooshian, A., Metcalf, A. R., Song, S., Fang, M., and Russell, L. M.: Precipitation effects of giant cloud condensation nuclei artificially introduced into stratocumulus clouds, Atmos. Chem. Phys., 15, 5645–5658, https://doi.org/10.5194/acp-15-5645-2015, 2015. a, b, c, d
Kärcher, B.: Formation and radiative forcing of contrail cirrus, Nat. Commun., 9, 1824, https://doi.org/10.1038/s41467-018-04068-0, 2018. a
Kokkola, H., Korhonen, H., Lehtinen, K. E. J., Makkonen, R., Asmi, A., Järvenoja, S., Anttila, T., Partanen, A.-I., Kulmala, M., Järvinen, H., Laaksonen, A., and Kerminen, V.-M.: SALSA – a Sectional Aerosol module for Large Scale Applications, Atmos. Chem. Phys., 8, 2469–2483, https://doi.org/10.5194/acp-8-2469-2008, 2008. a, b
Kuba, N. and Murakami, M.: Effect of hygroscopic seeding on warm rain clouds – numerical study using a hybrid cloud microphysical model, Atmos. Chem. Phys., 10, 3335–3351, https://doi.org/10.5194/acp-10-3335-2010, 2010. a, b
Lehahn, Y., Koren, I., Altaratz, O., and Kostinski, A. B.: Effect of coarse marine aerosols on stratocumulus clouds, Geophys. Res. Lett., 38, L20804, https://doi.org/10.1029/2011GL048504, 2011. a
Moisseev, D., Lautaportti, S., Alku, L., Tabakova, K., O'Connor, E. J., Leskinen, M., and Kulmala, M.: Inadvertent localized intensification of precipitation by aircraft, J. Geophys. Res.-Atmos., 124, 2094–2104, https://doi.org/10.1029/2018JD029449, 2019. a
Rosenfeld, D., Axisa, D., Woodley, W. L., and Lahav, R.: A quest for effective hygroscopic cloud seeding, J. Appl. Meteor. Climatol., 49, 1548–1562, https://doi.org/10.1175/2010JAMC2307.1, 2010. a, b, c, d, e, f, g
Segal, Y., Khain, A., Pinsky, M., and Rosenfeld, D.: Effects of hygroscopic seeding on raindrop formation as seen from simulations using a 2000-bin spectral cloud parcel model, Atmos. Res., 71, 3–34, https://doi.org/10.1016/j.atmosres.2004.03.003, 2004. a, b, c
Stevens, B., Moeng, C.-H. Ackerman, A. S., Bretherton, C. S., Chlond, A., de Roode, S., Edwards, J., Golaz, J.-C., Jiang, H., Khairoutdinov, M., Kirkpatrick, M. P., Lewellen, D. C., Lock, A., Müller, F., Stevens, D. E., Whelan, E., and Zhu, P.: Evaluation of Large-Eddy Simulations via observations of nocturnal marine stratocumulus, Mon. Weather Rev., 133, 1443–1462, 2005. a, b, c, d
Tonttila, J., Maalick, Z., Raatikainen, T., Kokkola, H., Kühn, T., and Romakkaniemi, S.: UCLALES–SALSA v1.0: a large-eddy model with interactive sectional microphysics for aerosol, clouds and precipitation, Geosci. Model Dev., 10, 169–188, https://doi.org/10.5194/gmd-10-169-2017, 2017. a, b, c, d, e, f
Tonttila, J., Afzalifar, A., Raatikainen, T., Kokkola, H., and Romakkaniemi, S.: UCLALES-SALSA, under release tag ScSeed-v1.0, https://doi.org/10.5281/zenodo.4451735, 2020.
WWAP (UNESCO World Water Assessment Programme): The United Nations World Water Development Report 2019: Leaving No One Behind, UNESCO, Paris, 2019. a
Zheng, G., Wang, Y., Aiken, A. C., Gallo, F., Jensen, M. P., Kollias, P., Kuang, C., Luke, E., Springston, S., Uin, J., Wood, R., and Wang, J.: Marine boundary layer aerosol in the eastern North Atlantic: seasonal variations and key controlling processes, Atmos. Chem. Phys., 18, 17615–17635, https://doi.org/10.5194/acp-18-17615-2018, 2018. a
cloud seeding). The particles, usually released from an aircraft, are expected to enhance cloud droplet growth, but its practical feasibility is somewhat uncertain. To improve upon this, we simulate the seeding effects with a numerical model. The model reproduces the main features seen in field observations, with a strong sensitivity to the total mass of the injected particle material.


