the Creative Commons Attribution 4.0 License.
the Creative Commons Attribution 4.0 License.
 | 26 Aug 2020
Revisiting global satellite observations of stratospheric cirrus clouds
Ling Zou
Sabine Griessbach
Lars Hoffmann
Bing Gong
Lunche Wang
As knowledge about the cirrus clouds in the lower stratosphere is limited, reliable long-term measurements are needed to assess their characteristics, radiative impact and important role in upper troposphere and lower stratosphere (UTLS) chemistry. We used 6 years (2006–2012) of Michelson Interferometer for Passive Atmospheric Sounding (MIPAS) measurements to investigate the global and seasonal distribution of stratospheric cirrus clouds and compared the MIPAS results with results derived from the latest version (V4.x) of the Cloud-Aerosol Lidar and Infrared Pathfinder Satellite Observations (CALIPSO) data. For the identification of stratospheric cirrus clouds, precise information on both the cloud top height (CTH) and the tropopause height is crucial. Here, we used lapse rate tropopause heights estimated from the ERA-Interim global reanalysis.
Considering the uncertainties of the tropopause heights and the vertical sampling grid, we define CTHs more than 0.5 km above the tropopause as stratospheric for CALIPSO data. For MIPAS data, we took into account the coarser vertical sampling grid and the broad field of view so that we considered cirrus CTHs detected more than 0.75 km above the tropopause as stratospheric. Further sensitivity tests were conducted to rule out sampling artefacts in MIPAS data.
The global distribution of stratospheric cirrus clouds was derived from night-time measurements because of the higher detection sensitivity of CALIPSO. In both data sets, MIPAS and CALIPSO, the stratospheric cirrus cloud occurrence frequencies are significantly higher in the tropics than in the extra-tropics. Tropical hotspots of stratospheric cirrus clouds associated with deep convection are located over equatorial Africa, South and Southeast Asia, the western Pacific, and South America. Stratospheric cirrus clouds were more often detected in December–February (15 %) than June–August (8 %) in the tropics (±20∘). At northern and southern middle latitudes (40–60∘), MIPAS observed about twice as many stratospheric cirrus clouds (occurrence frequencies of 4 %–5 % for MIPAS rather than about 2 % for CALIPSO). We attribute more frequent observations of stratospheric cirrus clouds with MIPAS to the higher detection sensitivity of the instrument to optically thin clouds.
In contrast to the difference between daytime and night-time occurrence frequencies of stratospheric cirrus clouds by a factor of about 2 in zonal means in the tropics (4 % and 10 %, respectively) and at middle latitudes for CALIPSO data, there is little diurnal cycle in MIPAS data, in which the difference of occurrence frequencies in the tropics is about 1 percentage point in zonal mean and about 0.5 percentage point at middle latitudes. The difference between CALIPSO day and night measurements can also be attributed to their differences in detection sensitivity.
Future work should focus on better understanding the origin of the stratospheric cirrus clouds and their impact on radiative forcing and climate.
- Article
(3994 KB) - Full-text XML
- BibTeX
- EndNote


Cirrus clouds are ice clouds that form at cold temperatures in the middle and upper troposphere. They cover roughly about 20 %–40 % of the globe (Liou, 1986; Wylie et al., 1994, 2005). As for their wide coverage and high occurrence frequencies, cirrus clouds play an important role in changing the surface energy budget of the earth–atmosphere system (Berry and Mace, 2014; Hong et al., 2016), affecting the distribution of water vapour and the thermal structure of the atmosphere (Schoeberl et al., 2019) and influencing the climate (Corti et al., 2006; Schoeberl and Dessler, 2011; Dinh et al., 2012; Dessler et al., 2016). The characteristics and distribution of cirrus clouds are among the most sensitive parameters for climate variability (Muri et al., 2014; Kärcher, 2018).
To better understand the formation, evolution, and climate effects of cirrus clouds, the exploration of their global geospatial distribution and occurrence frequencies is essential. Depending on the satellite instrument sensitivities and cirrus cloud definition, the derived occurrence frequencies significantly differ; e.g., on a global average, 34.9 % of the clouds above 500 hPa were defined as cirrus clouds, which were observed by the High-resolution Infrared Radiation Sounder (HIRS) between June 1989 and May 1993 (Wylie et al., 1994), a global average frequency of cirrus cloud occurrence was 16.7 %, which was derived from a joint analysis of the space-borne cloud radar (CloudSat) and the Cloud- Aerosol Lidar and Infrared Pathfinder Satellite Observations (CALIPSO) for the period from June 2006 to June 2007 based on the cirrus cloud criteria of cloud top temperature below −40∘ C and a visible optical depth below τ≈3.0 (Sassen et al., 2008), and the global annual mean cirrus cloud cover was 13.5 % with a cloud top pressure below 440 mb and an optical thickness below 3.6 being reported in the International Satellite Cloud Climatology Project (ISCCP) D2 data, which were acquired between 1984 and 2004 by nadir viewing satellite instruments (Eleftheratos et al., 2007). More observations from additional resources are therefore urgently required to clarify the global occurrence of cirrus clouds in a changing climate.
Despite the differences in the global occurrence frequencies, some consistencies with respect to the spatial and temporal distribution of cirrus clouds can be seen between the studies. For instance, cirrus clouds occur more often in the tropics than in the extra-tropics (Wang et al., 1996; Nazaryan et al., 2008). Another general agreement on the geospatial distribution of tropical cirrus clouds is that high occurrence frequencies are generally detected over equatorial Africa, South and Southeast Asia, the western Pacific, and South America (Riihimaki and McFarlane, 2010; Massie et al., 2013). The largest occurrence frequencies of tropical cirrus clouds generally occur in boreal winter, and minimum frequencies appear in boreal summer (Massie et al., 2010; Wang and Dessler, 2012). Considering the vertical distribution of the cloud fraction, Fu et al. (2007) found about 0.05 % at 18.5 km, 0.5 % at 18.0 km, and 5 % at 17.0 km between 20∘ S and 20∘ N from CALIPSO observations, which indicated the occurrence of cirrus clouds in the lower stratosphere. Dessler (2009) was the first to analyse the occurrence of cirrus clouds in the lower stratosphere with CALIPSO measurements in the Northern Hemisphere. The impact of stratospheric cirrus clouds on climate variability is still unclear, and studies on the occurrence of stratospheric cirrus clouds are still limited and controversial.
Stratospheric cirrus clouds have been reported in the tropics and at middle latitudes from in situ, ground-based lidar and satellite measurements. Studies of stratospheric cirrus clouds from in situ measurements are rare for the tropics (De Reus et al., 2009), middle latitudes (Clodman, 1957), and high latitudes (Lelieveld et al., 1999; Kärcher and Solomon, 1999). Reports of the appearance of stratospheric cirrus clouds from ground-based lidar measurements are provided more often at middle latitudes (Goldfarb et al., 2001; Keckhut et al., 2005; Noël and Haeffelin, 2007; Rolf, 2012) and in the tropics (Sivakumar et al., 2003; Sandhya et al., 2015). Among the satellite instruments, CALIPSO (Dessler, 2009; Pan and Munchak, 2011; Iwasaki et al., 2015) and Cryogenic Infrared Spectrometers and Telescopes for the Atmosphere (CRISTA) (Spang et al., 2015) were used to investigate stratospheric cirrus clouds. The distribution of stratospheric cirrus clouds in the tropics follows the general distribution of cirrus clouds, the highest fractions being found over equatorial Africa, South and Southeast Asia, the western Pacific, and South America. However, the consistency and agreement on the occurrences are still under debate as the results varied measurement-by-measurement and even study-by-study based on the same instrument.
At middle latitudes, Noël and Haeffelin (2007) found ∼2.5 % of cirrus clouds above the first tropopause based on ground-based lidar measurements over France. Pan and Munchak (2011) noted ∼2 % of cirrus clouds with cloud top heights (CTHs) of 0.5 km above the tropopause in the Northern Hemisphere when using tropopause heights derived from the National Centers for Environmental Prediction Global Forecast System (GFS). In another study, about twice as many stratospheric cirrus clouds (∼5 %) were detected during 2 weeks of infrared limb emission measurements in boreal summer 1997 with the CRISTA instrument over 40–60∘ N (Spang et al., 2015). Potential reasons for these differences could be the higher detection sensitivity of infrared (IR) limb emission measurements compared to the standard CALIPSO data product and a sampling bias due to the comparison of a 2 week period in 1996 versus a 4-year 3-monthly mean between 2006 and 2010. Further measurements with high detection sensitivity to stratospheric cirrus are indispensable.
Investigations of stratospheric cirrus clouds including high latitudes (>60∘) are rare (Pan and Munchak, 2011; Spang et al., 2015). The statistical values for the high-latitude stratospheric cirrus clouds have a large uncertainty, which may be on account of the low detection sensitivity, coarse classification accuracy between polar stratospheric clouds and stratospheric cirrus clouds (Sassen et al., 2008), and tropopause uncertainties at polar latitudes (Zängl and Hoinka, 2001). Therefore, high detection accuracy and sensitivity measurements are of significant importance for investigating the global occurrence and distribution of stratospheric cirrus clouds.
In this study, we are revisiting and exploring the global features of stratospheric cirrus clouds with the high vertical resolution space lidar CALIPSO and the high-sensitivity mid-infrared limb emission sounder MIPAS (Michelson Interferometer for Passive Atmospheric Sounding). The CALIPSO and MIPAS instruments, the stratospheric cirrus cloud top heights derived from the instruments, and the tropopause data used in this study are described in Sect. 2. As MIPAS and CALIPSO measurements have an overlap between June 2006 and April 2012, seasonal CTH occurrence frequencies of stratospheric cirrus during that time period are presented for CALIPSO in Sect. 3 and MIPAS in Sect. 4. Since the comparison between daytime and night-time CALIPSO measurements showed that the night-time measurements are more suitable for thin cirrus cloud detection (Sect. 3), the comparisons between MIPAS and CALIPSO occurrence frequencies of CTHs relative to the tropopause and for seasonal occurrence frequencies were only performed for night-time measurements (Sect. 4). A comparison of 4 years (2006–2010) of stratospheric cirrus cloud statistics investigated by Pan and Munchak (2011) using an earlier version of CALIPSO data is presented in Sect. 5. Conclusions of this study are drawn in Sect. 6.
2.1 CALIPSO
The CALIPSO satellite (Winker et al., 2007, 2009) was launched on 28 April 2006 as a member of the afternoon constellation (A-Train) satellite constellation. In September 2018, CALIPSO exited the A-Train and joined CloudSat to be a part of the C-Train. The Cloud-Aerosol Lidar with Orthogonal Polarization (CALIOP) is a two-wavelength polarization-sensitive lidar instrument on CALIPSO. It probes the high-resolution vertical structure and properties of clouds and aerosols on a near global scale. The vertical resolution of CALIPSO is 30 m from 0.5 to 8.2 km, 60 m from 8.2 to 20.2 km, and 180 m from 20.2 to 30.1 km. Studies found a 96.3 % estimation accuracy of the CALIOP sensor for characterizing the cloud cover compared with the Moderate Resolution Imaging Spectroradiometer (MODIS) and CloudSat Cloud Profiling Radar (CPR) (Chan and Comiso, 2013). CALIPSO is suitable for high-altitude cirrus cloud detection (Davis et al., 2010). The vertical feature mask data (CAL_LID_L2_VFMStandard-V4) used in this study were generated with a new set of cloud-aerosol discrimination (CAD) probability distribution functions. The increased spatial resolution provided an overall improvement in CAD reliability (Liu et al., 2019). Cirrus clouds and deep convective clouds are identified by the feature classification flags based on the CALIPSO CAD algorithm, as well as the International Satellite Cloud Climatology Project (ISCCP) definitions. To ensure a high confidence level of the data, only cirrus and deep convective clouds that are marked with a high feature type quality were extracted and analysed in our study. Furthermore, daytime and night-time data were flagged and analysed separately to take into account the different detection sensitivities.
For data processing, we first analysed the vertical structure of all cirrus and deep convective clouds reported in the CALIPSO vertical feature mask data. For multi-layer profiles, layers were combined if their vertical distances were less than 120 m (Martins et al., 2011). As we are interested in cirrus clouds in the upper troposphere and lower stratosphere (UTLS) region, co-located tropopause data are used to limit the analysis to CTHs in the range of ±4 km around the tropopause. An additional filter for polar stratospheric clouds (PSC) for high latitudes is indispensable as PSCs are identified as cirrus clouds by the CALIPSO classification algorithm. The PSC filter follows the criteria of Sassen et al. (2008); i.e. cloud layers were excluded if CTHs were higher than 12.0 km poleward of 60∘ N and 60∘ S during local wintertime. The CTH occurrence frequency is defined as the ratio of the number of cirrus cloud top height detections to total number of profiles in a given region. Two examples of night-time stratospheric cirrus and Antarctic PSCs are shown in Fig. 1. Those two stratospheric cirrus cases were detected in the tropics and at middle latitudes, respectively, and they are both associated with deep convection. The tops of the clouds reach up to 18 km in the tropics and at middle latitudes reach up to 12.5 km, both of which are 500 m above the tropopause. The PSCs over Antarctic are excluded in our study as their cloud tops are more than 4 km above the tropopause.
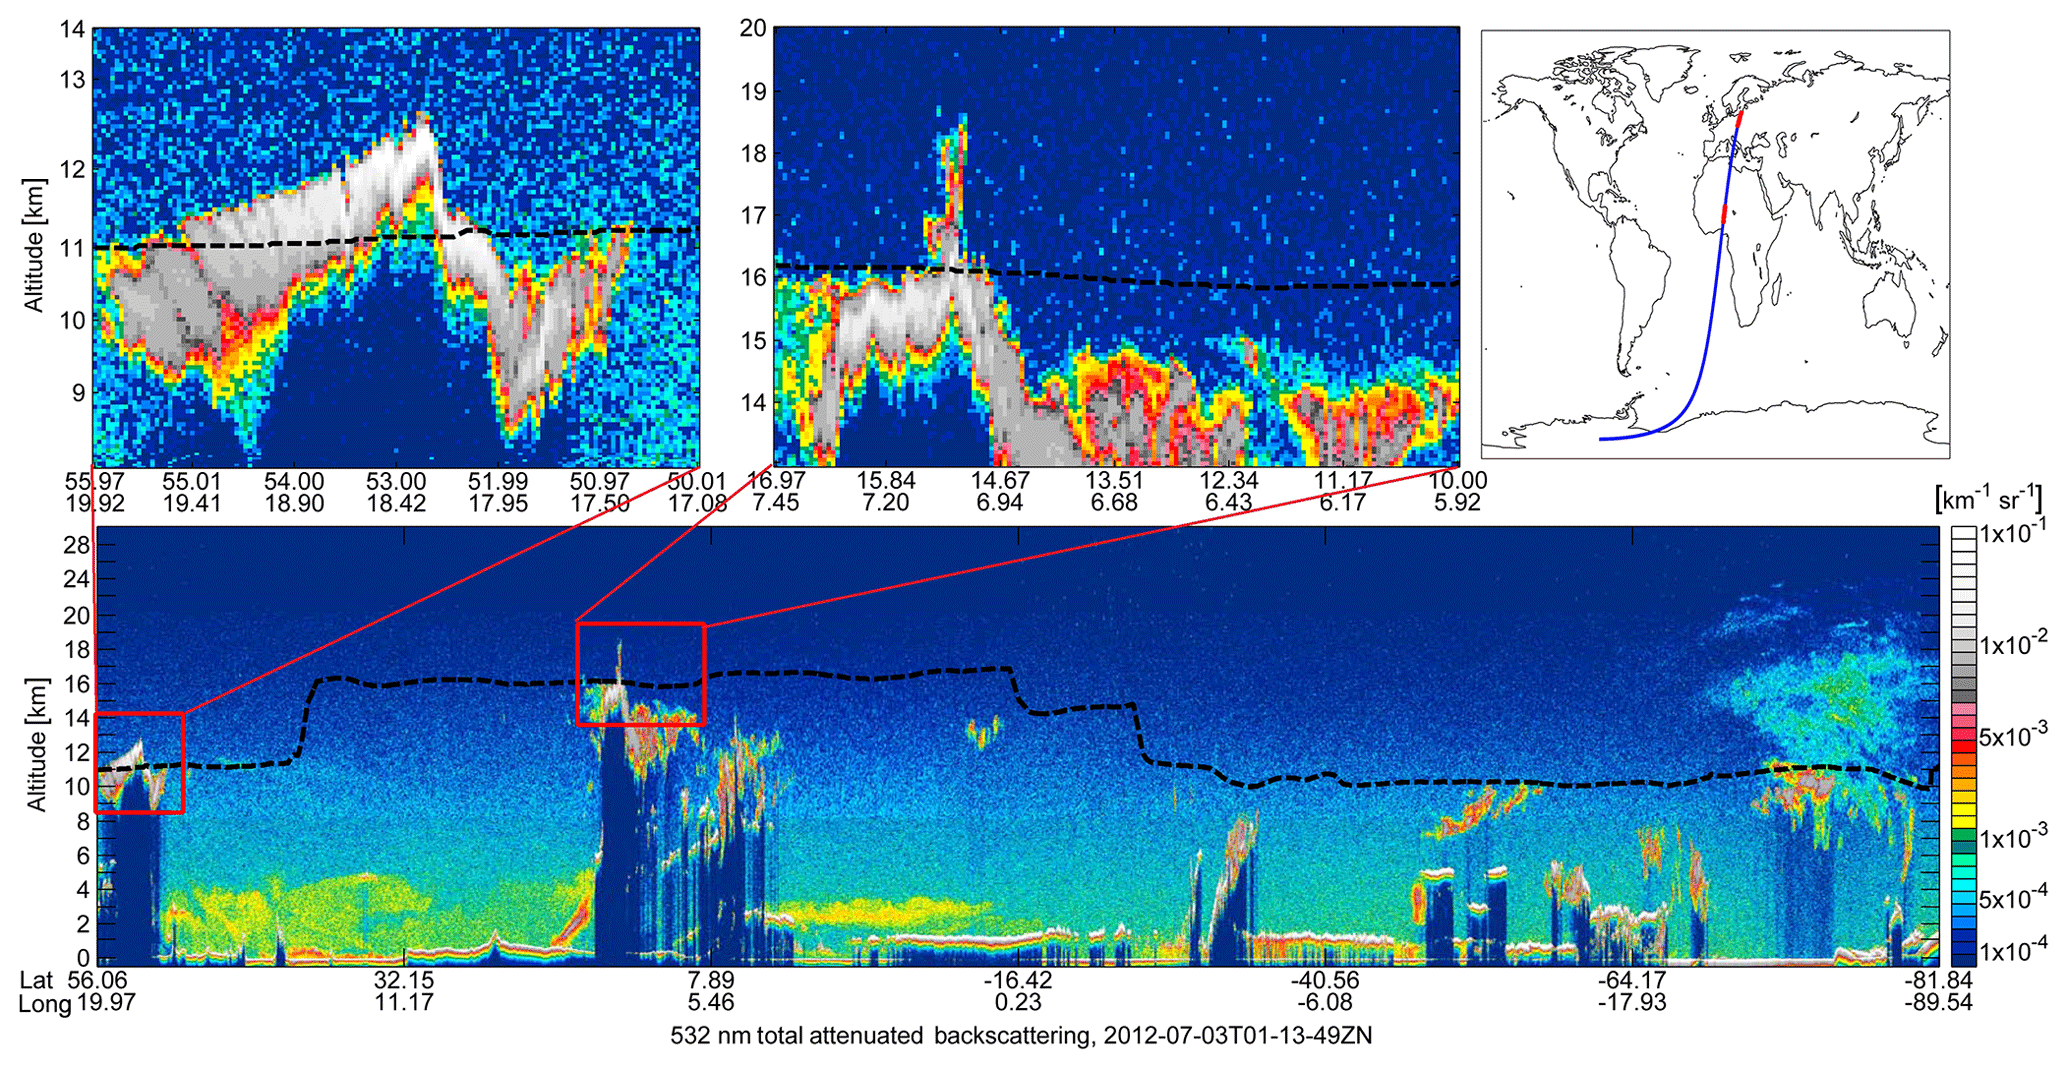
Figure 1CALIPSO total attenuated backscatter at 523 nm observed on 3 July 2012 just after 01:13 UTC. The dashed black line indicates the lapse rate tropopause as estimated from the ERA-Interim reanalysis.
2.2 MIPAS
The Michelson Interferometer for Passive Atmospheric Sounding (MIPAS) on board ESA's Envisat is a Fourier transform spectrometer for the detection of high-resolution limb emission spectra from the mid-troposphere to the mesosphere (Fischer et al., 2008). MIPAS was measuring from July 2002 to April 2012 at a local solar time (LST) of 10:00 and 22:00 LST for the ascending and descending node, respectively. The field of view provides a resolution of 3 km (vertical) ×30 km (horizontal) at the tangent point. After January 2005, the vertical sampling below 21 km in nominal measurement mode was optimized to 1.5 km. The detectors cover the spectral range from 685 to 2410 cm−1. In this work, the band A (685–980 cm−1) and band B (1205–1510 cm−1) version 8.03 level 1b data were used to derive cirrus cloud top heights.
The cirrus cloud detection was performed in two steps. First, the cloud detection was performed using the aerosol cloud index (ACI) (Griessbach et al., 2016). The ACI is defined as the maximum value of the cloud index (CI) and the aerosol index (AI): ACI = max (CI, AI). The CI is the ratio of the mean radiances of a strong CO2 emission band (788.25, 796.25 cm−1) and an atmospheric window band (832.31, 834.37 cm−1) (Spang et al., 2001a, b). The AI is defined as the ratio of the mean radiances in the same CO2 emission band (788.25, 796.25 cm−1) and another atmospheric window band (960.00, 961.00 cm−1). We used an ACI threshold of 7 to separate clear air (ACI > 7) and cloudy air (ACI ≦ 7) as this value provides comparable results to the most sensitive altitude and latitude variable thresholds for the CI (Sembhi et al., 2012; Griessbach et al., 2016). In the second step, we filtered out aerosol from the detected clouds by applying the volcanic ash detection method of Griessbach et al. (2014) and a brightness temperature difference correlation method that separates volcanic ash, mineral dust, and sulfate aerosol from ice clouds (Griessbach et al., 2016).
In this study, the top most tangent height of the ice cloud detection was extracted as cloud height to analyse stratospheric cirrus clouds with MIPAS. However, one shortcoming of the MIPAS measurements is the coarser vertical resolution and large field of view. The large field of view, broken cloud conditions, and different extinction coefficients of the cloud layers cause CTH uncertainties for MIPAS. For optically thick clouds, CTHs can be overestimated by up to ∼1.6 km due to the field of view, and for optically thin clouds CTHs can be underestimated by up to ∼5.1 km (Griessbach et al., 2020). An average CTH overestimation of 0.75 to 1 km compared to the High-Resolution Dynamics Limb Sounder (HIRDLS) and CALIPSO has been reported by Sembhi et al. (2012). Therefore, sensitivity tests of CTHs in MIPAS are indispensable in assessing the robustness of the results. After extracting the cirrus cloud heights, we applied the same PSC filter as for CALIPSO. Further, daytime and night-time flags for MIPAS were added based on the solar zenith angles of the observations.
2.3 Tropopause data
The lapse rate tropopause (LRT) is defined as the lowest level at which the lapse rate decreases to 2∘ C km−1 or less, provided the average lapse rate between this level and all higher levels within 2 km does not exceed 2∘ C km−1 (WMO, 1957). Due to the close relations to temperature and relative humidity, the LRT shows good agreement with sharp stability and chemical transitions between the troposphere and stratosphere globally (Pan and Munchak, 2011; Spang et al., 2015; Xian and Homeyer, 2019). The LRT is therefore considered crucial for stratospheric cirrus cloud detections (Spang et al., 2015). In this study, we used LRT geopotential heights derived from the ERA-Interim reanalysis (re3data.org, 2020). ERA-Interim is a global atmospheric reanalysis with approximately 0.75∘ grid resolution on 60 vertical levels from the surface up to 0.1 hPa, which is available 6-hourly from 1979 to August 2019 (Dee et al., 2011). Considering a typical ±0.3 km bias of the ERA-Interim LRT data with respect to Global Positioning System (GPS) measurements and the 0.2 km vertical grid sampling of the CALIPSO data, an uncertainty of 0.5 km was used for stratospheric cirrus cloud detections, which is comparable to the approach of Homeyer et al. (2010) and Pan and Munchak (2011). The term “stratospheric cirrus clouds” for CALIPSO hereafter indicates cirrus clouds that have CTHs that are at least 0.5 km above the tropopause.
3.1 Night-time and daytime stratospheric cirrus clouds
The CALIPSO night-time and daytime mean stratospheric cirrus cloud fractions are presented in Fig. 2. Although similar patterns are observed in the tropics, frequencies of stratospheric cirrus clouds that are 2–3 times higher are detected at night time rather than at daytime. The highest fraction at night time is located over central Africa with a maximum of ∼0.36, whereas it is <0.16 at daytime. The regional mean CTH occurrence frequency of stratospheric cirrus clouds in the tropics is ∼10 % at night time (Fig. 2c) but ∼4 % at daytime (Fig. 2d). At middle and high latitudes, there are rarely stratospheric cirrus cloud detections at daytime. The regional mean fractions over middle latitudes in the Southern Hemisphere and Northern Hemisphere are ∼1 % during the daytime and ∼2 % during the night time. The sensitivity of CALIPSO is higher by a factor of ∼2.5 at 18 km, ∼2 at 15 km, and ∼1.5 at 10 km at night time compared to daytime due to a better signal-to-noise ratio (Winker et al., 2009), which is in line with the findings of Hunt et al. (2009) and Getzewich et al. (2018). As high-altitude cirrus clouds show only little diurnal cycle and thin cirrus clouds in particular do not show any diurnal pattern (Wylie et al., 1994), we consider the difference in detection sensitivity the leading cause for the difference between CALIPSO night-time and daytime measurements. Hence, only night-time CALIPSO measurements will be further analysed in this study.
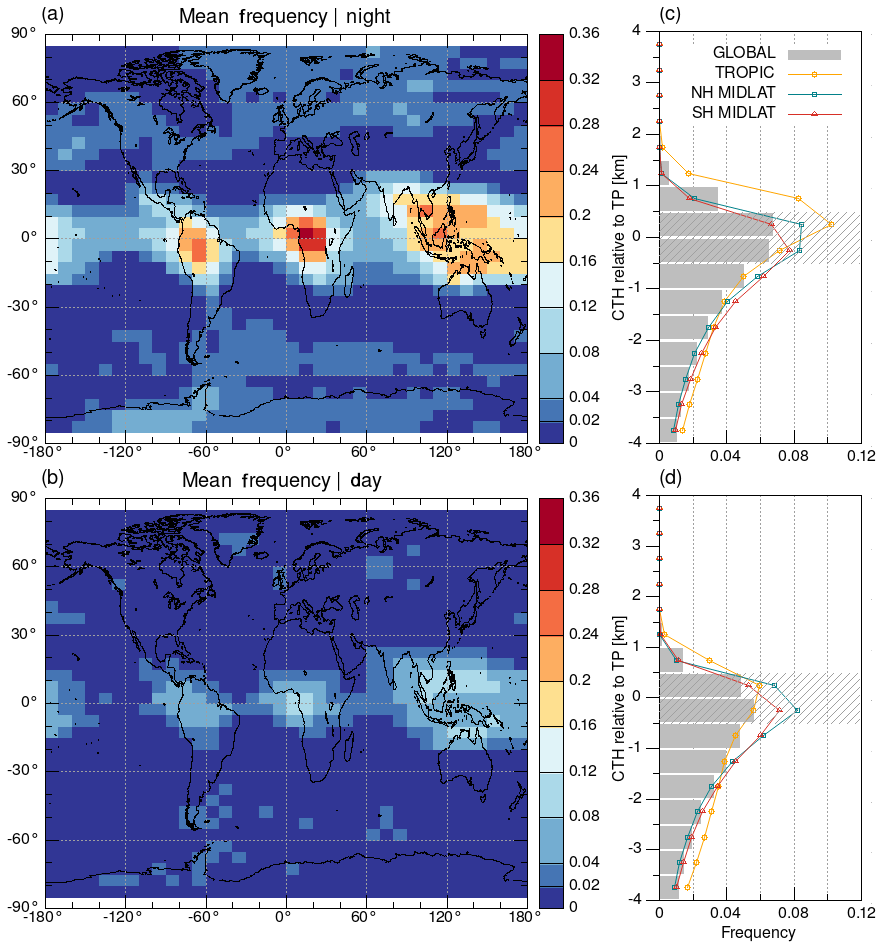
Figure 2Global distribution of CTH occurrence frequencies of stratospheric cirrus clouds from June 2006 to April 2012 derived from CALIPSO (a) night-time and (b) daytime measurements. The maps are shown on a latitude–longitude grid. The corresponding vertical CTH fraction profiles for (c) night time and (d) daytime are relative to the tropopause and show zonal means for the tropics (20∘ S–20∘ N), northern middle latitudes (NH MIDLAT) (40–60∘ N), and southern middle latitudes (SH MIDLAT) (40–60∘ S). The uncertainty of the tropopause is ±0.5 km and marked by the hatched grey area.
3.2 Seasonal night-time stratospheric cirrus clouds
Seasonal geospatial distributions of night-time stratospheric cirrus clouds are presented in Fig. 3, and seasonal vertical fractions of CTHs relative to the tropopause are shown in Fig. 4. The CTH occurrence frequencies of stratospheric cirrus clouds are globally similar for the four seasons with a maximum frequency of ∼5 % in December to February (DJF) and a minimum frequency of ∼4 % in September to November (SON). Regionally, high occurrence frequencies are observed in the tropics during all seasons over equatorial Africa, South and Southeast Asia, the western Pacific, and South America. The distribution of stratospheric cirrus cloud hotspots in the tropics (20∘ S–20∘ N) is consistent with the cirrus cloud hotspots reported by Wang et al. (1996) and Wylie et al. (2005). The seasonal tropical mean frequencies are in the range of ∼8 % to ∼15 % (Fig. 4) and are nearly 4 to 5 times higher than the middle latitude seasonal means.
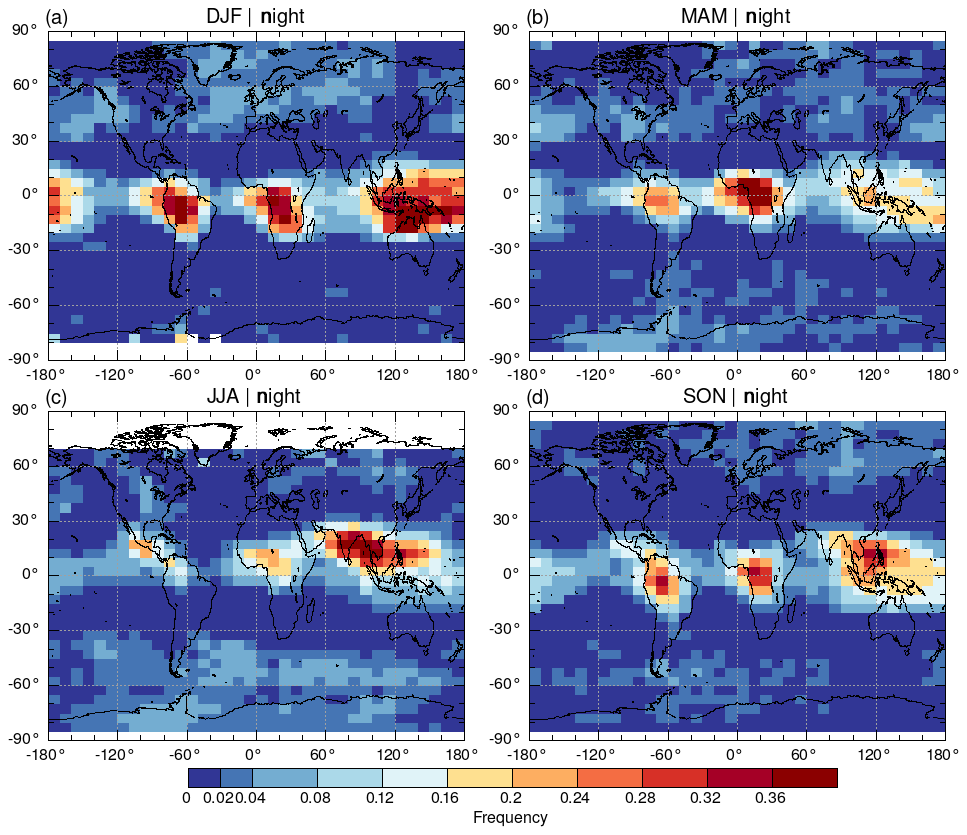
Figure 3Seasonal CTH occurrence frequencies of night-time stratospheric cirrus clouds derived from CALIPSO observations from June 2006 to April 2012 in (a) December to February (DJF), (b) March to May (MAM), (c) June to August (JJA), and (d) September to November (SON). The grid boxes are the same as in Fig. 2.
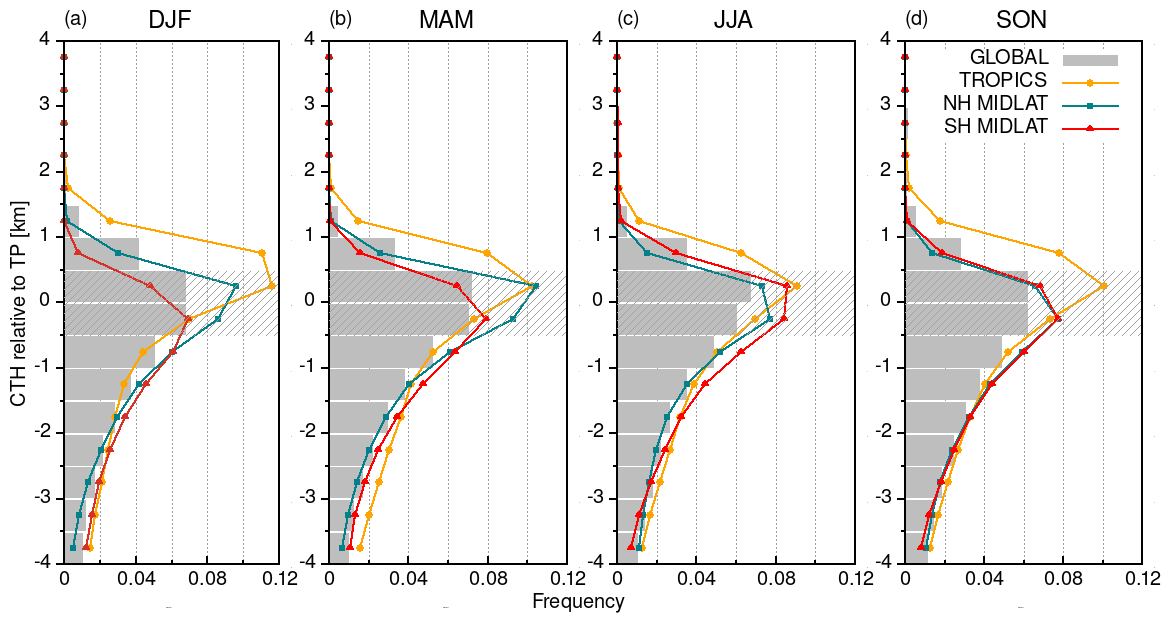
Figure 4Vertical occurrence frequencies of night-time CTHs relative to the tropopause derived from CALIPSO observations for the four seasons, (a) DJF, (b) MAM, (c) JJA, and (d) SON, and the same time period as in Fig. 3.
In DJF, high frequencies of stratospheric cirrus clouds are mainly located south of the Equator over equatorial Africa, South and Southeast Asia, the western Pacific, and South America with the highest fractions up to 0.36 (Fig. 3a). The tropical mean frequency is ∼0.15 (Fig. 4a). Rare stratospheric cirrus clouds are observed at Southern Hemisphere middle and high latitudes, while 4 %–8 % of stratospheric cirrus clouds are found over western North America, the North Atlantic, Europe, and northern Asia (Fig. 3a). The regional mean frequencies for southern middle latitudes (40∘ S–60∘ S) and northern middle latitudes (40∘ N–60∘ N) are 1 % and 3 %, respectively (Fig. 4a).
From March to May (MAM), the tropical hotspots show slightly northward movement following the intertropical convergence zone (ITCZ) and are mainly located over equatorial Africa (Fig. 3b). Significantly more stratospheric cirrus clouds are present at southern high latitudes, and the frequency at southern middle latitudes increases to ∼2 % (Fig. 4b).
From June to August (JJA), stratospheric cirrus clouds in the tropics are mainly located in the deep convection regions of the ITCZ that are now north of the Equator over Middle America, southern Asia, southern India, and the Bay of Bengal (Fig. 3c). The regional mean frequency for the tropics in JJA (Fig. 4c) may be slightly underestimated as the highest frequency is located at 20∘ N. Many stratospheric cirrus clouds are detected over southern middle and high latitudes during this time. The percentages of stratospheric cirrus clouds showing up over central northern America and northern Asia are 4 % and 8 %, respectively, but observations are missing at northern high latitudes due to the satellite's orbit (Fig. 3c). In the oceanic downwind region of the southern tip of South America, a band with 4 %–8 % of stratospheric cirrus cloud observations is visible (Fig. 3c). The regional mean frequencies for southern and northern middle latitudes are 3.1 % and 1.8 % in JJA (Fig. 4c).
In SON, the hotspots of stratospheric cirrus clouds in the tropics are located between 20∘ S and 20∘ N, with maximum frequencies not exceeding 36 % (Fig. 3d) and a mean frequency of about 10 % (Fig. 4d). Similar frequencies are found over the middle and high latitudes of both hemispheres. The frequencies at the middle and high latitudes of both hemispheres are comparable and mostly below 4 % (Fig. 3d). On average, the stratospheric cirrus cloud occurrence frequencies are ∼2 % at northern and southern middle latitudes (Fig. 4d).
The seasonal shifts of the hotspots in the tropics perfectly match the location of high convective frequencies and of the overshooting precipitation features that are following the ITCZ (Schoeberl et al., 2019). The highest occurrence frequencies are observed south of the Equator in DJF and north of the Equator in JJA, which is in agreement with the seasonal distribution of high cirrus clouds (Wang et al., 1996; Iwasaki et al., 2015). Although the occurrence frequencies at middle latitudes are lower compared to the tropics, we see higher occurrence frequencies during the winter months. The stratospheric cirrus clouds at middle and high latitudes are located at and downwind of gravity wave hotspots (Hoffmann et al., 2013). In DJF, stratospheric cirrus clouds over North America, the Northern Hemisphere Atlantic, and Eurasia are correlated with orographically and convectively induced gravity wave hotspots, whereas the stratospheric cirrus clouds over the northern Pacific are solely correlated with deep convection (Hoffmann et al., 2013). In JJA, stratospheric cirrus clouds occur in the oceanic downwind region of the southern tip of South America, which is a strong hotspot of orographic gravity waves (Jiang et al., 2002; Hoffmann et al., 2013, 2016).
4.1 Night-time cloud top height occurrence frequencies in the UTLS
The CALIPSO and MIPAS occurrence frequencies of CTHs relative to the tropopause are compared globally, seasonally, and latitudinally resolved in Fig. 5. The analysis is restricted to night-time measurements because of the higher detection sensitivity of CALIPSO at night time (shown in Sect. 3.1). At all altitudes within the range of ±4 km around the tropopause, cirrus CTH fractions from MIPAS and CALIPSO show similar vertical distributions with the highest frequencies around the tropopause. A maximum of cirrus cloud top height occurrences around the tropopause is also reported in other studies relying on CALIPSO (e.g. Pan and Munchak, 2011; He et al., 2013) and ground-based lidar data (Goldfarb et al., 2001; Sivakumar et al., 2003; Seifert et al., 2007; Noël and Haeffelin, 2007).
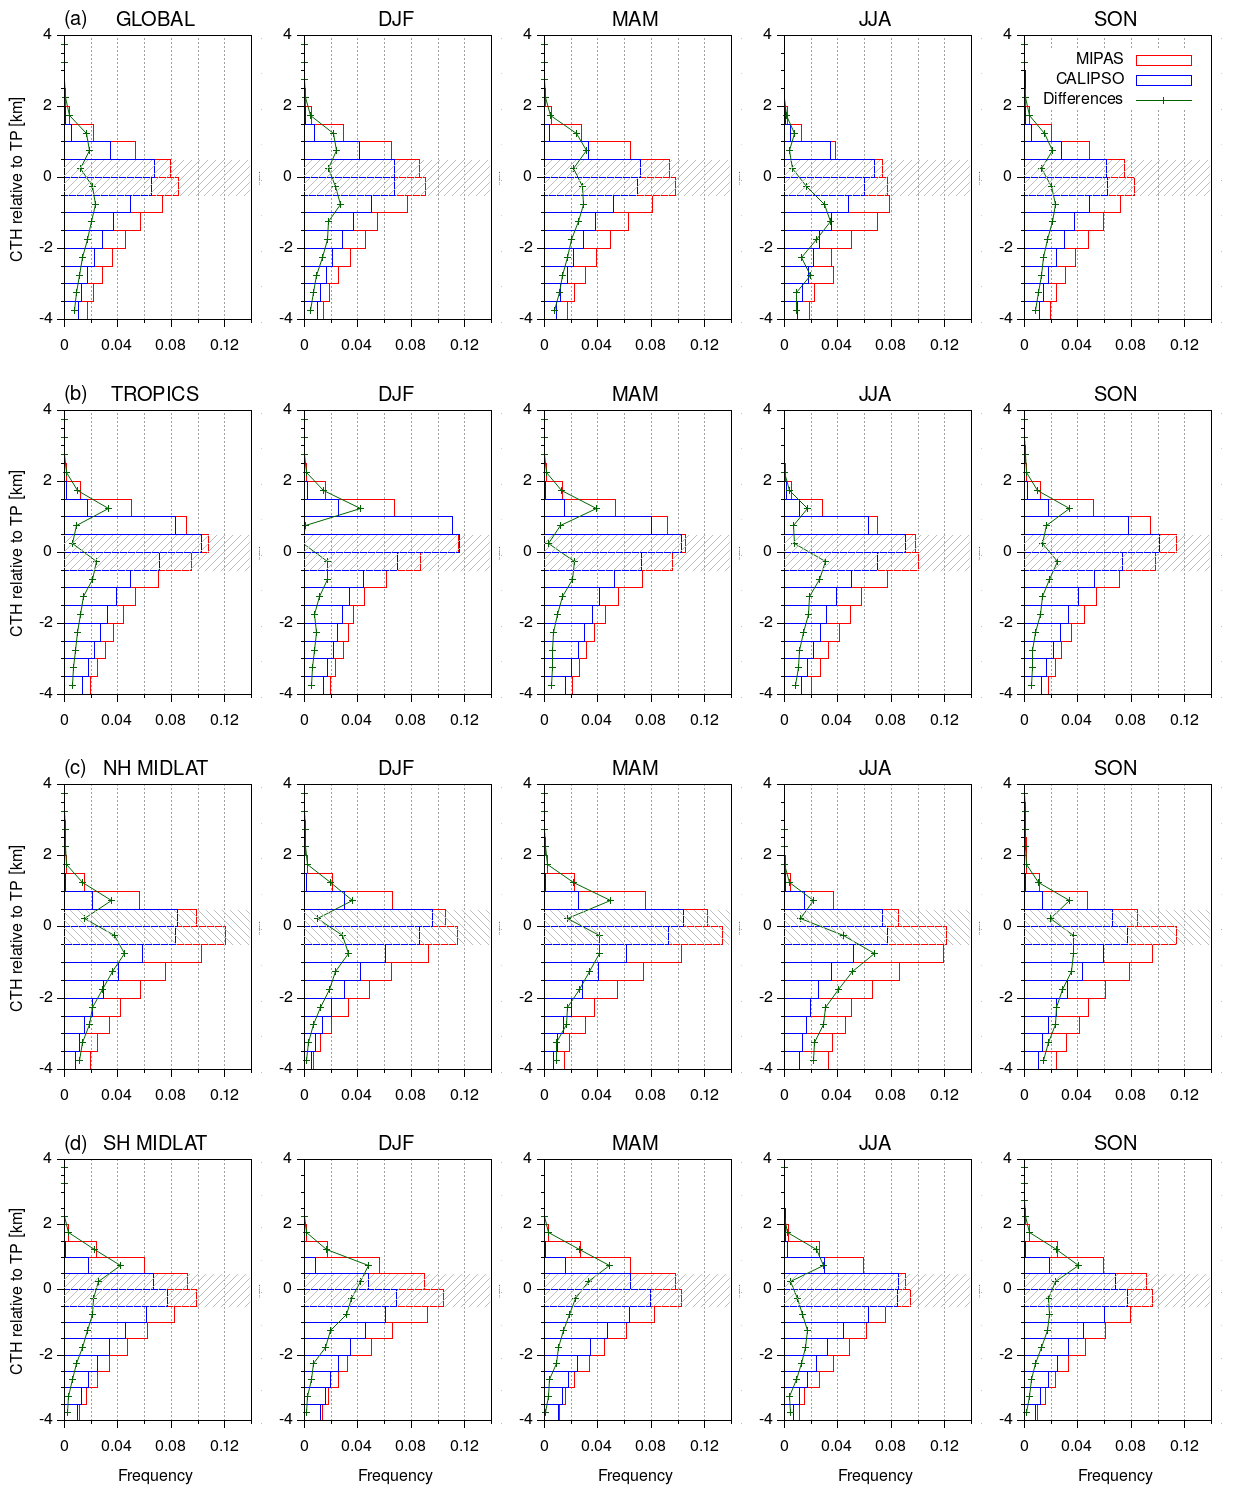
Figure 5Global and regional mean occurrence frequencies of CTHs relative to the tropopause from night-time measurements. The red bars indicate the MIPAS measurements, and blue bars indicate the CALIPSO measurements. The dotted green lines are the differences between MIPAS and CALIPSO measurements. The first column shows the total yearly mean values, and the other four columns are values for the four seasons DJF, MAM, JJA, and SON. The rows (a), (b), (c), and (d) present the average values over the globe, tropics, northern middle latitudes, and southern middle latitudes.
In most cases, MIPAS detects more cirrus clouds than CALIPSO, resulting in 2 percentage points (pps) more cirrus cloud detections for the all-year mean. The reasons for the generally higher frequencies observed by MIPAS are (a) a higher detection sensitivity towards optically thin cirrus clouds as its detection sensitivity goes down to optical depths (τ) of 10−5 (Sembhi et al., 2012), whereas the minimum optical depth for CALIPSO is about 10−3 (Martins et al., 2011), and (b) the long line of sight, which samples about 200 km around the tangent point, which makes MIPAS more likely to sample a cloud than the CALIPSO nadir measurements. We consider differences due to the diurnal cycle negligible as the CTH occurrence frequencies of high-altitude cirrus clouds in many cases are constant or even show a slight increase from 22:00 (MIPAS local Equator overpass time) to 01:30 (CALIPSO local Equator overpass time) (Noel et al., 2018; Fig. 5).
The absolute differences between MIPAS and CALIPSO CTH occurrence frequencies show two maxima above and below the tropopause. Only at the Southern Hemisphere middle latitudes is the maximum below the tropopause missing in DJF and MAM. On a global average, both maxima are comparable, but they vary depending on season and latitude. Regionally, in DJF and MAM the maximum in the stratosphere is dominant, and in JJA the maximum in the troposphere is more pronounced. The maximum differences at altitudes of 500 m above the tropopause are 3.3, 3.5, and 4.2 pps, and the average differences are 1.3, 1.2, and 1.7 pps in the tropics and southern and northern middle latitudes, respectively. The minimum difference is located at the tropopause and even reaches zero in the tropics.
MIPAS cloud measurements are known to overestimate cloud top heights by 0.75–1 km on average compared to CALIPSO (Sembhi et al., 2012), but the profiles in Fig. 5 do not exhibit any obvious altitude shift. In a recent study, Griessbach et al. (2020) showed that the uncertainty of the MIPAS cloud top heights depends on the cloud's optical thickness. For optically thick clouds (), MIPAS' altitude error is between −0.1 and 1.6 km (0.75 km on average), whereas for sub-visible cirrus clouds within CALIPSO's detection sensitivity range (), the MIPAS altitude error would be lower, between about −0.65 and 0.5 km on average.
4.2 Stratospheric cirrus clouds
Although a systematic cloud top height overestimation is not immediately visible in comparison to CALIPSO in Fig. 5, it is the largest challenge for the detection of stratospheric cirrus clouds with MIPAS. The most conservative approach to derive stratospheric cirrus clouds from MIPAS data would be counting only clouds with CTHs 1.6 km above the tropopause because this is the maximum possible overestimation for optically thick clouds due to MIPAS' field of view and vertical sampling (Griessbach et al., 2020). In practice, for the optically thickest clouds, the CTH uncertainty ranges from −0.1 to 1.6 km (Griessbach et al., 2020). Assuming that in our nearly 6 years of statistics the tangent heights are equally distributed with respect to the cloud top, we expected an average overestimation of 0.75 km. This value is in agreement with an average overestimation of 0.75 km derived from a comparison between MIPAS and CALIPSO measurements of 3-month averages of a summer and a winter season (Sembhi et al., 2012).
Here, we made the assumption that stratospheric cirrus clouds in the tropics have optical thicknesses that are detectable by CALIPSO. For fresh convection overshooting events, the optical thickness is above CALIPSO's detection limit (e.g. De Reus et al., 2009). However, for sub-visual cirrus clouds, CALIPSO was estimated to miss up to 66 % of them (Davis et al., 2010). An analysis of cloud occurrence frequencies of 3 years of Optical Spectrograph and InfraRed Imager System (OSIRIS) measurements showed that in the tropics on average about 13 % of the clouds between 12 and 25 km have an optical thickness below (Bourassa et al., 2005). Since CALIPSO's lower ice cloud detection limit is about , we assume that on average a small amount of sub-visible cirrus clouds in the tropics will be missed by CALIPSO. However, our main goal was to derive information on middle- and high-latitude stratospheric cirrus clouds, and, hence, we accepted an underestimation of tropical stratospheric cirrus and determined the optimal minimum distance to the tropopause for MIPAS cloud detections that minimizes the differences between MIPAS and CALIPSO stratospheric cloud occurrences in the tropics (Fig. 6a and Table 1).
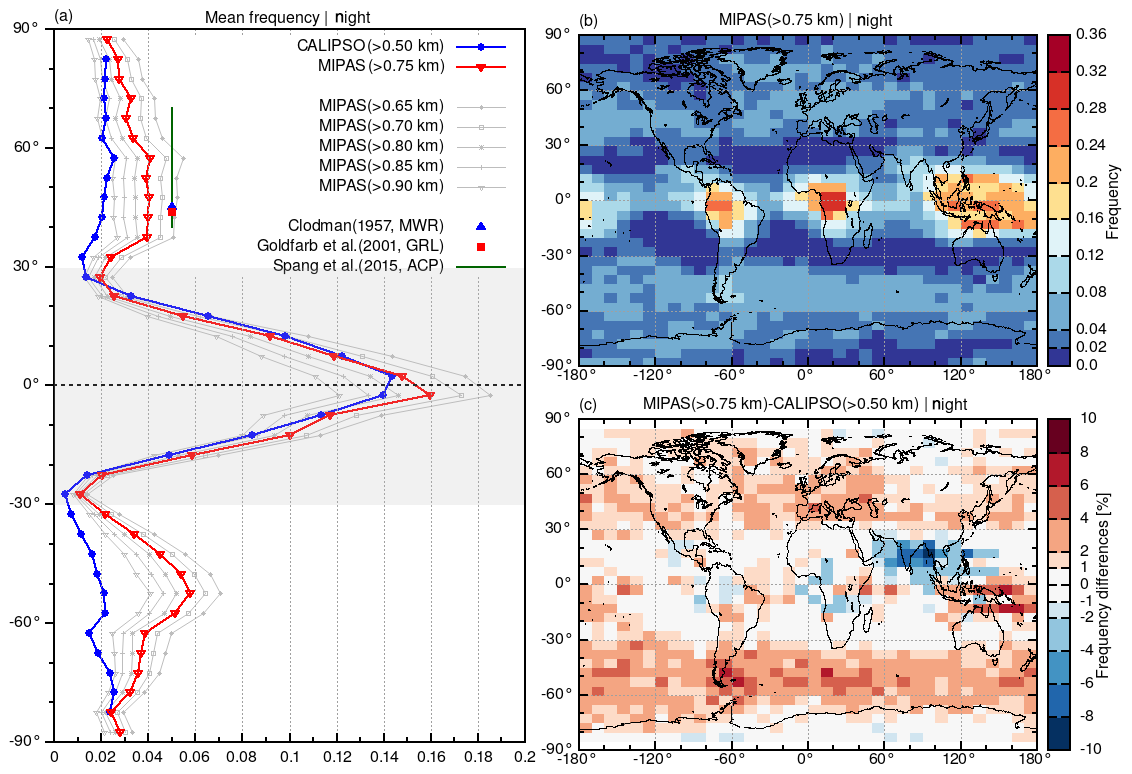
Figure 6Zonal mean CTH occurrence frequencies (a) and geospatial distribution on a latitude–longitude grid (b) of 6-year mean night-time occurrence frequencies of stratospheric cirrus clouds observed by MIPAS (CTHs >0.75 km above tropopause). (c) Difference between MIPAS and CALIPSO (CTHs >0.5 km above tropopause) occurrence frequencies.
Table 1Regional mean CTH occurrence frequencies of stratospheric cirrus clouds from CALIPSO and MIPAS measurements. MD-TP signifies the mean of the distances to the tropopause, and MIDLAT signifies middle latitude.
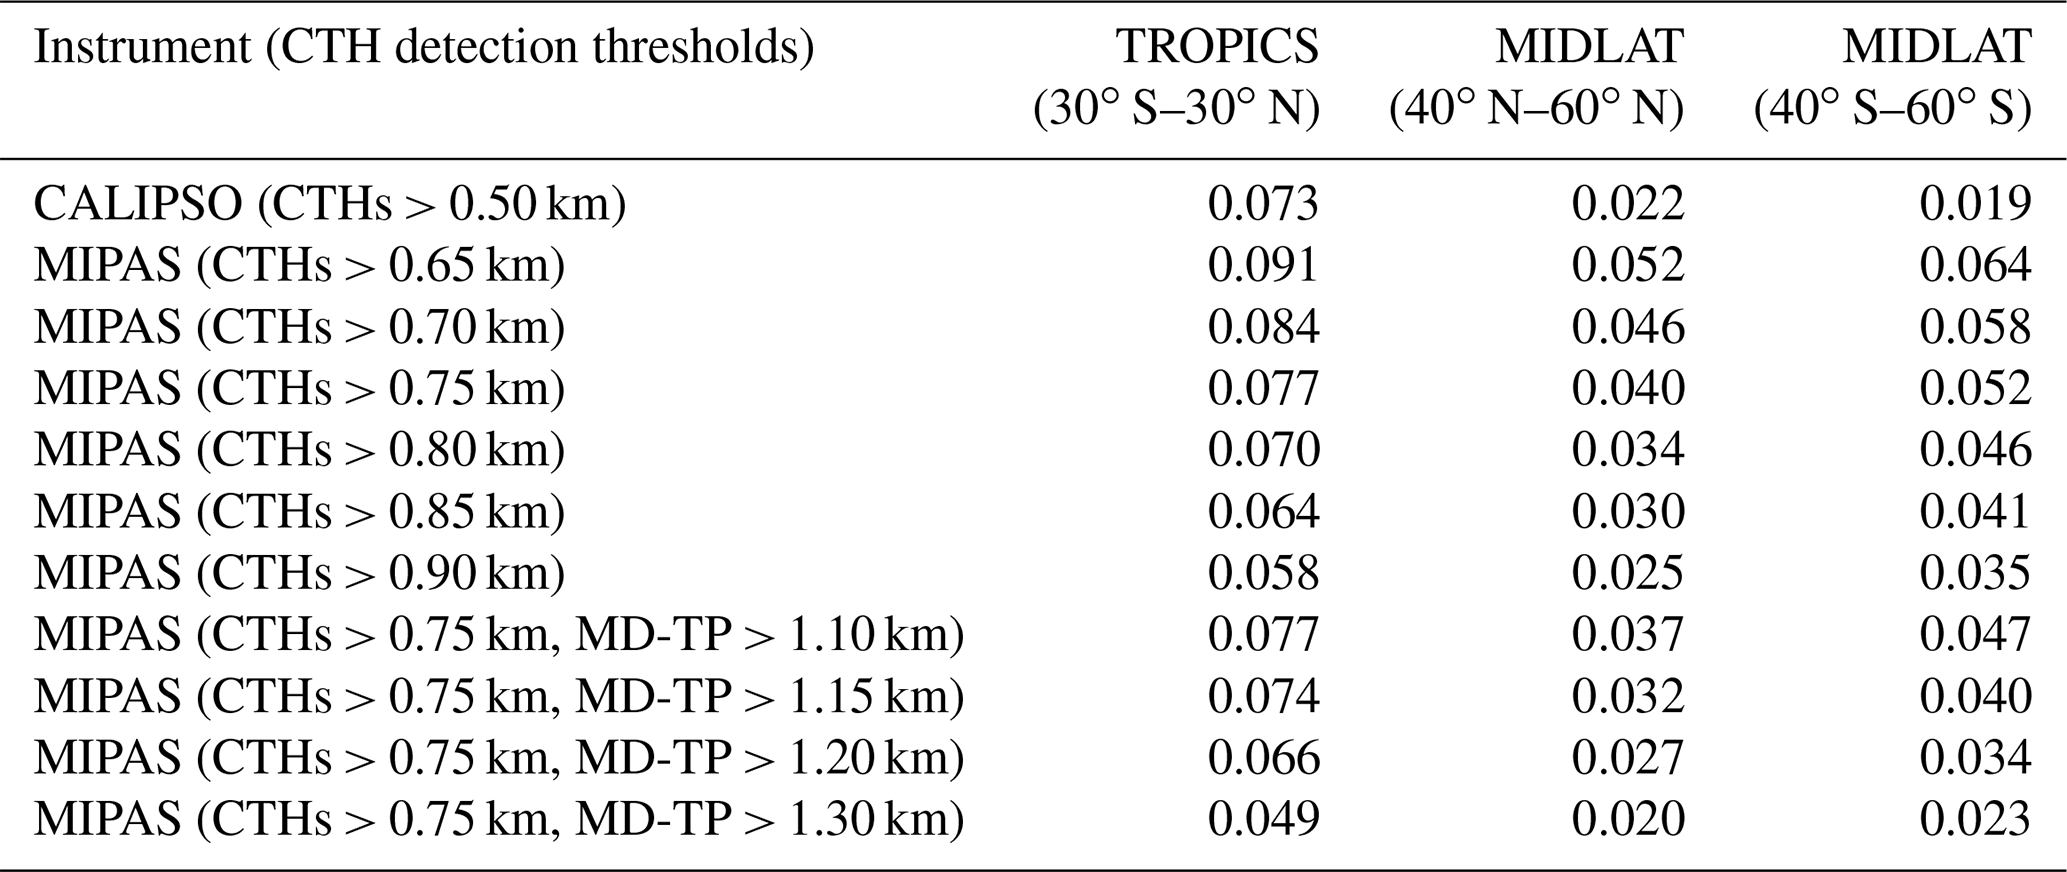
The minimum difference of stratospheric cirrus CTH frequencies in the tropics between CALIPSO (7.3 %) and MIPAS (7.7 %) is 0.4 pp when the minimum distance to the tropopause is 0.75 km for MIPAS (Fig. 6a and Table 1). Hence, we consider CTHs 0.75 km above the tropopause as stratospheric clouds for MIPAS. With a 0.75 km tropopause threshold for MIPAS, the CTH occurrence frequency of stratospheric cirrus clouds at northern middle latitudes is 4.0 % for MIPAS and ∼2.2 % for CALIPSO, and at southern middle latitudes it is 5.2 % for MIPAS and 1.9 % for CALIPSO. MIPAS observed 1.8 to 2.6 times more stratospheric cirrus clouds at middle latitudes than CALIPSO even though similar frequencies were found for the tropics.
The geospatial distribution of the CTH occurrence frequencies of stratospheric cirrus clouds observed by MIPAS and the differences to CALIPSO are presented in Fig. 6b and c. The general occurrence frequency patterns of both instruments are rather similar (Fig. 2b) with hotspots in the tropics over equatorial Africa, Southeast Asia, the western Pacific, and South America. However, significantly more stratospheric cirrus clouds are detected at middle and high latitudes by MIPAS. Although the average difference in the tropics is small, there are distinct patterns visible in the difference map (Fig. 6c). While MIPAS slightly underestimates the fractions of stratospheric cirrus clouds at the South American and equatorial African hotspot, it overestimates the Southeast Asian and western Pacific hotspot. The largest underestimation is found extending over the Indian peninsula and the Bay of Bengal with a maximum difference of 6–8 pps. The seasonal geospatial distribution of stratospheric cirrus clouds in Fig. 7e–h shows that this underestimation is related to the Asian summer monsoon, whereas the underestimation over South America and equatorial Africa occurs in all seasons. The overestimation over Southeast Asia and the western Pacific mostly occurs in MAM.
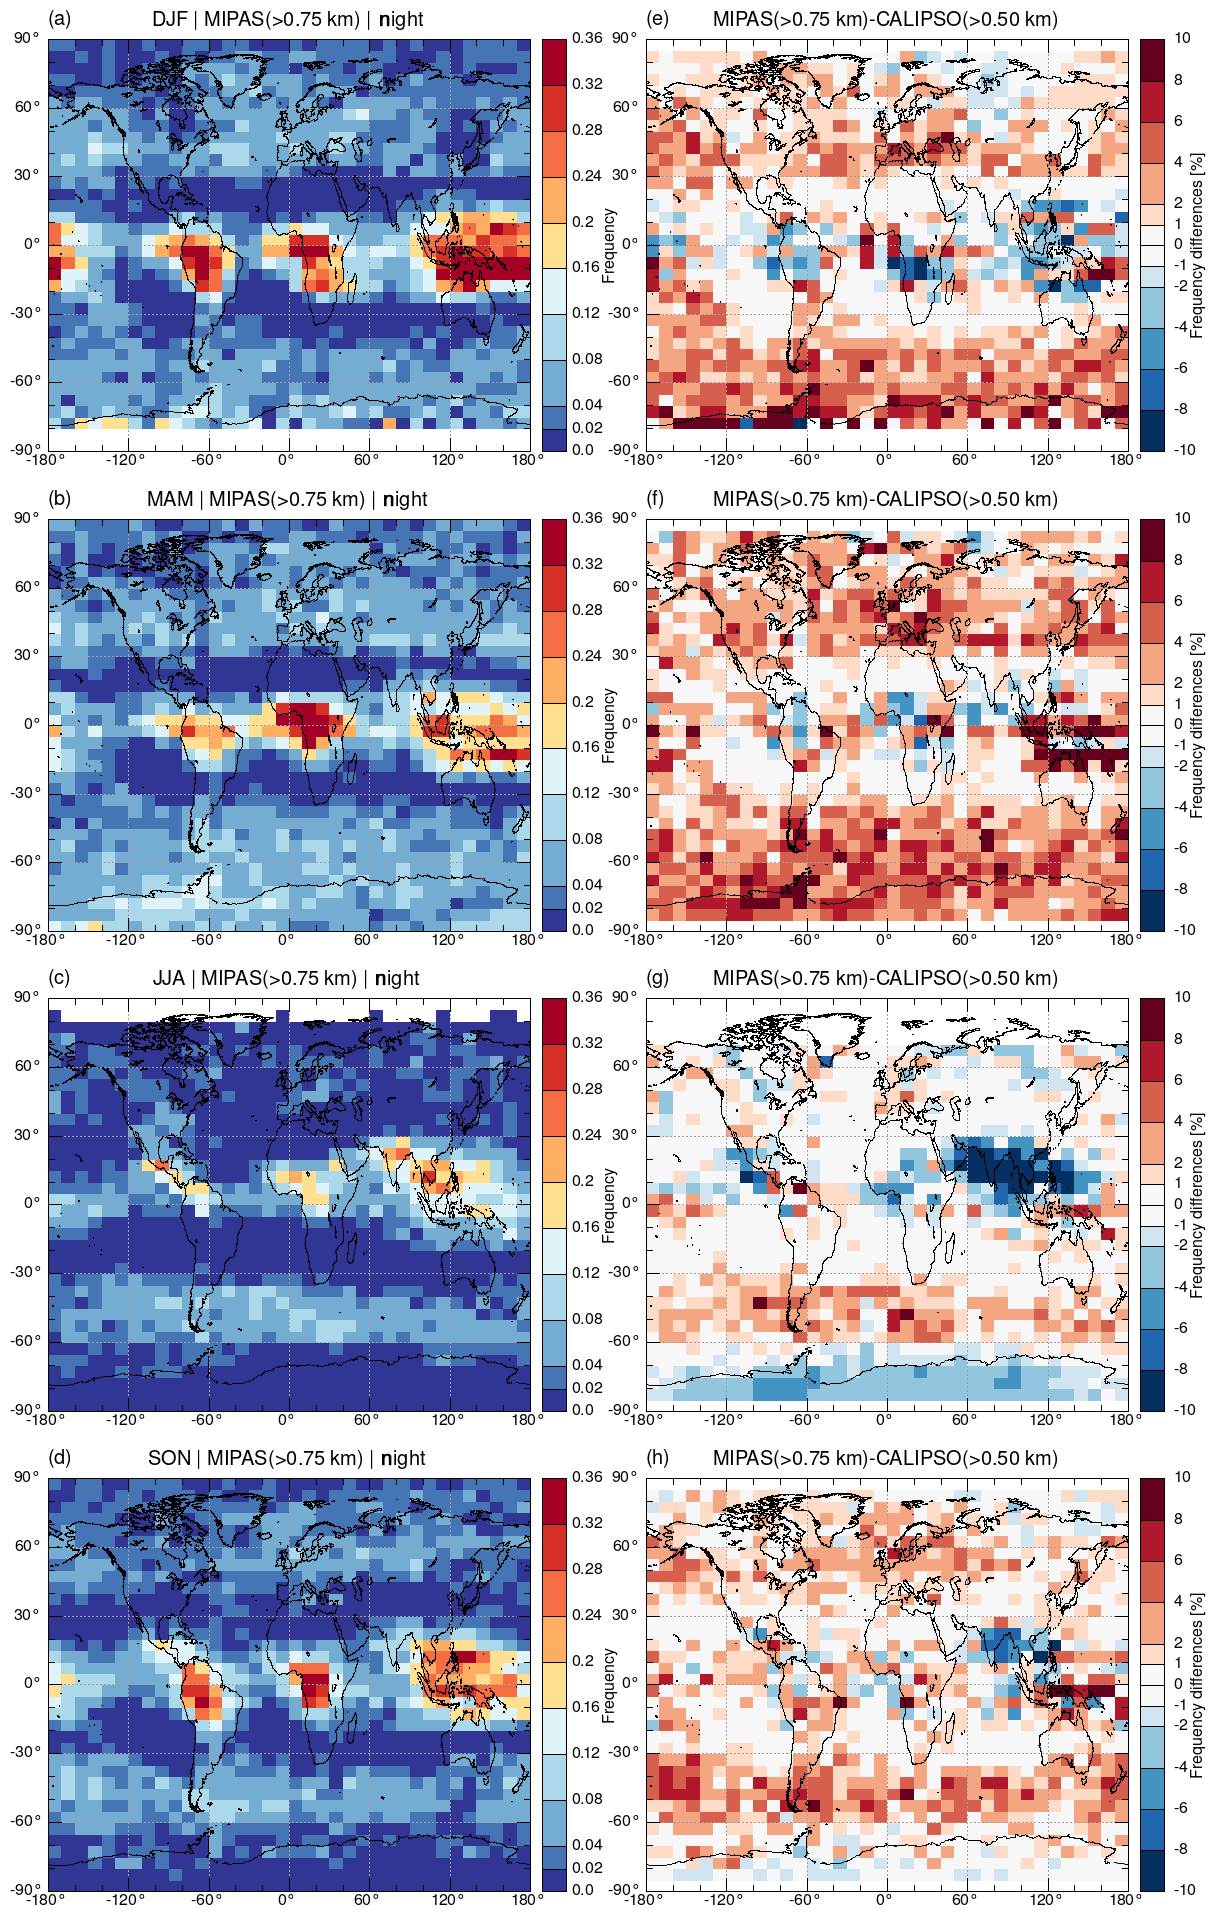
Figure 7Seasonal night-time mean CTH occurrence frequencies of stratospheric cirrus clouds observed by MIPAS (CTHs >0.75 km above tropopause) and the differences between MIPAS and CALIPSO (CTHs >0.50 km above tropopause). White boxes indicate that no stratospheric cirrus clouds were detected by MIPAS.
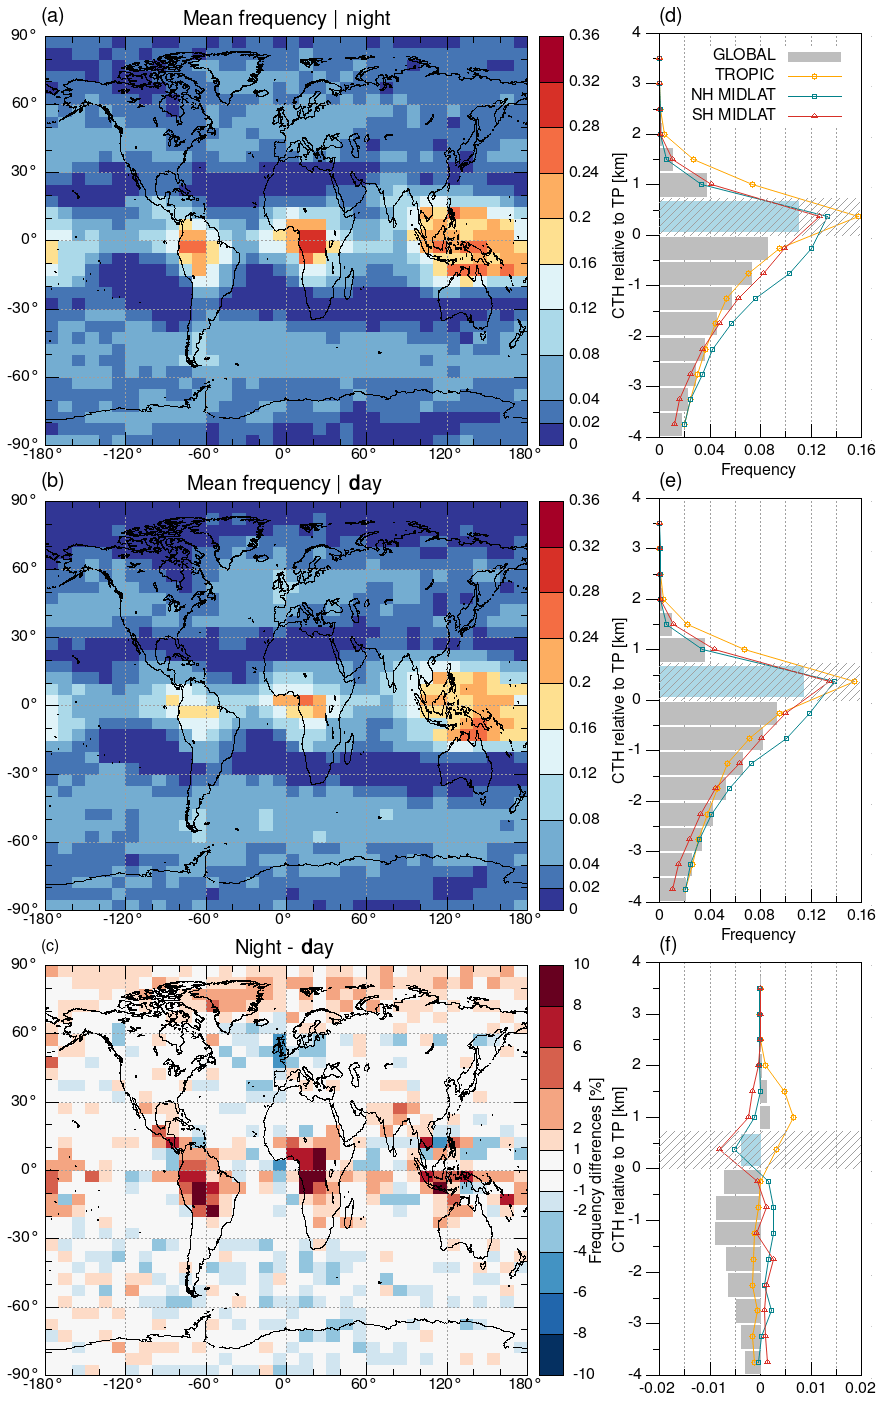
Figure 8Night-time (a) and daytime (b) CTH occurrence frequencies of stratospheric cirrus clouds derived from June 2006 to April 2012 MIPAS measurements. (c) Difference between MIPAS night-time and daytime occurrence frequencies. (d), (e), and (f) show the corresponding global mean frequencies of CTHs relative to the tropopause for night time and daytime and their difference, respectively. The MIPAS tropopause threshold from 0 to 0.75 km above the tropopause is marked grey.
As a possible cause for the higher occurrence frequencies found by MIPAS, we tested if a potentially non-sufficient aerosol filtering could have caused the higher detection frequencies in MIPAS data. Since we did not find any correlation with volcanic eruptions, which are the dominant source of MIPAS aerosol detections, we ruled this out.
The average occurrence frequency of 4 % derived from MIPAS at Northern Hemisphere middle latitudes is closer to the occurrence frequencies that were derived from previous in situ, ground-based, and space-based measurements. From 6 years of aircraft-based measurements over Canada between 1950 and 1956, Clodman (1957) derived an occurrence frequency of approximately 5 % for stratospheric cirrus clouds more than 2000 ft (0.61 km) above the tropopause. Despite the rather large measurement errors, Clodman (1957) considered this result “authentic”. From about 1 week of space-based CRISTA measurements in August 1997, Spang et al. (2015) also derived about 5 % of stratospheric cirrus clouds at middle and high latitudes (up to 70∘ N) for CTHs more than 0.5 km above the tropopause. In lidar data measured between 1997 and 1999 at Haute Provence, France (43.9∘ N), Goldfarb et al. (2001) also observed 5 % of clouds that had cloud top heights at least 1 km above the tropopause. We consider the higher detection sensitivity of MIPAS towards thin clouds as the reason for the approximately 2 times higher CTH occurrence frequencies of stratospheric cirrus clouds at northern middle latitudes, 3 times higher frequencies at southern middle latitudes, and 1.5 pps higher frequencies at high latitudes in MIPAS measurements, which was already suggested by the comparison of the CTH occurrence frequencies around the tropopause in Fig. 5.
At middle and high latitudes, MIPAS systematically observed more stratospheric clouds (Fig. 6c). In the Southern Hemisphere, the higher occurrence frequencies are in a band between about 35 and 70∘ S, and, in the Northern Hemisphere, they are more pronounced over the oceanic regions and Europe to western Russia. The higher occurrence frequencies at the middle latitudes show a seasonal dependence (Fig. 7a–d). During the summer months (JJA and DJF), the smallest cloud occurrence frequencies are present, which coincides with the generally observed pattern of high-altitude clouds in climatologies (Rossow and Schiffer, 1999). The highest regional mean frequencies at southern and northern middle latitudes for MIPAS are observed in MAM with values of 5.5 % and 3.3 %, respectively, while it is ∼2 % for CALIPSO. In DJF, nearly 1 % of middle- and high-latitude stratospheric cirrus clouds are detected by CALIPSO, but about 4 % are detected by MIPAS.
4.3 Diurnal cycle of cloud top height occurrences
The night-time measurements of MIPAS and CALIPSO differ by about 3.5 h in Equator crossing time (∼22:00 and ∼01:30). High-altitude cirrus clouds show little diurnal variation (Wylie et al., 1994). Over oceans, the high-altitude cloud occurrence measured by the Cloud-Aerosol Transport System (CATS) lidar is constant at middle latitudes and even slightly increases by up to 5 % between 30∘ N and 30∘ S (Noel et al., 2018; Fig. 6). Over land, the behaviour is the same except for Southern Hemisphere middle latitudes, which are considered less significant due to the small amount of land masses there (Noel et al., 2018; Fig. 6). Differences of stratospheric cloud fractions measured by CATS at ∼22:00 and ∼01:30 are less than 5 pps over equatorial Africa, South America, and the western Pacific in DJF and less than 2.5 pps over central Africa and northern warm pool (ocean) in JJA (Dauhut et al., 2020; Fig. 2). Ground-based radar measurements in the United States southern Great Plains show that the cloud occurrence frequencies differ by less than 2 pps between 22:00 and 01:30 (Zhao et al., 2017). Hence, the contribution of the diurnal cycle on cloud occurrence frequencies between CALIPSO and MIPAS is negligible.
Due to the same detection sensitivity of MIPAS for daytime and night-time measurements, we also analysed the daytime data. The MIPAS night-time and daytime stratospheric cirrus cloud statistics are compared in Fig. 8. The highest occurrence frequencies are observed in the tropics, where the daytime occurrence frequencies are about 1 pp smaller. At the middle latitudes, the daytime occurrence frequencies are slightly larger by less than 0.5 pp.
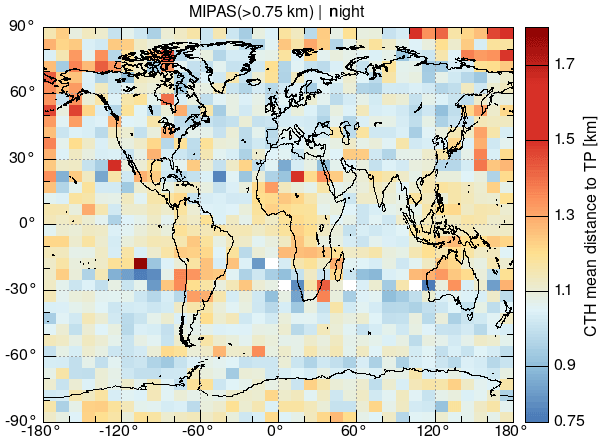
Figure 9Mean distance of the MIPAS stratospheric cirrus CTHs to the tropopause in each grid box for the data shown in Fig. 6b.
Assuming that stratospheric cirrus clouds correlate with high-altitude cirrus clouds, the result at middle latitudes is in agreement with the radar measurements above the United States southern Great Plains where total yearly mean cloud occurrence frequencies differ by less than 2 pps between 10:00 and 22:00 (Zhao et al., 2017) and where the CATS lidar measurements of high-altitude cirrus clouds show a deviation of less than 1 % from the total daily mean at the middle latitudes except at Southern Hemisphere middle latitudes over land (Noel et al., 2018).
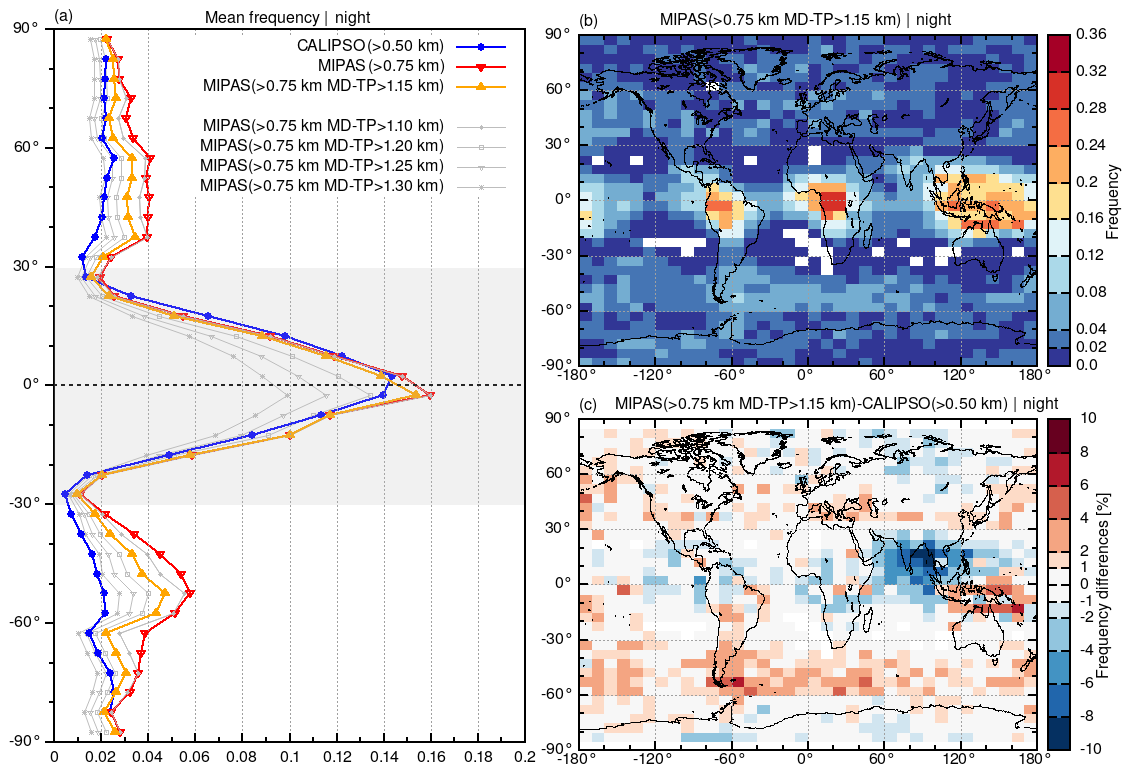
Figure 10Sensitivity test on MIPAS stratospheric cirrus cloud detections applying an additional criterion regarding the mean distance of the CTHs to the tropopause (MD-TP) for each grid box (see text for details). Plots show (a) zonal mean CTH occurrence frequencies, (b) geospatial distribution of CTH occurrence frequencies, and (c) differences between MIPAS and CALIPSO night-time occurrence frequencies.
In the tropics, the deviations of high-altitude cirrus clouds from the total daily mean between 10:00 and 22:00 observed by CATS in JJA are up to 3 % over ocean and reach up to about 18 % over land, where the larger occurrence frequencies are found during night time (Noel et al., 2018). Although these numbers appear large, 18 % of an average daily high-altitude cloud occurrence frequency of 20 % (Figs. 2 and 3 in Noel et al., 2018) means an absolute difference of 3.6 pps. CATS daytime data misses about 5 % of night-time clouds due to a lower lidar sensitivity during daytime (Noel et al., 2018), which means a further reduction of the difference by 1 to 2.6 pps. Finally, the absolute difference of 2.6 pps between daytime and night-time occurrence frequencies derived from CATS is valid for JJA, whereas the 1 pp difference between MIPAS daytime and night-time occurrence frequencies is valid for the total yearly mean. A recent study on stratospheric cirrus cloud occurrences in the tropics derived from CATS measurements reports differences of about 3 to 10 pps in DJF and 5 to 7 pps in JJA between 10:00 and 22:00 (Dauhut et al., 2020). This differs from our results that show only 1 pp difference between 10:00 and 22:00 measurements. As the detection sensitivity of CATS measurements averaged over 5 km during daytime is about 1.5 orders of magnitude lower than during night time (Yorks et al., 2016), we consider the different detection sensitivities of CATS daytime and night-time measurements as the main cause for the differences.
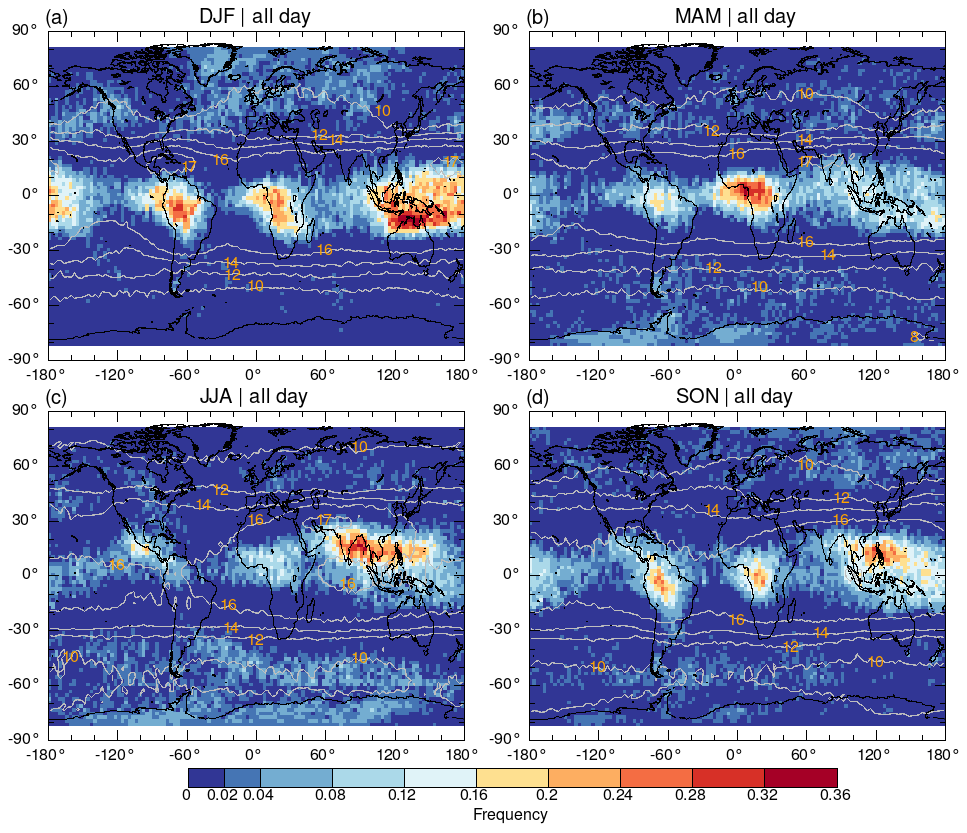
Figure 11All day (average of daytime and night time) seasonal CTH occurrence frequencies of stratospheric cirrus clouds derived from CALIPSO measurements between June 2006 and May 2010 for comparison with the results of Pan and Munchak (2011). The maps are gridded on a latitude–longitude grid. The grey contour lines indicate mean tropopause heights.
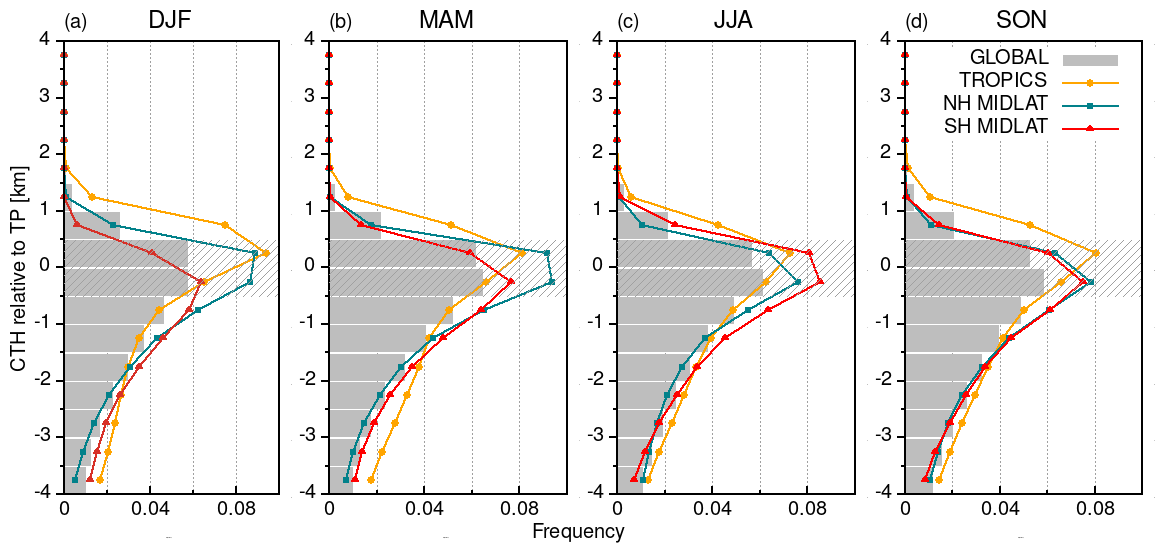
Figure 12Vertical distributions of all day (average of daytime and night time) CTHs relative to tropopause for four seasons, (a) DJF, (b) MAM, (c) JJA, and (d) SON, derived from CALIPSO observations between June 2006 and May 2010 for comparison with the results of Pan and Munchak (2011).
4.4 Sensitivity tests regarding the average distance to the tropopause
Figures 5 and 6 show that the occurrence frequencies of MIPAS and CALIPSO are closer to each other in the tropics than in the extra-tropics. To investigate potential sampling artefacts that arise from MIPAS sampling geometry, which approximately follows the tropopause, we calculated the mean of the distances of the CTHs of the stratospheric cirrus clouds to the tropopause (MD-TP) in each grid box. Here again, only night-time measurements were used. The means of the distances of the CTHs to the tropopause in Fig. 9 are larger in the tropics (1.1 to 1.3 km at the tropical hotspots) than at middle latitudes (0.75 to 1.0 km). Although these differences might relate to the 300 m low bias of the ERA-Interim tropopause heights in the tropics compared to GPS measurements and the different underlying causes for stratospheric cirrus clouds in the tropics, such as overshooting convection (De Reus et al., 2009; Iwasaki et al., 2015) and wave activity (Alexander et al., 2000) and, in the extra-tropics, such as double tropopause events (Noël and Haeffelin, 2007), we introduced an additional criterion for the MD-TP so that it is more homogeneous at all latitudes to rule out sampling artefacts. To do so, we removed the lowest CTHs in each grid box until the required mean distance to the tropopause was reached, and hence we reduced the number stratospheric cirrus counts.
Figure 10a and Table 1 show that with greater distance to the tropopause the zonal mean occurrence frequencies decrease. Again, we aimed for an optimal agreement between MIPAS and CALIPSO in the tropics, assuming that both instruments should have similar detection capabilities here. The minimum difference between MIPAS and CALIPSO in the tropics was achieved (0.1 pp) for a MD-TP larger than 1.15 km. In this scenario for MIPAS (CTHs >0.75 km and MD-TP >1.15 km), the CTH occurrence frequencies of stratospheric cirrus clouds are 3.2 % at Northern Hemisphere middle latitudes and 4.0 % at Southern Hemisphere middle latitudes. This is ∼0.5 to 0.7 pp smaller than for the statistics counting all clouds at 0.75 km above the tropopause but still up to a factor of 2 larger than the CALIPSO occurrence frequencies. The overall stratospheric cloud occurrence patterns in Fig. 10b remain the same as in Fig. 6b, but the positive differences in the extra-tropics are reduced, and the already strong negative difference related to the Asian summer monsoon got even stronger (compare Figs. 6c and 10c). Hence, we conclude that MIPAS' vertical sampling pattern is not the cause for the greater CTH occurrence frequencies detected at middle latitudes.
As different sampling volumes in MIPAS and CALIPSO may produce uncertainties, we calculated the fraction of stratospheric cirrus clouds in UTLS clouds (tropopause ±4 km) instead of in all profiles. This way a potential uncertainty due to the sampling volume is present in the nominator and denominator and hence should cancel out. While the absolute number of occurrence frequencies of stratospheric cirrus clouds in UTLS clouds increases compared to the occurrence frequencies of stratospheric cirrus clouds in all profiles, the factor between MIPAS and CALIPSO stratospheric cloud occurrence frequencies at middle latitudes remains the same, indicating that our result is robust and the different sampling volumes do not impair our results. Moreover, tropical cirrus layers near the tropopause extend horizontally over hundreds to thousands of kilometres (Winker and Trepte, 1998), and over half the horizontal scales of cirrus clouds at 16–17 km altitude are larger than 100 km (Massie et al., 2010). Due to the large horizontal scale of tropopause layer cirrus clouds, the effect of the sampling volume on the detection of CTH occurrence frequencies with MIPAS and CALIPSO would be negligible.
The CALIPSO level 2 V4.x data product used in this study was significantly improved with respect to the aerosol and cloud classification (Liu et al., 2019) and the cloud detection sensitivity by applying more accurate calibration algorithms, higher lidar ratios, and lower attenuated backscatter coefficients (Kar et al., 2018; Vaughan et al., 2019; Young et al., 2018) compared to the CALIPSO V3 data product that was used by Pan and Munchak (2011). To investigate the impact of these improvements, we analysed the distribution of CTHs with respect to the tropopause for the same 4 years of CALIPSO measurements from June 2006 to May 2010, the same stratospheric cirrus cloud definition (0.5 km above the local tropopause), and the same latitude–longitude grid as in Pan and Munchak (2011). In contrast to Pan and Munchak (2011), we applied a PSC filter for polar winter conditions.
The geospatial distribution of stratospheric cirrus clouds, shown in Fig. 11 using the same 2 latitude–longitude grid as Fig. 7 in Pan and Munchak (2011), exhibits similar patterns with the highest CTH frequencies of stratospheric cirrus clouds in the tropics but with larger absolute values in our study. At middle latitudes, more grid points with frequencies of 4 %–8 % are found over the northern Pacific Ocean, the northern Atlantic Ocean, northern Asia, the southern Atlantic, and the southern Indian Ocean in our study (Fig. 11). At high latitudes (>60∘) during polar winter, both our study and Pan and Munchak (2011) show enhanced CTH frequencies, but the occurrence frequencies of Pan and Munchak (2011) are significantly larger, reaching up to 24 % compared to up to ∼8 % in our study. This difference we attribute to the PSC filtering that was applied in our study.
We compared the seasonally resolved vertical distribution of cirrus clouds around the tropopause, shown in Fig. 12, with Fig. 10 in Pan and Munchak (2011). In both data sets, the maximum frequencies appear around the tropopause (±0.5 km), and the highest CTH occurrence frequencies in the tropics are found in DJF, at Northern Hemisphere middle latitudes also in DJF, and at Southern Hemisphere middle latitudes in JJA. However, in our study the occurrence frequencies are about 1 to 3 pps higher in the tropics and about 0.5 pp higher at Northern Hemisphere middle latitudes. Hence, using CALIPSO V4.x data and tropopauses derived from ERA-Interim results in notably larger CTH occurrence frequencies of stratospheric cirrus clouds than those derived by Pan and Munchak (2011).
In this study, we derived global stratospheric cirrus clouds from the mid-infrared limb emission sounder MIPAS and the CALIPSO lidar level 2 version 4.x data for the time period between June 2006 and April 2012 that was covered by both instruments. The local tropopause heights for each satellite profile were derived from the ERA-Interim reanalysis using the World Metrological Association (WMO) criteria for the first thermal tropopause.
For CALIPSO, cirrus cloud top heights more than 0.5 km above the local tropopause were considered stratospheric. Due to the better detection sensitivity of CALIPSO night-time measurements, we only considered the night-time measurements. The highest CTH occurrence frequencies of stratospheric cirrus clouds were found in the tropics over the continents of equatorial Africa, South and Southeast Asia, and South America, and the western Pacific warm pool. The hotspots follow the ITCZ, and the maximum occurrence frequencies reached more than 36 % in DJF. The zonal mean CTH occurrence frequency of stratospheric cirrus in the tropics is about 7 %. A secondary, but much weaker, stratospheric cirrus cloud cluster is located at the middle latitudes of both hemispheres with a zonal mean occurrence frequency of about 2 % and occurrence frequencies of up to 12 %. Our findings qualitatively agree with the results of Pan and Munchak (2011) but are quantitatively higher. One reason for the higher frequencies is that we looked at night-time data only. In addition, the comparison of night and day averages for the same time period as investigated by Pan and Munchak (2011) showed that using the combination of CALIPSO V4.x data and ERA-Interim causes higher occurrence frequencies, e.g. reaching up to 36 % in several grid boxes in DJF compared to a maximum of 32 % in a single grid box in Pan and Munchak (2011), who used CALIPSO V3 data and GFS tropopauses.
The largest challenge for deriving stratospheric cirrus clouds from MIPAS data was its rather large field of view and the vertical sampling of 1.5 km. Although MIPAS is known to overestimate cloud top heights of optically thin and thick clouds (τ>0.03) by about 0.75 km on average (Sembhi et al., 2012; Griessbach et al., 2020), we did not find an obvious altitude offset when comparing MIPAS and CALIPSO cloud occurrence frequencies relative to the tropopause (Fig. 5). But MIPAS systematically provided higher cloud occurrence frequencies than CALIPSO night-time measurements. We attributed the overall higher detection frequencies to MIPAS' larger sampling volume at the tangent point and the higher detection sensitivity reaching down to the cloud optical depth (τ) of 10−5 compared to 10−3 for CALIPSO.
However, to make sure we did not overestimate cloud top heights especially at the middle latitudes, we scaled the MIPAS stratospheric CTH occurrence frequencies in the tropics to those of CALIPSO. The minimum difference between MIPAS and CALIPSO was observed when MIPAS CTHs were more than 0.75 km above the tropopause. While the overall patterns and the average occurrence frequency in the tropics agreed, we found about 2 to 3 times more stratospheric cirrus clouds (up to 6 %) at the middle and high latitudes than for CALIPSO (up to 2.5 %). In a further sensitivity test to exclude sampling artefacts of MIPAS changing tangent heights with latitude, we investigated the mean distance of the stratospheric cirrus clouds to the tropopause. For a mean distance of 1.15 km, we found the best agreement with CALIPSO in the tropics. Since the mean distance to the tropopause is larger than the 0.75 km above-the-tropopause criterion, the number of stratospheric cirrus clouds at middle and high latitudes became smaller (up to 4 %) but was still by a factor of 2 larger than for CALIPSO. The CTH occurrence frequencies of stratospheric cirrus clouds derived from MIPAS are closer to the occurrence frequencies of about 5 %–7 % found in previous studies at middle latitudes (Clodman, 1957; Goldfarb et al., 2001; Spang et al., 2015). Although we cannot definitely quantify the occurrence frequencies from MIPAS, we conclude that more stratospheric cirrus clouds are present and that they are optically thin – too thin to be detected by CALIPSO.
The comparison of MIPAS daytime and night-time measurements showed slightly higher occurrence frequencies in the tropics during night time with a zonal mean of about 1 pp and slightly lower occurrence frequencies at middle latitudes with a zonal mean of about 0.5 pp (Fig. 8). This result is in-line with other observations of high-altitude cirrus clouds that show little diurnal cycle with thin cirrus clouds in particular showing no obvious diurnal pattern (Wylie et al., 1994). The comparison of CALIPSO daytime and night-time stratospheric cirrus cloud occurrence frequencies shows significantly higher occurrence frequencies in the tropics of 10 % during night time compared to 4 % during daytime. At middle latitudes the occurrence frequencies also differ by a factor of 2 with 2 % at night time and 1 % at daytime (Fig. 2). This difference is due to the different detection sensitivities between CALIPSO daytime and night-time measurements. From this we conclude that stratospheric cirrus clouds are optically thin, and for this type of cloud CALIPSO operates at its detection limit.
We revisited global stratospheric cirrus clouds with satellite observations with high vertical resolution and high detection sensitivity in this work. More stratospheric cirrus clouds were detected at middle latitudes with higher detection sensitivity measurements. Future work will have to assess the impact of these optically thin cirrus clouds on the radiative budget and climate. Furthermore, the individual characteristics of a single satellite sensor, i.e. its detection sensitivity and spatio-temporal coverage and resolution, may still pose limitations for the results. Future work using both high-resolution and high-detection-sensitivity measurements, or combining different measurement techniques, will push forward a better understanding of the characteristics and distributions of stratospheric cirrus clouds on a global scale.
Stratospheric cirrus cloud top heights from CALIPSO and MIPAS are available upon request from the contact author, Ling Zou (l.zou@fz-juelich.de; cheryl_zou@whu.edu.cn). MIPAS cloud data including aerosol and ice cloud flags are available at https://datapub.fz-juelich.de/slcs/mipas/aerosol_clouds/index.html (last access: 25 March 2020, Griessbach and Hoffmann, 2020). Tropopause data are available at https://www.re3data.org/repository/r3d100013201 (last access: 25 March 2020, Hoffmann, 2020).
LZ, SG, and LH conceived the study design. LZ conducted the formal analysis and compiled the results. SG provided the MIPAS data. LH provided the ERA-Interim tropopause data. BG and LCW supported the CALIPSO data processing. LZ wrote the paper with contributions from all co-authors.
The authors declare that they have no conflict of interest.
CALIPSO data were obtained from the NASA Langley Research Center Atmospheric Science Data Center. The MIPAS data were provided by the European Space Agency. The ERA-Interim reanalysis data were obtained from the European Centre for Medium-Range Weather Forecasts. We gratefully acknowledge the computing time granted on the supercomputers JURECA and JUWELS at Forschungszentrum Jülich. We would like to thank Reinhold Spang from the Forschungszentrum Jülich for useful discussions.
The authors are grateful to the reviewers for their time and valuable comments that improved the paper.
This research has been supported by the National Natural Science Foundation of China (grant no. 41801021) and the International Postdoctoral Exchange Fellowship Program (grant no. 20181010).
The article processing charges for this open-access
publication were covered by a Research
Centre of the Helmholtz Association.
This paper was edited by Matthias Tesche and reviewed by Vincent Noel and one anonymous referee.
Alexander, M. J., Beres, J. H., and Pfister, L.: Tropical stratospheric gravity wave activity and relationships to clouds, J. Geophys. Res.-Atmos., 105, 22299–22309, https://doi.org/10.1029/2000JD900326, 2000. a
Berry, E. and Mace, G. G.: Cloud properties and radiative effects of the Asian summer monsoon derived from A-Train data, J. Geophys. Res., 119, 9492–9508, https://doi.org/10.1002/2014JD021458, 2014. a
Bourassa, A. E., Degenstein, D. A., and Llewellyn, E. J.: Climatology of the subvisual cirrus clouds as seen by OSIRIS on Odin, in: Advances in Space Research, Vol. 36, Elsevier Ltd., 807–812, https://doi.org/10.1016/j.asr.2005.05.045, 2005. a
Chan, M. A. and Comiso, J. C.: Arctic cloud characteristics as derived from MODIS, CALIPSO, and cloudsat, J. Clim., 26, 3285–3306, https://doi.org/10.1175/JCLI-D-12-00204.1, 2013. a
Clodman, J.: Some statistical aspects of cirrus cloud, Mon. Weather Rev., 85, 37–41, https://doi.org/10.1175/1520-0493(1957)085<0037:SSAOCC>2.0.CO;2, 1957. a, b, c, d
Corti, T., Luo, B. P., Fu, Q., Vömel, H., and Peter, T.: The impact of cirrus clouds on tropical troposphere-to-stratosphere transport, Atmos. Chem. Phys., 6, 2539–2547, https://doi.org/10.5194/acp-6-2539-2006, 2006. a
Dauhut, T., Noel, V., and Dion, I.-A.: The diurnal cycle of the clouds extending above the tropical tropopause observed by spaceborne lidar, Atmos. Chem. Phys., 20, 3921–3929, https://doi.org/10.5194/acp-20-3921-2020, 2020. a, b
Davis, S., Hlavka, D., Jensen, E., Rosenlof, K., Yang, Q., Schmidt, S., Borrmann, S., Frey, W., Lawson, P., Voemel, H., and Bui, T. P.: In situ and lidar observations of tropopause subvisible cirrus clouds during TC4, J. Geophys. Res.-Atmos., 115, D00J17, https://doi.org/10.1029/2009JD013093, 2010. a, b
Dee, D. P., Uppala, S. M., Simmons, A. J., Berrisford, P., Poli, P., Kobayashi, S., Andrae, U., Balmaseda, M. A., Balsamo, G., Bauer, P., Bechtold, P., Beljaars, A. C. M., van de Berg, L., Bidlot, J., Bormann, N., Delsol, C., Dragani, R., Fuentes, M., Geer, A. J., Haimberger, L., Healy, S. B., Hersbach, H., Hólm, E. V., Isaksen, L., Kållberg, P., Köhler, M., Matricardi, M., McNally, A. P., Monge-Sanz, B. M., Morcrette, J.-J., Park, B.-K., Peubey, C., de Rosnay, P., Tavolato, C., Thépaut, J.-N., and Vitart, F.: The ERA-Interim reanalysis: configuration and performance of the data assimilation system, Q. J. Roy. Meteor. Soc., 137, 553–597, https://doi.org/10.1002/qj.828, 2011. a
De Reus, M., Borrmann, S., Bansemer, A., Heymsfield, A. J., Weigel, R., Schiller, C., Mitev, V., Frey, W., Kunkel, D., Kürten, A., Curtius, J., Sitnikov, N. M., Ulanovsky, A., and Ravegnani, F.: Evidence for ice particles in the tropical stratosphere from in-situ measurements, Atmos. Chem. Phys., 9, 6775–6792, https://doi.org/10.5194/acp-9-6775-2009, 2009. a, b, c
Dessler, A. E.: Clouds and water vapor in the Northern Hemisphere summertime stratosphere, J. Geophys. Res.-Atmos., 114, https://doi.org/10.1029/2009JD012075, 2009. a, b
Dessler, A. E., Ye, H., Wang, T., Schoeberl, M. R., Oman, L. D., Douglass, A. R., Butler, A. H., Rosenlof, K. H., Davis, S. M., and Portmann, R. W.: Transport of ice into the stratosphere and the humidification of the stratosphere over the 21st century, Geophys. Res. Lett., 43, 2323–2329, https://doi.org/10.1002/2016GL067991, 2016. a
Dinh, T., Durran, D. R., and Ackerman, T.: Cirrus and water vapor transport in the tropical tropopause layer-Part 1: A specific case modeling study, Atmos. Chem. Phys., 12, 9799–9815, https://doi.org/10.5194/acp-12-9799-2012, 2012. a
Eleftheratos, K., Zerefos, C. S., Zanis, P., Balis, D. S., Tselioudis, G., Gierens, K., and Sausen, R.: A study on natural and manmade global interannual fluctuations of cirrus cloud cover for the period 1984-2004, Atmos. Chem. Phys., 7, 2631–2642, https://doi.org/10.5194/acp-7-2631-2007, 2007. a
Fischer, H., Birk, M., Blom, C., Carli, B., Carlotti, M., Von Clarmann, T., Delbouille, L., Dudhia, A., Ehhalt, D., Endemann, M., Flaud, J. M., Gessner, R., Kleinert, A., Koopman, R., Langen, J., López-Puertas, M., Mosner, P., Nett, H., Oelhaf, H., Perron, G., Remedios, J., Ridolfi, M., Stiller, G., and Zander, R.: MIPAS: An instrument for atmospheric and climate research, Atmos. Chem. Phys., 8, 2151–2188, https://doi.org/10.5194/acp-8-2151-2008, 2008. a
Fu, Q., Hu, Y., and Yang, Q.: Identifying the top of the tropical tropopause layer from vertical mass flux analysis and CALIPSO lidar cloud observations, Geophys. Res. Lett., 34, L14813, https://doi.org/10.1029/2007GL030099, 2007. a
Getzewich, B. J., Vaughan, M. A., Hunt, W. H., Avery, M. A., Powell, K. A., Tackett, J. L., Winker, D. M., Kar, J., Lee, K. P., and Toth, T. D.: CALIPSO lidar calibration at 532 nm: Version 4 daytime algorithm, Atmos. Meas. Tech., 11, 6309–6326, https://doi.org/10.5194/amt-11-6309-2018, 2018. a
Goldfarb, L., Keckhut, P., Chanin, M. L., and Hauchecorne, A.: Cirrus climatological results from lidar measurements at OHP (44∘ N, 6∘ E), Geophys. Res. Lett., 28, 1687–1690, https://doi.org/10.1029/2000GL012701, 2001. a, b, c, d
Griessbach, S. and Hoffmann, L.: MIPAS Aerosol and Cloud Profiles, available at: https://datapub.fz-juelich.de/slcs/mipas/aerosol_clouds/index.html, last access: 25 March 2020. a
Griessbach, S., Hoffmann, L., Spang, R., and Riese, M.: Volcanic ash detection with infrared limb sounding: MIPAS observations and radiative transfer simulations, Atmos. Meas. Tech., 7, 1487–1507, https://doi.org/10.5194/amt-7-1487-2014, 2014. a
Griessbach, S., Hoffmann, L., Spang, R., Von Hobe, M., Müller, R., and Riese, M.: Infrared limb emission measurements of aerosol in the troposphere and stratosphere, Atmos. Meas. Tech., 9, 4399–4423, https://doi.org/10.5194/amt-9-4399-2016, 2016. a, b, c
Griessbach, S., Hoffmann, L., Spang, R., Achtert, P., Von Hobe, M., Mateshvili, N., Müller, R., Riese, M., Rolf, C., Seifert, P., and Vernier, J.-P.: Aerosol and cloud top height information of Envisat MIPAS measurements, Atmos. Meas. Tech, 13, 1243–1271, https://doi.org/10.5194/amt-13-1243-2020, 2020. a, b, c, d, e
He, Q. S., Li, C. C., Ma, J. Z., Wang, H. Q., Shi, G. M., Liang, Z. R., Luan, Q., Geng, F. H., and Zhou, X. W.: The properties and formation of cirrus clouds over the Tibetan plateau based on summertime Lidar measurements, J. Atmos. Sci., 70, 901–915, https://doi.org/10.1175/JAS-D-12-0171.1, 2013. a
Hoffmann, L.: Reanalysis Tropopause Data Repository, available at: https://www.re3data.org/repository/r3d100013201, last access: 25 March 2020. a
Hoffmann, L., Xue, X., and Alexander, M. J.: A global view of stratospheric gravity wave hotspots located with atmospheric infrared sounder observations, J. Geophys. Res.-Atmos., 118, 416–434, https://doi.org/10.1029/2012JD018658, 2013. a, b, c
Hoffmann, L., Grimsdell, A. W., and Alexander, M. J.: Stratospheric gravity waves at Southern Hemisphere orographic hotspots: 2003–2014 AIRS/Aqua observations, Atmos. Chem. Phys., 16, 9381–9397, https://doi.org/10.5194/acp-16-9381-2016, 2016. a
Homeyer, C. R., Bowman, K. P., and Pan, L. L.: Extratropical tropopause transition layer characteristics from high-resolution sounding data, J. Geophys. Res.-Atmos., 115, D13108, https://doi.org/10.1029/2009JD013664, 2010. a
Hong, Y., Liu, G., and Li, J. L.: Assessing the radiative effects of global ice clouds based on CloudSat and CALIPSO measurements, J. Clim., 29, 7651–7674, https://doi.org/10.1175/JCLI-D-15-0799.1, 2016. a
Hunt, W. H., Vaughan, M. A., Powell, K. A., and Weimer, C.: CALIPSO lidar description and performance assessment, J. Atmos. Ocean. Technol., 26, 1214–1228, https://doi.org/10.1175/2009JTECHA1223.1, 2009. a
Iwasaki, S., Luo, Z. J., Kubota, H., Shibata, T., Okamoto, H., and Ishimoto, H.: Characteristics of cirrus clouds in the tropical lower stratosphere, Atmos. Res., 164/165, 358–368, https://doi.org/10.1016/j.atmosres.2015.06.009, 2015. a, b, c
Jiang, J. H., Wu, D. L., and Eckermann, S. D.: Upper Atmosphere Research Satellite (UARS) MLS observation of mountain waves over the Andes, J. Geophys. Res.-Atmos., 107, SOL 15-1–SOL 15-10, https://doi.org/10.1029/2002JD002091, 2002. a
Kar, J., Vaughan, M. A., Lee, K. P., Tackett, J. L., Avery, M. A., Garnier, A., Getzewich, B. J., Hunt, W. H., Josset, D., Liu, Z., Lucker, P. L., Magill, B., Omar, A. H., Pelon, J., Rogers, R. R., Toth, T. D., Trepte, C. R., Vernier, J. P., Winker, D. M., and Young, S. A.: CALIPSO lidar calibration at 532 nm: Version 4 nighttime algorithm, Atmos. Meas. Tech., 11, 1459–1479, https://doi.org/10.5194/amt-11-1459-2018, 2018. a
Kärcher, B.: Formation and radiative forcing of contrail cirrus, Nat. Commun., 9, 1–17, https://doi.org/10.1038/s41467-018-04068-0, 2018. a
Kärcher, B. and Solomon, S.: On the composition and optical extinction of particles in the tropopause region, J. Geophys. Res.-Atmos., 104, 27441–27459, https://doi.org/10.1029/1999JD900838, 1999. a
Keckhut, P., Hauchecorne, A., Bekki, S., Colette, A., David, C., and Jumelet, J.: Indications of thin cirrus clouds in the stratosphere at mid-latitudes, Atmos. Chem. Phys., 5, 3407–3414, https://doi.org/10.5194/acp-5-3407-2005, 2005. a
Lelieveld, J., Bregman, A., Scheeren, H. A., Ström, J., Carslaw, K. S., Fischer, H., Siegmund, P. C., and Arnold, F.: Chlorine activation and ozone destruction in the northern lowermost stratosphere, J. Geophys. Res.-Atmos., 104, 8201–8213, https://doi.org/10.1029/1998JD100111, 1999. a
Liou, K.-N.: Influence of Cirrus Clouds on Weather and Climate Processes: A Global Perspective, Mon. Weather Rev., 114, 1167–1199, https://doi.org/10.1175/1520-0493(1986)114<1167:ioccow>2.0.co;2, 1986. a
Liu, Z., Kar, J., Zeng, S., Tackett, J., Vaughan, M., Avery, M., Pelon, J., Getzewich, B., Lee, K. P., Magill, B., Omar, A., Lucker, P., Trepte, C., and Winker, D.: Discriminating between clouds and aerosols in the CALIOP version 4.1 data products, Atmos. Meas. Tech., 12, 703–734, https://doi.org/10.5194/amt-12-703-2019, 2019. a, b
Martins, E., Noel, V., and Chepfer, H.: Properties of cirrus and subvisible cirrus from nighttime Cloud-Aerosol Lidar with Orthogonal Polarization (CALIOP), related to atmospheric dynamics and water vapor, J. Geophys. Res.-Atmos., 116, D02208, https://doi.org/10.1029/2010JD014519, 2011. a, b
Massie, S. T., Gille, J., Craig, C., Khosravi, R., Barnett, J., Read, W., and Winker, D.: HIRDLS and CALIPSO observations of tropical cirrus, J. Geophys. Res.-Atmos., 115, 0–11, https://doi.org/10.1029/2009JD012100, 2010. a, b
Massie, S. T., Khosravi, R., and Gille, J. C.: A multidecadal study of cirrus in the tropical tropopause layer, J. Geophys. Res.-Atmos., 118, 7938–7947, https://doi.org/10.1002/jgrd.50596, 2013. a
Muri, H., Kristjánsson, J. E., Storelvmo, T., and Pfeffer, M. A.: The climatic effects of modifying cirrus clouds in a climate engineering framework, J. Geophys. Res.-Atmos., 119, 4174–4191, https://doi.org/10.1002/2013JD021063, 2014. a
Nazaryan, H., McCormick, M. P., and Menzel, W. P.: Global characterization of cirrus clouds using CALIPSO data, J. Geophys. Res.-Atmos., 113, D16211, https://doi.org/10.1029/2007JD009481, 2008. a
Noël, V. and Haeffelin, M.: Midlatitude cirrus clouds and multiple tropopauses from a 2002-2006 climatology over the SIRTA observatory, J. Geophys. Res.-Atmos., 112, https://doi.org/10.1029/2006JD007753, 2007. a, b, c, d
Noel, V., Chepfer, H., Chiriaco, M., and Yorks, J.: The diurnal cycle of cloud profiles over land and ocean between 51∘ S and 51∘ N, seen by the CATS spaceborne lidar from the International Space Station, Atmos. Chem. Phys., 18, 9457–9473, https://doi.org/10.5194/acp-18-9457-2018, 2018. a, b, c, d, e, f, g
Pan, L. L. and Munchak, L. A.: Relationship of cloud top to the tropopause and jet structure from CALIPSO data, J. Geophys. Res.-Atmos., 116, 1–17, https://doi.org/10.1029/2010JD015462, 2011. a, b, c, d, e, f, g, h, i, j, k, l, m, n, o, p, q, r, s, t
re3data.org: Reanalysis Tropopause Data Repository; re3data.org – Registry of Research Data Repositories, https://doi.org/10.17616/R31NJMOH, available at: https://www.re3data.org/repository/r3d100013201, last access: 25 March 2020. a
Riihimaki, L. D. and McFarlane, S. A.: Frequency and morphology of tropical tropopause layer cirrus from CALIPSO observations: Are isolated cirrus different from those connected to deep convection?, J. Geophys. Res.-Atmos., 115, 18201, https://doi.org/10.1029/2009JD013133, 2010. a
Rolf, C.: Lidar observations of natural and volcanic-ash-induced cirrus clouds, Ph.D. thesis, Bergische Universität Wuppertal, available at: http://elpub.bib.uni-wuppertal.de/servlets/DerivateServlet/Derivate-4106/dc1235.pdf, (last access: 25 March 2020), 2012. a
Rossow, W. B. and Schiffer, R. A.: Advances in Understanding Clouds from ISCCP, B. Am. Meteorol. Soc., 80, 2261–2287, https://doi.org/10.1175/1520-0477(1999)080<2261:AIUCFI>2.0.CO;2, 1999. a
Sandhya, M., Sridharan, S., Devi, M. I., Niranjan, K., and Jayaraman, A.: A case study of formation and maintenance of a lower stratospheric cirrus cloud over the tropics, Ann. Geophys., 33, 599–608, https://doi.org/10.5194/angeo-33-599-2015, 2015. a
Sassen, K., Wang, Z., and Liu, D.: Global distribution of cirrus clouds from CloudSat/cloud-aerosol lidar and infrared pathfinder satellite observations (CALIPSO) measurements, J. Geophys. Res.-Atmos., 113, https://doi.org/10.1029/2008JD009972, 2008. a, b, c
Schoeberl, M. R. and Dessler, A. E.: Dehydration of the stratosphere, Atmos. Chem. Phys., 11, 8433–8446, https://doi.org/10.5194/acp-11-8433-2011, 2011. a
Schoeberl, M. R., Jensen, E. J., Pfister, L., Ueyama, R., Wang, T., Selkirk, H., Avery, M., Thornberry, T., and Dessler, A. E.: Water Vapor, Clouds, and Saturation in the Tropical Tropopause Layer, J. Geophys. Res.-Atmos., 124, 3984–4003, https://doi.org/10.1029/2018JD029849, 2019. a, b
Seifert, P., Ansmann, A., Müller, D., Wandinger, U., Althausen, D., Heymsfield, A. J., Massie, S. T., and Schmitt, C.: Cirrus optical properties observed with lidar, radiosonde, and satellite over the tropical Indian Ocean during the aerosol-polluted northeast and clean maritime southwest monsoon, J. Geophys. Res.-Atmos., 112, https://doi.org/10.1029/2006JD008352, 2007. a
Sembhi, H., Remedios, J., Trent, T., Moore, D. P., Spang, R., Massie, S., and Vernier, J. P.: MIPAS detection of cloud and aerosol particle occurrence in the UTLS with comparison to HIRDLS and CALIOP, Atmos. Meas. Tech., 5, 2537–2553, https://doi.org/10.5194/amt-5-2537-2012, 2012. a, b, c, d, e, f
Sivakumar, V., Bhavanikumar, Y., Rao, P. B., Mizutani, K., Aoki, T., Yasui, M., and Itabe, T.: Lidar observed characteristics of the tropical cirrus clouds, Radio Sci., 38, https://doi.org/10.1029/2002rs002719, 2003. a, b
Spang, R., Riese, M., Eidmann, G., Offermann, D., and Wang, P. H.: A detection method for cirrus clouds using crista 1 and 2 measurements, Adv. Space Res., 27, 1629–1634, https://doi.org/10.1016/S0273-1177(01)00227-7, 2001a. a
Spang, R., Riese, M., and Offermann, D.: CHRISTA-2 observations of the south polar vortex in winter 1997: A new dataset for polar process studies, Geophys. Res. Lett., 28, 3159–3162, https://doi.org/10.1029/2000GL012374, 2001b. a
Spang, R., Günther, G., Riese, M., Hoffmann, L., Müller, R., and Griessbach, S.: Satellite observations of cirrus clouds in the Northern Hemisphere lowermost stratosphere, Atmo. Chem. Phys., 15, 927–950, https://doi.org/10.5194/acp-15-927-2015, 2015. a, b, c, d, e, f, g
Vaughan, M., Garnier, A., Josset, D., Avery, M., Lee, K. P., Liu, Z., Hunt, W., Pelon, J., Hu, Y., Burton, S., Hair, J., Tackett, J. L., Getzewich, B., Kar, J., and Rodier, S.: CALIPSO lidar calibration at 1064nm: Version 4 algorithm, Atmos. Meas. Tech., 12, 51–82, https://doi.org/10.5194/amt-12-51-2019, 2019. a
Wang, P. H., Minnis, P., McCormick, M. P., Kent, G. S., and Skeens, K. M.: A 6-year climatology of cloud occurrence frequency from Stratospheric Aerosol and Gas Experiment II observations (1985–1990), J. Geophys. Res.-Atmos., 101, 29407–29429, https://doi.org/10.1029/96jd01780, 1996. a, b, c
Wang, T. and Dessler, A. E.: Analysis of cirrus in the tropical tropopause layer from CALIPSO and MLS data: A water perspective, J. Geophys. Res.-Atmos., 117, https://doi.org/10.1029/2011JD016442, 2012. a
Winker, D. M. and Trepte, C. R.: Laminar cirrus observed near the tropical tropopause by LITE, Geophys. Res. Lett., 25, 3351–3354, https://doi.org/10.1029/98GL01292, 1998. a
Winker, D. M., Hunt, W. H., and McGill, M. J.: Initial performance assessment of CALIOP, Geophys. Res. Lett., 34, L19803, https://doi.org/10.1029/2007GL030135, 2007. a
Winker, D. M., Vaughan, M. A., Omar, A., Hu, Y., Powell, K. A., Liu, Z., Hunt, W. H., and Young, S. A.: Overview of the CALIPSO mission and CALIOP data processing algorithms, J. Atmos. Ocean. Technol., 26, 2310–2323, https://doi.org/10.1175/2009JTECHA1281.1, 2009. a, b
WMO: Meteorology-a three-dimensional science:Second session for the commisstion for aerology, WMO Bulletin, 6, 134–138, available at: https://library.wmo.int/doc_num.php?explnum_id=6960 (last access: 25 August 2020), 1957. a
Wylie, D., Jackson, D. L., Menzel, W. P., and Bates, J. J.: Trends in global cloud cover in two decades of HIRS observations, J. Clim., 18, 3021–3031, https://doi.org/10.1175/JCLI3461.1, 2005. a, b
Wylie, D. P., Menzel, W. P., Woolf, H. M., and Strabala, K. I.: Four years of global cirrus cloud statistics using HIRS, J. Clim., 7, 1972–1986, https://doi.org/10.1175/1520-0442(1994)007<1972:FYOGCC>2.0.CO;2, 1994. a, b, c, d
Xian, T. and Homeyer, C. R.: Global tropopause altitudes in radiosondes and reanalyses, Atmos. Chem. Phys., 19, 5661–5678, https://doi.org/10.5194/acp-19-5661-2019, 2019. a
Yorks, J. E., McGill, M. J., Palm, S. P., Hlavka, D. L., Selmer, P. A., Nowottnick, E. P., Vaughan, M. A., Rodier, S. D., and Hart, W. D.: An overview of the CATS level 1 processing algorithms and data products, Geophys. Res. Lett., 43, 4632–4639, https://doi.org/10.1002/2016GL068006, 2016. a
Young, S. A., Vaughan, M. A., Garnier, A., Tackett, J. L., Lambeth, J. D., and Powell, K. A.: Extinction and optical depth retrievals for CALIPSO's Version 4 data release, Atmos. Meas. Tech., 11, 5701–5727, https://doi.org/10.5194/amt-11-5701-2018, 2018. a
Zängl, G. and Hoinka, P. K.: The tropopause in the polar regions, J. Clim., 14, 3117–3139, https://doi.org/10.1175/1520-0442(2001)014<3117:TTITPR>2.0.CO;2, 2001. a
Zhao, W., Marchand, R., and Fu, Q.: The diurnal cycle of clouds and precipitation at the ARM SGP site: Cloud radar observations and simulations from the multiscale modeling framework, J. Geophys. Res.-Atmos., 122, 7519–7536, https://doi.org/10.1002/2016JD026353, 2017. a, b
- Abstract
- Introduction
- Data sets
- Stratospheric cirrus clouds measured by CALIPSO from 2006 to 2012
- Stratospheric cirrus clouds measured by MIPAS from 2006 to 2012
- Comparison to previous stratospheric cirrus cloud statistics derived from CALIPSO
- Conclusions
- Data availability
- Author contributions
- Competing interests
- Acknowledgements
- Financial support
- Review statement
- References