the Creative Commons Attribution 4.0 License.
the Creative Commons Attribution 4.0 License.
 | 24 Aug 2020
The interaction between urbanization and aerosols during a typical winter haze event in Beijing
Miao Yu
Yang Yang
Qingchun Li
Yonghong Wang
Shiguang Miao
Yizhou Zhang
Yuesi Wang
Aerosols cause cooling at the surface by reducing shortwave radiation, while urbanization causes warming by altering the surface albedo and releasing anthropogenic heat. The combined effect of the two phenomena needs to be studied in depth. The effects of urbanization and aerosols were investigated during a typical winter haze event. The event, which occurred in Beijing from 15 to 22 December 2016, was studied via the Rapid-Refresh Multiscale Analysis and Prediction System – Short Term (RMAPS-ST) model. The mechanisms of the impacts of aerosols and urbanization were analyzed and quantified. Aerosols reduced urban-related warming during the daytime by 20 % (from 30 % to 50 %) as concentrations of fine particulate matter (PM2.5) increased from 200 to 400 µg m−3. Conversely, aerosols also enhanced urban-related warming at dawn, and the increment was approximately 28 %, which contributed to haze formation. Urbanization reduced the aerosol-related cooling effect by approximately 54 % during the haze event, and the strength of the impact changed little with increasing aerosol content. The impact of aerosols on urban-related warming was more significant than the impact of urbanization on aerosol-related cooling. Aerosols decreased the urban impact on the mixing-layer height by 148 % and on the sensible heat flux by 156 %. Furthermore, aerosols decreased the latent heat flux; however, this reduction decreased by 48.8 % due to urbanization. The impact of urbanization on the transport of pollutants was more important than that of aerosols. The interaction between urbanization and aerosols may enhance the accumulation of pollution and weigh against diffusion.
- Article
(10328 KB) - Full-text XML
- BibTeX
- EndNote


In recent years, heavy-haze pollution events have increasingly occurred in densely populated urban areas, such as the Beijing–Tianjin–Hebei region (BTH region) and Yangtze River Delta region of China (Zhang et al., 2019). These events have caused increasingly severe adverse effects on transportation, the ecological environment, and human health (Zhao et al., 2012; Wu et al., 2010; Liu et al., 2012). A statistical analysis of the variation in haze days in Beijing over the past 10 years showed that the number of haze days has significantly increased (Chen and Wang, 2015; Zhai et al., 2019). The average annual number of haze days was 162 from 1981 to 1990, 167 from 1991–2000, and 188 from 2001 to 2010. The conditions for the formation of heavy haze in the BTH region are very complex (Miao et al., 2017; Wei et al., 2018; Ren et al., 2019). Although emissions, meteorological conditions, terrain, and high-density human activities in urban areas are all important conditions for the evolution of heavy haze (Huang et al., 2008a; Zhu et al., 2018), meteorological conditions are critical for the evolution of heavy-haze pollution weather under the background of constant emissions (Wang et al., 2020; Pei et al., 2020). The characteristics of the structure of the atmospheric boundary layer determine the horizontal fluidity, vertical diffusion ability, stability, and capacity (mixed-layer thickness) of the atmosphere, which are the main factors affecting the formation, intensity, and duration of haze and atmospheric pollution (Guo et al., 2016). Coulter (1979) indicated that the height of the mixing layer would affect the concentration and diffusion of pollutants, which has been one of the most important physical parameters in atmospheric numerical models and atmospheric environment evaluations, and urbanization and aerosols have been indicated to influence the boundary layer height (Tao et al., 2015).
Urbanization, as the most drastic means by which human activities transform the environment, has had an important impact on regional climate and weather processes (Miao et al., 2011; Yu and Liu, 2015; Yu et al., 2017). Existing research suggests that there are three main ways by which urbanization influences the climate (Oke, 1982, 1995). The change in land use from natural surfaces to impervious underlying surfaces in association with urbanization alters the surface albedo and roughness, which results in the formation of urban heat islands (UHIs) (Taha, 1997; Folberth et al., 2014). These alterations lead to a change in the surface energy balance and the form of the thermal difference between urban and rural areas and further change the boundary layer structure (Grimmond, 2007; Li and Bou-Zeid, 2013). Second, thermal differences further lead to heat island circulation, which can influence the local circulation of synoptic conditions and the transport of pollutants (Crutzen, 2004). Anthropogenic aerosols and heat from the development of transportation and industry are also important parts of urban impacts on climate (Huang et al., 2008b). However, in contrast to the effects of urbanization, aerosols cause cooling at the surface by reducing shortwave radiation to enhance static stability (Grimmond, 2007; Crutzen, 2004; Huang et al., 2007). Furthermore, aerosols may increase longwave radiation in urban areas because they are likely to absorb and emit more energy than water vapor or greenhouse gases under certain conditions (Jacobson, 1998; Rudich et al., 2007). There have been few studies on the mechanism of the interaction between urbanization and aerosols, although many studies have focused on their respective effects. Accordingly, the interaction between urbanization and aerosols is important for studying regional climate.
Researchers are increasingly aware of the importance of the interaction between urbanization and aerosols. A very important study by Cao et al. (2016) describes the first attempt to determine the effects of aerosols on urbanization and indicated that aerosols can increase the nighttime UHI effect using a climate model. Yang et al. (2020) obtained different results when using observational data to perform similar research in the BTH region.
More detailed research needs to be performed by combining observational data and modeling because the conclusions may vary depending on the scale (Xu et al., 2019). Other illuminating work with regional models showed that the combined effect of UHIs and aerosols on precipitation depends on synoptic conditions (Zhong et al., 2015). However, for winter haze, Zhong et al. (2017) evaluated the impact of urban areas on air quality and indicated that urbanization can increase ventilation during the daytime and increase aerosol emissions, and these effects outweigh the UHI effect.
However, very few studies have quantified the individual effects of urbanization-induced UHIs and elevated aerosol emissions on the formation and development of haze in metropolitan areas. A difficulty faced by such studies is that the radiative forcing of aerosols is not a prognostic variable in most climate models (Cao et al., 2016). Some regional models, such as WRF-Chem (Weather Research and Forecasting model coupled with chemistry), can overcome this problem by parameterizing aerosols to aerosol optical depth (AOD) in some specific radiation schemes. Tao et al. (2015) and Zhong et al. (2018) made some progress in this area, and their results also indicated that a regional model could be used as an effective way to study the interaction between urbanization and aerosols. However, a quantitative evaluation of the impacts of urban areas on aerosols and the simultaneous impacts of aerosols on urban impacts in metropolitan areas has not been attempted.
In this study, the Rapid-Refresh Multiscale Analysis and Prediction System – Short Term (RMAPS-ST) was used to investigate the mechanism of the influence of the above two factors during a typical winter haze event. The objectives of this study are (1) to quantify the impacts of urban areas on aerosols and the impacts of aerosols on urbanization and (2) to obtain a better understanding of the interaction between urbanization and aerosols and its influence mechanism on the boundary layer structure and haze transmission during a typical winter haze event in the BTH region.
2.1 Observational data
To investigate the interaction between urbanization and aerosols, observation data on basic meteorological elements, air quality, radiation and surface heat flux, and the mixing-layer height (MLH) are very important to reveal the impact of urbanization and aerosols during haze events.
The basic meteorological elements were obtained from 309 national basic weather stations in the BTH region and were provided by the China Meteorological Administration (http://data.cma.cn/, last access: 19 August 2020). The locations of the national basic weather stations are shown in Fig. 1 (red dots). The mass concentrations of fine particulate matter (PM2.5) were recorded by 251 environmental monitoring stations managed by the Ministry of Ecology and Environment of the People's Republic of China (http://hbk.cei.cn/aspx/default.aspx, last access: 19 August 2020) (Fig. 1, black dots). We also used radiation and surface heat flux data to analyze the urban surface energy budget obtained from the Beijing meteorological tower (39.97∘ N, 116.37∘ E). The tower is 325 m high and is operated by the Institute of Atmospheric Physics (IAP), Chinese Academy of Sciences (CAS). The heat flux data were measured by a fast-response eddy covariance sensor system that was sampled at 10 Hz using a CR500 (Campbell Scientific Inc., USA). The radiation data were provided by Kipp & Zonen (Netherlands) four-component unventilated CNR1 radiometers. Radiation and surface flux data from 140 m of the tower were used in this study. In addition, the MLH is an important factor affecting pollutant diffusion and is also affected by both urbanization and aerosols. Because the MLH is not a routine observation, we obtained the data from only one site. The MLH and backscattering coefficient were measured by enhanced single-lens ceilometers (Vaisala, CL51, Finland) deployed by the IAP (Tang et al., 2016). Backscattering coefficient profiles were calculated by referencing the attenuation strobe laser lidar technique (910 nm), which is cited in Tang et al. (2015).
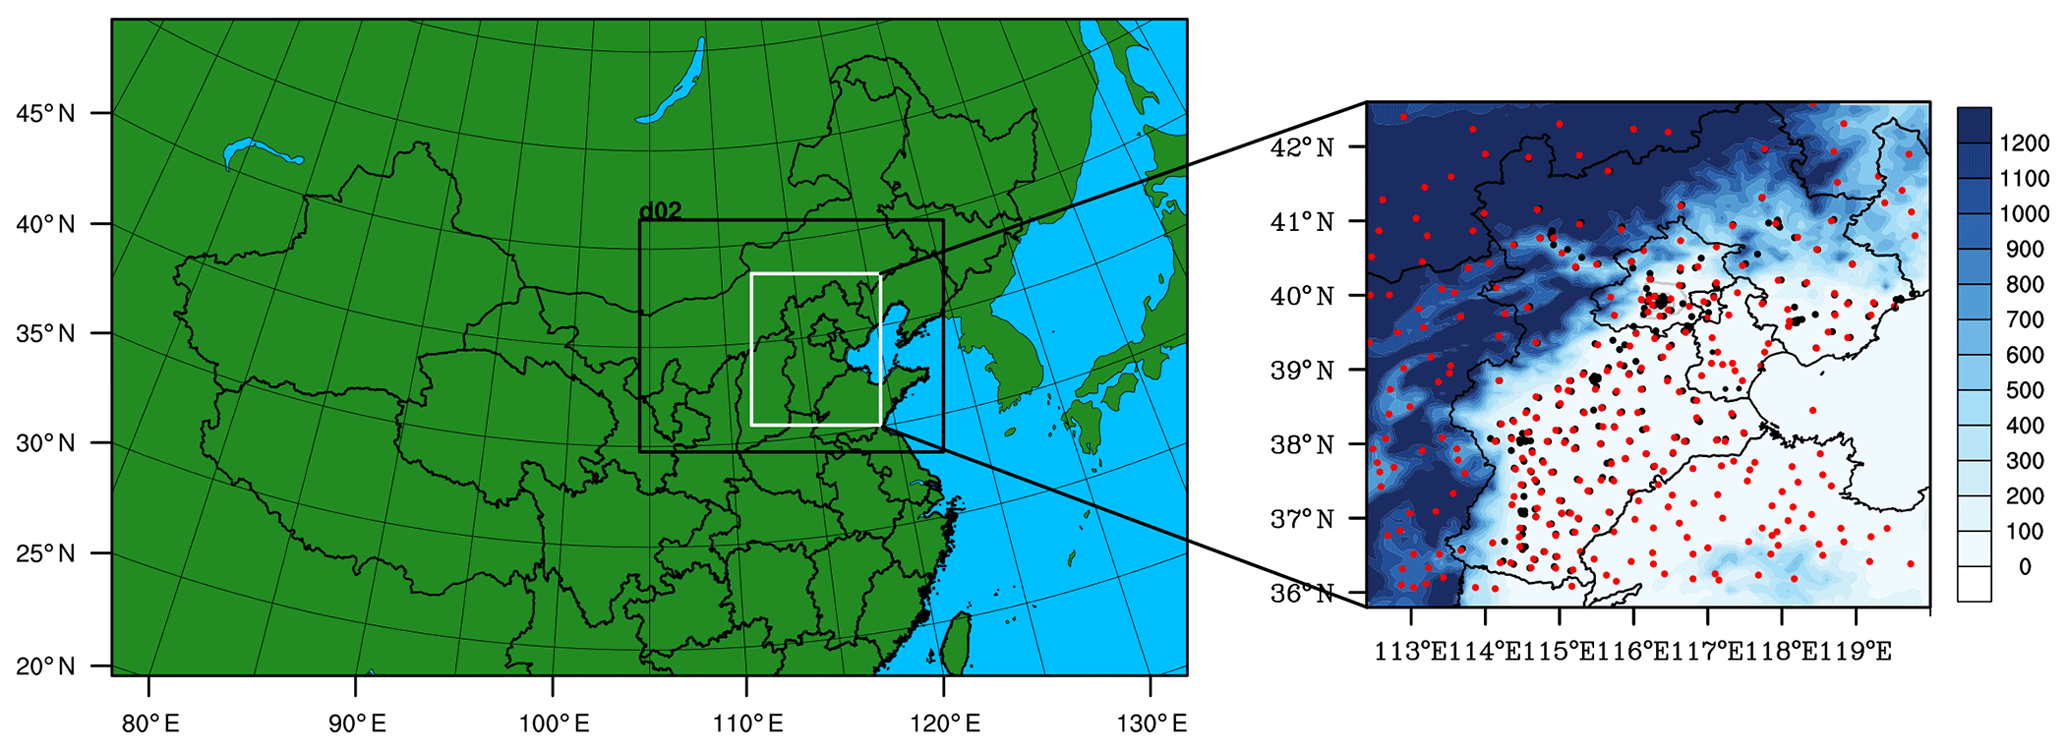
Figure 1Domain configuration of RMAPS-ST and the location of the study area, indicated by the solid white line. The black dots indicate the locations of the 251 environmental monitoring stations, and the red dots represent the 309 meteorological stations in the BTH region, where the gray loop lines show the locations of the 2nd Ring Road to the 6th Ring Road. The shading is the terrain height (unit: m).
2.2 Model description and experimental design
To investigate the respective effects of urbanization and aerosols and further determine the interaction between urbanization and aerosols, a high-resolution regional model with satisfactory performance is necessary for sensitivity tests. The model used in this study is the latest available version of RMAPS-ST, which was developed by the Institute of Urban Meteorology, China Meteorological Administration. RMAPS-ST is based on the Weather Research and Forecasting (WRF v3.8.1) model (Skamarock et al., 2008) and its data assimilation system (WRFDA v3.8). The simulation domain was centered at 37.0∘ N, 105.0∘ E and implemented with two nested grids with resolutions of 9 and 3 km for two domains (D1 and D2, respectively) (Fig. 1a). The model performance was verified, and RMAPS-ST was run operationally (Fan, 2018). The assimilation began every 3 h, and the assimilated data included automatic meteorological-station data, sounding data, and radar data when available. The model settings are shown in Table 1. The simulation started at 00:00 LST and ran from the 15 to 23 December 2016 with hourly outputs.
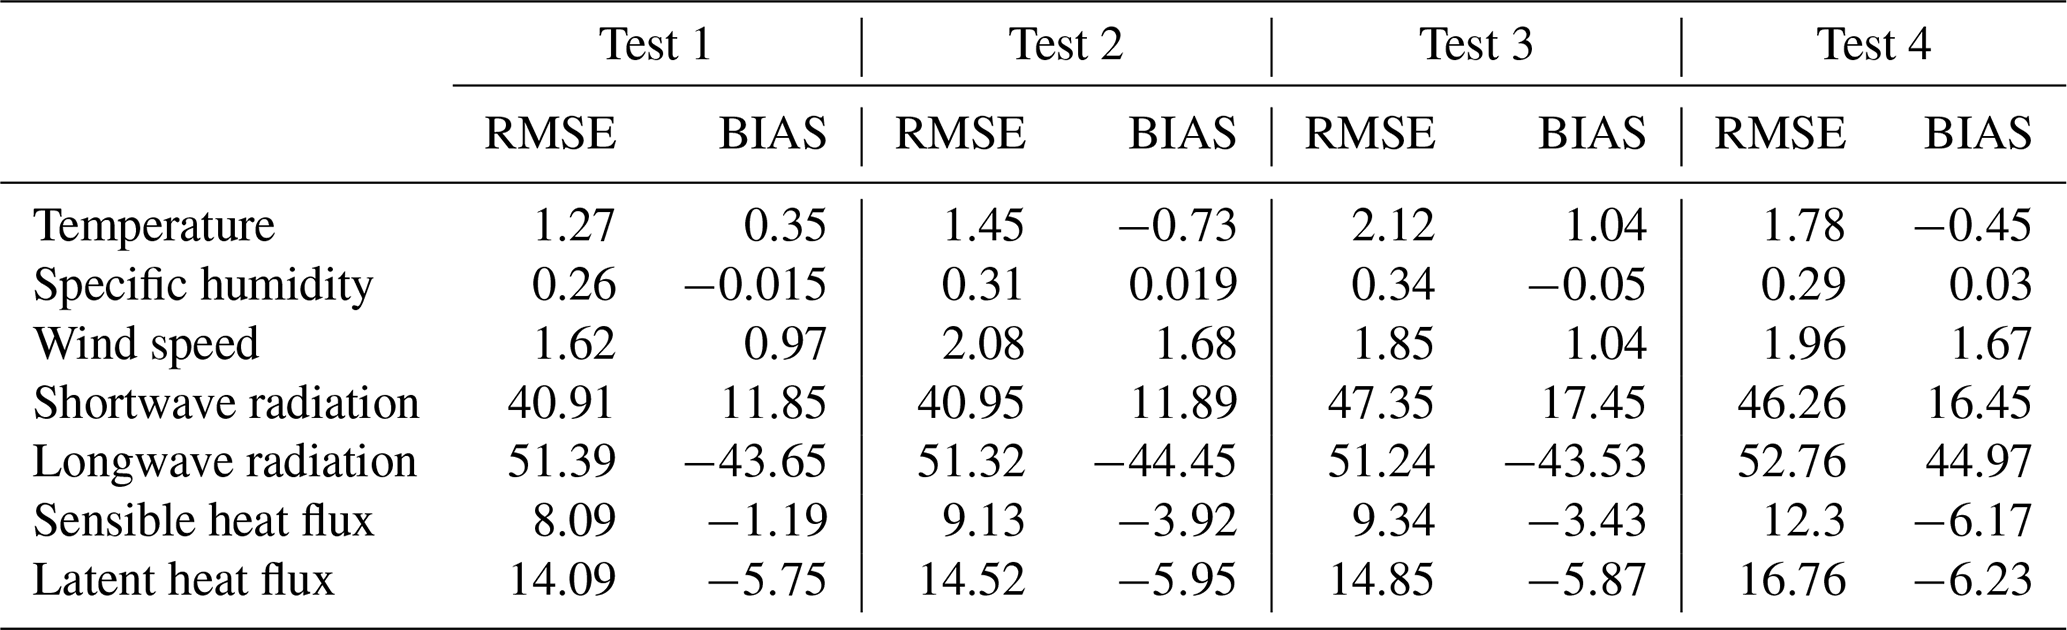
Table 1RMAPS-ST model settings. PBL: planetary boundary layer; YSU: Yonsei University scheme; RRTMG: Rapid Radiation Transfer Model for General Circulation Models; LSM: land surface model; SLUCM: single‐layer urban-canopy model.

The urban impact was represented by a high-resolution (30 m) land use map interpreted from Landsat Thematic Mapper satellite data from 2015 in Beijing. The urban-canopy parameters were optimized according to Miao and Chen (2014). The impact of aerosols was represented by adding the hourly distribution of AOD in the Rapid Radiation Transfer Model for General Circulation Models (RRTMG) radiation scheme. The AOD was extracted from the output of RMAPS-Chem (Zhao et al., 2019; Zhang et al., 2018) for the BTH region, which is shown in Fig. 1b. Anthropogenic emission data were obtained according to the Multiresolution Emission Inventory for China (2012) (http://www.meicmodel.org/, last access: 19 August 2020) with a resolution of . The particle size distribution and typology of aerosols used in this study are according to Ruiz et al. (2014). The simulated distribution of AOD in Beijing was verified to be satisfactory after comparison with the observed vertical profile of the backscattering coefficient (Fig. 2a and b). The correlation between the AOD and the column backscatter coefficient is 0.76 (Fig. 2c). Four tests were designed to investigate the impacts of aerosols and urbanization on typical haze events.
-
Test 1. Both urban and aerosol impacts were considered in the simulation. We updated the grid AOD distribution hourly as the input field for the RRTMG radiation scheme in D2.
-
Test 2. Only aerosol impact was considered in the simulation, and we replaced the urban grids with cropland to shield the impact of urbanization.
-
Test 3. Only urban impact was considered, and the direct radiative forcing of aerosols was not considered in the simulation.
-
Test 4. Both urban and aerosol impacts were not considered in the simulation.

Figure 2(a) Hourly backscattering coefficient (shading; Mm sr−1) observed by single-lens ceilometers (39.97∘ N, 116.37∘ E) from 15 to 23 December; (b) hourly column backscatter coefficient (black line; sr−1) and AOD used in modeling for Beijing (blue line); and (c) scatter diagram of hourly column backscatter coefficient and AOD (blue dots) and their correlations (red line).
The model evaluation results for the four tests are shown in Table 2. As the service operational system, the RMAPS-ST model assessment report indicated that the model performance was satisfactory (Fan et al., 2018). We evaluated not only the conventional meteorological variables (including temperature, humidity, and wind speed) but also unconventional but important variables for this study (including radiation and surface heat flux). A total of 309 meteorological-station data points were used to evaluate the conventional variables. The unconventional variables were evaluated according to the observational data from 140 m of the Beijing meteorological tower. Test 1 was found to be the best simulation and considered both the urban and aerosol impacts. The deficiency of observation sites, interpolation methods, and the height differences between the observations and simulations resulted in higher root mean square error (RMSE) values for radiation and heat flux than for the other variables.
3.1 Observation and weather condition analysis
A typical continuous severe heavy-haze event occurred from 15 to 22 December 2016 in the BTH region. Three stages dominated by three different synoptic patterns controlled the formation of this haze. In the first stage, northwest airflow in front of a ridge of high pressure was observed in the BTH region at a height of 700 to 500 hPa and in eastern China at a height of 850 hPa from 15 to 16 December, which induced a sharp warming pattern (Fig. 3a and b). At the surface, Beijing was located under the front of the high-pressure system to under the southwest airflow in front of the low-pressure system (Fig. 4), which favored pollutant transport from Hebei province to Beijing. From 17 December to the night of 18 December, the control system turned to latitude circulation at 700 to 500 hPa over the BTH region (there was a trough line south of 40∘ N at 20:00 LST on 17 and 18 December) (Fig. 3c). There was a northwest wind located north of 40∘ N and a southwest wind located south of 40∘ N at 850 hPa (Fig. 3d). The near surface was controlled by the northeast airflow located in the inverted low-pressure trough. The weak convergence of the high trough cooperates with the low pressure at the surface, leading to continuous pollution accumulation near the surface. Under this weather situation, the near-surface temperature began to continuously increase from 16 to 18 December, and the specific humidity also correspondingly increased (Fig. 5a). The near-surface wind speed and pressure decreased during this period (Fig. 5b). The concentration of PM2.5 gradually increased from 16 December, and the average concentration of PM2.5 reached 200 µg m−3 on 18 December. The density of ozone obviously decreased from 16 December (Fig. 5c).
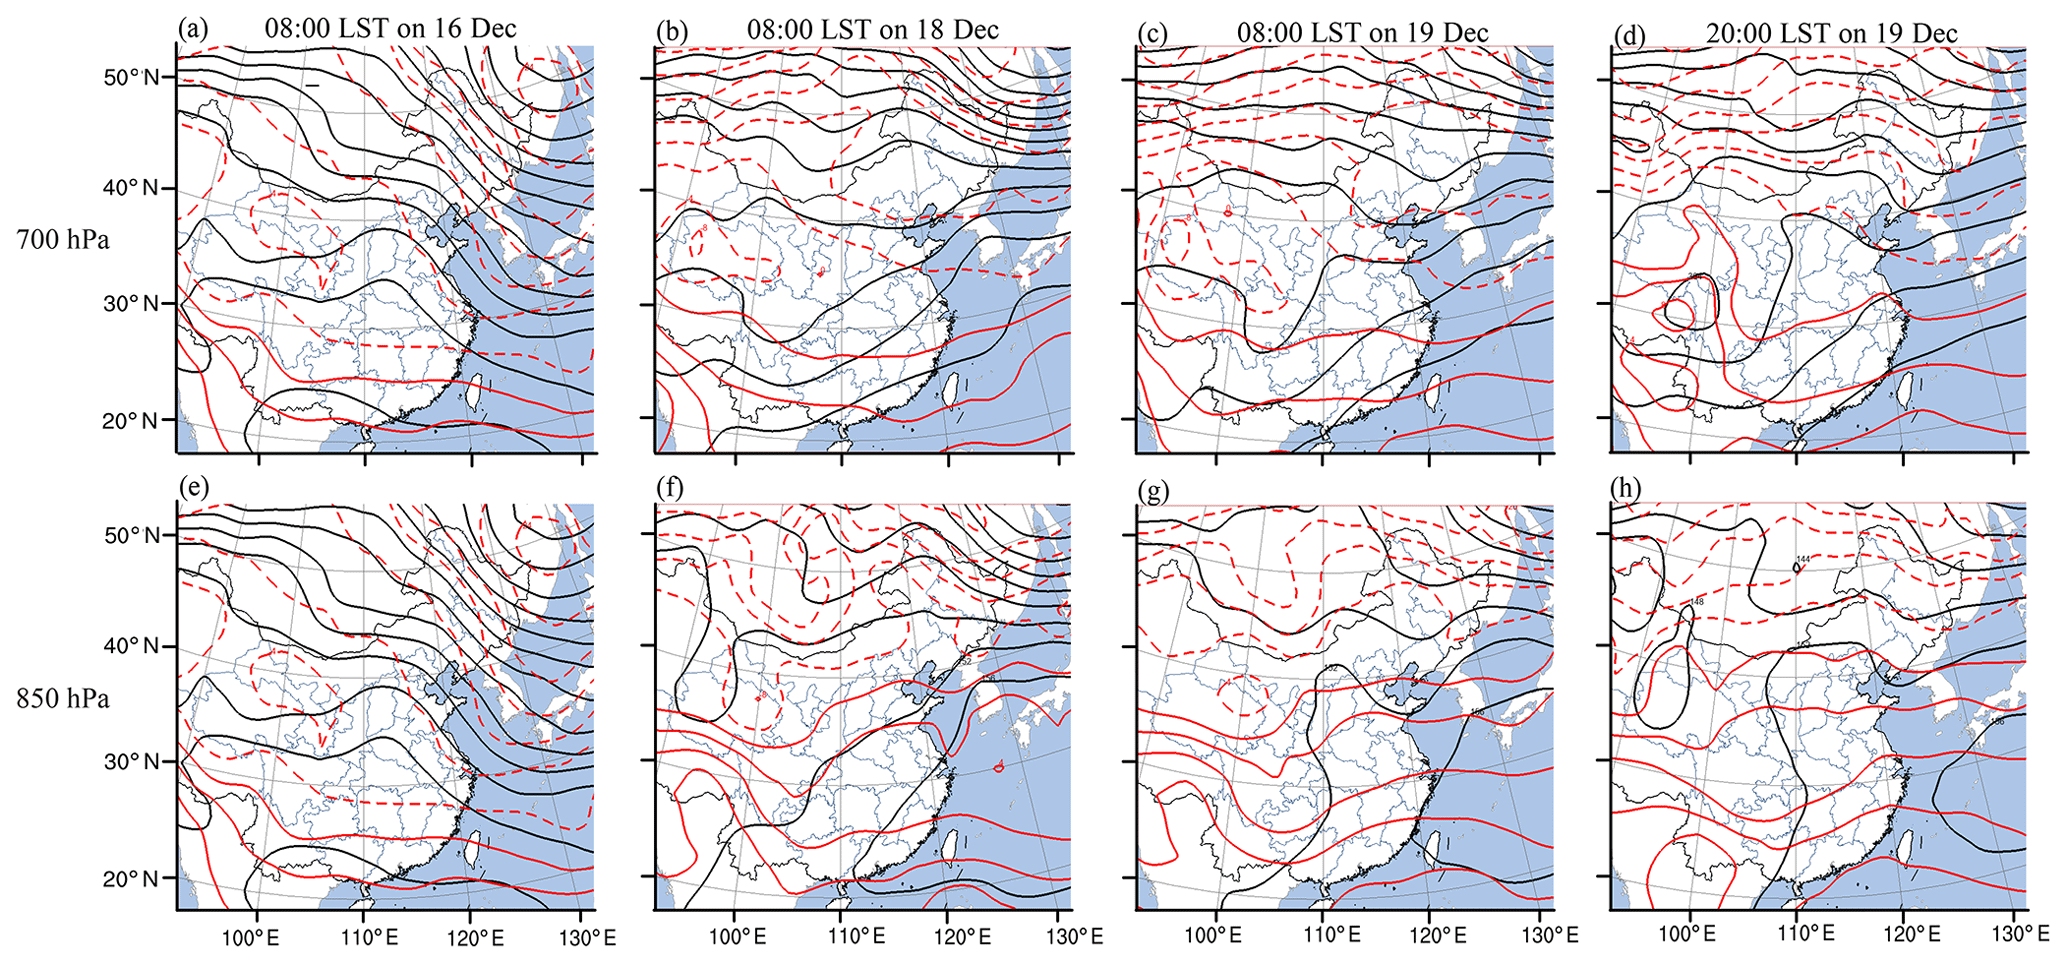
Figure 3Weather maps. (a) 08:00 LST on 16 December at 700 hPa; (b) 08:00 LST on 18 December at 700 hPa; (c) 08:00 LST on 19 December at 700 hPa; (d) 20:00 LST on 19 December at 700 hPa; (e) 08:00 LST on 16 December at 850 hPa; (f) 08:00 LST on 18 December at 850 hPa; (g) 08:00 LST on 19 December at 850 hPa; (h) 20:00 LST on 19 December at 850 hPa.
The MLH significantly declined beginning on 16 December, and the diurnal cycle almost disappeared during this period, which was accompanied by a reduction in visibility with a diurnal variation (Fig. 5d). The downward shortwave radiation and the net radiation gradually decreased from 16 to 18 December, which directly influenced the trend of the variation in ozone (the maximum density of ozone was less than 110 mg m−3), while there was little change detected in longwave radiation (Fig. 5e). The observed sensible heat flux also decreased from 16 to 19 December, although the temperature increased, which means that the heat exchange became weaker in the vertical direction, while the latent heat flux changed little (Fig. 5f). Southwest airflow was again captured by a wind profiler on the night of 18 December, and the transport layer occurred from 300 to 1500 m, which differs from the previous surface transport pattern (Fig. 4).
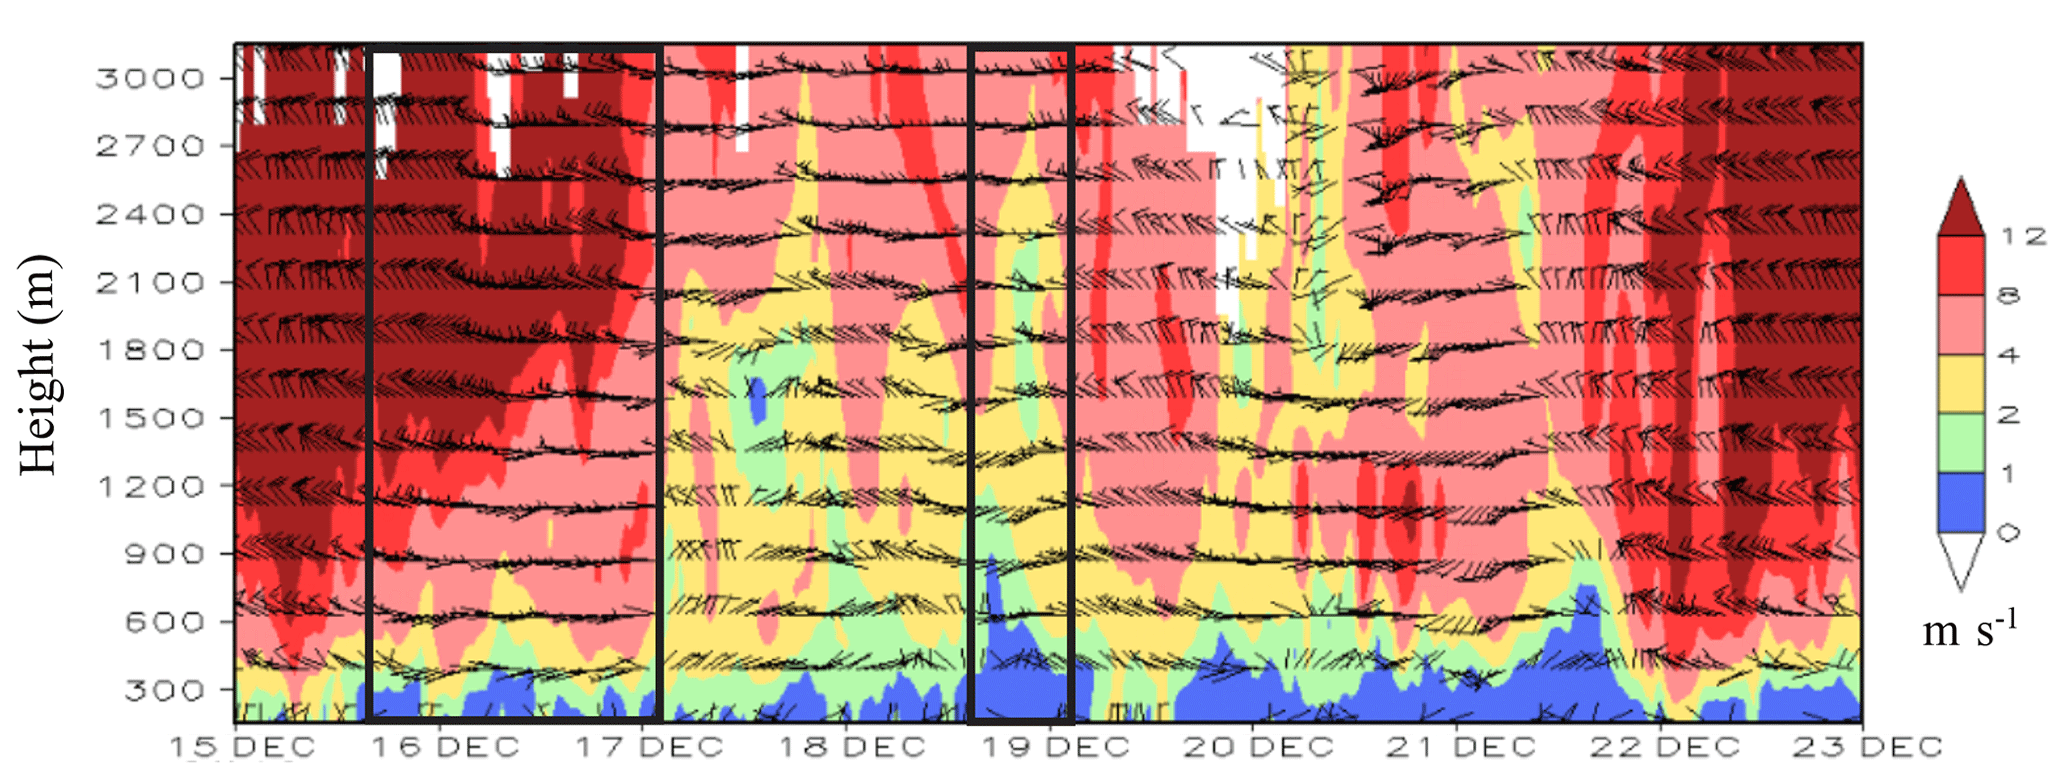
Figure 4Hourly wind profile from 15 to 23 December. Wind speed (shading; m s−1) and horizontal wind field (vector; m s−1). The black boxes show the two periods of south-wind conveyance.

Figure 5Diurnal pattern of observed variables from 15 to 23 December in Beijing. (a) Temperature (T; red line; ∘C) and absolute humidity (Q; blue line; g kg−1) at 2 m; (b) wind speed at 10 m (green line; m s−1) and pressure (black line; hPa); (c) average PM2.5 concentration (red line is the average and the shading indicates the standard deviation; µg m−3) and ozone concentration (blue lines and the shading indicate the standard deviation; mg m−3) of 35 environmental monitoring stations in Beijing; (d) mixing-layer height (MLH; blue line; m) and visibility (red line; km); (e) radiation from the observation tower at 140 m, downward shortwave radiation (DW SW; solid black line; W m−2), upward shortwave radiation (UR SW; dashed black line; W m−2), downward longwave radiation (DW LW; solid blue line; W m−2), upward longwave radiation (UR LW; dashed blue line; W m−2), and net radiation (red line; W m−2); and (f) sensible heat flux (red line; W m−2) and latent heat flux (red line; W m−2).
In the second stage, an important change occurred on the morning of 19 December, when the control system turned to the northwest airflow on the front of the trough over the BTH region at 500 to 850 hPa (Fig. 3e and f). After 20:00 LST on 19 December, obvious warming occurred again at 850 hPa in eastern China (Fig. 3h). However, the near-surface maximum temperature and diurnal range in Beijing significantly decreased but with high specific humidity from 20 to 21 December (Fig. 5a). According to the surface weather map, the control system turned to the southwest at 14:00 LST on 19 December, and a large-scale southeast wind appeared in eastern Beijing after 20:00 LST, which induced wide advection fog formation overnight (Fig. 3g). Due to the influence of the southwest airflow on the trough at 500 hPa, the inverted trough moved east, and Beijing was located in the southeast-wind zone. The near-surface pressure increased slightly, and the wind speed remained low at approximately 1 m s−1 (Fig. 5b). The synoptic system caused the PM2.5 concentration to peak (approximately 400 µg m−3 on average and above 500 µg m−3 observed at some stations) and was maintained from 20 to 21 December in the BTH region. The visibility was less than 400 m, and the diurnal cycle disappeared (Fig. 5d). The decrease in the downward shortwave and net radiation during this period was more pronounced than that in the previous 3 d (Fig. 5e). The sensible heat flux also decreased, and the diurnal cycle almost disappeared from 19 to 20 December (Fig. 5e). It was not until the strong cold air moved southward in the early morning of 22 December when the whole atmosphere converted to the northwest stream. The air pollutants were completely removed in the third stage.
3.2 Interaction between the impacts of urbanization and aerosols on haze events
Four impacts were analyzed as follows. Urban impact under the aero scenario (UI_aero) was represented by the results of Test 1 minus those of Test 2; urban impact under the no-aero scenario (UI_noaero) was represented by the results of Test 3 minus those of Test 4; the impact of the urbanization scenario was represented by the results of Test 1 minus those of Test 3 (AI_urban); the impact without urbanization was represented by the results of Test 2 minus those of Test 4 (AI_nourban). The interaction between urbanization and aerosols on local meteorological and regional transportation was discussed.
3.2.1 The impact on the local area
The quantitative results of the interaction between urbanization and aerosols are shown in Table 3. Temperature is one of the most sensitive variables affected by urbanization and aerosols and is also the most concerning variable. The impact of urbanization on the near-surface temperature displays diurnal variation in the Beijing area. The warming effect of urbanization was dominant at night. The urban impact on temperature was partly offset under aerosol conditions when comparing the results of UI_aero and UI_noaero, especially during the daytime (Fig. 6a, red lines). The urban impact always showed a positive contribution to the temperature throughout the day under the no-aerosol scenario, while the urban impact became slightly negative during the daytime under the aerosol scenario. The maximum difference between UI_aero and UI_noaero occurred on 20 and 21 December, when the AOD value reached its maximum, and the difference almost disappeared on 15 and 22 December, with a small AOD (Fig. 2b). The results indicate that the impact of urbanization on temperature is reduced by aerosols, which is consistent with the findings of Yang et al. (2020). The average urban impact on temperature in Beijing from 16 to 19 December with a PM2.5 concentration of approximately 200 mg m−3 was a reduction of 0.42 ∘C according to UI_aero and a reduction of 0.60 ∘C according to UI_noaero. This result means that aerosols reduce the urban impact on temperature by 30 %. When the concentration of PM2.5 reached 500 mg m−3 from 20 to 21 December, the aerosols reduced urbanization-related warming by 54 %.
Table 3Quantitative results of the interaction between urbanization and aerosols.

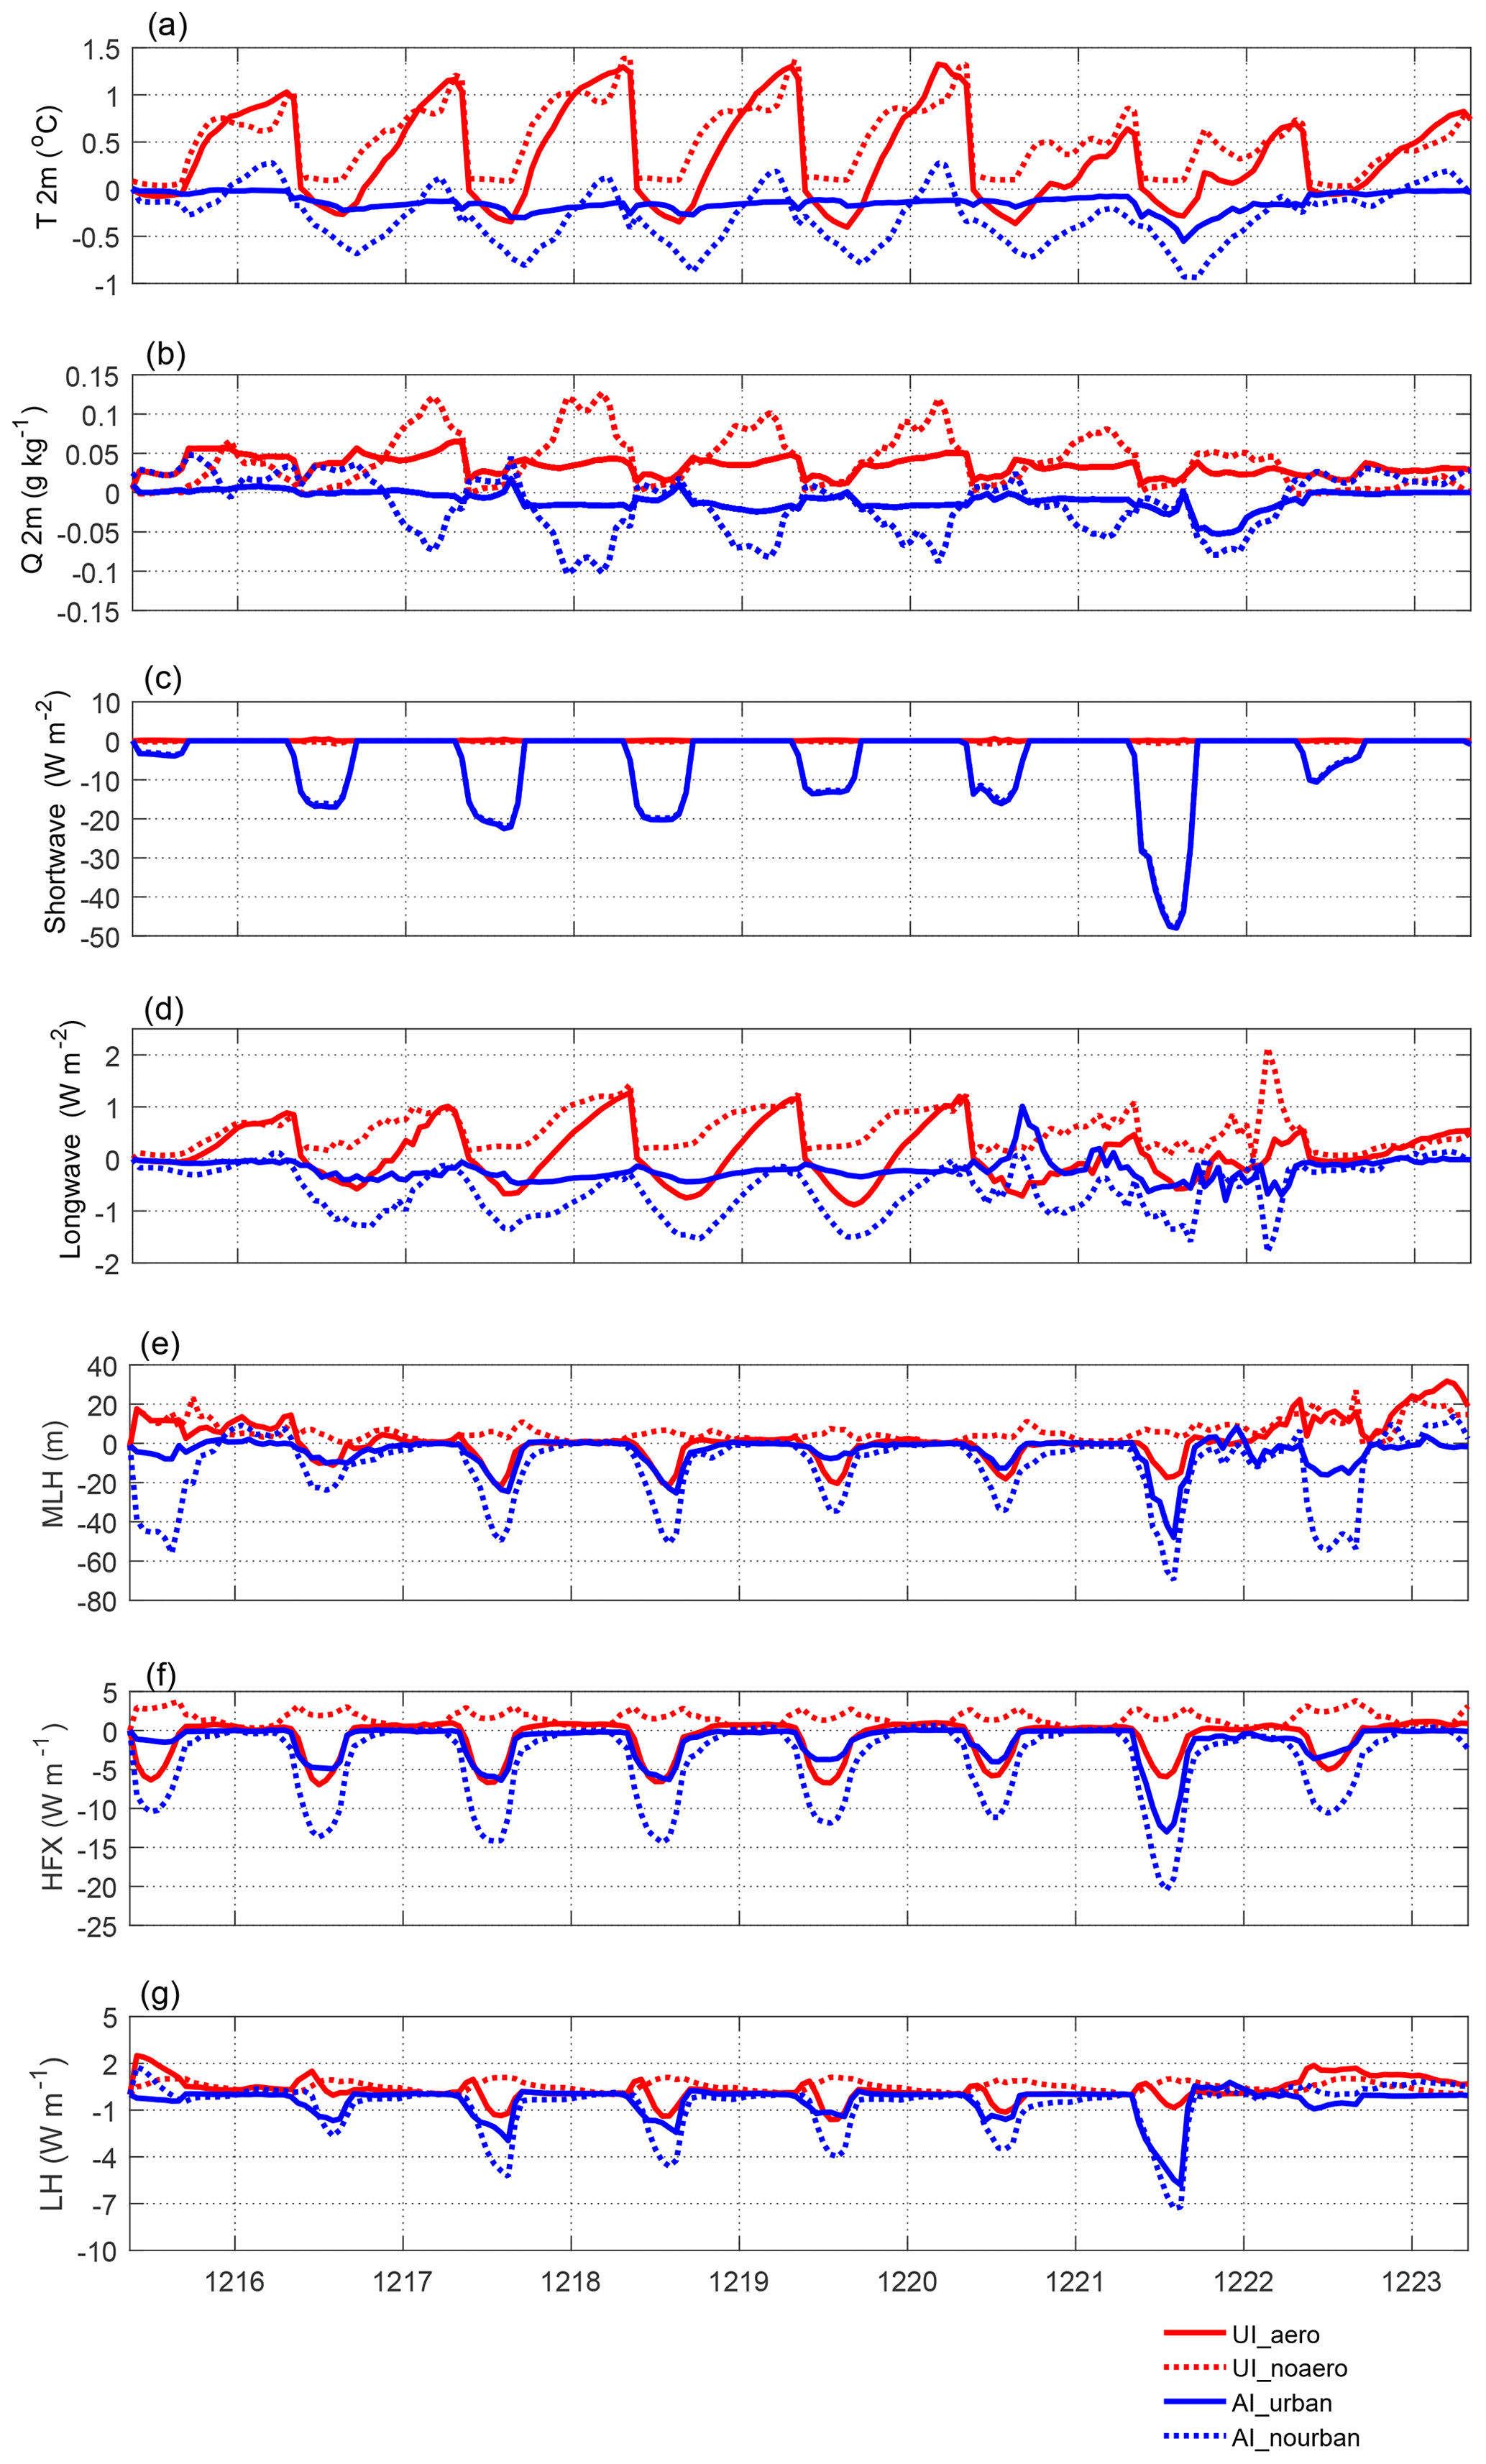
Figure 6Diurnal patterns of simulated variables from 15 to 23 December. (a) Temperature at 2 m (T; ∘C); (b) specific humidity (Q; g kg−1) at 2 m; (c) shortwave radiation (W m−2); (d) longwave radiation (W m−2); (e) mixing-layer height (MLH; m); (f) sensible heat flux (HFX; W m−2); and (g) latent heat flux (LH; W m−2).
The impact of aerosols on temperature is negative and without a diurnal cycle under the urbanization scenario for the whole day (Fig. 6a, blue lines). However, the impact of aerosols captured by AI_nourban is significant and displays a diurnal cycle. Another important observation is that the impact of aerosols on temperature under the no-urban scenario is not always negative. There is a slight warming period at dawn in the AI_nourban scenario, which may be because the longwave radiation is increased (Jacobson, 1998; Rudich et al., 2007). The average impact of aerosols on temperature in Beijing was −0.16 ∘C with urbanization and −0.34 ∘C without urbanization from 16 to 19 December. The impact of aerosols was −0.19 ∘C with urbanization and −0.43 ∘C without urbanization from 20 to 21 December. Urbanization decreased the impact of aerosols by 53 % under moderate pollution and by up to 56 % under heavy pollution. Two different impacts of aerosols on urban-related warming were observed. There was a reducing effect in the daytime with a strength of approximately 30 % to 50 % of the concentration, and an increasing effect occurred at dawn with a strength of approximately 28 %. Urbanization reduced the aerosol-related cooling effect by approximately 54 %.
The observed specific humidity continued to increase as the aerosol concentration increased (Fig. 5b) and was closely related to the UHI effect and aerosol composition (Zhang et al., 2010; Sun et al., 2013; Wang et al., 2020). The specific humidity also increased with urbanization throughout the day (Fig. 6b, red lines). Similar to temperature, urbanization had a more pronounced impact on specific humidity at night. The average urban impact on specific humidity was g kg−1 according to UI_aero and g kg−1 according to UI_noaero from 16 to 19 December and and g kg−1 from 20 to 21 December. Aerosols not only reduced the urban impact on the average daily specific humidity by 23.43 % but also reduced the diurnal range of specific humidity.
In contrast to urbanization, aerosols were found to reduce the specific humidity (Fig. 6b, blue lines). The impact of aerosols under the urbanization scenario was small and did not exhibit a diurnal pattern. However, the impact of aerosols under the no-urban scenario was more distinct and exhibited a diurnal cycle. The average impact of aerosols on specific humidity was −0.88 g kg−1 according to AI_urban and −1.36 g kg−1 according to AI_nourban throughout the study period. Urbanization reduced the impact of aerosols on specific humidity by 35.3 %. The impacts of urbanization and aerosols on humidity were slightly greater than those of aerosols on urban impacts.
There was no effect of urbanization on downward shortwave radiation according to both UI_aero and UI_noaero (Fig. 6c, red lines), although the value was not absolutely related to aerosols because of model uncertainty. Aerosols reduce the downward shortwave radiation during the daytime, and the differences between AI_urban and AI_nourban are very small.
The average decrease in shortwave radiation caused by aerosols was approximately 7 % of the total downward shortwave radiation from 16 to 20 December and up to 17 % when the PM2.5 was greater than 400 µg m−3. The urban impact increased the longwave radiation at night according to UI_aero, while the impact of urbanization was always positive for longwave radiation during the study period according to UI_noaero (Fig. 6d, red lines). Because it is closely related to temperature, the urban impact on longwave radiation was also reduced by aerosols, with reductions of 83 % from 16 to 19 December and 97 % from 20 to 21 December. The impact of aerosols on longwave radiation was less than that of shortwave radiation, and there was a slight decrease captured by AI_urban with an increase from noon on 20 December to nighttime on 21 December. The impact of aerosols decreased the longwave radiation captured by AI_nourban from 16 to 20 December and increased it during the night of 21 December (Fig. 6d, blue lines). Urbanization reduced the impact of aerosols on longwave radiation by 67 %, while aerosols reduced the urban impact on longwave radiation by 89 %. The impacts of urbanization and aerosols on longwave radiation are unimportant because they are both smaller than 2 W m−2.
The change in radiation further alters the MLH. Previous studies suggested that the MLH is important for the diffusion of pollutants and haze formation (Sun et al., 2013; Quan et al., 2014). Previous studies on urbanization indicated that urban-induced warming will increase the MLH during the daytime (Wang et al., 2007; Miao et al., 2012), and the results of UI_noaero showed the same pattern. However, when we introduced aerosols into the simulation, urbanization was found to decrease the MLH during the daytime according to UI_aero. The impact of aerosols decreased the average urbanization by 148 % during the haze event (Fig. 6e, red lines). Aerosols significantly decreased the MLH during the daytime according to both AI_urban and AI_nourban (Fig. 6e, blue lines). Urbanization decreased the impact of aerosols on the MLH by 58 % during the haze event.
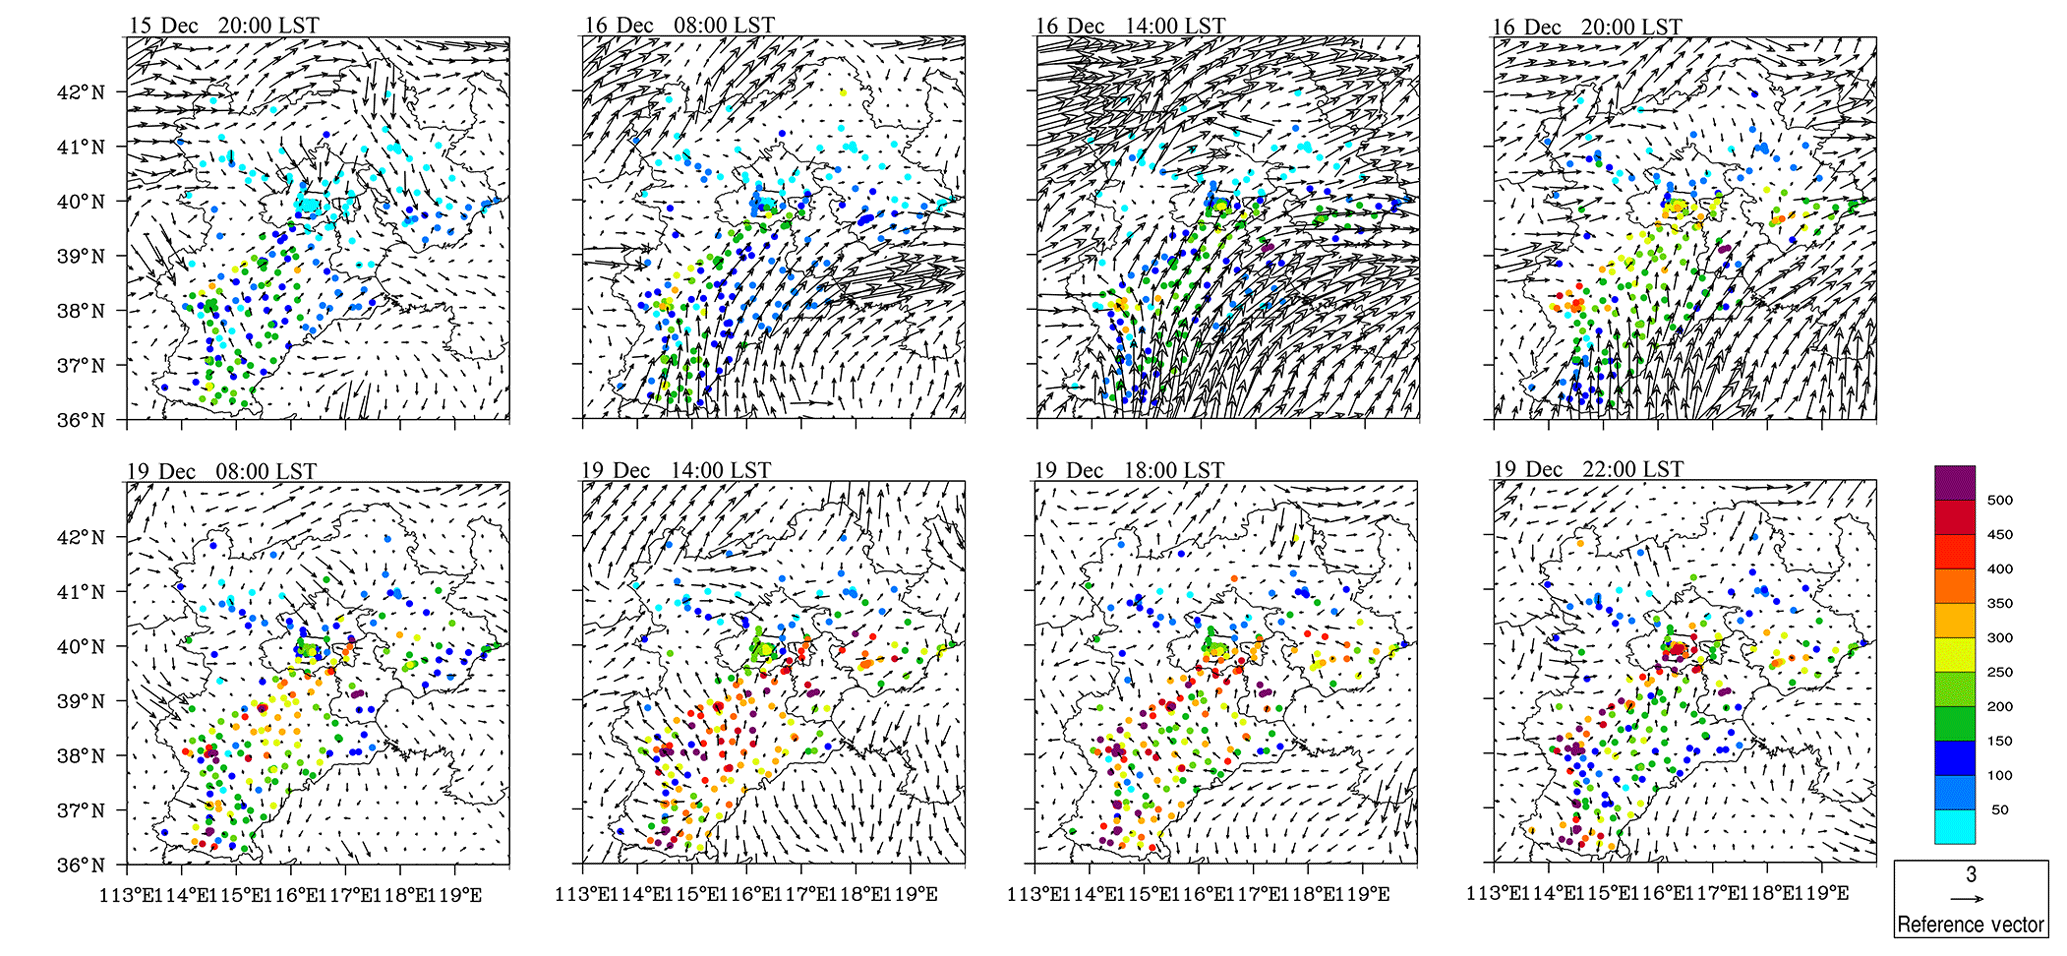
Figure 7Spatial distribution of the observed concentration of PM2.5 (dots; µg m−3) and wind field (vector; m s−1) for two increasing processes of the concentration of PM2.5.
Urban land use change directly alters the surface heat flux. Urbanization increased the sensible heat flux according to UI_noaero but decreased the sensible heat flux according to UI_aero (Fig. 6f, red lines). The impact of aerosols in reducing the urban impact on sensible heat flux was 156 % during the haze event. Aerosols reduced the sensible heat flux according to both AI_urban and AI_nourban (Fig. 6f, blue lines). The maximum impact of aerosols occurred on 21 December, with the maximum AOD. The impact of urbanization reduced the impact of aerosols on sensible heat flux by 59 %.
There was little effect of urbanization on latent heat flux because the observed latent heat flux in urban areas was small (Fig. 6g, red lines, and Fig. 5e). Aerosols decreased the latent heat flux, and the impact increased with increasing AOD (Fig. 6g, blue lines). The impact of urbanization reduced the impact of aerosols on the latent heat flux by 48 %.
The above results indicate that the offsetting effect of aerosols on urbanization is more important than the impact of urbanization on aerosols on local weather.
3.2.2 Effects on regional circulation
There are few valuable findings from the diurnal average wind speed analysis because the average wind speed was low during the haze event. Wind speed is likely to become more meaningful during the spatial analysis of wind vectors. There are two main transmission processes of pollution from Hebei province to Beijing during this haze process according to the weather map and wind profile analysis (Fig. 4). Accordingly, the diurnal pattern of PM2.5 in Beijing (Fig. 5c) also displays two increasing processes on 16 and 19 December (from 18:00 to 24:00 LST). The observed near-surface wind vector displays these two pollutant transport processes (Fig. 7). In the first processes, obvious aerosol transport began on the night of 15 December and continued to the night of 16 December (Fig. 6). The southwest wind dominated most of the southern part of Hebei province. The transmission flux was strong during the daytime on 16 December, leading to the concentration of PM2.5 continuing to increase in Beijing and in its transmission path. The wind speed remained low from 17 to 18 December in most of the plain area, and the concentration of PM2.5 continued to increase in the southwest and northeast of Hebei province. The second processes began at 14:00 LST on 19 December, and the south wind dominated the south of Beijing and turned to the southwest in Beijing at 14:00 to 18:00 LST. The dominant wind direction turned to the southwest at 22:00 LST in the southern part of Hebei province with a rapid increase in the concentration of PM2.5.
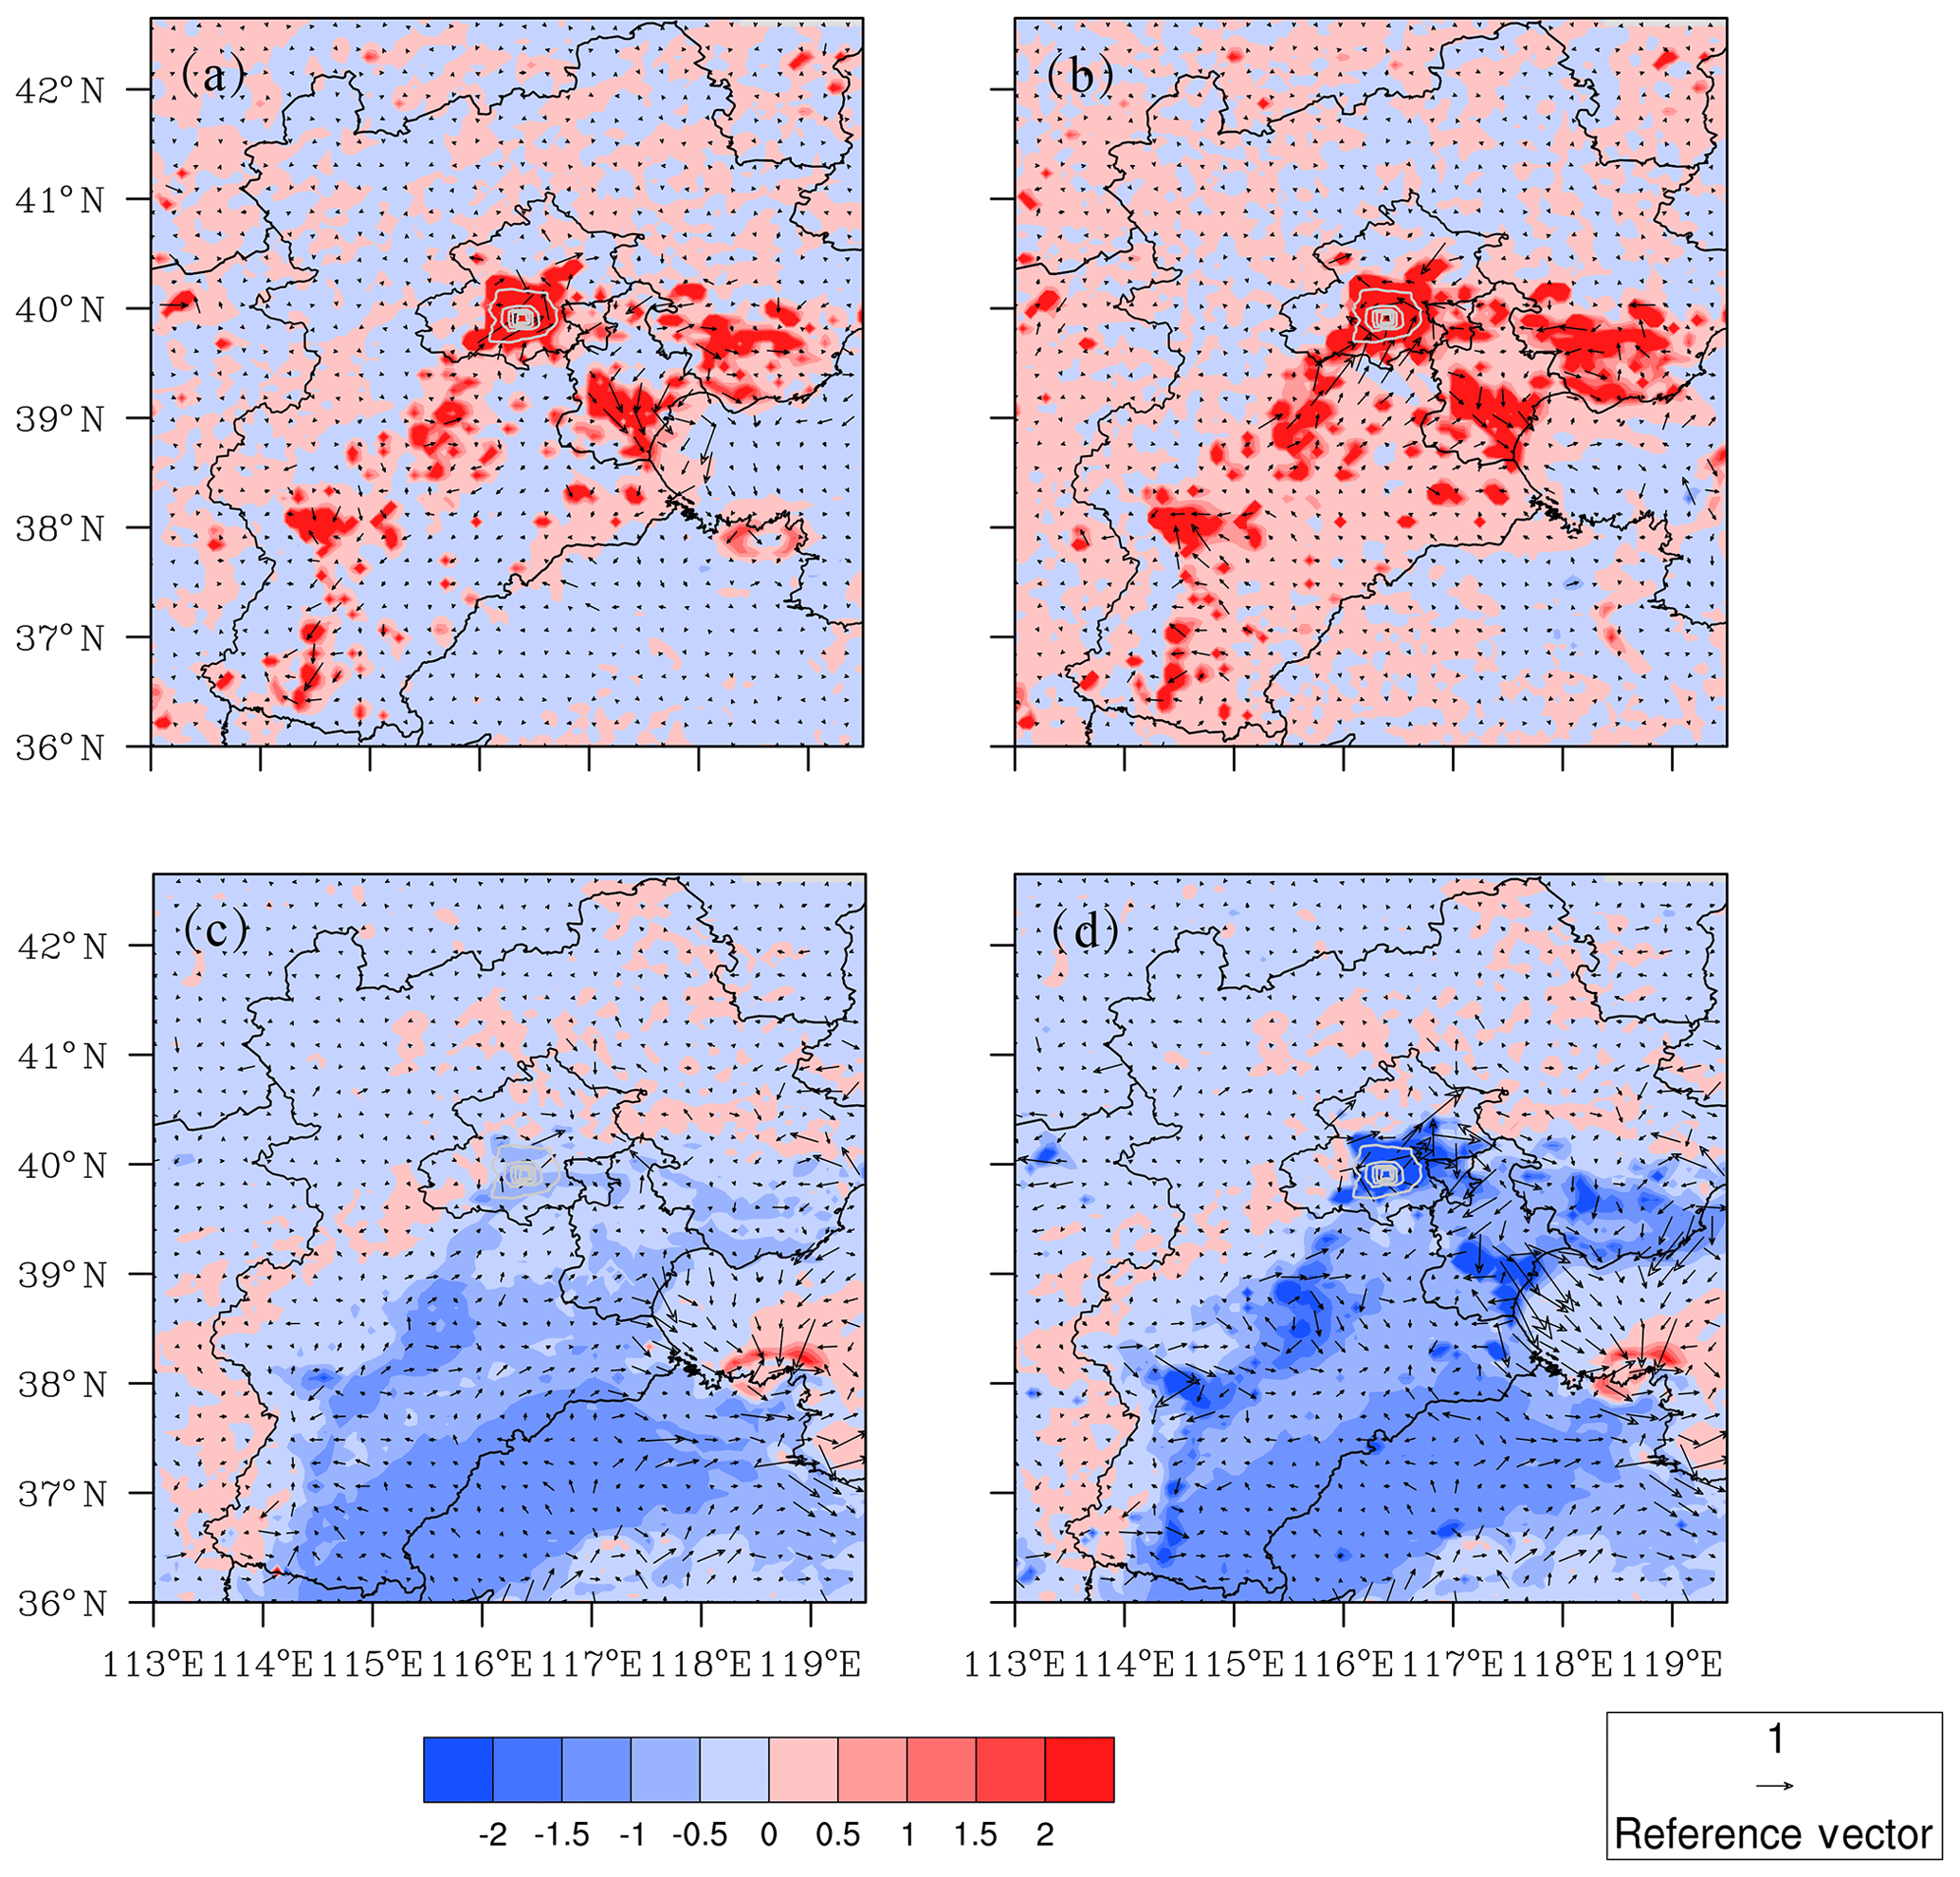
Figure 8Spatial distribution of simulated temperature (shading; ∘C) and wind field (vector; m s−1). (a) UI_aero; (b) UI_noaero; (c) AI_urban; (d) AI_nourban.
Most industrial aerosols in Beijing are transported from the southwest and northeast of Hebei province due to the control of pollutant discharge in the Beijing area during haze events. Therefore, the impact of urban areas and aerosols on transport, namely, wind fields, is very important for air quality in Beijing. The modeling results show that urbanization not only increased the temperature in urban areas (Fig. 8a and b) but also increased the average south-wind transport flux in the two main transmission processes of pollution in the southwest area of Beijing (Fig. 8a and b). The transmission flux captured by UI_noaero was stronger than that captured by UI_aero. The local cyclonic circulation induced by urbanization further induced upward movement, which was beneficial to diffusion conditions. Although aerosols decrease the transmission flux induced by urbanization, the strength of local cyclonic circulation is also reduced by aerosols. Furthermore, the aerosols reduced the temperature in most of the plain area in Hebei province (Fig. 8c and d). Urbanization decreased the impact of aerosols on temperature. There was no local or systemic effect on the wind field captured by either AI_urban or AI_nourban.
Taylor diagrams were used to analyze the relative contributions of urbanization and aerosols over time (Fig. 9). The daily mean differences in these four types of impact (UI_aero, UI_noaero, AI_urban, and AI_nourban) over the 8 d in the Beijing area are shown by Taylor diagrams. UI_noaero shows that temperature continued to increase from Day 1 to Day 5 and reached a maximum on Day 7. The variation in temperature according to UI_aero was small. This result means that the effect of urbanization on temperature is decreased by aerosols. Temperature increased from Day 1 to Day 7 according to AI_urban, while AI_nourban showed an increase from Day 3 to Day 7. The reduction in the urban impact on temperature by aerosols was more important than the reduction in aerosol impact on temperature by urbanization (Fig. 9a).
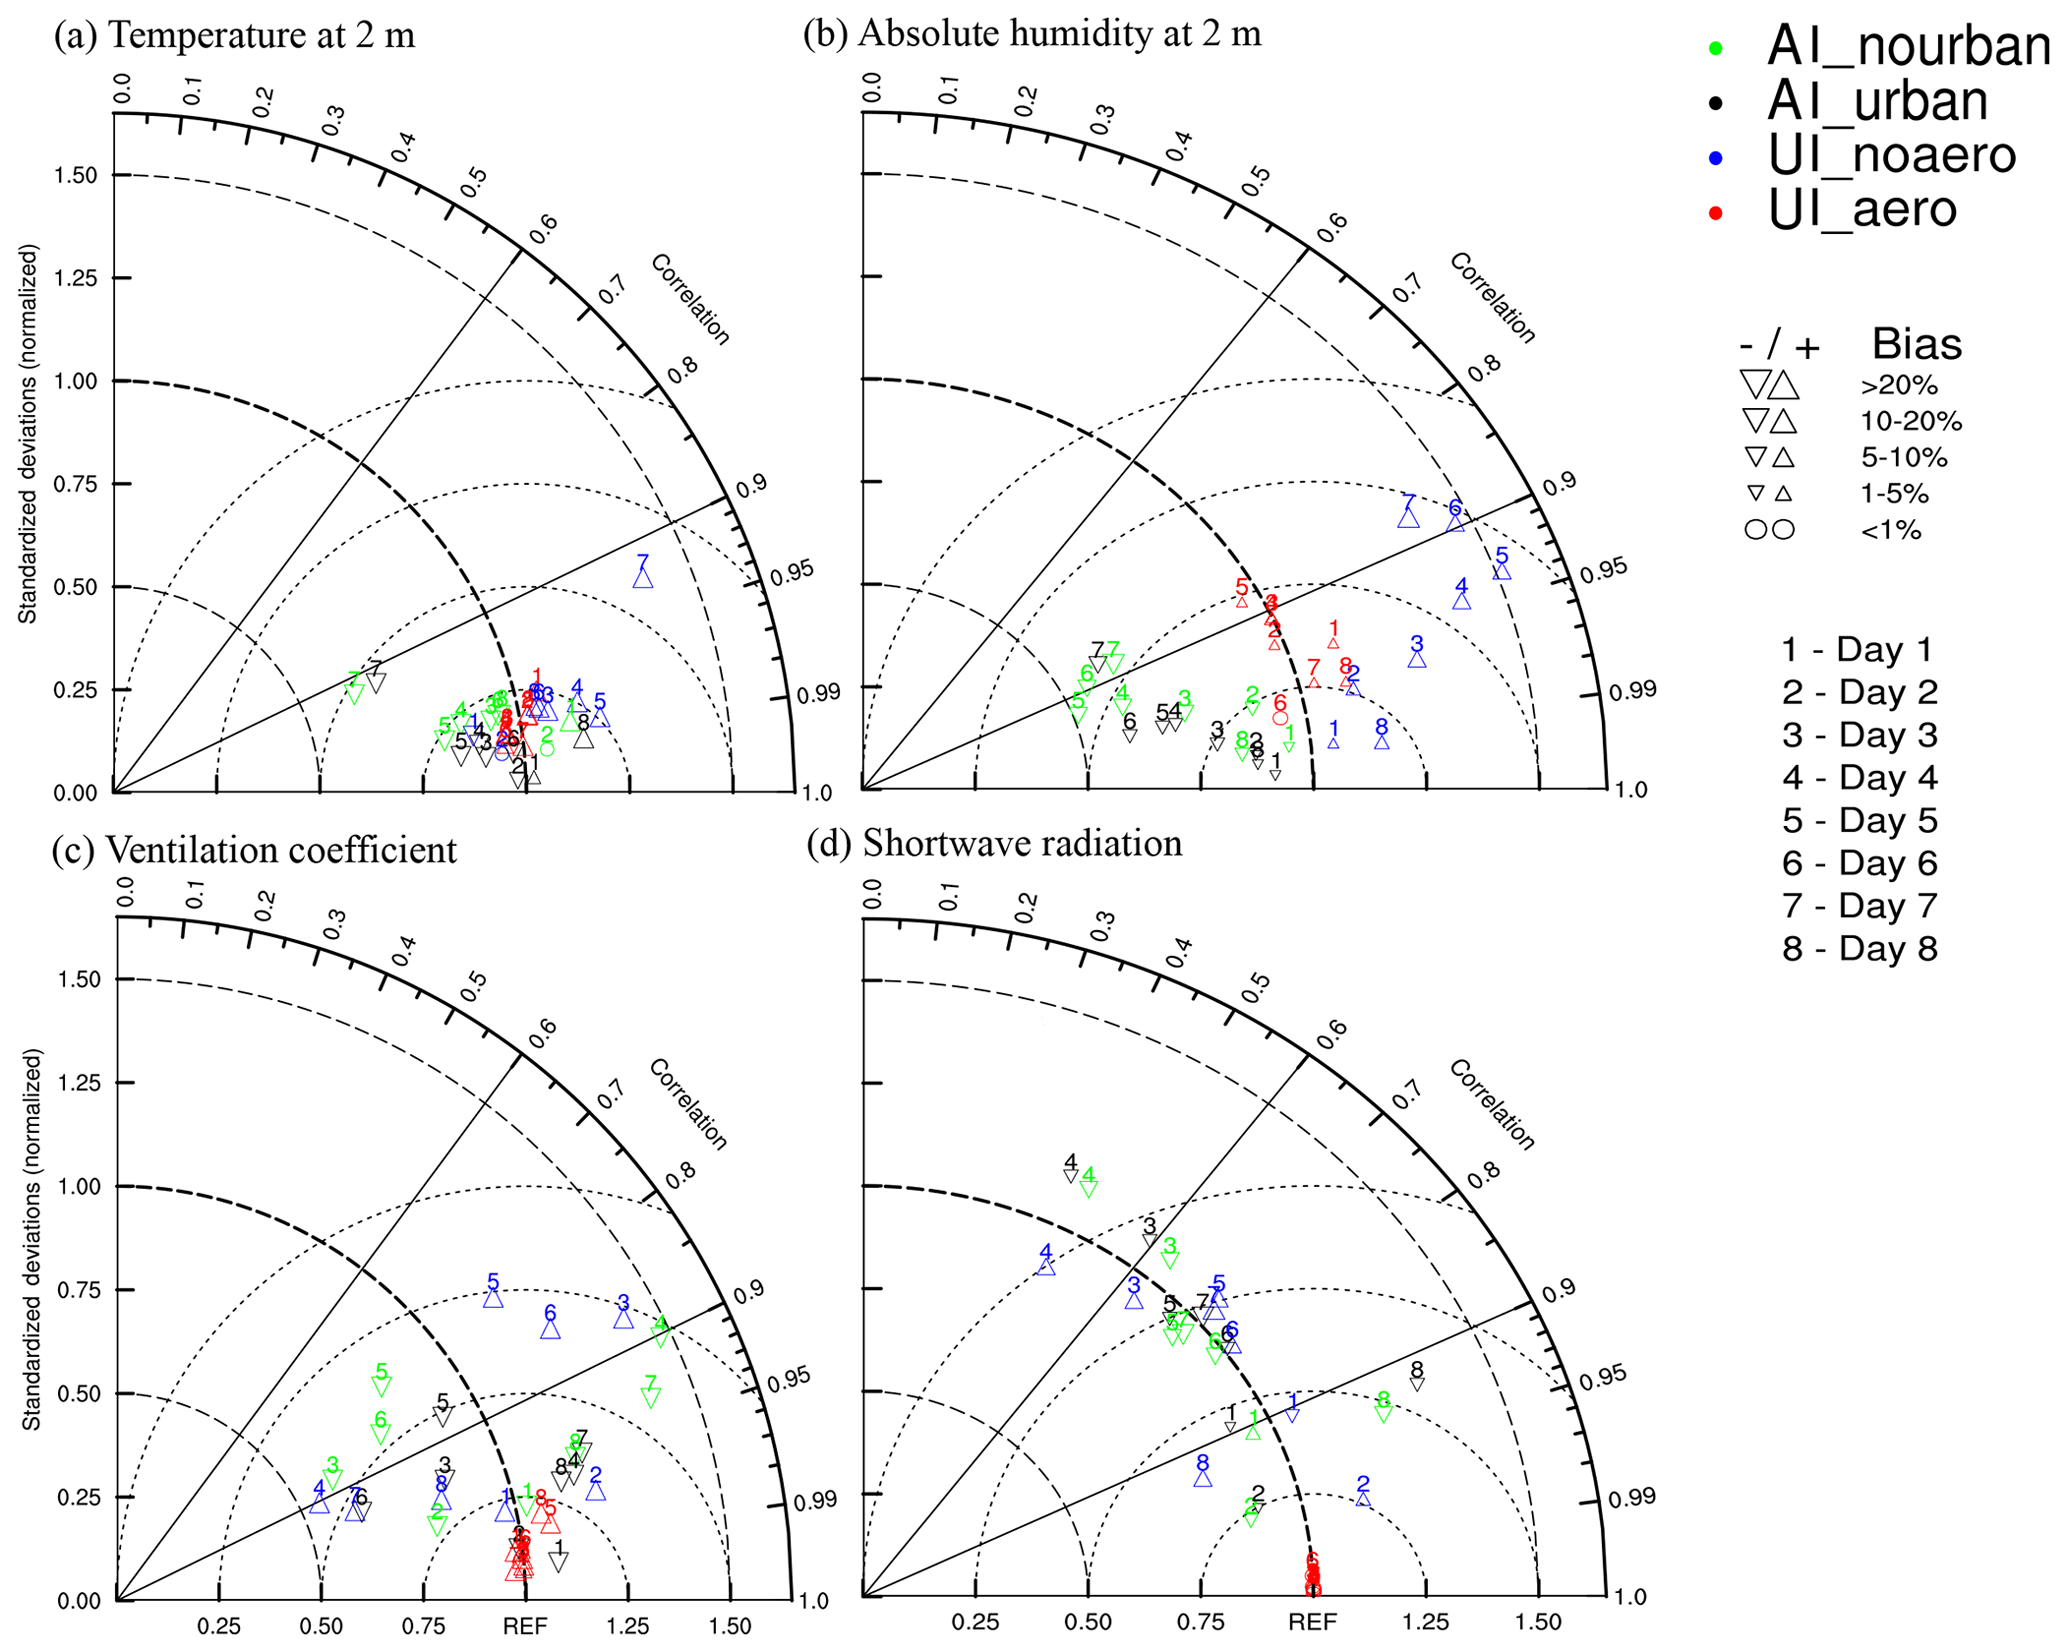
Figure 9Daily means of the four types of impacts (UI_aero, UI_noaero, AI_urban, and AI_nourban) in the 8 d are shown in Taylor diagrams in the Beijing area. (a) Temperature at 2 m (∘C); (b) absolute humidity (g kg−1); (c) ventilation coefficient (m2 s−1); (d) shortwave radiation (W m−2).
The effect of aerosols on the urban impacts on temperature was more important than the urban impacts on the effects of aerosols on temperature (Fig. 9a).
Specific humidity continued to increase from Day 1 to Day 5 according to UI_noaero, while the variation in specific humidity was small according to UI_aero (Fig. 9b). Similar to what was observed for temperature, reducing the urban impact on specific humidity by aerosols is more important than reducing the impacts to aerosols by urban areas. The ventilation coefficient (VC) in UI_aero showed little change over these 8 d, and this coefficient showed increases on Day 2, Day 3, Day 5, and Day 6 and decreases on Day 4, Day 7, and Day 8 according to UI_noaero. The reduction in the urban impact on the VC by aerosols was more important than the reduction in the impact of aerosols by urbanization. The analysis of shortwave radiation also provided the same conclusion that the reduction in the urban impact on the daily mean by aerosols was more important than the reduction in the impact of aerosols by urbanization (Fig. 9d).
3.2.3 Impacts on the vertical distribution
In the period from 00:00 to 08:00 LST from 16 to 20 December, there was an interesting phenomenon that temperature was slightly larger in UI_aero than in UI_noaero, and the urban impact reached a maximum at the same time. Such an outcome is easy to overlook if the analysis focuses on only the daily average. Therefore, a detailed vertical temperature and wind field analysis of the four addressed scenarios (UI_aero, UI_noaero, AI_urban, and AI_nourban) were used to determine the mechanism behind this finding (Fig. 10).
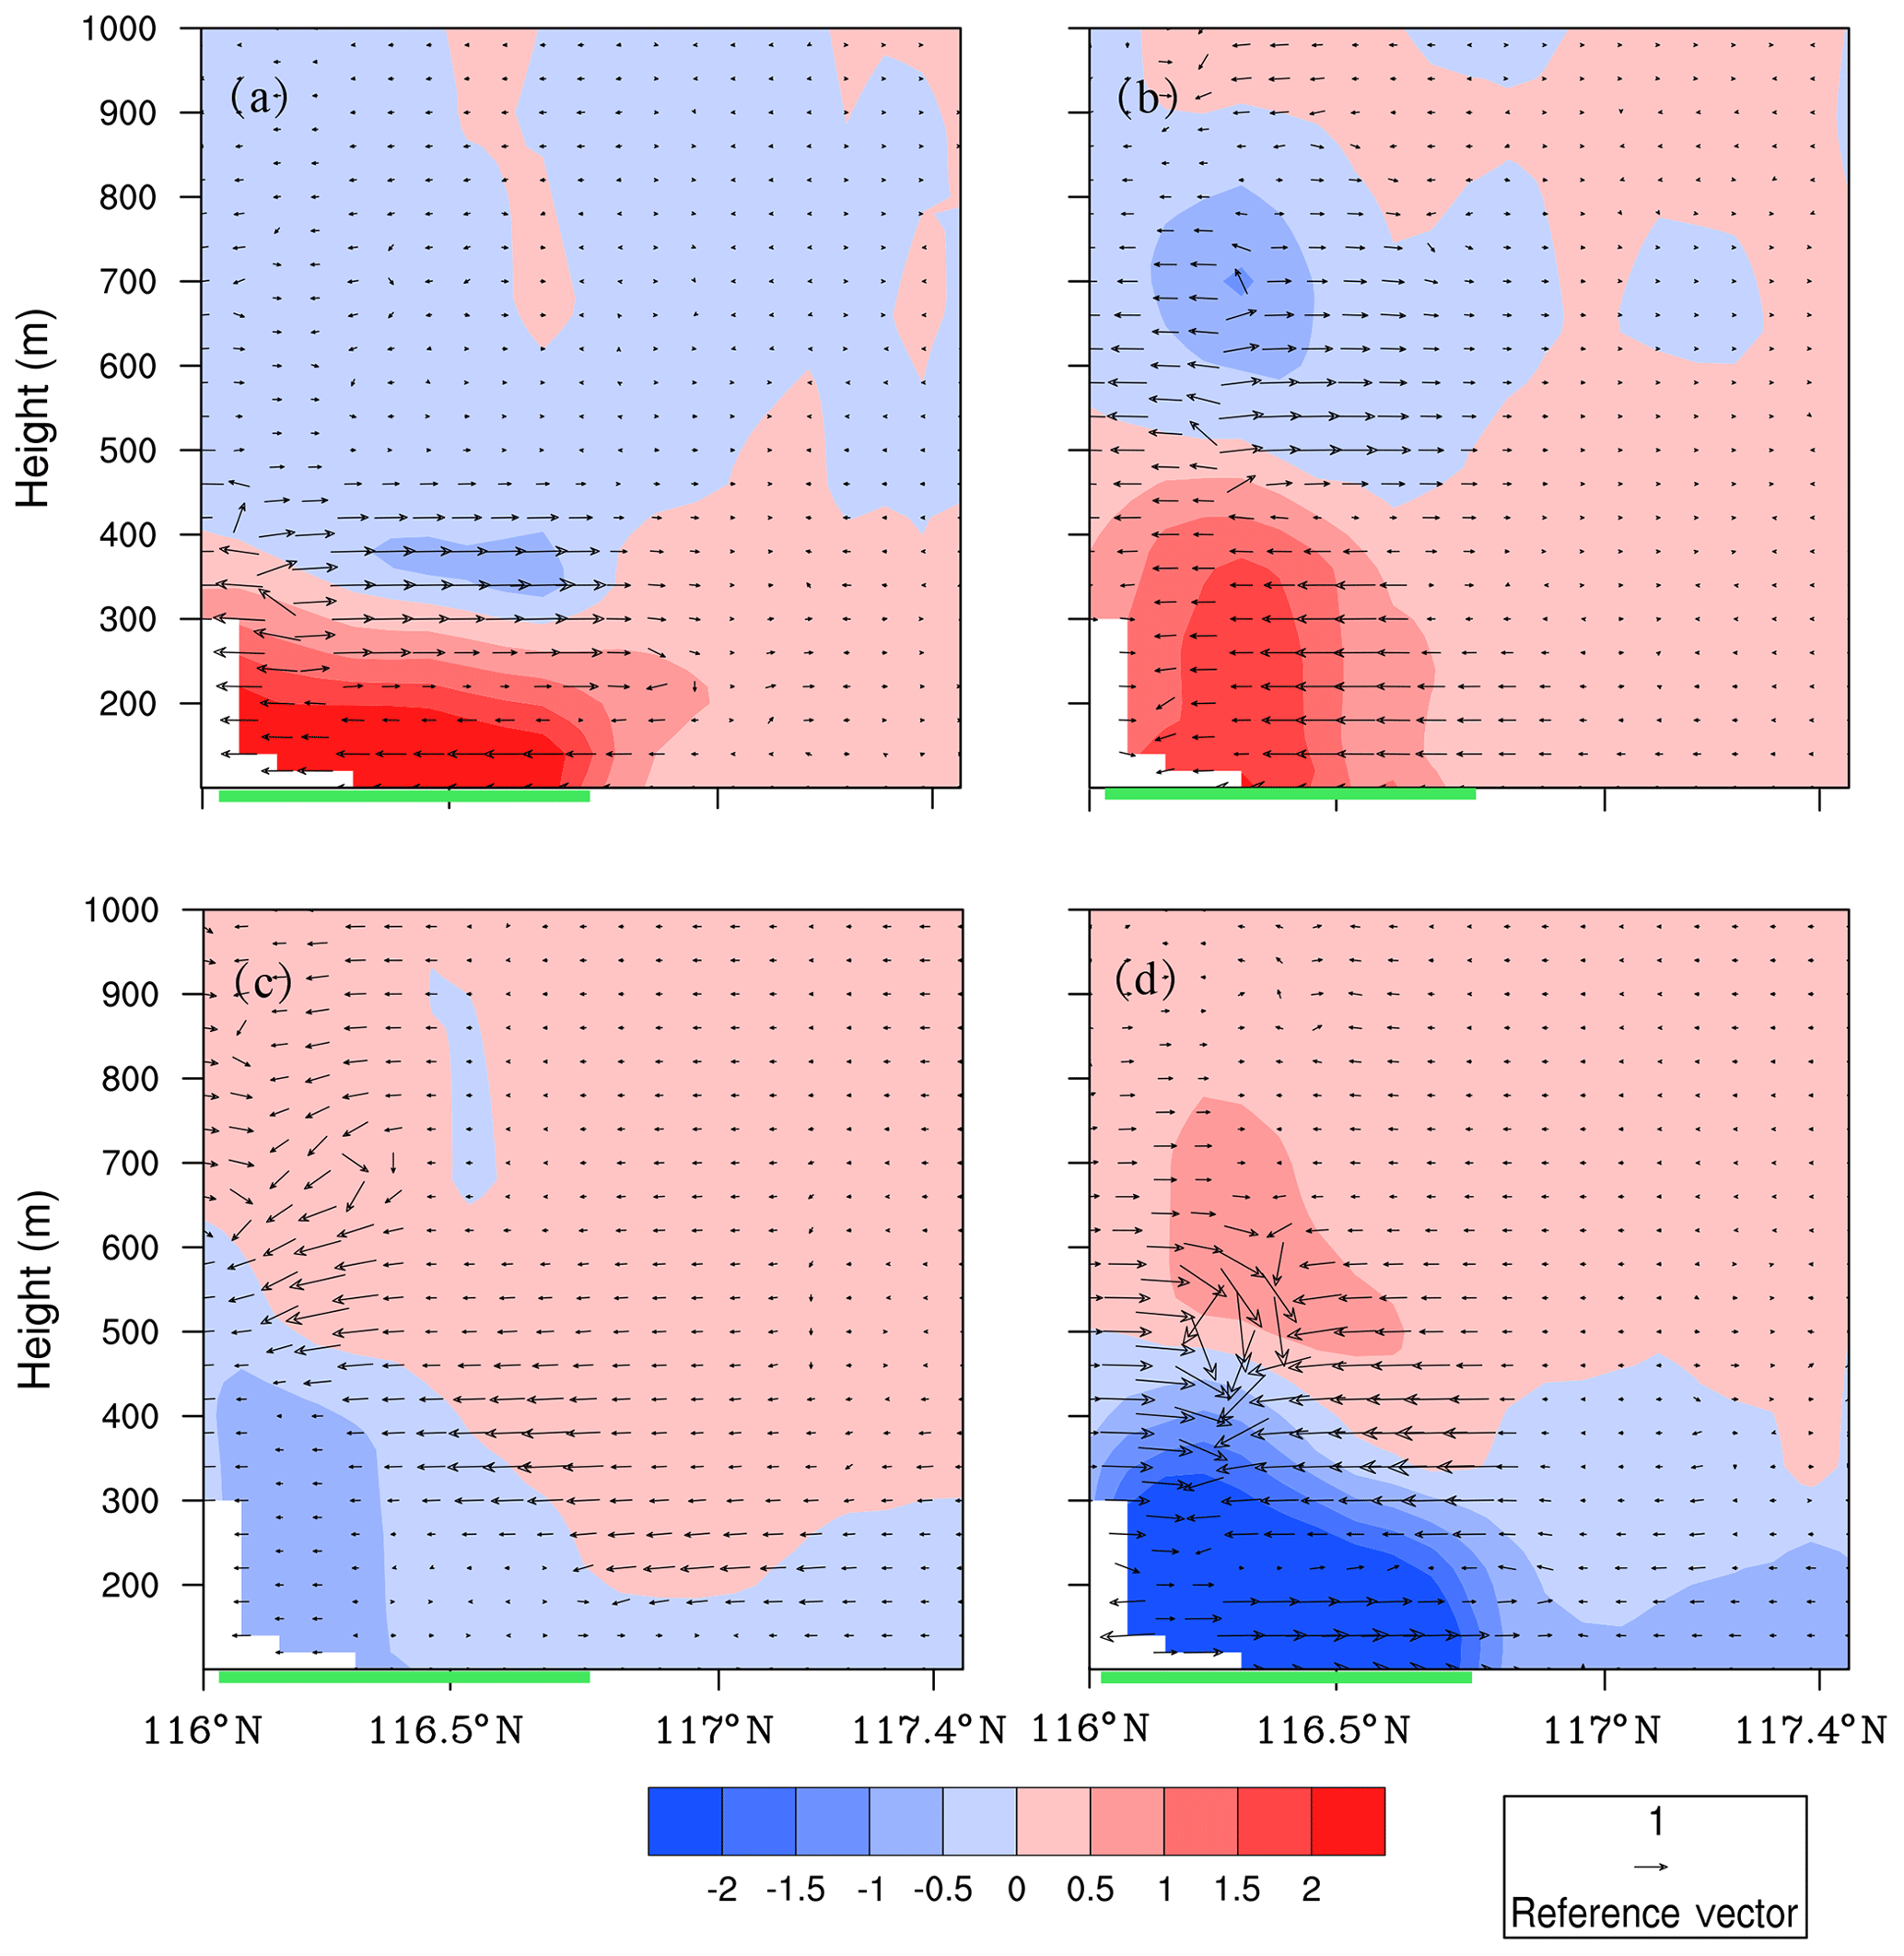
Figure 10Cross section at 39.9∘ N of average temperature (shading; ∘C) and wind field (vector; m s−1) from 00:00 to 08:00 LST from 16 to 20 December. (a) UI_aero; (b) UI_noaero; (c) AI_urban; and (d) AI_nourban.
The impact on warming by urbanization reached 350 m in UI_aero and 450 m in UI_noaero (Fig. 10a and b). Aerosols not only increased the warming impact induced by urbanization but also reduced the warming height. Aerosols increase the near-surface warming effect induced by urbanization because of the absorption of longwave radiation. Although absorption by aerosols was always observed during the study period, the impact increased with the increase in longwave radiation induced by urbanization. Therefore, the warming effect of aerosols may dominate at night in the near-surface layer. This effect further induces urban-related warming to increase and compress this effect to a lower height with a lower MLH in UI_aero than in UI_noaero (Fig. 10a). The aerosols reduced the temperature below 450 m in the urban area of Beijing (Fig. 10c and d), and the cooling effect was reduced by urbanization below 450 m. Urbanization also reduced the near-surface west wind induced by aerosols in urban areas because of the drag caused by buildings.
A typical persistent haze process occurred from 15 to 22 December 2016 in the BTH region. The average concentration of PM2.5 was approximately 200 µg m−3, and the maximum was 695 µg m−3. The interaction between aerosols and urbanization on haze events was investigated in this study. Four tests were designed using RMAPS-ST to study the mechanism of the impacts of aerosols and urbanization.
Two different impacts of aerosols on urban-related warming were found. A reducing effect occurred during the daytime, and the strength was approximately 30 % to 50 % of the concentration. An increasing effect occurred at dawn, and the strength was approximately 28 %, which is important for haze formation. The combined effect was a reducing effect on the daily mean of urban-related warming. Urbanization reduced the aerosol-related cooling effect by approximately 54 % during the haze event, and the strength of the impact changed little with increasing aerosol content. The impact of urbanization on the effect of aerosols on humidity is slightly larger than the impact of aerosols on urban impact. Aerosols reduce the average downward shortwave radiation from 7 % to 17 % with concentrations of PM2.5 of 200 to 400 µg m−3. There is no urban impact on downward shortwave radiation or an impact of aerosols on shortwave radiation. The impacts of urban areas and aerosols on longwave radiation are both smaller than 2 W m−2. The most significant impact of aerosols is observed on the MLH and sensible heat flux. The decrease in urban impact caused by aerosols reaches 148 % for MLH and 156 % for sensible heat flux. These values are much larger than those for urbanization, which reduces the impact of aerosols on the MLH and sensible heat flux. There is little urban impact on latent heat flux. However, aerosols decreased the latent heat flux, and the impact was reduced by 48.8 % by urbanization. In general, the impact of aerosols on urban impact is more important than the impact of urbanization on aerosol impacts in terms of regional averages.
Urbanization increased the wind speed southwest of the Beijing area and the local cyclonic circulation in the urban area of Beijing during the two main transmission processes. Although aerosols reduced the urban-related southwest transmission, they worsened the diffusion conditions in urban areas. The impact of urbanization on wind fields, namely, the transport of pollutants, is more important than that of aerosols. However, the interaction between urbanization and aerosols may enhance the accumulation of pollution and weigh against diffusion.
The impact of aerosols on urban-related warming is more significant than the impact of urbanization on aerosol-related cooling according to spatial statistical analysis. Similar results were found for absolute humidity, VC, and shortwave radiation. Aerosol-related warming is dominant at dawn in the near-surface layer. Aerosols increase urban-related warming and reduce the impact height of urban-related warming. This further enhances stability and reduces the MLH.
In this study, it was easier to distinguish the impacts of aerosols and urbanization by using RMAPS-ST with AOD hourly inputs than with RMAPS-Chem. One reason for this difference is that the model performance of RMAPS-ST is much better than that of RMAPS-Chem in meteorological fields. Although real-time feedback in modeling is not provided, RMAPS-ST is more efficient and more suitable for short-term operational forecasting.
This study not only qualified the impacts of aerosols and urbanization on haze events but also analyzed the interaction between aerosols and urbanization during haze events. This research will help to improve air quality under the continuous urbanization and sustainable development of large cities.
The government has taken a series of emission reduction measures, including limiting industrial emissions and vehicle plate number traffic restriction measures, to improve the air quality in the BTH region. The policies have been effective in reducing aerosols. At the same time, urbanization continues mainly in the areas around Beijing (such as Xiong'an New Area). The results of this study show that the combined impact of urbanization and decreasing aerosols will increase the downward shortwave radiation and further increase the surface temperature and ozone concentration in the boundary layer. Previous studies indicated that ozone generally increases with temperature and decreases with humidity (Camalier et al., 2007; Cardelino and Chameides, 1990). It is well known that ozone is not only a pollutant but also a greenhouse gas. Therefore, ozone will form a positive feedback mechanism to induce warming and ozone pollution in the boundary layer. This feedback will pose a new challenge regarding how to reduce ozone pollution in urban areas. Some studies have suggested that urban greening can effectively reduce ozone pollution (Nowak et al., 2000; Benjamin and Winer, 1998). More attempts should be made to add the interaction between urbanization and ozone in regional models.
The data in this study are available from the corresponding author upon request (tgq@dq.cern.ac.cn).
MY designed the research and wrote the paper. GT conducted the measurements and reviewed the paper. YY conducted modeling tests. QL and YW performed synoptic analysis. SM, YZ, and YW reviewed and commented on the paper.
The authors declare that they have no conflict of interest.
This work was supported by the Beijing National Science Foundation of China (grant no. 8171002), the National Natural Science Foundation of China (grant nos. 41705090, 41705076, and 41705088), and the National Key R&D Program of China (grant no. 2019YFA0607202).
This paper was edited by Jianping Huang and reviewed by Nathan Hosannah and one anonymous referee.
Benjamin, M. T. and Winer, A. M.: Estimating the ozone-forming potential of urban trees and shrubs, Atmos. Environ., 32, 53–68, 1998.
Camalier, L., Cox, W., and Dolwick, P.: The effects of meteorology on ozone in urban areas and their use in assessing ozone trends, Atmos. Environ., 41, 7127–7137, 2007.
Cao, C., Lee, X., Liu, S., Schultz, N., Xiao, W., Zhang, M., and Zhao, L.: Urban heat islands in China enhanced by haze pollution, Nat. Commun., 7, 1–7, 2016.
Cardelino, C. A. and Chameides, W. L.: Natural hydrocarbons, urbanization, and urban ozone, J. Geophys. Res., 95, 13971, https://doi.org/10.1029/JD095iD09p13971, 1990.
Chen, H. and Wang, H.: Haze Days in North China and the associated atmospheric circulations based on daily visibility data from 1960 to 2012, J. Geophys. Res.-Atmos., 120, 5895–5909, 2015.
Coulter, R. L.: A Comparison of three methods for measuring mixing-layer height, J. Appl. Meteorol., 18, 1495–1499, 1979.
Crutzen, P. J.: New directions: the growing urban heat and pollution “island” effect-impact on chemistry and climate, Atmos. Environ., 38, 3539–3540, 2004.
Fan, S.: Assessment report of regional high resolution model (RMAPS-ST), IUM Technical Note IUM/2018-1, Beijing, China, IUM, 2018.
Folberth, G. A., Rumbold, S. T., Collins, W. J., and Butler, T. M.: Global radiative forcing and megacities, Urban Climate, 1, 4–19, 2014.
Grimmond, S. U. E.: Urbanization and global environmental change: local effects of urban warming, Geogr. J., 173, 83–88, 2007.
Guo, J., Miao, Y., Zhang, Y., Liu, H., Li, Z., Zhang, W., He, J., Lou, M., Yan, Y., Bian, L., and Zhai, P.: The climatology of planetary boundary layer height in China derived from radiosonde and reanalysis data, Atmos. Chem. Phys., 16, 13309–13319, https://doi.org/10.5194/acp-16-13309-2016, 2016.
Huang, J., Minnis, P., Yi, Y., Tang, Q., Wang, X., Hu, Y., and Winker, D. M.: Summer dust aerosols detected from CALIPSO over the Tibetan Plateau, Geophys. Res. Lett., 34, L18805, https://doi.org/10.1029/2007GL029938, 2007.
Huang, J., Minnis, P., Chen, B., Huang, Z., Liu, Z., Zhao, Q., and Ayers, J. K.: Long-range transport and vertical structure of Asian dust from CALIPSO and surface measurements during PACDEX, J. Geophys. Res., 113, D23212, https://doi.org/10.1029/2008JD010620, 2008a.
Huang, J., Zhang, W., Zuo, J., Bi, J., Shi, J., Wang, X., Chang, Z., Huang, Z., Yang, S., Zhang, B., Wang, G., Feng, G., Yuan, J., Zhang, L., Zuo, H., Wang, S., Fu, C., and Chou, J.: An overview of the semi-arid climate and environment research observatory over the Loess Plateau, Adv. Atmos. Sci., 25, 1–16, https://doi.org/10.1007/s00376-008-0906-7, 2008b.
Hong, S. Y., Noh, Y., and Dudhia, J.: A new vertical diffusion package with an explicit treatment of entrainment processes, Mon. Weather Rev., 134, 2318–2341, 2006.
Jacobson, M. Z.: Studying the effects of aerosols on vertical photolysis rate coefficient and temperature profiles over an urban airshed, J. Geophys. Res., 103, 10593–10604, 1998.
Kain, J. S.: The Kain–Fritsch convective parameterization: An update, J. Appl. Meteorol., 43, 170–181, 2004.
Li, D. and Bou-Zeid, E.: Synergistic interaction between urban heat islands and heat waves: the impact in cities is larger than the sum of its parts, J. Appl. Meteorol. Clim., 52, 2051–2064, 2013.
Liu, Q., Geng, H., and Chen, Y.: Vertical distribution of aerosols during different intense dry haze period around Shanghai, China Environmental Science, 32, 207–213, 2012 (in Chinese).
Miao, S. and Chen, F.: Enhanced modeling of latent heat flux from urban surfaces in the Noah/single-layer urban canopy coupled model, Sci. China Earth Sci., 57, 2408–2416, 2014.
Miao, S., Dou J., Chen, F., Li, J., and Li, A.: Analysis of observations on the urban surface energy balance in Beijing, Sci. China Earth Sci., 55, 1881–1890, 2012.
Miao, Y., Guo, J., Liu, S., Liu, H., Li, Z., Zhang, W., and Zhai, P.: Classification of summertime synoptic patterns in Beijing and their associations with boundary layer structure affecting aerosol pollution, Atmos. Chem. Phys., 17, 3097–3110, https://doi.org/10.5194/acp-17-3097-2017, 2017.
Nowak, D. J., Civerolo, K. L., Rao, S. T., Sistla, G., Luley, C. J., and Crane, D. E.: A modeling study of the impact of urban trees on ozone, Atmos. Environ., 34, 1601–1613, 2000.
Oke, T. R.: The energetic basis of the urban heat island, Q. J. Roy. Meteor. Soc., 108, 1–24, 1982.
Oke, T. R.: The heat island of the urban boundary layer: Characteristics, causes and effects, Nato Adv. Sci. Inst. Se., 277, 81–107, 1995.
Pei, L., Yan, Z., Chen, D., and Miao, S.: Climate variability or anthropogenic emissions: which caused Beijing Haze?, Environ. Res. Lett., 15, 034004, https://doi.org/10.1088/1748-9326/ab6f11, 2020.
Quan, J., Tie, X., Zhang, Q., Liu, Q., Li, X., Gao, Y., and Zhao, D.: Characteristics of heavy aerosol pollution during the 2012–2013 winter in Beijing, China, Atmos. Environ., 88, 83–89, 2014.
Ren, Y., Zhang, H., Wei, W., Wu, B., Cai, X., and Song, Y.: Effects of turbulence structure and urbanization on the heavy haze pollution process, Atmos. Chem. Phys., 19, 1041–1057, https://doi.org/10.5194/acp-19-1041-2019, 2019.
Rudich, Y., Donahue, N. M., and Mentel, T. F.: Aging of organic aerosol: bridging the gap between laboratory and field studies, Ann. Rev. Phys. Chem., 58, 321–352, 2007.
Skamarock, W. C., Klemp, J. B., Dudhia, J., Gill, D. O., Barker, D., Wang, W., and Powers, J. G.: A description of the advanced research WRF version 3, NCAR/TN-475 + STR, 2008.
Sun, Y., Wang, Z., Fu, P., Jiang, Q., Yang, T., Li, J., and Ge, X.: The impact of relative humidity on aerosol composition and evolution processes during wintertime in Beijing, China, Atmos. Environ., 77, 927–934, 2013.
Taha, H.: Urban climates and heat islands: albedo, evapotranspiration, and anthropogenic heat, Energ. Buildings, 25, 99–103, 1997.
Tang, G., Zhu, X., Hu, B., Xin, J., Wang, L., Münkel, C., Mao, G., and Wang, Y.: Impact of emission controls on air quality in Beijing during APEC 2014: lidar ceilometer observations, Atmos. Chem. Phys., 15, 12667–12680, https://doi.org/10.5194/acp-15-12667-2015, 2015.
Tang, G., Zhang, J., Zhu, X., Song, T., Münkel, C., Hu, B., Schäfer, K., Liu, Z., Zhang, J., Wang, L., Xin, J., Suppan, P., and Wang, Y.: Mixing layer height and its implications for air pollution over Beijing, China, Atmos. Chem. Phys., 16, 2459–2475, https://doi.org/10.5194/acp-16-2459-2016, 2016.
Tao, W., Liu, J., Ban-Weiss, G. A., Hauglustaine, D. A., Zhang, L., Zhang, Q., Cheng, Y., Yu, Y., and Tao, S.: Effects of urban land expansion on the regional meteorology and air quality of eastern China, Atmos. Chem. Phys., 15, 8597–8614, https://doi.org/10.5194/acp-15-8597-2015, 2015.
Thompson, G., Field, P. R., Rasmussen, R. M., and Hall, W. D.: Explicit forecasts of winter precipitation using an improved bulk microphysics scheme. Part II: Implementation of a new snow parameterization, Mon. Weather Rev., 136, 5095–5115, 2008.
Wang, K., Wang, J., Wang, P., Sparrow, M., Yang, J., and Chen, H.: Influences of urbanization on surface characteristics as derived from the Moderate-Resolution Imaging Spectroradiometer: A case study for the Beijing metropolitan area, J. Geophys. Res., 112, D22S06, https://doi.org/10.1029/2006jd007997, 2007.
Wang, Y., Yu, M., Wang, Y., Tang, G., Song, T., Zhou, P., Liu, Z., Hu, B., Ji, D., Wang, L., Zhu, X., Yan, C., Ehn, M., Gao, W., Pan, Y., Xin, J., Sun, Y., Kerminen, V.-M., Kulmala, M., and Petäjä, T.: Rapid formation of intense haze episodes via aerosol–boundary layer feedback in Beijing, Atmos. Chem. Phys., 20, 45–53, https://doi.org/10.5194/acp-20-45-2020, 2020.
Wei, W., Zhang, H., Wu, B., Huang, Y., Cai, X., Song, Y., and Li, J.: Intermittent turbulence contributes to vertical dispersion of PM2.5 in the North China Plain: cases from Tianjin, Atmos. Chem. Phys., 18, 12953–12967, https://doi.org/10.5194/acp-18-12953-2018, 2018.
Wu, D., Wu, X, Li, F., Tan, H., Chen, J, Cao, Z., Sun, X., Chen, H., and Li, H.: Temporal and spatial variation of haze during 1951–2005 in Chinese mainland, Acta Meteorolgica Sinica, 68, 680–688, 2010 (in Chinese).
Xu, X., Chen, F., Barlage, M., Gochis, D., Miao, S., and Shen, S.: Lessons learned from modeling irrigation from field to regional scales, J. Adv. Model. Earth Sy., 11, 2428–2448,https://doi.org/10.1029/2018MS001595, 2019.
Yang, Y., Zheng, Z., Yim, S. Y. L., Roth, M., Ren, G., Gao, Z., Wang, T., Li, Q., Shi, C., Ning, G., and Li, Y.: PM2.5 pollution modulates wintertime urban heat island intensity in the Beijing-Tianjin-Hebei Megalopolis, China, Geophys. Res. Lett., 47, GL084288, https://doi.org/10.1029/2019GL084288, 2020.
Yu, M., Miao, S., and Li, Q.: Synoptic analysis and urban signatures of a heavy rainfall on 7 August 2015 in Beijing, J. Geophys. Res.-Atmos., 122, 65–78, https://doi.org/10.1002/2016JD025420, 2017.
Yu, M., Liu, Y. M., Dai, Y. F., and Yang, A.: Impact of urbanization on boundary layer structure in Beijing, Climatic Change, 120, 123–136, 2013.
Zhai, S., Jacob, D. J., Wang, X., Shen, L., Li, K., Zhang, Y., Gui, K., Zhao, T., and Liao, H.: Fine particulate matter (PM2.5) trends in China, 2013–2018: separating contributions from anthropogenic emissions and meteorology, Atmos. Chem. Phys., 19, 11031–11041, https://doi.org/10.5194/acp-19-11031-2019, 2019.
Zhang, C., Liu, C., Hu, Q., Cai, Z., Su, W., Xia, C., and Liu, J.: Satellite UV-Vis spectroscopy: implications for air quality trends and their driving forces in China during 2005–2017, Light-Sci. Appl., 8, 1–12, 2019.
Zhang, W., Zhuang, G., Guo, J., Xu, D., Wang, W., and Baumgardner, D., and Yang, W.: Sources of aerosol as determined from elemental composition and size distributions in Beijing, Atmos. Res., 95, 197–209, https://doi.org/10.1016/j.atmosres.2009.09.017, 2010.
Zhang, Z., Zhao, X., Xiong, Y., and Ma, X. H.: The Fog/Haze Medium-range Forecast Experiments Based on Dynamic Statistic Method, J. Appl. Meteorol. Sci., 29, 57–69, 2018 (in Chinese).
Zhao, P. S., Xu, X. F., Meng, W., Dong, F., and Zhang, X. L.: Characteristics of haze days in the region of Beijing, Tianjin, and Hebei, China Environmental Science, 31, 31–36, 2012 (in Chinese).
Zhao, X. J., Li, Z. M., and Xu, J.: Modification and performance tests of visibility parameterizations for haze days, Environmental Science, 40, 1688–1696, 2019 (in Chinese).
Zhong, S., Qian, Y., Zhao, C., Leung, R., and Yang, X. Q.: A case study of urbanization impact on summer precipitation in the Greater Beijing Metropolitan Area: Urban heat island versus aerosol effects, J.f Geophys. Res.-Atmos., 120, 10903–10914, https://doi.org/10.1002/2015JD023753, 2015.
Zhong, S., Qian, Y., Zhao, C., Leung, R., Wang, H., Yang, B., Fan, J., Yan, H., Yang, X.-Q., and Liu, D.: Urbanization-induced urban heat island and aerosol effects on climate extremes in the Yangtze River Delta region of China, Atmos. Chem. Phys., 17, 5439–5457, https://doi.org/10.5194/acp-17-5439-2017, 2017.
Zhong, S., Qian, Y., Sarangi, C., Zhao, C., Leung, R., Wang, H., and Yang, B.: Urbanization effect on winter haze in the Yangtze River Delta region of China, Geophys. Res. Lett., 45, 6710–6718, https://doi.org/10.1029/2018GL077239, 2018.
Zhu, X., Tang, G., Guo, J., Hu, B., Song, T., Wang, L., Xin, J., Gao, W., Münkel, C., Schäfer, K., Li, X., and Wang, Y.: Mixing layer height on the North China Plain and meteorological evidence of serious air pollution in southern Hebei, Atmos. Chem. Phys., 18, 4897–4910, https://doi.org/10.5194/acp-18-4897-2018, 2018.