the Creative Commons Attribution 4.0 License.
the Creative Commons Attribution 4.0 License.
 | 14 Aug 2020
Towards the connection between snow microphysics and melting layer: insights from multifrequency and dual-polarization radar observations during BAECC
Jussi Tiira
Annakaisa von Lerber
Dmitri Moisseev
In stratiform rainfall, the melting layer (ML) is often visible in radar observations as an enhanced reflectivity band, the so-called bright band. Despite the ongoing debate on the exact microphysical processes taking place in the ML and on how they translate into radar measurements, both model simulations and observations indicate that the radar-measured ML properties are influenced by snow microphysical processes that take place above it. There is still, however, a lack of comprehensive observations to link the two. To advance our knowledge of precipitation formation in ice clouds and provide new insights into radar signatures of snow growth processes, we have investigated this link. This study is divided into two parts. Firstly, surface-based snowfall measurements are used to develop a new method for identifying rimed and unrimed snow from X- and Ka-band Doppler radar observations. Secondly, this classification is used in combination with multifrequency and dual-polarization radar observations collected during the Biogenic Aerosols – Effects on Clouds and Climate (BAECC) experiment in 2014 to investigate the impact of precipitation intensity, aggregation, riming and dendritic growth on the ML properties. The results show that the radar-observed ML properties are highly related to the precipitation intensity. The previously reported bright band “sagging” is mainly connected to the increase in precipitation intensity. Ice particle riming plays a secondary role. In moderate to heavy rainfall, riming may cause additional bright band sagging, while in light precipitation the sagging is associated with unrimed snow. The correlation between ML properties and dual-polarization radar signatures in the snow region above appears to be arising through the connection of the radar signatures and ML properties to the precipitation intensity. In addition to advancing our knowledge of the link between ML properties and snow processes, the presented analysis demonstrates how multifrequency Doppler radar observations can be used to get a more detailed view of cloud processes and establish a link to precipitation formation.
- Article
(8298 KB) - Full-text XML
- BibTeX
- EndNote


Stratiform precipitation is prevalent in middle to high latitudes. In such precipitation systems, ice particles nucleated at the cloud top descend and grow on their way down by going through various microphysical processes, e.g., vapor deposition, aggregation and/or riming (Lamb and Verlinde, 2011). In the case of rainfall, these ice particles transform into raindrops in the melting layer (ML). The melting of ice particles is capable of modulating the thermal structure of the ML through the exchange of latent heat with the environment (Stewart et al., 1984; Carlin and Ryzhkov, 2019) and, as a result, can change the dynamics of precipitation (e.g., Heymsfield, 1979; Szeto et al., 1988; Fabry and Zawadzki, 1995). It has shown that ML properties are modified by the ambient environment such as relative humidity (RH; Willis and Heymsfield, 1989; Battaglia et al., 2003; Carlin and Ryzhkov, 2019), as well as microphysical processes taking place in the ML (Heymsfield et al., 2015), and by snow microphysical processes occurring above, e.g., aggregation and riming (Stewart et al., 1984; Klaassen, 1988; Fabry and Zawadzki, 1995; Zawadzki et al., 2005; von Lerber et al., 2014; Kumjian et al., 2016; Xie et al., 2016; Wolfensberger et al., 2016; Trömel et al., 2019). In addition, the microwave attenuation in the ML is sensitive to the parameterization of snow microphysics (von Lerber et al., 2014) and can be significant at millimeter wavelengths (Matrosov, 2008; Haynes et al., 2009; Li and Moisseev, 2019).
To centimeter-wavelength weather radars, the ML appears as a band of the increased reflectivity, the so-called bright band, while to millimeter-wavelength radars, such an appearance is less distinct (e.g., Lhermitte, 1988; Sassen et al., 2005; Kollias and Albrecht, 2005). Properties of the ML and its radar manifestation bright band are influenced by cloud dynamics and microphysics, which can be directly probed by aircraft-mounted in situ measurements (e.g., Stewart et al., 1984; Willis and Heymsfield, 1989; Heymsfield et al., 2015) despite the inability to conduct continuous long-term operations with such setups. Remote sensing of the ML with radars dates back to the 1940s (Ryde, 1946). Atlas (1957) has found that the strength of the bright band is weakened when melting graupel particles are present, which was further confirmed by Klaassen (1988) and Zawadzki et al. (2005). A comprehensive long-term analysis of the ML appearance in vertically pointing X-band radar and ultra high frequency (UHF) wind profiler observations has been performed by Fabry and Zawadzki (1995). They have compiled a record of the main ML features that were later used in modeling studies (e.g., Szyrmer and Zawadzki, 1999; Zawadzki et al., 2005; von Lerber et al., 2014). As the ML bridges snow and rain, the raindrop size distributions below the ML seem to be related to the bright band's reflectivity values (Huggel et al., 1996; Sarma et al., 2016). As presented by Wolfensberger et al. (2016), the thickness of the ML depends on riming, particle fall velocities and the bright band intensity. Meanwhile, the downward extension of the bright band, called the saggy bright band, may be linked to riming as suggested by previous studies (Trömel et al., 2014; Kumjian et al., 2016; Ryzhkov et al., 2016; Xie et al., 2016; Erlingis et al., 2018). Recently, Carlin and Ryzhkov (2019) have incorporated the cooling effects of melting snowflakes in the ML model and proposed that the saggy bright band may be explained by a combination of processes instead of a single factor. From the perspective of observation, there seems to be a lack of statistical studies untangling the impacts of snow growth processes on the observed ML properties.
Over the last few years, multifrequency radar measurements of clouds and precipitation have become more easily attainable, which has led to the proliferation of studies demonstrating the advantages of using these observations for the investigation of snow microphysical processes (e.g., Kneifel et al., 2011, 2015; Leinonen et al., 2012a, 2013, 2018; Tyynelä and Chandrasekar, 2014; Leinonen and Moisseev, 2015; Leinonen and Szyrmer, 2015; Grecu et al., 2018; Chase et al., 2018; Mason et al., 2018, 2019). The potential dependence of dual-wavelength ratios (DWRs) at Ka–W-bands and X–Ka-bands on riming was observed by Kneifel et al. (2015). Dias Neto et al. (2019) have presented the strong aggregation signatures close to the ML using multifrequency radar observations. This rapid aggregation could manifest itself as a dark band in W-band cloud radar observations, namely the dip in radar reflectivity just above the ML top (Lhermitte, 1988; Sassen et al., 2005, 2007; Heymsfield et al., 2008). Such a reflectivity dip just above the ML may even be present in X-band radar measurements of light precipitation (Fabry and Zawadzki, 1995) but has not been well addressed. Mason et al. (2018) have incorporated the Doppler velocity and radar reflectivity observations from vertically pointing Ka- and W-band radars into an optimal estimation scheme to infer the riming fraction, among other parameters. In addition to multifrequency radar observations, dual-polarization radar measurements show promise in improving our understanding of ice precipitation processes (e.g., Bechini et al., 2013; Giangrande et al., 2016; Kumjian et al., 2016; Ryzhkov et al., 2016; Moisseev et al., 2015, 2017; Li et al., 2018; Oue et al., 2018; Vogel and Fabry, 2018; Moisseev et al., 2019; Tiira and Moisseev, 2020). Therefore, the utilization of collocated multifrequency and dual-polarization radar observations may pave the way for a better understanding of the connection between dry and melting snow microphysics.
The detailed properties of ice particles are complex as manifested by the extraordinary variety in their habit, size, mass and concentration (Korolev et al., 2000, 2003; Bailey and Hallett, 2009). This complexity is exacerbated by the diversity of ice growth processes that take place in ice clouds (Li et al., 2018; Oue et al., 2018; Barrett et al., 2019; Moisseev et al., 2015, 2017, 2019; Tiira and Moisseev, 2020). Despite the recent attempts to resolve the ice microphysics (e.g., Mason et al., 2018, 2019; Barrett et al., 2019), direct characterization of ice particles and their growth processes is still challenging. In some cases, ML properties could emphasize radar signatures of such processes (Zawadzki et al., 2005; Kumjian et al., 2016; Li and Moisseev, 2020) and therefore provide additional information. However, there is an ongoing debate on the link between snow growth processes, such as riming and aggregation, their radar signatures and ML properties (e.g., Kumjian et al., 2016; Carlin and Ryzhkov, 2019; Heymsfield et al., 2015). This study aims to advance our understanding of the link and resolve at least some of the discussed topics. During the Biogenic Aerosols – Effects on Clouds and Climate (BAECC) experiment (Petäjä et al., 2016), vertically pointing X-, Ka- and W-band cloud radars were deployed at the University of Helsinki research station in Hyytiälä, Finland. These observations were supplemented by range–height indicator (RHI) scans carried out by the Finnish Meteorological Institute (FMI) C-band dual-polarization radar, providing a set of unique synergistic observations ideally suited for studying the connection between the growth and melting processes of snowflakes.
The paper is organized as follows. Section 2 introduces the instrumentation used in this study, followed by the illustration of detecting the ML and separating unrimed and rimed snow in Sect. 3. A sanity check of the snow classification and the statistical results of multifrequency and dual-polarization radar observations are provided in Sect. 4. Conclusions are presented in Sect. 5.
The BAECC field campaign was conducted at the University of Helsinki's Hyytiälä Station from February to September 2014 (Petäjä et al., 2016). This experiment provides comprehensive vertically pointing multifrequency radar rainfall observations, which are used in this study. A 2D video disdrometer (2DVD) was used to measure rain rate and calibrate X-band radar reflectivity. The collocated observations were aided by the FMI C-band dual-polarization weather radar. In addition to the radar setup during BAECC, long-term snow observations were made by a National Aeronautics and Space Administration (NASA) Particle Imaging Package (PIP; Newman et al., 2009; Tiira et al., 2016; von Lerber et al., 2017).
2.1 2DVD and vertically pointing radars
The Atmospheric Radiation Measurement 2DVD (ARM 2DVD) used in this study is the new generation of the one described in Kruger and Krajewski (2002). It relies on two cameras and two light sources placed in orthogonal directions and records image projections of raindrops as they fall cross the cameras' field of view. The 2DVD is often used for recording the size distributions, fall velocities and shapes of raindrops. Based on this information, the rain rate and reflectivity at a given radar frequency can be derived.
The X- and Ka-band scanning ARM cloud radar (X/Ka-SACR) and W-band ARM cloud radar (MWACR) have the range gate spacing of 25, 25 and 30 m, respectively (Kollias et al., 2014; Kneifel et al., 2015; Falconi et al., 2018). The original time resolution of 2 s was averaged to 10 s for these radars. The half-power beam widths of X-SACR, Ka-SACR and MWACR are 1.27, 0.33 and 0.38∘, respectively. X- and Ka-SACR are dual-polarization radar systems installed on the same pedestal, recording the co-polar (e.g., ρhv, Zdr) and cross-polar (e.g., cross-polar correlation coefficient and linear depolarization ratio, LDR) measurements, respectively. MWACR had a small antenna pointing error of 0.5 to 1∘, which may lead to significant error in the vertical Doppler velocity but which does not affect reflectivity measurements.
To mitigate the potential attenuation from wet radome and raindrops, the simulated X-band radar reflectivity from 2DVD data was used to match the measured X-band reflectivity at 500 m where the near-field effect is minimized (Sekelsky, 2002; Falconi et al., 2018). As the Ka-band reflectivity can be significantly affected by the attenuation from the ML, rain and a wet radome (Li and Moisseev, 2019), the relative calibration was made at precipitation top where the Rayleigh assumption can be applied at Ka- and X-bands. During BAECC, a radiosonde was launched four times per day, out of which the temporally closest one was used as input to the millimeter-wavelength propagation model (Liebe, 1985) to correct for the gaseous attenuation at all radar frequencies.
2.2 Dual-polarization weather radar
The FMI C-band dual-polarization weather radar located in Ikaalinen, 64 km west from the Hyytiälä station, operates in the simultaneous transmission and receiving mode (Doviak et al., 2000). This radar performs RHI scans over the measurement site every 15 min. The range and azimuth resolutions are 500 m and 1∘, respectively. The dual-polarization measurements used in this study are Zdr, which was calibrated during light rainfalls (Bringi and Chandrasekar, 2001; Li et al., 2018). For data analysis, the Python ARM Radar Toolkit (Helmus and Collis, 2016) was used.
2.3 NASA particle imaging package
The PIP is an improved version of the Snowflake Video Imager (Newman et al., 2009), which uses a high frame rate camera operating at 380 frames per second to record the silhouettes of precipitation particles. The field of view of this camera is 48 mm×64 mm with a spatial resolution of 0.01 mm2. The focal plane of this camera is 1.3 m. Because the measurement volume is not enclosed, the wind-induced effects on the measurements are minimized (Newman et al., 2009). The data-processing software defines the size of each particle using the disk-equivalent diameter (Ddeq), which is the diameter of a disk with the same area of a particle shadow. Particle size distribution (PSD) and fall velocity are recorded as a function of Ddeq in the PIP software. Based on these PIP products, von Lerber et al. (2017) have derived particle mass and fall velocity as a function of the observed maximum particle diameter (Dmax,ob), which is obtained by fitting an ellipsoid model to each particle. Here and hereafter, D represents Dmax,ob. The snowfall measurements started as part of the BAECC field campaign were continued, and data collected during the experiment and an additional three winters were used in this study. The collected data were processed using the method by von Lerber et al. (2017).
3.1 Detection of ML boundaries
The height where melting starts ranges from the surface to several kilometers above, mainly depending on the temperature profiles. Thus, prior to addressing the general characteristics of ML, it is important to detect ML boundaries. Fabry and Zawadzki (1995) have employed the gradient of reflectivity to determine the ML boundaries using single-polarization X-band radar measurements. The vertically pointing X- and Ka-band radars used in this study provide dual-polarization observations, i.e., ρhv and LDR, respectively. These observations supply additional information to estimate the ML boundaries (Giangrande et al., 2008). However, care should be taken in how this information is used. Wolfensberger et al. (2016) have suggested that the use of ρhv could underestimate the ML top as the significant drop in ρhv may not happen until a significant amount of ice has already melted. To mitigate this issue, we determined the upper boundary of ML by finding the local minimum of the X-band reflectivity gradient around the ρhv-detected ML top, which is similar to Wolfensberger et al. (2016). The validity of utilizing the radar reflectivity in determining the ML top is further confirmed in our recent study (Li and Moisseev, 2020). The ML bottom was determined in a similar way to derive the radar reflectivity at the melting bottom. Note that cases in which precipitation fall streaks are significantly slanted, as shown in Fabry and Zawadzki (1995), were excluded.
3.2 Diagnosing snowflake rime mass fraction
The rime mass fraction (FR), defined as the ratio of accreted ice mass by riming to the total snowflake mass, has been used to quantify the riming extent in ice microphysical schemes (Morrison and Milbrandt, 2015) and in observational studies (e.g., Moisseev et al., 2017; Li et al., 2018). The rime mass fraction can be defined as
where Dmax and Dmin are maximum and minimum particle sizes, respectively, mob(D) and mur(D) are masses of observed and unrimed snowflakes as a function of D, respectively, and N(D) is the PSD. In this study, FR was computed using ground-based observations of PSD and snowflake masses retrieved from PIP observations, as described in von Lerber et al. (2017). The masses of unrimed ice particles were derived assuming the following. Firstly, unrimed snowflakes were present in PIP observations. Secondly, the ice particles belonging to the lightest 5 % are representative of unrimed snowflakes. Following these assumptions, the mass of unrimed snowflakes can be expressed as mur(D)=0.0053D2.05. This relation is similar to the one derived from aircraft measurements (Heymsfield et al., 2004). A further discussion on the definition of mur(D) is found in Moisseev et al. (2017) and Li et al. (2018).
Mason et al. (2018) have shown that the extent of riming can be retrieved using radar-measured DWR (Matrosov, 1998; Hogan et al., 2000) and mean Doppler velocity (V). If the radar reflectivity is expressed in decibels (dB), then the DWR can be written as
where and are observed radar reflectivities at the wavelengths of λ1 and λ2, respectively. Zλ can be expressed as
where is the dielectric constant of liquid water and is the backscattering coefficient of snow particles at a given wavelength. In X-SACR, Ka-SACR and MWACR data files, is set to 0.93, 0.88 and 0.70, respectively. The values of σb,λ were taken from the single-scattering databases (Leinonen and Moisseev, 2015; Leinonen and Szyrmer, 2015; Tyynelä and von Lerber, 2019). These three datasets were combined into a single lookup table of ice particle scattering properties defined as a function of maximum diameter and mass. For a given D and mob, the backscattering cross section was estimated using linear interpolation in the log–log space. The mean Doppler velocity can be derived in the same way:
where v(D) is the fall velocity of snowflakes which was used to derive m(D) (von Lerber et al., 2017). To minimize the impact of varying air density (ρair), Vλ was adjusted to the air condition of 1000 hPa and 0 ∘C (air density ρair,0) with a factor of (Heymsfield et al., 2007). ρair was derived from the temperature and relative humidity obtained from the temporally closest sounding.
Dias Neto et al. (2019) have shown that the size growth of snowflakes close to the ML is accelerated due to the enhanced aggregation. Therefore, relatively large aggregates are prevalent snow types close to the ML and are better represented by DWR(X, Ka) than DWR(Ka, W) (see the comparison by Barrett et al., 2019). The use of a lower radar frequency (X- and Ka-bands) avoids estimating the non-neglectable W-band attenuation caused by ML, as well as supercooled liquid water (Li and Moisseev, 2019). Therefore, the potential link between FR and simulated Doppler radar measurements at X- and Ka-bands was accessed with the utilization of in situ snowfall observations from BAECC to the winters of 2014–2018.
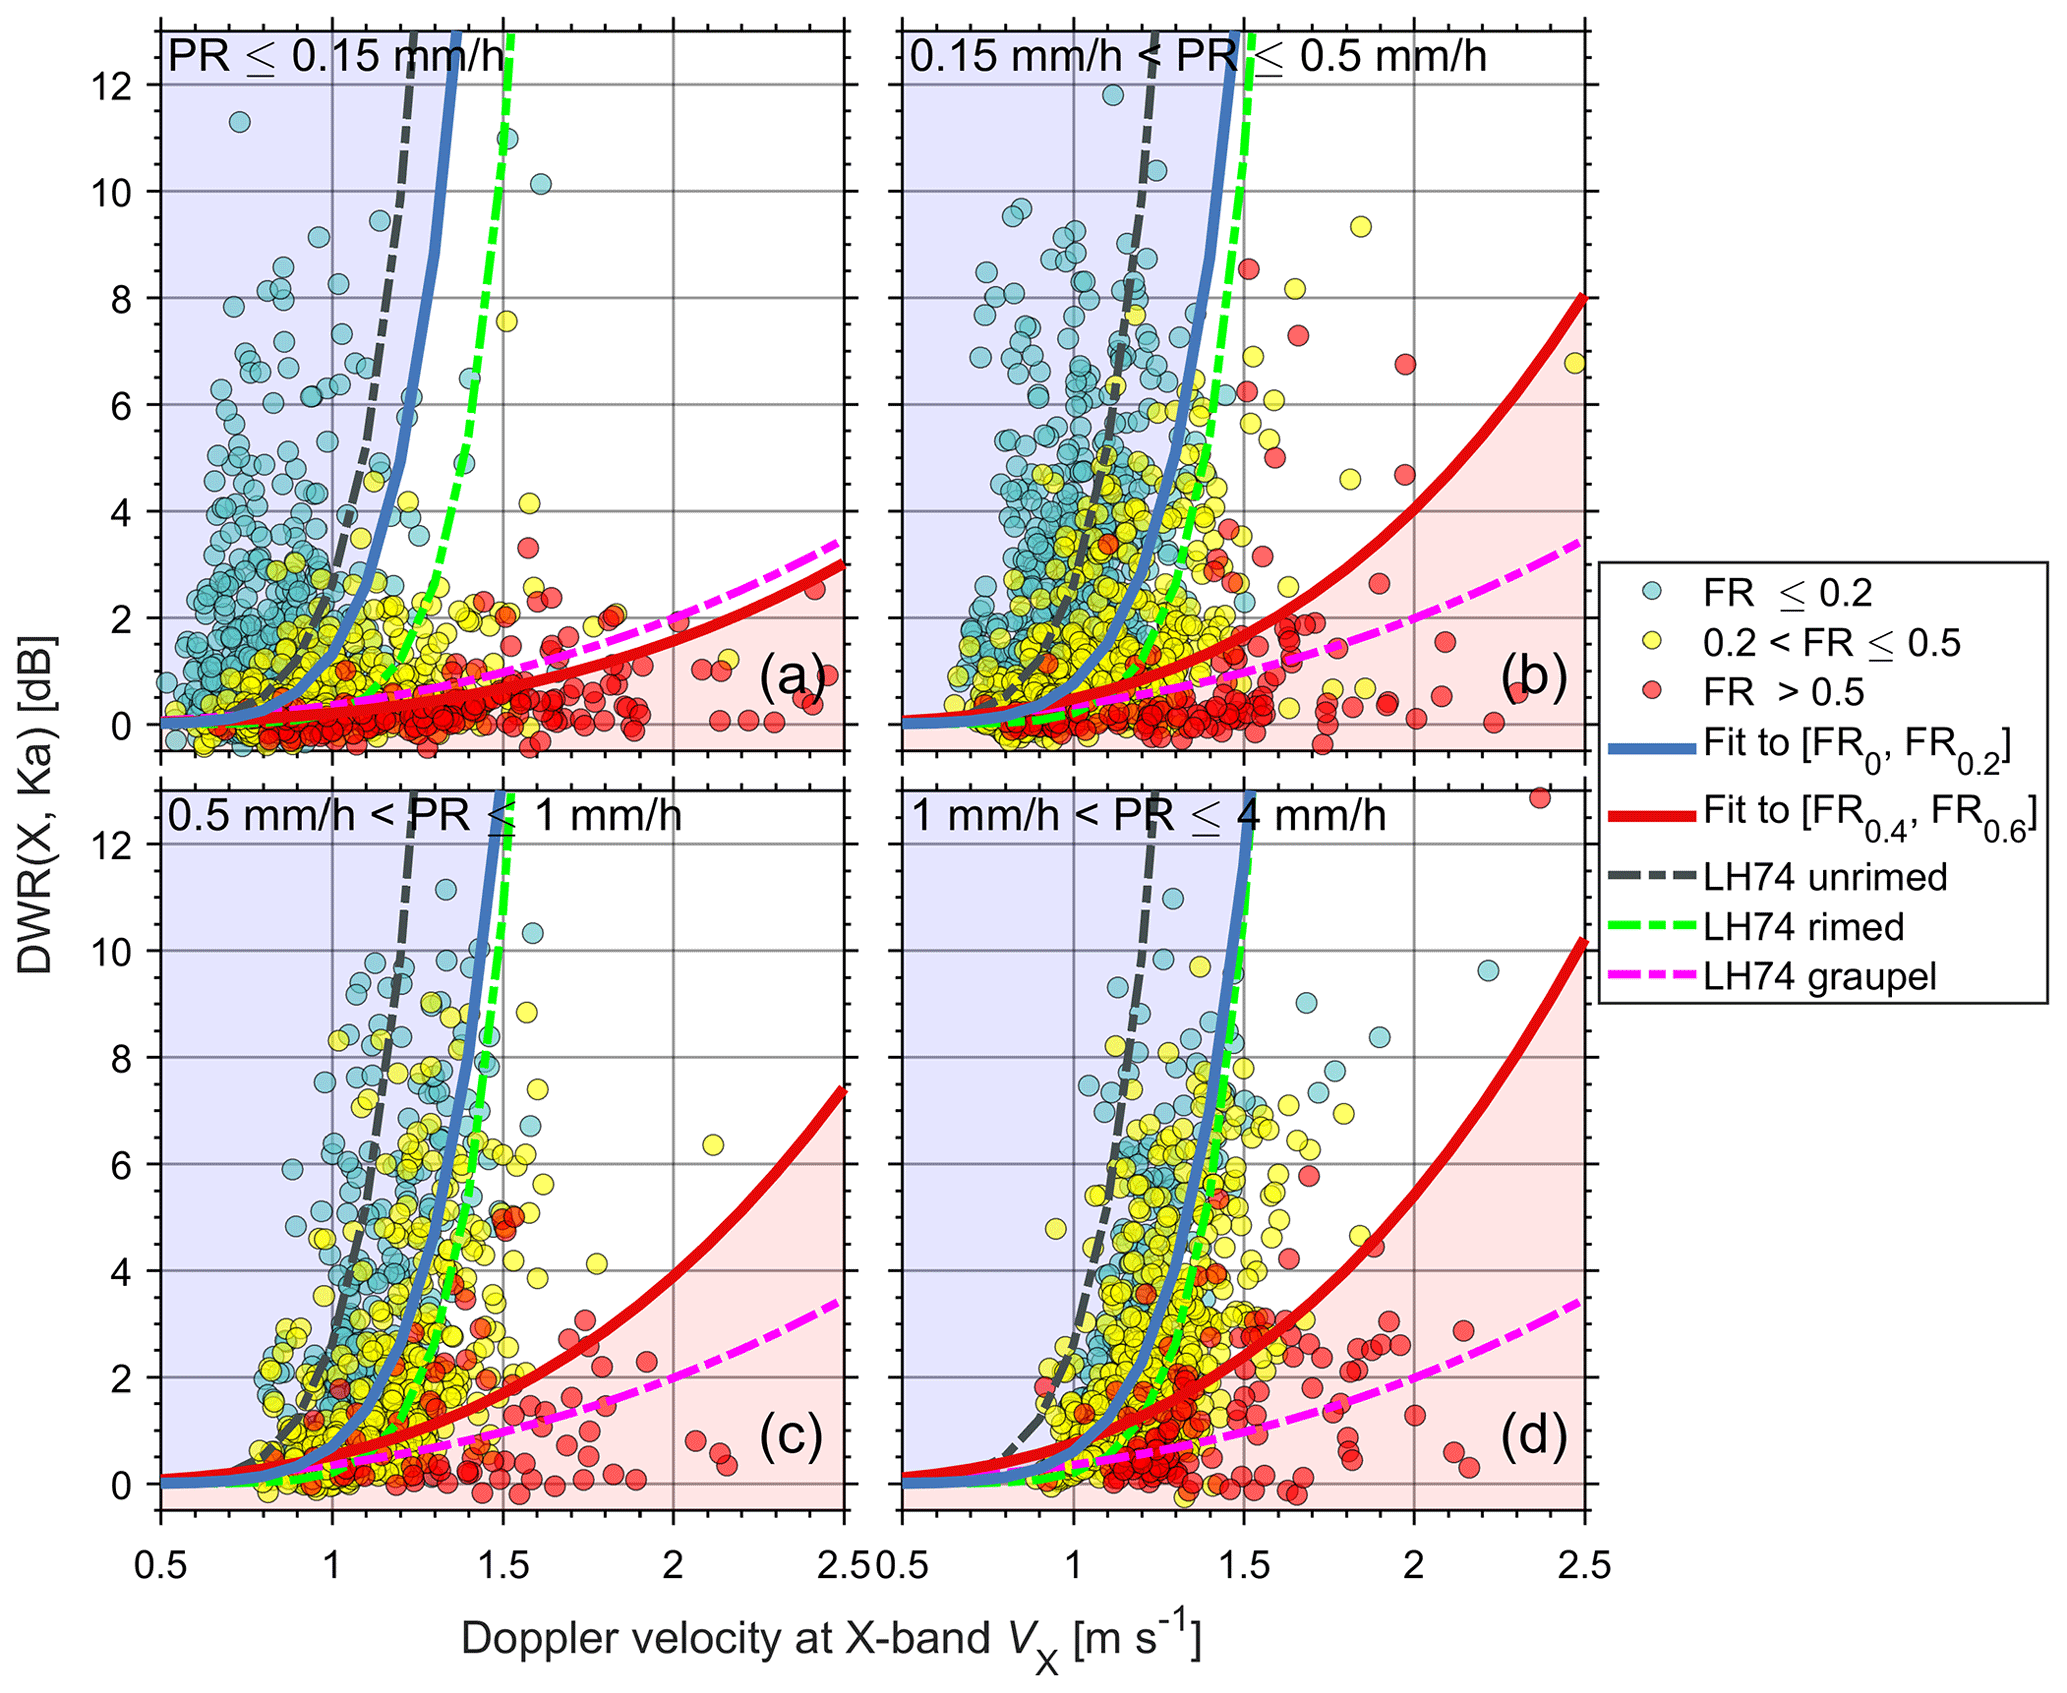
Figure 1Scatter plot of DWR(X, Ka) versus VX (1000 hPa and 0 ∘C) colored with FR. Mass–size and velocity–size relations from Locatelli and Hobbs (1974) are adopted for reference (dashed lines). Observed mass–size and velocity–size relations are derived using the approach developed by von Lerber et al. (2017), and the particle backscattering coefficient σb,λ is adopted from Leinonen and Moisseev (2015) and Leinonen and Szyrmer (2015). The solid blue and red curves separate unrimed (light blue shading), transitional (no shading) and rimed snow (light red shading) in our classification scheme.
The dependence of DWR(X, Ka) and VX on FR can be computed using Eqs. (1), (2) and (4). For comparison, the mob−D and v−D relations of aggregates of unrimed radiating assemblages, side planes, bullets, and columns (LH74 unrimed), aggregates of densely rimed radiating assemblages of dendrites (LH74 rimed), and lump graupel (LH74 graupel) presented in Locatelli and Hobbs (1974) were used. To compute the DWR(X, Ka) and VX using relations from the literature, we assumed that N(D) can be parameterized as
where the intercept parameter N0 is canceled out while computing DWR and VX, so the radar variables depend on Λ, which controls the average size of ice particles in N(D). We have varied Λ−1 between 0 and 11 mm to mimic different snowfall conditions, which is similar to what was done in Leinonen and Szyrmer (2015). Table 1 summaries the fitted expressions of DWR(X, Ka) = for these three particle types. Since snow microphysics and the corresponding radar measurements can significantly change with precipitation intensity (Moisseev et al., 2017), the computed values were separated into four subgroups according to precipitation rate (PR).
Table 1Fitted parameters for DWR(X, Ka) = . Aggregates of unrimed radiating assemblages, side planes, bullets, and columns (LH74 unrimed), aggregates of densely rimed radiating assemblages of dendrites (LH74 rimed), and lump graupel (LH74 graupel) in Locatelli and Hobbs (1974) are shown for reference. The last column shows the root mean square error (RMSE) of fitting. The confidence interval is marked by “\” when the parameter is manually fixed.

Simulations of DWR(X, Ka)-VX for four groups of precipitation rate are presented in Fig. 1. Most cases with FR ≤ 0.2 are centered around the curve of LH74 unrimed, whose velocity–diameter relation is similar to low-density snowflakes (Tiira et al., 2016). It seems that riming happens more frequently in heavier precipitation. In contrast, far fewer unrimed cases are present in heavier precipitation (Fig. 1c and d). Heavily rimed snowflakes (FR > 0.5; red dots) are characterized by low DWR(X, Ka) and high VX, contrasting with the unrimed/lightly rimed cases (blue dots). Specifically, snowflakes with large sizes and low velocities usually are rather slightly rimed (FR ≤ 0.2). For the cases where FR exceeds 0.5, most DWR(X, Ka) values are below 3 dB, indicating that heavily rimed particles are usually associated with small snowflakes. Inspired by this distinct feature, we have fitted the DWR(X, Ka) = relations for cases with FR ≤ 0.2 and 0.4 ≤ FR ≤ 0.6 (shown in Table 1), which separate the observations into three types: unrimed, transitional and rimed snow. For the sake of comparison, the power b for unrimed snow was adopted from the fit for LH74 unrimed. In this study, these fitted relations were employed for classifying unrimed and rimed snow. The presence of supercooled liquid water does not significantly affect X-band reflectivity but may lead to appreciable attenuation at Ka-band which translates to enhanced DWR(X, Ka) after the relative calibration at precipitation top. For the liquid water path of 500 g m−2, the estimated Ka-band attenuation is in the order of 1 dB (Kneifel et al., 2015). Therefore, cases with DWR(X, Ka) < 1 dB were rejected when identifying unrimed snow.
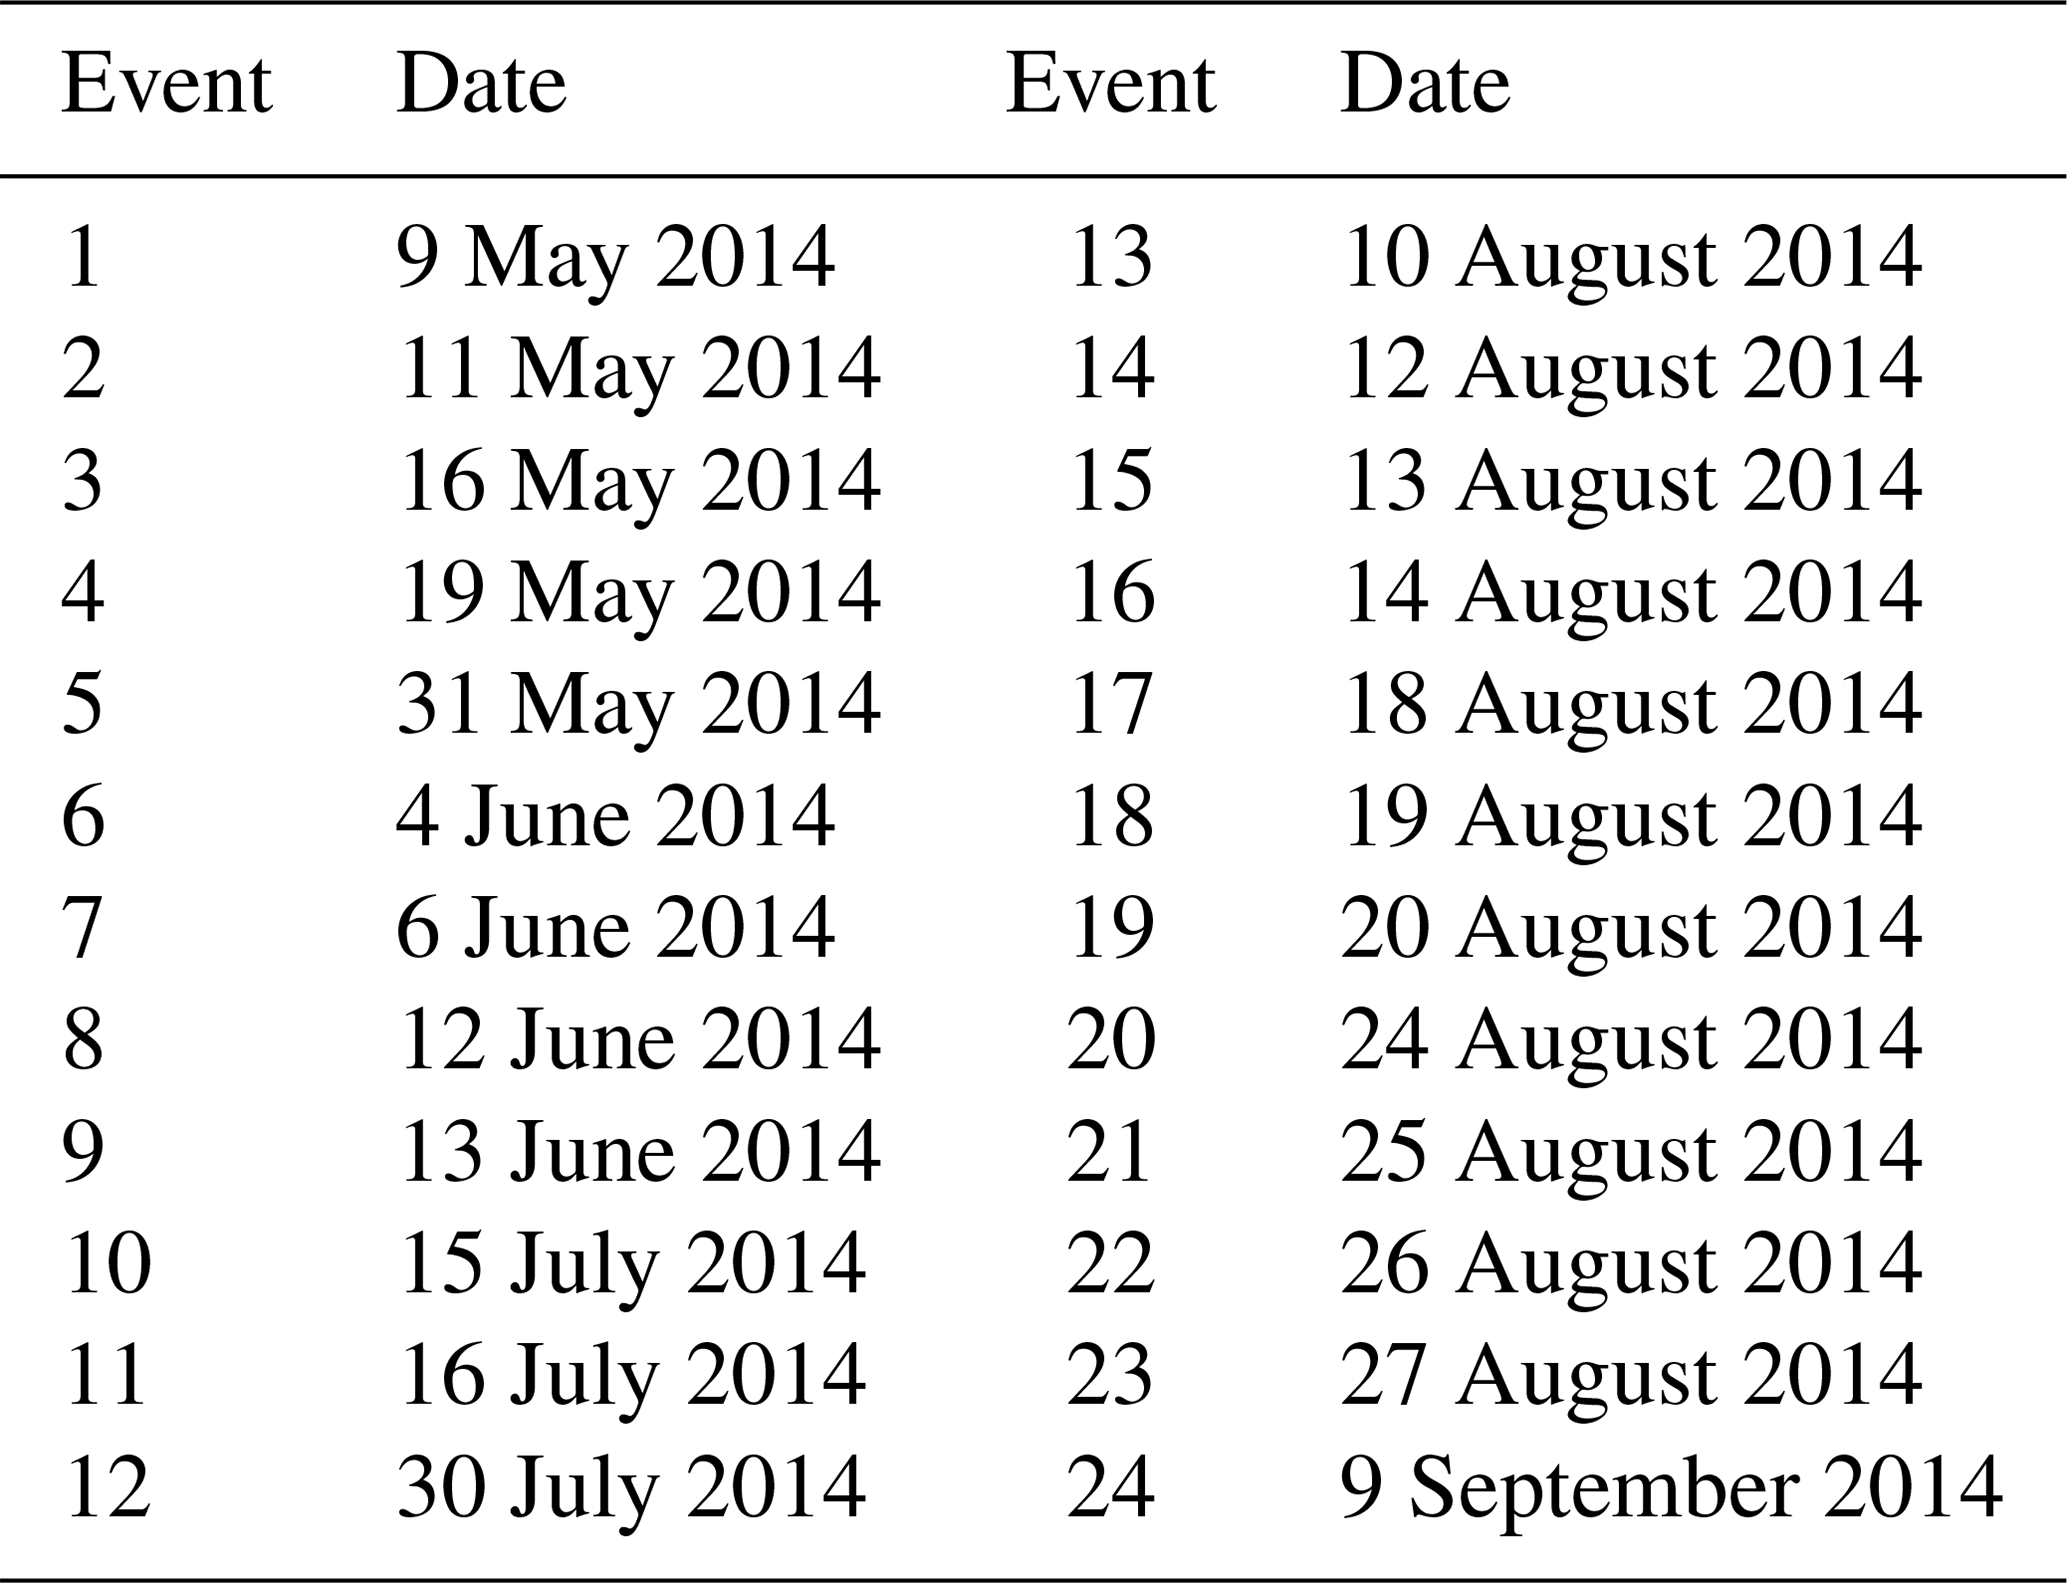
To study how ML properties depend on the precipitation intensity, snowflake riming fraction and PSD, all rainfall cases observed during the BAECC experiment were analyzed. Given the need for coinciding multifrequency vertically pointing radar measurements and the radar scans performed during the experiment, we have identified 4147 vertical profiles of observations in 24 stratiform rainfall events corresponding to about 11.5 h. Table 2 summaries the dates used in this study (quicklooks are available at https://doi.org/10.5281/zenodo.3979103). Due to the periodic changes in radar scans, the multifrequency radar measurements recorded in the vertically pointing mode were available only in some inconsecutive time periods for an event. During the analysis, the mean radar Doppler velocity was scaled to the air density at 1000 hPa and 0 ∘C, as previously described. It should be noted that the RHI scans by the FMI C-band weather radar were performed every 15 min. Therefore, the profiles of specific differential phase and differential reflectivity are recorded much less frequently than the vertically pointing radar observations. The RHI observations are nonetheless presented here in order to link the features observed in this study to the previous reports (Giangrande et al., 2016; Kumjian et al., 2016; Li et al., 2018; Vogel and Fabry, 2018). Figure 2 shows the flow chart of the data process in this study.
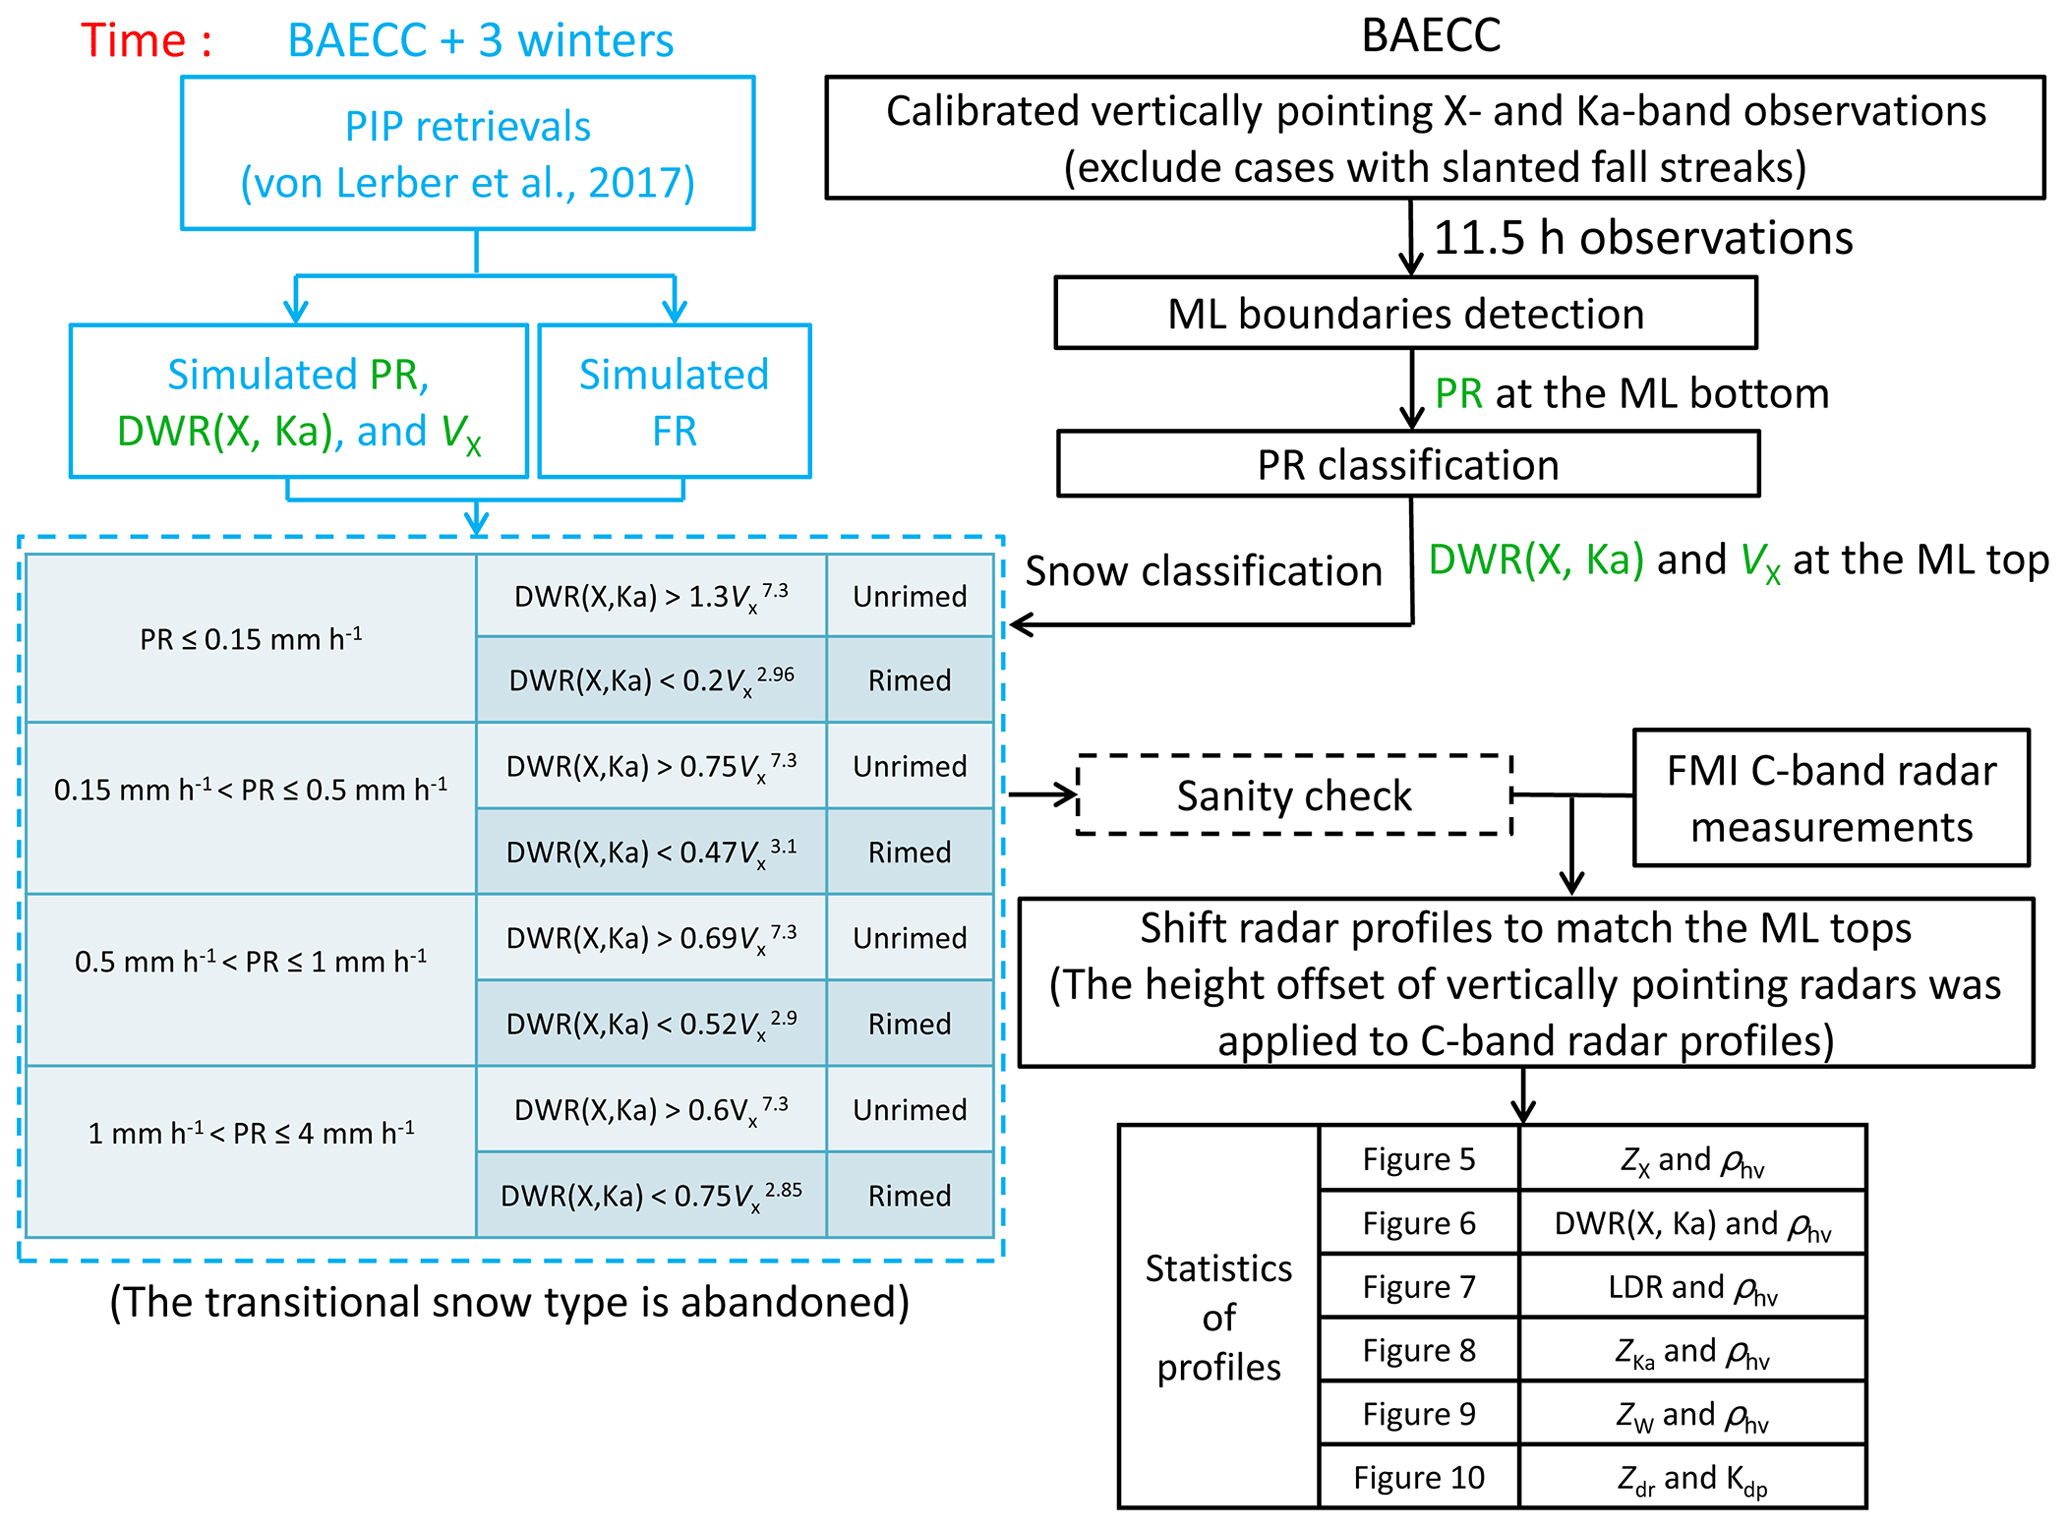
Figure 2Flow chart of the data process in this study. The snow classification part as discussed in Sect. 3.1 is in light blue. Variables used in snow classification are in green. Radar observations during BAECC are in black. The sanity check in the next section is represented by the dashed black diagram.
4.1 Sanity check of the snow classification
At the first step of our data analysis, the classification of unrimed and rimed snow using DWR(X, Ka)-VX observations at the ML top, proposed in the previous section, was evaluated against previous studies. As shown in Fig. 3, both DWR(X, Ka) and VX tend to increase as the precipitation intensifies. Most cases of rimed snow fall in the region of DWR(X, Ka) < 4 dB and VX being higher than for unrimed snow. The VX of unrimed snow rarely exceeds 1.5 m s−1. Those outliers of rimed snow in Fig. 1a may be attributed to the local vertical air motions, which contaminate the measured mean Doppler velocity. It should be noted that the snow observations in Fig. 1 are limited to PR ≤ 4 mm h−1; namely, the maximum radar reflectivity at the ML bottom (ZX,rain) is around 33 dBZ, as computed by using the localized Z–R relation (Leinonen et al., 2012b).
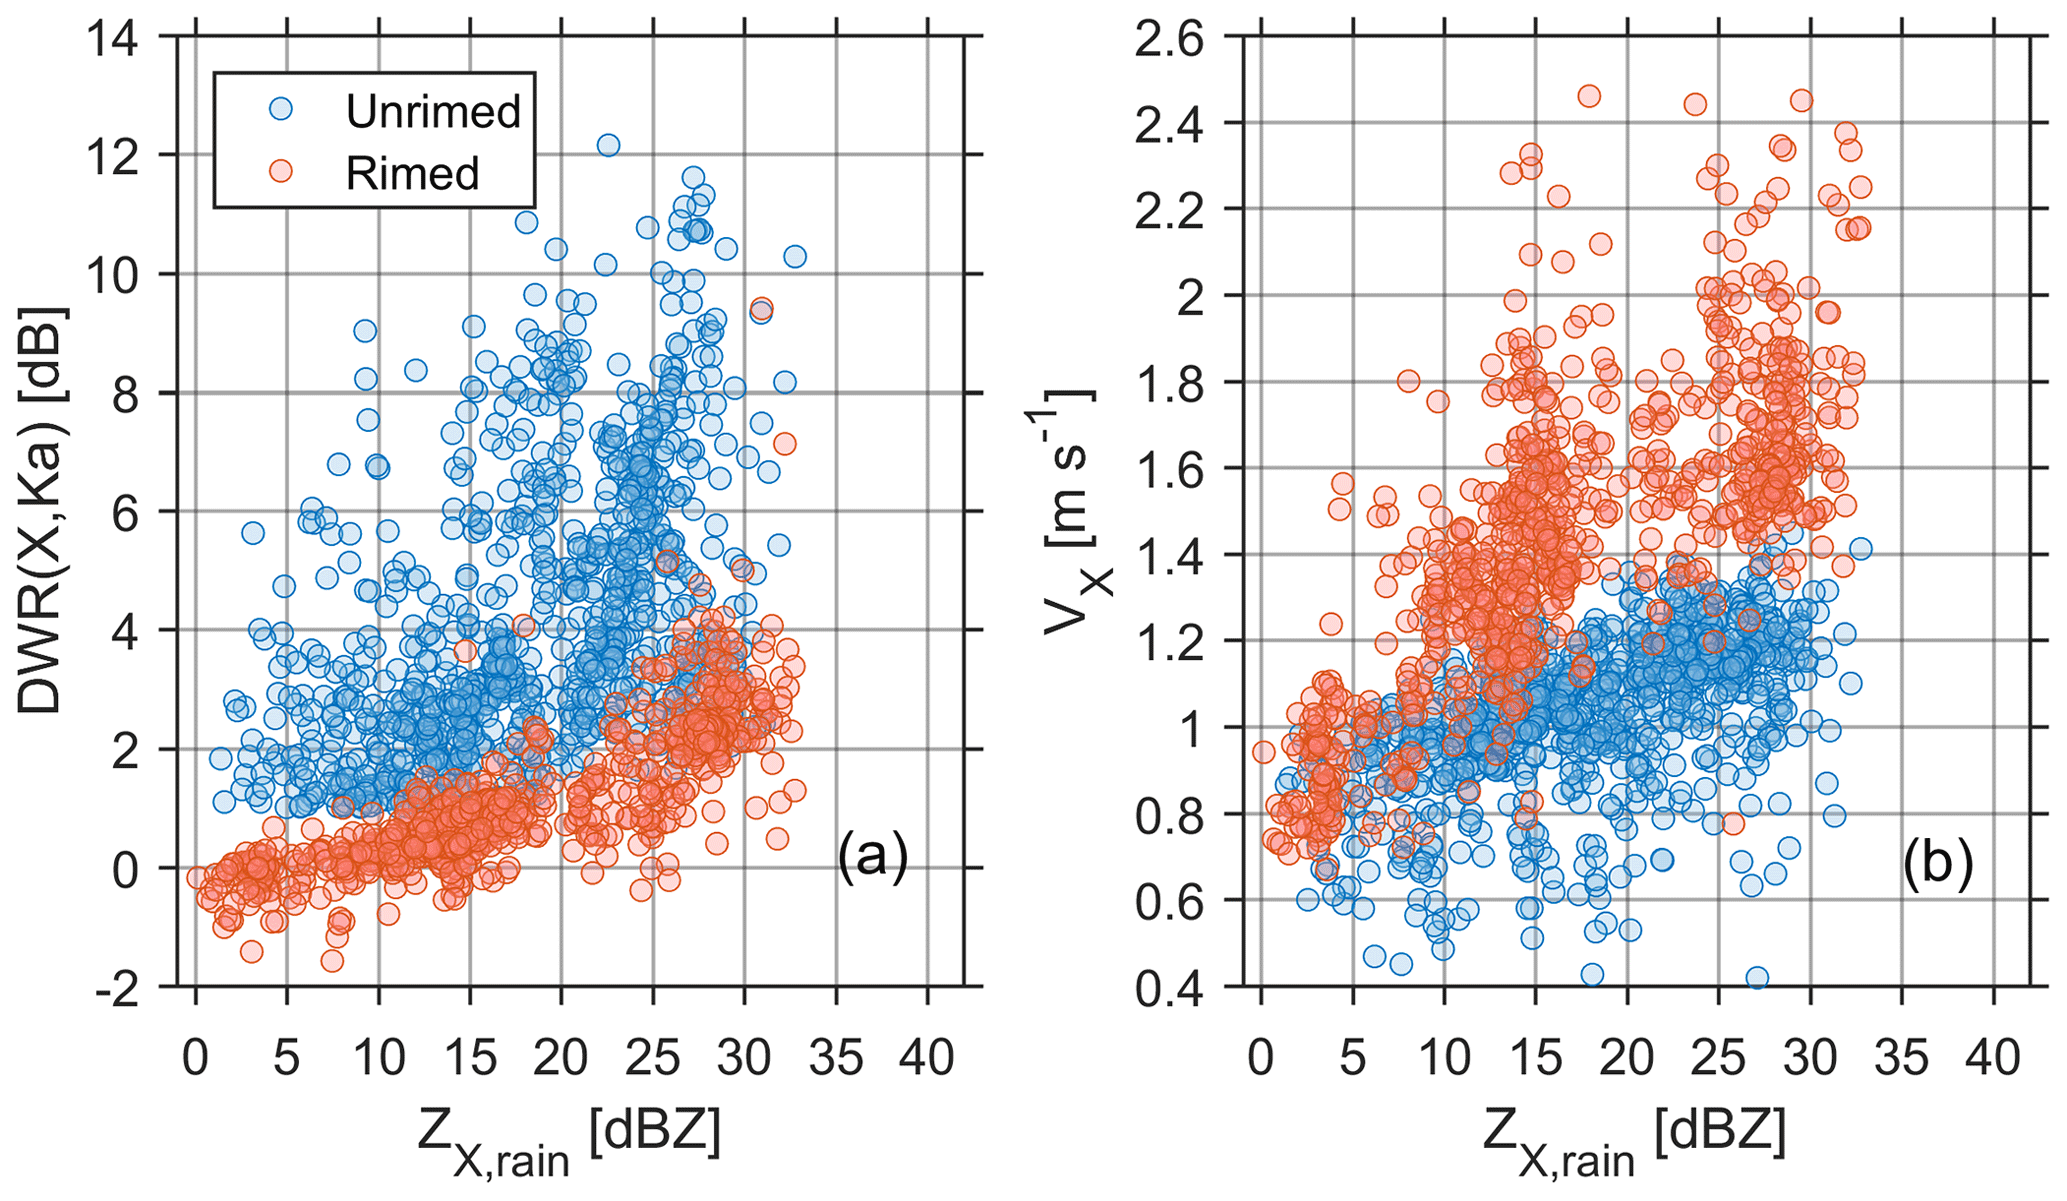
Figure 3Distribution of (a) DWR(X, Ka) and (b) VX above the ML as a function of ZX,rain. Note that no transitional snow type between unrimed and rimed is presented.
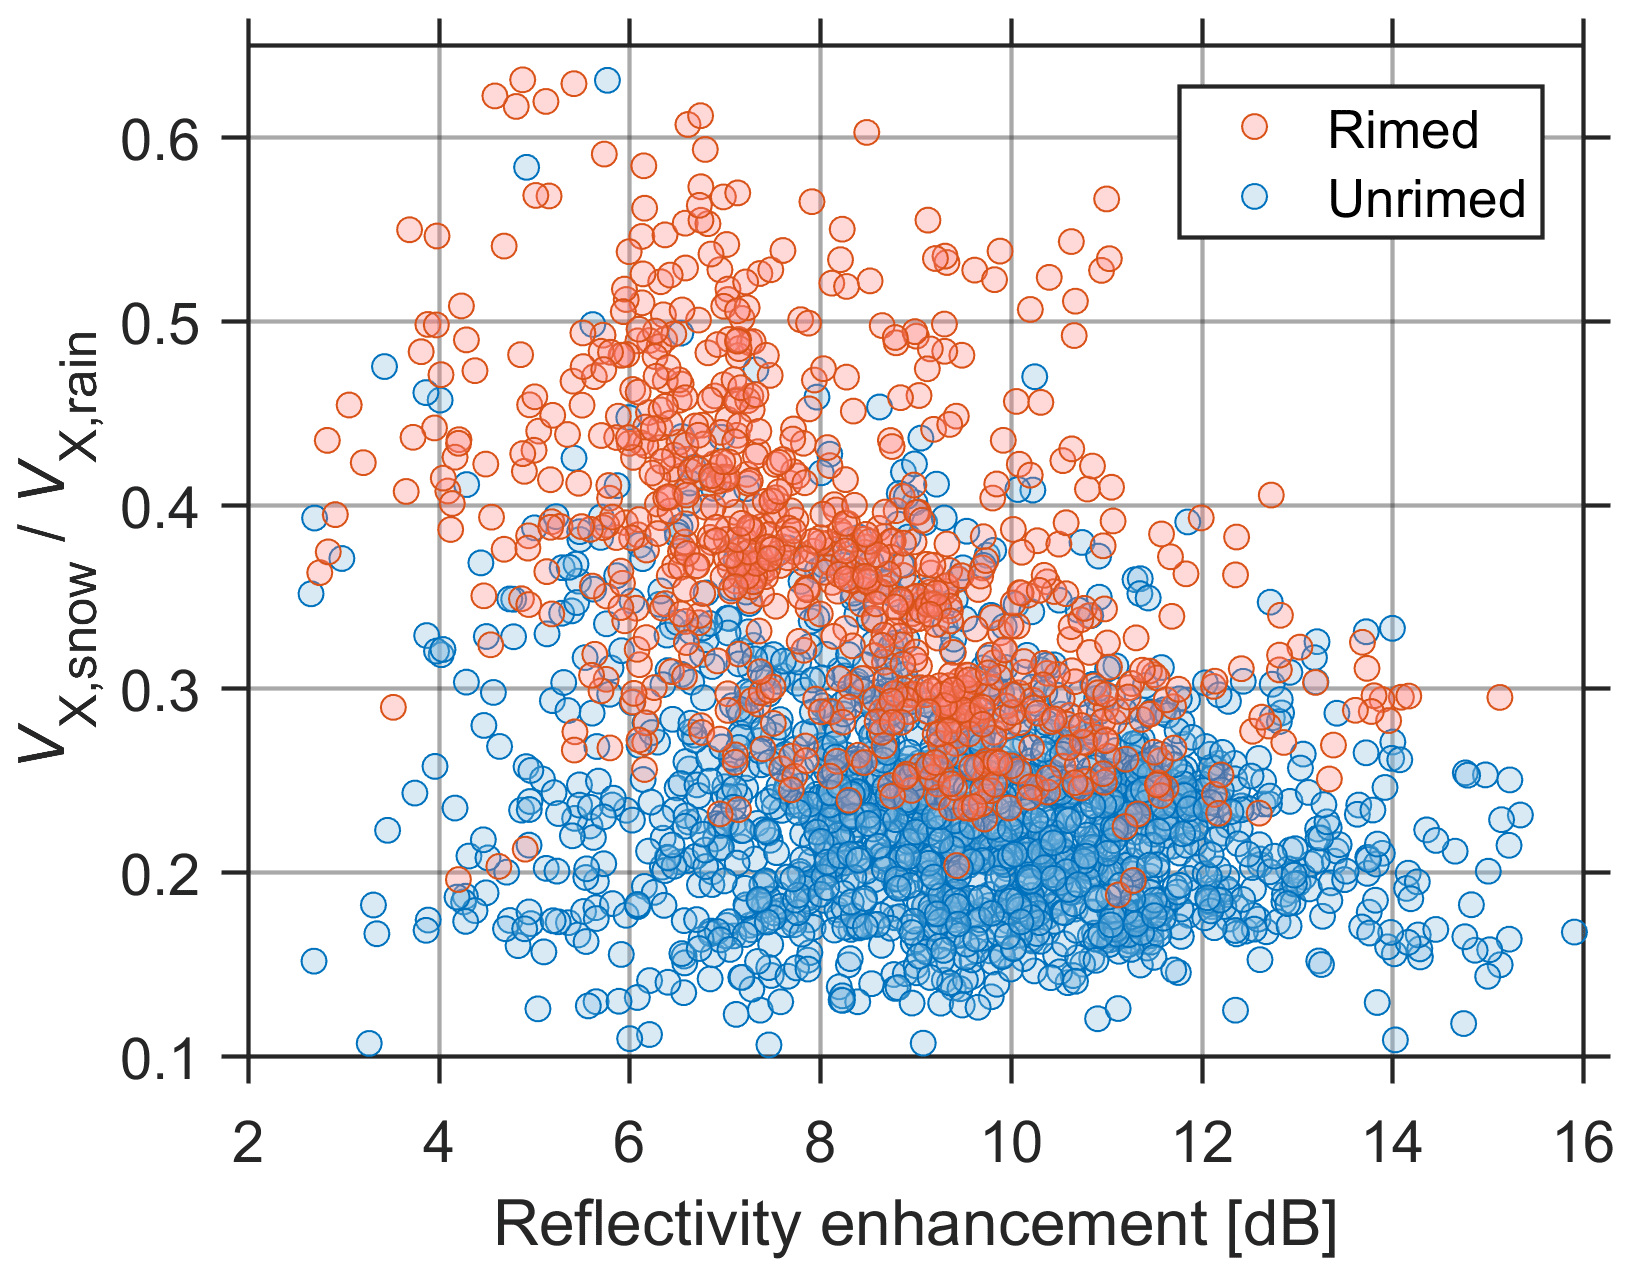
Figure 4Scatter plot of versus reflectivity enhancement in the ML. The reflectivity enhancement is defined as the difference between the reflectivity peak in the ML and the reflectivity in rain just below the ML.
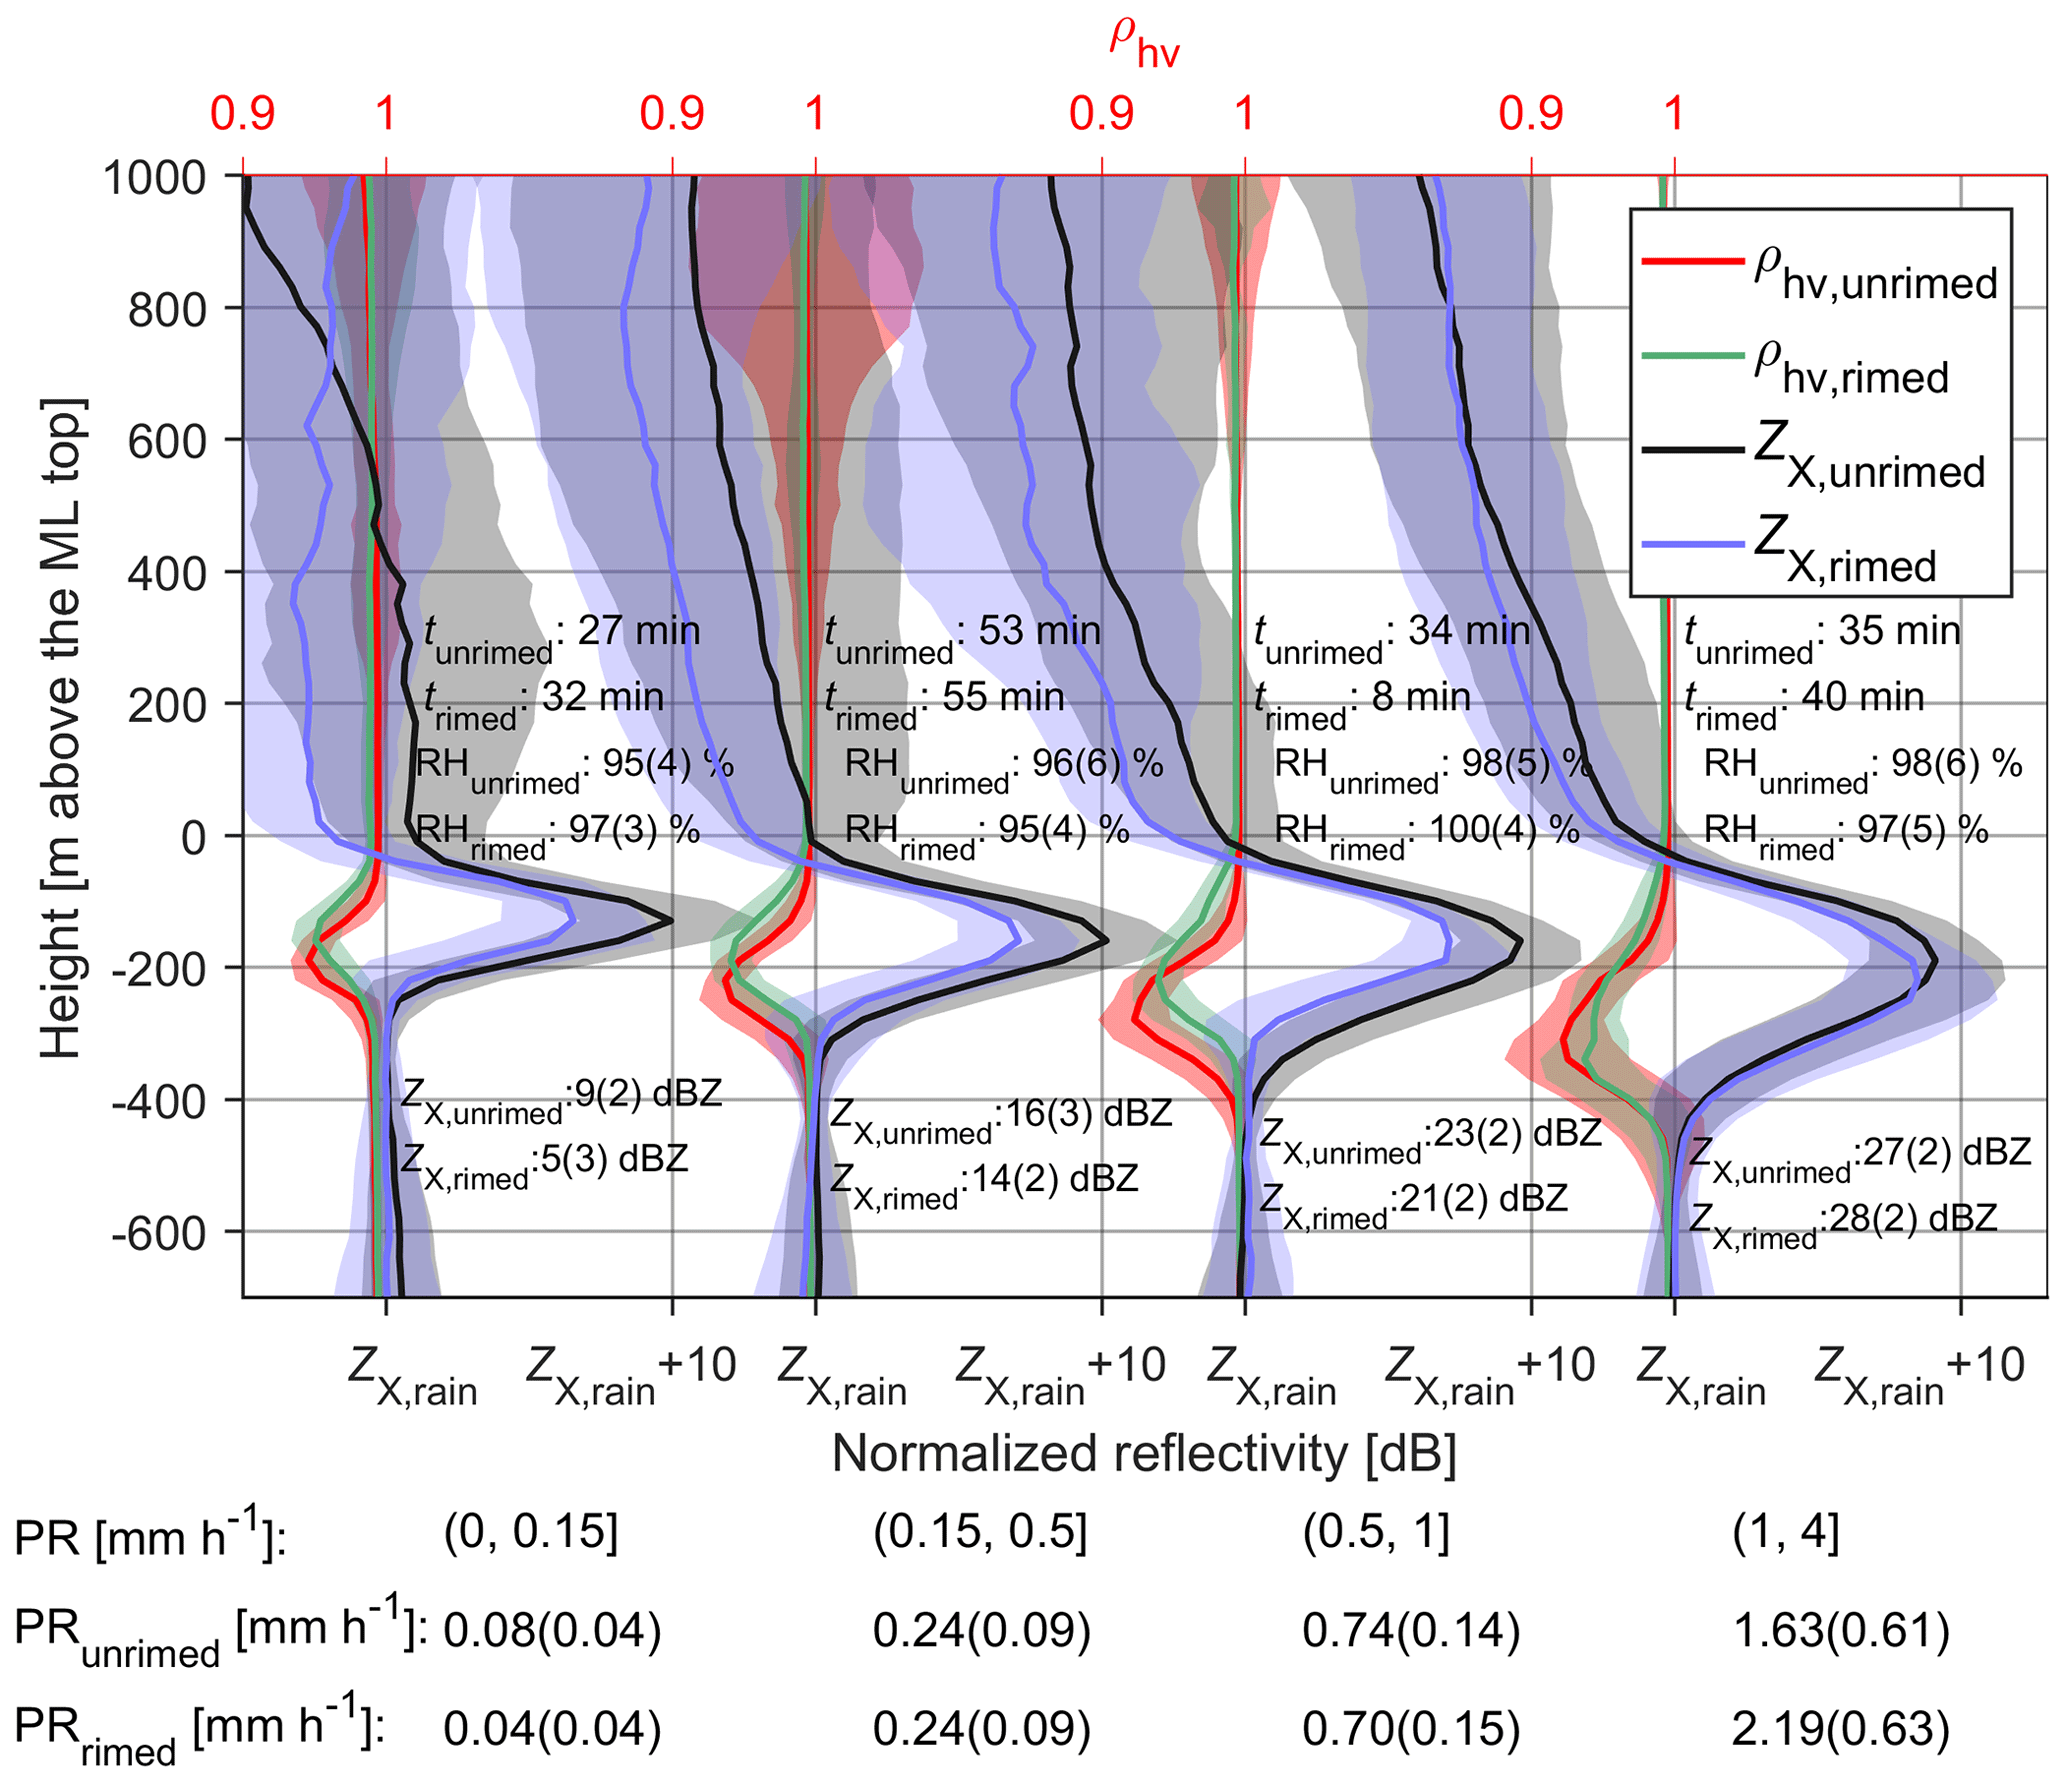
Figure 5Normalized X-band radar profiles grouped by PR. tunrimed and trimed indicate the total observing time in each group for unrimed and rimed cases, respectively. The median values of X-band reflectivity at the ML bottom for unrimed (ZX,unrimed) and rimed (ZX,rimed) cases are marked just below the ML bottom with the standard values in brackets. The median and standard deviations (in parentheses) of relative humidity (RH) at the ML top for unrimed (RHunrimed) and rimed (RHrimed) cases in each group are presented near the ML top. The median and standard deviations (in parentheses) of PR for unrimed (PRunrimed) and rimed (PRrimed) cases in each group are presented in the lower part. Shaded regions represent the standard derivation.
The reflectivity enhancement in the ML, which is defined as the difference between the ZX maximum in the ML and the ZX at the melting bottom (ZX,rain), was also studied. Zawadzki et al. (2005) have analyzed the UHF Doppler wind profiler observations in reflectivity enhancement space and found that the augmentation of rimed snowflake mass can increase and decrease reflectivity enhancement. As shown in Fig. 4, despite the scattered distribution of reflectivity enhancement, the majority of cases with high is dominated by rimed snow, while most unrimed cases are below . Such dependence of on riming is in line with the results in Zawadzki et al. (2005), indicating the reasonable snow classification employed in this study.
4.2 Vertical profiles of multifrequency radar measurements in the ML
To obtain a general idea of how the ML is modulated by riming and aggregation, statistics of vertically pointing radar observations were made. As the ML properties are modulated by precipitation intensity (Fabry and Zawadzki, 1995; Carlin and Ryzhkov, 2019), the observations were grouped by PR. For ease of comparison, the vertical axis is shifted such that the reference height is the ML top.
4.2.1 X-band reflectivity, ρhv and DWR(X, Ka)
Figure 5 shows the profiles of radar reflectivity and ρhv measured by X-SACR and grouped by PR. Note that to generalize the observations, the vertical axis is shifted such that the ML top is the reference height of 0 m, and each reflectivity profile was normalized by offsetting the difference between ZX,rain and the median value of ZX,rain in the corresponding PR group. The same procedure was made to ρhv and the following measurements. For most cases, the relative humidity (RH) around the ML top is above 95 % with no dependence on PR. Thus, the effect of dry air infiltration, e.g., decreasing reflectivity and ML thickness and descending dual-polarization measurements (Carlin and Ryzhkov, 2019), should be minimized. Considering the general aspects of Fig. 5, it is clear that the ML thickness and reflectivity peak increase with PR, which is in line with previous results (Fabry and Zawadzki, 1995; Wolfensberger et al., 2016; Trömel et al., 2019).
The ρhv and radar reflectivity have been used in identifying the bright band sagging (Kumjian et al., 2016; Ryzhkov et al., 2016; Xie et al., 2016). When PR is greater than 1 mm h−1, the level of ρhv minimum of rimed snow seems to be lower than the unrimed; however, the opposite holds when PR is less than or equal to 1 mm h−1, which seems controversial to the expectation that the bright band sagging is mainly caused by riming (Kumjian et al., 2016). In our observations, both ρhv dip and reflectivity peak descend with the increase in PR. Therefore, it appears that precipitation intensity is an important factor affecting the formation of the saggy bright band. This finding is in line with a recent simulation study (Carlin and Ryzhkov, 2019), which proposes that the saggy bright band can also be attributed to other factors, such as the aggregation process, the increased precipitation intensity and the sudden decrease in RH. For unrimed snow, the response of ρhv to the melting is obviously later than X-band reflectivity, which indicates that the utilization of ρhv for detecting the ML top should be applied with caution.
The reflectivity peak is smaller for rimed snow than unrimed for a given PR provided that the Rayleigh scattering is not violated. When PR is greater than 1 mm h−1, the reflectivity peaks of rimed and unrimed snow are closer, which can be explained by the non-Rayleigh scattering of very large aggregates at X-band, as discussed by Fabry and Zawadzki (1995). Another notable finding is that the ZX at the ML top for rimed snow is smaller than unrimed, which indicates that rimed snowflakes may have smaller sizes for a given PR. This is further confirmed in the DWR(X, Ka) profiles as shown in Fig. 6. From the aggregation region to the ML top, the DWR(X, Ka) of rimed snow is significantly smaller than unrimed snow. In particular, very weak DWR(X, Ka) for rimed snow could be identified just above the ML. This indicates that the aggregation process, the dominating factor of growing snow size close to the ML (Fabry and Zawadzki, 1995), can be heavily suppressed for rimed snow. Heymsfield et al. (2015) have reported the enhanced maximum particle size below the 0 ∘C isotherm using in situ measurements and attributed it to the continuing aggregation in the ML. Such continuing aggregation in conjunction with the changing scattering properties (the water coating) may be responsible for the continuing increase in DWR(X, Ka) in the ML.
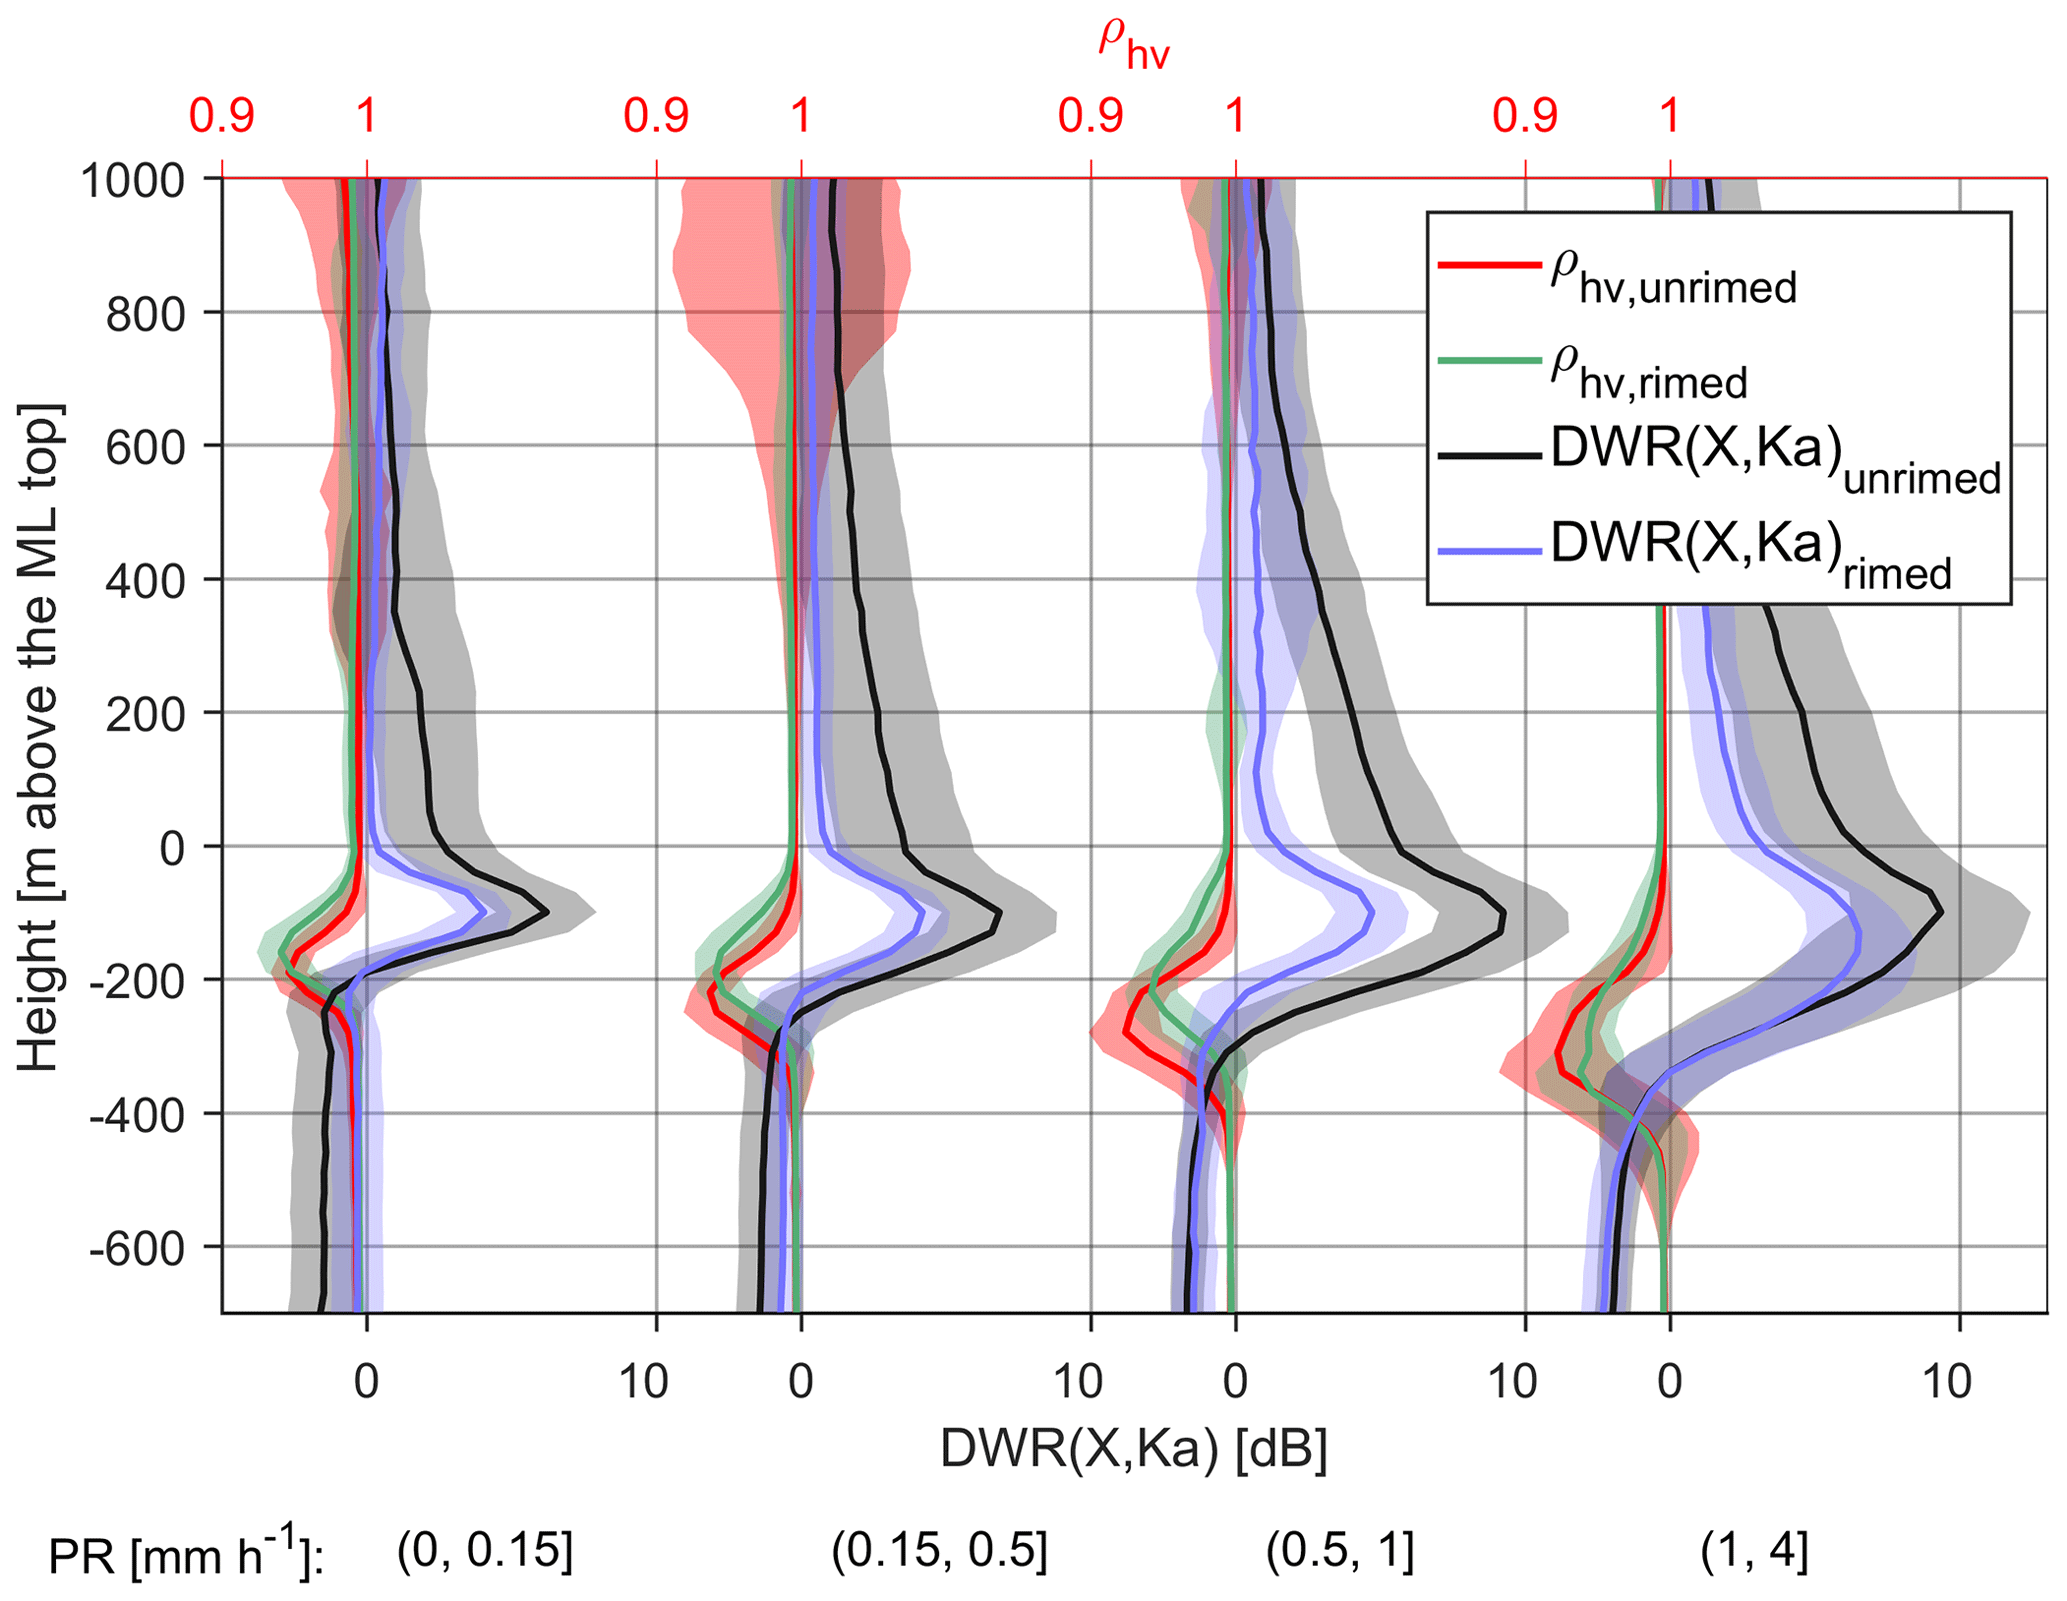
Figure 6Same as Fig. 5 but for DWR(X, Ka). Note that the radar calibration is made by matching the X- and Ka-band radar reflectivities at precipitation top.
Interestingly, the DWR(X, Ka) profile below the ML is higher for the rimed cases and progressively converges towards the unrimed profile as PR increases. For light precipitation, the rain drops are small enough to be Rayleigh scatterers at Ka-band; thus the difference of DWR(X, Ka) in rain between unrimed and rimed cases is rooted in the differences in attenuation. If the supercooled liquid water attenuation of rimed cases is more significant, the corresponding DWR(X, Ka) in rain would be smaller than the unrimed cases. However, the reverse is observed. von Lerber et al. (2014) have shown that the melting layer attenuation of rimed snowflakes is smaller than unrimed ones, which could possibly explain the larger DWR(X, Ka) of rimed cases in rain. With the increase in precipitation intensity, the DWR(X, Ka) of rimed cases in rain decreases towards the unrimed profile. This can be attributed to several factors, such as the enhanced liquid attenuation above the melting layer and the non-Rayleigh scattering of large raindrops at Ka-band. We hesitate to determine the role of non-Rayleigh scattering in rain since raindrops characterized by different non-Rayleigh scattering size regions can lead to opposite effects on DWR(X, Ka), as shown by Li and Moisseev (2019).
4.2.2 Ka-band LDR and reflectivity
LDR usually increases in the ML as melting increases the dielectric constant of nonspherical ice particles. Figure 7 shows the profiles of LDR (Ka-SACR) and ρhv (X-SACR). Both LDR peak and ρhv dip in rimed snow are lower than unrimed snow when PR is greater than 1 mm h−1, while the reverse is observed for lighter precipitation. Despite the rather good agreement between LDR and ρhv observations, it appears that LDR systematically reveals a lower ML bottom than ρhv, indicating that LDR can be suitable in discriminating between rain and melting snow (Illingworth and Thompson, 2011; Dias Neto et al., 2019). The smaller LDR peak for rimed snow is correlated with the smaller X-band reflectivity enhancement as shown in Fig. 5, which is consistent with Illingworth and Thompson (2011) and Sandford et al. (2017).
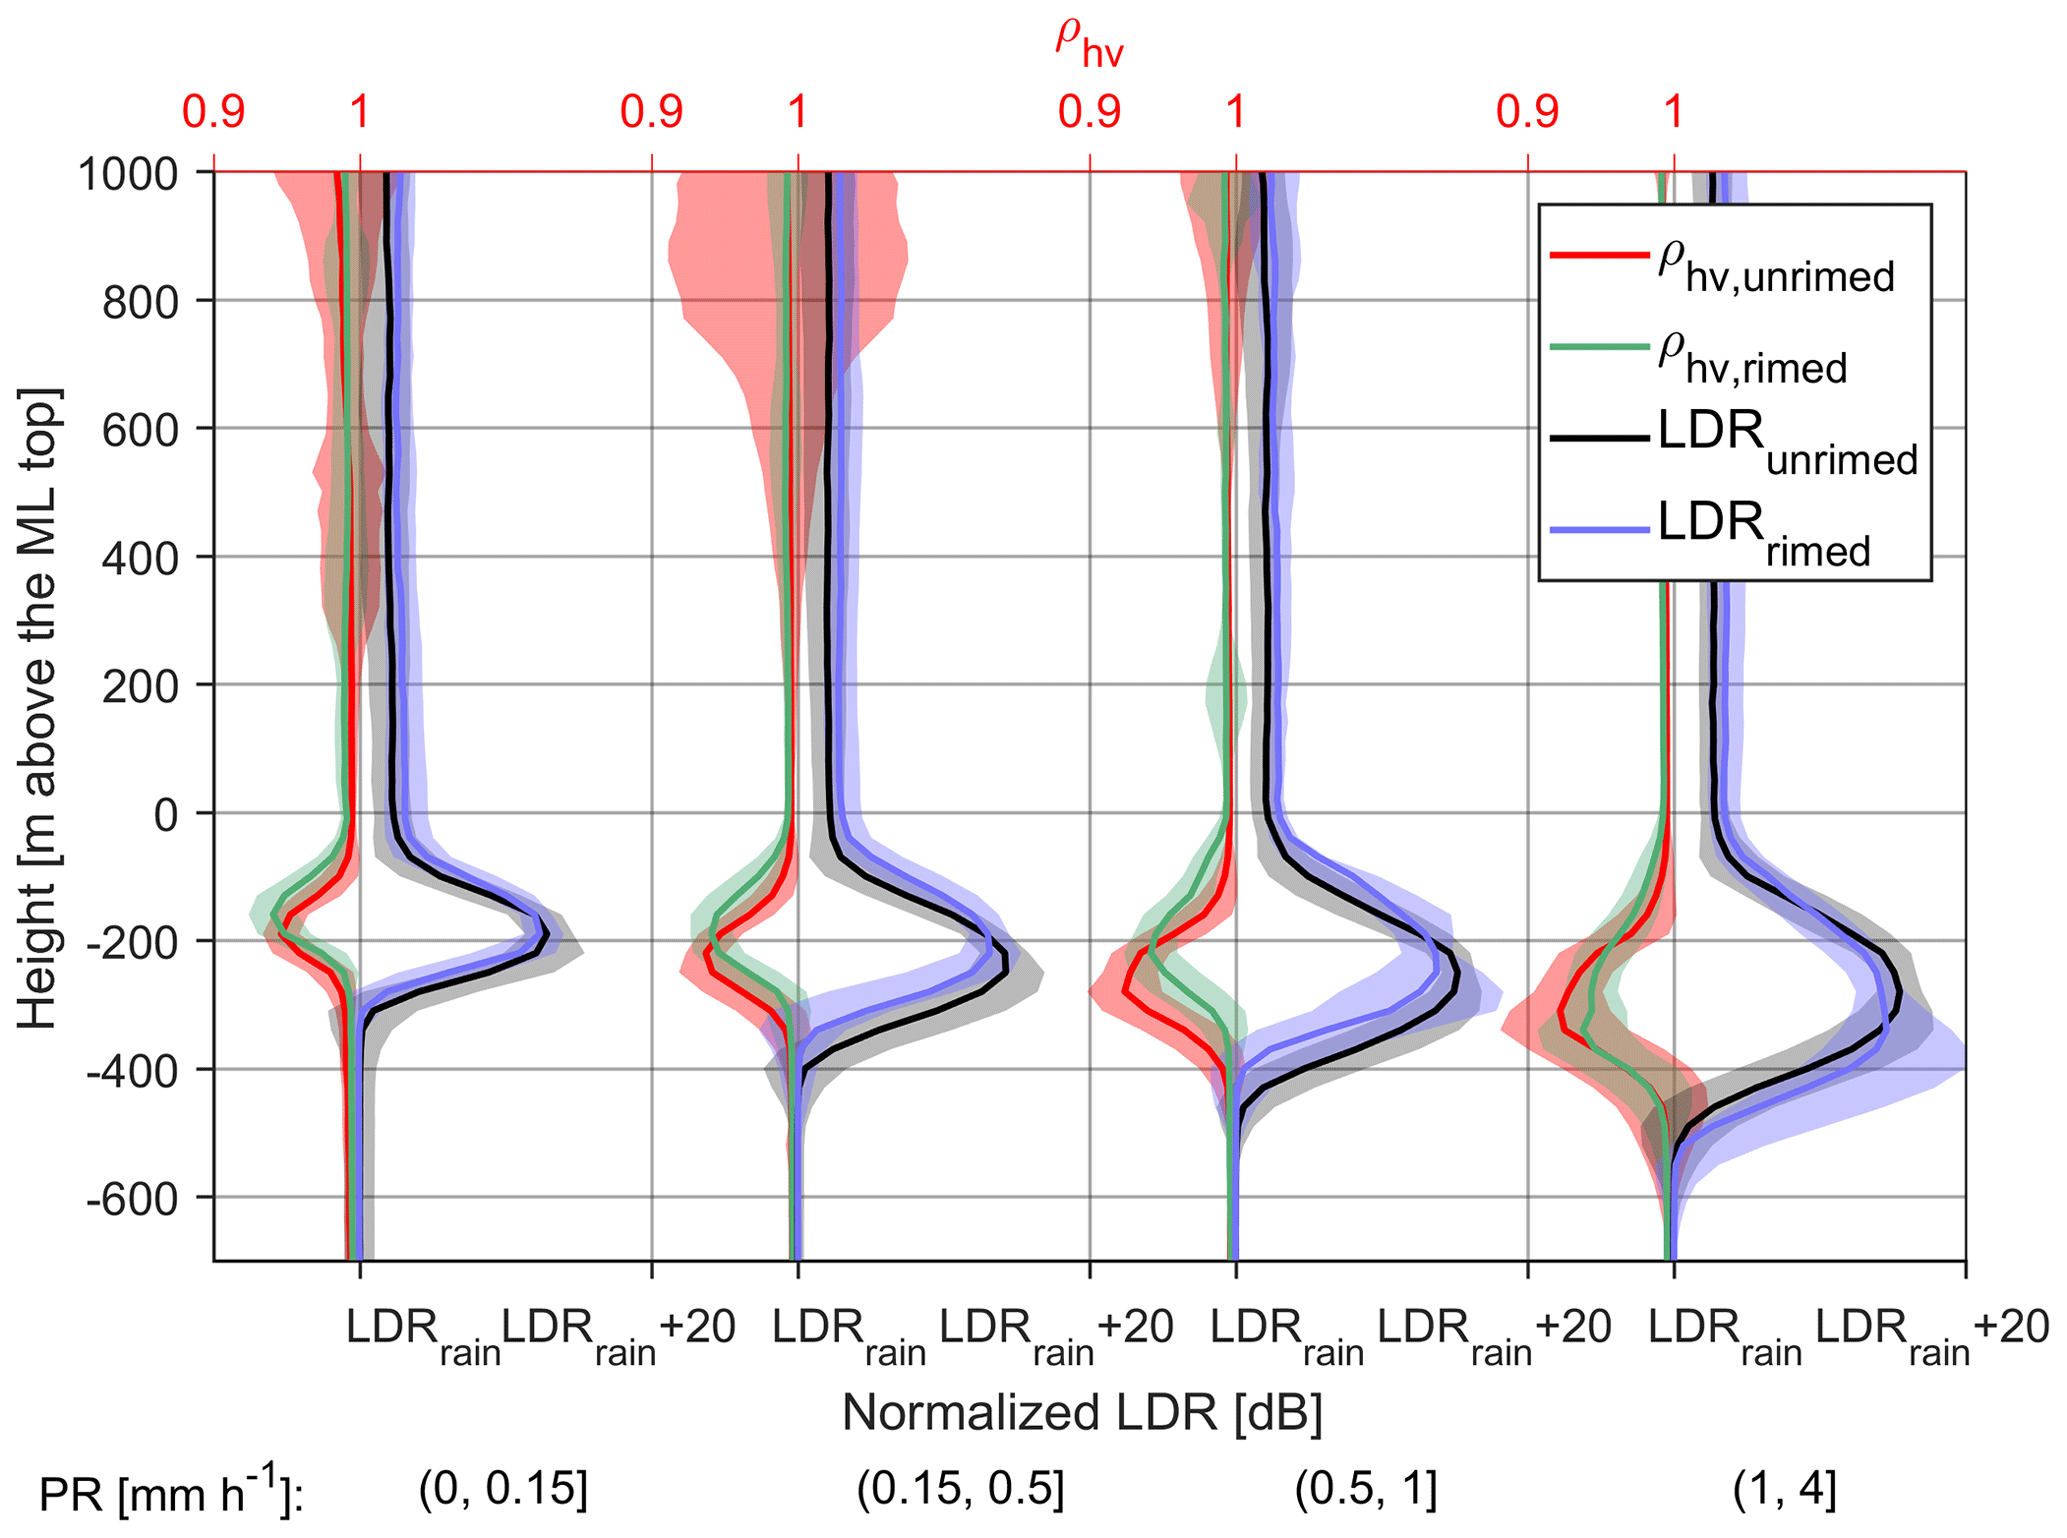
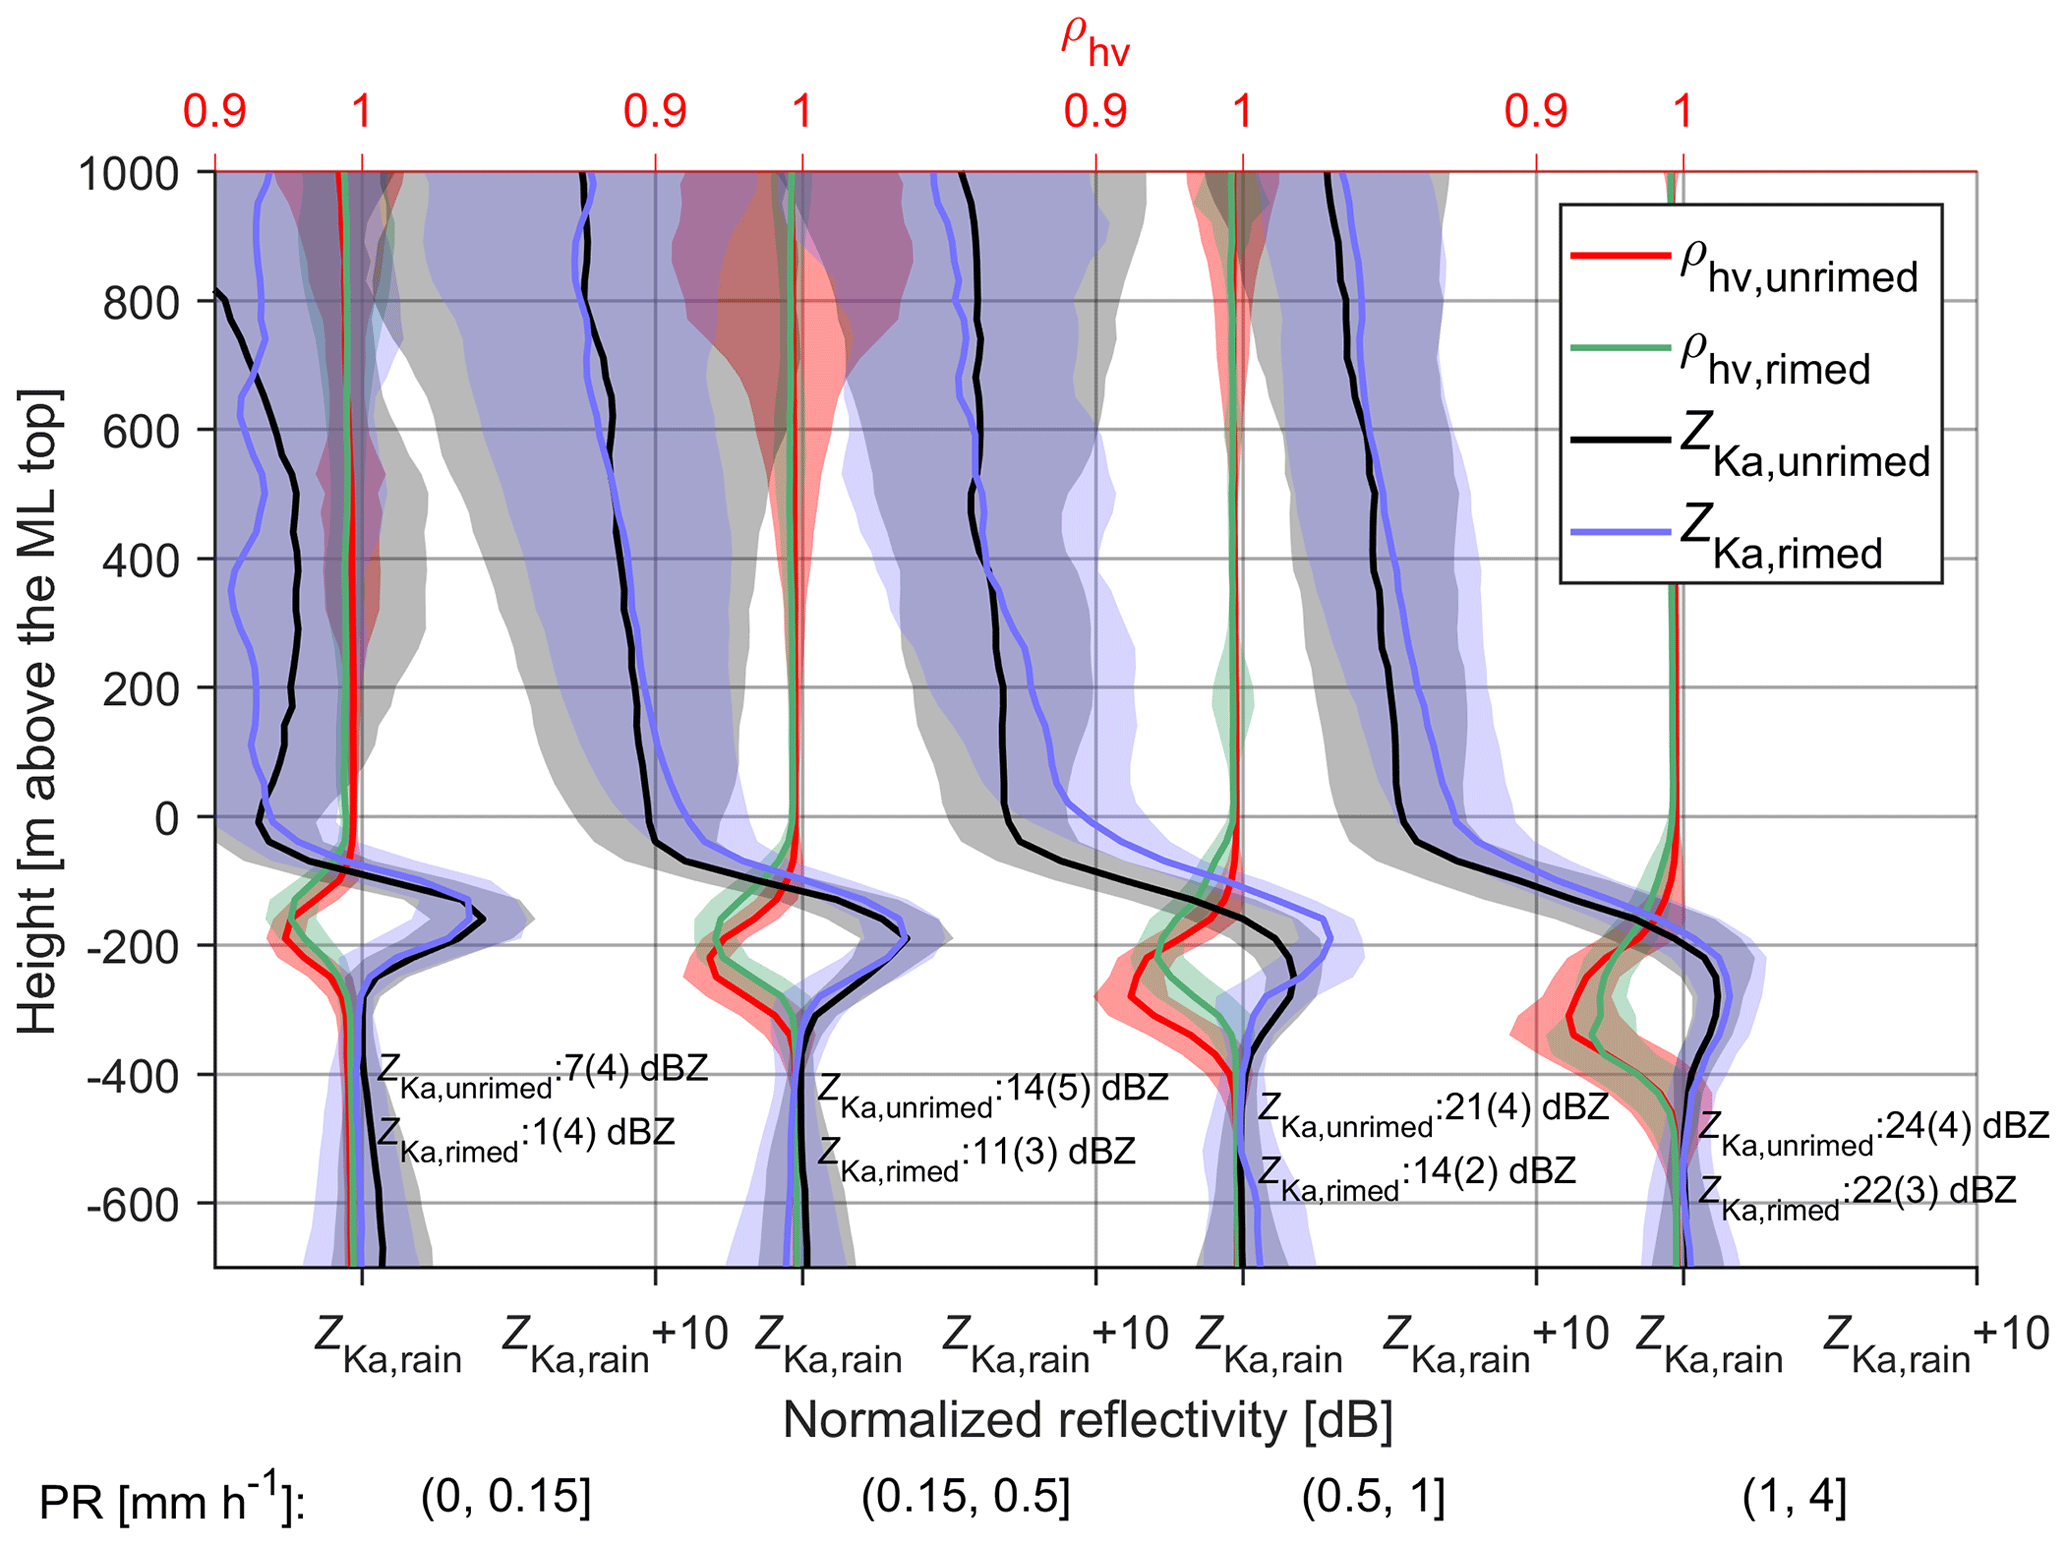
Figure 8Same as Fig. 5 but for Ka-band radar. Note that the calibration is made by matching the Ka-band reflectivity with X-band at precipitation top, while the attenuation in the profile is not accounted for. To be in line with Fig. 5, ρhv observed by X-SACR is presented instead of the LDR measured by Ka-SACR.
As shown in Fig. 8, the Ka-band reflectivity enhancement in the ML decreases as the precipitation intensifies. This is similar to the observations presented by Fabry and Zawadzki (1995) who found that the reflectivity peak in the ML observed by an X-band radar is less pronounced than that measured by an UHF radar when the reflectivity in rain exceeds 25 dBZ. With the increase in precipitation intensity, the size of snowflakes generally grows. Therefore, there are less hydrometeors satisfying the Rayleigh criteria, and the non-Rayleigh scattering becomes more significant. As a result, the reflectivity peak in the ML is not as pronounced as in the scenario of Rayleigh scattering. In addition, the ML attenuation increases as PR intensifies (Li and Moisseev, 2019), which further impedes the increase in reflectivity in the ML. This also explains the lower reflectivity enhancement in the ML for rimed snow when PR is greater than 0.5 mm h−1. As shown in Fig. 6, rimed snowflakes are usually smaller; thus the non-Rayleigh effect and ML attenuation (von Lerber et al., 2014) are not as significant as the larger unrimed ice particles.
When PR is less than or equal to 0.15 mm h−1, a weak reflectivity dip, the dark band, appears at the top of the ML for unrimed snow, which may also be observed by centimeter-wavelength radars (Fabry and Zawadzki, 1995). In the literature, the dark band has different definitions. For ground-based radars, Kollias and Albrecht (2005) referred the dip in radar reflectivity below the ML top as dark band. The dark band which is present just above the ML top, as observed by the spaceborne W-band radar, can be caused by the strong signal attenuation from large snow aggregates, as discussed in Sassen et al. (2007). Meanwhile, the change of PSD during the aggregation process can also contribute to this reflectivity dip, which is named dark band by Sassen et al. (2005) and dim band by Heymsfield et al. (2008). In this study, the dark band is identified as the decrease in radar reflectivity just above the ML top, as shown in Sassen et al. (2005, 2007) and Heymsfield et al. (2008).
4.2.3 W-band reflectivity
W-band reflectivity can be heavily affected by a wet radome, rain, ML, supercooled liquid water and gaseous attenuation (Kneifel et al., 2015; Li and Moisseev, 2019). Such attenuation coupled with precipitation microphysical processes, as well as the change of particle scattering regimes, can modulate the W-band reflectivity profiles. As shown in Fig. 9, the decrease in W-band reflectivity with height is mainly caused by rain attenuation. This effect is enhanced as PR increases, which has been adopted to retrieve PR (Matrosov, 2007). From dry to melting snow, there is a jump in W-band reflectivity, and the extent of such a jump seems dependent on PR. The bright band signature is partially visible when PR is less than or equal to 0.15 mm h−1 but is absent as the precipitation intensifies. This is expected, given the increased non-Rayleigh scattering at W-band for large snowflakes (Sassen et al., 2005). When PR is less than or equal to 0.15 mm h−1, the dark band is present for both unrimed and rimed snow, while the reflectivity dip near the ML top for unrimed snow is stronger than rimed. Below 1 mm h−1, the dark band is present for unrimed snow, in contrast with its absence for rimed snow when PR is greater than 0.15 mm h−1, which may indicate that the dark band is more frequently observed for the scenario of unrimed snow.
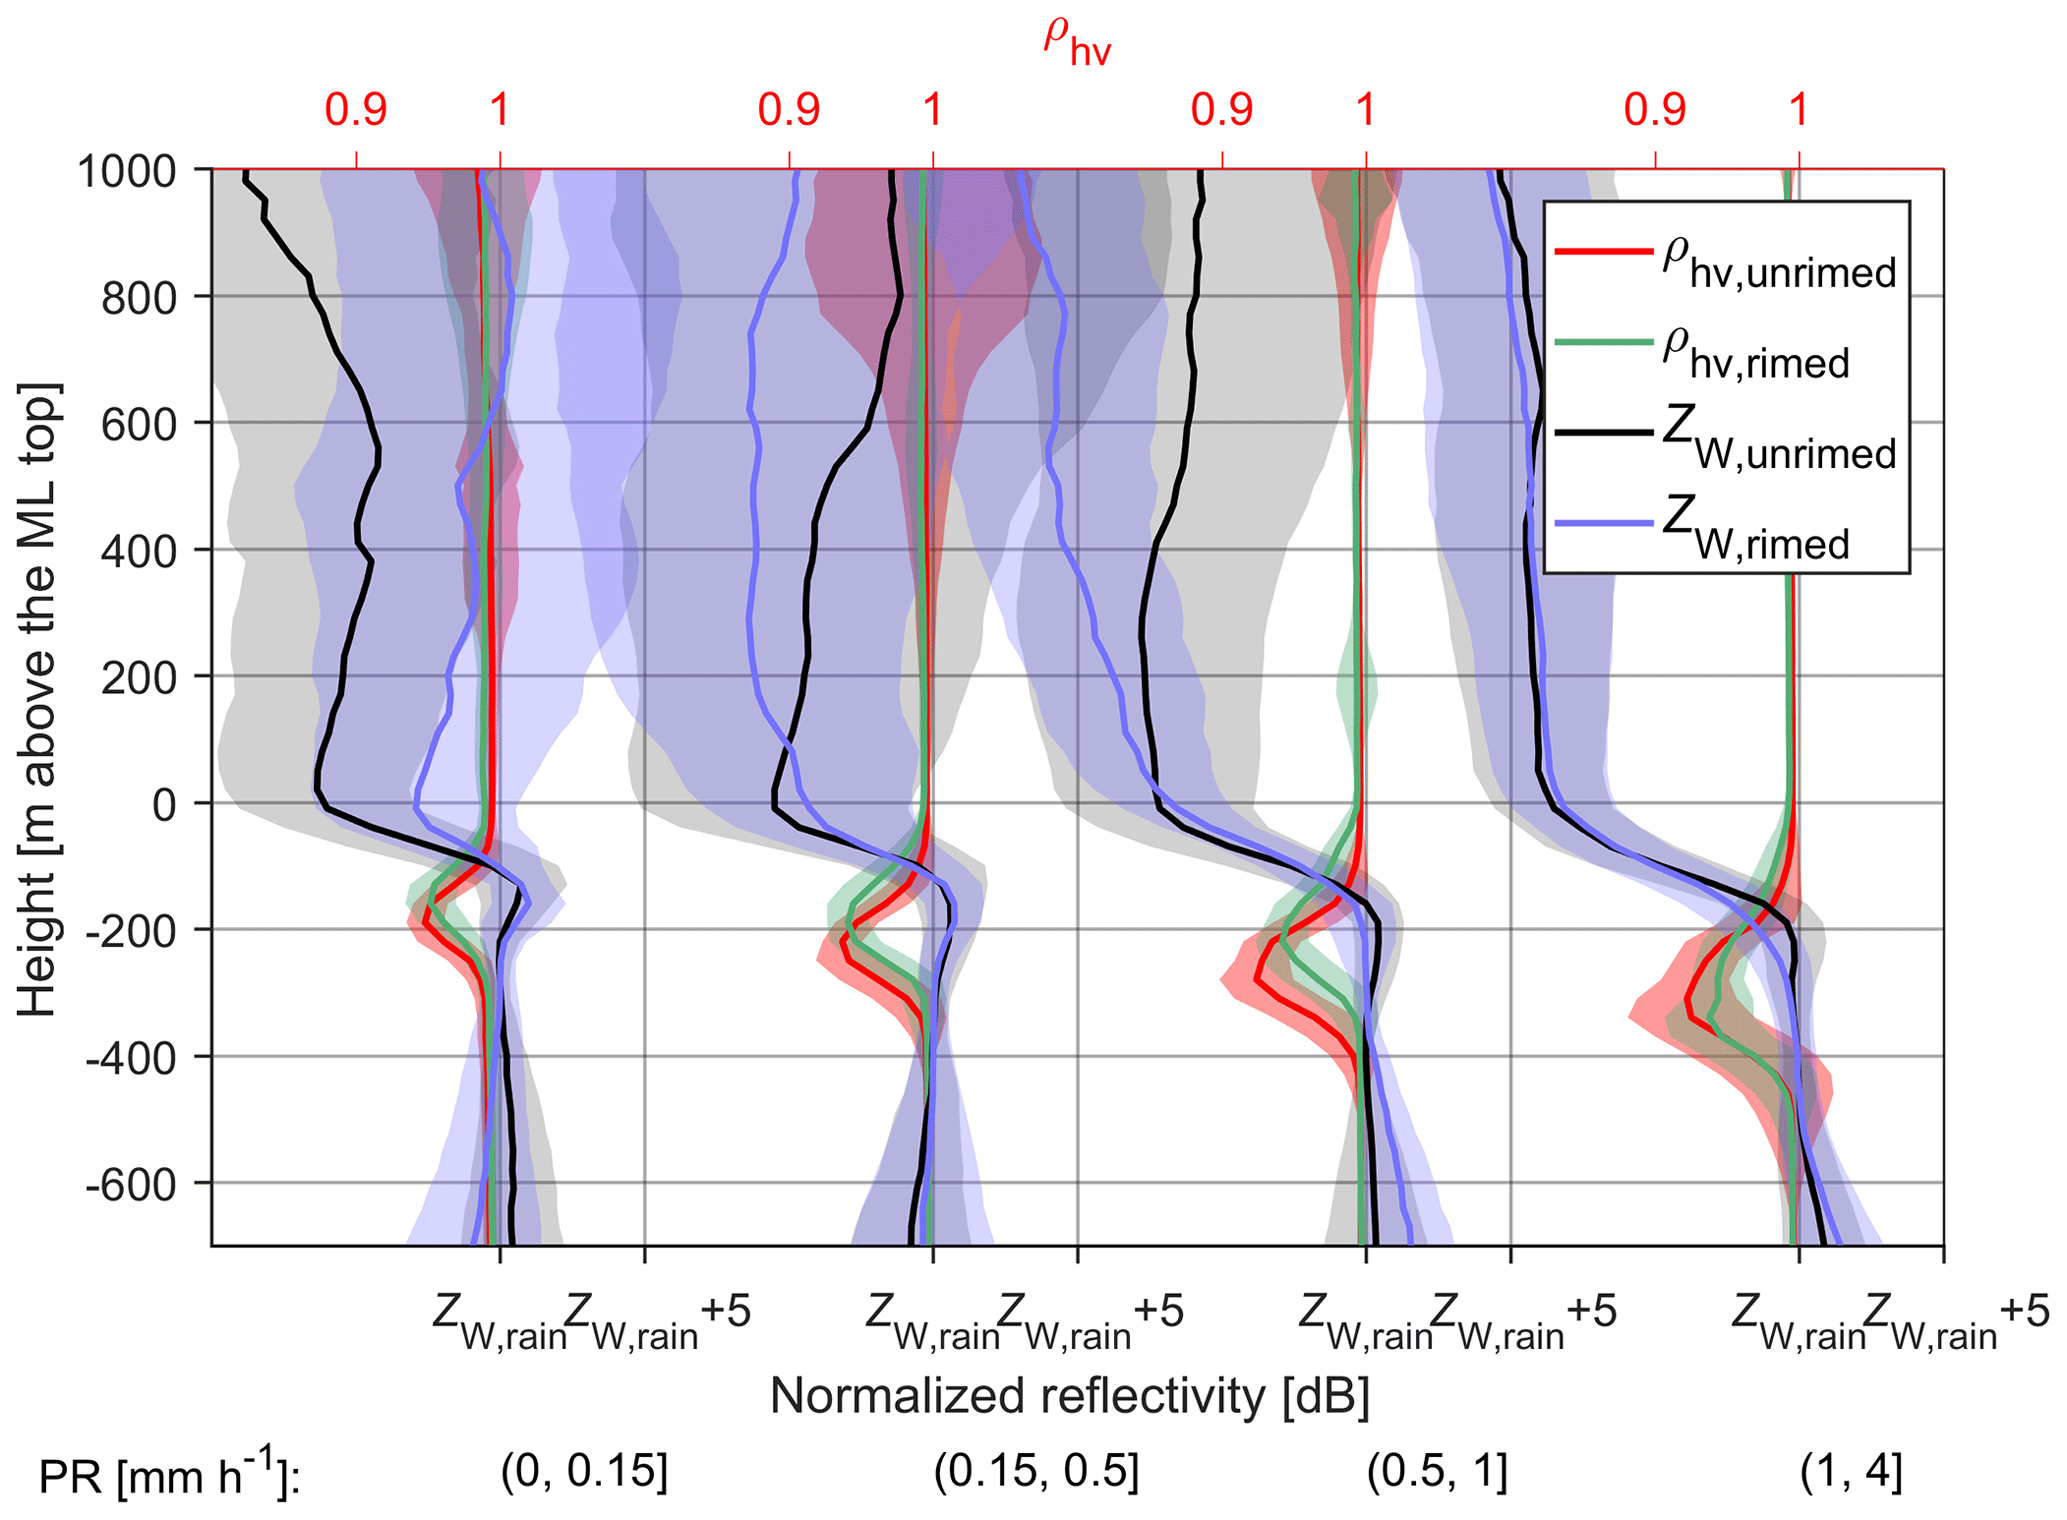
Figure 9Same as Fig. 5 but for W-band. Note that the reflectivity profiles at W-band are shifted by matching the radar reflectivity at the ML bottom (ZW,rain), while the value of ZW,rain is not shown due to the unknown W-band attenuation.
Sassen et al. (2005) have proposed that the dark band observed by W-band radars is due to the combination of Rayleigh and non-Rayleigh scattering effects modulated by the PSD. Heymsfield et al. (2008) have pinpointed that such a reflectivity dip is linked to the aggregation process, which consumes small ice while growing large snowflakes whose backscattering cross sections at W-band are much smaller than the scenario of Rayleigh scattering. This statement is evidenced in our statistical results since the dark band feature is more significant for unrimed snow and is more distinct at W-band than at Ka-band. Furthermore, the obscured dark band for rimed snow may indicate that the aggregation of rimed snow can be weaker than unrimed snow.
4.3 Weather radar measurements
Recent studies have demonstrated the potential of polarimetric measurements in revealing cloud microphysics and improving precipitation forecasts (Tiira and Moisseev, 2020; Trömel et al., 2019). Given the importance of precipitation intensity to the ML, it is necessary to address how the dual-polarization observations are dependent on PR. Therefore, we have analyzed the statistical profiles of Zdr and Kdp observed by the RHI scan of the FMI C-band dual-polarization radar. The vertical axis of weather radar RHI observations was shifted to the same level as we did for vertically pointing radars.
Significant dependence of Zdr and Kdp on PR can be found in Fig. 10. In cases when PR is greater than 0.15 mm h−1, Zdr decreases significantly to around 0 dB just above the ML. This is mainly due to the aggregation process, which leads to increased particle size and decreased density. In contrast, Zdr does not change just above the ML when PR is less than or equal to 0.15 mm h−1, indicating that very weak aggregation happens in light precipitation. Li et al. (2018) have shown that Zdr is a function of snow shape, canting angle distribution and density, and it generally decreases with the increase in radar reflectivity. It would be interesting to study the riming impact on Zdr profiles (Vogel and Fabry, 2018); unfortunately, we were not able to perform such a comparison due to the very limited number of RHI profiles during the studied events. It should be noted that the beam width of FMI C-band radar is 1∘, resulting in a vertical projection of around 1.1 km over the Hyytiälä station. This explains why the height at which Zdr starts increasing is approximately 500 m higher than the ML top determined by X-SACR.

Figure 10Normalized Zdr and Kdp profiles observed by FMI C-band radar with RHI scanning. Number of RHI profiles is presented at the bottom. The ML top (as retrieved from X-SACR observations) is used as the reference height in the vertical axis.
High Kdp values were observed when PR exceeds 1 mm h−1, while no detectable Kdp signal can be found when PR is less than or equal to 1 mm h−1. This is in line with the previous finding that the enhanced Kdp is indicative of intense precipitation (Bechini et al., 2013). When PR is greater than 1 mm h−1, the enhanced Kdp starts at around 3000 m above the ML with the expected temperature of around −20 ∘C, which is related to the dendritic growth region (Bechini et al., 2013; Moisseev et al., 2015). Overall, these observations indicate that the dependence of ML properties on the dual-polarization signatures above may mainly be due to the correlation of these signatures with precipitation intensity.
In this work, the connection between the precipitation melting layer and snow microphysics was studied using vertically pointing multifrequency Doppler radar and C-band dual-polarization weather radar observations. Using surface-based snowfall measurements collected over five winters at the University of Helsinki measurement station and supplemented by the single particle scattering datasets of aggregated snowflakes and rimed ice particles, a connection between rime mass fraction and radar observations at X- and Ka-bands was established and used in classifying unrimed and rimed snow. The sanity checks show that the results of this classification are consistent with the previous study using single-frequency radar observations (Zawadzki et al., 2005). Statistics of vertically pointing multifrequency dual-polarization radars and RHI scans of C-band polarimetric weather radar show the following.
-
The radar-observed melting layer properties show a detectable connection to the precipitation intensity. The increase in precipitation intensity can lead to the saggy bright band, i.e., the descending of reflectivity peak and ρhv dip.
-
Riming can affect melting layer properties in the following ways.
- a.
In moderate to heavy rainfall, riming may cause additional bright band sagging. However, the opposite effect is observed in light precipitation, namely, such sagging is associated with unrimed snow.
- b.
X-band radar reflectivity peak is smaller for rimed snow than unrimed for a given precipitation intensity if the non-Rayleigh scattering effect is not significant.
- c.
If the non-Rayleigh scattering effect is distinct, e.g., at Ka- or W-band, the reflectivity peak can be larger for rimed snow.
- d.
The reflectivity dip at the melting layer top (dark band) is obscured for rimed snow, while it is pronounced for unrimed snow. This suggests that the aggregation process may be suppressed by riming.
- a.
-
The decrease in Zdr towards the melting layer is pronounced in heavy precipitation but is insignificant in light precipitation.
A well-calibrated triple-frequency radar setup has been shown potential in studying the microphysics of snowfall. However, such measurements may not be well suited to rainfall due to the highly uncertain W-band attenuation caused by the melting layer, as well as the supercooled water. The approach presented explores the possibility of adding the Doppler velocity to distinguish between unrimed and rimed conditions and is less affected by the attenuation from supercooled water. Such instrumentation as the X/Ka-SACR mounted on the same platform takes much less effort in pointing alignment. Its application may also be expanded to space-borne radars. For example, instead of launching triple-frequency radars, implementing the Doppler capability with sufficient sensitivity on either of the radars on a dual-wavelength platform may be served as an option.
A coordinated radar setup as employed during BAECC facilitates the synergy of multiple radar frequencies and polarimetric observations at various scan modes. Due to the periodical changes of radar scanning modes during BAECC, the total stratiform rainfall cases are limited to ∼11.5 h. More of such observations can be utilized to evaluate and consolidate the presented conclusions. If such coordinated measurements with high time resolutions can be obtained in the future, our understanding of snow microphysical processes may be further advanced.
Quicklooks of radar observations used in this study are available at https://doi.org/10.5281/zenodo.3979103 (Li, 2020).
The FMI radar data are available from the Atmospheric Radiation Measurement (ARM) Climate Research Facility (https://iop.archive.arm.gov/arm-iop/2014/tmp/baecc/moisseev-radar_cband/?uid=LIH2&st=5f32748d&home=arm-archive, last access: 11 August 2020) (von Lerber, 2020).
The ARM data used in this study are available from Atmospheric Radiation Measurement (ARM) Climate Research Facility (ARM Climate Research Facility, 2006, 2010, 2011).
PIP data are available from https://doi.org/10.5281/zenodo.3977959 (Moisseev, 2020).
HL and DM designed and conceptualized the study. HL performed the investigation and did the data analysis. DM contributed with the research supervision. JT processed the FMI C-band radar raw data. AvL developed the snow retrieval algorithm based on PIP products. HL wrote the original paper. All coauthors contributed to reviewing and editing this paper.
The authors declare that they have no conflict of interest.
We would like to thank the personnel of Hyytiälä Station for their support in field observations. We especially thank Matti Leskinen for his help in data analysis. The research of Haoran Li, Jussi Tiira and Dmitri Moisseev was supported by the Academy of Finland's Centers of Excellence program (grant 307331) and ERA‐PLANET's transnational project iCUPE (grant agreement 689443), funded under the EU Horizon 2020 framework program. Annakaisa von Lerber was funded by the Academy of Finland (postdoc grant 333901). Haoran Li was also funded by the China Scholarship Council. The instrumentation used in this study was supported by NASA's Global Precipitation Measurement Mission ground validation program and by the US Department of Energy's Office of Science ARM program.
This research has been supported by the Academy of Finland (grant no. 307331), the European Commission (grant no. ERA-PLANET (689443)) and the China Scholarship Council (grant no. 201603170181).
Open-access funding was provided by Helsinki University Library.
This paper was edited by Jui-Yuan Christine Chiu and reviewed by Andrew Heymsfield and two anonymous referees.
ARM Climate Research Facility: Marine W-Band (95 GHz) ARM Cloud Radar (MWACR). 2014-01-15 to 2014-09-13, ARM Mobile Facility (TMP) U. of Helsinki Research Station (SMEAR II), Hyytiala, Finland; AMF2 (M1), Compiled by: Isom, B., Bharadwaj, N., Lindenmaier, I., Nelson, D., Hardin, J., and Matthews, A., Atmospheric Radiation Measurement (ARM) Climate Research Facility Data Archive, Oak Ridge, Tennessee, USA, https://doi.org/10.5439/1150242, 2006. a
ARM Climate Research Facility: Ka-Band Scanning ARM Cloud Radar (KASACRVPT). 2014-01-15 to 2014-09-13, ARM Mobile Facility (TMP) U. of Helsinki Research Station (SMEAR II), Hyytiala, Finland; AMF2 (M1), Compiled by: Isom, B., Bharadwaj, N., Lindenmaier, I., Nelson, D., Hardin, J., and Matthews, A., Atmospheric Radiation Measurement (ARM) Climate Research Facility Data Archive, Oak Ridge, Tennessee, USA, https://doi.org/10.5439/1046201, 2010. a
ARM Climate Research Facility: X-Band Scanning ARM Cloud Radar (XSACRVPT). 2014-01-15 to 2014-09-13, ARM Mobile Facility (TMP) U. of Helsinki Research Station (SMEAR II), Hyytiala, Finland; AMF2 (M1), Compiled by: Isom, B., Bharadwaj, N., Lindenmaier, I., Nelson, D., Hardin, J., and Matthews, A., Atmospheric Radiation Measurement (ARM) Climate Research Facility Data Archive, Oak Ridge, Tennessee, USA, https://doi.org/10.5439/1150303, 2011. a
Atlas, D.: Drop size and radar structure of a precipitation streamer, J. Meteorol., 14, 261–271, 1957. a
Bailey, M. P. and Hallett, J.: A comprehensive habit diagram for atmospheric ice crystals: confirmation from the laboratory, AIRS II, and other field studies, J. Atmos. Sci., 66, 2888–2899, 2009. a
Barrett, A. I., Westbrook, C. D., Nicol, J. C., and Stein, T. H. M.: Rapid ice aggregation process revealed through triple-wavelength Doppler spectrum radar analysis, Atmos. Chem. Phys., 19, 5753–5769, https://doi.org/10.5194/acp-19-5753-2019, 2019. a, b, c
Battaglia, A., Kummerow, C., Shin, D.-B., and Williams, C.: Constraining microwave brightness temperatures by radar brightband observations, J. Atmos. Ocean. Tech., 20, 856–871, 2003. a
Bechini, R., Baldini, L., and Chandrasekar, V.: Polarimetric radar observations in the ice region of precipitating clouds at C-band and X-band radar frequencies, J. Appl. Meteorol. Clim., 52, 1147–1169, 2013. a, b, c
Bringi, V. N. and Chandrasekar, V.: Polarimetric Doppler weather radar: principles and applications, Cambridge University Press, Cambridge, 2001. a
Carlin, J. T. and Ryzhkov, A. V.: Estimation of melting-layer cooling rate from dual-polarization radar: spectral bin model simulations, J. Appl. Meteorol. Clim., 58, 1485–1508, 2019. a, b, c, d, e, f, g
Chase, R. J., Finlon, J. A., Borque, P., McFarquhar, G. M., Nesbitt, S. W., Tanelli, S., Sy, O. O., Durden, S. L., and Poellot, M. R.: Evaluation of triple-frequency radar retrieval of snowfall properties using coincident airborne in situ observations during OLYMPEX, Geophys. Res. Lett., 45, 5752–5760, 2018. a
Dias Neto, J., Kneifel, S., Ori, D., Trömel, S., Handwerker, J., Bohn, B., Hermes, N., Mühlbauer, K., Lenefer, M., and Simmer, C.: The TRIple-frequency and Polarimetric radar Experiment for improving process observations of winter precipitation, Earth Syst. Sci. Data, 11, 845–863, https://doi.org/10.5194/essd-11-845-2019, 2019. a, b, c
Doviak, R., Bringi, V., Ryzhkov, A., Zahrai, A., and Zrnić, D.: Considerations for polarimetric upgrades to operational WSR-88D radars, J. Atmos. Ocean. Tech., 17, 257–278, 2000. a
Erlingis, J. M., Gourley, J. J., Kirstetter, P.-E., Anagnostou, E. N., Kalogiros, J., Anagnostou, M. N., and Petersen, W.: Evaluation of operational and experimental precipitation algorithms and microphysical insights during IPHEx, J. Hydrometeorol., 19, 113–125, 2018. a
Fabry, F. and Zawadzki, I.: Long-term radar observations of the melting layer of precipitation and their interpretation, J. Atmos. Sci., 52, 838–851, 1995. a, b, c, d, e, f, g, h, i, j, k, l
Falconi, M. T., von Lerber, A., Ori, D., Marzano, F. S., and Moisseev, D.: Snowfall retrieval at X, Ka and W bands: consistency of backscattering and microphysical properties using BAECC ground-based measurements, Atmos. Meas. Tech., 11, 3059–3079, https://doi.org/10.5194/amt-11-3059-2018, 2018. a, b
Giangrande, S. E., Krause, J. M., and Ryzhkov, A. V.: Automatic designation of the melting layer with a polarimetric prototype of the WSR-88D radar, J. Appl. Meteorol. Clim., 47, 1354–1364, 2008. a
Giangrande, S. E., Toto, T., Bansemer, A., Kumjian, M. R., Mishra, S., and Ryzhkov, A. V.: Insights into riming and aggregation processes as revealed by aircraft, radar, and disdrometer observations for a 27 April 2011 widespread precipitation event, J. Geophys. Res.-Atmos., 121, 5846–5863, 2016. a, b
Grecu, M., Tian, L., Heymsfield, G. M., Tokay, A., Olson, W. S., Heymsfield, A. J., and Bansemer, A.: Nonparametric methodology to estimate precipitating ice from multiple-frequency radar reflectivity observations, J. Appl. Meteorol. Clim., 57, 2605–2622, 2018. a
Haynes, J. M., L'Ecuyer, T. S., Stephens, G. L., Miller, S. D., Mitrescu, C., Wood, N. B., and Tanelli, S.: Rainfall retrieval over the ocean with spaceborne W-band radar, J. Geophys. Res.-Atmos., 114, D00A22, https://doi.org/10.1029/2008JD009973, 2009. a
Helmus, J. J. and Collis, S. M.: The Python ARM Radar Toolkit (Py-ART), a library for working with weather radar data in the Python programming language, J. Open Res. Softw., 4, e25, https://doi.org/10.5334/jors.119, 2016. a
Heymsfield, A. J., Bansemer, A., Schmitt, C., Twohy, C., and Poellot, M. R.: Effective ice particle densities derived from aircraft data, J. Atmos. Sci., 61, 982–1003, 2004. a
Heymsfield, A. J., Bansemer, A., and Twohy, C. H.: Refinements to ice particle mass dimensional and terminal velocity relationships for ice clouds. Part I: Temperature dependence, J. Atmos. Sci., 64, 1047–1067, 2007. a
Heymsfield, A. J., Bansemer, A., Matrosov, S., and Tian, L.: The 94-GHz radar dim band: Relevance to ice cloud properties and CloudSat, Geophys. Res. Lett., 35, L03802, https://doi.org/10.1029/2007GL031361, 2008. a, b, c, d
Heymsfield, A. J., Bansemer, A., Poellot, M. R., and Wood, N.: Observations of ice microphysics through the melting layer, J. Atmos. Sci., 72, 2902–2928, 2015. a, b, c, d
Heymsfield, G. M.: Doppler radar study of a warm frontal region, J. Atmos. Sci., 36, 2093–2107, 1979. a
Hogan, R. J., Illingworth, A. J., and Sauvageot, H.: Measuring crystal size in cirrus using 35-and 94-GHz radars, J. Atmos. Ocean. Tech., 17, 27–37, 2000. a
Huggel, A., Schmid, W., and Waldvogel, A.: Raindrop size distributions and the radar bright band, J. Appl. Meteorol., 35, 1688–1701, 1996. a
Illingworth, A. and Thompson, R.: Radar bright band correction using the linear depolarisation ratio, in: Proceedings of the 8th International Symposium on Weather Radar and Hydrology, April 2011, Exeter, UK, 64–68, 2011. a, b
Klaassen, W.: Radar observations and simulation of the melting layer of precipitation, J. Atmos. Sci., 45, 3741–3753, 1988. a, b
Kneifel, S., Kulie, M., and Bennartz, R.: A triple-frequency approach to retrieve microphysical snowfall parameters, J. Geophy. Res.-Atmos., 116, D11203, https://doi.org/10.1029/2010JD015430, 2011. a
Kneifel, S., Lerber, A., Tiira, J., Moisseev, D., Kollias, P., and Leinonen, J.: Observed relations between snowfall microphysics and triple-frequency radar measurements, J. Geophy. Res.-Atmos., 120, 6034–6055, 2015. a, b, c, d, e
Kollias, P. and Albrecht, B.: Why the melting layer radar reflectivity is not bright at 94 GHz, Geophys. Res. Lett., 32, L24818, https://doi.org/10.1029/2005GL024074, 2005. a, b
Kollias, P., Jo, I., Borque, P., Tatarevic, A., Lamer, K., Bharadwaj, N., Widener, K., Johnson, K., and Clothiaux, E. E.: Scanning ARM cloud radars. Part II: Data quality control and processing, J. Atmos. Ocean. Tech., 31, 583–598, 2014. a
Korolev, A., Isaac, G., and Hallett, J.: Ice particle habits in stratiform clouds, Q. J. Roy. Meteorol. Soc., 126, 2873–2902, 2000. a
Korolev, A. V., Isaac, G. A., Cober, S. G., Strapp, J. W., and Hallett, J.: Microphysical characterization of mixed-phase clouds, Q. J. Roy. Meteorol. Soc., 129, 39–65, 2003. a
Kruger, A. and Krajewski, W. F.: Two-dimensional video disdrometer: A description, J. Atmos. Ocean. Tech., 19, 602–617, 2002. a
Kumjian, M. R., Mishra, S., Giangrande, S. E., Toto, T., Ryzhkov, A. V., and Bansemer, A.: Polarimetric radar and aircraft observations of saggy bright bands during MC3E, J. Geophys. Res.-Atmos., 121, 3584–3607, 2016. a, b, c, d, e, f, g, h
Lamb, D. and Verlinde, J.: Physics and chemistry of clouds, Cambridge University Press, Cambridge, 2011. a
Leinonen, J. and Moisseev, D.: What do triple-frequency radar signatures reveal about aggregate snowflakes?, J. Geophys. Res.-Atmos., 120, 229–239, 2015. a, b, c
Leinonen, J. and Szyrmer, W.: Radar signatures of snowflake riming: A modeling study, Earth Space Sci., 2, 346–358, 2015. a, b, c, d
Leinonen, J., Kneifel, S., Moisseev, D., Tyynelä, J., Tanelli, S., and Nousiainen, T.: Evidence of nonspheroidal behavior in millimeter-wavelength radar observations of snowfall, J. Geophys. Res.-Atmos., 117, D18205, https://doi.org/10.1029/2012JD017680, 2012a. a
Leinonen, J., Moisseev, D., Leskinen, M., and Petersen, W. A.: A climatology of disdrometer measurements of rainfall in Finland over five years with implications for global radar observations, J. Appl. Meteorol. Clim., 51, 392–404, 2012b. a
Leinonen, J., Moisseev, D., and Nousiainen, T.: Linking snowflake microstructure to multi-frequency radar observations, J. Geophys. Res.-Atmos., 118, 3259–3270, 2013. a
Leinonen, J., Lebsock, M. D., Tanelli, S., Sy, O. O., Dolan, B., Chase, R. J., Finlon, J. A., von Lerber, A., and Moisseev, D.: Retrieval of snowflake microphysical properties from multifrequency radar observations, Atmos. Meas. Tech., 11, 5471–5488, https://doi.org/10.5194/amt-11-5471-2018, 2018. a
Lhermitte, R. M.: Observation of rain at vertical incidence with a 94 GHz Doppler radar: An insight on Mie scattering, Geophys. Res. Lett., 15, 1125–1128, 1988. a, b
Li, H. and Moisseev, D.: Melting layer attenuation at Ka- and W-bands as derived from multi-frequency radar Doppler spectra observations, J. Geophys. Res.-Atmos., 124, 9520–9533, https://doi.org/10.1029/2019JD030316, 2019. a, b, c, d, e, f
Li, H.: Quicklooks of X-SACR data during BAECC – stratiform rainfall, zenodo, https://doi.org/10.5281/zenodo.3979103, 2020. a
Li, H. and Moisseev, D.: Two layers of melting ice particles within a single radar bright band: Interpretation and implications, Geophys. Res. Lett., 47, e2020GL087499, https://doi.org/10.1029/2020GL087499, 2020. a, b
Li, H., Moisseev, D., and von Lerber, A.: How does riming affect dual-polarization radar observations and snowflake shape?, J. Geophys. Res.-Atmos., 123, 6070–6081, 2018. a, b, c, d, e, f, g
Liebe, H. J.: An updated model for millimeter wave propagation in moist air, Radio Sci., 20, 1069–1089, 1985. a
Locatelli, J. D. and Hobbs, P. V.: Fall speeds and masses of solid precipitation particles, J. Geophys. Res., 79, 2185–2197, 1974. a, b, c
Mason, S., Chiu, C., Hogan, R., Moisseev, D., and Kneifel, S.: Retrievals of riming and snow density from vertically pointing doppler radars, J. Geophys. Res.-Atmos., 123, 13807–13834, 2018. a, b, c, d
Mason, S. L., Hogan, R. J., Westbrook, C. D., Kneifel, S., Moisseev, D., and von Terzi, L.: The importance of particle size distribution and internal structure for triple-frequency radar retrievals of the morphology of snow, Atmos. Meas. Tech., 12, 4993–5018, https://doi.org/10.5194/amt-12-4993-2019, 2019. a, b
Matrosov, S. Y.: A dual-wavelength radar method to measure snowfall rate, J. Appl. Meteorol., 37, 1510–1521, 1998. a
Matrosov, S. Y.: Potential for attenuation-based estimations of rainfall rate from CloudSat, Geophys. Res. Lett., 34, L05817, https://doi.org/10.1029/2006GL029161, 2007. a
Matrosov, S. Y.: Assessment of radar signal attenuation caused by the melting hydrometeor layer, IEEE T. Geosci. Remote., 46, 1039–1047, 2008. a
Moisseev, D.: Snow microphysical properties retrieved from PIP observations collected in Hyytiälä on 2014–2015, zenodo, https://doi.org/10.5281/zenodo.3977959, 2020. a
Moisseev, D., von Lerber, A., and Tiira, J.: Quantifying the effect of riming on snowfall using ground-based observations, J. Geophys. Res.-Atmos., 122, 4019–4037, 2017. a, b, c, d, e
Moisseev, D., Lautaportti, S., Alku, L., Tabakova, K., O'Connor, E. J., Leskinen, M., and Kulmala, M.: Inadvertent Localized Intensification of Precipitation by Aircraft, J. Geophys. Res.-Atmos., 124, 2094–2104, https://doi.org/10.1029/2018JD029449, 2019. a, b
Moisseev, D. N., Lautaportti, S., Tyynela, J., and Lim, S.: Dual-polarization radar signatures in snowstorms: Role of snowflake aggregation, J. Geophys. Res.-Atmos., 120, 12644–12655, 2015. a, b, c
Morrison, H. and Milbrandt, J. A.: Parameterization of cloud microphysics based on the prediction of bulk ice particle properties. Part I: Scheme description and idealized tests, J. Atmos. Sci., 72, 287–311, 2015. a
Newman, A. J., Kucera, P. A., and Bliven, L. F.: Presenting the snowflake video imager (SVI), J. Atmos. Ocean. Tech., 26, 167–179, 2009. a, b, c
Oue, M., Kollias, P., Ryzhkov, A., and Luke, E. P.: Toward exploring the synergy between cloud radar polarimetry and Doppler spectral analysis in deep cold precipitating systems in the Arctic, J. Geophys. Res.-Atmos., 123, 2797–2815, 2018. a, b
Petäjä, T., O'Connor, E. J., Moisseev, D., Sinclair, V. A., Manninen, A. J., Väänänen, R., von Lerber, A., Thornton, J. A., Nicoll, K., Petersen, W., Chandrasekar, V., Smith, J. N., Winkler, P. M., Krüger, O., Hakola, H., Timonen, H., Brus, D., Laurila, T., Asmi, E., Riekkola, M. L., Mona, L., Massoli, P., Engelmann, R., Komppula, M., Wang, J., Kuang, C. G., Back, J., Virtanen, A., Levula, J., Ritsche, M., and Hickmon, N.: BAECC: A field campaign to elucidate the impact of biogenic aerosols on clouds and climate, B. Am. Meteorol. Soc., 97, 1909–1928, 2016. a, b
Ryde, J.: The attenuation and radar echoes produced at centimeter wavelengths by various meteorological phenomena, in: Meteorological Factors in Radio Wave Propagation, Physical Society, London, 169–189, 1946. a
Ryzhkov, A., Zhang, P., Reeves, H., Kumjian, M., Tschallener, T., Trömel, S., and Simmer, C.: Quasi-vertical profiles – A new way to look at polarimetric radar data, J. Atmos. Ocean. Tech., 33, 551–562, 2016. a, b, c
Sandford, C., Illingworth, A., and Thompson, R.: The potential use of the linear depolarization ratio to distinguish between convective and stratiform rainfall to improve radar rain-rate estimates, J. Appl. Meteorol. Clim., 56, 2927–2940, 2017. a
Sarma, A. C., Deshamukhya, A., Narayana Rao, T., and Sharma, S.: A study of raindrop size distribution during stratiform rain and development of its parameterization scheme in the framework of multi-parameter observations, Meteorol. Appl., 23, 254–268, 2016. a
Sassen, K., Campbell, J. R., Zhu, J., Kollias, P., Shupe, M., and Williams, C.: Lidar and triple-wavelength Doppler radar measurements of the melting layer: A revised model for dark- and brightband phenomena, J. Appl. Meteorol., 44, 301–312, 2005. a, b, c, d, e, f
Sassen, K., Matrosov, S., and Campbell, J.: CloudSat spaceborne 94 GHz radar bright bands in the melting layer: An attenuation-driven upside-down lidar analog, Geophys. Res. Lett., 34, L16818, https://doi.org/10.1029/2007GL030291, 2007. a, b, c
Sekelsky, S. M.: Near-field reflectivity and antenna boresight gain corrections for millimeter-wave atmospheric radars, J. Atmos. Ocean. Tech., 19, 468–477, 2002. a
Stewart, R. E., Marwitz, J. D., Pace, J. C., and Carbone, R. E.: Characteristics through the melting layer of stratiform clouds, J. Atmos. Sci., 41, 3227–3237, 1984. a, b, c
Szeto, K. K., Lin, C. A., and Stewart, R. E.: Mesoscale circulations forced by melting snow. Part I: Basic simulations and dynamics, J. Atmos. Sci., 45, 1629–1641, 1988. a
Szyrmer, W. and Zawadzki, I.: Modeling of the melting layer. Part I: Dynamics and microphysics, J. Atmos. Sci., 56, 3573–3592, 1999. a
Tiira, J. and Moisseev, D.: Unsupervised classification of vertical profiles of dual polarization radar variables, Atmos. Meas. Tech., 13, 1227–1241, https://doi.org/10.5194/amt-13-1227-2020, 2020. a, b, c
Tiira, J., Moisseev, D. N., von Lerber, A., Ori, D., Tokay, A., Bliven, L. F., and Petersen, W.: Ensemble mean density and its connection to other microphysical properties of falling snow as observed in Southern Finland, Atmos. Meas. Tech., 9, 4825–4841, https://doi.org/10.5194/amt-9-4825-2016, 2016. a, b
Trömel, S., Ryzhkov, A. V., Zhang, P., and Simmer, C.: Investigations of backscatter differential phase in the melting layer, J. Appl. Meteorol. Clim., 53, 2344–2359, 2014. a
Trömel, S., Ryzhkov, A. V., Hickman, B., Mühlbauer, K., and Simmer, C.: Polarimetric radar variables in the layers of melting and dendritic growth at X band – implications for a nowcasting strategy in stratiform rain, J. Appl. Meteorol. Clim., 58, 2497–2522, 2019. a, b, c
Tyynelä, J. and Chandrasekar, V.: Characterizing falling snow using multifrequency dual-polarization measurements, J. Geophys. Res.-Atmos., 119, 8268–8283, 2014. a
Tyynelä, J. and von Lerber, A.: Validation of microphysical snow models using in-situ, multi-frequency and dual-polarization radar measurements in Finland, J. Geophys. Res.-Atmos., 124, 13273–13290, https://doi.org/10.1029/2019JD030721, 2019. a
Vogel, J. M. and Fabry, F.: Contrasting polarimetric observations of stratiform riming and nonriming events, J. Appl. Meteorol. Clim., 57, 457–476, 2018. a, b, c
von Lerber, A.: Finnish Meteorological Institute Dual-Pol C-band Weather Radar, Ikaalinen, available at: https://iop.archive.arm.gov/arm-iop/2014/tmp/baecc/moisseev-radar_cband/?uid=LIH2&st=5f32748d&home=arm-archive, last access: 11 August 2020. a
von Lerber, A., Moisseev, D., Leinonen, J., Koistinen, J., and Hallikainen, M. T.: Modeling radar attenuation by a low melting layer with optimized model parameters at C-band, IEEE T. Geosci. Remote., 53, 724–737, 2014. a, b, c, d, e
von Lerber, A., Moisseev, D., Bliven, L. F., Petersen, W., Harri, A.-M., and Chandrasekar, V.: Microphysical properties of snow and their link to Ze–S relations during BAECC 2014, J. Appl. Meteorol. Clim., 56, 1561–1582, 2017. a, b, c, d, e, f
Willis, P. T. and Heymsfield, A. J.: Structure of the melting layer in mesoscale convective system stratiform precipitation, J. Atmos. Sci., 46, 2008–2025, 1989. a, b
Wolfensberger, D., Scipion, D., and Berne, A.: Detection and characterization of the melting layer based on polarimetric radar scans, Q. J. Roy. Meteorol. Soc., 142, 108–124, 2016. a, b, c, d, e
Xie, X., Evaristo, R., Simmer, C., Handwerker, J., and Trömel, S.: Precipitation and microphysical processes observed by three polarimetric X-band radars and ground-based instrumentation during HOPE, Atmos. Chem. Phys., 16, 7105–7116, https://doi.org/10.5194/acp-16-7105-2016, 2016. a, b, c
Zawadzki, I., Szyrmer, W., Bell, C., and Fabry, F.: Modeling of the melting layer. Part III: The density effect, J. Atmos. Sci., 62, 3705–3723, 2005. a, b, c, d, e, f, g