the Creative Commons Attribution 4.0 License.
the Creative Commons Attribution 4.0 License.
 | 03 Aug 2020
Remote sensing of methane leakage from natural gas and petroleum systems revisited
Oliver Schneising
Michael Buchwitz
Maximilian Reuter
Steffen Vanselow
Heinrich Bovensmann
John P. Burrows
The switch from the use of coal to natural gas or oil for energy generation potentially reduces greenhouse gas emissions and thus the impact on global warming and climate change because of the higher energy creation per CO2 molecule emitted. However, the climate benefit over coal is offset by methane (CH4) leakage from natural gas and petroleum systems, which reverses the climate impact mitigation if the rate of fugitive emissions exceeds the compensation point at which the global warming resulting from the leakage and the benefit from the reduction of coal combustion coincide. Consequently, an accurate quantification of CH4 emissions from the oil and gas industry is essential to evaluate the suitability of natural gas and petroleum as bridging fuels on the way to a carbon-neutral future.
We show that regional CH4 release from large oil and gas fields can be monitored from space by using dense daily recurrent measurements of the TROPOspheric Monitoring Instrument (TROPOMI) onboard the Sentinel-5 Precursor satellite to quantify emissions and leakage rates. The average emissions for the time period 2018/2019 from the five most productive basins in the United States, the Permian, Appalachian, Eagle Ford, Bakken, and Anadarko, are estimated to be 3.18±1.13, 2.36±0.88, 1.37±0.63, 0.89±0.56, and 2.74±0.74 Mt yr−1, respectively. This corresponds to CH4 leakage rates relative to the associated production between 1.2 % and 1.4 % for the first four production regions, which are consistent with bottom-up estimates and likely fall below the break-even leakage rate for immediate climate benefit. For the Anadarko Basin, the fugitive emission rate is larger and amounts to 3.9±1.1 %, which likely exceeds the break-even rate for immediate benefit and roughly corresponds to the break-even rate for a 20-year time horizon. The determined values are smaller than previously derived satellite-based leakage rates for the time period 2009–2011, which was an early phase of hydraulic fracturing, indicating that it is possible to improve the climate footprint of the oil and gas industry by adopting new technologies and that efforts to reduce methane emissions have been successful. For two of the world's largest natural gas fields, Galkynysh and Dauletabad in Turkmenistan, we find collective methane emissions of 3.26±1.17 Mt yr−1, which corresponds to a leakage rate of 4.1±1.5 %, suggesting that the Turkmen energy industry is not employing methane emission avoidance strategies and technologies as successfully as those currently widely used in the United States. The leakage rates in Turkmenistan and in the Anadarko Basin indicate that there is potential to reduce fugitive methane emissions from natural gas and petroleum systems worldwide. In particular, relatively newly developed oil and gas plays appear to have larger leakage rates compared to more mature production areas.
- Article
(7305 KB) - Full-text XML
- Companion paper
- BibTeX
- EndNote


Methane (CH4) is an important greenhouse gas, which accounts for the second-largest share of radiative forcing caused by human activities since preindustrial times. It has a much shorter atmospheric lifetime and a considerably higher global warming potential than the most important anthropogenically modified greenhouse gas, carbon dioxide (CO2) (Holmes et al., 2013). Hence, a combined climate change mitigation strategy, aiming at reducing both CO2 and CH4 emissions in parallel, addresses long-term and near-term effects of global warming and is required to achieve climate goals most efficiently (Shindell et al., 2012; Shoemaker et al., 2013).
An integral contribution to anthropogenic methane emissions originates from the exploitation of natural gas and oil for energy generation (i.e. the production of natural gas and oil, the refining of oil, and the subsequent storage, distribution, and combustion of these fuels). To assess the climate impact of the production of natural gas or oil in comparison to coal, the fugitive emission rate relative to production is a key parameter. Although the combustion of natural gas or oil produces less CO2 than coal at the same energy content, methane emissions during the production and distribution process offset the climate benefit over coal. Hence, there is a compensation point, the break-even rate, at which the climate impacts of the relevant gas–oil mix and coal coincide. The exact break-even rate depends on the time horizon, the climate impact metric (e.g. global warming potential or technology warming potential), and the considered fuel-switching scenario. It has been estimated that an immediate climate benefit of switching from coal-fired to gas-fired power plants requires life-cycle methane emissions to stay below 3 % (Alvarez et al., 2012). For a time horizon of 20 years the corresponding break-even rate is about 4 %, which drops to 2 % if carbon capture and sequestration becomes available (Farquharson et al., 2016).
The latest official bottom-up estimate of methane emissions from natural gas and petroleum systems reported by the United States Environmental Protection Agency (EPA) is 8.13 Mt [5.12–11.54; 2σ] in 2017, corresponding to 0.9 % [0.5–1.2; 2σ] of aggregated gross production (U.S. Environmental Protection Agency, 2019a), which is very likely below the break-even emission rate. As in all leakage rate estimations presented here, combined oil and gas production in terms of energy content is the reference value of the calculation, and a methane content of 93 % in natural gas (U.S. Environmental Protection Agency, 2019b) is used to determine the mass fraction of methane in the produced natural gas. Alternative bottom-up estimates (Alvarez et al., 2018) find total US oil and gas emissions of 13.0 Mt [11.3–15.1; 2σ] in 2015, which is 63 % higher than the EPA estimate and corresponds to a fugitive emission rate of 1.4 % [1.1–1.6; 2σ] (relative to combined oil and gas production).
However, several top-down studies suggest that the oil and gas industry leaks substantially more methane than assumed in official inventories, at least locally or temporally, with highly variable regional leakage rates occasionally reaching several multiples of the expected bottom-up estimates (Pétron et al., 2012; Karion et al., 2013; Caulton et al., 2014; Brandt et al., 2014; Schneising et al., 2014; Peischl et al., 2015, 2016, 2018; Alvarez et al., 2018). This points to a heterogeneity of the methane leakage and complicates the specification of typical emission rates, which are necessary to reliably assess the climate footprint of the natural gas and petroleum industry as a whole.
In the past, the satellite-based detection of CH4 emissions from the oil and gas industry was mostly limited to long-term averages typically yielding emission rates with large associated uncertainties (Schneising et al., 2014; Turner et al., 2016; Buchwitz et al., 2017). Exceptional emissions of superemitters have also been observed in single satellite overpasses (Thompson et al., 2016). The recently launched TROPOspheric Monitoring Instrument (TROPOMI) onboard the Sentinel-5 Precursor satellite, with its unique combination of high precision, accuracy, and spatiotemporal coverage (Veefkind et al., 2012), now enables the systematic detection of sufficiently large emission sources in a single satellite overpass. This has already been demonstrated for daily CH4 enhancements from the energy sector for specific source regions in North America, Europe, and Turkmenistan (Varon et al., 2019; Schneising et al., 2019; Pandey et al., 2019; de Gouw et al., 2020). Here we use dense daily recurrent TROPOMI observations to reassess the emissions of petroleum- and gas-producing basins. The presented analysis includes emission estimates of the five most prolific basins in the United States as well as for two of the world's largest natural gas fields in Turkmenistan. The corresponding locations of these production regions are shown in Fig. 1.
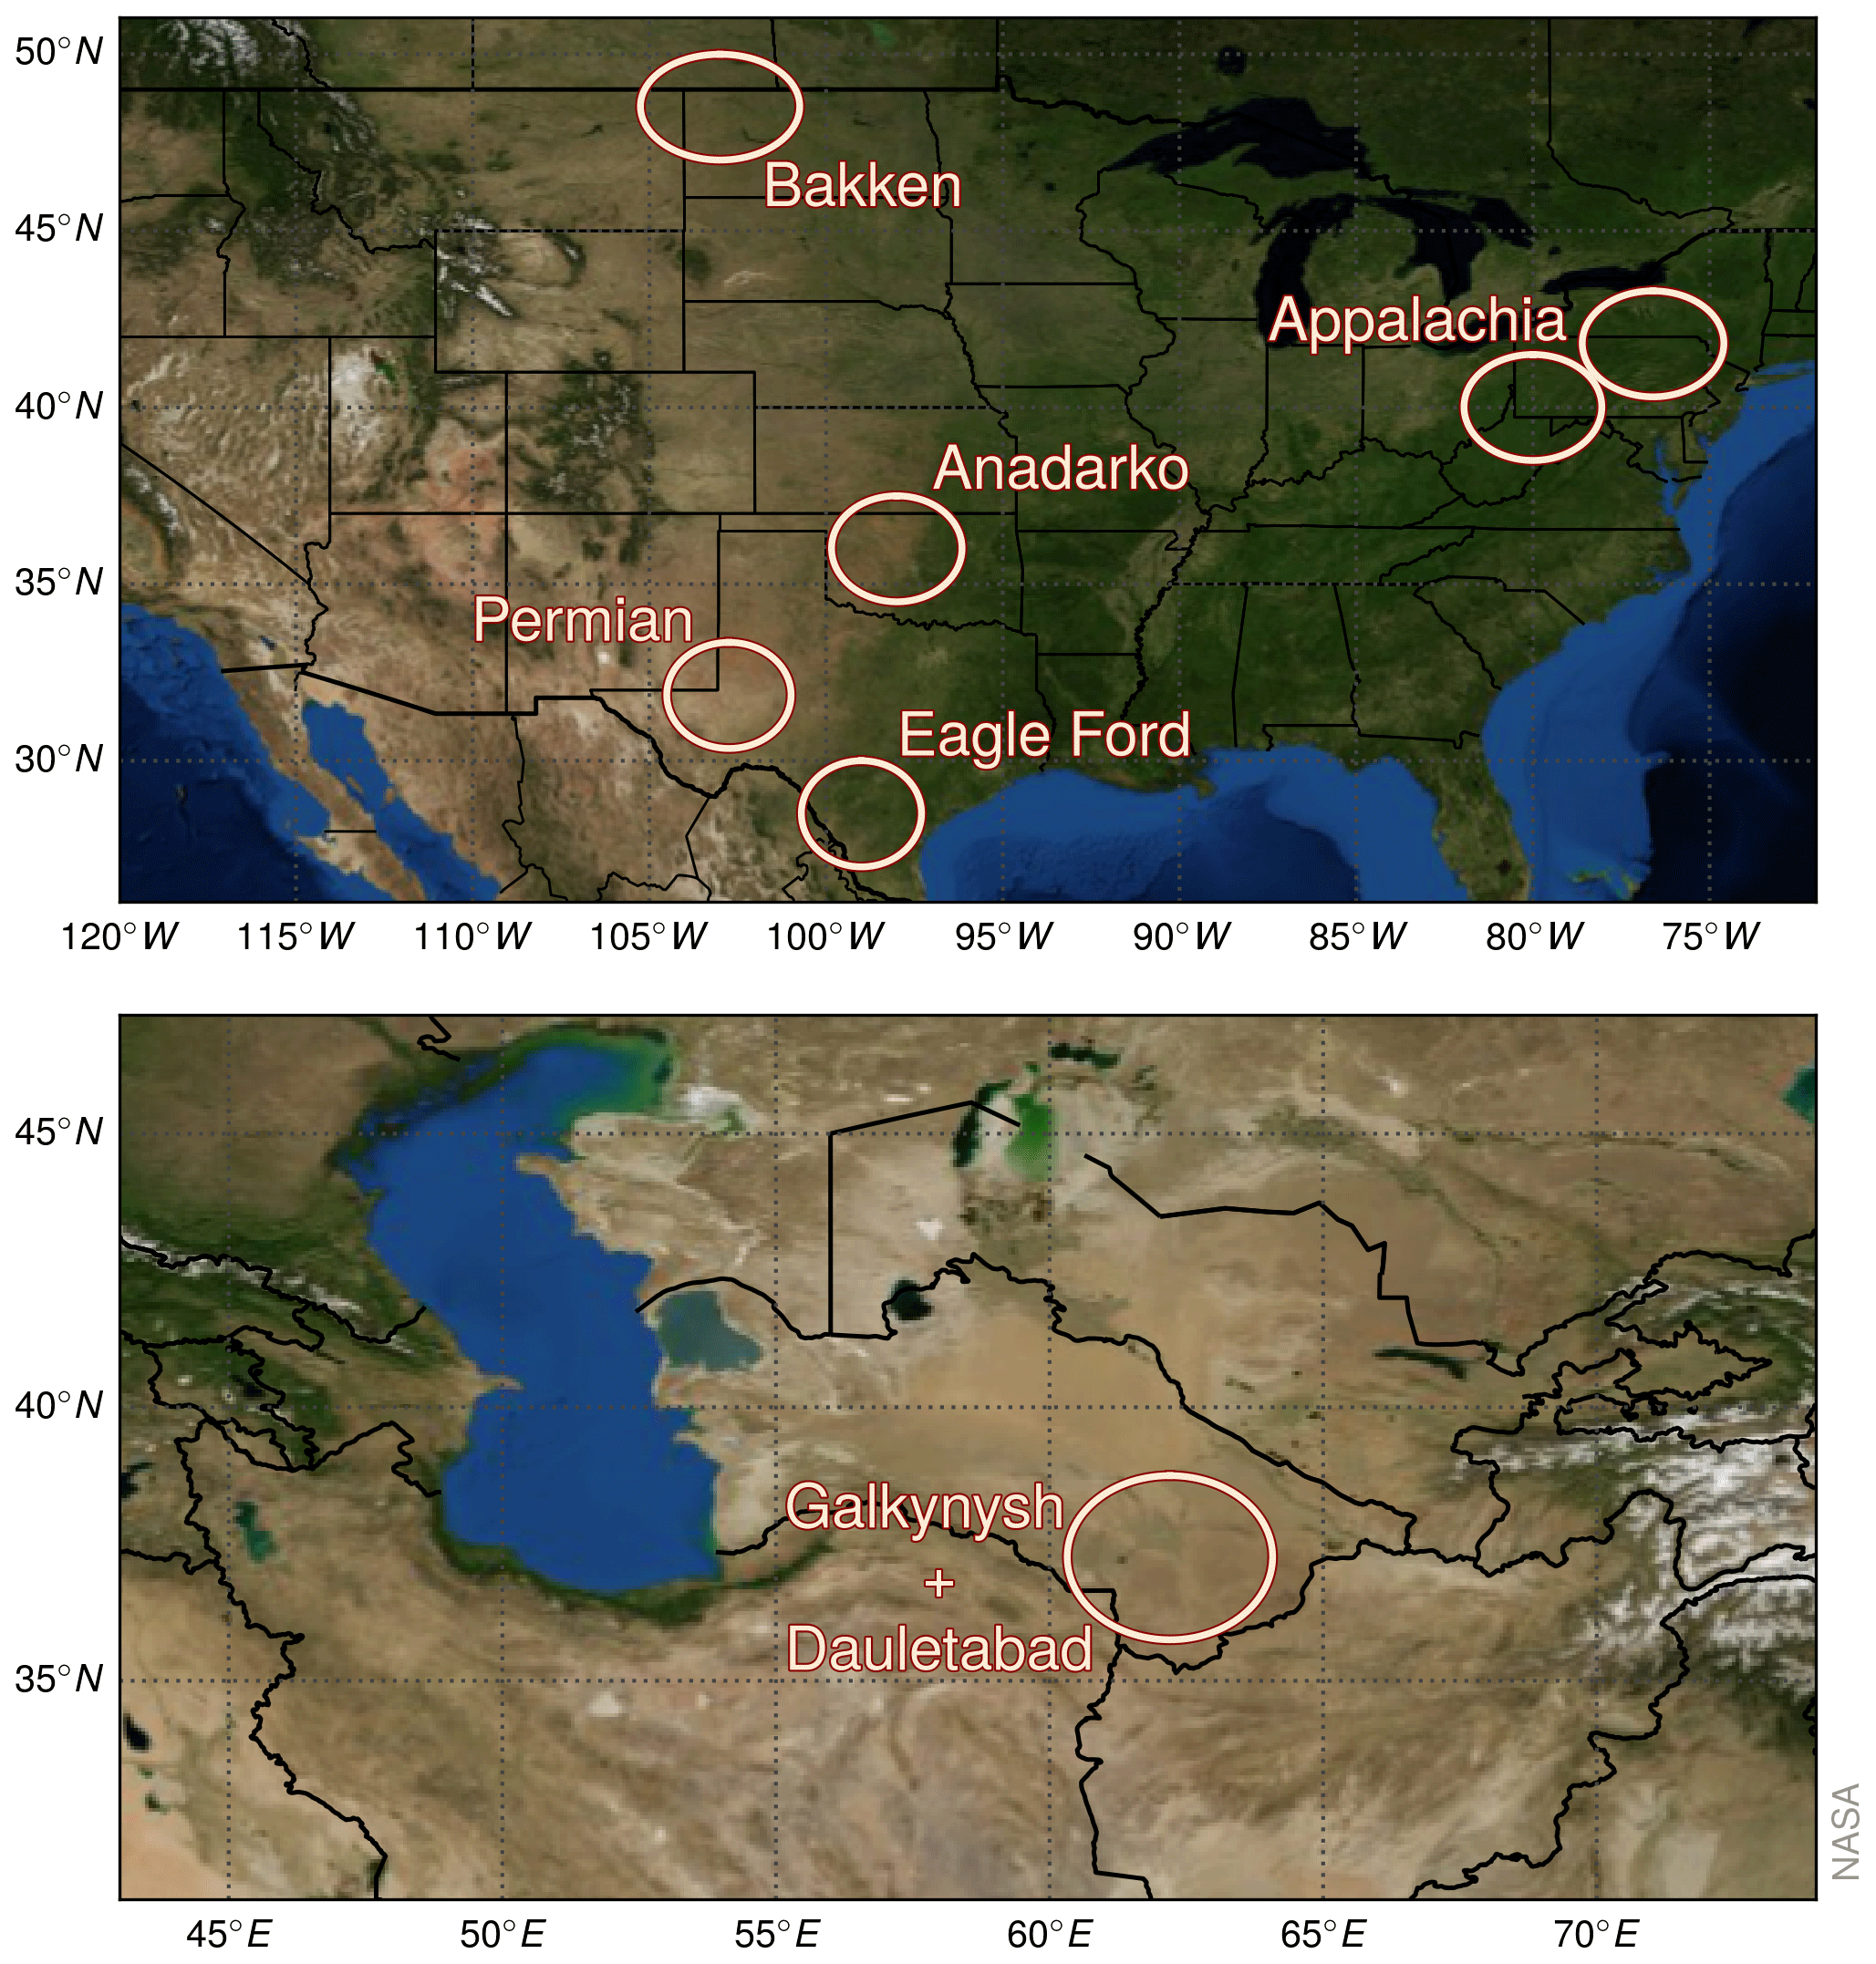
Figure 1Location of the analysed natural gas and oil production regions. Due to its large and elongated extent, the Appalachia region is split into two subregions. All circles have a radius of 166.5 km, corresponding to 1.5∘ after the coordinate transformation described in Sect. 2.
In this study, atmospheric methane abundances are retrieved from radiance measurements in the shortwave infrared (SWIR) spectral range of the TROPOMI instrument onboard the Sentinel-5 Precursor (Sentinel-5P) satellite using the latest version of the Weighting Function Modified DOAS (WFM-DOAS) algorithm (Buchwitz et al., 2006; Schneising et al., 2011) optimised to retrieve methane and carbon monoxide simultaneously (TROPOMI/WFMD v1.2) (Schneising et al., 2019).
Sentinel-5P was launched in October 2017 into a sun-synchronous orbit with an Equator crossing time of 13:30 local solar time. TROPOMI is a spaceborne nadir-viewing imaging spectrometer measuring solar radiation reflected by the Earth in a push-broom configuration. It has a swath width of 2600 km and combines high spatial resolution with daily global coverage. The nadir measurements in the SWIR have a horizontal resolution of 7×7 km2 and are sensitive to all altitude levels including the planetary boundary layer, which makes them well suited for the investigation of emissions from oil and gas fields. The retrieved TROPOMI/WFMD column-averaged dry air mole fractions of methane, XCH4, are characterised by a random error (precision) of 14.0 ppb and a systematic error (relative accuracy) of 4.3 ppb after quality filtering (Schneising et al., 2019).
The methane emission estimation is based on daily TROPOMI observations and a Gaussian integral method. For a fixed source region, quality-filtered daily XCH4 retrievals are automatically processed as described below. First the data given on geographical longitude and latitude are transformed to rotated coordinates so that zero meridian and Equator pass through the centre of the analysed region with the zonal direction matching the mean wind direction. The mean wind is defined as the average of all boundary layer winds within the region (as defined by the circles in Figs. 1, 4, 5, 7, 8, 10, and 11) and within the time window between 11:00 and 13:00 local time to take the wind history into account. Thereby, the boundary layer wind at a given time and place is defined as the pressure-weighted mean of winds for all layers within the boundary layer as obtained from the hourly European Centre for Medium-Range Weather Forecasts (ECMWF) ERA5 reanalysis product (Hersbach et al., 2018). The corresponding transformation of the coordinates and wind components is described in detail in Doms and Baldauf (2018). Similar approaches based on rotating individual satellite observations according to wind direction have also been used in the analysis of other atmospheric species (Valin et al., 2013; Pommier et al., 2013; Fioletov et al., 2015).
After rotating the coordinate system, the transformed daily data are gridded on a grid, and boxes with XCH4 below the 10th percentile within a radius of 700 km around the pivotal point are additionally excluded due to potential residual cloud cover that may occur occasionally (Schneising et al., 2019). The rotated coordinates have the following advantages: (1) the new grid is nearly rectangular, leading to an almost homogeneous distribution of grid points, (2) it is straightforward to compute the integral perpendicular to wind direction, which is needed in our flux estimation, and (3) multiple daily grid files can be easily combined into long-term averages because the wind always has the same orientation (left to right).
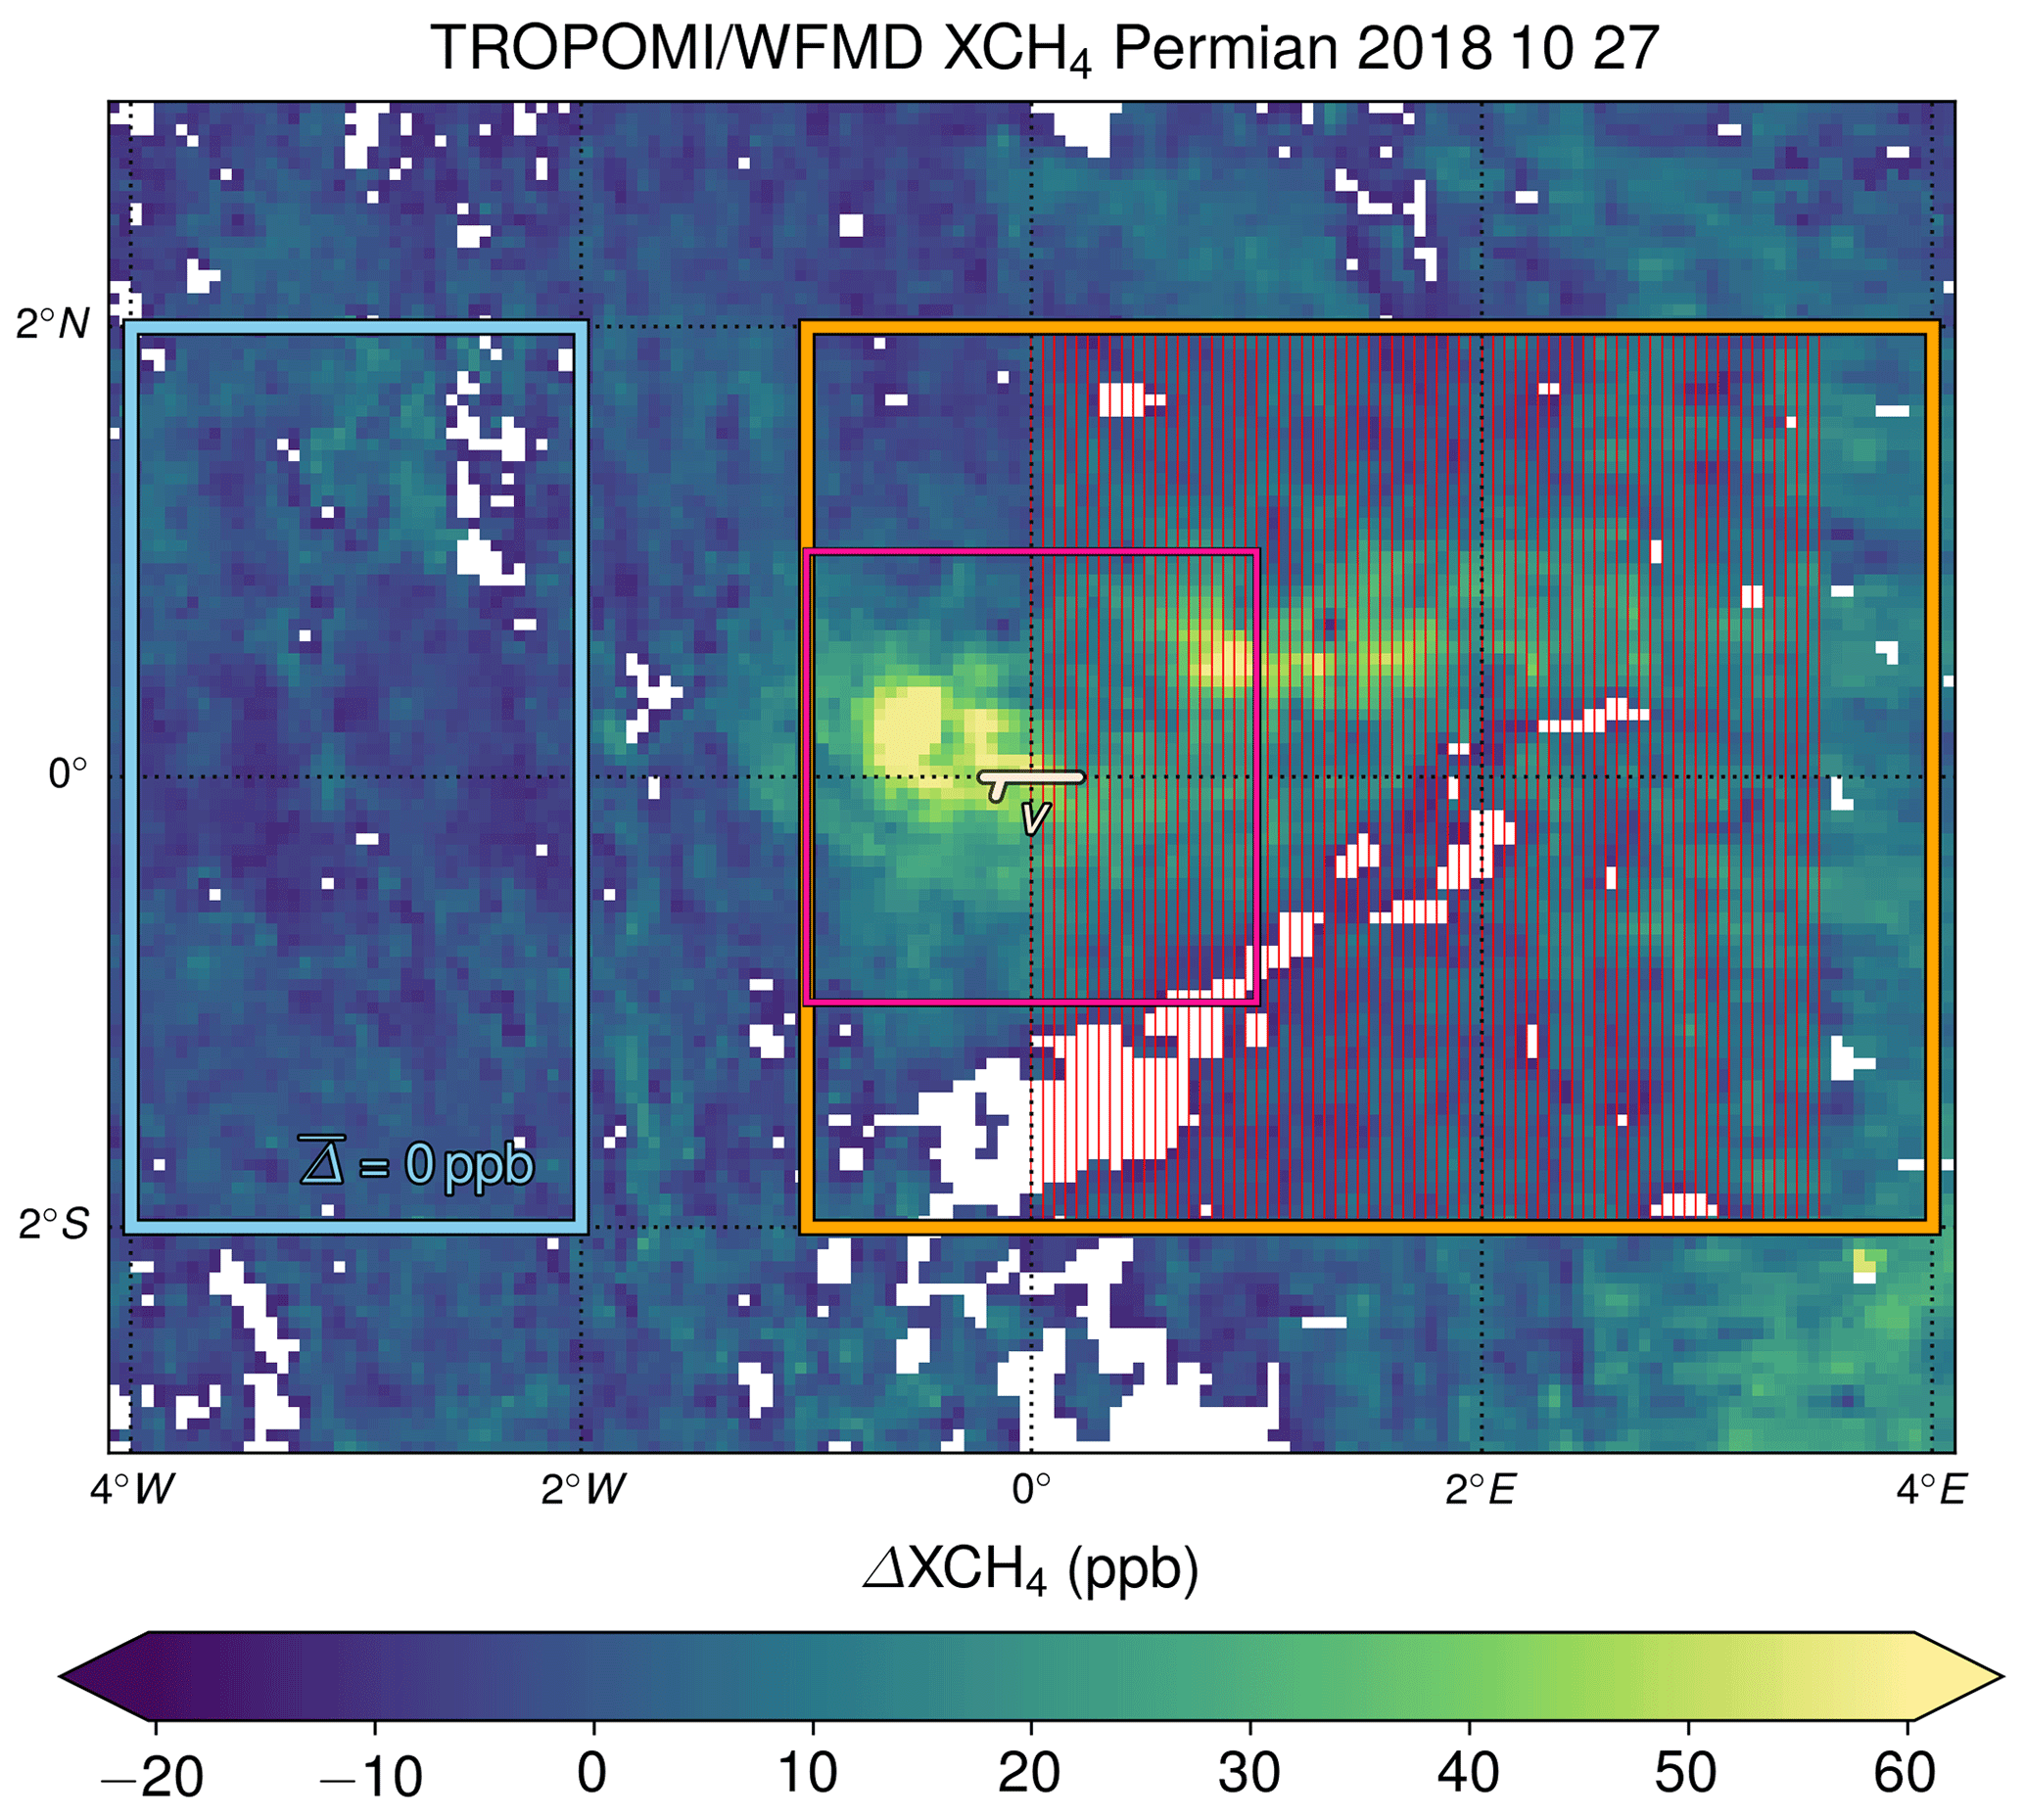
Figure 2Example daily data to illustrate the estimation of the emission. The coordinate system has been transformed so that the wind direction lies along the Equator. The background region is shown in sky blue, the plume region in orange, and the hot-spot region in pink. The extent of these regions is fixed for all analysed days in the rotated coordinate system. By design, the background region has a mean abundance of 0 ppb. The meridional sections used to calculate the daily flux are displayed in red.
After subtracting a mean background upwind of the source, the data look like the example shown in Fig. 2. The corresponding background region, which is highlighted in the figure, has the same position for all days and all investigated regions in the transformed coordinate system, and its suitability to enable a reliable emission estimate of the source region for a given day is automatically evaluated using certain selection criteria introduced below (see also Sect. 3.7 for an assessment of the exclusionary power of the filter criteria, including those concerning the background region). Let E be the total column enhancement (in units of mass per area) and v the mean boundary layer wind speed. To estimate the daily emission rate Φ, we calculate fluxes of the vector field Ev through cross sections perpendicular to wind direction (meridional red lines in Fig. 2) according to the divergence theorem; the flux through the other three sides of a rectangle surrounding the source region is assumed to be negligible (unit normals of the zonal boundaries are perpendicular to wind direction, and the upwind meridional boundary is in the background with E=0). The flux through the kth cross section is
Thereby, Δl is the size of a grid box (0.05∘ is equivalent to about 5 km near the Equator) and i corresponds to meridional summation along the kth red line. The molar mass of methane , the Avogadro constant , and the mean dry air column ρdry (in units of molecules per area) within a radius corresponding to 3∘ after the coordinate transformation are used to convert between the enhancement in XCH4 and the total column enhancement E; is the dimensionless near-surface averaging kernel (which is about 1.02 for all source regions analysed here) characterising the boundary layer sensitivity of the retrieval valid for the present mean altitude.
The average over all Φk then yields the final daily flux estimate Φ. Thereby, all Φk values with at least 60 % of all maximum available grid boxes existing along the kth meridional section are selected. If there are no such Φk values to average, there is no flux estimate for this specific day. Before averaging, the gaps of the selected Φk are filled according to a fitted linear combination of a Gaussian and a linear polynomial (see Fig. 3 for an example meridional section).

Figure 3Demonstration of the gap-filling procedure. For Φk with at least 60 % of all maximum available grid boxes along the meridional section, the gaps in the original data (blue) are filled (green) according to a fitted linear combination of a Gaussian and a linear polynomial (grey). The Φk values with less than 60% of data are not used in the estimation of the daily emissions. Shown here are the results for a specific k on an example day.
The corresponding total 1σ uncertainty uΦ is determined by the individual uncertainty components relative to the respective means via
with uv, abs being the standard deviation of all absolute boundary layer wind speed values over the selected region between 11:00 and 13:00 local time and uv, dir quantifying the uncertainty due to the maximal mean wind direction change in the considered 2 h time window of wind history; is the standard deviation of the dry air columns within the same region used to determine the mean value, and uE is the standard deviation of the enhancement integrals along the different meridional sections. For the regions under consideration in this study, the impact of topography (via ) is small compared to the other parameters contributing to the flux uncertainty (see Sect. 3.7).
Of all available days, those with a sufficient amount of data are selected to calculate the averaged long-term emission rate of the corresponding source region and the regional mean enhancement distribution. Thereby, at least 25 % of the background, plume, and hot-spot regions (see Fig. 2) must be filled with data after quality filtering in each case, and there have to be at least four cross sections with more than 60 % of data to average. As scenes with low wind speed may be dominated by diffusion and scenes with large wind velocity exhibit smaller column enhancements, additional criteria require that . Moreover, the enhancement distribution is required to be sufficiently uniform with respect to the Equator and in the background (10 ppb, 15 ppb, σ(Eb)<10 ppb) to minimise scenarios with potential residual cloudiness or a considerably wrong wind direction, where is the mean enhancement on the northern and southern half of the background and plume region, and σ(Eb) is the standard deviation of the enhancements in the background region. Furthermore, days with mean wind direction changes during the considered 2 h time window that are larger than 30∘ or with uncertainty estimates larger than 5 Mt yr−1 are additionally excluded. The corresponding uncertainty of the mean long-term emission rate is given via error propagation by the root sum square of the individual daily uncertainties uΦ divided by the number of effectively contributing days neff, which is smaller than the actual number of days due to expected correlation of neighbouring data points,
We assume uncorrelated data blocks with a length of 1 month; i.e. neff is the number of months containing emission estimates contributing to the mean.
The associated long-term leakage rate is then calculated by normalising the estimated emissions by the combined oil and gas gross production of the considered region in terms of energy content (Schneising et al., 2014). In order to express the leakage rate as a percentage, emission (dividend) and production (divisor) are converted to the same units (energy per time, see Table 1). To quantify the combined production, the natural gas is converted to barrel of oil equivalent (BOE) by using a factor depending on its energy content. Although the exact conversion factor varies slightly with the specific composition of the natural gas, we use the widely used relationship of 6000 cubic feet per BOE (U.S. Energy Information Administration, 2019). To convert between emitted CH4 mass and natural gas volume in cubic feet via the ideal gas law, we assume standard natural gas reference conditions (International Organization for Standardization, 1996) (T=288.15 K, p=1013.25 hPa) and a CH4 content of 93 % in natural gas (U.S. Environmental Protection Agency, 2019b) with a realistic range of 87 %–99 % for high-caloric gas. Please note that all comparative leakage rates presented here (e.g. the bottom-up and airborne-based estimates) were also calculated as or converted to combined energy loss rates to make them comparable to our estimates.
For a production mixture of oil and gas the break-even rate of about 3 % estimated in the literature for gas-only production (Alvarez et al., 2012; Farquharson et al., 2016) has to be reduced as oil produces more CO2 per unit of energy than natural gas. The fuel-related emission factors for bituminous coal, crude oil, and natural gas are 95, 73, and 56 tCO2 TJ−1 (Intergovernmental Panel on Climate Change, 2006). Thus, oil has about 56 % of the emission-saving potential of natural gas when replacing coal. As the maximal share of oil in the production mixtures of the analysed production regions is 75 % (see Sect. 3 and Table 1), the smallest occurring compensation value of all considered mixtures is assumed to be . Consequently, we assume a break-even range of 2 %–3 % to achieve immediate climate benefit when switching from coal-based to a typical mixture of gas- and petroleum-based energy generation for a natural gas share between 25 % and 100 %.
The top five producing basins in the United States during 2018/2019 in order of combined oil and gas production in terms of energy content were the Permian, Appalachian, Eagle Ford, Bakken, and Anadarko (U.S. Energy Information Administration, 2020), which are therefore potential candidates for our approach. As rotation in wind direction is an important element in the presented method, nearly rotation-symmetrical basins such as the Permian, Bakken, and Anadarko are best suited for the analysis. Due to its large and elongated extent, the Appalachia region is split into two subregions. The tubular shape of Eagle Ford, with almost linearly arranged sources, and its proximity to the offshore sources in the Gulf of Mexico complicate the analysis for this region. We also consider Galkynysh and Dauletabad, which are two of the world's largest natural gas fields located in Turkmenistan, to put the American results into a global context.
3.1 Permian
The Permian is a sedimentary basin in western Texas and eastern New Mexico. It has become one of the most productive oil-producing regions in the world and is by far the most prolific oil field in the United States. In the recent past, the share of natural gas has been increasing as wells get older and fewer new wells are drilled. The average production in the period 2018/2019 was 3897 thousand barrels of oil (Mbbl) and 13 182 million cubic feet (MMcf) of natural gas per day (U.S. Energy Information Administration, 2020), corresponding to a total combined energy production of 6094 kBOE d−1 (kilo barrel of oil equivalent per day). Thus, the production mix consists of about 65 % oil and 35 % natural gas. The Permian is subdivided into two major lobes with unconventional oil and gas production, the Delaware and the Midland Basin, which are separated by the Central Basin Platform dominated by conventional production. The qualitative detection of daily methane enhancements for the Permian has recently been demonstrated using TROPOMI measurements (de Gouw et al., 2020). Usually, the methane emissions of the Delaware Basin and Midland Basin are detected independently in daily satellite data (for example in Fig. 2). The averaged enhancement distribution for the period 2018/2019 and the daily emission estimates are shown in Fig. 4. The associated mean emission estimate for this period is 3.18±1.13 Mt yr−1, corresponding to a fugitive emission rate of 1.3±0.5 % relative to combined oil and gas energy production, which is slightly larger than the national bottom-up estimate of the EPA (0.9 % [0.5–1.2;2σ]) but consistent with Alvarez et al. (2018) (1.4 % [1.1–1.6;2σ]) and likely below the break-even leakage rate for immediate climate benefit.
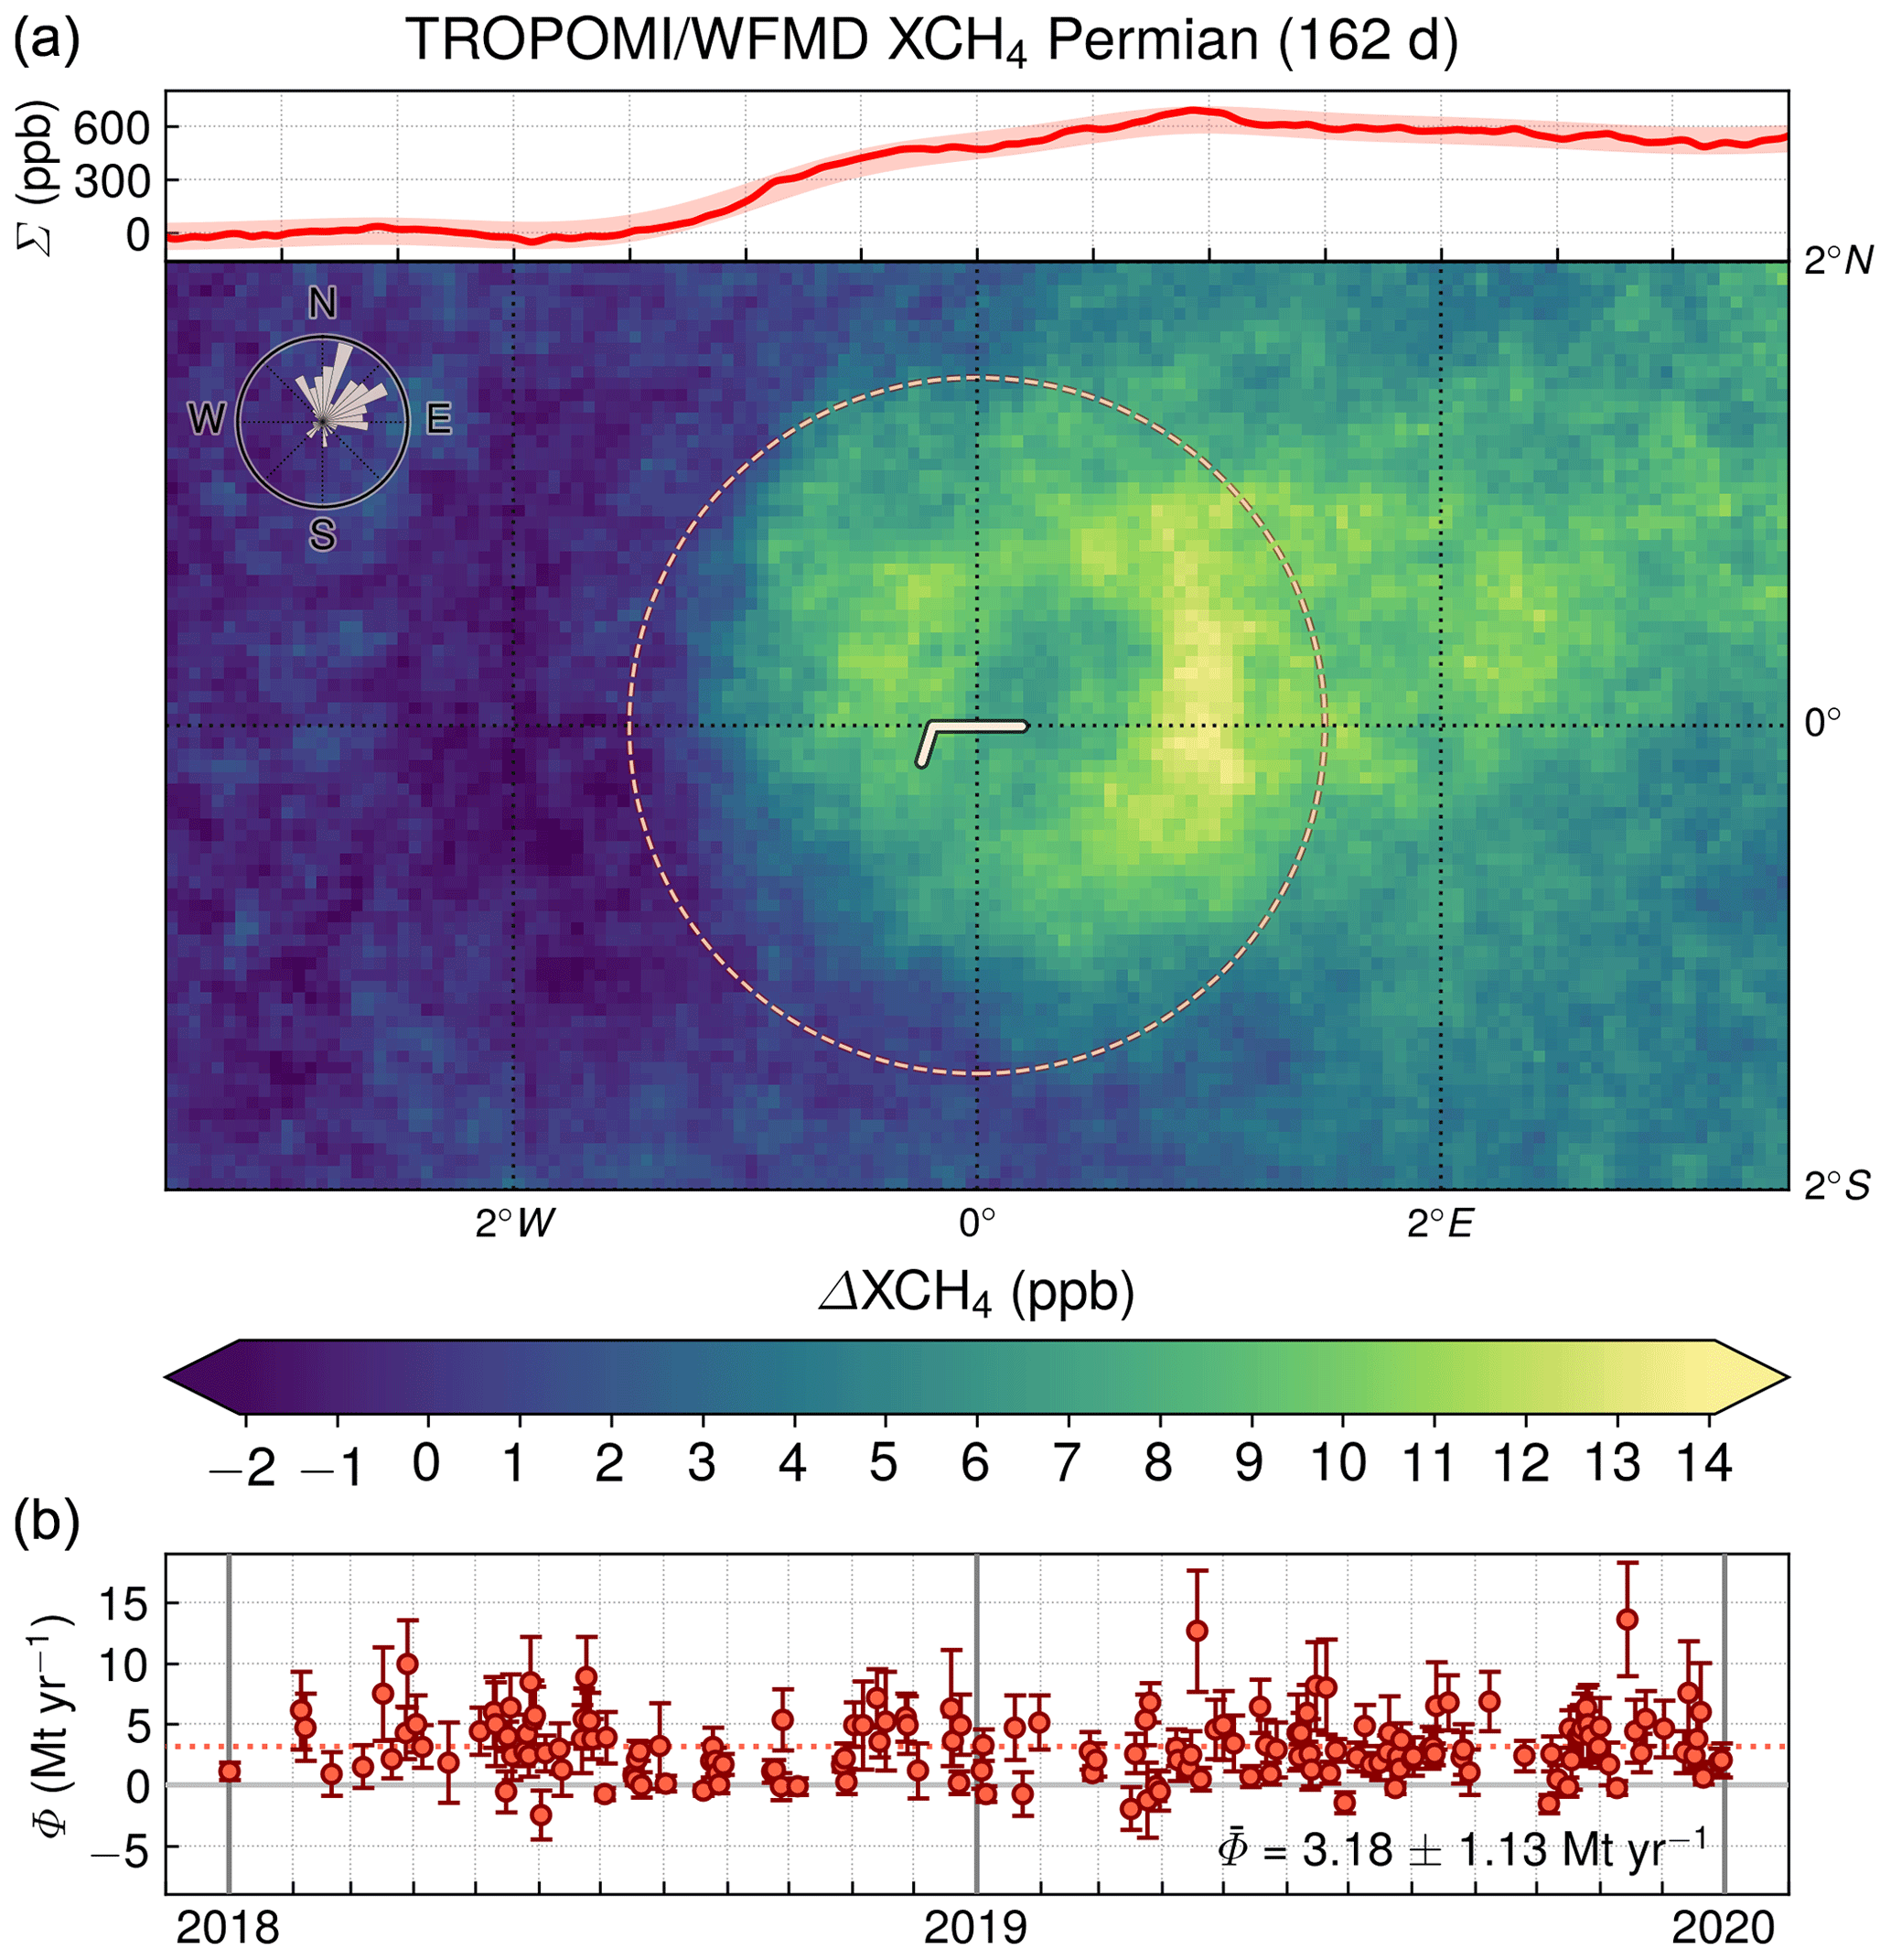
Figure 4Averaged enhancement distribution with associated integrated enhancement along the meridional sections (a) and daily emission estimates Φ (b) for the Permian Basin. The coordinates of the pivotal point are 31.85∘ N and 102.75∘ W; the radius of the circle highlighting the approximate basin extent is 166.5 km, corresponding to 1.5∘ after the coordinate transformation. The daily Φ values are used to determine the mean emission , which corresponds to a fugitive emission rate of 1.3±0.5 %. The distribution of the associated original daily wind directions (defined as the direction in which the wind blows) can be seen in the overlaid wind rose in the upper left corner.
Concurrent with our study, Zhang et al. (2020) also quantified methane emissions from the Permian Basin using a different data set and an alternative inversion method combining information from the operational TROPOMI methane product and prior emission estimates within a Bayesian framework. Despite these quite distinct approaches, their total emission estimate of 2.9±0.5 Mt yr−1 based on satellite observations from May 2018 to March 2019 agrees within uncertainties with our estimate. If we restrict our analysis to this specific period, the consistency becomes even better and we get the almost identical estimate of 2.8 Mt yr−1 with our method, which is independent of prior knowledge. Therefore, the corresponding absolute results are considered very robust. However, there is a crucial difference in the calculation and subsequent interpretation of the leakage rate: while our rate (1.3 %) is calculated relative to combined oil and gas production in terms of energy content (Schneising et al., 2014), the rate of Zhang et al. (2020) is larger (3.7 %) and appears more alarming because it is put in relation to natural gas production only. With this alternative divisor we would also get a leakage rate of 3.7 % (as can be determined from Table 1). But as the Permian is dominated by oil production, we consider the total energy approach to be better suited to assess the climate impact compared to coal in general. Otherwise, the energy content of the extracted oil would be neglected and a pure oil play (with an infinitesimal fraction of not marketed but vented natural gas) would have a leakage rate of 100 %. For a pure natural gas play, however, both approaches to determine the leakage rate coincide.
3.2 Bakken
The Bakken formation is the second-largest oil-producing region in the United States, with production mainly concentrated in North Dakota. The oil and natural gas in the Bakken are locked in rock reservoirs with low permeability, and unconventional drilling methods were necessary to transform the formation into a prolific production region. The production mix consists of about 75 % oil and 25 % natural gas, and the average production in the period 2018/2019 was 1361 Mbbl of oil and 2661 MMcf of natural gas per day (U.S. Energy Information Administration, 2020), corresponding to a total combined energy production of 1805 kBOE d−1. The determined mean emission estimate for the period 2018/2019 is 0.89±0.56 Mt yr−1. As can be seen in Fig. 5, the associated averaged enhancement distribution is noisier due to fewer contributing days and does not show a plume structure as clear as in the case of the Permian. Together with the large relative uncertainty, this suggests that the emissions of the Bakken are close to the detection limit for daily data. The estimated emissions correspond to a fugitive emission rate of 1.3±0.8 % relative to combined oil and gas energy production, which is consistent with Alvarez et al. (2018) and slightly larger than the national EPA bottom-up estimate. The rate is likely below the break-even rate, but the error bars extend into the break-even range. The derived leakage rate is also consistent with the energy loss rates of 1.6±0.5 % and 1.4±0.5 % estimated for the Bakken from airborne data taken in May 2014 (Peischl et al., 2016) and April 2015 (Peischl et al., 2018). The respective airborne-based estimates were originally specified as leakage rates relative to natural gas production only and have been converted to rates relative to combined oil and gas production in terms of energy content in each case by considering the natural gas fraction of 25 % in the production mix of the Bakken to make the estimates directly comparable to our estimates. The Bakken estimate from this study is smaller than previously derived satellite-based leakage rates for the time period 2009–2011, which were estimated to be 10.1±7.3 % for this early phase of hydraulic fracturing (Schneising et al., 2014). Although the corresponding uncertainties of both satellite studies for the Bakken are large, the reduction of relative leakage over time suggests that the climate footprint of the oil and gas industry can be improved by adopting new technologies and that efforts to reduce fugitive methane emissions have been successful. The systematic measures proactively implemented by coalitions of oil and gas companies since 2014 to continuously reduce methane emissions include additional leak detection and repair campaigns, replacement or upgrade of high-emitting devices, and reduction of venting or flaring toward the ambitious goal of achieving a leakage rate not exceeding 1 % across the natural gas supply chain (including a maximum of 0.3 % from upstream operations) by 2025 (ONE Future, 2019; Oil and Gas Climate Initiative, 2019). An illustration of the decreasing leakage rates derived from satellite and airborne measurements in the discussed publications is shown together with the assumed break-even range for immediate climate benefit in Fig. 6.
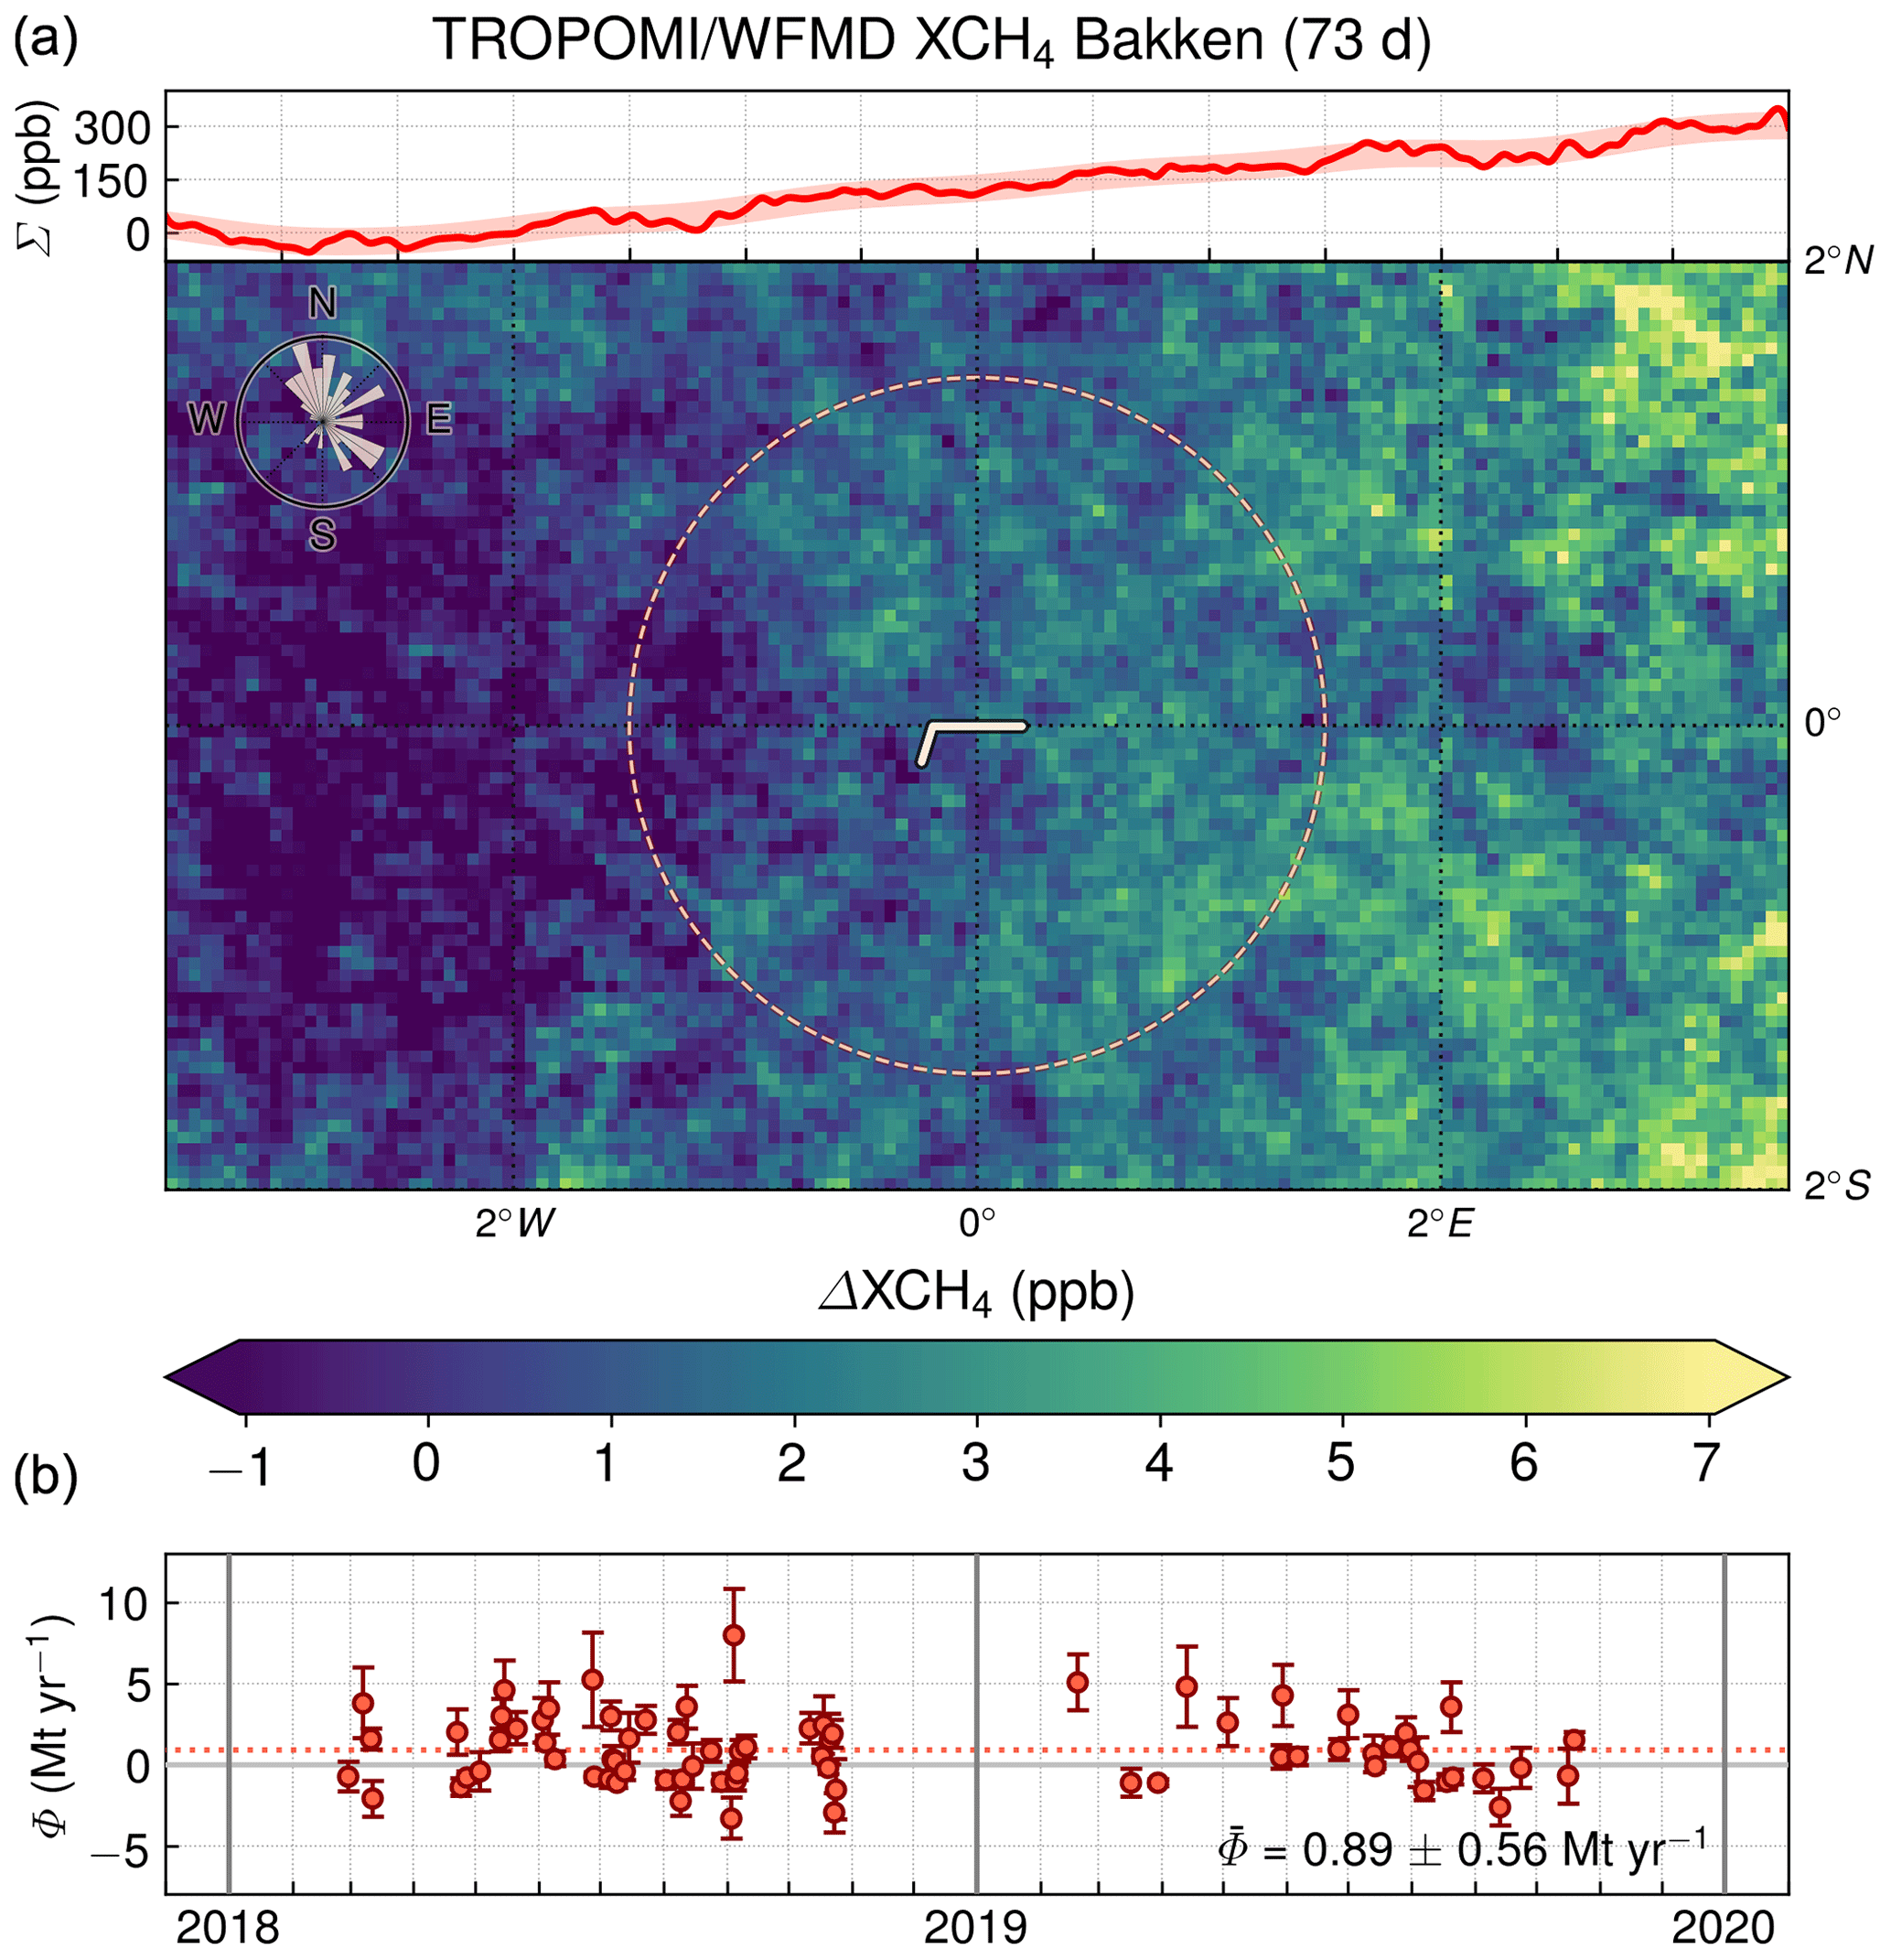
Figure 5As Fig. 4 but for the Bakken formation. The coordinates of the pivotal point are 48.5∘ N, 103∘ W. The mean emission estimate corresponds to a fugitive emission rate of 1.3±0.8 %.
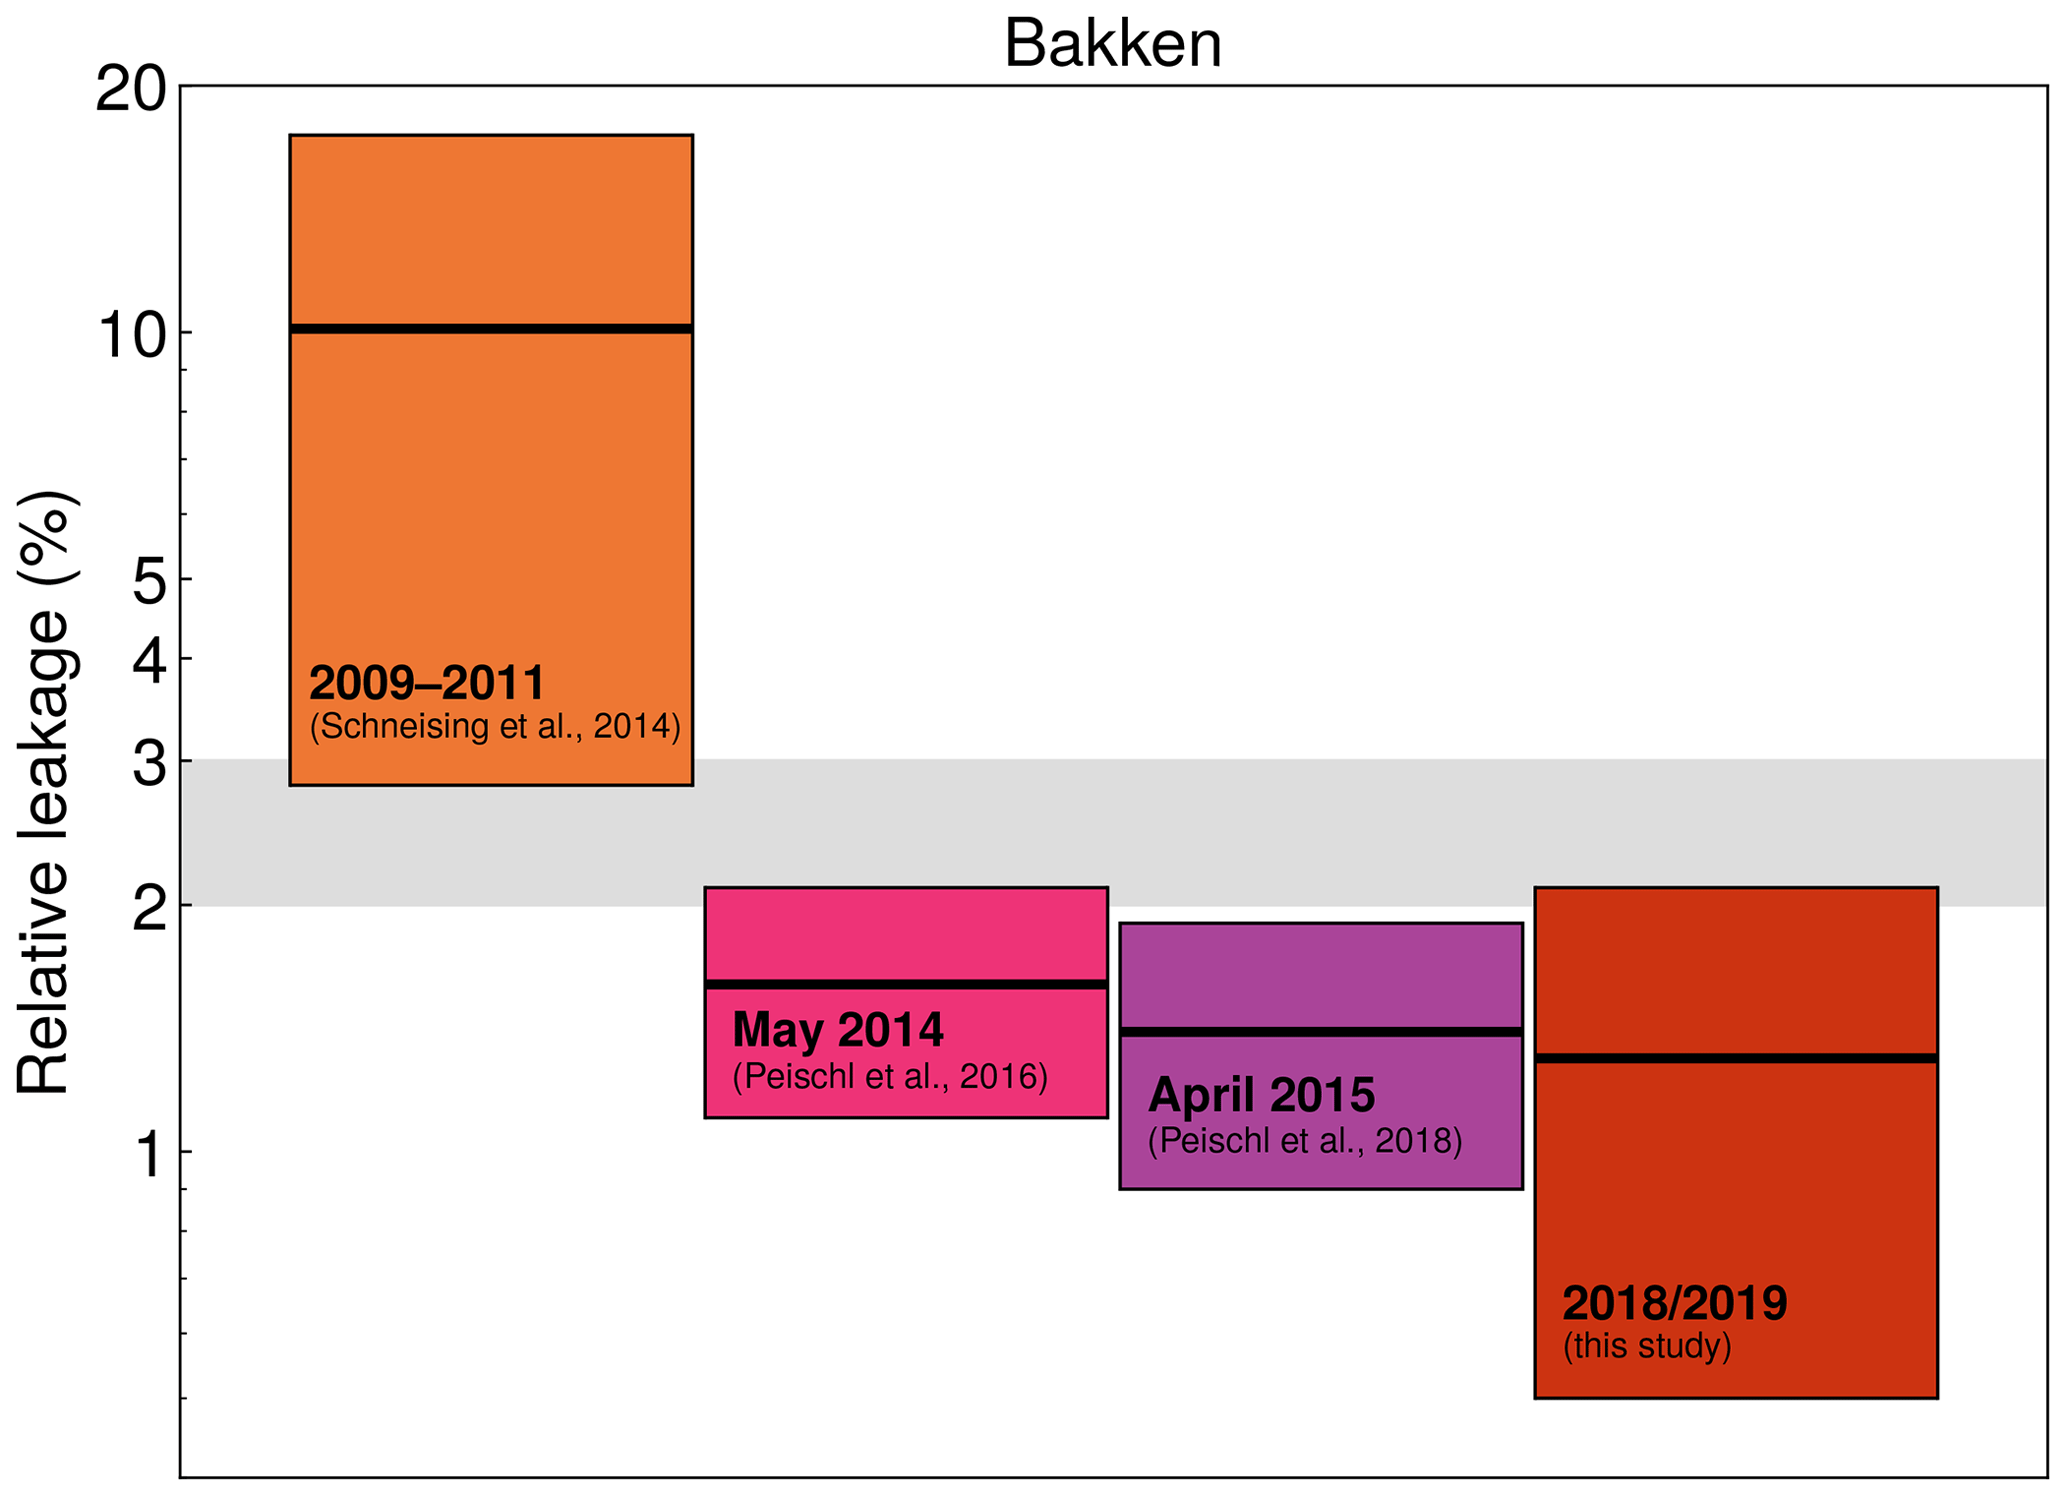
Figure 6Comparison of fugitive emission rates for the Bakken formation from different studies with a reduction of relative leakage over time. See main text for details. The assumed break-even range for immediate climate benefit is shown in grey.
3.3 Appalachia
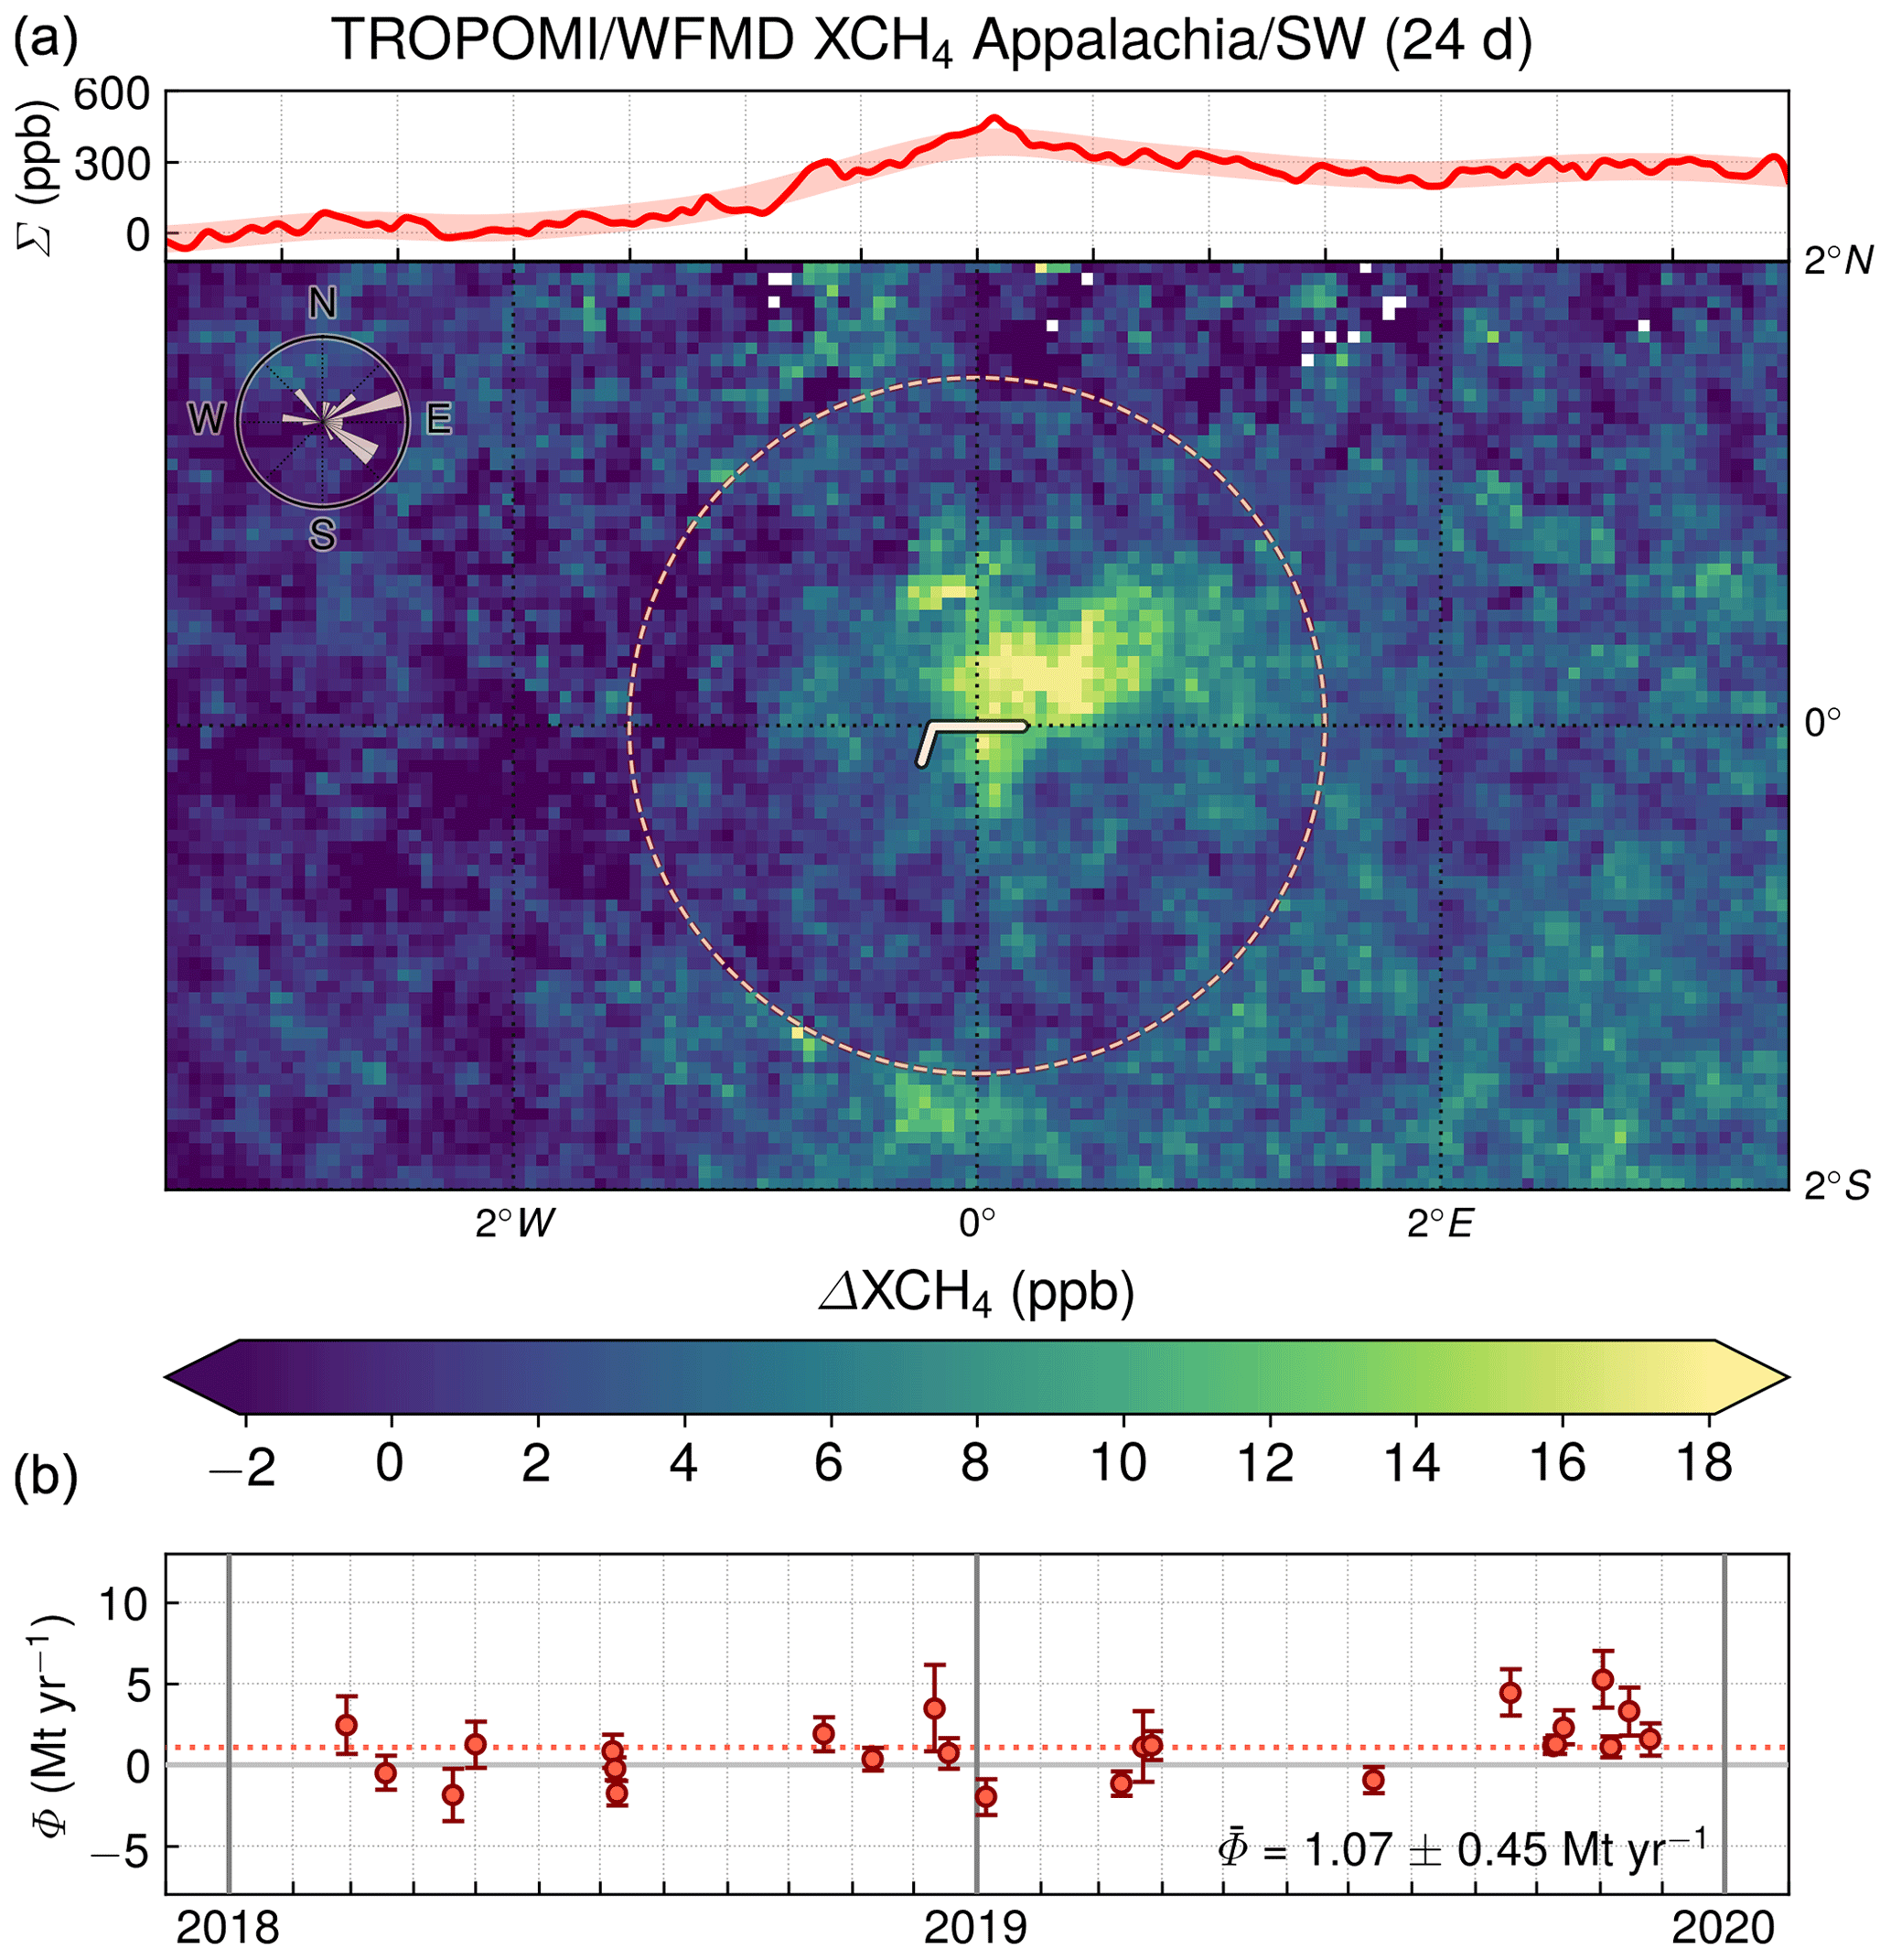
The Appalachia region in eastern North America consists of several stacked formations, most prominently the Marcellus and Utica shale plays. The region drives the overall increase in United States natural gas production. The Marcellus shale is a unit of sedimentary rock and the most productive natural-gas-producing formation in the Appalachian Basin. The older Utica and Point Pleasant formations extend below the Marcellus shale and the Upper Devonian shale above it. Unconventional drilling in the Appalachian is mainly focused on two hot-spot regions in the southwestern and northeastern part of Pennsylvania. These two regions are analysed separately due to the large and elongated extent of the basin. The average production of the Appalachia region during 2018/2019 was 30 312 MMcf of natural gas and 127 Mbbl of oil per day (U.S. Energy Information Administration, 2020), corresponding to a total combined energy production of 5179 kBOE d−1. Thus, the production mix is strongly gas driven, with 98 % natural gas and only 2 % oil. The averaged enhancement distribution during 2018/2019 for the southwestern part of the Appalachia region and the daily emission estimates are shown in Fig. 7. The associated mean emission estimate is 1.07±0.45 Mt yr−1. The corresponding estimation for the northeastern part is 1.29±0.43 Mt yr−1. Thus, the mean emission for the complete Appalachia region amounts to 2.36±0.88 Mt yr−1. However, it has to be noted that there are only a few days contributing to this emission estimate, namely 24 d for the southwestern and 10 d for the northeastern part of the Appalachian. The derived emissions are equivalent to a fugitive emission rate of 1.2±0.4 %, which is consistent with the bottom-up estimates and likely below the compensation point for a climate benefit on all time frames. The leakage rate inferred from satellite measurements of XCH4 is higher than the loss rate of 0.3±0.1 % estimated for the northeastern Marcellus from airborne data taken in July 2013 (Peischl et al., 2015). Although this airborne estimate was specified as a leakage rate relative to natural gas production only, it can be compared directly to our estimate because the Appalachia region is strongly gas driven (98 %), and conversion to a rate relative to combined oil and gas production in terms of energy content thus has only a marginal impact.
3.4 Eagle Ford
The Eagle Ford Shale is a geological formation in southern Texas, which extends from the Mexican border to the northeast in a tubular shape. The brittleness of the rock in the high-carbonate areas in the western part of the formation makes it more conducive to hydraulic fracturing, and a lot of capital has been invested to develop its unconventional hydrocarbon extraction. The production mix consists of about 55 % oil and 45 % natural gas, and the average production in the period 2018/2019 was 1344 Mbbl of oil and 6674 MMcf of natural gas per day (U.S. Energy Information Administration, 2020), corresponding to a total combined energy production of 2456 kBOE d−1. Due to its shape, with almost linearly arranged sources and proximity to significant offshore sources in the Gulf of Mexico (Yacovitch et al., 2020), the introduced approach is challenging in the case of Eagle Ford. To avoid the background being impacted by the offshore sources, wind directions blowing towards the northwest (between north and west) were additionally excluded. As a consequence, almost all summer days on which the winds mainly blow off the sea are filtered out, leaving only 25 d for analysis (see Fig. 8). The associated mean emission estimate for the period 2018/2019 is 1.37±0.63 Mt yr−1, corresponding to a leakage rate of 1.4±0.7 %, which is consistent with Alvarez et al. (2018) and slightly larger than the national EPA bottom-up estimate. Although the estimated fugitive emission rate is below 2 %, the error bars extend into the break-even range. The derived leakage rate is also consistent with estimates based on airborne data taken in April 2015 (Peischl et al., 2018), which report a mean loss rate of 2.6±0.9 % relative to natural gas production. This corresponds to an energy loss rate of 1.2±0.4 % when taking the natural gas share of 45 % in the production mix into account. As in the case of the Bakken, the Eagle Ford estimate from this study is smaller than previously derived satellite-based leakage rates for the time period 2009–2011, which were estimated to be 9.1±6.2 % (Schneising et al., 2014), suggesting that the emissions have been reduced by improving the technological standards since the early phase of hydraulic fracturing. An illustration of the decreasing leakage rates derived from satellite and airborne measurements in the discussed publications is shown together with the assumed break-even range for immediate climate benefit in Fig. 9.
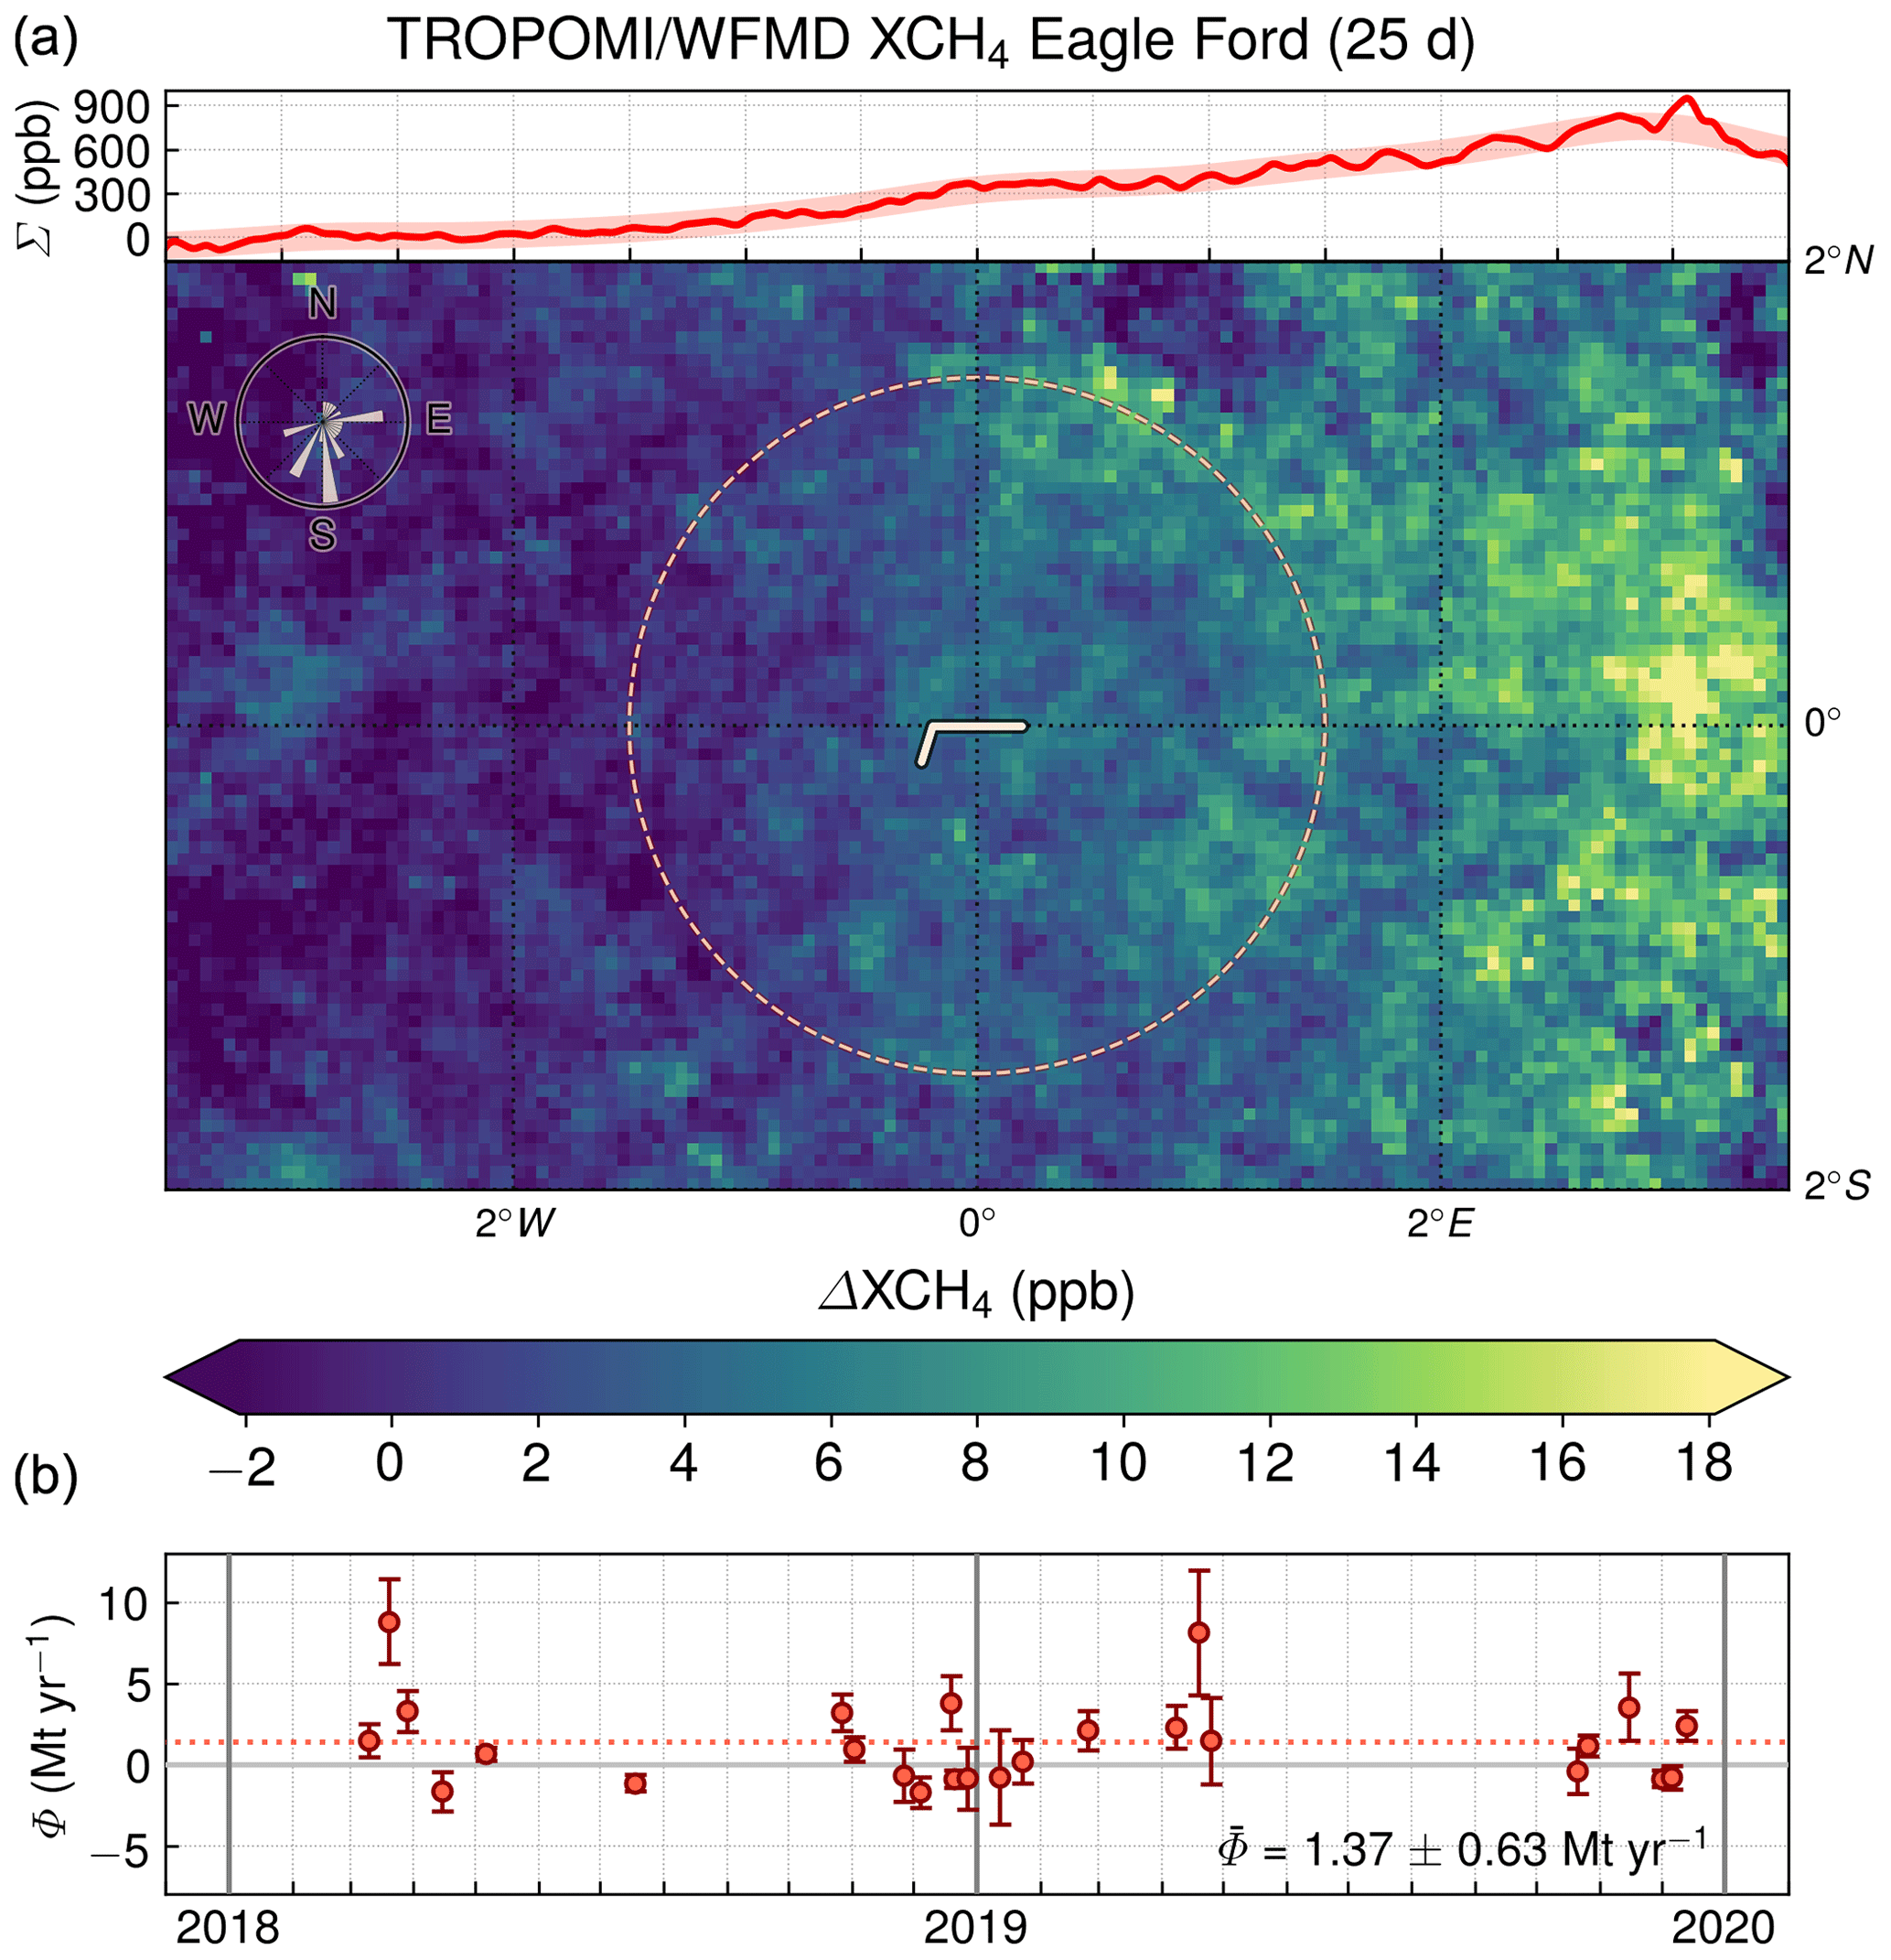

Figure 9Comparison of fugitive emission rates for the Eagle Ford Shale from different studies with a reduction of relative leakage over time. See main text for details. The assumed break-even range for immediate climate benefit is shown in grey.
3.5 Anadarko
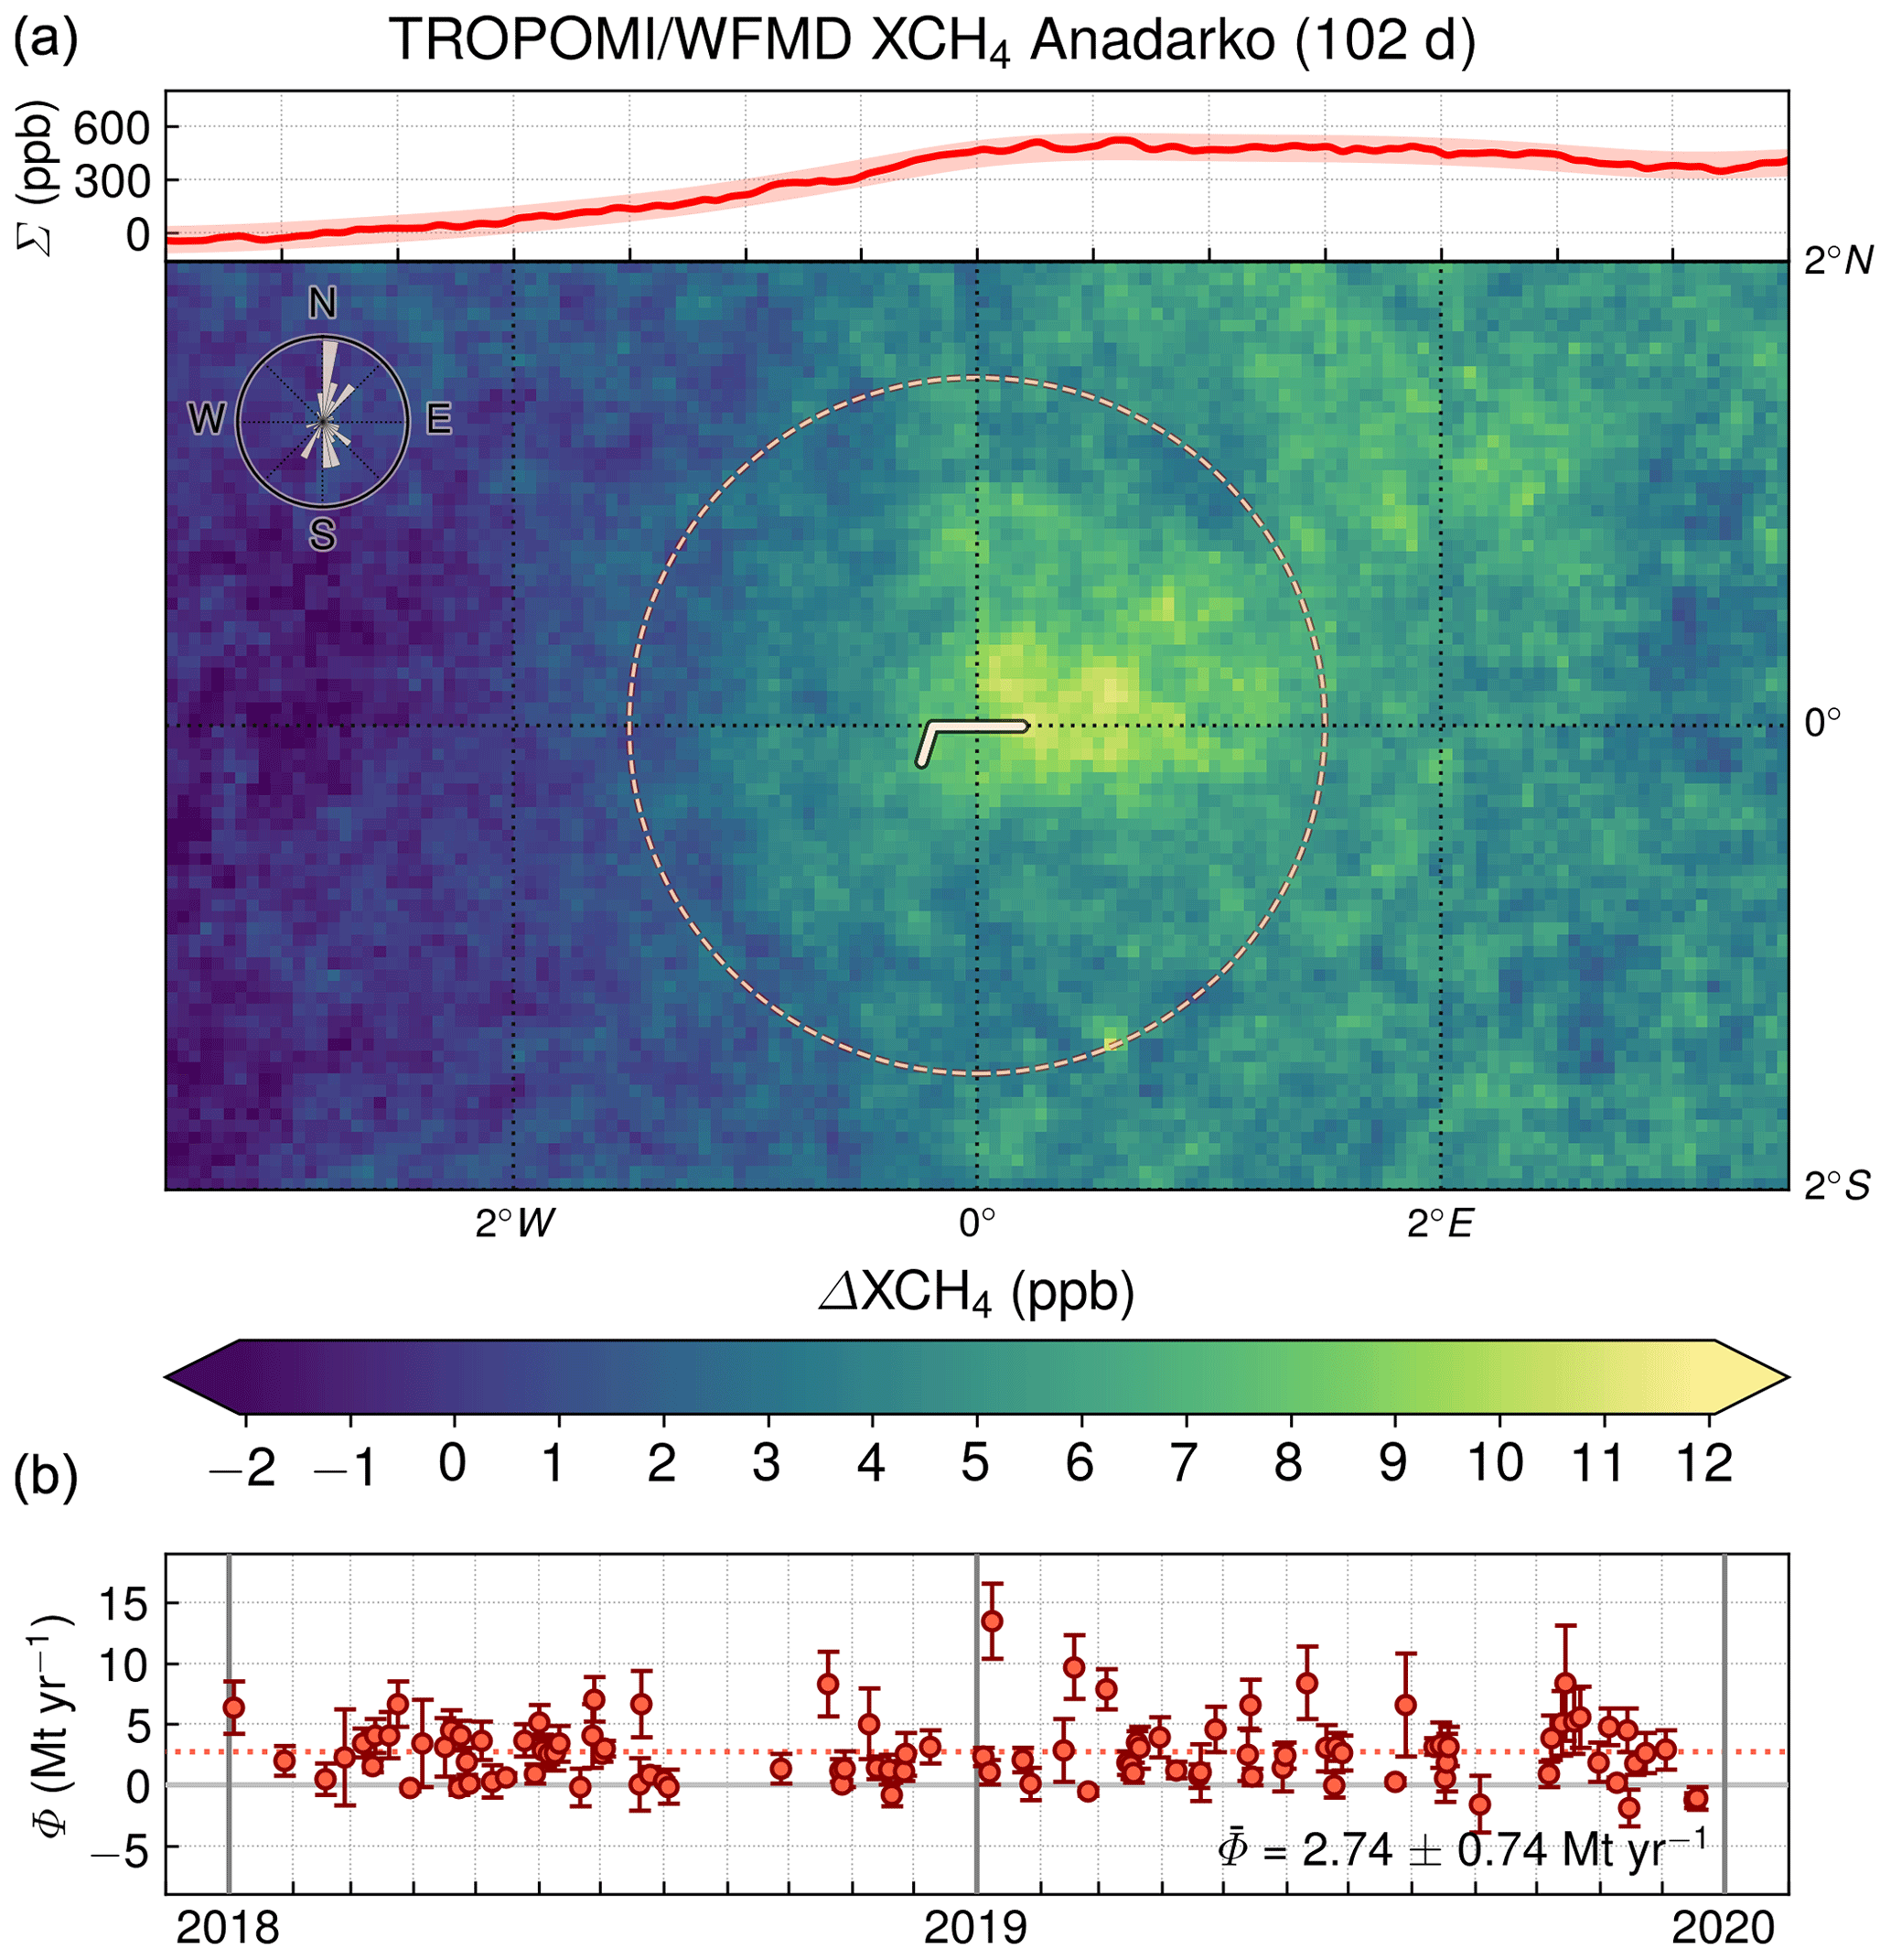
The Anadarko Basin is located in the western part of Oklahoma and the bordering states. It is one of the most prolific natural gas production regions in North America and is just beginning to exploit its unconventional production potential. It is an attractive target for operators as it contains many stacked plays overlapping in large parts of the basin, allowing access to multiple targets from one well pad. The average production in the period 2018/2019 was 7421 MMcf of natural gas and 548 Mbbl of oil per day (U.S. Energy Information Administration, 2020), which corresponds to a total production of 1785 kBOE d−1 and a production mix of about 70 % natural gas and 30 % oil. The averaged enhancement distribution for the period 2018/2019 and the daily emission estimates are shown in Fig. 10. The mean emission estimate of 2.74±0.74 Mt yr−1 corresponds to a leakage rate of 3.9±1.1 %, which is considerably larger than for the other analysed production regions in the United States and likely exceeds the break-even rate for immediate climate benefit. It rather corresponds to the break-even rate for a 20-year time horizon and a scenario without carbon capture and sequestration (Farquharson et al., 2016).
3.6 Galkynysh and Dauletabad
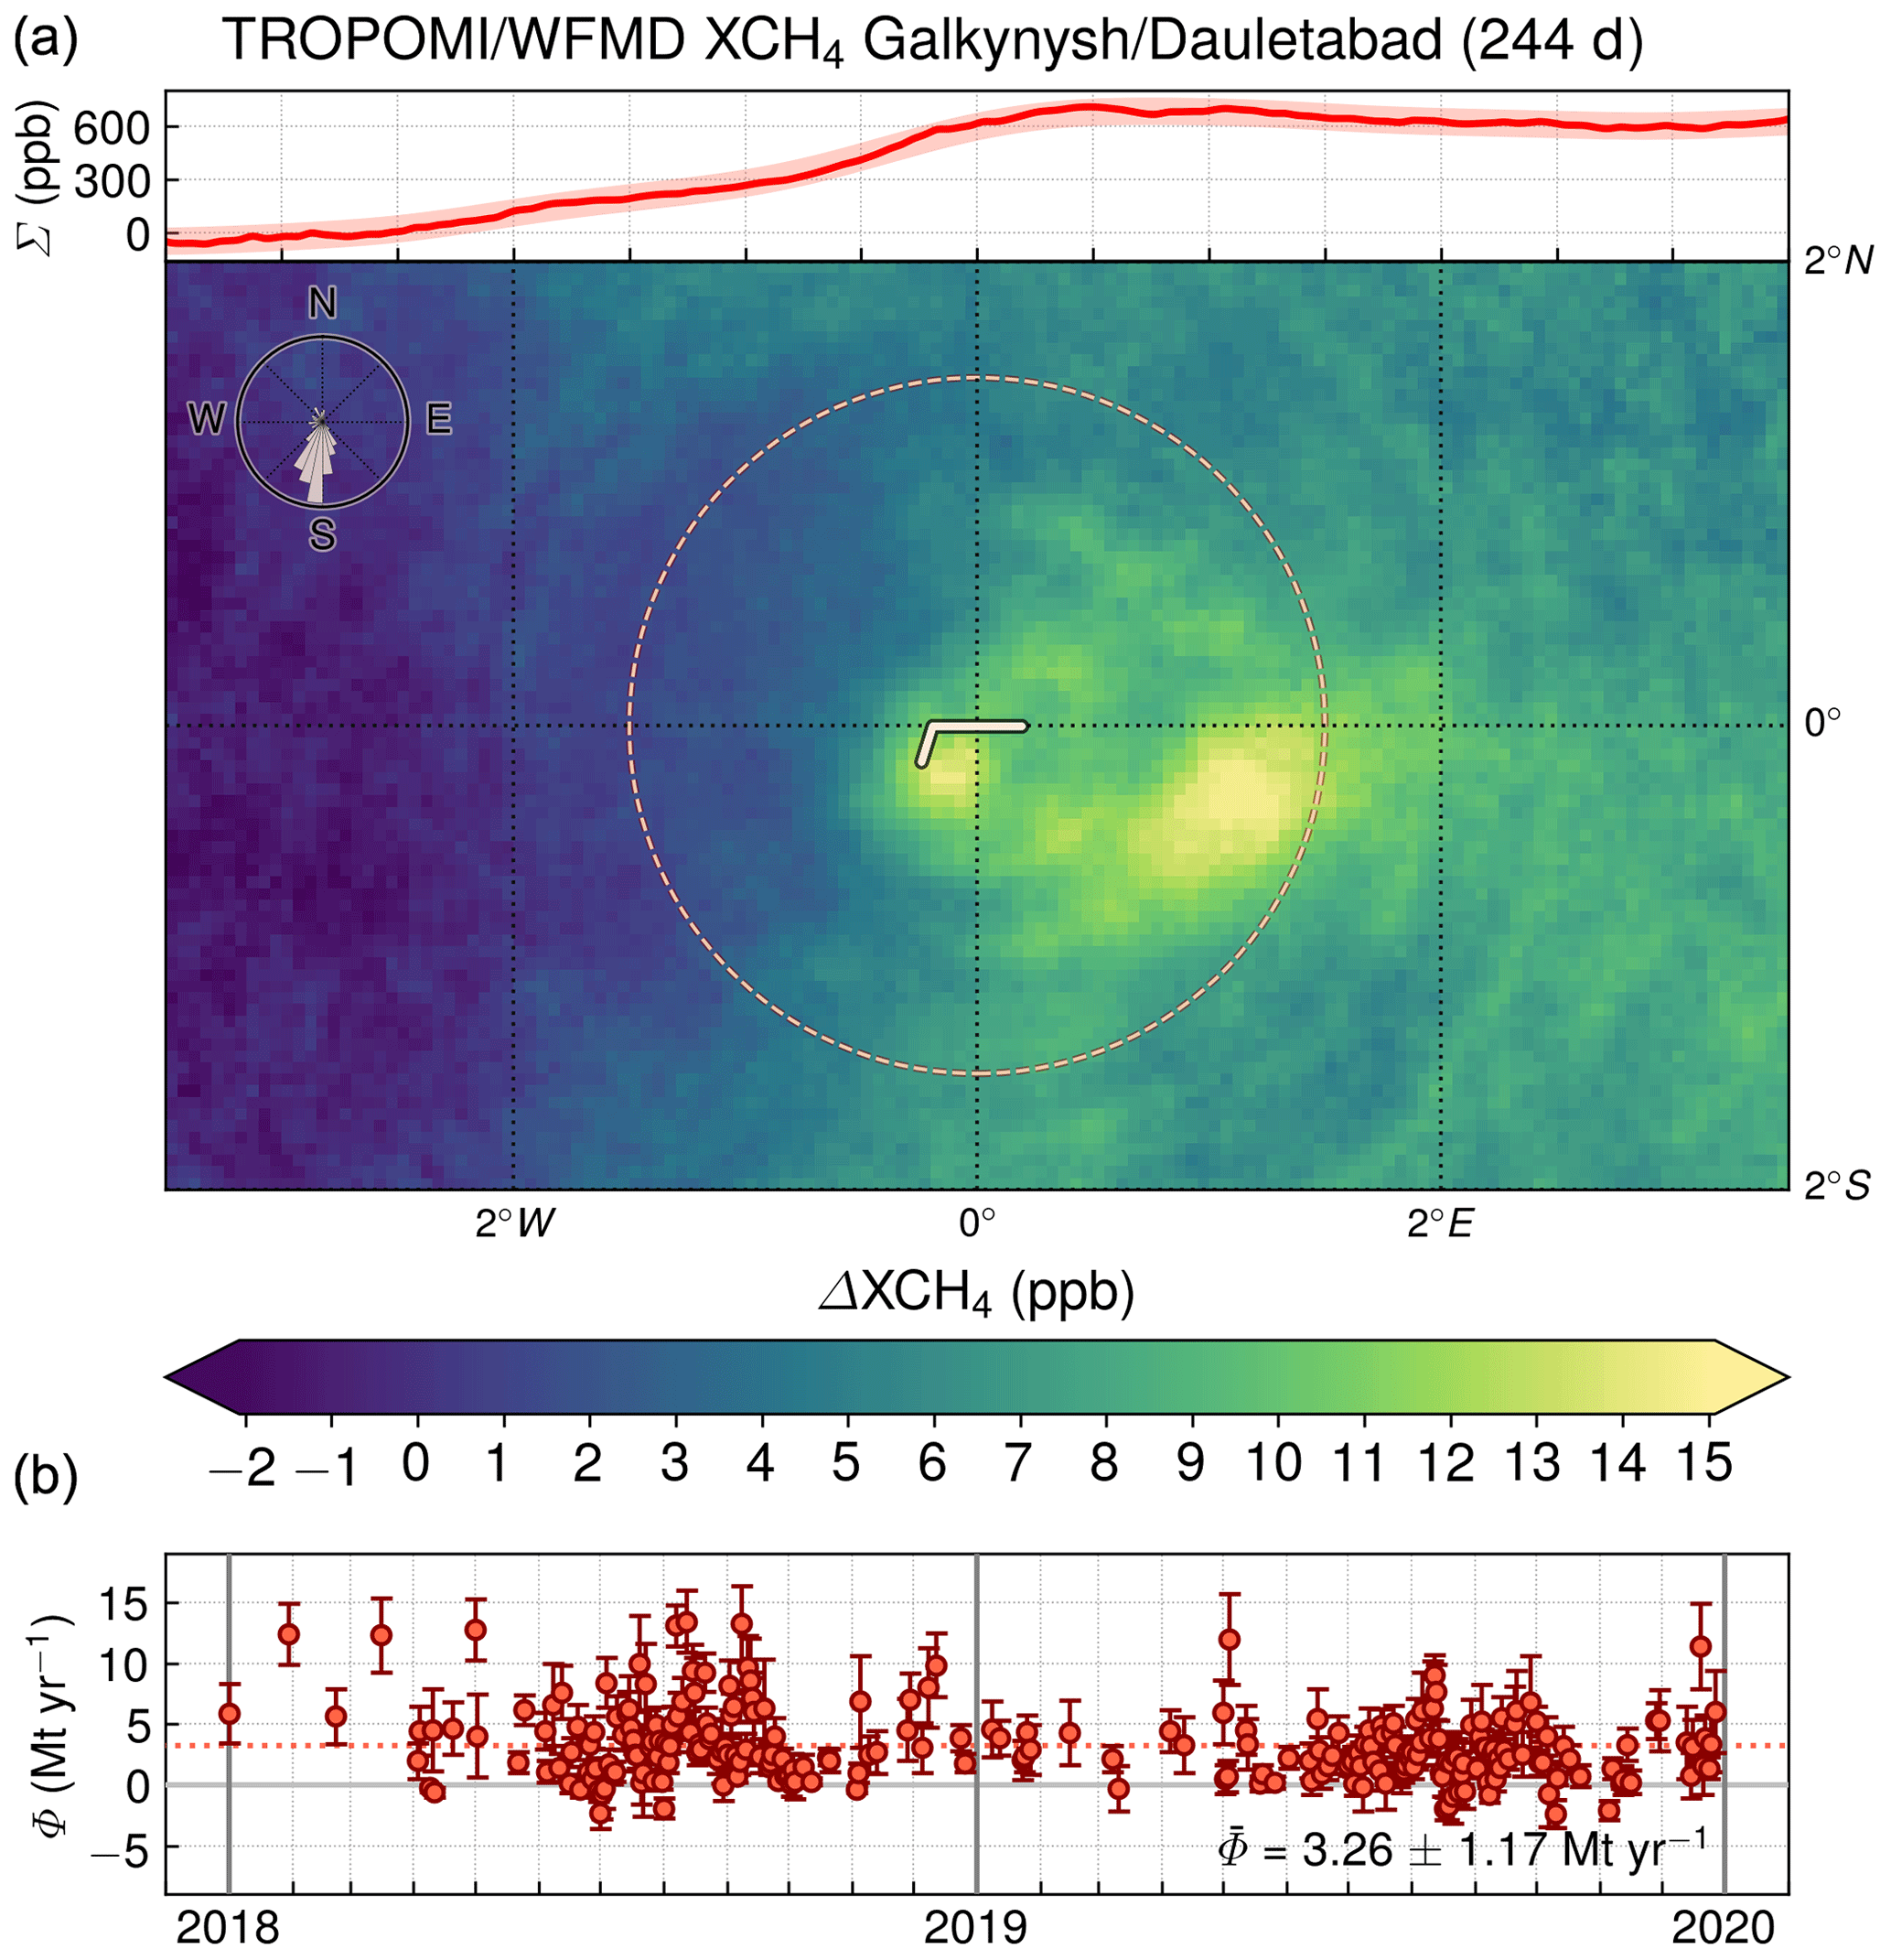
Besides the discussed production regions in the United States, we also analysed methane emissions from two of the world's largest natural gas fields, Galkynysh and Dauletabad in Turkmenistan. Galkynysh is a cluster of conventional oil and gas deposits that have been combined under a common name. Galkynysh started production in 2013 and was planned to be developed in three stages by adding capacities of about 2900, 2900, and 3400 MMcf d−1 in the respective stages (AidData, 2013; U.S. Energy Information Administration, 2016). As the last stage was expected to start in late 2015, we assume that the field production was close to the envisaged total quantity of 9200 MMcf d−1 in the analysed period 2018/2019, although official production figures are not available. Dauletabad is also a large natural gas field in Turkmenistan, which is located between Galkynysh and the Iranian border, with assumed gas production of 2900 MMcf d−1 (Mammadov, 2015). This corresponds to a total collective production for Galkynysh and Dauletabad of 2017 kBOE d−1 because there is no reference to commercial oil production from either field. The qualitative detection of daily methane enhancements for the Galkynysh field has already been demonstrated using TROPOMI measurements (Schneising et al., 2019). The quantitative reinforcement in this study (see Fig. 11) provides a joint emission estimate together with Dauletabad of 3.26±1.17 Mt yr−1, corresponding to a fugitive emission rate of 4.1±1.5 %, which is comparable to the leakage rate for the Anadarko Basin and roughly corresponds to the break-even rate for a 20-year time horizon (Farquharson et al., 2016). Due to the lack of official production reporting, it is possible that the actual leakage rate for these Turkmen fields may be somewhat smaller (e.g. if there is also some oil production) or larger (e.g. if the targeted production of Galkynysh was not achieved in 2018/2019).
3.7 Uncertainty contributions and breakdown of selection criteria
As described in Sect. 2, the total daily uncertainty uΦ is determined from individual uncertainty components quantifying the impact of the enhancement patterns in the context of systematic biases or single-measurement precision (uE), absolute wind speed and wind direction knowledge or variability (uv, abs and uv, dir), and pressure or topography () on the emission estimates (see Eq. 2). The mean percentage variance contribution for a given component c is defined as the mean of all contributing days of the daily . Besides the emission and production values used to determine the leakage rates, the individual mean percentage variance contributions to the emission estimates are summarised in Table 1 for the regions under consideration in this study. As can be seen, the main sources of uncertainty are given by the variable enhancement patterns related to precision and accuracy and by the spatial and temporal variability of the absolute wind speed. Due to the exclusion of days with mean wind direction changes larger than 30∘ during the considered 2 h time window of wind history, the contribution of wind direction variability is small. The same is true for the relative impact of topography on the emission estimates, at least for the regions analysed here.
Table 1Summary of the emission and production values used to determine the leakage rates (emissions divided by combined oil and gas production). All values have been converted (kBOE d−1) as described in Sect. 2. Also shown are the mean percentage variance contributions to the emission estimates for the relative uncertainty components of Eq. (2).
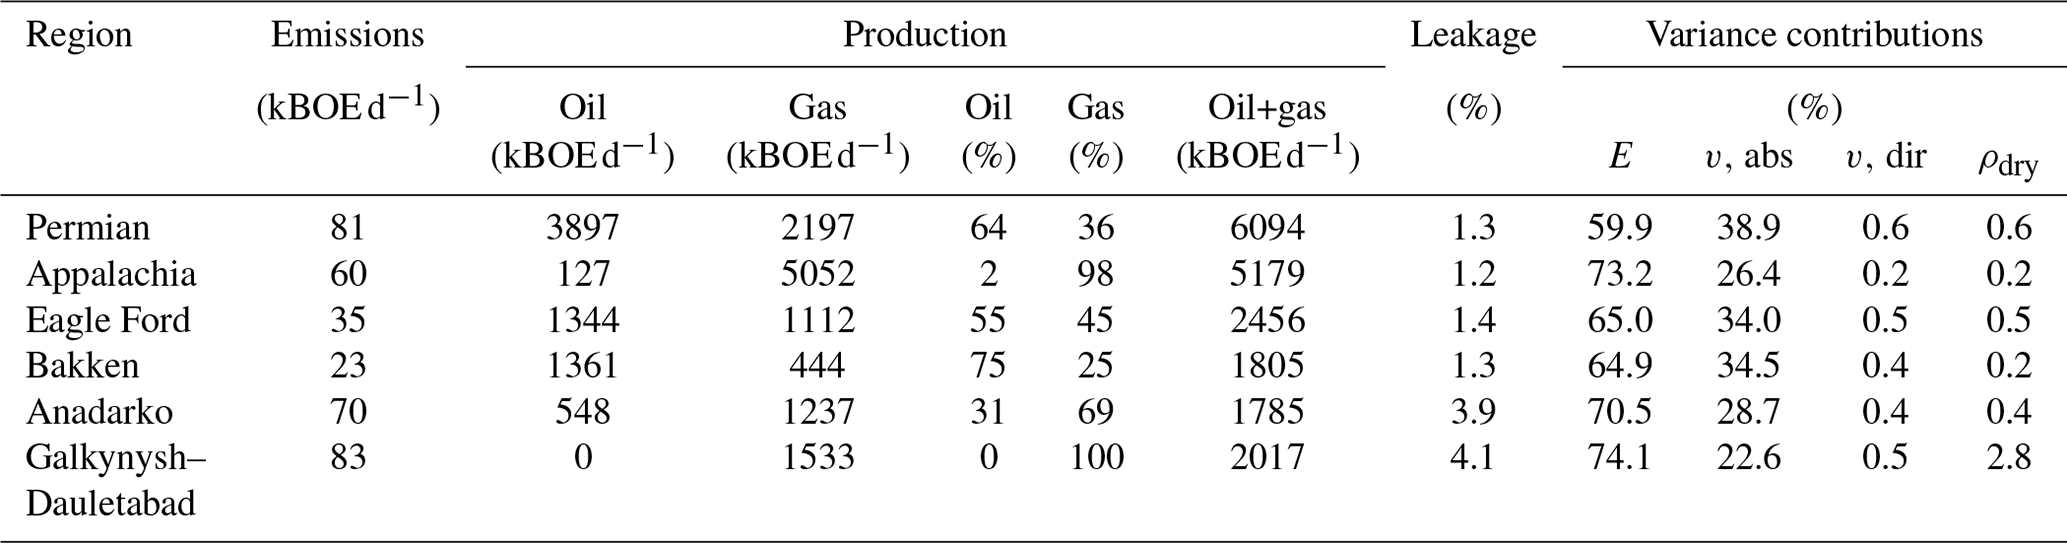
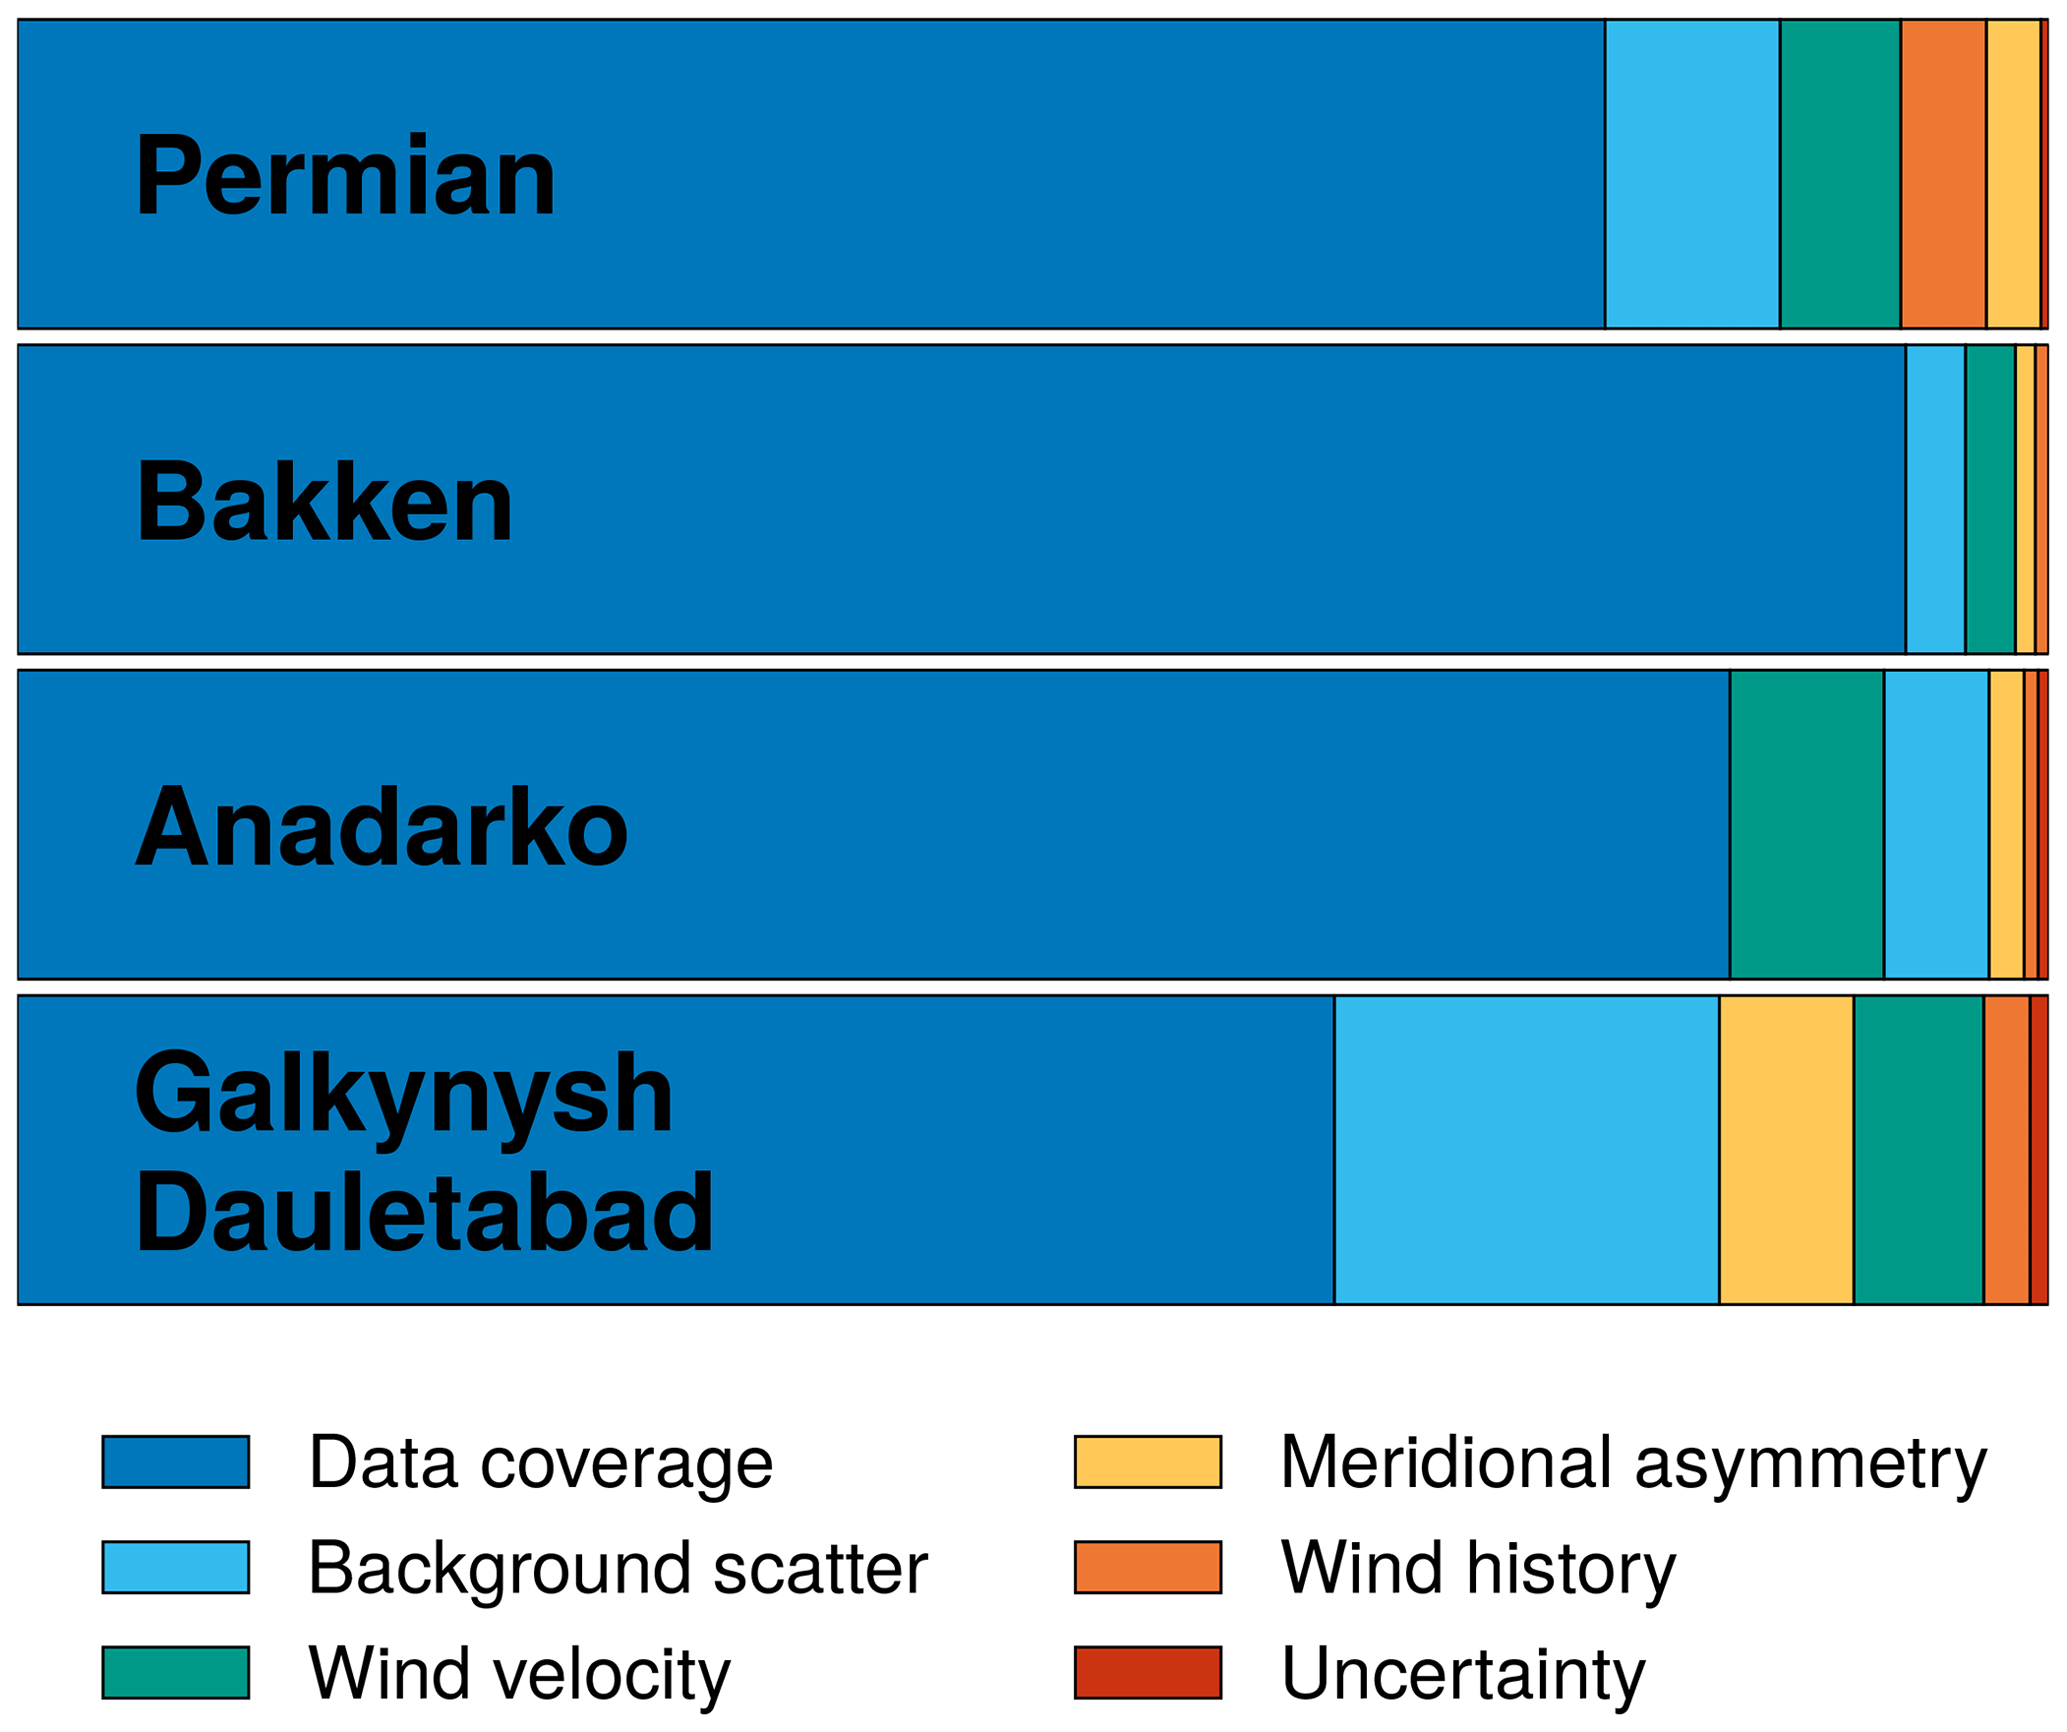
Figure 12Relative contributions of the selection criteria sorted by importance for different regions. See main text for details.
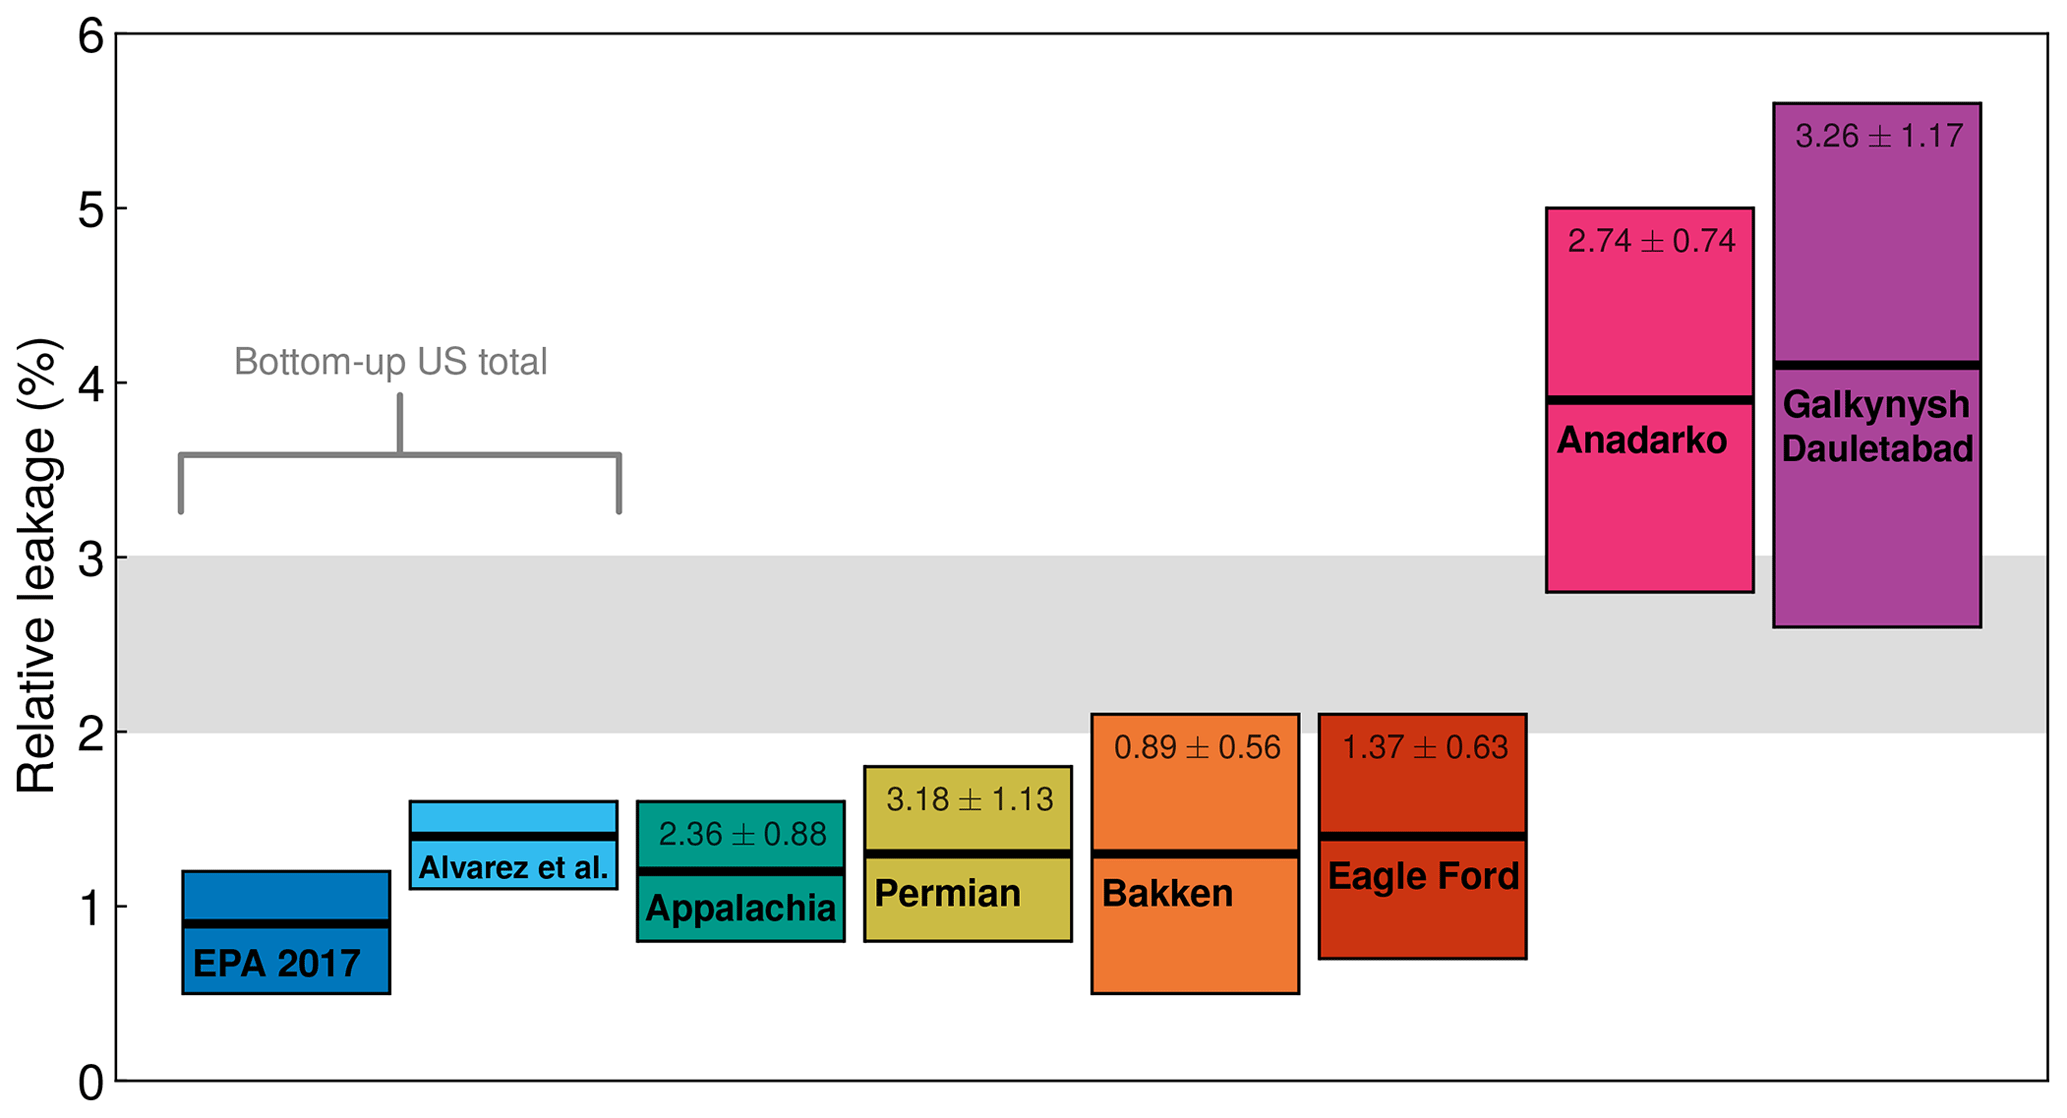
Figure 13Summary of the results for the different regions analysed in this study and a comparison to bottom-up estimates for the entire United States. All leakage rates are calculated relative to combined oil and gas production in terms of energy content. The respective absolute emissions (Mt yr−1) are shown in the upper area of the bars for the individual regions. The assumed break-even range for immediate climate benefit is shown in grey.
Section 2 also describes the filter criteria for selecting the data in order to ensure reliable emission estimates. Most excluding are the ones that filter out days with too few data coverage over the corresponding region. To determine the subsequent order of the leftover filters, the criteria excluding the most days of the remaining data set are successively identified. The results are summarised in Fig. 12 for different oil and gas plays under consideration. The filter criteria ordered by exclusionary power for all regions combined are (1) too few data, (2) background scatter σ(Eb) that is too high, (3) wind velocity v that is too high or too low, (4) asymmetry that is too large with respect to the Equator, (5) considerable wind direction change within the 2 h time window of wind history, and (6) daily uncertainty uΦ that is too large. For the individual regions, the respective filter sequences are similar, with a maximum permutation of two criteria compared to the overall sequence.
We have analysed regional atmospheric methane enhancements over large oil and gas production areas derived from daily measurements in the shortwave infrared spectral range of the TROPOMI instrument onboard the Sentinel-5 Precursor satellite to estimate the mean emissions for the analysed regions during the period 2018/2019. The analysis benefits from TROPOMI's unique combination of high precision, accuracy, and spatiotemporal coverage, allowing for the systematic detection of sufficiently large emission sources in a single satellite overpass.
To assess the climate impact of the oil and gas industry, the determined emission estimates were related to the combined oil and gas production of the considered regions in terms of energy content to infer the respective fugitive emission rates. A summary of the results is given in Table 1 and illustrated in Fig. 13, showing the leakage rates for the different regions analysed in comparison to bottom-up estimates for the entire United States. In addition to regions where the inferred fugitive emission rates are reasonably consistent with the bottom-up estimates and likely below the break-even rate for immediate climate benefit (Appalachian, Permian, Bakken, and Eagle Ford), we have also identified regions that probably exceed this range (Anadarko and Galkynysh–Dauletabad), rendering a climate benefit over all time frames for these production areas questionable. The results suggest that it is possible to reduce methane emissions below the break-even leakage rate at which the climate impacts of the gas–oil mix and coal coincide if sufficient technological efforts are undertaken and appropriate industrial practices are employed. On the other hand, this does not seem to have been achieved in all production regions yet. In particular, relatively newly developed oil and gas plays appear to have larger leakage rates compared to more mature production areas. As a consequence, there is still potential to reduce fugitive methane emissions from natural gas and petroleum systems worldwide. The self-imposed goal of many oil and gas companies to reduce the leakage rate below 1 % has probably not yet been achieved in the measured regions.
Due to the inherent heterogeneity of methane leakage in the energy sector depending on operating conditions and procedures, it is difficult to specify typical leakage rates and to reliably assess the climate footprint of the natural gas and petroleum industry as a whole, which is essential for developing a sagacious environmental and energy policy. Further studies including other regions and longer time series are needed to unambiguously evaluate the sustainability of the oil and gas industry by obtaining a better sampling of the leakage distribution. Better knowledge of the relationships between leakage and production practices or basin development would also serve to improve current spatially and temporally resolved emission databases. In order to achieve these objectives, satellite measurements, ideally supplemented by frequent aircraft and ground-based measurements, can make an important contribution. An analysis of the main sources of uncertainty in satellite-based emission and leakage estimates suggests that future missions with improved precision and spatial resolution may have the potential to refine the current capabilities of emission monitoring from space by further reducing uncertainties. However, any emission estimation requires accurate knowledge of the wind speed and direction at an adequate horizontal and vertical resolution, which is not directly available by satellite observations and has to be provided by external sources.
The methane data set presented in this publication can be accessed via http://www.iup.uni-bremen.de/carbon_ghg/products/tropomi_wfmd/ (Schneising, 2019).
OS designed and operated the TROPOMI/WFMD satellite retrievals, performed the data analysis, interpreted the results, and wrote the paper. MB, MR, SV, HB, and JPB provided significant conceptual input to the design of the TROPOMI/WFMD satellite retrievals, the interpretation, and the improvement of the paper. All authors discussed the results and commented on the paper.
The authors declare that they have no conflict of interest.
This article is part of the special issue “TROPOMI on Sentinel-5 Precursor: first year in operation (AMT/ACP inter-journal SI)”. It is not associated with a conference.
This publication contains modified Copernicus Sentinel data (2018, 2019). Sentinel-5 Precursor is an ESA mission implemented on behalf of the European Commission. The TROPOMI payload is a joint development by the ESA and the Netherlands Space Office (NSO). Sentinel-5 Precursor ground-segment development has been funded by the ESA and with national contributions from the Netherlands, Germany, and Belgium.
We acknowledge the use of the meteorological ERA5 reanalysis from the European Centre for Medium-Range Weather Forecasts (ECMWF) and the oil and natural gas production data from the U.S. Energy Information Administration (EIA).
The research leading to the presented results has in part been funded by the ESA
projects GHG-CCI, GHG-CCI+, and Methane+, the Federal Ministry of Education and Research project
AIRSPACE (grant 01LK1701B), the DLR project “S5P Datennutzung” (50EE1811A), and the State and the University of Bremen.
The article processing charges for this open-access publication were covered by the University of Bremen.
This paper was edited by Ben Veihelmann and reviewed by two anonymous referees.
AidData: China CDB Agree Financing for Turkmenistan Gas Fields, available at: https://china.aiddata.org/projects/43168 (last access: 17 February 2020), 2013. a
Alvarez, R. A., Pacala, S. W., Winebrake, J. J., Chameides, W. L., and Hamburg, S. P.: Greater focus needed on methane leakage from natural gas infrastructure, P. Natl. Acad. Sci. USA, 109, 6435–6440, https://doi.org/10.1073/pnas.1202407109, 2012. a, b
Alvarez, R. A., Zavala-Araiza, D., Lyon, D. R., Allen, D. T., Barkley, Z. R., Brandt, A. R., Davis, K. J., Herndon, S. C., Jacob, D. J., Karion, A., Kort, E. A., Lamb, B. K., Lauvaux, T., Maasakkers, J. D., Marchese, A. J., Omara, M., Pacala, S. W., Peischl, J., Robinson, A. L., Shepson, P. B., Sweeney, C., Townsend-Small, A., Wofsy, S. C., and Hamburg, S. P.: Assessment of methane emissions from the U.S. oil and gas supply chain, Science, 361, 186–188, https://doi.org/10.1126/science.aar7204, 2018. a, b, c, d, e
Brandt, A. R., Heath, G. A., Kort, E. A., O'Sullivan, F., Pétron, G., Jordaan, S. M., Tans, P., Wilcox, J., Gopstein, A. M., Arent, D., Wofsy, S., Brown, N. J., Bradley, R., Stucky, G. D., Eardley, D., and Harriss, R.: Methane Leaks from North American Natural Gas Systems, Science, 343, 733–735, https://doi.org/10.1126/science.1247045, 2014. a
Buchwitz, M., de Beek, R., Noël, S., Burrows, J. P., Bovensmann, H., Schneising, O., Khlystova, I., Bruns, M., Bremer, H., Bergamaschi, P., Körner, S., and Heimann, M.: Atmospheric carbon gases retrieved from SCIAMACHY by WFM-DOAS: version 0.5 CO and CH4 and impact of calibration improvements on CO2 retrieval, Atmos. Chem. Phys., 6, 2727–2751, https://doi.org/10.5194/acp-6-2727-2006, 2006. a
Buchwitz, M., Schneising, O., Reuter, M., Heymann, J., Krautwurst, S., Bovensmann, H., Burrows, J. P., Boesch, H., Parker, R. J., Somkuti, P., Detmers, R. G., Hasekamp, O. P., Aben, I., Butz, A., Frankenberg, C., and Turner, A. J.: Satellite-derived methane hotspot emission estimates using a fast data-driven method, Atmos. Chem. Phys., 17, 5751–5774, https://doi.org/10.5194/acp-17-5751-2017, 2017. a
Caulton, D. R., Shepson, P. B., Santoro, R. L., Sparks, J. P., Howarth, R. W., Ingraffea, A. R., Cambaliza, M. O. L., Sweeney, C., Karion, A., Davis, K. J., Stirm, B. H., Montzka, S. A., and Miller, B. R.: Toward a better understanding and quantification of methane emissions from shale gas development, P. Natl. Acad. Sci. USA, 111, 6237–6242, https://doi.org/10.1073/pnas.1316546111, 2014. a
de Gouw, J. A., Veefkind, J. P., Roosenbrand, E., Dix, B., Lin, J. C., Landgraf, J., and Levelt, P. F.: Daily Satellite Observations of Methane from Oil and Gas Production Regions in the United States, Sci. Rep., 10, 1379, https://doi.org/10.1038/s41598-020-57678-4, 2020. a, b
Doms, G. and Baldauf, M.: A Description of the Nonhydrostatic Regional COSMO-Model, Part I: Dynamics and Numerics, Core documentation of the COSMO-model, available at: http://www.cosmo-model.org/content/model/documentation/core/cosmoDyncsNumcs.pdf (last access: 2 December 2019), 2018. a
Farquharson, D., Jaramillo, P., Schivley, G., Klima, K., Carlson, D., and Samaras, C.: Beyond Global Warming Potential: A Comparative Application of Climate Impact Metrics for the Life Cycle Assessment of Coal and Natural Gas Based Electricity, J. Ind. Ecol., 21, 857–873, https://doi.org/10.1111/jiec.12475, 2016. a, b, c, d
Fioletov, V. E., McLinden, C. A., Krotkov, N., and Li, C.: Lifetimes and emissions of SO2 from point sources estimated from OMI, Geophys. Res. Lett., 42, 1969–1976, https://doi.org/10.1002/2015GL063148, 2015. a
Hersbach, H., de Rosnay, P., Bell, B., Schepers, D., Simmons, A., Soci, C., Abdalla, S., Alonso-Balmaseda, M., Balsamo, G., Bechtold, P., Berrisford, P., Bidlot, J.-R., de Boisséson, E., Bonavita, M., Browne, P., Buizza, R., Dahlgren, P., Dee, D., Dragani, R., Diamantakis, M., Flemming, J., Forbes, R., Geer, A. J., Haiden, T., Hólm, E., Haimberger, L., Hogan, R., Horányi, A., Janiskova, M., Laloyaux, P., Lopez, P., Munoz-Sabater, J., Peubey, C., Radu, R., Richardson, D., Thépaut, J.-N., Vitart, F., Yang, X., Zsótér, E., and Zuo, H.: Operational global reanalysis: progress, future directions and synergies with NWP, ERA Report Series, European Centre for Medium Range Weather Forecasts, Reading, England, https://doi.org/10.21957/tkic6g3wm, 2018. a
Holmes, C. D., Prather, M. J., Søvde, O. A., and Myhre, G.: Future methane, hydroxyl, and their uncertainties: key climate and emission parameters for future predictions, Atmos. Chem. Phys., 13, 285–302, https://doi.org/10.5194/acp-13-285-2013, 2013. a
Intergovernmental Panel on Climate Change: IPCC Guidelines for National Greenhouse Gas Inventories, Volume 2 Energy, Chapter 2 Stationary Combustion, available at: https://www.ipcc-nggip.iges.or.jp/public/2006gl/pdf/2_Volume2/V2_2_Ch2_Stationary_Combustion.pdf (last access: 12 March 2020), 2006. a
International Organization for Standardization: Natural gas – Standard reference conditions (ISO 13443), available at: https://www.iso.org/standard/20461.html (last access: 17 February 2020), 1996. a
Karion, A., Sweeney, C., Pétron, G., Frost, G., Hardesty, R. M., Kofler, J., Miller, B. R., Newberger, T., Wolter, S., Banta, R., Brewer, A., Dlugokencky, E., Lang, P., Montzka, S. A., Schnell, R., Tans, P., Trainer, M., Zamora, R., and Conley, S.: Methane emissions estimate from airborne measurements over a western United States natural gas field, Geophys. Res. Lett., 40, 4393–4397, https://doi.org/10.1002/grl.50811, 2013. a
Mammadov, Q.: Turkmenistan positions itself as Eurasian natural gas power, Oil Gas J., 113, 76–84, http://digital.ogj.com/ogjournal/20151207, 2015. a
Oil and Gas Climate Initiative: Scaling up action – A report from the Oil and Gas Climate Initiative, available at: https://oilandgasclimateinitiative.com/annual-report/ (last access: 2 June 2020), 2019. a
ONE Future: 2018 Methane Emission Intensities – A Progress Report, available at: https://onefuture.us/wp-content/uploads/2019/11/ONE-Future-2018-Final-Report-LN.pdf (last access: 2 June 2020), 2019. a
Pandey, S., Gautam, R., Houweling, S., van der Gon, H. D., Sadavarte, P., Borsdorff, T., Hasekamp, O., Landgraf, J., Tol, P., van Kempen, T., Hoogeveen, R., van Hees, R., Hamburg, S. P., Maasakkers, J. D., and Aben, I.: Satellite observations reveal extreme methane leakage from a natural gas well blowout, P. Natl. Acad. Sci. USA, 116, 26376–26381, https://doi.org/10.1073/pnas.1908712116, 2019. a
Peischl, J., Ryerson, T. B., Aikin, K. C., de Gouw, J. A., Gilman, J. B., Holloway, J. S., Lerner, B. M., Nadkarni, R., Neuman, J. A., Nowak, J. B., Trainer, M., Warneke, C., and Parrish, D. D.: Quantifying atmospheric methane emissions from the Haynesville, Fayetteville, and northeastern Marcellus shale gas production regions, J. Geophys. Res., 120, 2119–2139, https://doi.org/10.1002/2014JD022697, 2015. a, b
Peischl, J., Karion, A., Sweeney, C., Kort, E. A., Smith, M. L., Brandt, A. R., Yeskoo, T., Aikin, K. C., Conley, S. A., Gvakharia, A., Trainer, M., Wolter, S., and Ryerson, T. B.: Quantifying atmospheric methane emissions from oil and natural gas production in the Bakken shale region of North Dakota, J. Geophys. Res., 121, 6101–6111, https://doi.org/10.1002/2015JD024631, 2016. a, b
Peischl, J., Eilerman, S. J., Neuman, J. A., Aikin, K. C., de Gouw, J., Gilman, J. B., Herndon, S. C., Nadkarni, R., Trainer, M., Warneke, C., and Ryerson, T. B.: Quantifying Methane and Ethane Emissions to the Atmosphere From Central and Western U.S. Oil and Natural Gas Production Regions, J. Geophys. Res., 123, 7725–7740, https://doi.org/10.1029/2018JD028622, 2018. a, b, c
Pétron, G., Frost, G., Miller, B. R., Hirsch, A. I., Montzka, S. A., Karion, A., Trainer, M., Sweeney, C., Andrews, A. E., Miller, L., Kofler, J., Bar-Ilan, A., Dlugokencky, E. J., Patrick, L., Moore, C. T., Ryerson, T. B., Siso, C., Kolodzey, W., Lang, P. M., Conway, T., Novelli, P., Masarie, K., Hall, B., Guenther, D., Kitzis, D., Miller, J., Welsh, D., Wolfe, D., Neff, W., and Tans, P.: Hydrocarbon emissions characterization in the Colorado Front Range: A pilot study, J. Geophys. Res., 117, D04304, https://doi.org/10.1029/2011JD016360, 2012. a
Pommier, M., McLinden, C. A., and Deeter, M.: Relative changes in CO emissions over megacities based on observations from space, Geophys. Res. Lett., 40, 3766–3771, https://doi.org/10.1002/grl.50704, 2013. a
Schneising, O.: TROPOMI/WFMD XCH4 and XCO v1.2, available at: http://www.iup.uni-bremen.de/carbon_ghg/products/tropomi_wfmd/ (last access: 24 July 2020), 2019. a
Schneising, O., Buchwitz, M., Reuter, M., Heymann, J., Bovensmann, H., and Burrows, J. P.: Long-term analysis of carbon dioxide and methane column-averaged mole fractions retrieved from SCIAMACHY, Atmos. Chem. Phys., 11, 2863–2880, https://doi.org/10.5194/acp-11-2863-2011, 2011. a
Schneising, O., Burrows, J. P., Dickerson, R. R., Buchwitz, M., Reuter, M., and Bovensmann, H.: Remote sensing of fugitive methane emissions from oil and gas production in North American tight geologic formations, Earth's Future, 2, 548–558, https://doi.org/10.1002/2014EF000265, 2014. a, b, c, d, e, f
Schneising, O., Buchwitz, M., Reuter, M., Bovensmann, H., Burrows, J. P., Borsdorff, T., Deutscher, N. M., Feist, D. G., Griffith, D. W. T., Hase, F., Hermans, C., Iraci, L. T., Kivi, R., Landgraf, J., Morino, I., Notholt, J., Petri, C., Pollard, D. F., Roche, S., Shiomi, K., Strong, K., Sussmann, R., Velazco, V. A., Warneke, T., and Wunch, D.: A scientific algorithm to simultaneously retrieve carbon monoxide and methane from TROPOMI onboard Sentinel-5 Precursor, Atmos. Meas. Tech., 12, 6771–6802, https://doi.org/10.5194/amt-12-6771-2019, 2019. a, b, c, d, e
Shindell, D., Kuylenstierna, J. C. I., Vignati, E., van Dingenen, R., Amann, M., Klimont, Z., Anenberg, S. C., Muller, N., Janssens-Maenhout, G., Raes, F., Schwartz, J., Faluvegi, G., Pozzoli, L., Kupiainen, K., Höglund-Isaksson, L., Emberson, L., Streets, D., Ramanathan, V., Hicks, K., Oanh, N. T. K., Milly, G., Williams, M., Demkine, V., and Fowler, D.: Simultaneously Mitigating Near-Term Climate Change and Improving Human Health and Food Security, Science, 335, 183–189, https://doi.org/10.1126/science.1210026, 2012. a
Shoemaker, J. K., Schrag, D. P., Molina, M. J., and Ramanathan, V.: What Role for Short-Lived Climate Pollutants in Mitigation Policy?, Science, 342, 1323–1324, https://doi.org/10.1126/science.1240162, 2013. a
Thompson, D. R., Thorpe, A. K., Frankenberg, C., Green, R. O., Duren, R., Guanter, L., Hollstein, A., Middleton, E., Ong, L., and Ungar, S.: Space-based remote imaging spectroscopy of the Aliso Canyon CH4 superemitter, Geophys. Res. Lett., 43, 6571–6578, https://doi.org/10.1002/2016GL069079, 2016. a
Turner, A. J., Jacob, D. J., Benmergui, J., Wofsy, S. C., Maasakkers, J. D., Butz, A., Hasekamp, O., and Biraud, S. C.: A large increase in U.S. methane emissions over the past decade inferred from satellite data and surface observations, Geophys. Res. Lett., 43, 2218–2224, https://doi.org/10.1002/2016GL067987, 2016. a
U.S. Energy Information Administration: International Energy Statistics – Turkmenistan Analysis, available at: https://www.eia.gov/international/analysis/country/TKM (last access: 17 February 2020), 2016. a
U.S. Energy Information Administration: The Distribution of U.S. Oil and Natural Gas Wells by Production Rate, available at: https://www.eia.gov/petroleum/wells/pdf/full_report.pdf (last access: 17 February 2020), 2019. a
U.S. Energy Information Administration: Drilling Productivity Report, January 2020, available at: https://www.eia.gov/petroleum/drilling/pdf/dpr-full.pdf and https://www.eia.gov/petroleum/drilling/xls/dpr-data.xlsx, last access: 31 January 2020. a, b, c, d, e, f
U.S. Environmental Protection Agency: Inventory of U.S. Greenhouse Gas Emissions and Sinks 1990–2017, available at: https://www.epa.gov/sites/production/files/2019-04/documents/us-ghg-inventory-2019-main-text.pdf, last access: 2 December 2019a. a
U.S. Environmental Protection Agency: Inventory of U.S. Greenhouse Gas Emissions and Sinks 1990–2017, All Annexes, available at: https://www.epa.gov/sites/production/files/2019-04/documents/us-ghg-inventory-2019-annexes.pdf, last access: 2 December 2019b. a, b
Valin, L. C., Russell, A. R., and Cohen, R. C.: Variations of OH radical in an urban plume inferred from NO2 column measurements, Geophys. Res. Lett., 40, 1856–1860, https://doi.org/10.1002/grl.50267, 2013. a
Varon, D. J., McKeever, J., Jervis, D., Maasakkers, J. D., Pandey, S., Houweling, S., Aben, I., Scarpelli, T., and Jacob, D. J.: Satellite Discovery of Anomalously Large Methane Point Sources From Oil/Gas Production, Geophys. Res. Lett., 46, 13507–13516, https://doi.org/10.1029/2019GL083798, 2019. a
Veefkind, J. P., Aben, I., McMullan, K., Förster, H., de Vries, J., Otter, G., Claas, J., Eskes, H. J., de Haan, J. F., Kleipool, Q., van Weele, M., Hasekamp, O., Hoogeveen, R., Landgraf, J., Snel, R., Tol, P., Ingmann, P., Voors, R., Kruizinga, B., Vink, R., Visser, H., and Levelt, P. F.: TROPOMI on the ESA Sentinel-5 Precursor: A GMES mission for global observations of the atmospheric composition for climate, air quality and ozone layer applications, Remote Sens. Environ., 120, 70–83, https://doi.org/10.1016/j.rse.2011.09.027, 2012. a
Yacovitch, T. I., Daube, C., and Herndon, S. C.: Methane Emissions from Offshore Oil and Gas Platforms in the Gulf of Mexico, Environ. Sci. Technol., 54, 3530–3538, https://doi.org/10.1021/acs.est.9b07148, 2020. a
Zhang, Y., Gautam, R., Pandey, S., Omara, M., Maasakkers, J. D., Sadavarte, P., Lyon, D., Nesser, H., Sulprizio, M. P., Varon, D. J., Zhang, R., Houweling, S., Zavala-Araiza, D., Alvarez, R. A., Lorente, A., Hamburg, S. P., Aben, I., and Jacob, D. J.: Quantifying methane emissions from the largest oil-producing basin in the United States from space, Science Advances, 6, eaaz5120, https://doi.org/10.1126/sciadv.aaz5120, 2020. a, b