the Creative Commons Attribution 4.0 License.
the Creative Commons Attribution 4.0 License.
 | 03 Aug 2020
Ship plumes in the Baltic Sea Sulfur Emission Control Area: chemical characterization and contribution to coastal aerosol concentrations
Stina Ausmeel
Axel Eriksson
Erik Ahlberg
Moa K. Sporre
Mårten Spanne
Adam Kristensson
In coastal areas, there is increased concern about emissions from shipping activities and the associated impact on air quality. We have assessed the ship aerosol properties and the contribution to coastal particulate matter (PM) and nitrogen dioxide (NO2) levels by measuring ship plumes in ambient conditions at a site in southern Sweden, within a Sulfur Emission Control Area. Measurements took place during a summer and a winter campaign, 10 km downwind of a major shipping lane. Individual ships showed large variability in contribution to total particle mass, organics, sulfate, and NO2. The average emission contribution of the shipping lane was 29±13 and 37±20 ng m−3 to PM0.5, 18±8 and 34±19 ng m−3 to PM0.15, and 1.21±0.57 and 1.11±0.61 µg m−3 to NO2, during winter and summer, respectively. Sulfate and organics dominated the particle mass and most plumes contained undetectable amounts of equivalent black carbon (eBC). The average eBC contribution was 3.5±1.7 ng m−3 and the absorption Ångström exponent was close to 1. Simulated ageing of the ship aerosols using an oxidation flow reactor showed that on a few occasions, there was an increase in sulfate and organic mass after photochemical processing of the plumes. However, most plumes did not produce measurable amounts of secondary PM upon simulated ageing.
- Article
(1124 KB) - Full-text XML
- Companion paper
-
Supplement
(524 KB) - BibTeX
- EndNote


Air pollution from shipping is a global concern due to its climate and health effects (Oeder et al., 2015; Brandt et al., 2013; Corbett et al., 2007; Eyring et al., 2010; Lack et al., 2011). In many places, there is an increase in shipping activities as a result of increased international trade. Ship emissions are an increasingly important source of air pollution, especially in coastal areas and harbours (Corbett and Fischbeck, 1997; Eyring et al., 2005). The International Maritime Organization (IMO) has regulated fuel sulfur content in several steps in recent years, from 1.5 % to 0.1 % mass fraction between the years 2010 and 2015 in sulfur emission control areas (SECAs). The fuel sulfur had been 3.5 % outside SECA but was restricted to 0.5 % in 2020.
Ship emission properties, such as particle number and mass concentration, particle size, and chemical composition, depend on a variety of parameters, and ships make up a heterogeneous mix of emission sources. Most particles emitted from ships are in the sub-micrometre range, typically with a diameter below 100 nm (Lack et al., 2009). Studies have shown a decrease in mean particle diameter when switching to a lower fuel sulfur content (Betha et al., 2017; Zetterdahl et al., 2016) as well as a decrease in emitted particulate matter (PM) (Lack et al., 2009; Diesch et al., 2013; Mueller et al., 2015; Buffaloe et al., 2014). Studies of chemical composition of ship PM have shown that the mass is typically dominated by organic matter, sulfate, and black carbon. Zetterdahl et al. (2016) measured PM emission factors on board a ship in the Baltic Sea, running on HFO (heavy fuel oil) and low-sulfur residual marine fuel oil. The total and non-volatile PM emission factors were 0.17±0.03 and 0.12±0.03 g (kg fuel)−1, respectively, for HFO and 0.06±0.03 and 0.04±0.02 g (kg fuel)−1, respectively, for the low-sulfur fuel. The black carbon emission factor ranged from 0.027 to 0.087 g (kg fuel)−1, depending on engine load and was slightly higher for HFO. Lack et al. (2009) reported emission factors for 43 ship plumes based on ambient measurements using aerosol mass spectrometry (AMS) for chemically resolved PM. They observed that an average PM1 emission factor of 3.32±4.04 g (kg fuel)−1 and specifically 1.21±1.50 g (kg fuel)−1 (36 %) was sulfate, 1.26±0.96 g (kg fuel)−1 (38 %) was organic matter, and 0.85±0.76 g (kg fuel)−1 (26 %) was black carbon. Sulfate and organic matter were linearly correlated with fuel sulfur content. In a study by Cappa et al. (2014), the ship plume PM varied with ship speed, with an EF ranging from 0.09 (slow speed, 2.9 knots) to 1.5 g (kg fuel)−1 (high speed, 12 knots). For this ship, running on a low-sulfur marine gas oil, the PM sulfate content was below the detection limit of the AMS, while the primary organic matter (pOM) made up 53±14 % of the total mass (EFpOM 0.39±0.44 g (kg fuel)−1), and black carbon (BC) made up 47±14 %. Similarly, Shen and Li (2019) also found negligible sulfate emissions from marine diesel oil, which was dominated purely by organic and elemental carbon. In the same study, the use of HFO as fuel resulted in 75 % sulfate mass (including bound water) and 21 % organic carbon, and the rest was elemental carbon and ash. Plume studies of 139 ships in a 1 % sulfur emission control area, presented in Diesch et al. (2013), showed an average PM1 emission factor of 2.4±1.8 g (kg fuel)−1, and specifically 0.54±0.46 g (kg fuel)−1 (23 %) was sulfate and 1.8±1.7 g (kg fuel)−1 (75 %) was organic matter. In a recent on-board study by Huang et al. (2018), it was also found that organic matter was the most abundant PM fraction (45 %–65 %), while sulfate content was low compared to the values listed above (2 %–15 %). The elemental carbon (or black carbon) PM mass fraction was low (1 %–6 %) for the main engine used for propulsion, while it was higher (20 %) for the auxiliary engine used to generate electricity. The PM composition, including other species than just sulfate, depends partly on fuel sulfur content (Lack and Corbett, 2012). There are several other parameters which affect the absolute emission of PM as well as the particle composition, such as fuel type, operation conditions, engine load, engine properties, and maintenance. Ship exhaust also contains elevated levels of nitrogen oxides (NOx, including NO2 and NO), sulfur dioxide (SO2), carbon monoxide (CO), carbon dioxide (CO2), and volatile organic compounds (VOCs) (Sinha et al., 2003; Chen et al., 2005; Alföldy et al., 2013; Moldanová et al., 2009; Huang et al., 2018; Cooper, 2001). Concentrations of CO2 can be used to estimate emission factors of gases and particles. NOx emissions from ships have also been shown to depend on, at least, both fuel type and ship speed (Beecken et al., 2014; IPCC, 2013).
One way to characterize and quantify ship emissions is through ambient measurements in coastal areas, downwind of shipping lanes. This method makes it possible to register an increase in aerosol levels and potential exposure in an area when individual ship emission plumes pass the measurement station. Other methods include measurements on laboratory engine emissions (Anderson et al., 2015; Kasper et al., 2007; Lyyränen et al., 1999; Petzold et al., 2010) or measurements on board or following a sailing ship, intersecting the emission plume (Chen et al., 2005; Murphy et al., 2009; Petzold et al., 2008; Aliabadi et al., 2016; Lack et al., 2011). However, while these methods can provide detailed knowledge on fresh emissions from a specific ship, they do not give information on the variety of particle properties between different ships, on how the plume evolves during transport in the atmosphere, or on human exposure over land areas, and these methods can be more cost-intensive. By measuring in ambient conditions on the coast, emissions from a large part of the shipping fleet can be captured, and atmospheric measurements are needed to give information on emissions, dilution, and impact on the environment and local air quality. Atmospheric measurements of elevated CO2 concentrations close to (less than a few minutes downwind) shipping lanes, can give emission factors during atmospheric conditions which differ from test-bed conditions.
To date, a number of atmospheric studies of individual ship plumes have been conducted in harbour areas (Alföldy et al., 2013; Healy et al., 2009; Jonsson et al., 2011; Lu et al., 2006; Westerlund et al., 2015) and also in the Arctic (Aliabadi et al., 2015). One study of aged plumes from a shipping lane has been performed by Kivekäs et al. (2014), off the west coast of Denmark, measuring plumes with an atmospheric age of about 1 h. In the study by Kivekäs et al. (2014) ship plumes were measured at a coastal station about 25–50 km from the shipping lane, where there was good potential to study the impact of ship emissions on land concentrations and how particles are aged during semi-long-range transport. However, the authors suggested shorter distances to be able to detect elevated particle number concentrations from each individual ship passing along the lane when winds blew from the ships to the coastal stations. In this study, we have performed measurements 10 km (corresponding to approximately 30 min of plume ageing) downwind of a major shipping lane in southern Sweden. With this set-up, we were able to measure elevated particle number concentration for a majority of the ship plumes. The distance is nevertheless large enough to represent typical shipping lanes around the globe which influence inland air pollution, as well as to observe some effects of particle ageing.
The measurements presented here were taken in the Baltic Sea SECA during 2016 in order to study ship emission properties after the newest regulation of fuel sulfur content (0.1 % by mass). In a report by Mellqvist et al. (2017), the compliance levels to the most recent SECA regulations were studied in the nearby region of where our measurements were conducted. During the years 2015 and 2016, the compliance level was 92 %–94 % in the region around Denmark. Also, Jonson et al. (2019) have shown that there is a strong indication that ships are complying, based on emission modelling before and after the 2015 SECA regulation. The method for individual ship plume identification and the contribution to particle number concentrations have been described in detail in Ausmeel et al. (2019). In the current paper, however, we report the contribution from a major shipping lane to local particle mass concentrations and chemical composition (organics, sulfate, black carbon) and NO2, as well as the effects of additional ageing simulated with an oxidation flow reactor. The results complement previous studies in two ways: firstly, due to the new measurement location at an intermediate distance from the shipping lane; secondly, due to the measurements being performed after the recent fuel sulfur regulations within SECAs, which was introduced on 1 January 2015. The estimation of how ship traffic along a major route contributes to the coastal particle concentrations can contribute to the development of aerosol dynamic process models, regional aerosol particle models, health assessment models, and epidemiological studies.
The field site and the measurement methods have been described in Ausmeel et al. (2019) and are only briefly outlined here. The measurements took place at the Falsterbo peninsula, southern Sweden, during January–March and May–July 2016. The location of the field site and the surrounding area are shown in Fig. 1. The largest nearby cities are Copenhagen (capital of Denmark) and Malmö, with populations of about 800 000 and 300 000, respectively. All water in this figure is within the North Sea and Baltic Sea SECA. The field site is located at the tip of a peninsula, around which a frequently trafficked shipping lane passes (illustrated by a red line in Fig. 1). When performing measurements along a coastline, the interface between atmospheric boundary layers over land and sea can cause a build-up of a thermal internal boundary layer at the shoreline. This has been described by, e.g., Hanna et al. (1984) and is important to consider when doing plume measurements. However, due to the geographical surroundings at our field site, we do not expect this effect to be strong or exist at all, since the peninsula is a small land mass almost surrounded by water. The boundary layer height is likely a parameter which affects the dilution of the plumes and the background air and thereby the plume concentration. However, it seemed that boundary layer height did not affect the plume concentration in a systematic and reproducible way in Falsterbo as deduced using the Hybrid Single Particle Lagrangian Integrated Trajectory Model (HYSPLIT) (Stein et al., 2016) with meteorological data from the Global Data Assimilation System (GDAS). Since this study aims at describing the ship emission contribution to inland aerosol burden and not the concentrations at the exhaust stack, the effects of boundary layer height have not been pursued any further in this paper.
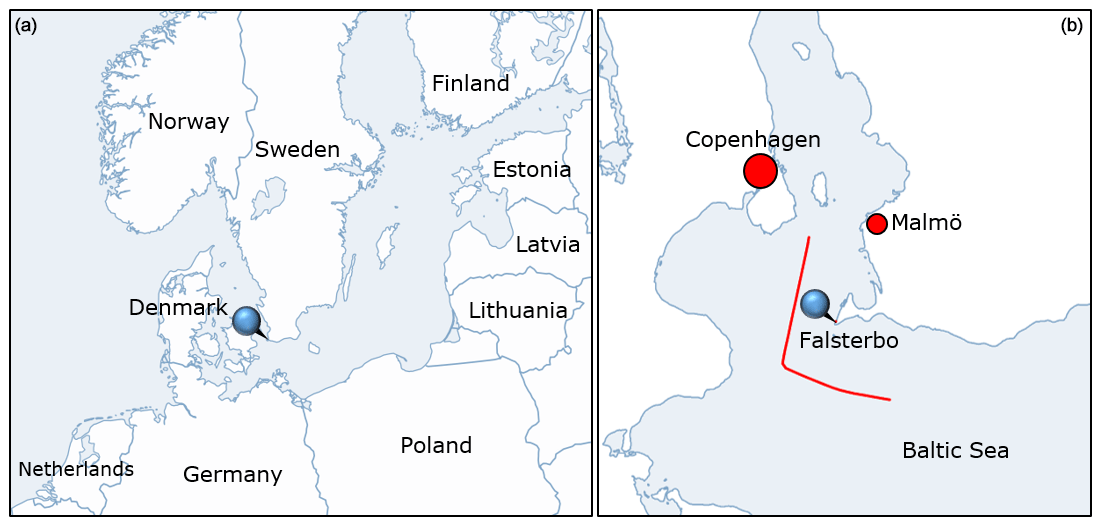
Figure 1Map of the Baltic Sea region (a) and the nearby region around the field site (b). The measurement site Falsterbo is marked with blue pin, and the nearby large cities Copenhagen and Malmö are marked with red circles. The red line shows a typical route of a ship following the main shipping lane around the Falsterbo peninsula, based on AIS position data.

Figure 2Aerosol particle properties measured with an SMPS and an SP-AMS versus time (31 January–1 February 2016), from measurements at the coastline in southern Sweden during an episode with westerly winds blowing from the Øresund Strait to the coastal station Falsterbo. The concentrations are those of the total aerosol; i.e. background concentrations are not subtracted. (a) Two-dimensional colour plot of total particle number size distribution from the SMPS. (b) The total number and volume concentrations from the SMPS and incidents of ship plume passages determined with AIS and meteorological data. (c) Concentration of the chemical constituents from the SP-AMS; total organics (Org), ammonium (NH4), nitrate (NO3), and sulfate (SO4). The wind direction (269±14 ∘) and wind speed (8.7±1.1 m s−1) can be considered stable during this period.
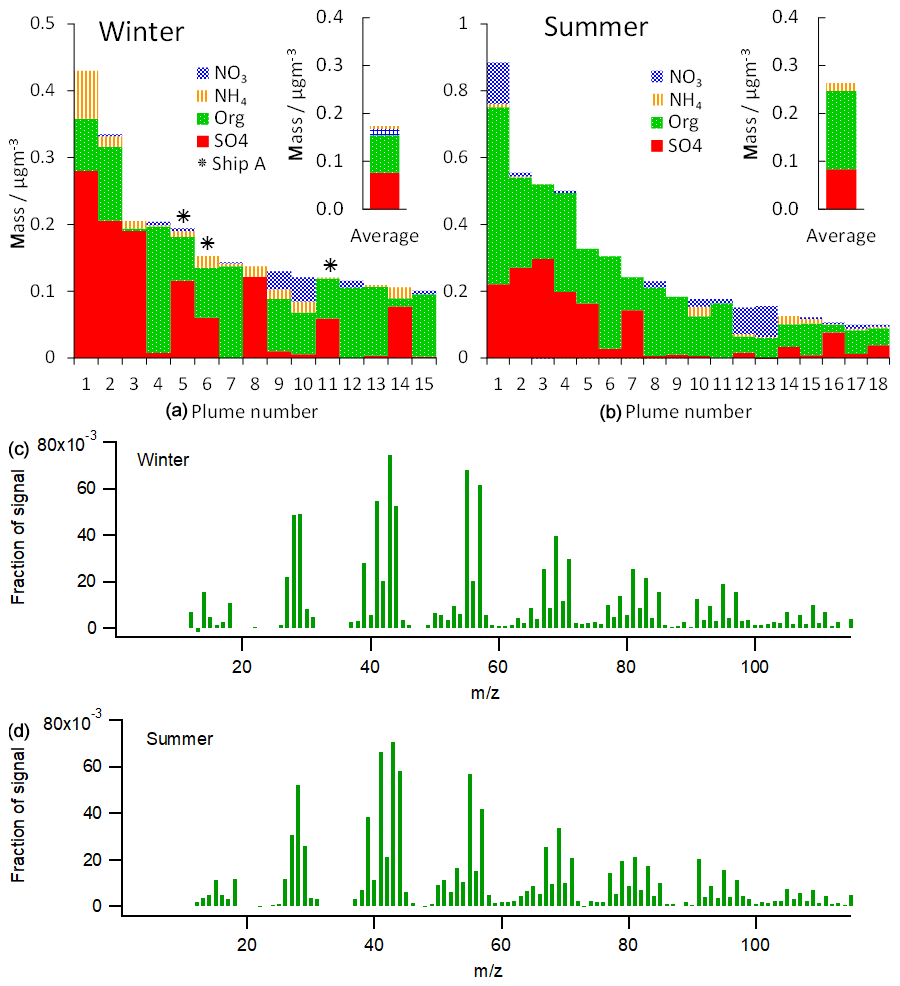
Figure 3(a, b) Mass concentration and composition of the particle constituents nitrate (NO3), ammonium (NH4), total organics (Org), and sulfate (SO4) of ship plumes with an average mass content larger than 0.1 µg m−3, measured with the SP-AMS. Panel (a) shows plumes in winter and panel (b) shows plumes in summer sorted in decreasing order of total mass conc. Inserted bar plot shows the average of all plumes. The stars mark the plumes from the same ship passing at three different occasions (plume nos. 5, 6, and 11). (c, d) Average organic mass spectra of plumes in the winter and summer measured with the SP-AMS.
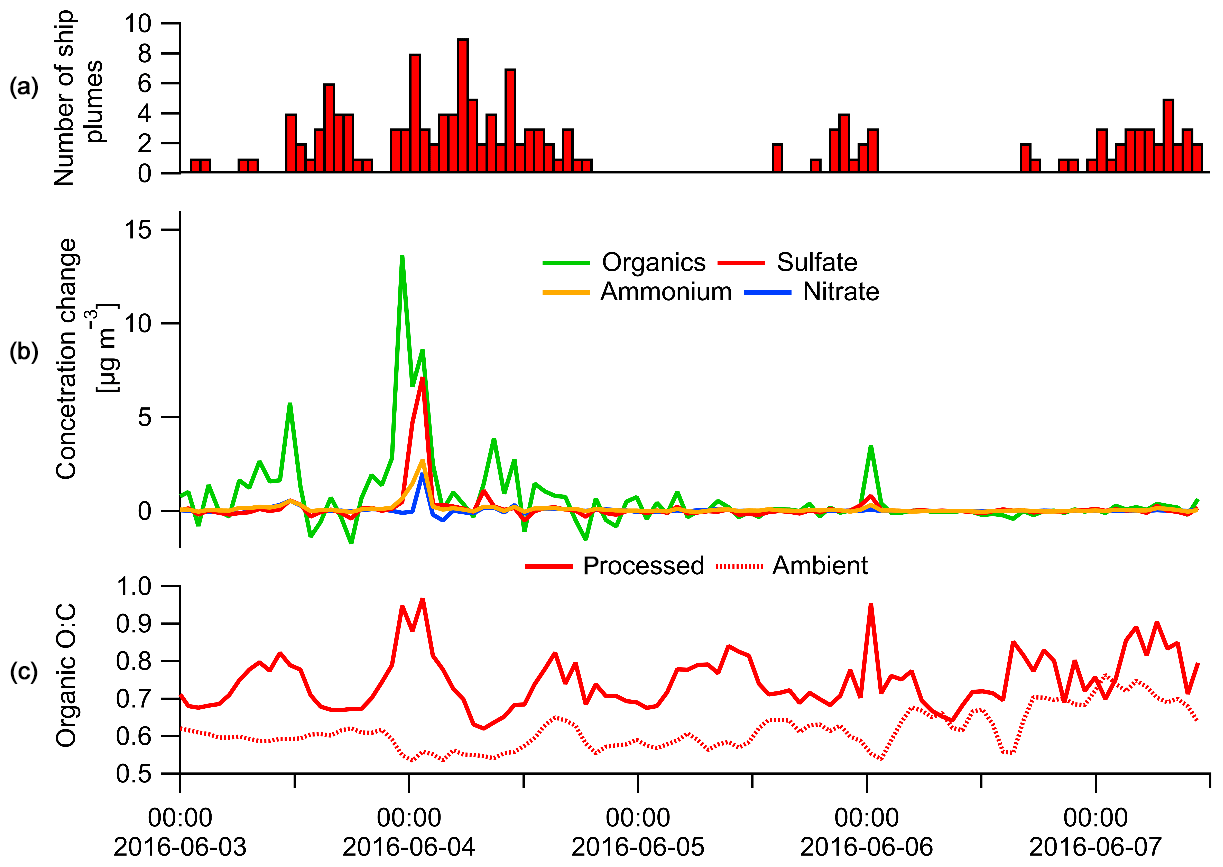
Figure 4Overview of an oxidation flow reactor (OFR) experiment in the summer. (a) Number of ship plumes sampled. (b) Chemical species concentration change upon OFR processing. (c) Organic O:C ratio after (processed) and before (ambient) OFR. Due to the alternating OFR/bypass sampling, all data are hourly averages.
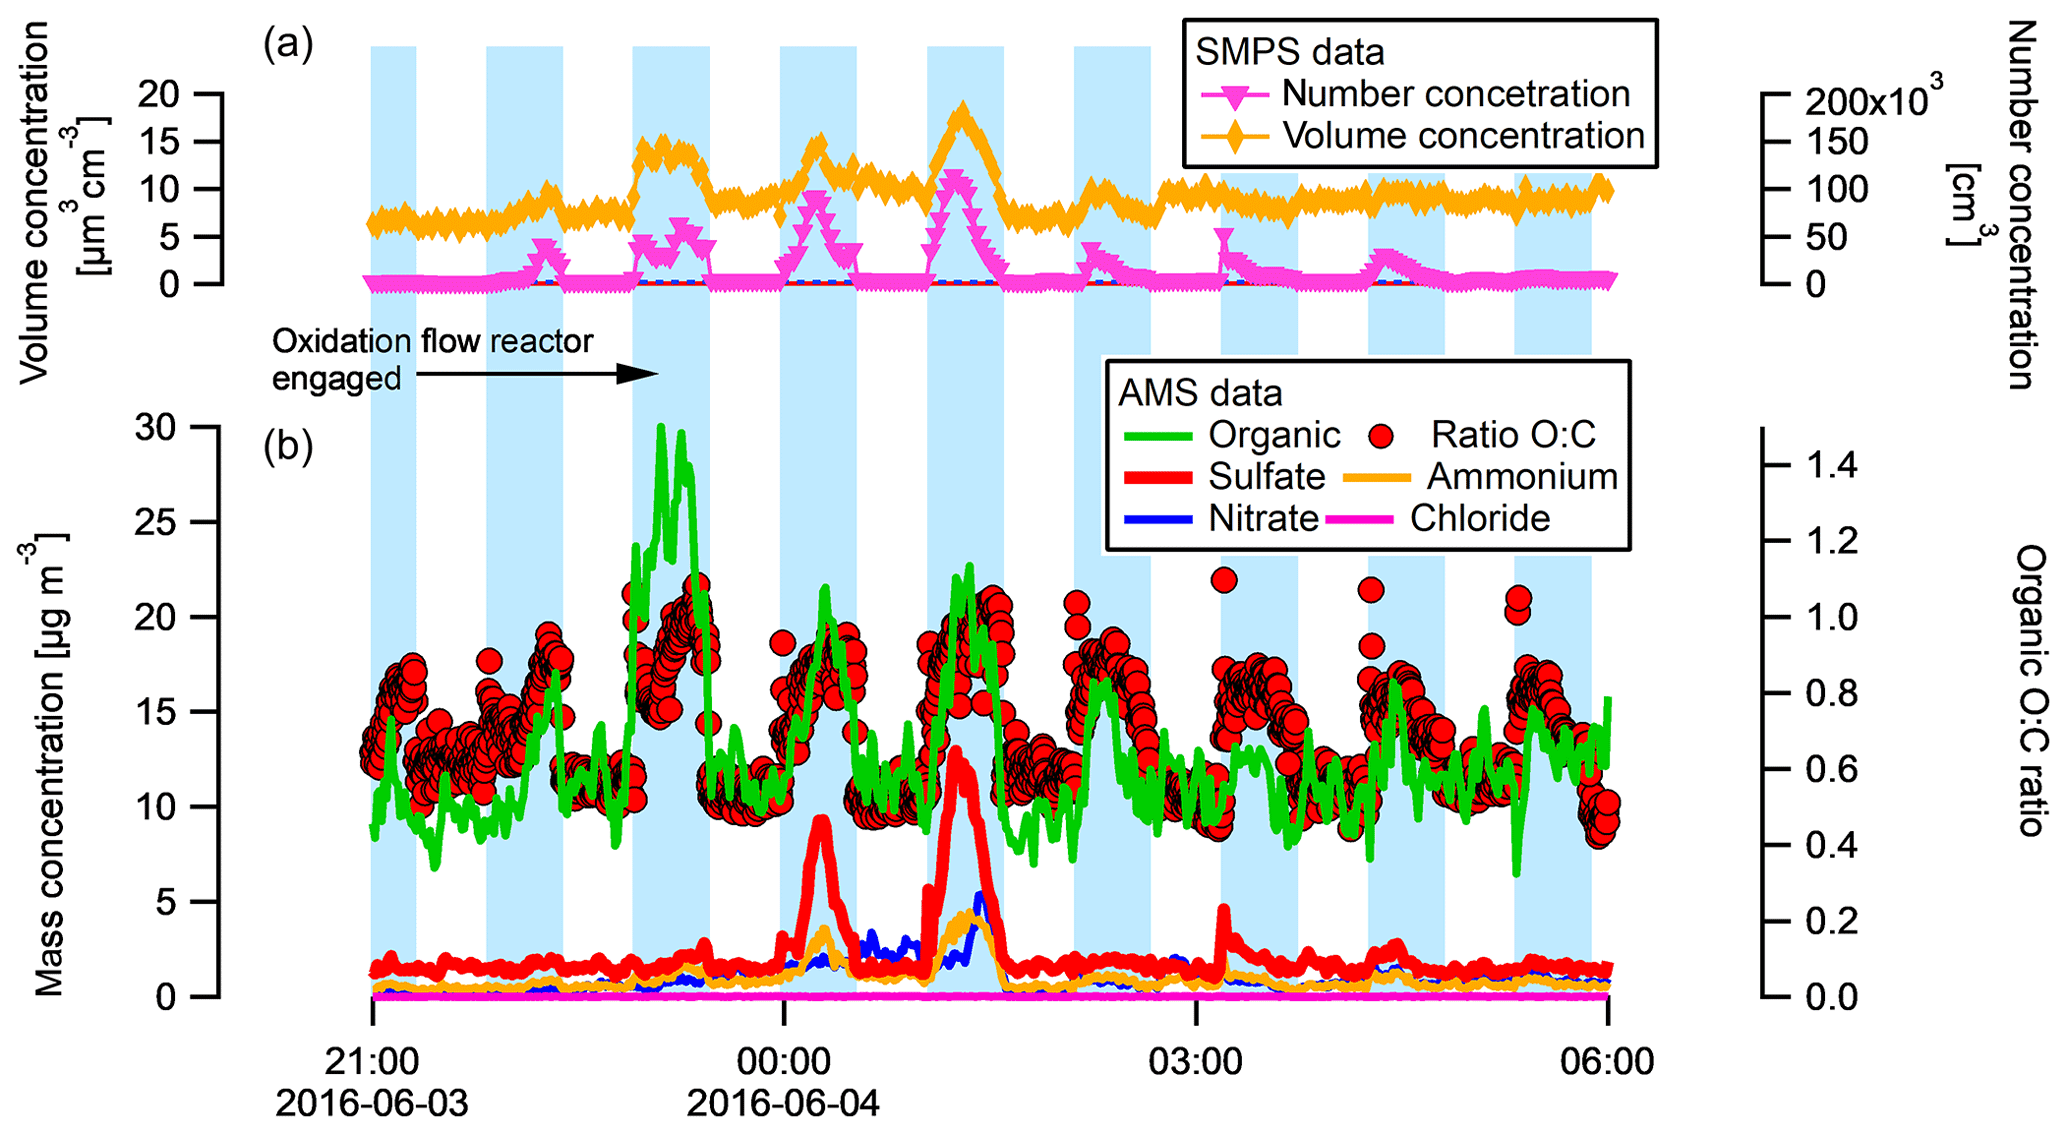
Figure 5Atmospheric processing simulated though an oxidation flow reactor (OFR). OFR measurements are shown in light blue background. (a) SMPS number and estimated volume concentration. (b) SP-AMS chemical species concentrations and organic O:C ratio.
In order to measure particle number size distribution and estimate mass concentrations for particles with a mobility diameter up to 0.15 µm (PM0.15) as well as 0.5 µm (PM0.5), a custom-built scanning mobility particle sizer (SMPS) was used (DMA – differential mobility analyser, Hauke type medium, custom-built; CPC – condensation particle counter, 3010, TSI Inc., USA) (Svenningsson et al., 2008). The scan time of the DMA was 2 min and the particle size range measured was 15–532 nm. SMPS size distributions were corrected for sampling losses using the Particle Loss Calculator tool (von der Weiden et al., 2009).
The particle chemical composition was evaluated online with a soot particle aerosol mass spectrometer (SP-AMS, Aerodyne Research Inc.) (Onasch et al., 2012). The SP-AMS was alternately run in single and dual-vaporizer mode during winter and only in single vaporizer mode during summer. In single vaporizer mode, particles are flash-vaporized upon impaction on a heated (600 ∘C) tungsten surface. In the dual-vaporizer mode, particles containing refractory black carbon (rBC) are vaporized by an Nd:YAG laser (1064 nm). The vapours are then ionized (70 eV electron ionization) and detected in a high-resolution time-of-flight (HR-ToF) mass spectrometer. The SP-AMS ionization efficiency with respect to nitrate was calibrated using 300 nm ammonium nitrate particles, and for rBC calibration, regal black was used. The relative ionization efficiency for ammonium (RIE- NH4) was 3.8 in winter and 4.0 in summer, and the collection efficiency (CE) was assumed to be 0.5 for both campaigns. SP was not used in the summer in order not to affect the detection of other compounds, since the BC levels were found to be low in the winter campaign. SP-AMS data analysis was performed using Igor Pro 6.37 (Wavemetrics, USA), Squirrel 1.57I, and PIKA 1.16I. In addition to the SP-AMS measurements, equivalent black carbon (eBC) content was measured with online, filter-based optical absorption methods, using a seven-wavelength Aethalometer (model AE33, Magee Scientific) (Drinovec et al., 2015) and a 637 nm multi-angle absorption photometer (MAAP; Thermo Fisher Scientific) (Müller et al., 2011), both with a sample time of 1 min. For the gaseous compounds, CO2 was measured at 1 Hz with a non-dispersive infrared gas analyser (LI840, LI-COR), NOx was measured every minute using a chemiluminescence monitor (CLD 700 AL, Eco Physics), and SO2 was measured every minute using a UV fluorescent SO2 analyser (S.A AF22M, Environnement).
A potential aerosol mass (PAM) oxidation flow reactor (OFR) (Kang et al., 2007; Lambe et al., 2011) was alternately connected before the SP-AMS, SMPS, and Aethalometer to simulate atmospheric ageing during parts of the summer campaign. The reactor is a 13.2 L aluminium cylinder with two UV lamps mounted inside. The reactor produces high levels of ozone and hydroxyl radicals (OH), and has been shown to produce similar yields and mass spectra to those from traditionally used smog chambers (Bruns et al., 2015; Lambe et al., 2015). The flow through the reactor was 5 L min−1, which gives an average residence time of 160 s. The particle instruments sampled air from the radial centre of the reactor, while ozone was sampled from a perforated Teflon tube ring. The reactor and bypass sampling was controlled using an automated three-way valve which switched every 30 min. The first 5 min of ambient data and the first 10 min of reactor data were not analysed, in order to give the sampling line time enough to stabilize flows. In some previous field studies with the PAM-OFR (Ortega et al., 2016; Palm et al., 2016), it was placed outside with the end plate removed, directly sampling ambient air. This has been shown to minimize losses (Ortega et al., 2013). Due to the location, this was not possible in the present study. A fine metal mesh grid, which is usually installed at the inlet side of the reactor to help develop a laminar flow, was removed in order to minimize losses. Further details about the simulated atmospheric ageing, including calibration, particle losses, and the fate of produced low-volatile species, are discussed in the Supplement (Figs. S3–S5).
Individual ship plumes were extracted from the data set based on a set of criteria which are described in the companion paper (Ausmeel et al., 2019). In brief, plumes were initially selected by inspection of the time series, choosing peaks in particle number concentration where there was a clear increase above the background and noise level. This increase should not be longer than about 20 min and not shorter than about 5 min, to exclude other potential sources than ship plumes from the nearby lane. In order to assess individual ship plumes, no plumes that were overlapping or close to each other in time (less than 5 min) were included in the analysis. Plumes were only selected when the wind was blowing over the shipping lane to the measurement station. Further, automatic ship identification system (AIS) position data were used to confirm that the increase in particles was due to a passing ship. This was performed by calculating a trajectory of the emission plume from the ship using wind data. The expected plume passage based on AIS and wind data and the visible plumes in the particle counter agreed excellently, and a large fraction (>95 %) of the plumes (including all plume events, not only the plumes ultimately used for analysis, of which 100 % were confirmed with AIS) was detectable as a distinct increase compared to background particle concentrations. Background concentrations were subtracted from the total plume concentration to get only ship emission contributions. The background level in this analysis was defined as the baseline concentration from which the identified plumes can be distinguished (the background concentration was always relatively stable during onshore wind – see Fig. 2 – and hence the background subtraction was straightforward). The background aerosol contains particles from several emission sources, including ship emissions from other regions which are well-mixed in the air. Hence, the contribution from ships presented in this paper is not necessarily the total contribution from shipping but only from one shipping lane of interest at a specific distance from the measurement site. For other variables, such as eBC measured with the Aethalometer, aerosol mass measured with SP-AMS, and aerosol number concentration of larger particles (diameter above 530 nm) measured with an aerosol particle sizer (APS), most individual plumes were not observable through a visual inspection of the time series. For these, the contribution during the plume duration was still calculated in the same way as for particle number concentration using the same time stamps, followed by a statistical analysis (t test) of whether this contribution was significantly larger than the background concentrations (Ausmeel et al., 2019).
The average concentration for each plume was calculated by integrating the total area under the plume peak. The values were then normalized by the plume duration to give an average plume peak concentration. All ship passages that resulted in an elevated particle number concentration, fulfilling the criteria for plume selection listed above, and which could be connected to an individual ship with AIS were included in the calculation of the average contribution from the fleet. Daily and seasonal contribution values from the shipping lane are calculated based on AIS data, which showed an average of 73 and 63 ships passing per day in winter and summer, respectively. During periods when the wind blows from the Øresund Strait (i.e. across the shipping lane), the Falsterbo site is hence affected by the nearest shipping lane approximately 51 % of the time in the winter and 44 % in the summer, based on the average observed plume duration of 10 min multiplied with the average number of ships per day. Based on historical wind data from the last 20 years (Swedish Meteorological and Hydrological Institute, SMHI), the wind intercepts the shipping lanes in Øresund Strait about 70 % of the time in both summer and winter, which was used to estimate the seasonal contribution from ships. For the daily and seasonal estimates, it was assumed that the average ship plume contribution (Δplume) is representative of all plumes. For calculation of the uncertainty in the daily and seasonal contribution, the uncertainty in aerosol number concentration was estimated to be 30 %, the uncertainty in particle loss estimation was 30 %, the variation in ship traffic density was 17 %–34 %, and the uncertainty in seasonal wind pattern was estimated to be 5 %. These values were used to calculate the total uncertainty with error propagation, i.e. added in quadrature.
3.1 Plume identification and general characteristics
An example of a time series from the SMPS (size distribution and number concentration) and SP-AMS (chemical speciation) during wintertime is shown in Fig. 2. Panel b also displays the times when ship plumes were expected to arrive at the measurement station based on ship position (AIS) and wind data. The plumes can visibly be distinguished from the background concentration in the time series of the particle number concentration (Fig. 2a and b) as relatively short (ca. 10 min) and intense peaks, generally matching expected passages well. Most particles are in the lower range of the size spectrum, below 100 nm in diameter (Fig. 2a). This is also reflected in the volume concentration (Fig. 2b), which does not increase during all plume events, since the small particles do not contribute greatly to the total volume compared to the background concentrations. This means that most particles from ship emissions do not contribute directly to local particle mass concentrations, while the contribution to number concentration is larger. Note that this is valid at the measurement site, ca. 30 min downwind of the emission source. Secondary aerosol formation can still contribute to larger mass further downwind, which is discussed in Sect. 3.5, “Simulation of atmospheric processing”. In summary, several hundred ships passed the measurement station during the campaigns (approximately 70 per day), and those that it was possible to attribute to a specific ship were studied in detail. Mass concentrations (PM0.15 and PM0.5) were calculated from particle number size distributions and evaluated for 113 plumes in the winter. Chemical composition from SP-AMS measurements was evaluated for 15 and 18 plumes in winter and summer, respectively. In total, 76 plumes were evaluated for NOx and 100 plumes for eBC in the winter. The lack of eBC and NOx data as well size distributions in the summer was due to either instrument malfunction or unfavourable winds. Particles with an aerodynamic equivalent diameter larger than 530 nm did not contribute significantly to the particle number or mass concentration. This was shown by the APS (APS 3321, TSI Inc. USA) measurements (0.5–20 µm). For all identified plumes, the contribution to PM2.5 and PM10 was assessed based on APS size distribution (assuming spherical particles with unit density). For the plumes observed in this study, there was no contribution to PM2.5 or PM10 distinguishable from background levels.
A general feature observed in both measurement campaigns is that the particle properties varied from ship to ship. As described in Ausmeel et al. (2019), the ships evaluated in this study varied in size, load, etc. The deadweight tonnage was 1–140 kt (10th and 90th percentile) with a median of 6 kt. The ship speed was 5–19 knots (10th and 90th percentile) with a median of 11 kn. The ships observed in this study were mainly of the types cargo ship, tanker, and ro-ro ship. A correlation test with linear least square regression was performed on all plume aerosol variables versus all ship properties. No significant correlation was found, even when normalizing plume concentrations for plume transport time. Hence, we could not conclude that there was any relation between observed aerosol emissions 30 min downwind of the emission source and specific ship properties. However, for some variables there were few plumes observed, e.g. during summer when AIS data were lacking and for particle mass measurements (see Table 1 and Fig. 3). A larger set of plumes would be needed for such relations to be observed, if present. Large variations between individual ships were also shown by Jonsson et al. (2011) at a measurement distance of 0.5–1 km from the ships. In this study, there were no data currently available on the specific fuel used by each ship or in the Baltic Sea in general. However, according to Jonson et al. (2015), the fuel distribution in the Baltic and North Sea in 2011 was around 74 % residual (e.g. HFO) and 26 % were distillate (MDO – marine diesel oil, MGO – marine gas oil). Further, Johansson and Jalkanen (2016) reported an 88 % decrease in SOx and a 36 % decrease in PM2.5 emissions from the year 2014 to 2015 in the Baltic Sea, based on AIS data and emission modelling. Strong decreases in SOx and PM2.5 due to SECA implementations have also been predicted and reported in, e.g., Kalli et al. (2013) and Jonson et al. (2015). Regarding the use of scrubbers to reduce airborne sulfur emissions, in the paper by Jonson et al. (2019) it is stated that there was an increase in the number of scrubbers used globally, from 77 vessels in 2014 to 155 in 2016. Of these, 85 vessels with scrubbers were operating in the Baltic Sea area in 2016. This is a small fraction of the >20 000 ships operating in the region (Johansson and Jalkanen, 2016).
Table 1Average absolute contribution of particle mass (PM), NO2, equivalent black carbon (eBC), particle number concentration (PN), SO2, and CO2 to local air quality due to a number (n) of ship plumes, from two measurement campaigns at the Falsterbo coastal site.
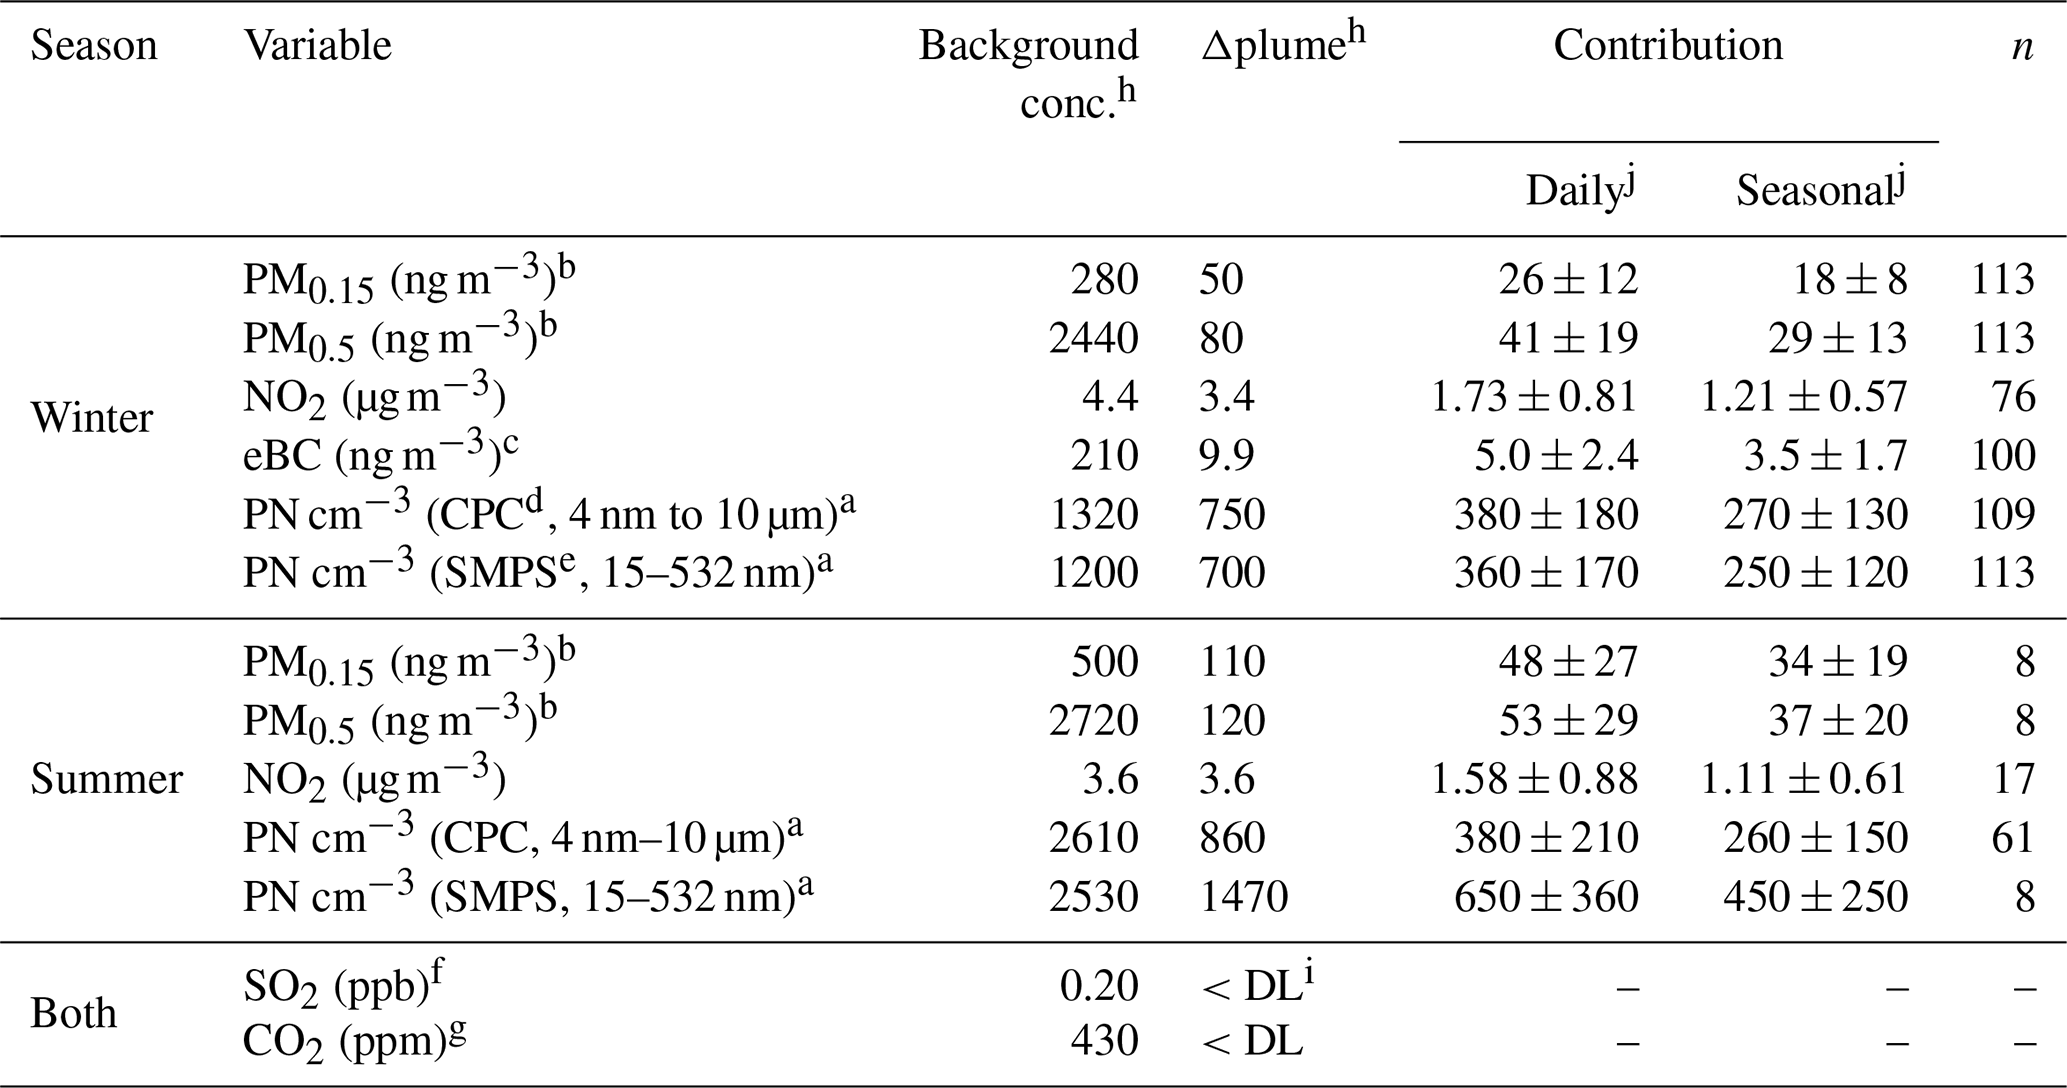
a Value from Ausmeel et al. (2019). b Based on size distribution data. c Based on Aethalometer data (880 nm). pd Condensation particle counter. e Scanning mobility particle sizer. f Plume concentrations not distinguishable from background; instrument noise level is <1 ppm, according to manufacturer. g Plume concentrations not distinguishable from background; instrument noise level is <0.5 ppb, according to manufacturer. h The background particle and gas concentrations (background conc.) and the contribution due to ships (average plume conc.) to different pollutants. Each value represents an average of a number of plumes (n) and is calculated from the ship plume peak average concentration (i.e. concentration per unit time). i Below detection limit (<DL). j “Daily” values refer to days with wind directions where ships affect Falsterbo (mainly westerly) and “seasonal” values refer to the average contribution observed at each campaign extrapolated over one season, including all wind directions.
The fact that Falsterbo is often not affected by a large particle volume (or mass) contribution from ships could potentially be explained by the recently implemented SECA regulations, making ship owners improve or switch to other fuels. The effect of sulfur regulations on the chemical composition is discussed further in Sect. 3.4. In this study, we only consider emissions from the shipping lane passing about 10 km from the measurement location. Depending on wind direction, it is also likely that the background particle concentrations contain emissions from ships in other regions, making the actual effect of ships on the local air quality larger. In a region with more ship traffic or in harbour areas, the local effects on particle levels and consequently health implications will be of greater concern.
In Table 1, the average measured plume concentration is presented together with the background concentration (i.e. without local plume contribution) as well as estimated corresponding daily and seasonal contributions of the shipping lane during winter and summer to PM0.15, PM0.5, NO2, eBC, and particle number (PN) levels. The measured ambient concentrations of SO2 and CO2 are also shown, although individual plumes were not distinguishable from the background. SO2 is typically of interest in ship emission studies due to the fuel sulfur content, especially before regulations and outside SECAs. At the current distance of ca. 10 km from the shipping lane, SO2 plume concentrations were too diluted to be detected and separated from ambient background levels in the winter campaign with an instrument noise level of 0.5 ppb. No measurements of SO2 were performed during the summer campaign. It is still possible that there is a ship contribution to SO2, but the individual peaks are smeared out so that it appears as a general increase in background level. SO2 concentrations in Falsterbo were in general low: below 1 ppb. Ship contributions to CO2 were also not detected, with an instrument noise level of less than 1 ppm. Therefore, it was not possible to calculate emission factors at this distance from the shipping lane.
3.2 Contribution to particle mass concentrations
Particulate mass concentrations were calculated from the SMPS size distributions, assuming spherical particles with a density of 1.5 g cm−3 (Matthias et al., 2010). Mass concentration values presented here are given in PM0.15 or PM0.5 (particulate matter in the in the range 15–150 or 15–500 nm). The PM0.15 contribution was included in this study to be able to compare with Kivekäs et al. (2014), who also presented this contribution. Figure S1 shows the frequency distribution of the 113 individual contributions of plumes to PM0.5 during the winter campaign. Most ships have a small contribution to PM of less than 100 ng m−3. A relatively low PM is expected in the strictest SECA regions compared to elsewhere due to the strong reduction in particulate sulfate. However, there are multiple reasons for the low PM contribution observed in Falsterbo. The fuel sulfur content and the small, but existing, use of scrubbers is the first explanation, and the compliance with these regulations is indeed high. Secondly, the impact presented is from one shipping lane, and the total contribution from shipping is hence larger due to ship emissions being a source of the regional background aerosol. Thirdly, the ships in Falsterbo are relatively small compared to the rest of the Baltic and on larger seas elsewhere, since they have to pass the Øresund Strait and under bridges. Smaller ships typically have lower engine power and emit less air pollutants on an absolute scale. Meteorological factors did not seem to influence the plume detection to any large extent, and the shipping lane contribution to ambient concentrations was similar in both the summer and winter campaign. However, longer measurements would be needed to study the effect of meteorological parameters on plume detection, and this will be of even greater importance in other measurement sites where there is the risk of a build-up of a thermal internal boundary layer at the shoreline.
A few ships can be regarded as relatively high mass contributors. It cannot be determined from our results whether the high contributors to observed plume peaks at the coastline were non-compliant with the SECA regulations. Based on the number of plumes which resulted in high PM concentrations (either BC, organics, or sulfate or all of these) and compared to the number of plumes that should have intersected the measurement site based on AIS and wind data, about 2 %–5 % were detected by our aerosol instrumentation. This number is in the same order of magnitude as the level of non-compliance reported by Mellqvist et al. (2017) and could be related to the potentially higher emissions from such ships. In order to link these plumes to non-compliance, a more detailed study of the stack emission and the fuel properties (or use of exhaust scrubbers) is needed. Using the average PM for all ships, the contribution to the daily PM0.15 and PM0.5 levels in Falsterbo is around 8 % and 1 %, respectively. The contribution during the summer and winter measurements (assuming winds carrying ship emissions during 70 % of the year) was ca. 8 %–10 % and 1 % for PM0.15 and PM0.5, respectively (Table 1). Hence, we show that ships in this part of the Baltic SECA generally contribute with low PM concentrations. However, although mass contributions are low in this study, they can still be higher in areas with even more intense ship traffic or close to harbours.
In a similar study to ours by Kivekäs et al. (2014), their reported PM0.15 values were 100 ng m−3 within plumes and 23 ng m−3 daily contribution. This compares well to our values of about 50 ng m−3 within plumes and 26 ng m−3 daily contribution. However, there are several factors impacting the particle concentrations which differ between the locations, which makes a detailed comparison for, e.g., evaluating the effect of SECA regulations difficult. In the study by Kivekäs et al. (2014) the data cover a larger ship corridor in the North Sea. Hence, the ships were also larger (had higher gross tonnage and deadweight), and the particle source is consequently not the same as in Falsterbo. Additionally, the distance between the ships and the station is larger in the Kivekäs et al. (2014) study, suggesting that plumes could be more diluted. However, the most rapid dilution occurs directly after emission and then much more slowly after around 30 min of atmospheric transport (Tian et al., 2014), which suggests that this should not constitute a large difference between the observed particle concentration between the sites. The particle mass can also be affected by the current chemical state of the atmosphere, e.g. by differences in seasons and meteorology. According to Kivekäs et al. (2014), the maximum distance between ship and measurement site for which plumes were still visible as an increase in number concentration was about 50 km, and they suggested measurements should be performed at distances shorter than 45 min of transport time. In this study, we registered all plumes in particle number concentration at a distance of less than 45 min. However, mass concentrations and some gaseous compound were still not detectable for all ships.
In a model study by Karl et al. (2019), three different regional chemistry transport model systems were used to study the influence of shipping in the Baltic Sea region, including the Øresund region, in which our measurements took place. The maximum annual mean PM2.5 contribution from shipping in the Øresund region was reported as 0.9 µg m−3, corresponding to a relative contribution of 10 %. From our observations, ship plumes contributed with 0.029±0.013µg m−3 (winter) and 0.037±0.020 µg m−3 (summer). Since we only observe the contribution from a single shipping lane, the comparatively low PM2.5 contribution is not unexpected. However, the factor of 20–30 difference between our observations and the contribution modelled by Karl et al. (2019) is still large. This could potentially be explained by the emission inventory used in model simulations being older than the most recent SECA regulation. Further studies of SECA regions and the typical fuels used within these would be valuable for confirming a potential decrease in the total PM contribution from ships due to the sulfur regulations.
3.3 Contribution to NO2
Plumes contained about 0–10 µg m−3 of NO2, with a similar distribution among ships as for PM concentrations, i.e. that a few ships contributed with high concentrations while the majority of the plumes were diluted to below the detection limit of the instrument (0.1 ppm). The plume NO2 concentrations, with background subtracted, are shown in Fig. S2, and average NO2 values are presented in Table 1. There was in general no increase in NO concentration associated with the ships in this study. One instance of elevated NO was recorded and attributed to a pleasure craft passing very close to the station (less than 1 km away and about 5 min of plume transport). This type of ship is not representative of the fleet in general and is not considered in further results or discussion. Except for this case, all contribution to NOx was in the form of NO2 both during winter and summer and during the day and night-time. This implies that the plume transport in this case results in a well-mixed plume reaching the coast line. In a study by Karl et al. (2019), the ship-related NO2 concentrations in the Baltic Sea region were evaluated using three regional chemistry transport model systems. It was found that the contribution was 3–5 µg m−3 along the main shipping routes. Our observed seasonal contributions in Falsterbo of 1.21±0.57 µg m−3 (winter) and 1.11±0.61 µg m−3 (summer) are lower than the one presented by Karl et al. (2019) Since our measurement campaign is limited to one shipping lane, we are likely treating diluted ship emissions from further away as background emissions, and hence our calculated contribution is likely a lower estimate. The measurements presented here are also limited in time and do not cover a full year of observations.
3.4 Contribution to BC and chemical composition
The contribution from ships to measured eBC during winter was 3.5±1.7 ng m−3, which is 2 % compared to background eBC levels (Table 1). For eBC, a very small number of ships are contributing. Most plumes show no eBC contribution at all while still increasing the particle number and mass concentration to some degree, indicating other major particle components. Within the ship plumes, the average eBC fraction corresponds to approximately 5 % of the total PM0.5 mass. An eBC fraction of 5 % is very low compared to previous ship emission studies. The individual eBC fraction varied a lot from ship to ship, which can depend on many factors including engine operation, fuel type, and the use of scrubbers. The 10 % of the plumes (n=15) with the highest eBC mass contribution (>20 ng m−3) had an average eBC fraction (±1σ) of 40±20 % of the PM0.5 calculated from SMPS size distributions. The absorption Ångström exponent (AAE) was calculated for the plumes, using seven wavelengths of the Aethalometer, after background subtraction, and was on average ∼1, which is typical for fresh BC (Kirchstetter et al., 2004; Sandradewi et al., 2008; Zotter et al., 2017).
Previous studies have shown an increase in light absorption at shorter wavelengths in plumes, indicating a significant fraction of brown carbon (BrC) (Yu et al., 2018; Corbin et al., 2018, 2019). This was not seen in our study in the Baltic Sea SECA, which is in line with Corbin et al. (2018), who showed that the burning of heavy fuel oil resulted in both BC and BrC, while marine gas oil or diesel fuel resulted in negligible BrC fractions and an AAE close to 1, suggesting that distillate fuel is dominant in our sample. Heavy fuel oil is not expected to be used to any large degree within the SECA. For the MAAP, the plumes were not distinguishable from the background due to the detection limit of the instrument. The rBC content was also measured with the SP-AMS in the winter campaign, showing similar results with a low contribution in general. There are, however, studies that have shown a significant BC fraction in ship exhaust. Lack et al. (2009) reported an average particle composition of 15 % BC, 46 % sulfate, and 39 % organic matter. Cappa et al. (2014) measured emission factors of BC from a ship running on low-sulfur marine gas oil and found extremely small sulfate fractions, while organic matter and BC dominated the particulate matter, with approximately 63 % BC at a speed of 6.9 kn and 25 % at a speed of 12 kn. Hence, the average BC fraction of 5 % observed in Falsterbo appears to be relatively low, even with an average speed closer to 12 kn. It has been shown that BC emission factors depend on operating conditions, fuel quality, and the potential use of scrubbers for reducing sulfur emissions (Lack and Corbett, 2012). Jonsson et al. (2011) showed that the non-volatile fraction of fresh ship emissions in a region close to Falsterbo (Gothenburg, west coast of Sweden) contributed to slightly less than 50 % of the total particle population. However, it cannot be determined whether the non-volatile fraction consists of soot particles or non-volatile organic compounds. In the model study of the Baltic region specifically (Karl et al., 2019), the shipping contribution to aerosol elemental carbon (EC) was found to be 0.03–0.04 µg m−3 along the main shipping routes and in the main ports. This is a factor of 10 larger than our measured contribution of 3.5 ng m−3, similar to the discrepancy in NOx, possibly due to the emission inventory being from before the most recent SECA regulation as well as the difference between the total influence from shipping versus that from one shipping lane.
Due to the small particle sizes and consequently the low mass concentration when diluted, the filter-based measurement techniques are not optimal for investigating the presence of soot particles with our type of set-up (there could potentially be a high number concentration of small soot particles, while at the same time the BC concentration is low due to low light absorption). Also, the SP-AMS has a detection limit for particle size and hence some ship-emitted particles at small sizes are not measured by the SP-AMS, and those that are still contribute with a relatively small mass fraction. For further studies of ship BC emissions, other measurement techniques, such as the Single Particle Soot Photometer (SP2), which measures individual soot particles down to ∼0.3 fg, could be useful. Also, extracting microscopy pictures of the PM0.1 fraction in fresh ship emission plumes could be useful for determining the presence of smaller-sized soot particles.
The chemical composition of the ship plumes with relatively high PM contribution was provided by the SP-AMS measurements. In summary, the contribution to total PM is low with a very small or non-distinguishable refractory BC (rBC) fraction. Figure 3 shows the chemical composition of all plumes with a total mass concentration of more than 0.1 µg m−3 (in order of decreasing mass). The average composition is inserted for each season. As seen in Fig. 3, when plumes have relatively high mass concentrations, the particles contain mainly sulfate and organics. For individual ships, there was a high variability in these fractions, but there seems to be a higher fraction of organics in the summer based on the 33 observed plumes. Of the 33 plumes which were chemically resolved with AMS, there were 14 plumes with zero or close to zero (<0.01 µg m−3) sulfate content and two plumes with zero or close to zero organics. The organic matter fraction (Org, OM) was translated to organic carbon (OC) using a conversion factor of 1.2, which is given by Canagaratna et al. (2015) for hydrocarbon-like organic aerosol (HOA). For the 17 plumes which contained both a sulfate and an organic fraction, the average Org:SO4 (±1 SD) ratio was 2.3±3.2. Studies of single ships or test-bed engines show largely varying organics-to-sulfate ratios. In the study by Murphy et al. (2009), the OC:SO4 ratio was 0.30±0.01 in an airborne exhaust plume. The ship in that paper was running on a 3 % m∕m sulfur heavy fuel oil. In a study by Moldanová et al. (2009), OM:SO4 was around 2.4 for HFO (or OC:SO4 around 2.9, using the conversion factor OC=1.2 OM given above), and in another study by Petzold et al. (2011), OM:SO4 was around 0.38 for HFO and 16 for a marine gas oil (or OC:SO4 around 0.46 and 19, respectively). Mueller et al. (2015) reported an OM:SO4 which was around 3.8 for HFO and 515 for a marine diesel fuel (or OC:SO4 around 4.6 and 618, respectively). There are also studies reporting chemical composition for multiple ships, measured in ambient air, which is more comparable to our observations. Based on the average OC and SO4 in 43 ship plumes measured by Lack et al. (2009), where the emission factors were 1.21±1.50 g (kg fuel)−1 (36 %) for sulfate and 1.26±0.96 g (kg fuel)−1 for OM, the corresponding average OM:SO4 is then 1.04 (or OC:SO4 around 1.25). Similarly, for the 139 ship plumes observed by Diesch et al. (2013), the average OM:SO4 was 3.3 (or OC:SO4 around 4.0). Our ratio of 2.3±3.2 is hence in the same range as previous studies. Murphy et al. (2009) observed that the OC:SO4 was constant during the first hour of plume dilution into the marine boundary layer. To confirm this at our measurement site, more chemically resolved ship plumes are needed.
In addition to a variable chemical content, there was also a large variation in total mass of the ship plume aerosol, where many of the plumes detected by the CPC were not seen at all in the volume and mass concentration time series (SMPS and SP-AMS), hence the relatively small number of plumes in Fig. 3. Most plumes were simply not above the SP-AMS detection limit (<50 nm) with the settings used, which was also confirmed with the SMPS particle volume. However, the particles with a diameter below 50 nm will not contribute largely to the total mass, and the results presented here hence focus on the plumes with the largest PM contribution. Whether the difference in mass and specifically the organic fraction is significant between seasons requires further measurements.
In one instance, the plume from an individual ship was detected multiple times. This is indicated with symbols in Fig. 3, where the ship passed the Falsterbo peninsula on three different occasions during the winter campaign. All plumes were detected during night-time, and the ship-to-site distance and the transport time were similar (12–15 km and 20–30 min) on all occasions. The chemical composition and the total mass is similar for the plumes from this ship, with similar fractions of sulfate and organics, compared to the large variability between different ships. This suggests that there is reproducibility in the method. For future studies, AIS data can be used to deduce which ship and engine types and fuels used are responsible for the increases in number and mass concentrations. For the organic fraction of the particles from all of the 33 ship plumes measurable by the SP-AMS, a larger amount of organics was seen in the plumes during summer. Comparing the mass spectra (Fig. 3) shows that the organic ship aerosol is very similar in winter and summer, which strengthens the validity of the method used. The organic aerosol mass spectrum of the ship plumes in Falsterbo is similar to that measured in a laboratory study by Mueller et al. (2015), as well as in ambient conditions measured by Murphy et al. (2009) and Lu et al. (2006). The dominant hydrocarbon fragments are in general similar to those observed in aerosols from other traffic sources such as diesel emissions (Canagaratna et al., 2004). Elemental analysis of carbon, oxygen, and hydrogen content was performed according to Canagaratna et al. (2015) and resulted in similar O:C and H:C ratios in both campaigns. The O:C ratio in the plume was 0.20 in winter and 0.21 in summer, while the H:C ratio was 1.89 in winter and 1.73 in summer. Hence, there is no indication of particularly stronger oxidation or ageing of the plumes in the summer, possibly due to the relatively short transport time.
3.5 Simulation of atmospheric processing
Figure 4 shows an overview of the results from simulated ageing with an OFR of ship plume aerosol during the summer campaign. During the reactor period, the ambient aerosol particles were dominated by organics (78 % by mass) and sulfate (14 % by mass). The wind direction during the OFR experiment was mostly 90–180∘, making the distance to ship lanes a few kilometres longer compared to periods with westerly winds. Also, the wind speed was typically lower during the OFR period, making the transport time of the plume about 90 min long compared to about 30 min during westerly winds. The reactor mainly changed the aerosol in two ways. A large number of small particles were produced, and the O:C ratio was increased. The number of particles increases because a supersaturation of condensable vapours is produced as the aerosol enters the highly oxidizing environment. In the atmosphere, the production rate of these vapours is lower and instead of nucleating they would likely condense onto pre-existing particles. The ratio between reactor and ambient mass was mostly between 0.8 and 1.2. Much of this variation can be explained by the naturally changing ambient concentrations, since the enhancement is calculated as an average of reactor and bypass measurements varying with time. Notably there is no PM formation in the OFR in periods where no plumes are predicted. The contribution of precursors from individual ships cannot be extracted from the data due to mixing in the OFR. Although there are periods of significant secondary PM formation (Fig. 4), considering the predicted number of plumes impacting the site, it is clear that most plumes did not contribute measurable amounts of secondary PM (as produced by the OFR). For example, none of the plumes (n=28) that were sampled during the last day (7 June 2016) of the experiment resulted in a net increase in PM1 after simulated ageing. However, for the period during which plumes produced secondary PM in the reactor (3 and 4 June 2016), rather high concentrations (several micrograms per cubic metre) were produced (see Fig. 4). For this period, if we assume that only one plume per hour is actually causing the secondary PM, this corresponds to 19 out of a total of 154 ships, i.e. 12 %. Assuming instead that all ships sampled in a given hour contributed to the secondary PM, this results in 60 out of a total of 154 ships, i.e. 39 %. As some of the 154 plumes may individually contribute below the detection limit (indeed this seems likely) and we cannot rule out interferences from non-ship sources, we consider 39 % an upper limit on the fraction of ship plumes which contributed to secondary PM in our OFR experiment. Considering that none of the observed plume concentrations was above 1 µg m−3 without OFR processing (see Fig. 3), this suggests that more PM forms in the plumes further downwind of the measurement site.
As shown in Fig. 4, some periods of secondary particle formation were observed in the reactor. The increase was due to sulfate and secondary organic aerosol (SOA) formation. Figure 5 shows one of these periods with a higher time resolution, where several consecutive OFR engagements result in high (up to a factor ∼2) increases in PM1 from secondary aerosol formation. Particle volume increases during the periods with secondary PM formation in the OFR were a factor of 1.5–2.5, and the absolute mass increase was several micrograms per cubic metre. While both estimated volume from the SMPS and mass concentration as measured by the SP-AMS increased simultaneously during OFR processing, the magnitudes of the increase are not the same due to changes in the SP-AMS collection efficiency, as further discussed in the OFR section of the Supplement. The increases in nitrate and ammonium were moderate on an absolute scale. During the periods where no ship plumes were predicted, the difference between reactor and ambient measurements was close to zero, suggesting no net secondary formation from ageing of the background air mass and negligible particle losses on a mass basis.
Modelling of the fate of produced low-volatile species (Supplement and Fig. S4) suggests that a significant portion (∼60 %–90 %) of the oxidation products do not enter the particle phase due to the low condensation sink. Although the model was set up for organics, this is true for all secondary aerosol species formed in the reactor. Particulate nitrate formation will also be sensitive to the availability of gas-phase ammonia to neutralize the aerosol. There was no diurnal trend in the enhancements, in contrast with previous OFR field campaigns in urban (Ortega et al., 2016) and forested areas (Palm et al., 2016). This may be caused by the background air masses reaching the site already being somewhat aged and precursor concentrations being low. Further, the fact that the reactor was kept in an air-conditioned space increases the losses when it is colder outside (e.g. during nights), which was also seen by Ahlberg et al. (2019). No trend in the enhancement of particle mass with OH exposure was seen, likely due to the comparably low exposures. Ambient O:C and H:C ratios, commonly used as a proxy for atmospheric age, were on average 0.62±0.15 and 1.53±0.15 (1σ), respectively. The reactor produced an organic aerosol with a significantly higher O:C ratio (0.76±0.17), while H:C was not affected to any large degree (1.51±0.16). The O:C increase at times when aerosol mass was not increased (i.e. for the background aerosol and the majority of the plumes), suggests either heterogeneous oxidation or that SOA mass was formed and lost in similar magnitudes.
While the bulk of the secondary PM formed was due to organic compounds (see Fig. 4), two OFR engagements, shown in Fig. 5, additionally resulted in high sulfate formation. The increase in sulfate upon processing, which was not observed for the vast majority of the approximately 100 plumes sampled, was possibly due to failure to comply with the Sulfur Emission Control Area regulations. No SO2 data are available from the same period. In future ship emission campaigns, both SO2 and VOC measurements would be useful for evaluating secondary PM formation and as tracers for ship emissions in general. OFRs can be used for qualitatively observing ships that contribute a lot to secondary aerosol inland but should preferably be placed closer to the shipping lanes. Care must also be taken to ensure that reported secondary particle formation is not influenced by the background condensation sink (Palm et al., 2016; Ahlberg et al., 2019).
Ship emission plumes from the Øresund Strait were sampled with several online aerosol measurement techniques at a coastline in southern Sweden during the winter and summer of 2016. Plumes ranging in number from a few to 100 were analysed for particle mass contribution (PM00.15 and PM0.5), particle chemical composition, and gaseous NO2. The aerosol particles were exposed to additional atmospheric ageing using an oxidation flow reactor. The ageing of the background aerosol at Falsterbo in the oxidation flow reactor did not show significant increases in secondary mass, despite an increase in the O:C ratio. We suggest that the reason for this is that the regional background particles from long-range transport arriving at Falsterbo are already relatively aged. During the limited flow reactor measurements, there were a few cases with a clear increase in sulfate and organic mass behind the flow reactor. However, the distance from ships during these days is relatively large and the contribution from individual ships is not clear, which means that further studies are needed to infer how aged shipping particles can influence particle exposure. Falsterbo would be a good place to do further oxidative ageing experiments but with a slightly different set-up than used in this study and for a longer time period. A common observation for all aerosol parameters was large ship-to-ship variations in aerosol properties and plume concentrations, and these variations were not found to be correlated with any specific ship properties or plume transport time. Hence, the differences can be attributed to meteorological effects or variable exhaust properties. To determine which effect is most dominant, further studies are required. For example, successful CO2 measurements would make it possible to calculate emission factors of the aerosol species. To measure CO2 in ship plumes, the measurements should either take place closer than 10 km from the emission source or instruments with high sensitivity (better than <1 ppm) must be used. During these measurement campaigns, ships in this part of the Baltic Sea SECA did generally contribute with low PM concentrations. The PM was dominated by organics and sulfate, in varying fractions, and the organic mass spectrum strongly resembled that of typical diesel emissions. We were able to detect BC in plumes with one out of three instruments measuring BC, namely the Aethalometer. The AAE of the ship BC vas close to 1, indicating that diesel-like fuel was common rather than heavy fuel oil, which is to be expected within a SECA. The contribution to eBC concentrations was relatively small (on average 3.5 ng m−3) like the contribution to PM0.5 exposure in general. The eBC fraction of the total mass was approximately 5 % in the diluted plumes, which is small compared to other ship emission studies. The BC contribution of ships sailing along shipping routes in this region is relatively small as has been demonstrated in this study. This indicates a smaller health impact due to BC compared to other anthropogenic BC sources. However, health effects due to other particle parameters might be significantly larger. For example, exposure to particle number concentration (Ausmeel et al., 2019), organic compounds, and NOx is higher. Although PM contributions are low in this study, they can still be higher in areas with more intense ship traffic, close to harbours, or in non-SECA regions. The regional impact of ships is higher than that measured in this study, since the background levels in Falsterbo also contain ship emissions from more distant shipping activities. This contribution is diffuse compared to the individual ship plumes and therefore not possible to assess with our method. Hence, we expect an additional gaseous and primary and secondary aerosol particle contribution from ships sailing further away than about 30 km from the coastline. In addition, our OFR measurements indicate a possible secondary aerosol PM influence.
The data sets used in this study are available upon request from the authors (Adam Kristensson, adam.kristensson@nuclear.lu.se).
The supplement contains, in the following order, frequency distributions of the individual contributions of ship plumes, technical details regarding the oxidation flow reactor including measured and modelled losses, and a comparison of SP-AMS and SMPS mass measurements during OFR periods. The supplement related to this article is available online at: https://doi.org/10.5194/acp-20-9135-2020-supplement.
SA analysed the aerosol data, was responsible for project administration during the summer campaign, and prepared the paper. AE was involved in the aerosol sampling and assisted in the data analysis and in the writing process. EA was involved in the aerosol sampling, conducted PAM-OFR experiments and analysis, prepared the relevant section of the paper, and assisted in the data analysis and in the writing process. MKS generated trajectories used in the PAM-OFR analysis and assisted in the writing process. MS was involved in the aerosol sampling and in the writing process. AK designed the study, developed the model code, was responsible for project administration during the winter campaign, and assisted in the writing process.
The authors declare that they have no conflict of interest.
This study was financed by the Swedish research council FORMAS. The Crafoord Foundation is acknowledged for the contribution to the MAAP instrument funding and funding of the postdoc position for the current studies. Fredrik Windmark, Swedish Meteorological and Hydrological Institute (SMHI), is acknowledged for helping to provide AIS data. Paul Hansson, Henric Nilsson, and Susanna Gustafsson from the Environment Department at the City of Malmö are acknowledged for helping prepare and set up the measurements at Falsterbo. Kirsten Kling of DTU and Antti Joonas Koivisto of NRCWE are acknowledged for helping with the summer campaign and Fredrik Mattsson and Anna Hansson for helping with the winter campaign. Thank you also to Håkan Lindberg and the personnel from Falsterbo golf course and Lennart Karlsson from Falsterbo bird watching station, who were willing to prepare a place for our measurement trailer, and to the County Administrative Board of Skåne and Vellinge municipality for giving permission to measure in Flommen Nature Reserve.
This research has been supported by the Swedish research council FORMAS (grant no. 2014-951) and the The Crafoord Foundation (grant nos. 20140955 and 20161026).
This paper was edited by Joel Thornton and reviewed by Matthias Karl and one anonymous referee.
Ahlberg, E., Ausmeel, S., Eriksson, A., Holst, T., Karlsson, T., Brune, W. H., Frank, G., Roldin, P., Kristensson, A., and Svenningsson, B.: No Particle Mass Enhancement from Induced Atmospheric Ageing at a Rural Site in Northern Europe, Atmosphere, 10, 408, https://doi.org/10.3390/atmos10070408, 2019.
Alföldy, B., Lööv, J. B., Lagler, F., Mellqvist, J., Berg, N., Beecken, J., Weststrate, H., Duyzer, J., Bencs, L., Horemans, B., Cavalli, F., Putaud, J.-P., Janssens-Maenhout, G., Csordás, A. P., Van Grieken, R., Borowiak, A., and Hjorth, J.: Measurements of air pollution emission factors for marine transportation in SECA, Atmos. Meas. Tech., 6, 1777–1791, https://doi.org/10.5194/amt-6-1777-2013, 2013.
Aliabadi, A. A., Staebler, R. M., and Sharma, S.: Air quality monitoring in communities of the Canadian Arctic during the high shipping season with a focus on local and marine pollution, Atmos. Chem. Phys., 15, 2651–2673, https://doi.org/10.5194/acp-15-2651-2015, 2015.
Aliabadi, A. A., Thomas, J. L., Herber, A. B., Staebler, R. M., Leaitch, W. R., Schulz, H., Law, K. S., Marelle, L., Burkart, J., Willis, M. D., Bozem, H., Hoor, P. M., Köllner, F., Schneider, J., Levasseur, M., and Abbatt, J. P. D.: Ship emissions measurement in the Arctic by plume intercepts of the Canadian Coast Guard icebreaker Amundsen from the Polar 6 aircraft platform, Atmos. Chem. Phys., 16, 7899–7916, https://doi.org/10.5194/acp-16-7899-2016, 2016.
Anderson, M., Salo, K., Hallquist, Å. M., and Fridell, E.: Characterization of particles from a marine engine operating at low loads, Atmos. Environ., 101, 65–71, 2015.
Ausmeel, S., Eriksson, A., Ahlberg, E., and Kristensson, A.: Methods for identifying aged ship plumes and estimating contribution to aerosol exposure downwind of shipping lanes, Atmos. Meas. Tech., 12, 4479–4493, https://doi.org/10.5194/amt-12-4479-2019, 2019.
Beecken, J., Mellqvist, J., Salo, K., Ekholm, J., and Jalkanen, J.-P.: Airborne emission measurements of SO2, NOx and particles from individual ships using a sniffer technique, Atmos. Meas. Tech., 7, 1957–1968, https://doi.org/10.5194/amt-7-1957-2014, 2014.
Betha, R., Russell, L. M., Sanchez, K. J., Liu, J., Price, D. J., Lamjiri, M. A., Chen, C.-L., Kuang, X. M., da Rocha, G. O., and Paulson, S. E.: Lower NOx but higher particle and black carbon emissions from renewable diesel compared to ultra low sulfur diesel in at-sea operations of a research vessel, Aerosol Sci. Technol., 51, 123–134, 2017.
Brandt, J., Silver, J. D., Christensen, J. H., Andersen, M. S., Bønløkke, J. H., Sigsgaard, T., Geels, C., Gross, A., Hansen, A. B., Hansen, K. M., Hedegaard, G. B., Kaas, E., and Frohn, L. M.: Assessment of past, present and future health-cost externalities of air pollution in Europe and the contribution from international ship traffic using the EVA model system, Atmos. Chem. Phys., 13, 7747–7764, https://doi.org/10.5194/acp-13-7747-2013, 2013.
Bruns, E. A., El Haddad, I., Keller, A., Klein, F., Kumar, N. K., Pieber, S. M., Corbin, J. C., Slowik, J. G., Brune, W. H., Baltensperger, U., and Prévôt, A. S. H.: Inter-comparison of laboratory smog chamber and flow reactor systems on organic aerosol yield and composition, Atmos. Meas. Tech., 8, 2315–2332, https://doi.org/10.5194/amt-8-2315-2015, 2015.
Buffaloe, G. M., Lack, D. A., Williams, E. J., Coffman, D., Hayden, K. L., Lerner, B. M., Li, S.-M., Nuaaman, I., Massoli, P., Onasch, T. B., Quinn, P. K., and Cappa, C. D.: Black carbon emissions from in-use ships: a California regional assessment, Atmos. Chem. Phys., 14, 1881–1896, https://doi.org/10.5194/acp-14-1881-2014, 2014.
Canagaratna, M. R., Jayne, J. T., Ghertner, D. A., Herndon, S., Shi, Q., Jimenez, J. L., Silva, P. J., Williams, P., Lanni, T., Drewnick, F., Demerjian, K. L., Kolb, C. E., and Worsnop, D. R.: Chase Studies of Particulate Emissions from in-use New York City Vehicles, Aerosol Sci. Technol., 38, 555–573, https://doi.org/10.1080/02786820490465504, 2004.
Canagaratna, M. R., Jimenez, J. L., Kroll, J. H., Chen, Q., Kessler, S. H., Massoli, P., Hildebrandt Ruiz, L., Fortner, E., Williams, L. R., Wilson, K. R., Surratt, J. D., Donahue, N. M., Jayne, J. T., and Worsnop, D. R.: Elemental ratio measurements of organic compounds using aerosol mass spectrometry: characterization, improved calibration, and implications, Atmos. Chem. Phys., 15, 253–272, https://doi.org/10.5194/acp-15-253-2015, 2015.
Cappa, C. D., Williams, E. J., Lack, D. A., Buffaloe, G. M., Coffman, D., Hayden, K. L., Herndon, S. C., Lerner, B. M., Li, S.-M., Massoli, P., McLaren, R., Nuaaman, I., Onasch, T. B., and Quinn, P. K.: A case study into the measurement of ship emissions from plume intercepts of the NOAA ship Miller Freeman, Atmos. Chem. Phys., 14, 1337–1352, https://doi.org/10.5194/acp-14-1337-2014, 2014.
Chen, G., Huey, L. G., Trainer, M., Nicks, D., Corbett, J., Ryerson, T., Parrish, D., Neuman, J. A., Nowak, J., Tanner, D., Holloway, J., Brock, C., Crawford, J., Olson, J. R., Sullivan, A., Weber, R., Schauffler, S., Donnelly, S., Atlas, E., Roberts, J., Flocke, F., Hübler, G., and Fehsenfeld, F.: An investigation of the chemistry of ship emission plumes during ITCT 2002, J. Geophys. Res., 110, D10S90, https://doi.org/10.1029/2004jd005236, 2005.
Cooper, D. A.: Exhaust emissions from high speed passenger ferries, Atmos. Environ., 35, 4189–4200, https://doi.org/10.1016/S1352-2310(01)00192-3, 2001.
Corbett, J. J. and Fischbeck, P.: Emissions from Ships, Science, 278, 823–824, https://doi.org/10.1126/science.278.5339.823, 1997.
Corbett, J. J., Winebrake, J. J., Green, E. H., Kasibhatla, P., Eyring, V., and Lauer, A.: Mortality from Ship Emissions: A Global Assessment, Environ. Sci. Technol., 41, 8512–8518, https://doi.org/10.1021/es071686z, 2007.
Corbin, J. C., Pieber, S. M., Czech, H., Zanatta, M., Jakobi, G., Massabò, D., Orasche, J., El Haddad, I., Mensah, A. A., Stengel, B., Drinovec, L., Mocnik, G., Zimmermann, R., Prévôt, A. S. H., and Gysel, M.: Brown and Black Carbon Emitted by a Marine Engine Operated on Heavy Fuel Oil and Distillate Fuels: Optical Properties, Size Distributions, and Emission Factors, J. Geophys. Res.-Atmos., 123, 6175–6195, https://doi.org/10.1029/2017jd027818, 2018.
Corbin, J. C., Czech, H., Massabò, D., de Mongeot, F. B., Jakobi, G., Liu, F., Lobo, P., Mennucci, C., Mensah, A. A., Orasche, J., Pieber, S. M., Prévôt, A. S. H., Stengel, B., Tay, L. L., Zanatta, M., Zimmermann, R., El Haddad, I., and Gysel, M.: Infrared-absorbing carbonaceous tar can dominate light absorption by marine-engine exhaust, npj Climate and Atmospheric Science, 2, 12, https://doi.org/10.1038/s41612-019-0069-5, 2019.
Diesch, J.-M., Drewnick, F., Klimach, T., and Borrmann, S.: Investigation of gaseous and particulate emissions from various marine vessel types measured on the banks of the Elbe in Northern Germany, Atmos. Chem. Phys., 13, 3603–3618, https://doi.org/10.5194/acp-13-3603-2013, 2013.
Drinovec, L., Močnik, G., Zotter, P., Prévôt, A. S. H., Ruckstuhl, C., Coz, E., Rupakheti, M., Sciare, J., Müller, T., Wiedensohler, A., and Hansen, A. D. A.: The “dual-spot” Aethalometer: an improved measurement of aerosol black carbon with real-time loading compensation, Atmos. Meas. Tech., 8, 1965–1979, https://doi.org/10.5194/amt-8-1965-2015, 2015.
Eyring, V., Köhler, H. W., van Aardenne, J., and Lauer, A.: Emissions from international shipping: 1. The last 50 years, J. Geophys. Res., 110, D17305, https://doi.org/10.1029/2004jd005619, 2005.
Eyring, V., Isaksen, I. S. A., Berntsen, T., Collins, W. J., Corbett, J. J., Endresen, O., Grainger, R. G., Moldanova, J., Schlager, H., and Stevenson, D. S.: Transport impacts on atmosphere and climate: Shipping, Atmos. Environ., 44, 4735–4771, https://doi.org/10.1016/j.atmosenv.2009.04.059, 2010.
Hanna, S. R., Paine, R. J., and Schulman, L. L.: Overwater dispersion in coastal regions, Bound.-Lay. Meteorol., 30, 389-411, https://doi.org/10.1007/BF00121963, 1984.
Healy, R. M., O'Connor, I. P., Hellebust, S., Allanic, A., Sodeau, J. R., and Wenger, J. C.: Characterisation of single particles from in-port ship emissions, Atmos. Environ., 43, 6408–6414, 2009.
Huang, C., Hu, Q., Wang, H., Qiao, L., Jing, S. a., Wang, H., Zhou, M., Zhu, S., Ma, Y., Lou, S., Li, L., Tao, S., Li, Y., and Lou, D.: Emission factors of particulate and gaseous compounds from a large cargo vessel operated under real-world conditions, Environ. Pollut., 242, 667–674, https://doi.org/10.1016/j.envpol.2018.07.036, 2018.
IPCC: Climate Change 2013: The Physical Science Basis. Contribution of Working Group I to the Fifth Assessment Report of the Intergovernmental Panel on Climate Change, Cambridge University Press, Cambridge, United Kingdom and New York, NY, USA, 1535 pp., 2013.
Johansson, L. and Jalkanen, J.-P.: Emissions from Baltic Sea shipping in 2015, Baltic Sea Environment Fact Sheets, HELCOM, 2016.
Jonson, J. E., Jalkanen, J. P., Johansson, L., Gauss, M., and Denier van der Gon, H. A. C.: Model calculations of the effects of present and future emissions of air pollutants from shipping in the Baltic Sea and the North Sea, Atmos. Chem. Phys., 15, 783–798, https://doi.org/10.5194/acp-15-783-2015, 2015.
Jonson, J. E., Gauss, M., Jalkanen, J.-P., and Johansson, L.: Effects of strengthening the Baltic Sea ECA regulations, Atmos. Chem. Phys., 19, 13469–13487, https://doi.org/10.5194/acp-19-13469-2019, 2019.
Jonsson, Å. M., Westerlund, J., and Hallquist, M.: Size-resolved particle emission factors for individual ships, Geophys. Res. Lett., 38, L13809, https://doi.org/10.1029/2011gl047672, 2011.
Kalli, J., Jalkanen, J.-P., Johansson, L., and Repka, S.: Atmospheric emissions of European SECA shipping: long-term projections, WMU Journal of Maritime Affairs, 12, 129–145, https://doi.org/10.1007/s13437-013-0050-9, 2013.
Kang, E., Root, M. J., Toohey, D. W., and Brune, W. H.: Introducing the concept of Potential Aerosol Mass (PAM), Atmos. Chem. Phys., 7, 5727–5744, https://doi.org/10.5194/acp-7-5727-2007, 2007.
Karl, M., Jonson, J. E., Uppstu, A., Aulinger, A., Prank, M., Sofiev, M., Jalkanen, J.-P., Johansson, L., Quante, M., and Matthias, V.: Effects of ship emissions on air quality in the Baltic Sea region simulated with three different chemistry transport models, Atmos. Chem. Phys., 19, 7019–7053, https://doi.org/10.5194/acp-19-7019-2019, 2019.
Kasper, A., Aufdenblatten, S., Forss, A., Mohr, M., and Burtscher, H.: Particulate emissions from a low-speed marine diesel engine, Aerosol Sci. Technol., 41, 24–32, 2007.
Kirchstetter, T. W., Novakov, T., and Hobbs, P. V.: Evidence that the spectral dependence of light absorption by aerosols is affected by organic carbon, J. Geophys. Res., 109, D21208, https://doi.org/10.1029/2004jd004999, 2004.
Kivekäs, N., Massling, A., Grythe, H., Lange, R., Rusnak, V., Carreno, S., Skov, H., Swietlicki, E., Nguyen, Q. T., Glasius, M., and Kristensson, A.: Contribution of ship traffic to aerosol particle concentrations downwind of a major shipping lane, Atmos. Chem. Phys., 14, 8255–8267, https://doi.org/10.5194/acp-14-8255-2014, 2014.
Lack, D. A., Corbett, J. J., Onasch, T., Lerner, B., Massoli, P., Quinn, P. K., Bates, T. S., Covert, D. S., Coffman, D., Sierau, B., Herndon, S., Allan, J., Baynard, T., Lovejoy, E., Ravishankara, A. R., and Williams, E.: Particulate emissions from commercial shipping: Chemical, physical, and optical properties, J. Geophys. Res., 114, D00F04, https://doi.org/10.1029/2008jd011300, 2009.
Lack, D. A., Cappa, C. D., Langridge, J., Bahreini, R., Buffaloe, G., Brock, C., Cerully, K., Coffman, D., Hayden, K., Holloway, J., Lerner, B., Massoli, P., Li, S.-M., McLaren, R., Middlebrook, A. M., Moore, R., Nenes, A., Nuaaman, I., Onasch, T. B., Peischl, J., Perring, A., Quinn, P. K., Ryerson, T., Schwartz, J. P., Spackman, R., Wofsy, S. C., Worsnop, D., Xiang, B., and Williams, E.: Impact of Fuel Quality Regulation and Speed Reductions on Shipping Emissions: Implications for Climate and Air Quality, Environ. Sci. Technol., 45, 9052–9060, https://doi.org/10.1021/es2013424, 2011.
Lack, D. A. and Corbett, J. J.: Black carbon from ships: a review of the effects of ship speed, fuel quality and exhaust gas scrubbing, Atmos. Chem. Phys., 12, 3985–4000, https://doi.org/10.5194/acp-12-3985-2012, 2012.
Lambe, A. T., Ahern, A. T., Williams, L. R., Slowik, J. G., Wong, J. P. S., Abbatt, J. P. D., Brune, W. H., Ng, N. L., Wright, J. P., Croasdale, D. R., Worsnop, D. R., Davidovits, P., and Onasch, T. B.: Characterization of aerosol photooxidation flow reactors: heterogeneous oxidation, secondary organic aerosol formation and cloud condensation nuclei activity measurements, Atmos. Meas. Tech., 4, 445–461, https://doi.org/10.5194/amt-4-445-2011, 2011.
Lambe, A. T., Chhabra, P. S., Onasch, T. B., Brune, W. H., Hunter, J. F., Kroll, J. H., Cummings, M. J., Brogan, J. F., Parmar, Y., Worsnop, D. R., Kolb, C. E., and Davidovits, P.: Effect of oxidant concentration, exposure time, and seed particles on secondary organic aerosol chemical composition and yield, Atmos. Chem. Phys., 15, 3063–3075, https://doi.org/10.5194/acp-15-3063-2015, 2015.
Lu, G., Brook, J. R., Alfarra, M. R., Anlauf, K., Leaitch, W. R., Sharma, S., Wang, D., Worsnop, D. R., and Phinney, L.: Identification and characterization of inland ship plumes over Vancouver, BC, Atmos. Environ., 40, 2767–2782, 2006.
Lyyränen, J., Jokiniemi, J., Kauppinen, E. I., and Joutsensaari, J.: Aerosol characterisation in medium-speed diesel engines operating with heavy fuel oils, J. Aerosol Sci., 30, 771–784, 1999.
Matthias, V., Bewersdorff, I., Aulinger, A., and Quante, M.: The contribution of ship emissions to air pollution in the North Sea regions, Environ. Pollut., 158, 2241–2250, 2010.
Mellqvist, J., Beecken, J., Conde, V., and Ekholm, J.: Surveillance of Sulfur Emissions from Ships in Danish Waters, Chalmers University of Technology, Sweden, Report, https://doi.org/10.17196/DEPA.001, 2017.
Moldanová, J., Fridell, E., Popovicheva, O., Demirdjian, B., Tishkova, V., Faccinetto, A., and Focsa, C.: Characterisation of particulate matter and gaseous emissions from a large ship diesel engine, Atmos. Environ., 43, 2632–2641, https://doi.org/10.1016/j.atmosenv.2009.02.008, 2009.
Mueller, L., Jakobi, G., Czech, H., Stengel, B., Orasche, J., Arteaga-Salas, J. M., Karg, E., Elsasser, M., Sippula, O., and Streibel, T.: Characteristics and temporal evolution of particulate emissions from a ship diesel engine, Appl. Energ., 155, 204–217, 2015.
Müller, T., Henzing, J. S., de Leeuw, G., Wiedensohler, A., Alastuey, A., Angelov, H., Bizjak, M., Collaud Coen, M., Engström, J. E., Gruening, C., Hillamo, R., Hoffer, A., Imre, K., Ivanow, P., Jennings, G., Sun, J. Y., Kalivitis, N., Karlsson, H., Komppula, M., Laj, P., Li, S.-M., Lunder, C., Marinoni, A., Martins dos Santos, S., Moerman, M., Nowak, A., Ogren, J. A., Petzold, A., Pichon, J. M., Rodriquez, S., Sharma, S., Sheridan, P. J., Teinilä, K., Tuch, T., Viana, M., Virkkula, A., Weingartner, E., Wilhelm, R., and Wang, Y. Q.: Characterization and intercomparison of aerosol absorption photometers: result of two intercomparison workshops, Atmos. Meas. Tech., 4, 245–268, https://doi.org/10.5194/amt-4-245-2011, 2011.
Murphy, S. M., Agrawal, H., Sorooshian, A., Padró, L. T., Gates, H., Hersey, S., Welch, W., Jung, H., Miller, J., and Cocker III, D. R.: Comprehensive simultaneous shipboard and airborne characterization of exhaust from a modern container ship at sea, Environ. Sci. Technol., 43, 4626–4640, 2009.
Oeder, S., Kanashova, T., Sippula, O., Sapcariu, S. C., Streibel, T., Arteaga-Salas, J. M., Passig, J., Dilger, M., Paur, H.-R., Schlager, C., Mülhopt, S., Diabaté, S., Weiss, C., Stengel, B., Rabe, R., Harndorf, H., Torvela, T., Jokiniemi, J. K., Hirvonen, M.-R., Schmidt-Weber, C., Traidl-Hoffmann, C., BéruBé, K. A., Wlodarczyk, A. J., Prytherch, Z., Michalke, B., Krebs, T., Prévôt, A. S. H., Kelbg, M., Tiggesbäumker, J., Karg, E., Jakobi, G., Scholtes, S., Schnelle-Kreis, J., Lintelmann, J., Matuschek, G., Sklorz, M., Klingbeil, S., Orasche, J., Richthammer, P., Müller, L., Elsasser, M., Reda, A., Gröger, T., Weggler, B., Schwemer, T., Czech, H., Rüger, C. P., Abbaszade, G., Radischat, C., Hiller, K., Buters, J. T. M., Dittmar, G., and Zimmermann, R.: Particulate Matter from Both Heavy Fuel Oil and Diesel Fuel Shipping Emissions Show Strong Biological Effects on Human Lung Cells at Realistic and Comparable In Vitro Exposure Conditions, PLOS ONE, 10, e0126536, https://doi.org/10.1371/journal.pone.0126536, 2015.
Onasch, T., Trimborn, A., Fortner, E., Jayne, J., Kok, G., Williams, L., Davidovits, P., and Worsnop, D.: Soot particle aerosol mass spectrometer: development, validation, and initial application, Aerosol Sci. Technol., 46, 804–817, 2012.
Ortega, A. M., Day, D. A., Cubison, M. J., Brune, W. H., Bon, D., de Gouw, J. A., and Jimenez, J. L.: Secondary organic aerosol formation and primary organic aerosol oxidation from biomass-burning smoke in a flow reactor during FLAME-3, Atmos. Chem. Phys., 13, 11551–11571, https://doi.org/10.5194/acp-13-11551-2013, 2013.
Ortega, A. M., Hayes, P. L., Peng, Z., Palm, B. B., Hu, W., Day, D. A., Li, R., Cubison, M. J., Brune, W. H., Graus, M., Warneke, C., Gilman, J. B., Kuster, W. C., de Gouw, J., Gutiérrez-Montes, C., and Jimenez, J. L.: Real-time measurements of secondary organic aerosol formation and aging from ambient air in an oxidation flow reactor in the Los Angeles area, Atmos. Chem. Phys., 16, 7411–7433, https://doi.org/10.5194/acp-16-7411-2016, 2016.
Palm, B. B., Campuzano-Jost, P., Ortega, A. M., Day, D. A., Kaser, L., Jud, W., Karl, T., Hansel, A., Hunter, J. F., Cross, E. S., Kroll, J. H., Peng, Z., Brune, W. H., and Jimenez, J. L.: In situ secondary organic aerosol formation from ambient pine forest air using an oxidation flow reactor, Atmos. Chem. Phys., 16, 2943–2970, https://doi.org/10.5194/acp-16-2943-2016, 2016.
Petzold, A., Hasselbach, J., Lauer, P., Baumann, R., Franke, K., Gurk, C., Schlager, H., and Weingartner, E.: Experimental studies on particle emissions from cruising ship, their characteristic properties, transformation and atmospheric lifetime in the marine boundary layer, Atmos. Chem. Phys., 8, 2387–2403, https://doi.org/10.5194/acp-8-2387-2008, 2008.
Petzold, A., Weingartner, E., Hasselbach, J., Lauer, P., Kurok, C., and Fleischer, F.: Physical Properties, Chemical Composition, and Cloud Forming Potential of Particulate Emissions from a Marine Diesel Engine at Various Load Conditions, Environ. Sci. Technol., 44, 3800–3805, https://doi.org/10.1021/es903681z, 2010.
Petzold, A., Lauer, P., Fritsche, U., Hasselbach, J., Lichtenstern, M., Schlager, H., and Fleischer, F.: Operation of Marine Diesel Engines on Biogenic Fuels: Modification of Emissions and Resulting Climate Effects, Environ. Sci. Technol., 45, 10394–10400, https://doi.org/10.1021/es2021439, 2011.
Sandradewi, J., Prévôt, A. S. H., Szidat, S., Perron, N., Alfarra, M. R., Lanz, V. A., Weingartner, E., and Baltensperger, U.: Using Aerosol Light Absorption Measurements for the Quantitative Determination of Wood Burning and Traffic Emission Contributions to Particulate Matter, Environ. Sci. Technol., 42, 3316–3323, https://doi.org/10.1021/es702253m, 2008.
Shen, F. and Li, X.: Effects of fuel types and fuel sulfur content on the characteristics of particulate emissions in marine low-speed diesel engine, Environ. Sci. Pollut. R., https://doi.org/10.1007/s11356-019-07168-6, 2019.
Sinha, P., Hobbs, P. V., Yokelson, R. J., Christian, T. J., Kirchstetter, T. W., and Bruintjes, R.: Emissions of trace gases and particles from two ships in the southern Atlantic Ocean, Atmos. Environ., 37, 2139–2148, https://doi.org/10.1016/S1352-2310(03)00080-3, 2003.
Stein, A. F., Draxler, R. R., Rolph, G. D., Stunder, B. J. B., Cohen, M. D., and Ngan, F.: NOAA's HYSPLIT Atmospheric Transport and Dispersion Modeling System, B. Am. Meteorol. Soc., 96, 2059–2077, https://doi.org/10.1175/bams-d-14-00110.1, 2016.
Svenningsson, B., Arneth, A., Hayward, S., Holst, T., Massling, A., Swietlicki, E., Hirsikko, A., Junninen, H., Riipinen, I., and Vana, M.: Aerosol particle formation events and analysis of high growth rates observed above a subarctic wetland–forest mosaic, Tellus B, 60, 353–364, 2008.
Tian, J., Riemer, N., West, M., Pfaffenberger, L., Schlager, H., and Petzold, A.: Modeling the evolution of aerosol particles in a ship plume using PartMC-MOSAIC, Atmos. Chem. Phys., 14, 5327–5347, https://doi.org/10.5194/acp-14-5327-2014, 2014.
von der Weiden, S.-L., Drewnick, F., and Borrmann, S.: Particle Loss Calculator – a new software tool for the assessment of the performance of aerosol inlet systems, Atmos. Meas. Tech., 2, 479–494, https://doi.org/10.5194/amt-2-479-2009, 2009.
Westerlund, J., Hallquist, M., and Hallquist, Å. M.: Characterization of fleet emissions from ships through multi-individual determination of size-resolved particle emissions in a coastal area, Atmos. Environ., 112, 159–166, https://doi.org/10.1016/j.atmosenv.2015.04.018, 2015.
Yu, G.-H., Park, S., Shin, S.-K., Lee, K.-H., and Nam, H.-G.: Enhanced light absorption due to aerosol particles in ship plumes observed at a seashore site, Atmos. Pollut. Res., 9, 1177–1183, https://doi.org/10.1016/j.apr.2018.05.005, 2018.
Zetterdahl, M., Moldanová, J., Pei, X., Pathak, R. K., and Demirdjian, B.: Impact of the 0.1 % fuel sulfur content limit in SECA on particle and gaseous emissions from marine vessels, Atmos. Environ., 145, 338–345, 2016.
Zotter, P., Herich, H., Gysel, M., El-Haddad, I., Zhang, Y., Močnik, G., Hüglin, C., Baltensperger, U., Szidat, S., and Prévôt, A. S. H.: Evaluation of the absorption Ångström exponents for traffic and wood burning in the Aethalometer-based source apportionment using radiocarbon measurements of ambient aerosol, Atmos. Chem. Phys., 17, 4229–4249, https://doi.org/10.5194/acp-17-4229-2017, 2017.