the Creative Commons Attribution 4.0 License.
the Creative Commons Attribution 4.0 License.
 | 13 Jul 2020
Predictions of the glass transition temperature and viscosity of organic aerosols from volatility distributions
Douglas A. Day
Harald Stark
Jose L. Jimenez
Volatility and viscosity are important properties of organic aerosols (OA), affecting aerosol processes such as formation, evolution, and partitioning of OA. Volatility distributions of ambient OA particles have often been measured, while viscosity measurements are scarce. We have previously developed a method to estimate the glass transition temperature (Tg) of an organic compound containing carbon, hydrogen, and oxygen. Based on analysis of over 2400 organic compounds including oxygenated organic compounds, as well as nitrogen- and sulfur-containing organic compounds, we extend this method to include nitrogen- and sulfur-containing compounds based on elemental composition. In addition, parameterizations are developed to predict Tg as a function of volatility and the atomic oxygen-to-carbon ratio based on a negative correlation between Tg and volatility. This prediction method of Tg is applied to ambient observations of volatility distributions at 11 field sites. The predicted Tg values of OA under dry conditions vary mainly from 290 to 339 K and the predicted viscosities are consistent with the results of ambient particle-phase-state measurements in the southeastern US and the Amazonian rain forest. Reducing the uncertainties in measured volatility distributions would improve predictions of viscosity, especially at low relative humidity. We also predict the Tg of OA components identified via positive matrix factorization of aerosol mass spectrometer (AMS) data. The predicted viscosity of oxidized OA is consistent with previously reported viscosity of secondary organic aerosols (SOA) derived from α-pinene, toluene, isoprene epoxydiol (IEPOX), and diesel fuel. Comparison of the predicted viscosity based on the observed volatility distributions with the viscosity simulated by a chemical transport model implies that missing low volatility compounds in a global model can lead to underestimation of OA viscosity at some sites. The relation between volatility and viscosity can be applied in the molecular corridor or volatility basis set approaches to improve OA simulations in chemical transport models by consideration of effects of particle viscosity in OA formation and evolution.
- Article
(4418 KB) - Full-text XML
-
Supplement
(1078 KB) - BibTeX
- EndNote


Organic aerosols (OA) contribute substantially to the mass loadings of atmospheric fine particulate matter (Hallquist et al., 2009; Jimenez et al., 2009). OA formed from various anthropogenic or biogenic precursors have complex physicochemical properties (Goldstein and Galbally, 2007; Nizkorodov et al., 2011; Ditto et al., 2018), which makes predictions of their role in air quality, climate, and public health challenging (Kanakidou et al., 2005; Shrivastava et al., 2017). Volatility and viscosity are important properties of OA, both of which affect important aerosol processes such as gas–particle partitioning, new particle formation and evolution of size distribution, heterogeneous reactions, and cloud condensation and ice nucleation pathways of OA, as summarized in recent review articles (Krieger et al., 2012; Bilde et al., 2015; Pöschl and Shiraiwa, 2015; Knopf et al., 2018; Reid et al., 2018).
Recent measurements have shown that OA can exist in liquid (low dynamic viscosity η; η<102 Pa s), semisolid (10 Pa s), and amorphous solid (η>1012 Pa s) states, depending on temperature (T), relative humidity (RH), and chemical composition (Reid et al., 2018). Even though there are several particle bounce measurements to infer ambient OA phase state, there are limited ambient measurements of particle phase state or viscosity (Virtanen et al., 2010; O'Brien et al., 2014; Bateman et al., 2016, 2017; Pajunoja et al., 2016; Liu et al., 2017; Ditto et al., 2019; Slade et al., 2019). Viscosity can be directly converted to bulk diffusivity of organic molecules using the Stokes–Einstein equation, which has been shown to work well for organic molecules diffusing through low-viscosity materials (Price et al., 2016; Chenyakin et al., 2017). This relation is inapplicable for predicting the bulk diffusivity of water and small molecules, and it may also underestimate the diffusivity of organic molecules in a highly viscous matrix, which can be corrected using a fractional Stokes–Einstein equation (Price et al., 2016; Evoy et al., 2019).
Viscosity can be related to the glass transition temperature (Tg), at which a phase transition between amorphous solid and semisolid states occurs (Koop et al., 2011). Ambient temperature varies through 100 K throughout the troposphere, greatly influencing the viscosity of the mixture. When the ambient temperature is below Tg, an amorphous particle behaves as a solid, while a particle would be semisolid or liquid when the ambient temperature is above Tg. OA particles contain a number of organic compounds and also a variable amount of liquid water depending on RH, which can act as a plasticizer to reduce Tg: these mixture effects can be estimated using the Gordon–Taylor relation (Mikhailov et al., 2009; Koop et al., 2011; Dette et al., 2014). In addition, ambient OA may often be internally mixed with inorganic species such as sulfate and nitrate, which would further lower Tg and viscosity if they were well mixed in one phase; when the phase separation occurs, the inorganic-rich and organic-rich phases may undergo glass transition at different temperatures (Dette and Koop, 2015).
For pure organic compounds with known molecular structure, viscosity can be predicted by group contribution approaches (Cao et al., 1993; Bosse, 2005; Y. C. Song et al., 2016; Rovelli et al., 2019; Gervasi et al., 2020); chemical composition of ambient OA is complex, and molecular specificity is often unavailable, which makes viscosity predictions of ambient OA challenging. We have recently developed a set of semiempirical parameterizations using molar mass (M) and atomic O:C ratio (Shiraiwa et al., 2017) or elemental composition (DeRieux et al., 2018) to predict Tg for compounds comprised of carbon, hydrogen, and oxygen (CHO compounds). These parameterizations have been applied to high-resolution mass spectrometry measurements to estimate viscosity of organic aerosols (DeRieux et al., 2018; Schum et al., 2018; Ditto et al., 2019; Song et al., 2019) and coupled into a thermodynamic model (Gervasi et al., 2020). Note that heteroatoms and the effects of molecular structure and functional groups on Tg are not considered in parameterizations of Shiraiwa et al. (2017) and DeRieux et al. (2018).
Viscosity of pure compounds has been found to be inversely correlated with vapor pressure (Thomas et al., 1979). The molecular-corridor-based analysis (Shiraiwa et al., 2014; Li et al., 2016) of hundreds of secondary organic aerosol (SOA) components has shown that compounds with lower pure-compound saturation mass concentration (C0) have higher Tg (Shiraiwa et al., 2017). Rothfuss and Petters (2017) found that there is a similar trend between the sensitivity of viscosity to functional group addition and the sensitivity of vapor pressure to functional group addition. Measurements of the evaporation kinetics of maleic acid showed that decreasing particle viscosity leads to a suppression in the effective vapor pressure of maleic acid (Marshall et al., 2018). Champion et al. (2019) found that SOA with higher condensed-phase fractions of extremely low volatility organic compounds (ELVOC) and low volatility organic compounds (LVOC) showed an increased viscosity. Zhang et al. (2019) measured Tg of isoprene SOA components including isoprene hydroxy hydroperoxide (ISOPOOH), isoprene-derived epoxydiol (IEPOX), 2-methyltetrols, and 2-methyltetrol sulfates (2-MT-OS), observing a tight correlation between Tg and vapor pressure.
Based on the above evidence showing a close relation between volatility and viscosity, in this study we develop the parameterizations predicting Tg as a function of C0 based on data from over 2000 compounds. Functional group contribution approaches are often used to predict C0 (Capouet and Müller, 2006; Pankow and Asher, 2008; Compernolle et al., 2011; O'Meara et al., 2014); thereby, using C0 to predict Tg would include the molecular structure effect indirectly. The developed parameterizations are applied to field observations of volatility distributions to predict viscosity of ambient OA.
2.1 Dataset of glass transition temperature
The training dataset used to develop the parameterizations of Tg include 2448 organic compounds classified into four classes (see the number of CH, CHO, CHON, and CHOS compounds in Table S1 in the Supplement). Measured Tg values are available for 42 CH compounds, 259 CHO compounds, 35 CHON compounds, and 1 CHOS compound (Koop et al., 2011; Rothfuss and Petters, 2017; Lessmeier et al., 2018; Zhang et al., 2019), among which there are 168 compounds with measured C0 available (Table S1). When Tg measurements are unavailable, Tg is estimated from the melting temperature (Tm) by applying the Boyer–Kauzmann rule of (Kauzmann, 1948; Boyer, 1954) with g=0.70085 (±0.00375) (Koop et al., 2011), referred to as “estimated Tg” in this study (see good agreement of measured and estimated Tg in Fig. S1a in the Supplement). There are 1187 compounds (391 CH, 537 CHO, 241 CHON, and 18 CHOS compounds) with both measured Tm and C0 (Tables S1, S2) adopted from the MPBPWIN program test sets (http://esc.syrres.com/interkow/EpiSuiteData.htm, last access: 9 July 2020) included in the EPI Suite software version 4.1 (Estimation Programs Interface; US EPA, 2015). Measured Tg, Tm, or C0 for CHOS compounds is sparse and we adopt 850 CHOS compounds included in Li et al. (2016) with their Tm and C0 estimated by the EPI Suite software (Table S2). There are estimation limitations in the EPI Suite; for example, the disagreement between measured and estimated C0 is larger for compounds with µg m−3 (Fig. S1b), which may affect the Tg predictions for compounds with low volatility. However, given the large number of data points with measured C0 included in the training dataset, the estimation bias introduced by the EPI Suite may not substantially impact the accuracy of the parameterization developed in this study.
The test dataset used to validate the performance of the parameterizations predicting Tg of SOA components includes 654 CHO compounds and 212 CHON compounds found in SOA oxidation products (Shiraiwa et al., 2014). The values of their C0 are estimated using the EVAPORATION model (Compernolle et al., 2011). Their Tm values are adopted from the EPI Suite. The Tg values predicted by our parameterizations are compared with the Tg estimated from the Tm by applying the Boyer–Kauzmann rule in the test dataset.
2.2 Parameterizations of Tg as a function of volatility
Figure 1a shows a dependence of Tg on C0 for 2448 organic compounds in the training dataset. The compounds with lower C0 have higher Tg, and the Tg appears to level off at around 420 K at µg m−3. The dependence of Tg on the atomic O:C ratio is weaker (Figs. 1a and S2), in agreement with previous studies (Koop et al., 2011; Shiraiwa et al., 2017). Note that a tight correlation between Tg and the O:C ratio has been observed for oxidation products formed from specific precursors including α-pinene (Dette et al., 2014), n-heptadecane, and naphthalene (Saukko et al., 2012). Based on the trend shown in Fig. 1a, we develop a parameterization (Eq. 1) to predict Tg as a function of C0 and O:C, which are the parameters used in the two-dimensional volatility basis set (2D-VBS) framework (Donahue et al., 2011).
The coefficients in Eq. (1) are obtained by fitting the Tg of 2448 compounds in Fig. 1a with multilinear least squares analysis with 68 % prediction and confidence intervals. The predicted Tg by Eq. (1) is plotted in Fig. 1a with the O:C ratios of 0, 0.5, and 1, showing that the predicted dependence of Tg on C0 follows the trend well in the training dataset. The O:C ratio mainly affects the predicted Tg of volatile compounds or extremely low volatility compounds. Figure 1b shows that the Tg values of those compounds are predicted well by Eq. (1) as indicated by a high correlation coefficient (R) of 0.92. The average absolute value of the relative error (AAVRE; Aiken et al., 2007) is 12 %.
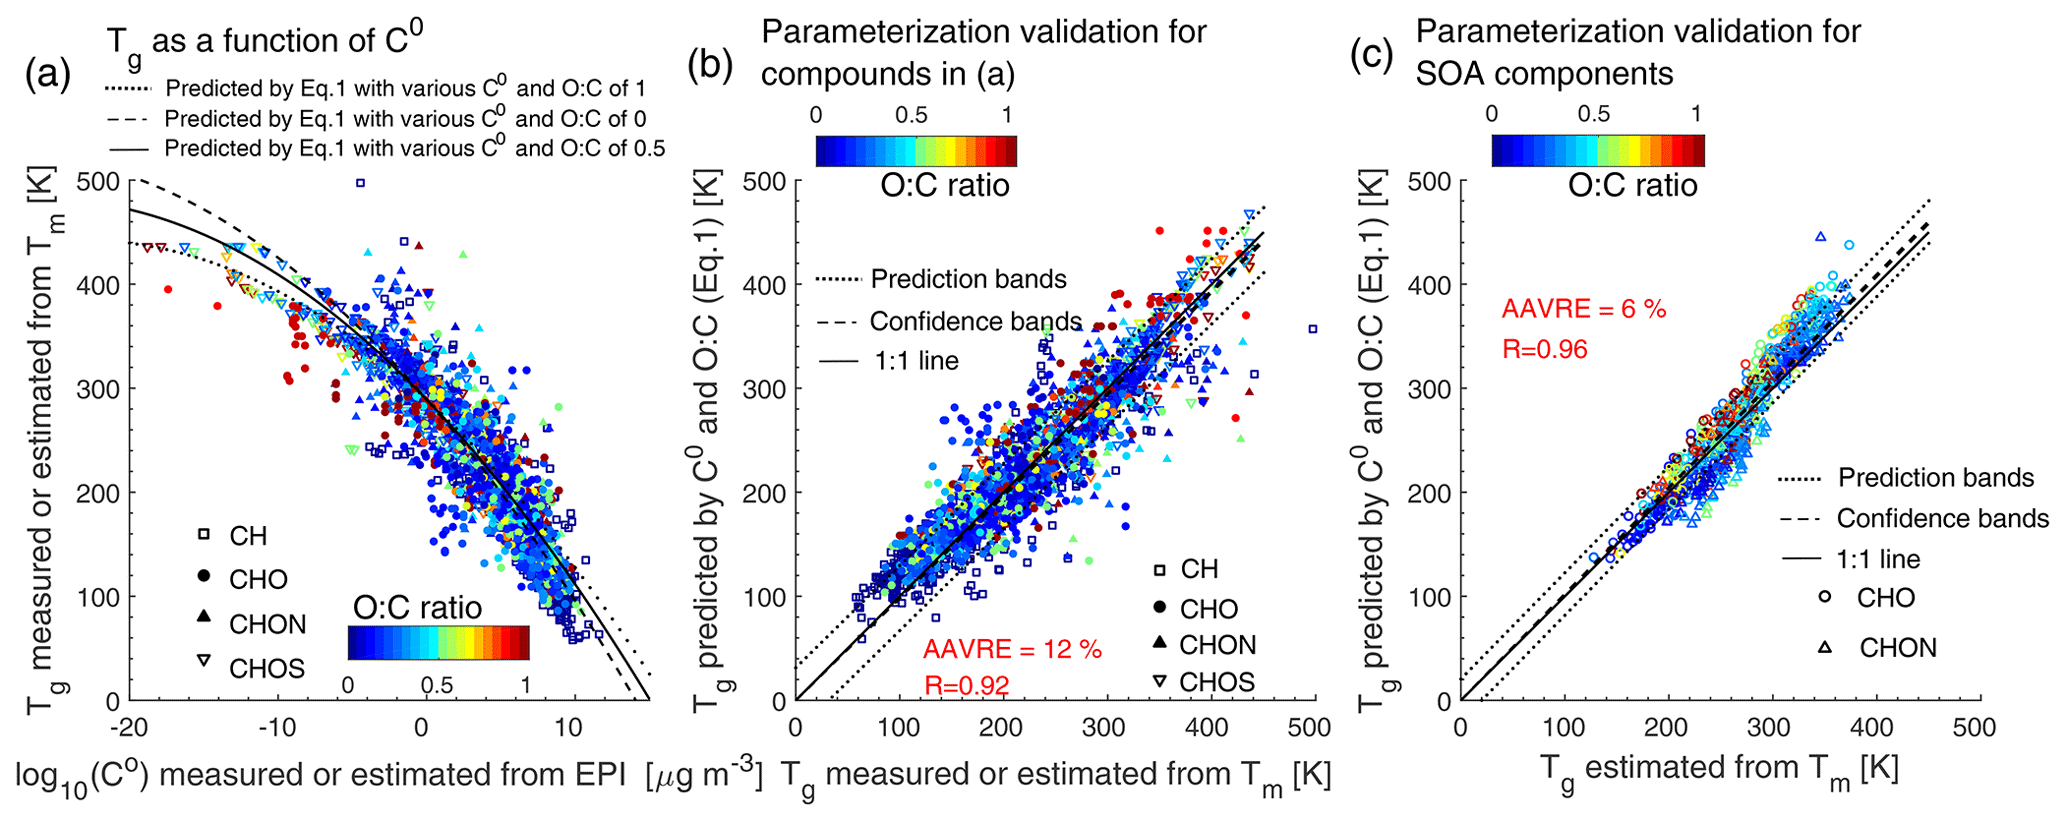
Figure 1(a) Tg of organic compounds in the training dataset plotted against C0. The lines show the predictions of Tg (Eq. 1) by C0 and the O:C ratios of 0 (dashed), 0.5 (solid), and 1 (dotted). (b) Predicted Tg by C0 and the O:C ratio (Eq. 1) for compounds shown in (a) compared to measured or otherwise estimated Tg from Tm. (c) Predicted Tg for SOA components (Shiraiwa et al., 2014) using Eq. (1) plotted against estimated Tg from Tm with the Boyer–Kauzmann rule. The correlation coefficient (R) and the average absolute value of the relative error (AAVRE) are shown. In (b) and (c) the dashed and dotted lines show 68 % confidence and prediction bands, respectively.
Equation (1) is further evaluated using the test dataset for SOA components. Figure 1c compares Tg predicted by Eq. (1) with estimated Tg from Tm by applying the Boyer–Kauzmann rule, showing that Eq. (1) also presents a good performance for predicting Tg of these SOA components with R=0.96 and AAVRE =6 %. Note that C0 values of SOA components were estimated using the EVAPORATION model (Compernolle et al., 2011). The Tg values of individual SOA compounds can be predicted within ±20 K as indicated by the prediction band (dotted lines in Fig. 1c); however, this uncertainty may be much smaller for multicomponent SOA mixtures under ideal mixing conditions as indicated in the confidence band (dashed lines, almost overlapping with the 1:1 line) (Shiraiwa et al., 2017; DeRieux et al., 2018; Song et al., 2019).
We also develop a parameterization (Eq. 2) predicting Tg as a function of C0 solely, which can be applied to the information available with the one-dimensional VBS framework (1D-VBS; Donahue et al., 2006), and this can be used when the O:C ratio is not available in measurements.
The coefficients in Eq. (2) are obtained following the procedures developing Eq. (1) and the same training dataset is used. Figures S3–S4 show that Eq. (2) gives very similar predictions as Eq. (1) particularly for the compounds with low O:C ratio. As Eqs. (1) and (2) are developed based on the compounds with their C0 higher than µg m−3, Eqs. (1) and (2) may not be applicable for compounds with µg m−3 (Fig. 1a).
2.3 Predictions of Tg and viscosity of organic aerosols
For the application of Tg parameterizations in field observations of volatility distributions, Tg for each volatility bin (Tg,i) is calculated by Eq. (1). The term volatility refers to the effective saturation mass concentration (C∗), and we assume ideal thermodynamic mixing in which case C∗ is equal to C0 (Donahue et al., 2011). Note that there may be additional uncertainty in application of Tg parameterizations (which were developed based on pure compounds) to each volatility bin representing a surrogate of complex multicomponent mixtures. The isolines in Fig. 2 show the Tg,i predicted by Eq. (1) with the C∗ and O:C defined in the 2D-VBS framework. Tg would be below ∼250 K for intermediate volatility organic compounds (IVOC; µg m−3), from ∼260 to 290 K for semivolatile organic compounds (SVOC; µg m−3), and higher than 300 K for low-volatility organic compounds (LVOC; µg m−3) and extremely low volatility organic compounds (ELVOC; µg m−3). The Tg increases as the O:C ratio increases for SVOC and IVOC, which is consistent with previous studies (Koop et al., 2011; Saukko et al., 2012; Berkemeier et al., 2014). The Tg slightly decreases as the O:C ratio increases for LVOC and ELVOC compounds, which might be due to the uncertainties in Eq. (1) which is derived from a dataset containing fewer LVOC and ELVOC compounds as shown in Fig. 1a, which exhibits lower Tg with higher O:C.

Figure 2Predicted glass transition temperatures of organic aerosols under dry conditions (Tg,org) during the SOAS campaign placed into the 2-D VBS framework. The isopleths correspond to the Tg calculated using Eq. (1) with the effective saturation mass concentration (C∗) and the O:C ratio defined in the 2D-VBS. The markers represent the Tg,org of total OA (TOA) and IEPOX SOA calculated from the volatility distributions simulated by a global chemical transport model (EMAC-ORACLE; Shiraiwa et al., 2017) or measured during the SOAS campaign (Hu et al., 2016; Saha et al., 2017; Stark et al., 2017). Three methods (Formulas, Partitioning, and Thermograms) are applied in Stark et al. (2017) to derive the C∗ distributions, where the Thermograms method provides the most credible volatility distributions compared to Formulas and Partitioning (marker edge lines in gray).
The glass transition temperatures of organic aerosols under dry conditions (Tg,org) are calculated by the Gordon–Taylor equation (Gordon and Taylor, 1952) by assuming the Gordon–Taylor constant (kGT) of 1 (Dette et al., 2014):
where wi is the mass fraction in the particle phase for each volatility bin. The Gordon–Taylor approach has been validated for a wide range of mixtures including SOA compounds (Dette et al., 2014; Lessmeier et al., 2018). The Gordon–Taylor approach may fail in the case of adduct or complex formation (Koop et al., 2011), which is highly unlikely in multicomponent mixtures with myriads of SOA compounds with very small individual mole fractions and when particular interactions between individual compounds are more likely to average out (Shiraiwa et al., 2017); this aspect would need to be investigated in future studies.
The phase state of aerosol particles strongly depends on their water content (Mikhailov et al., 2009; Koop et al., 2011). Under humid conditions, the water content in OA can be estimated using the effective hygroscopicity parameter (κ) (Petters and Kreidenweis, 2007). The Tg of organic–water mixtures (Tg(worg)) at given RH can be estimated using the Gordon–Taylor equation (Gordon and Taylor, 1952):
where worg is the mass fraction of organics in particles; Tg,w is the glass transition temperature of pure water (136 K; Kohl et al., 2005), and kGT is the Gordon–Taylor constant for organic–water mixtures which is suggested to be 2.5 (Zobrist et al., 2008; Koop et al., 2011). Viscosity can then be calculated by applying the Vogel–Tammann–Fulcher (VTF) equation (Angell, 1991): , where η∞ is the viscosity at infinite temperature (10−5 Pa s; Angell, 1991), D is the fragility parameter which is assumed to be 10 (DeRieux et al., 2018), and T0 is the Vogel temperature calculated as .
3.1 Southern Oxidant and Aerosol Study (SOAS)
In this section we predict glass transition temperatures and phase state of ambient OA during the SOAS (Southern Oxidant and Aerosol Study) campaign, which took place in the southeastern United States (Centreville, Alabama) in summer 2013 (Carlton et al., 2018). The Tg of organic aerosols under dry conditions (Tg,org) is calculated using Eqs. (1) and (3) with measured volatility distributions. Figure 2 shows the calculated Tg,org placed in the 2D-VBS framework against the average log 10(C∗) calculated by ) (Kostenidou et al., 2018), and the measured O:C ratio is from Xu et al. (2015).
Figure 2 shows that Tg,org of total OA (TOA) range from 232 to 334 K, depending on volatility distributions measured by different methods, while the most credible predicted Tg,org values span in the range of 313–330 K. The reasons are stated below by comparing the different methods deriving the C∗ distributions. Stark et al. (2017) used three methods (Thermograms, Partitioning, and Formulas) to derive volatility distributions by applying the measurements of organic acids (which were shown to account for about half of the total OA; Yatavelli et al., 2015) from a high-resolution chemical ionization time-of-flight mass spectrometer equipped with a filter inlet for gases and aerosols (Lopez-Hilfiker et al., 2014; Thompson et al., 2017). In the Thermograms method, C∗ at 298 K is estimated from the desorption temperature after calibration with known species (Faulhaber et al., 2009). This method results in 93 % of OA mass distributed in the LVOC and ELVOC (Stark et al., 2017), and a high Tg,org of 330 K is predicted (Fig. 2). While this method may be influenced by thermal decomposition, the peak temperatures of decomposing species can be expected to relate closer to actual volatilities than any of the other two analysis methods (Stark et al., 2017). The result from the thermogram method is consistent with those measured by an aerosol mass spectrometer (AMS) with a thermodenuder, which also applied the thermogram method to estimate the C∗ distributions (Hu et al., 2016). Saha et al. (2017) applied an evaporation kinetic model (Lee et al., 2011) based on the VBS approach to extract the C∗ distributions, and the effects of enthalpy of vaporization and accommodation coefficient (α) are considered, resulting in the estimated Tg,org of 313 K. This study retrieved α of ∼0.5, which is consistent with recent experiments (Krechmer et al., 2017; Liu et al., 2019).
The lower Tg,org values (<280 K) calculated from the C∗ distributions estimated from the Formulas and Partitioning methods (Stark et al., 2017) are less atmospherically relevant. The Formulas method used SIMPOL (simple group contribution method; Pankow and Asher, 2008) to calculate vapor pressures from the composition of the identified ions. While the specific functional group distributions needed for SIMPOL are unknown from mass spectrometer measurements, some assumptions can be made, leading to limits in the volatility distributions, all of which are showing the same behavior of high volatilities (Stark et al., 2017). This is because many of the detected species can be thermal decomposition products rather than actual SOA molecules (Stark et al., 2015, 2017), which can lead to overestimations of volatilities, resulting in the unlikely low Tg,org of 232 K. The Partitioning method used the measured particle-phase mass fractions of each species to estimate C∗ based on the partitioning theory (Pankow, 1994). The estimated C∗ is distributed mainly in the SVOC range (Stark et al., 2017), leading to a Tg,org of 279 K (Fig. 2). This value is very close to the Tg,org (281 K) simulated by a global chemical transport model, EMAC-ORACLE, in which a narrow distribution of C∗ (1, 10, 102, and 103 µg m−3) was applied (Shiraiwa et al., 2017). However, Stark et al. (2017) note that the partitioning-based volatility distribution is likely too high due to an artifact of signal-to-noise limitations, confining the C∗ characterizable by the partitioning method to a relatively narrow range centered around the ambient OA concentration (by definition the semivolatile range). These analyses indicate that the volatility distributions derived from different methods, even when based on the same measurements, significantly affect the predicted Tg,org, and the most atmospherically relevant volatility distributions should be carefully chosen to reasonably predict the glass transition temperature of ambient OA. In summary, the Tg,org values during the SOAS campaign should be in the range of 313–330 K.
Figure 2 also includes Tg,org of isoprene-derived epoxydiol SOA (IEPOX-SOA) identified via positive matrix factorization (PMF) of AMS mass spectra (Lanz et al., 2007). IEPOX-SOA is predicted to have a Tg,org of 345 K with very low volatility with the average C∗ lower than 10−4 µg m−3 (Hu et al., 2016; Lopez-Hilfiker et al., 2016; D'Ambro et al., 2019), which may be due to substantial formation of organosulfates and other oligomers (Lin et al., 2012; Hu et al., 2015; Riva et al., 2019). The predicted Tg,org of IEPOX-SOA is higher than previously reported Tg,org of 263–293 K for monoterpene-derived (α-pinene, 3-carene, myrcene, limonene, and ocimene) SOA (Petters et al., 2019).
We further calculate the viscosity of OA based on the Tg,org of TOA predicted above in order to compare with the ambient phase-state measurements during the SOAS campaign. Figure 3a shows the predicted viscosity of total OA at different RH; T is adopted as 298 K, the average value during the SOAS campaign (Hu et al., 2016). The effective hygroscopicity parameter (κ) is set to 0.14 for TOA based on measurements (Cerully et al., 2015). The characteristic timescale of mass transport and mixing by molecular diffusion (τmix) is also calculated: (Seinfeld and Pandis, 2006), where dp is the particle diameter, and the bulk diffusion coefficient Db is calculated from the predicted viscosity by the fractional Stokes–Einstein relation (Evoy et al., 2019). We assume a radius of the diffusing molecule of 10−10 m and a particle diameter of 200 nm (Shiraiwa et al., 2011). Note that these estimated timescales represent rough estimations, as molecular interactions in complex mixtures are not considered.
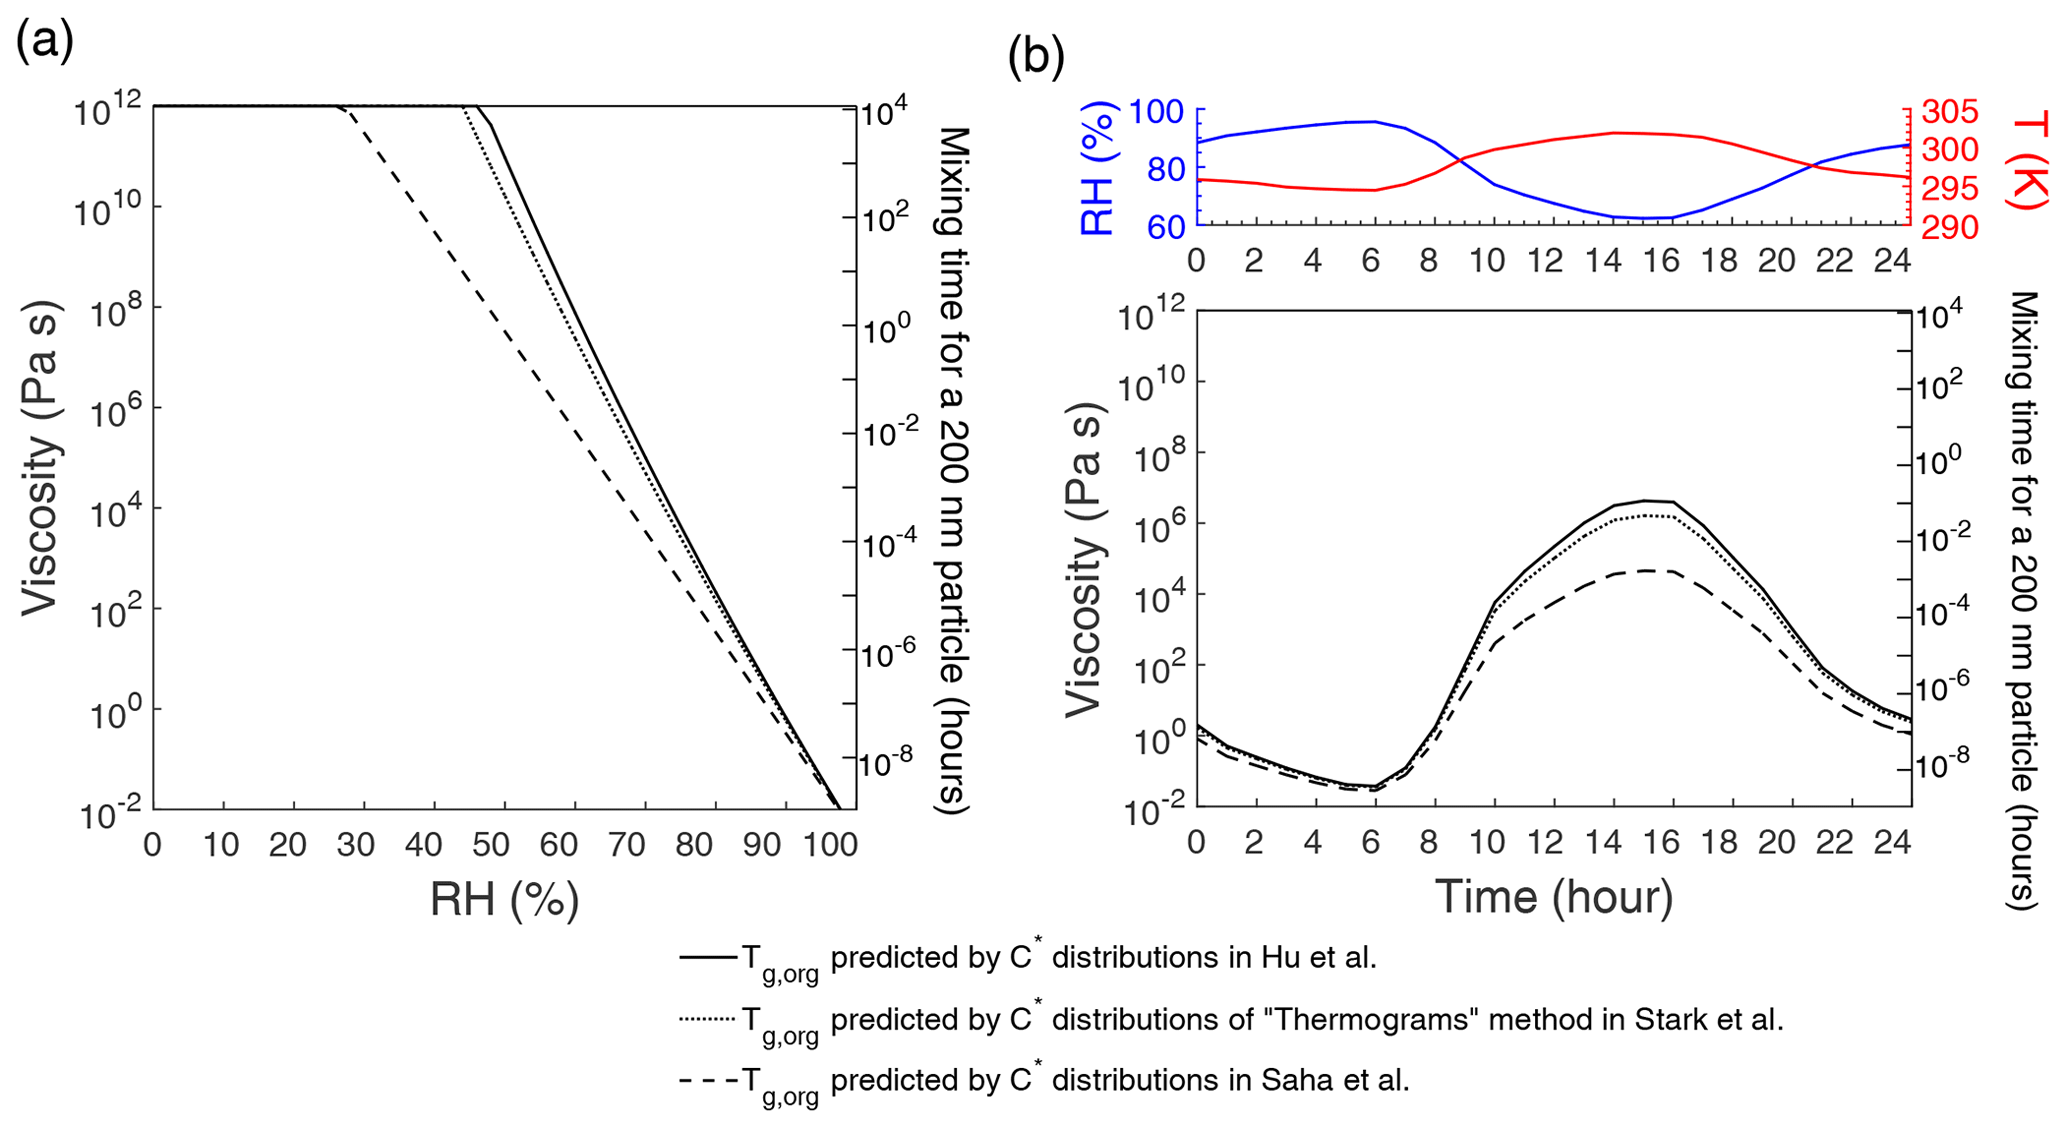
Figure 3(a) Predicted viscosity of total OA measured during the SOAS campaign as a function of RH. (b) Diurnal variations of viscosity of total OA predicted employing the measured RH and T (Hu et al., 2016) during the SOAS campaign. Tg,org values are calculated using the volatility distributions measured in Hu et al. (2016), Saha et al. (2017), and the Thermograms method in Stark et al. (2017). Characteristic mixing timescales of organic molecules with a radius of 10−10 m within 200 nm particles are also shown on the right axis.
The viscosity of TOA at RH of 83 % (average RH during SOAS) is predicted to be less than 102 Pa s with τmix less than 1 s, which is consistent with the particle bounce measurements, suggesting that organic-dominated particles were mostly liquid during the SOAS campaign (Pajunoja et al., 2016). When RH was below ∼50 % in the sampling inlet, the particles were found to adopt a semisolid state (Pajunoja et al., 2016), which agrees with the predicted viscosity of 107–1011 Pa s, and τmix can be higher than 1 h at 50 % RH (Fig. 3a). The variations in Tg,org (313–330 K) due to the different measured C∗ distributions (Fig. 2) have a more significant impact on the predicted viscosity at low and medium RH (Fig. 3a). When RH is higher than ∼70 %, the predicted viscosities calculated from different Tg,org values are very close; at high RH the condensed-phase water has a larger influence on the phase state than the volatility does, depending on the hygroscopicity of organic aerosols.
Figure 3b shows diurnal variations of predicted viscosity of total OA using measured T and RH during the SOAS campaign (Hu et al., 2016). During 10:00–20:00 LT (local time) when RH <70 % and T>298 K, three simulations using different Tg,org values predict that total OA occurs as semisolid with the predicted viscosity of 102–107 Pa s and the mixing times of less than 1 h. Particles are predicted to have a low viscosity of <1 Pa s, adopting a liquid phase during nighttime. The lowest viscosity occurs around 05:00–06:00 LT with RH >95 %. Here we did not consider the effects of the diurnal variations of volatility distributions, as they did not vary dramatically over the campaign period (Saha et al., 2017). Besides T and RH, diurnal variation of ambient aerosol phase state also depends on particle chemical composition and mixing states. Organic particles in the Amazon were found to be more viscous at night than the daytime due to the influence of biomass burning that may form nonliquid particles (Bateman et al., 2017). Particles in a mixed forest in northern Michigan, USA, were also found more viscous at night despite higher RH than the daytime, due to the formation of high molar mass organic compounds and smaller inorganic sulfate mass fractions (Slade et al., 2019). Phase-state measurements during daytime and nighttime at Atlanta, USA, suggested that the ambient particle phase state was influenced by OA composition, the presence of inorganic ions, aerosol liquid water, and particle mixing state (Ditto et al., 2019).
3.2 Tg,org at 11 global sites
Figure 4 summarizes Tg,org at 11 sites where the measured volatility distributions with volatility bins of four or more are available (Table S3). We did not include the data with narrower volatility ranges which may not correctly characterize the properties of ambient SOA (Bilde et al., 2015), and thus may not be appropriate for estimating volatility distributions or would result in unrealistically low Tg without considering realistically low C∗ bins. Note that a narrow VBS may still be useful for efficiency in three-dimensional chemical transport models for SOA evaporation and condensation under a narrow range of ambient temperature variations (Kostenidou et al., 2018).

Figure 4Predicted glass transition temperatures of organic aerosols under dry conditions (Tg,org) at 11 sites. The fill color of the markers represents Tg,org (a) or the O:C ratio (b). The marker edge color indicates the OA components identified via PMF of the AMS mass spectra. The isopleths in (a) correspond to Tg calculated using Eq. (1) with C∗ and O:C defined in the 2D-VBS. The vertical error bars correspond to uncertainties in Tg,org considering parameterization uncertainties and error propagation. The horizontal error bars for the Centreville site correspond to the upper and lower limits of the average log10(C∗) calculated from different volatility distributions measured during the SOAS campaign (Hu et al., 2016; Saha et al., 2017; Stark et al., 2017).
Figure 4a shows the 2D-VBS framework of O:C vs. log10C∗ with the marker fill color representing Tg,org, whereas panel (b) shows Tg,org vs. log10C∗ with the marker fill color representing O:C. The marker edge color represents OA components identified via positive matrix factorization of AMS mass spectra (Lanz et al., 2007), including biomass-burning OA (BBOA), hydrocarbon-like OA (HOA), cooking OA (COA), and oxygenated OA (OOA), which is sometimes further separated into more oxygenated OA (MO-OOA) and less oxygenated OA (LO-OOA) factors. Note that these different OA factors may often be internally mixed in ambient atmosphere, and predicted Tg,org and particle viscosity would be irrelevant in such a case. Nevertheless, these predictions can be useful when particles are externally mixed or ambient OA are dominated by a certain OA factor.
Tg,org of total OA (TOA) varies from 290 to 339 K. The lower Tg,org occurs at Beijing, China, in June 2018 (Xu et al., 2019). OA in Beijing was found to be overall more volatile with the particle-phase semivolatile fraction of 63 %. This may be due to the higher total OA mass concentrations in Beijing (Xu et al., 2019), which facilitate greater partitioning of SVOC compounds into the particle phase, leading to a lower Tg,org. The predicted Tg,org of total OA at numerous other sites range between 300 and 320 K, including Paris (Paciga et al., 2016), Mexico City (Cappa and Jimenez, 2010), Centreville (Hu et al., 2016; Saha et al., 2017; Stark et al., 2017), Raleigh (Saha et al., 2017), and Durham (Saha et al., 2018) in southeastern US. The Tg,org value (316 K) at 220 m downwind from a highway in Durham is higher than the Tg,org (309 K) at 10 m downwind from a highway due to the dilution and mixing of traffic-sourced particles with background air and evaporation of semivolatile species during downwind transport (Saha et al., 2018). The Tg,org values are predicted to be high (>320 K) at the sites in Athens (Louvaris et al., 2017), Pasadena (Ortega et al., 2016), Colorado Rocky Mountain (Stark et al., 2017), and the Amazon (Hu et al., 2016). The Tg,org values for MO-OOA in Mexico City and Paris are predicted to be very high at ∼350 K, reflecting their very low volatility.
Figure 5 shows the OA viscosity variation of OA components against RH. The hygroscopic growth is considered based on hygroscopicity (κ), which is estimated as a function of the O:C ratio (Lambe et al., 2011) when κ was not measured (Table S3). The κ values of OA factors with low O:C ratio, i.e., HOA, COA, and BBOA, are estimated to be low (<0.08); they are predicted to undergo glass transition at RH between 25 % and 68 % and adopt a liquid phase only when RH is very high (∼80 %). The predicted behavior of BBOA is in line with bounce measurements observing that particles are semisolid in a biomass-burning plume (Bateman et al., 2017). OA factors with higher O:C ratios including LO-OOA, MO-OOA, and IEPOX SOA tend to become liquid (viscosity <102 Pa s) at intermediate RH (Fig. 5b).
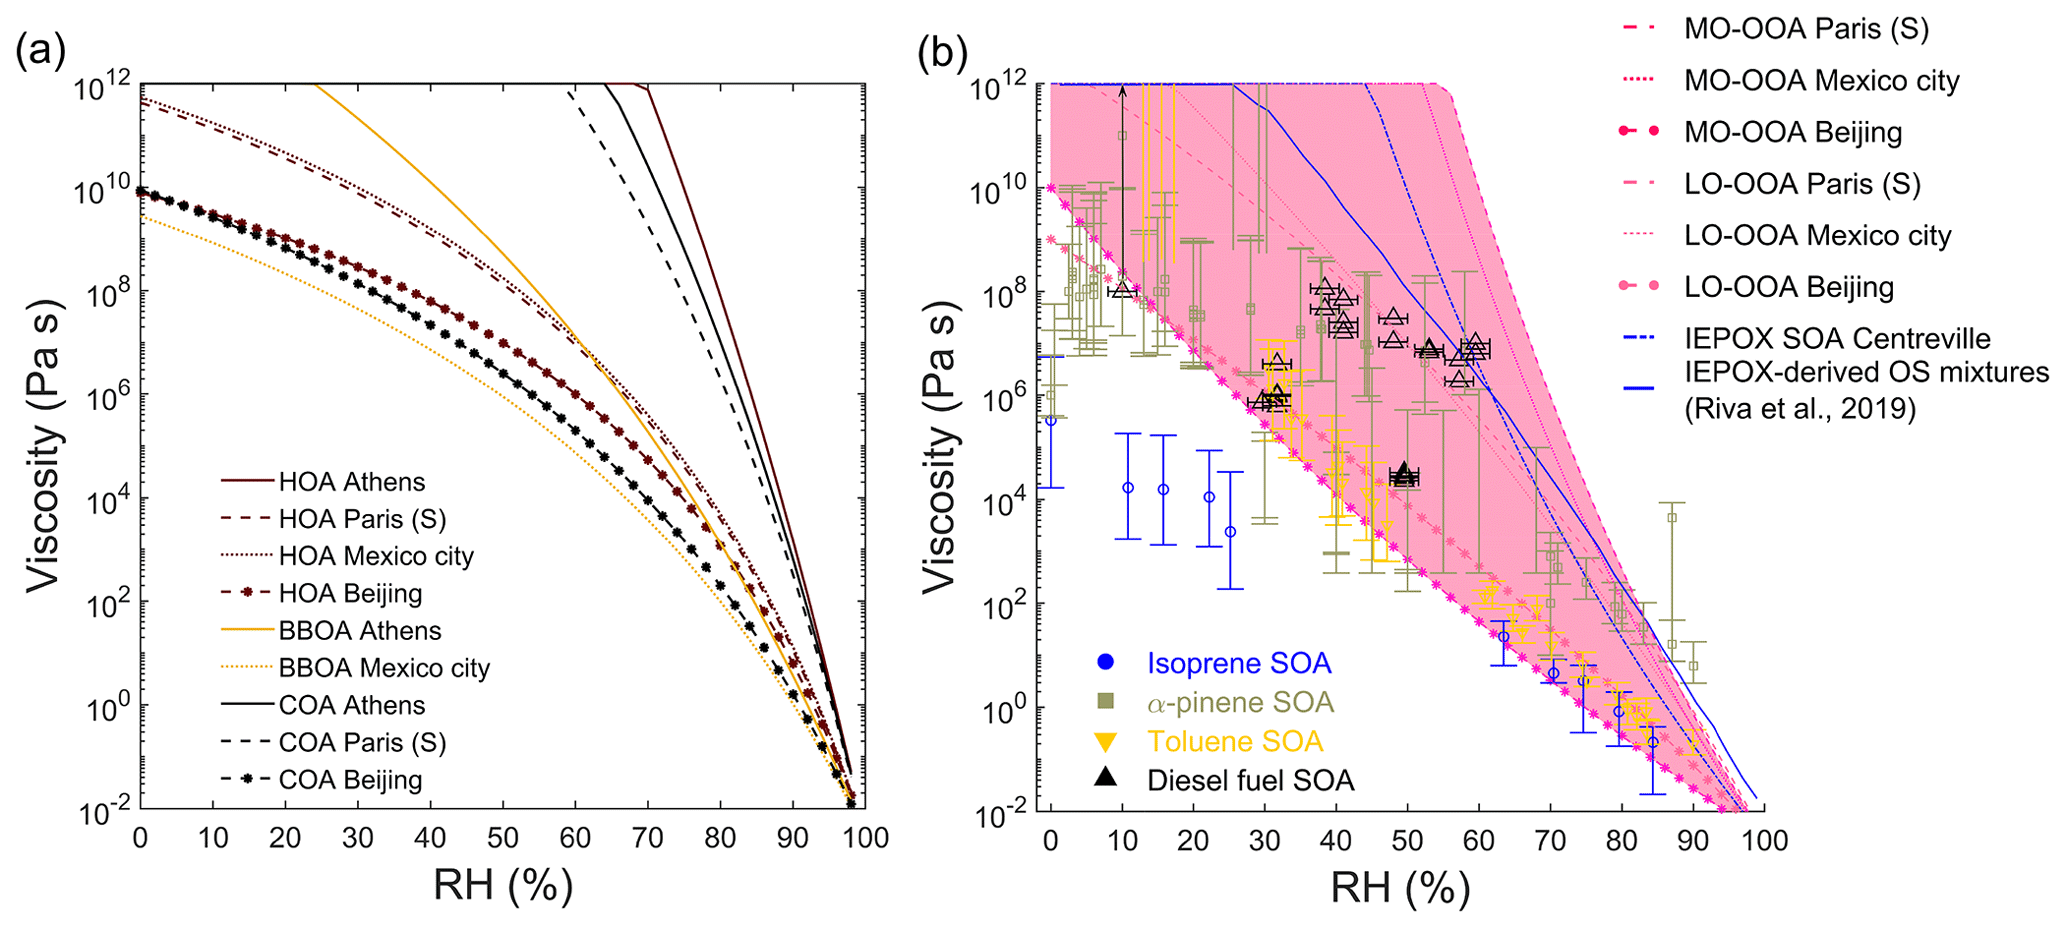
Figure 5Predicted viscosity of (a) HOA, COA, and BBOA and (b) LO-OOA, MO-OOA, and IEPOX SOA in different locations at 298 K as a function of RH. Experimentally measured viscosity of laboratory-generated SOA formed from isoprene (Song et al., 2015), α-pinene (Abramson et al., 2013; Renbaum-Wolff et al., 2013; Kidd et al., 2014; Pajunoja et al., 2014; Bateman et al., 2015; Zhang et al., 2015; Grayson et al., 2016; Petters et al., 2019), toluene (M. Song et al., 2016), and diesel fuel (Song et al., 2019) are also shown. Predicted viscosity of IEPOX-derived OS mixtures (solid blue line) is from Riva et al. (2019). Note that in the case when these OA factors are internally mixed with other components, the predicted viscosity would not represent real ambient complex organic mixtures.
There have been growing measurements of RH-dependent viscosity of laboratory-generated SOA formed from different precursors, e.g., isoprene (Song et al., 2015), α-pinene (Abramson et al., 2013; Renbaum-Wolff et al., 2013; Kidd et al., 2014; Pajunoja et al., 2014; Bateman et al., 2015; Zhang et al., 2015; Grayson et al., 2016; Petters et al., 2019), toluene (M. Song et al., 2016), and diesel fuel (Song et al., 2019). As the OOA factors characterized from ambient AMS observations may represent ambient SOA (Jimenez et al., 2009), the predicted viscosities of OOA are compared with laboratory measurements of SOA viscosities in Fig. 5b. It shows that the majority of experimental values is well bounded by the predicted viscosities of OOA, represented by the pink shaded area. One exception is the measured viscosity of isoprene SOA is lower than the predicted viscosity of IEPOX SOA at low RH (<30 %). One possible reason is that the isoprene SOA in experiments was formed with high oxidant concentrations with a short reaction time in an oxidation flow reactor in the absence of inorganic seed particles (Song et al., 2015). In ambient environments heterogeneous reactions with acidic sulfate particles forming oligomers are suggested to be an important pathway (Surratt et al., 2010; Lin et al., 2013; Hu et al., 2015, 2016). These particle-phase organosulfates may contribute to a higher viscosity, as indicated by the predicted viscosity of IEPOX-derived organosulfate mixtures with their Tg,org estimated to be 313 K (Riva et al., 2019). Another reason could be the mass concentrations of isoprene SOA are much higher (100–1000 µg m−3; Song et al., 2015) compared to ambient OA concentrations (5 µg m−3 during SOAS; Stark et al., 2017). Higher mass concentrations can lead to lower viscosity, as more semivolatile compounds can partition into the particle phase (Grayson et al., 2016; Jain et al., 2018; Champion et al., 2019).
Shiraiwa et al. (2017) simulated the global distribution of annual averages of SOA phase state using the chemical transport model EMAC (Jöckel et al., 2006) coupled with the organic aerosol module ORACLE (Tsimpidi et al., 2014). ORACLE uses the 1D-VBS framework with four C∗ bins (1, 10, 102, and 103 µg m−3). To estimate Tg, the values of molar mass and O:C ratio were assigned for each volatility bin based on molecular corridors (Shiraiwa et al., 2014). Note that the molar mass assigned for the volatility bin of 1 µg m−3 was assumed to have relatively high molar mass to partially compensate for the fact that ORACLE does not consider lower volatility bins with higher molar mass. As shown in Fig. 6, global distributions of Tg∕T presented in Shiraiwa et al. (2017) are converted to viscosity using the VTF equation. Figure 6 also includes the viscosity of total OA at the 11 sites by applying measured volatility distributions and the global model-simulated 5-year-average T and RH with κ assumed to be 0.1 (Pringle et al., 2010). Figure 6b shows that the predicted viscosities at the 11 sites generally agree with the global simulations: the amorphous solid or semisolid phase occurs over relatively dry areas, including the sites in western US, Mexico City, Beijing, and coastal sites in Greece; the lower viscosity occurs in southeastern US and Paris.
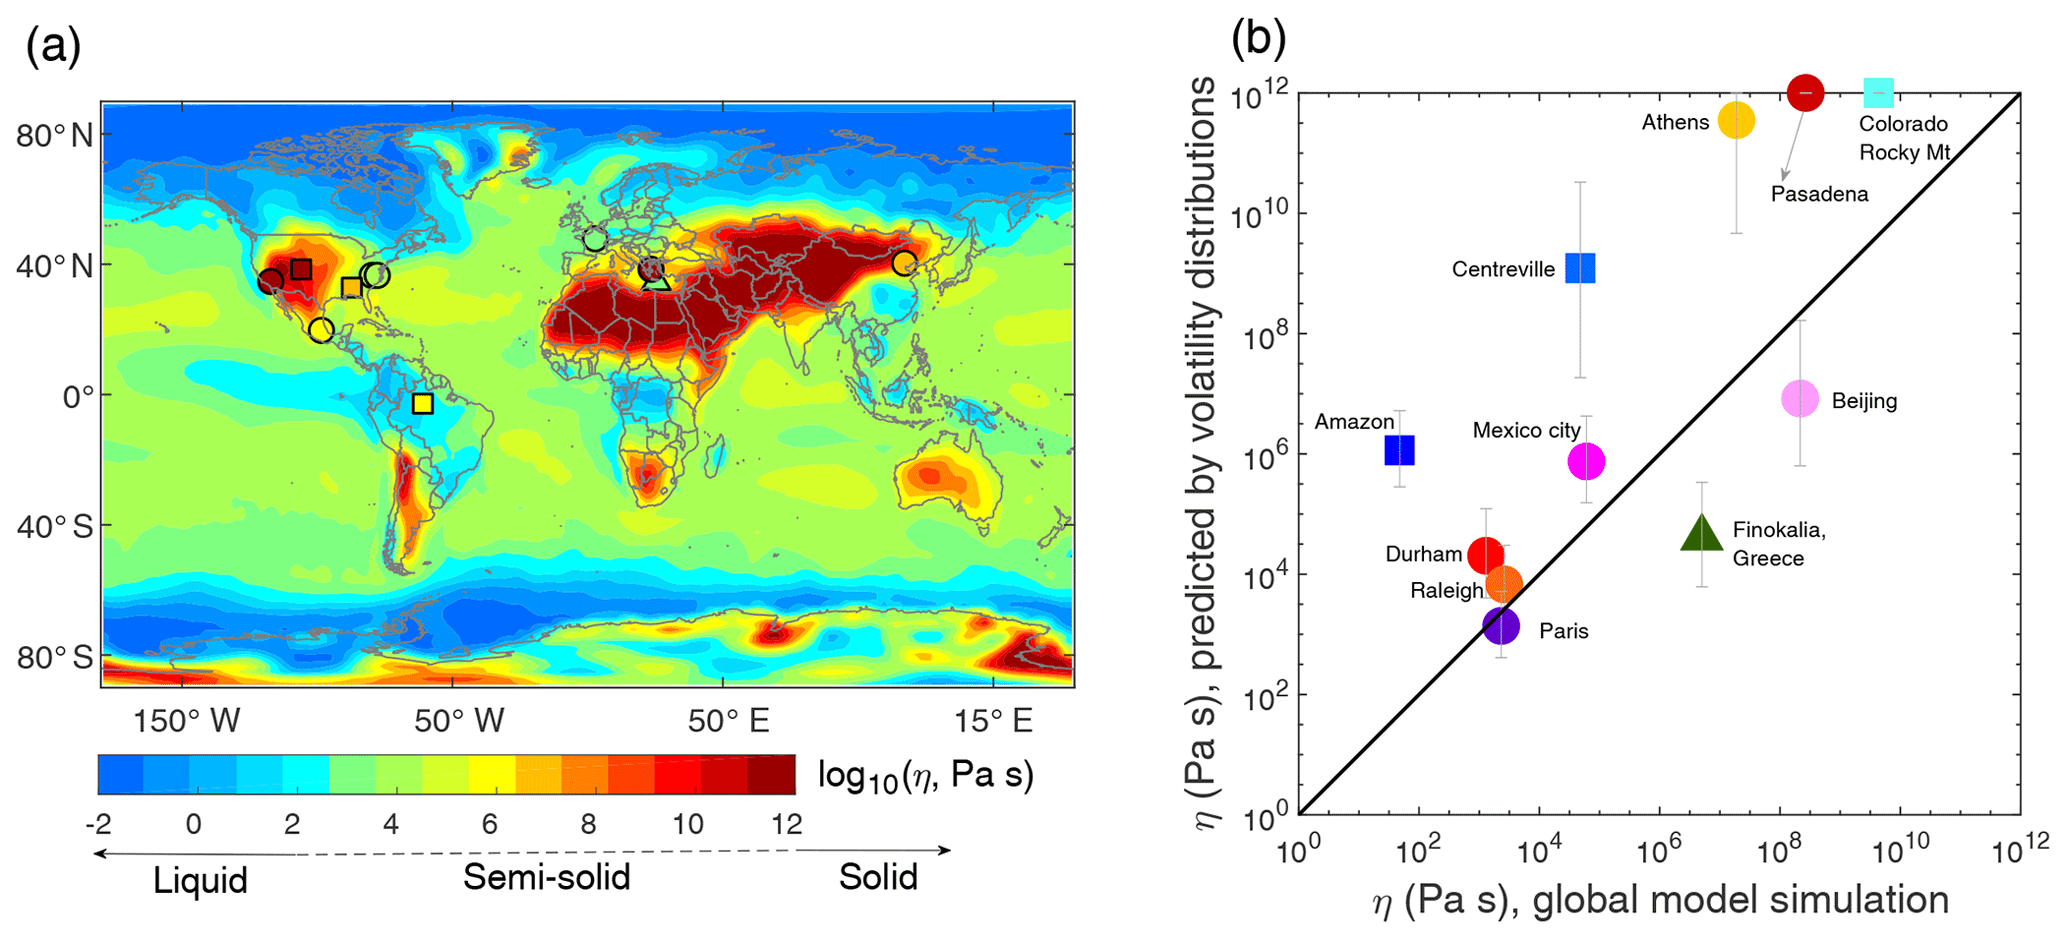
Figure 6(a) Global distributions of SOA annually averaged viscosity at the surface simulated by a global chemical transport model (Shiraiwa et al., 2017) with the viscosity predicted by measured volatility distributions at 11 global sites (triangle, square, and circle represent remote, forested, and urban sites, respectively, Table S3). The color code indicates viscosity on a log scale. (b) Predicted viscosity based on measured volatility distributions compared against the viscosity in global simulations. The error bars correspond to uncertainties in viscosities calculated from uncertainties in predicted Tg,org shown in Fig. 4.
The global simulations show that the particles are liquid in the Amazon, while they occur as semisolid in our predictions based on measured volatility distributions (Fig. 6a). The reason for this disagreement may be mainly due to the substantial fraction of low volatility compounds observed in ambient measurements largely missing from global simulations. Hu et al. (2016) observed that 90 % of OA has volatilities lower than 1 µg m−3, which is the lowest C∗ bin in the global simulations. The ambient phase-state measurements show that for background conditions of the Amazonian tropical forest particles are mostly liquid, while for the anthropogenic influence including both urban pollution and biomass burning they occur as semisolid or glassy (Bateman et al., 2016, 2017). The volatility distributions were measured in the dry season that is heavily influenced by biomass burning (Hu et al., 2016), which can lead to the higher predicted viscosity. Similar cases are observed in Athens and the two sites in the western US, that our predictions based on volatility distributions indicate the glassy phase state, while the global model predicts the occurrence of a semisolid phase.
We have developed parameterizations to estimate the glass transition temperature of organic compounds using saturation mass concentration (C0) and atomic O:C ratio. They can be applied to ambient observations of volatility distributions to estimate viscosity of ambient organic aerosols. The Tg and viscosity prediction method can be applied in the volatility basis set or the molecular-corridor-based approach to improve OA simulations in chemical transport models by consideration of effects of particle viscosity on OA formation and evolution (Shiraiwa et al., 2017; Pye et al., 2017; Schmedding et al., 2019). Most of the current chemical transport models treat particles as a homogeneously well-mixed liquid without considering particle-phase diffusion limitations, which can lead to bias in simulations of SOA mass concentrations and evolution of size distributions (Shiraiwa and Seinfeld, 2012; Zaveri et al., 2018). The SOA simulations applying the VBS framework have not yet included the effects of viscosity on SOA formation and evolution. When the gas–particle partitioning is limited by bulk diffusion, kinetic treatments of SOA partitioning may need to be applied (Perraud et al., 2012; Liu et al., 2016; Yli-Juuti et al., 2017; Li and Shiraiwa, 2019). Some chamber experiments probing the mixing timescales of SOA particles formed from isoprene, α-pinene, and limonene did not observe significant kinetic limitations at moderate and high RH under room temperature conditions (Loza et al., 2013; Ye et al., 2016), while kinetic limitations of bulk diffusion of organic molecules in β-caryophyllene SOA have been observed at 75 % RH (Ye et al., 2018), warranting further investigations on the degree of kinetic limitations in ambient tropospheric conditions. In addition, the interplay of diffusion limitations and phase separation impacts heterogeneous and multiphase chemistry (Vander Wall et al., 2018; DeRieux et al., 2019; Zhou et al., 2019) and gas–particle partitioning (Zuend and Seinfeld, 2012; Shiraiwa et al., 2013; Freedman, 2017; Pye et al., 2017; Gorkowski et al., 2019a). The particle morphology and the degree of nonideal mixing and liquid–liquid phase separation can evolve upon atmospheric aging (Gorkowski et al., 2019b). These aspects may also need to be considered for better representation of organic aerosols in future studies.
We recently developed a parameterization (Eq. A1) predicting Tg as a function of the number of carbon (nC), hydrogen (nH), and oxygen (nO) atoms (DeRieux et al., 2018), similar to the formulation used to predict C0 (Donahue et al., 2011; Li et al., 2016):
Values of the coefficients , bC, bH, bCH, bO, and bCO are 1.96, 61.99, −113.33, 28.74, 0, and 0 for CH compounds and 12.13, 10.95, −41.82, 21.61, 118.96, and −24.38 for CHO compounds. We broaden the parameterizations for CH and CHO compounds (Eq. A1) to the following equations applicable to CHON (Eq. A2) and CHOS compounds (Eq. A3):
Values of the coefficients , bC, bO, bN, bCO, bCN, and bON in Eq. (A2) are 5.34, 31.53, −7.06, 134.96, 6.54, −34.36, and −15.35, respectively. Values of the coefficients , bC, bO, bS, bCO, bCS, and bOS in Eq. (A3) are 1.12, 68.41, 64.95, 35.77, −12.32, −9.85, and 13.80, respectively. These values are obtained by fitting the Tg of CHON and CHOS compounds included in the training dataset (Fig. 1a, Table S1) with multilinear least squares analysis. Figure A1a shows a fair agreement between the predicted Tg using Eq. (A2) and the measured or otherwise estimated Tg with R of 0.55 and relatively large AAVRE of 16 % for CHON compounds in the training dataset. Figure A1b shows a better prediction performance with R of 0.83 and AAVRE of 9 % for 212 CHON compounds included in the test dataset for SOA components with their Tg estimated by the Boyer–Kauzmann rule using the EPI-estimated Tm. Figure A1c shows that Eq. (A3) performs well for the CHOS compounds included in the training dataset with their Tg estimated by the Boyer–Kauzmann rule using the EPI-estimated Tm (R=0.87, AAVRE =8 %).
Figure S5 shows the comparison of Tg predicted by the elemental composition (Eqs. A1–A3) with the Tg predicted as a function of C0 and the O:C ratio (Eq. 1). The agreement between the two sets of parameterizations for nitrogen- and sulfur-containing compounds is not as good as that for CHO compounds, indicating that there are limitations of predicting Tg by the elemental composition for nitrogen- and sulfur-containing compounds with complex elemental compositions and molecular structures. As volatility depends significantly on functional groups contained in a molecule (Pankow and Asher, 2008; Compernolle et al., 2011), predicting Tg by volatility (Eq. 1) indirectly incorporates the molecular structure effects. As there are limited CHON and CHOS compounds with measured Tg available, future experiments measuring more Tg data for nitrogen- and sulfur-containing organics would help improve the Tg parameterizations by elemental composition.
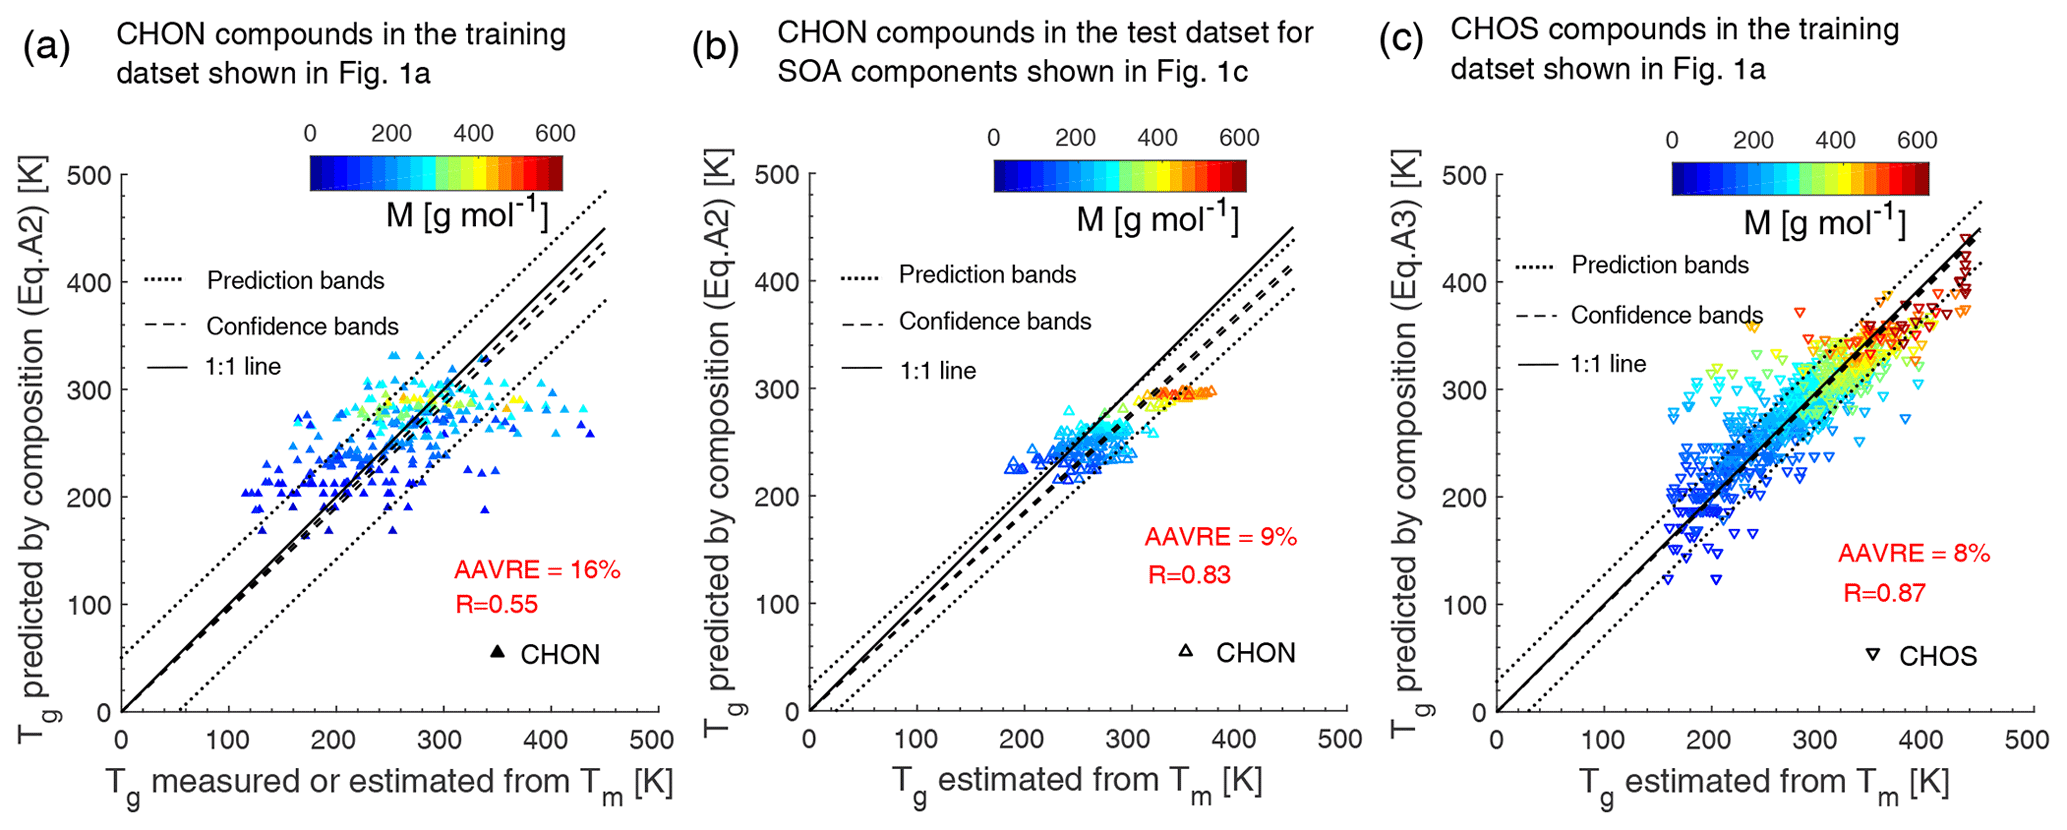
Figure A1Tg predicted by elemental composition (Eq. A2) compared to (a) measured or otherwise estimated Tg by the Boyer–Kauzmann rule using measured Tm for CHON compounds in the training dataset and (b) estimated Tg by the Boyer–Kauzmann rule with Tm estimated by the EPI Suite for CHON compounds in the test dataset for SOA components. (c) Tg predicted by elemental composition (Eq. A3) compared to estimated Tg by the Boyer–Kauzmann rule with Tm estimated by the EPI Suite for CHOS compounds in the training dataset. The dashed and dotted lines show 68 % confidence and prediction bands, respectively. The correlation coefficient (R) and the average absolute value of the relative error (AAVRE) are included in each figure legend.
Recently Zhang et al. (2019) developed a semiempirical parameterization (Eq. B1) using vapor pressure (p0 in atm) to predict Tg based on measured Tg of 11 SOA compounds:
p0 can be converted to C0 via , where R is the ideal gas constant ( m3 atm mol−1 K−1), M is the molar mass (g mol−1), and T is the temperature (K). Figure B1 compares the measured Tg included in the training dataset shown in Fig. 1a to Tg predicted by (a) C0 and the atomic O:C ratio (Eq. 1), (b) elemental composition (Eqs. A1–A3), and (c) Eq. (B1) by Zhang et al. (2019). While all three methods perform reasonably well, the predictions using elemental composition (Eqs. A1–A3) show better performance (Fig. B1b) with R of 0.93 and AAVRE of 11 %.
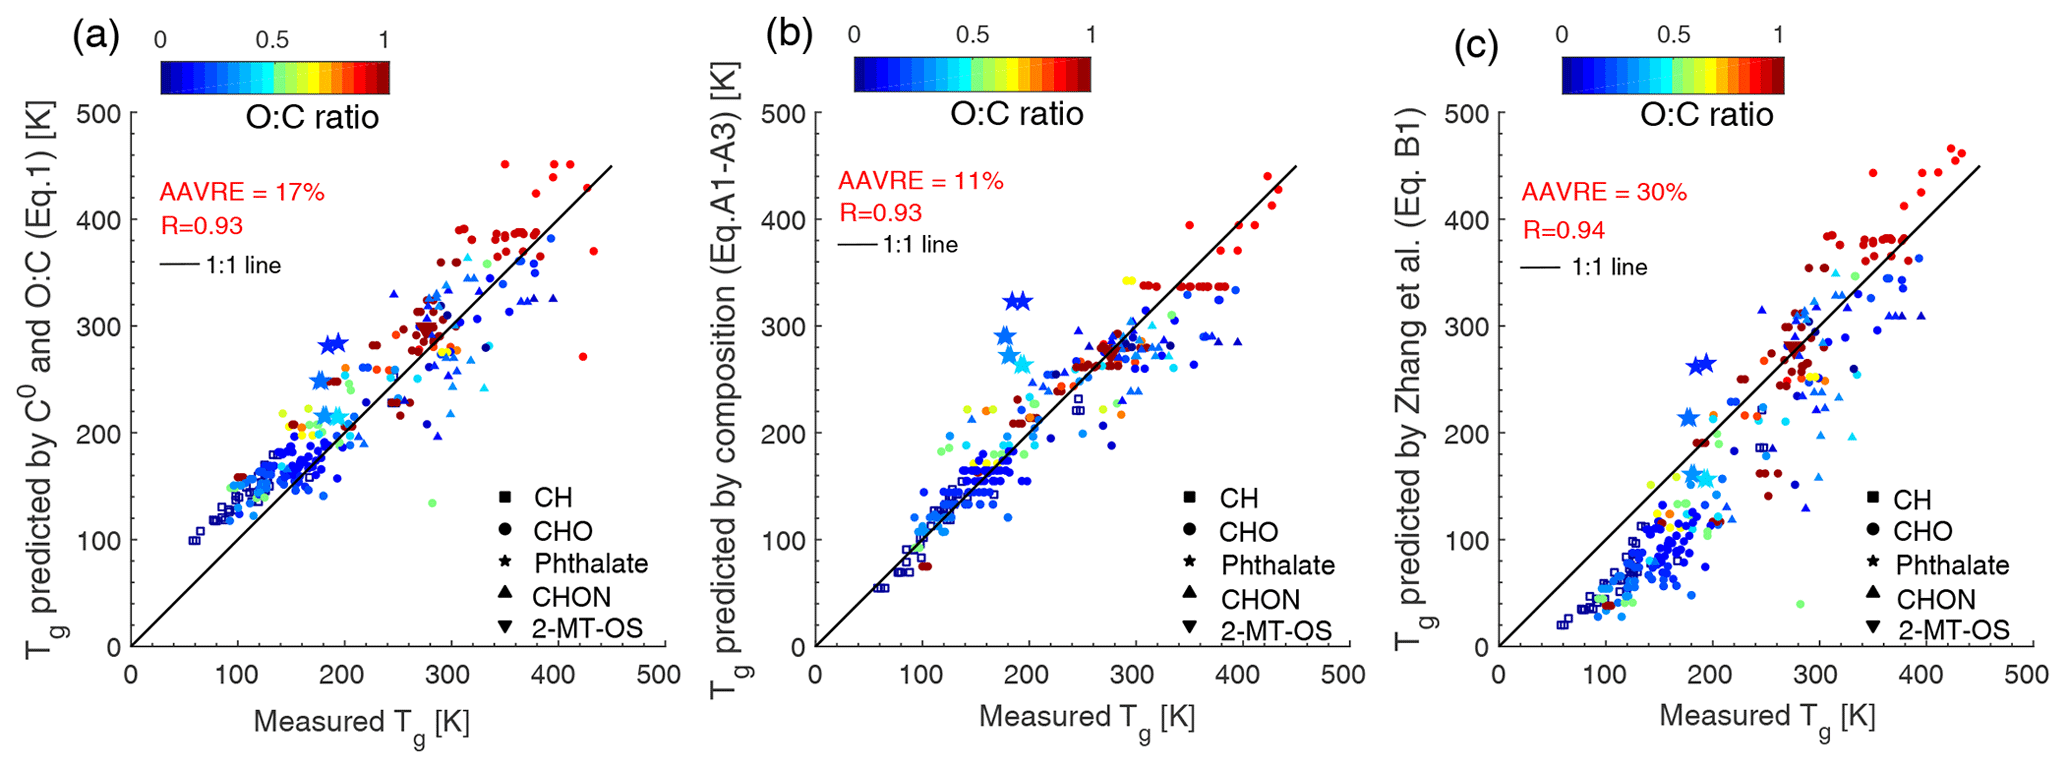
Figure B1Comparison between measured Tg in the training dataset in Fig. 1a and Tg predicted by (a) C0 and O:C (Eq. 1), (b) elemental composition (Eqs. A1–A3), and (c) the parameterization (Eq. B1) in Zhang et al. (2019). The solid line shows the 1:1 line. The correlation coefficient (R) and the average absolute value of the relative error (AAVRE) are included in each figure legend.
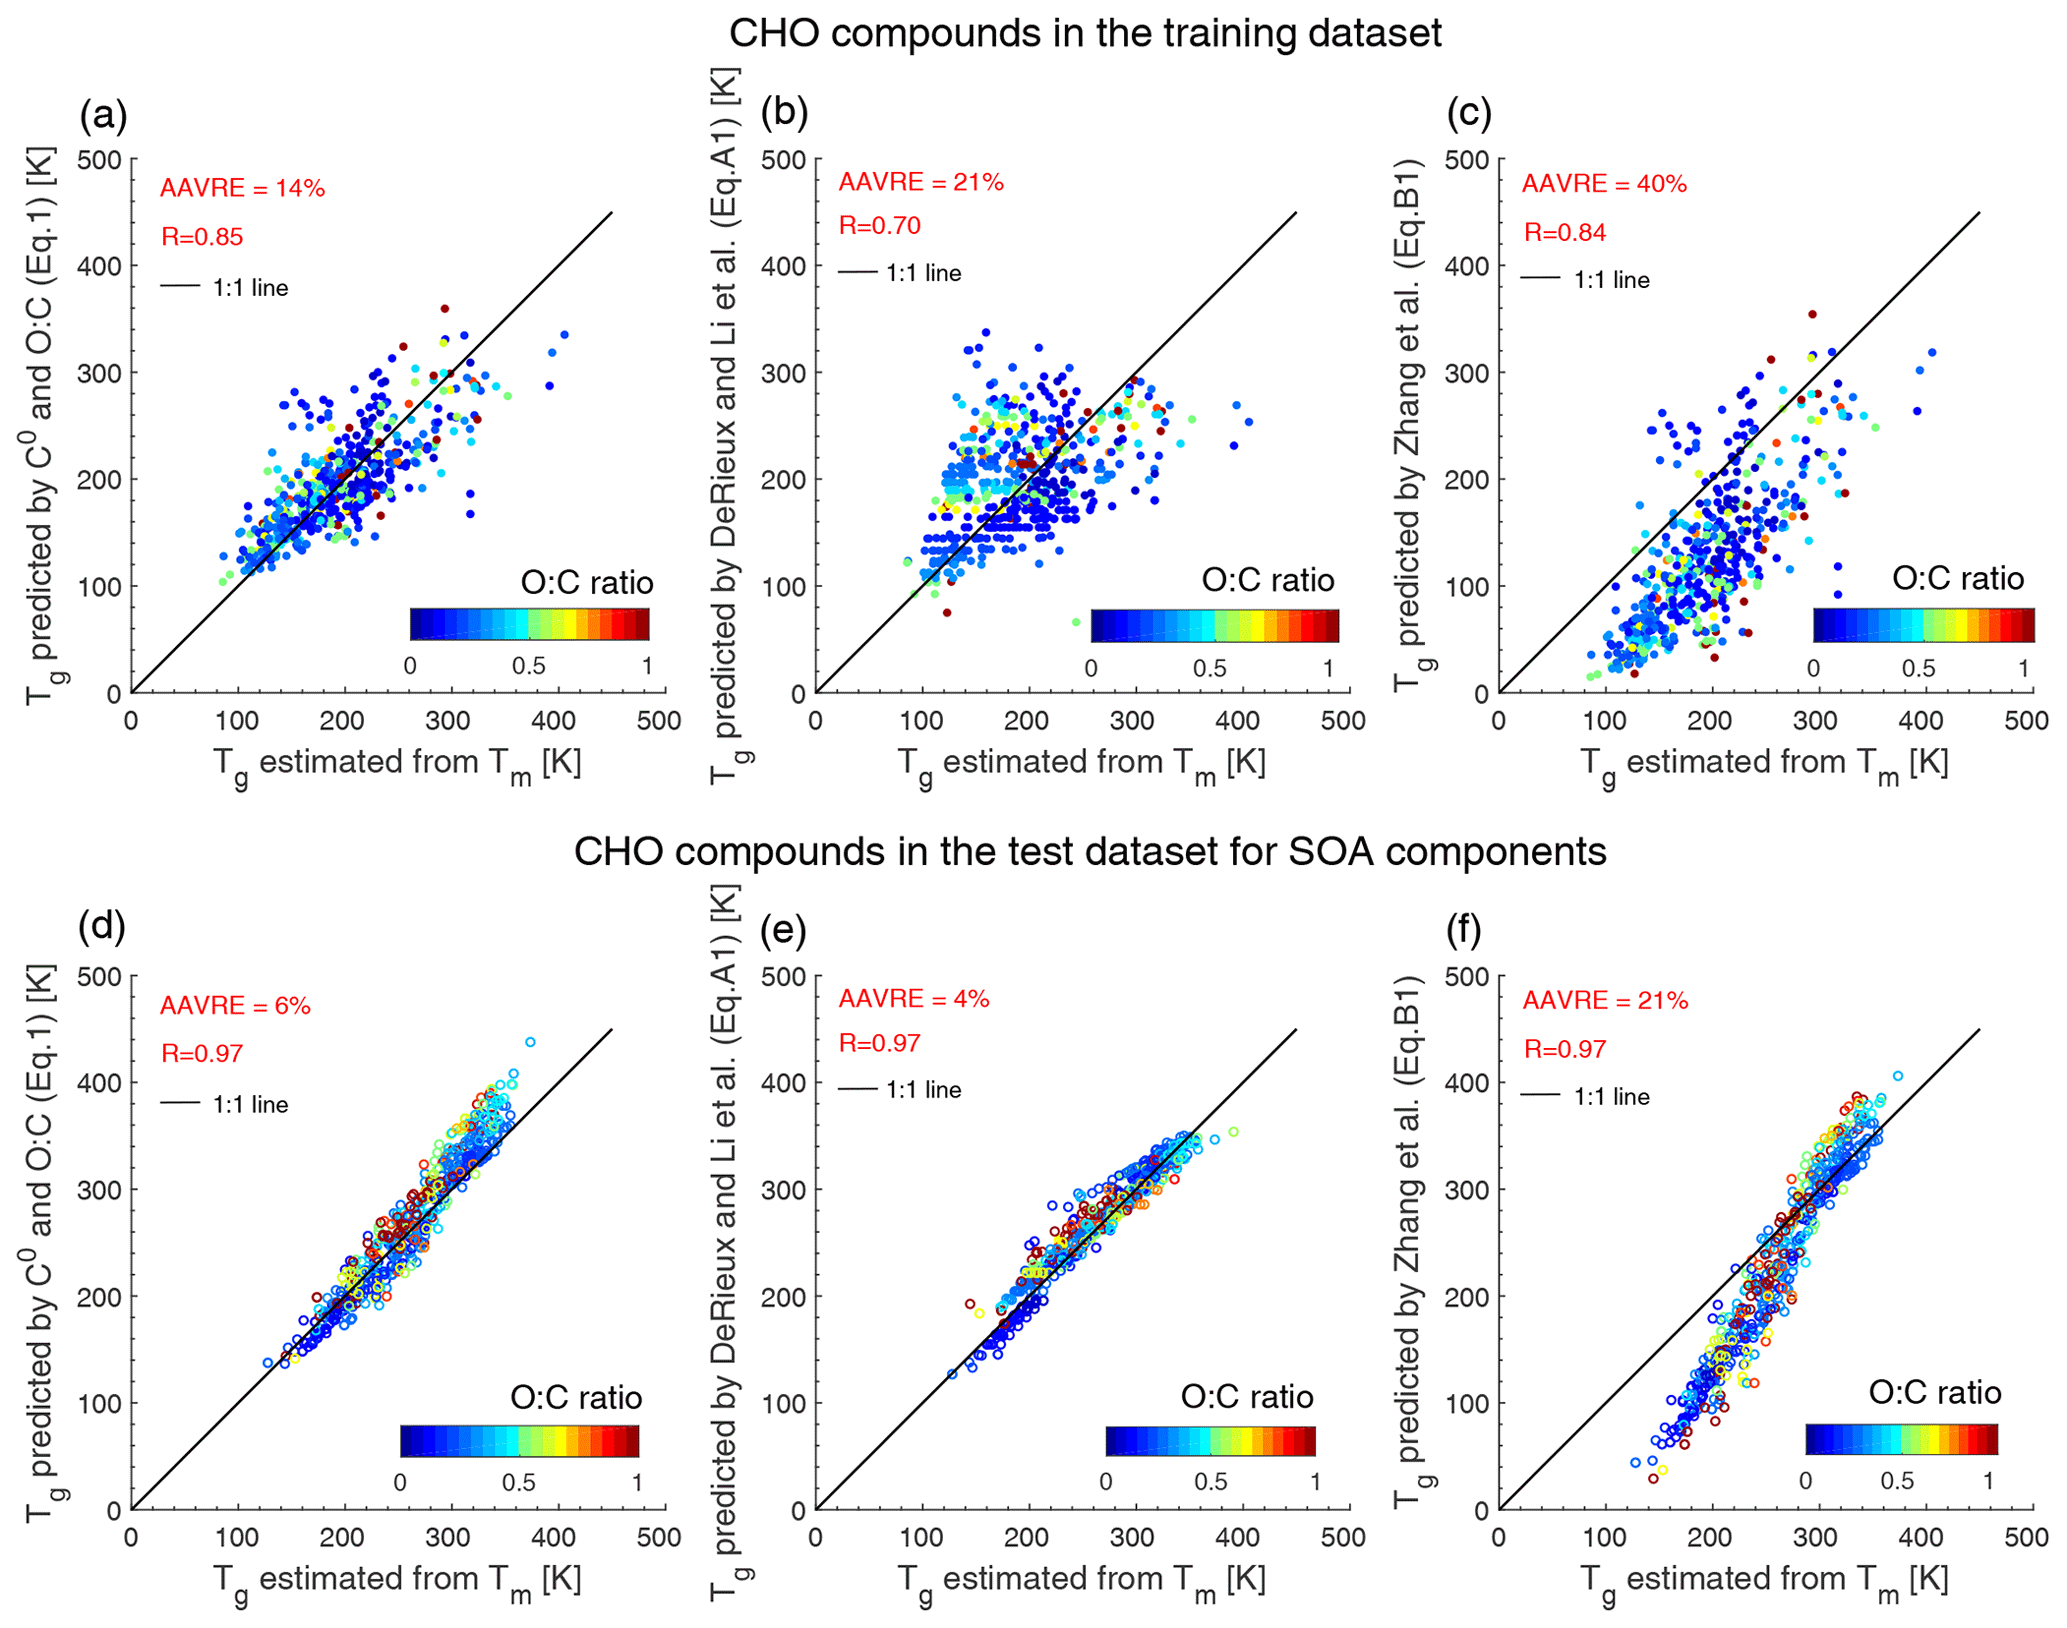
Figure B2Predicted Tg by (a) C0 and O:C (Eq. 1), (b) elemental composition (Eq. A1), and (c) the parameterization (Eq. B1) in Zhang et al. (2019) plotted against estimated Tg from Tm applying the Boyer–Kauzmann rule. CHO compounds in (a)–(c) included in the training dataset shown in Fig. 1a are with measured Tm and C0 values; CHO compounds in (d)–(f) included in the test dataset for SOA components shown in Fig. 1c are with Tm and C0 values estimated by the EPI Suite and the EVAPORATION model, respectively. The correlation coefficient (R) and the average absolute value of the relative error (AAVRE) are shown.
The prediction performance is influenced by the training dataset used to develop parameterizations of Tg. The compounds shown in Fig. B1 contain mostly carboxylic acid and hydroxyl functional groups (Koop et al., 2011; Rothfuss and Petters, 2017) and are included in the training dataset used to develop Eqs. (1) and Eqs. (A1)–(A3). The training dataset used in Zhang et al. (2019) included 11 organic compounds, and their parameterization predicted Tg of isoprene SOA very well (Zhang et al., 2019), but underpredicted some low-Tg compounds (Fig. B1c). For compounds with their measured Tg higher than 200 K, predictions by Zhang et al. (2019) show good performance and are consistent with the predictions given by Eq. (1) as a function of C0 and the O:C ratio. Predicted Tg values of 2-MT-OS using the three methods are 297 K (Eq. 1, as a function of C0 and the O:C ratio), 275 K (Eq. A3, as a function of the elemental composition), and 280 K (Eq. B1, Zhang et al., 2019), comparable with the measured Tg of 276±15 K (Zhang et al., 2019).
Note that predictions using elemental composition (Eq. A1) overestimate the Tg of phthalate compounds (the star markers in Fig. B1). For instance, the observed Tg of dioctyl phthalate is 194 K (Zhang et al., 2018), while the prediction is higher than 300 K (Fig. B1b). The reason is that ester is not an effective functional group to increase viscosity compared to carboxylic acid and hydroxyl (Rothfuss and Petters, 2017). Parameterizations using volatility (Eqs. 1 and B1) improve the predicted Tg of phthalate compounds (Fig. B1a, c). Figure B2 shows, compared to the predictions using Eq. (B1) provided in Zhang et al. (2019), that predictions by C0 and the atomic O:C (Eq. 1) and elemental composition (Eq. A1) agree better with the Tg estimated from the Boyer–Kauzmann rule. Future experiments measuring more Tg data of SOA components would help verify the Tg predictions by different parameterizations.
The data used in this study are available in the Supplement.
The supplement related to this article is available online at: https://doi.org/10.5194/acp-20-8103-2020-supplement.
YL, JLJ, and MS designed the research. YL developed the parameterizations. DAD, HS, and JLJ provided measured volatility distributions for the SOAS campaign. YL and MS wrote the article. All authors discussed the results and contributed to article editing.
We thank Alexandra Tsimpidi, Vlassis Karydis, Spyros Pandis, and Jos Lelieveld for global simulations of SOA concentrations used to calculate Tg∕T (as presented in Shiraiwa et al., 2017), which are converted into viscosity (Fig. 6). We also thank Sergey Nizkorodov, Andreas Zuend, Yue Zhang, Jason Surratt, and Markus Petters for stimulating discussions.
This research has been supported by the National Science Foundation, Division of Atmospheric and Geospace Sciences (grant nos. AGS-1654104 and AGS-1822664) and the U.S. Department of Energy (grant nos. DE-SC0018349 and DE-SC0016559).
This paper was edited by Neil M. Donahue and reviewed by two anonymous referees.
Abramson, E., Imre, D., Beranek, J., Wilson, J. M., and Zelenyuk, A.: Experimental determination of chemical diffusion within secondary organic aerosol particles, Phys. Chem. Chem. Phys., 15, 2983–2991, https://doi.org/10.1039/c2cp44013j, 2013.
Aiken, A. C., DeCarlo, P. F., and Jimenez, J. L.: Elemental analysis of organic species with electron ionization high-resolution mass spectrometry, Anal. Chem., 79, 8350–8358, https://doi.org/10.1021/ac071150w, 2007.
Angell, C.: Relaxation in liquids, polymers and plastic crystals – strong/fragile patterns and problems, J. Non-Cryst. Solids, 131–133, 13–31, https://doi.org/10.1016/0022-3093(91)90266-9, 1991.
Bateman, A. P., Bertram, A. K., and Martin, S. T.: Hygroscopic influence on the semisolid-to-liquid transition of secondary organic materials, J. Phys. Chem. A, 119, 4386–4395, https://doi.org/10.1021/jp508521c, 2015.
Bateman, A. P., Gong, Z., Liu, P., Sato, B., Cirino, G., Zhang, Y., Artaxo, P., Bertram, A. K., Manzi, A. O., Rizzo, L. V., Souza, R. A. F., Zaveri, R. A., and Martin, S. T.: Sub-micrometre particulate matter is primarily in liquid form over Amazon rainforest, Nat. Geosci., 9, 34–37, https://doi.org/10.1038/ngeo2599, 2016.
Bateman, A. P., Gong, Z., Harder, T. H., de Sá, S. S., Wang, B., Castillo, P., China, S., Liu, Y., O'Brien, R. E., Palm, B. B., Shiu, H.-W., Cirino, G. G., Thalman, R., Adachi, K., Alexander, M. L., Artaxo, P., Bertram, A. K., Buseck, P. R., Gilles, M. K., Jimenez, J. L., Laskin, A., Manzi, A. O., Sedlacek, A., Souza, R. A. F., Wang, J., Zaveri, R., and Martin, S. T.: Anthropogenic influences on the physical state of submicron particulate matter over a tropical forest, Atmos. Chem. Phys., 17, 1759–1773, https://doi.org/10.5194/acp-17-1759-2017, 2017.
Berkemeier, T., Shiraiwa, M., Pöschl, U., and Koop, T.: Competition between water uptake and ice nucleation by glassy organic aerosol particles, Atmos. Chem. Phys., 14, 12513–12531, https://doi.org/10.5194/acp-14-12513-2014, 2014.
Bilde, M., Barsanti, K., Booth, M., Cappa, C. D., Donahue, N. M., Emanuelsson, E. U., McFiggans, G., Krieger, U. K., Marcolli, C., Topping, D., Ziemann, P., Barley, M., Clegg, S., Dennis-Smither, B., Hallquist, M., Hallquist, Å. M., Khlystov, A., Kulmala, M., Mogensen, D., Percival, C. J., Pope, F., Reid, J. P., Ribeiro da Silva, M. A. V., Rosenoern, T., Salo, K., Soonsin, V. P., Yli-Juuti, T., Prisle, N. L., Pagels, J., Rarey, J., Zardini, A. A., and Riipinen, I.: Saturation vapor pressures and transition enthalpies of low-volatility organic molecules of atmospheric relevance: from dicarboxylic acids to complex mixtures, Chem. Rev., 115, 4115–4156, https://doi.org/10.1021/cr5005502, 2015.
Bosse, D.: Diffusion, viscosity, and thermodynamics in liquid systems, PhD thesis, available at: https://kluedo.ub.uni-kl.de/frontdoor/deliver/index/docId/1691/file/PhD-Bosse-published.pdf (last access: 9 July 2020), 2005.
Boyer, R. F.: Relationship of first-to second-order transition temperatures for crystalline high polymers, J. Appl. Phys., 25, 825–829, https://doi.org/10.1063/1.1721752, 1954.
Cao, W., Knudsen, K., Fredenslund, A. and Rasmussen, P.: Group-contribution viscosity predictions of liquid mixtures using UNIFAC-VLE parameters, Ind. Eng. Chem. Res., 32, 2088–2092, https://doi.org/10.1021/ie00021a034, 1993.
Capouet, M. and Müller, J.-F.: A group contribution method for estimating the vapour pressures of α-pinene oxidation products, Atmos. Chem. Phys., 6, 1455–1467, https://doi.org/10.5194/acp-6-1455-2006, 2006.
Cappa, C. D. and Jimenez, J. L.: Quantitative estimates of the volatility of ambient organic aerosol, Atmos. Chem. Phys., 10, 5409–5424, https://doi.org/10.5194/acp-10-5409-2010, 2010.
Carlton, A. G., de Gouw, J., Jimenez, J. L., Ambrose, J. L., Attwood, A. R., Brown, S., Baker, K. R., Brock, C., Cohen, R. C., and Edgerton, S.: Synthesis of the southeast atmosphere studies: Investigating fundamental atmospheric chemistry questions, B. Am. Meteorol. Soc., 99, 547–567, https://doi.org/10.1175/BAMS-D-16-0048.1, 2018.
Cerully, K. M., Bougiatioti, A., Hite Jr., J. R., Guo, H., Xu, L., Ng, N. L., Weber, R., and Nenes, A.: On the link between hygroscopicity, volatility, and oxidation state of ambient and water-soluble aerosols in the southeastern United States, Atmos. Chem. Phys., 15, 8679–8694, https://doi.org/10.5194/acp-15-8679-2015, 2015.
Champion, W. M., Rothfuss, N. E., Petters, M. D., and Grieshop, A. P.: Volatility and viscosity are correlated in terpene secondary organic aerosol formed in a flow reactor, Environ. Sci. Tech. Let., 6, 513–519, https://doi.org/10.1021/acs.estlett.9b00412, 2019.
Chenyakin, Y., Ullmann, D. A., Evoy, E., Renbaum-Wolff, L., Kamal, S., and Bertram, A. K.: Diffusion coefficients of organic molecules in sucrose–water solutions and comparison with Stokes–Einstein predictions, Atmos. Chem. Phys., 17, 2423–2435, https://doi.org/10.5194/acp-17-2423-2017, 2017.
Compernolle, S., Ceulemans, K., and Müller, J.-F.: EVAPORATION: a new vapour pressure estimation methodfor organic molecules including non-additivity and intramolecular interactions, Atmos. Chem. Phys., 11, 9431–9450, https://doi.org/10.5194/acp-11-9431-2011, 2011.
D'Ambro, E. L., Schobesberger, S., Gaston, C. J., Lopez-Hilfiker, F. D., Lee, B. H., Liu, J., Zelenyuk, A., Bell, D., Cappa, C. D., Helgestad, T., Li, Z., Guenther, A., Wang, J., Wise, M., Caylor, R., Surratt, J. D., Riedel, T., Hyttinen, N., Salo, V.-T., Hasan, G., Kurtén, T., Shilling, J. E., and Thornton, J. A.: Chamber-based insights into the factors controlling epoxydiol (IEPOX) secondary organic aerosol (SOA) yield, composition, and volatility, Atmos. Chem. Phys., 19, 11253–11265, https://doi.org/10.5194/acp-19-11253-2019, 2019.
DeRieux, W.-S. W., Li, Y., Lin, P., Laskin, J., Laskin, A., Bertram, A. K., Nizkorodov, S. A., and Shiraiwa, M.: Predicting the glass transition temperature and viscosity of secondary organic material using molecular composition, Atmos. Chem. Phys., 18, 6331–6351, https://doi.org/10.5194/acp-18-6331-2018, 2018.
DeRieux, W.-S. W., Lakey, P. S. J., Chu, Y., Chan, C. K. K., Glicker, H., Smith, J. N., Zuend, A., and Shiraiwa, M.: Effects of phase state and phase separation on dimethylamine uptake of ammonium sulfate and ammonium sulfate–sucrose mixed particles, ACS Earth Space Chem., 3, 1268–1278, https://doi.org/10.1021/acsearthspacechem.9b00142, 2019.
Dette, H. P., Qi, M., Schröder, D. C., Godt, A., and Koop, T.: Glass-forming properties of 3-methylbutane-1,2,3-tricarboxylic acid and its mixtures with water and pinonic acid, J. Phys. Chem. A, 118, 7024–7033, https://doi.org/10.1021/jp505910w, 2014.
Dette, H. P. and Koop, T.: Glass formation processes in mixed inorganic/organic aerosol particles, J. Phys. Chem. A, 119, 4552–4561, https://doi.org/10.1021/jp5106967, 2015.
Ditto, J. C., Barnes, E. B., Khare, P., Takeuchi, M., Joo, T., Bui, A. A. T., Lee-Taylor, J., Eris, G., Chen, Y., Aumont, B., Jimenez, J. L., Ng, N. L., Griffin, R. J., and Gentner, D. R.: An omnipresent diversity and variability in the chemical composition of atmospheric functionalized organic aerosol, Commun. Chem., 1, 75, https://doi.org/10.1038/s42004-018-0074-3, 2018.
Ditto, J. C., Joo, T., Khare, P., Sheu, R., Takeuchi, M., Chen, Y., Xu, W., Bui, A. A. T., Sun, Y., Ng, N. L. S., and Gentner, D. R.: Effects of molecular-level compositional variability in organic aerosol on phase state and thermodynamic mixing behavior, Environ. Sci. Technol., 53, 13009–13018, https://doi.org/10.1021/acs.est.9b02664, 2019.
Donahue, N., Robinson, A., Stanier, C., and Pandis, S.: Coupled partitioning, dilution, and chemical aging of semivolatile organics, Environ. Sci. Technol., 40, 2635–2643, https://doi.org/10.1021/es052297c, 2006.
Donahue, N. M., Epstein, S. A., Pandis, S. N., and Robinson, A. L.: A two-dimensional volatility basis set: 1. organic-aerosol mixing thermodynamics, Atmos. Chem. Phys., 11, 3303–3318, https://doi.org/10.5194/acp-11-3303-2011, 2011.
Evoy, E., Maclean, A. M., Rovelli, G., Li, Y., Tsimpidi, A. P., Karydis, V. A., Kamal, S., Lelieveld, J., Shiraiwa, M., Reid, J. P., and Bertram, A. K.: Predictions of diffusion rates of large organic molecules in secondary organic aerosols using the Stokes–Einstein and fractional Stokes–Einstein relations, Atmos. Chem. Phys., 19, 10073–10085, https://doi.org/10.5194/acp-19-10073-2019, 2019.
Faulhaber, A. E., Thomas, B. M., Jimenez, J. L., Jayne, J. T., Worsnop, D. R., and Ziemann, P. J.: Characterization of a thermodenuder-particle beam mass spectrometer system for the study of organic aerosol volatility and composition, Atmos. Meas. Tech., 2, 15–31, https://doi.org/10.5194/amt-2-15-2009, 2009.
Freedman, M. A.: Phase separation in organic aerosol, Chem. Soc. Rev., 46, 7694–7705, https://doi.org/10.1039/c6cs00783j, 2017.
Gervasi, N. R., Topping, D. O., and Zuend, A.: A predictive group-contribution model for the viscosity of aqueous organic aerosol, Atmos. Chem. Phys., 20, 2987–3008, https://doi.org/10.5194/acp-20-2987-2020, 2020.
Goldstein, A. H. and Galbally, I. E.: Known and unexplored organic constituents in the Earth's atmosphere, Environ. Sci. Technol., 41, 1514–1521, https://doi.org/10.1021/es072476p, 2007.
Gordon, M. and Taylor, J. S.: Ideal copolymers and the second-order transitions of synthetic rubbers. i. non-crystalline copolymers, J. Appl. Chem., 2, 493–500, https://doi.org/10.1002/jctb.5010020901, 1952.
Gorkowski, K., Preston, T. C., and Zuend, A.: Relative-humidity-dependent organic aerosol thermodynamics via an efficient reduced-complexity model, Atmos. Chem. Phys., 19, 13383–13407, https://doi.org/10.5194/acp-19-13383-2019, 2019a.
Gorkowski, K., Donahue, N. M., and Sullivan, R. C.: Aerosol optical tweezers constrain the morphology evolution of liquid-liquid phase-separated atmospheric particles, Chem, 6, 1–17, https://doi.org/10.1016/j.chempr.2019.10.018, 2019b.
Grayson, J. W., Zhang, Y., Mutzel, A., Renbaum-Wolff, L., Böge, O., Kamal, S., Herrmann, H., Martin, S. T., and Bertram, A. K.: Effect of varying experimental conditions on the viscosity of α-pinene derived secondary organic material, Atmos. Chem. Phys., 16, 6027–6040, https://doi.org/10.5194/acp-16-6027-2016, 2016.
Hallquist, M., Wenger, J. C., Baltensperger, U., Rudich, Y., Simpson, D., Claeys, M., Dommen, J., Donahue, N. M., George, C., Goldstein, A. H., Hamilton, J. F., Herrmann, H., Hoffmann, T., Iinuma, Y., Jang, M., Jenkin, M. E., Jimenez, J. L., Kiendler-Scharr, A., Maenhaut, W., McFiggans, G., Mentel, Th. F., Monod, A., Prévôt, A. S. H., Seinfeld, J. H., Surratt, J. D., Szmigielski, R., and Wildt, J.: The formation, properties and impact of secondary organic aerosol: current and emerging issues, Atmos. Chem. Phys., 9, 5155–5236, https://doi.org/10.5194/acp-9-5155-2009, 2009.
Hu, W. W., Campuzano-Jost, P., Palm, B. B., Day, D. A., Ortega, A. M., Hayes, P. L., Krechmer, J. E., Chen, Q., Kuwata, M., Liu, Y. J., de Sá, S. S., McKinney, K., Martin, S. T., Hu, M., Budisulistiorini, S. H., Riva, M., Surratt, J. D., St. Clair, J. M., Isaacman-Van Wertz, G., Yee, L. D., Goldstein, A. H., Carbone, S., Brito, J., Artaxo, P., de Gouw, J. A., Koss, A., Wisthaler, A., Mikoviny, T., Karl, T., Kaser, L., Jud, W., Hansel, A., Docherty, K. S., Alexander, M. L., Robinson, N. H., Coe, H., Allan, J. D., Canagaratna, M. R., Paulot, F., and Jimenez, J. L.: Characterization of a real-time tracer for isoprene epoxydiols-derived secondary organic aerosol (IEPOX-SOA) from aerosol mass spectrometer measurements, Atmos. Chem. Phys., 15, 11807–11833, https://doi.org/10.5194/acp-15-11807-2015, 2015.
Hu, W., Palm, B. B., Day, D. A., Campuzano-Jost, P., Krechmer, J. E., Peng, Z., de Sá, S. S., Martin, S. T., Alexander, M. L., Baumann, K., Hacker, L., Kiendler-Scharr, A., Koss, A. R., de Gouw, J. A., Goldstein, A. H., Seco, R., Sjostedt, S. J., Park, J.-H., Guenther, A. B., Kim, S., Canonaco, F., Prévôt, A. S. H., Brune, W. H., and Jimenez, J. L.: Volatility and lifetime against OH heterogeneous reaction of ambient isoprene-epoxydiols-derived secondary organic aerosol (IEPOX-SOA), Atmos. Chem. Phys., 16, 11563–11580, https://doi.org/10.5194/acp-16-11563-2016, 2016.
Jain, S., Fischer, B. K., and Petrucci, A. G.: The Influence of absolute mass loading of secondary organic aerosols on their phase state, Atmosphere, 9, 131, https://doi.org/10.3390/atmos9040131, 2018.
Jimenez, J. L., Canagaratna, M. R., Donahue, N. M., Prevot, A. S. H., Zhang, Q., Kroll, J. H., DeCarlo, P. F., Allan, J. D., Coe, H., Ng, N. L., Aiken, A. C., Docherty, K. S., Ulbrich, I. M., Grieshop, A. P., Robinson, A. L., Duplissy, J., Smith, J. D., Wilson, K. R., Lanz, V. A., Hueglin, C., Sun, Y. L., Tian, J., Laaksonen, A., Raatikainen, T., Rautiainen, J., Vaattovaara, P., Ehn, M., Kulmala, M., Tomlinson, J. M., Collins, D. R., Cubison, M. J., Dunlea, E. J., Huffman, J. A., Onasch, T. B., Alfarra, M. R., Williams, P. I., Bower, K., Kondo, Y., Schneider, J., Drewnick, F., Borrmann, S., Weimer, S., Demerjian, K., Salcedo, D., Cottrell, L., Griffin, R., Takami, A., Miyoshi, T., Hatakeyama, S., Shimono, A., Sun, J. Y., Zhang, Y. M., Dzepina, K., Kimmel, J. R., Sueper, D., Jayne, J. T., Herndon, S. C., Trimborn, A. M., Williams, L. R., Wood, E. C., Middlebrook, A. M., Kolb, C. E., Baltensperger, U., and Worsnop, D. R.: Evolution of organic aerosols in the atmosphere, Science, 326, 1525–1529, https://doi.org/10.1126/science.1180353, 2009.
Jöckel, P., Tost, H., Pozzer, A., Brühl, C., Buchholz, J., Ganzeveld, L., Hoor, P., Kerkweg, A., Lawrence, M. G., Sander, R., Steil, B., Stiller, G., Tanarhte, M., Taraborrelli, D., van Aardenne, J., and Lelieveld, J.: The atmospheric chemistry general circulation model ECHAM5/MESSy1: consistent simulation of ozone from the surface to the mesosphere, Atmos. Chem. Phys., 6, 5067–5104, https://doi.org/10.5194/acp-6-5067-2006, 2006.
Kanakidou, M., Seinfeld, J. H., Pandis, S. N., Barnes, I., Dentener, F. J., Facchini, M. C., Van Dingenen, R., Ervens, B., Nenes, A., Nielsen, C. J., Swietlicki, E., Putaud, J. P., Balkanski, Y., Fuzzi, S., Horth, J., Moortgat, G. K., Winterhalter, R., Myhre, C. E. L., Tsigaridis, K., Vignati, E., Stephanou, E. G., and Wilson, J.: Organic aerosol and global climate modelling: a review, Atmos. Chem. Phys., 5, 1053–1123, https://doi.org/10.5194/acp-5-1053-2005, 2005.
Kauzmann, W.: The nature of the glassy state and the behavior of liquids at low temperatures, Chem. Rev., 43, 219–256, https://doi.org/10.1021/cr60135a002, 1948.
Kidd, C., Perraud, V., Wingen, L. M., and Finlayson-Pitts, B. J.: Integrating phase and composition of secondary organic aerosol from the ozonolysis of alpha-pinene, P. Natl. Acad. Sci. USA, 111, 7552–7557, https://doi.org/10.1073/pnas.1322558111, 2014.
Knopf, D. A., Alpert, P. A., and Wang, B.: The role of organic aerosol in atmospheric ice nucleation: a review, ACS Earth Space Chem., 2, 168–202, https://doi.org/10.1021/acsearthspacechem.7b00120, 2018.
Kohl, I., Bachmann, L., Hallbrucker, A., Mayer, E., and Loerting, T.: Liquid-like relaxation in hyperquenched water at ≤ 140 K, Phys. Chem. Chem. Phys., 7, 3210–3220, https://doi.org/10.1039/B507651J, 2005.
Koop, T., Bookhold, J., Shiraiwa, M., and Pöschl, U.: Glass transition and phase state of organic compounds: dependency on molecular properties and implications for secondary organic aerosols in the atmosphere, Phys. Chem. Chem. Phys., 13, 19238–19255, https://doi.org/10.1039/C1CP22617G, 2011.
Kostenidou, E., Karnezi, E., Hite Jr., J. R., Bougiatioti, A., Cerully, K., Xu, L., Ng, N. L., Nenes, A., and Pandis, S. N.: Organic aerosol in the summertime southeastern United States: components and their link to volatility distribution, oxidation state and hygroscopicity, Atmos. Chem. Phys., 18, 5799–5819, https://doi.org/10.5194/acp-18-5799-2018, 2018.
Krechmer, J. E., Day, D. A., Ziemann, P. J., and Jimenez, J. L.: Direct measurements of gas/particle partitioning and mass accommodation coefficients in environmental chambers, Environ. Sci. Technol., 51, 11867–11875, https://doi.org/10.1021/acs.est.7b02144, 2017.
Krieger, U. K., Marcolli, C., and Reid, J. P.: Exploring the complexity of aerosol particle properties and processes using single particle techniques, Chem. Soc. Rev., 41, 6631–6662, https://doi.org/10.1039/C2CS35082C, 2012.
Lambe, A. T., Onasch, T. B., Massoli, P., Croasdale, D. R., Wright, J. P., Ahern, A. T., Williams, L. R., Worsnop, D. R., Brune, W. H., and Davidovits, P.: Laboratory studies of the chemical composition and cloud condensation nuclei (CCN) activity of secondary organic aerosol (SOA) and oxidized primary organic aerosol (OPOA), Atmos. Chem. Phys., 11, 8913–8928, https://doi.org/10.5194/acp-11-8913-2011, 2011.
Lanz, V. A., Alfarra, M. R., Baltensperger, U., Buchmann, B., Hueglin, C., and Prévôt, A. S. H.: Source apportionment of submicron organic aerosols at an urban site by factor analytical modelling of aerosol mass spectra, Atmos. Chem. Phys., 7, 1503–1522, https://doi.org/10.5194/acp-7-1503-2007, 2007.
Lee, B.-H., Pierce, J. R., Engelhart, G. J., and Pandis, S. N.: Volatility of secondary organic aerosol from the ozonolysis of monoterpenes, Atmos. Environ., 45, 2443–2452, https://doi.org/10.1016/j.atmosenv.2011.02.004, 2011.
Lessmeier, J., Dette, H. P., Godt, A., and Koop, T.: Physical state of 2-methylbutane-1,2,3,4-tetraol in pure and internally mixed aerosols, Atmos. Chem. Phys., 18, 15841–15857, https://doi.org/10.5194/acp-18-15841-2018, 2018.
Li, Y. and Shiraiwa, M.: Timescales of secondary organic aerosols to reach equilibrium at various temperatures and relative humidities, Atmos. Chem. Phys., 19, 5959–5971, https://doi.org/10.5194/acp-19-5959-2019, 2019.
Li, Y., Pöschl, U., and Shiraiwa, M.: Molecular corridors and parameterizations of volatility in the chemical evolution of organic aerosols, Atmos. Chem. Phys., 16, 3327–3344, https://doi.org/10.5194/acp-16-3327-2016, 2016.
Lin, Y.-H., Zhang, Z., Docherty, K. S., Zhang, H., Budisulistiorini, S. H., Rubitschun, C. L., Shaw, S. L., Knipping, E. M., Edgerton, E. S., Kleindienst, T. E., Gold, A., and Surratt, J. D.: Isoprene epoxydiols as precursors to secondary organic aerosol formation: acid-catalyzed reactive uptake studies with authentic compounds, Environ. Sci. Technol., 46, 250–258, https://doi.org/10.1021/es202554c, 2012.
Lin, Y.-H., Zhang, H., Pye, H. O. T., Zhang, Z., Marth, W. J., Park, S., Arashiro, M., Cui, T., Budisulistiorini, S. H., Sexton, K. G., Vizuete, W., Xie, Y., Luecken, D. J., Piletic, I. R., Edney, E. O., Bartolotti, L. J., Gold, A., and Surratt, J. D.: Epoxide as a precursor to secondary organic aerosol formation from isoprene photooxidation in the presence of nitrogen oxides, P. Natl. Acad. Sci. USA, 110, 6718–6723, https://doi.org/10.1073/pnas.1221150110, 2013.
Liu, P., Li, Y. J., Wang, Y., Gilles, M. K., Zaveri, R. A., Bertram, A. K., and Martin, S. T.: Lability of secondary organic particulate matter, P. Natl. Acad. Sci. USA, 113, 12643–12648, https://doi.org/10.1073/pnas.1603138113, 2016.
Liu, X., Day, D. A., Krechmer, J. E., Brown, W., Peng, Z., Ziemann, P. J., and Jimenez, J. L.: Direct measurements of semi-volatile organic compound dynamics show near-unity mass accommodation coefficients for diverse aerosols, Commun. Chem., 2, 98, https://doi.org/10.1038/s42004-019-0200-x, 2019.
Liu, Y., Wu, Z., Wang, Y., Xiao, Y., Gu, F., Zheng, J., Tan, T., Shang, D., Wu, Y., Zeng, L., Hu, M., Bateman, A. P., and Martin, S. T.: Submicrometer particles are in the liquid state during heavy haze episodes in the urban atmosphere of Beijing, China, Environ. Sci. Tech. Let., 4, 427–432, https://doi.org/10.1021/acs.estlett.7b00352, 2017.
Lopez-Hilfiker, F. D., Mohr, C., Ehn, M., Rubach, F., Kleist, E., Wildt, J., Mentel, Th. F., Lutz, A., Hallquist, M., Worsnop, D., and Thornton, J. A.: A novel method for online analysis of gas and particle composition: description and evaluation of a Filter Inlet for Gases and AEROsols (FIGAERO), Atmos. Meas. Tech., 7, 983–1001, https://doi.org/10.5194/amt-7-983-2014, 2014.
Lopez-Hilfiker, F. D., Mohr, C., D'Ambro, E. L., Lutz, A., Riedel, T. P., Gaston, C. J., Iyer, S., Zhang, Z., Gold, A., Surratt, J. D., Lee, B. H., Kurten, T., Hu, W. W., Jimenez, J., Hallquist, M., and Thornton, J. A.: Molecular composition and volatility of organic aerosol in the southeastern U.S.: implications for IEPOX derived SOA, Environ. Sci. Technol., 50, 2200–2209, https://doi.org/10.1021/acs.est.5b04769, 2016.
Louvaris, E. E., Florou, K., Karnezi, E., Papanastasiou, D. K., Gkatzelis, G. I., and Pandis, S. N.: Volatility of source apportioned wintertime organic aerosol in the city of Athens, Atmos. Environ., 158, 138–147, https://doi.org/10.1016/j.atmosenv.2017.03.042, 2017.
Loza, C. L., Coggon, M. M., Nguyen, T. B., Zuend, A., Flagan, R. C., and Seinfeld, J. H.: On the mixing and evaporation of secondary organic aerosol components, Environ. Sci. Technol., 47, 6173–6180, https://doi.org/10.1021/es400979k, 2013.
Marshall, F. H., Berkemeier, T., Shiraiwa, M., Nandy, L., Ohm, P. B., Dutcher, C. S., and Reid, J. P.: Influence of particle viscosity on mass transfer and heterogeneous ozonolysis kinetics in aqueous-sucrose-maleic acid aerosol, Phys. Chem. Chem. Phys., 20, 15560–15573, https://doi.org/10.1039/c8cp01666f, 2018.
Mikhailov, E., Vlasenko, S., Martin, S. T., Koop, T., and Pöschl, U.: Amorphous and crystalline aerosol particles interacting with water vapor: conceptual framework and experimental evidence for restructuring, phase transitions and kinetic limitations, Atmos. Chem. Phys., 9, 9491–9522, https://doi.org/10.5194/acp-9-9491-2009, 2009.
Nizkorodov, S. A., Laskin, J., and Laskin, A.: Molecular chemistry of organic aerosols through the application of high resolution mass spectrometry, Phys. Chem. Chem. Phys., 13, 3612–3629, https://doi.org/10.1039/c0cp02032j, 2011.
O'Brien, R. E., Neu, A., Epstein, S. A., MacMillan, A. C., Wang, B., Kelly, S. T., Nizkorodov, S. A., Laskin, A., Moffet, R. C., and Gilles, M. K.: Physical properties of ambient and laboratory-generated secondary organic aerosol, Geophys. Res. Lett., 41, 4347–4353, https://doi.org/10.1002/2014GL060219, 2014.
O'Meara, S., Booth, A. M., Barley, M. H., Topping, D., and McFiggans, G.: An assessment of vapour pressure estimation methods, Phys. Chem. Chem. Phys., 16, 19453–19469, https://doi.org/10.1039/c4cp00857j, 2014.
Ortega, A. M., Hayes, P. L., Peng, Z., Palm, B. B., Hu, W., Day, D. A., Li, R., Cubison, M. J., Brune, W. H., Graus, M., Warneke, C., Gilman, J. B., Kuster, W. C., de Gouw, J., Gutiérrez-Montes, C., and Jimenez, J. L.: Real-time measurements of secondary organic aerosol formation and aging from ambient air in an oxidation flow reactor in the Los Angeles area, Atmos. Chem. Phys., 16, 7411–7433, https://doi.org/10.5194/acp-16-7411-2016, 2016.
Paciga, A., Karnezi, E., Kostenidou, E., Hildebrandt, L., Psichoudaki, M., Engelhart, G. J., Lee, B.-H., Crippa, M., Prévôt, A. S. H., Baltensperger, U., and Pandis, S. N.: Volatility of organic aerosol and its components in the megacity of Paris, Atmos. Chem. Phys., 16, 2013–2023, https://doi.org/10.5194/acp-16-2013-2016, 2016.
Pajunoja, A., Malila, J., Hao, L., Joutsensaari, J., Lehtinen, K. E., and Virtanen, A.: Estimating the viscosity range of SOA particles based on their coalescence time, Aerosol Sci. Tech., 48, i–iv, https://doi.org/10.1080/02786826.2013.870325, 2014.
Pajunoja, A., Hu, W., Leong, Y. J., Taylor, N. F., Miettinen, P., Palm, B. B., Mikkonen, S., Collins, D. R., Jimenez, J. L., and Virtanen, A.: Phase state of ambient aerosol linked with water uptake and chemical aging in the southeastern US, Atmos. Chem. Phys., 16, 11163–11176, https://doi.org/10.5194/acp-16-11163-2016, 2016.
Pankow, J. F.: An absorption model of gas-particle partitioning of organic-compounds in the atmosphere, Atmos. Environ., 28, 185–188, https://doi.org/10.1016/1352-2310(94)90093-0, 1994.
Pankow, J. F. and Asher, W. E.: SIMPOL.1: a simple group contribution method for predicting vapor pressures and enthalpies of vaporization of multifunctional organic compounds, Atmos. Chem. Phys., 8, 2773–2796, https://doi.org/10.5194/acp-8-2773-2008, 2008.
Perraud, V., Bruns, E. A., Ezell, M. J., Johnson, S. N., Yu, Y., Alexander, M. L., Zelenyuk, A., Imre, D., Chang, W. L., Dabdub, D., Pankow, J. F., and Finlayson-Pitts, B. J.: Nonequilibrium atmospheric secondary organic aerosol formation and growth, P. Natl. Acad. Sci. USA, 109, 2836–2841, https://doi.org/10.1073/pnas.1119909109, 2012.
Petters, M. D. and Kreidenweis, S. M.: A single parameter representation of hygroscopic growth and cloud condensation nucleus activity, Atmos. Chem. Phys., 7, 1961–1971, https://doi.org/10.5194/acp-7-1961-2007, 2007.
Petters, S. S., Kreidenweis, S. M., Grieshop, A. P., Ziemann, P. J., and Petters, M. D.: Temperature- and humidity-dependent phase states of secondary organic aerosols, Geophys. Res. Lett., 46, 1005–1013, https://doi.org/10.1029/2018GL080563, 2019.
Pöschl, U. and Shiraiwa, M.: Multiphase chemistry at the atmosphere-biosphere interface influencing climate and public health in the anthropocene, Chem. Rev., 115, 4440–4475, https://doi.org/10.1021/cr500487s, 2015.
Price, H. C., Mattsson, J., and Murray, B. J.: Sucrose diffusion in aqueous solution, Phys. Chem. Chem. Phys., 18, 19207–19216, https://doi.org/10.1039/c6cp03238a, 2016.
Pringle, K. J., Tost, H., Pozzer, A., Pöschl, U., and Lelieveld, J.: Global distribution of the effective aerosol hygroscopicity parameter for CCN activation, Atmos. Chem. Phys., 10, 5241–5255, https://doi.org/10.5194/acp-10-5241-2010, 2010.
Pye, H. O. T., Murphy, B. N., Xu, L., Ng, N. L., Carlton, A. G., Guo, H., Weber, R., Vasilakos, P., Appel, K. W., Budisulistiorini, S. H., Surratt, J. D., Nenes, A., Hu, W., Jimenez, J. L., Isaacman-VanWertz, G., Misztal, P. K., and Goldstein, A. H.: On the implications of aerosol liquid water and phase separation for organic aerosol mass, Atmos. Chem. Phys., 17, 343–369, https://doi.org/10.5194/acp-17-343-2017, 2017.
Reid, J. P., Bertram, A. K., Topping, D. O., Laskin, A., Martin, S. T., Petters, M. D., Pope, F. D., and Rovelli, G.: The viscosity of atmospherically relevant organic particles, Nat. Commun., 9, 956, https://doi.org/10.1038/s41467-018-03027-z, 2018.
Renbaum-Wolff, L., Grayson, J. W., Bateman, A. P., Kuwata, M., Sellier, M., Murray, B. J., Shilling, J. E., Martin, S. T., and Bertram, A. K.: Viscosity of α-pinene secondary organic material and implications for particle growth and reactivity, P. Natl. Acad. Sci. USA, 110, 8014–8019, https://doi.org/10.1073/pnas.1219548110, 2013.
Riva, M., Chen, Y., Zhang, Y., Lei, Z., Olson, N. E., Boyer, H. C., Narayan, S., Yee, L. D., Green, H. S., Cui, T., Zhang, Z., Baumann, K., Fort, M., Edgerton, E., Budisulistiorini, S. H., Rose, C. A., Ribeiro, I. O., e Oliveira, R. L., dos Santos, E. O., Machado, C. M. D., Szopa, S., Zhao, Y., Alves, E. G., de Sá, S. S., Hu, W., Knipping, E. M., Shaw, S. L., Duvoisin Junior, S., de Souza, R. A. F., Palm, B. B., Jimenez, J.-L., Glasius, M., Goldstein, A. H., Pye, H. O. T., Gold, A., Turpin, B. J., Vizuete, W., Martin, S. T., Thornton, J. A., Dutcher, C. S., Ault, A. P., and Surratt, J. D.: Increasing isoprene epoxydiol-to-inorganic sulfate aerosol ratio results in extensive conversion of inorganic sulfate to organosulfur forms: implications for aerosol physicochemical properties, Environ. Sci. Technol., 53, 8682–8694, https://doi.org/10.1021/acs.est.9b01019, 2019.
Rothfuss, N. E. and Petters, M. D.: Influence of functional groups on the viscosity of organic aerosol, Environ. Sci. Technol., 51, 271–279, https://doi.org/10.1021/acs.est.6b04478, 2017.
Rovelli, G., Song, Y.-C., Maclean, A. M., Topping, D. O., Bertram, A. K.. and Reid, J. P.: Comparison of approaches for measuring and predicting the viscosity of ternary component aerosol particles, Anal. Chem., 91, 5074–5082, https://doi.org/10.1021/acs.analchem.8b05353, 2019.
Saha, P. K., Khlystov, A., Yahya, K., Zhang, Y., Xu, L., Ng, N. L., and Grieshop, A. P.: Quantifying the volatility of organic aerosol in the southeastern US, Atmos. Chem. Phys., 17, 501–520, https://doi.org/10.5194/acp-17-501-2017, 2017.
Saha, P. K., Khlystov, A., and Grieshop, A. P.: Downwind evolution of the volatility and mixing state of near-road aerosols near a US interstate highway, Atmos. Chem. Phys., 18, 2139–2154, https://doi.org/10.5194/acp-18-2139-2018, 2018.
Saukko, E., Lambe, A. T., Massoli, P., Koop, T., Wright, J. P., Croasdale, D. R., Pedernera, D. A., Onasch, T. B., Laaksonen, A., Davidovits, P., Worsnop, D. R., and Virtanen, A.: Humidity-dependent phase state of SOA particles from biogenic and anthropogenic precursors, Atmos. Chem. Phys., 12, 7517–7529, https://doi.org/10.5194/acp-12-7517-2012, 2012.
Schmedding, R., Rasool, Q. Z., Zhang, Y., Pye, H. O. T., Zhang, H., Chen, Y., Surratt, J. D., Lee, B. H., Mohr, C., Lopez-Hilfiker, F. D., Thornton, J. A., Goldstein, A. H., and Vizuete, W.: Predicting Secondary Organic Aerosol Phase State and Viscosity and its Effect on Multiphase Chemistry in a Regional Scale Air Quality Model, Atmos. Chem. Phys. Discuss., https://doi.org/10.5194/acp-2019-900, in review, 2019.
Schum, S. K., Zhang, B., Džepina, K., Fialho, P., Mazzoleni, C., and Mazzoleni, L. R.: Molecular and physical characteristics of aerosol at a remote free troposphere site: implications for atmospheric aging, Atmos. Chem. Phys., 18, 14017–14036, https://doi.org/10.5194/acp-18-14017-2018, 2018.
Seinfeld, J. H. and Pandis, S. N.: Atmospheric chemistry and physics – From air pollution to climate change, John Wiley & Sons, Inc., New York, 2006.
Shiraiwa, M. and Seinfeld, J. H.: Equilibration timescale of atmospheric secondary organic aerosol partitioning, Geophys. Res. Lett., 39, L24801, https://doi.org/10.1029/2012GL054008, 2012.
Shiraiwa, M., Ammann, M., Koop, T., and Pöschl, U.: Gas uptake and chemical aging of semisolid organic aerosol particles, P. Natl. Acad. Sci. USA, 108, 11003–11008, https://doi.org/10.1073/pnas.1103045108, 2011.
Shiraiwa, M., Zuend, A., Bertram, A. K., and Seinfeld, J. H.: Gas-particle partitioning of atmospheric aerosols: interplay of physical state, non-ideal mixing and morphology, Phys. Chem. Chem. Phys., 15, 11441–11453, https://doi.org/10.1039/C3CP51595H, 2013.
Shiraiwa, M., Berkemeier, T., Schilling-Fahnestock, K. A., Seinfeld, J. H., and Pöschl, U.: Molecular corridors and kinetic regimes in the multiphase chemical evolution of secondary organic aerosol, Atmos. Chem. Phys., 14, 8323–8341, https://doi.org/10.5194/acp-14-8323-2014, 2014.
Shiraiwa, M., Li, Y., Tsimpidi, A. P., Karydis, V. A., Berkemeier, T., Pandis, S. N., Lelieveld, J., Koop, T., and Pöschl, U.: Global distribution of particle phase state in atmospheric secondary organic aerosols, Nat. Commun., 8, 15002, https://doi.org/10.1038/ncomms15002, 2017.
Shrivastava, M., Cappa, C. D., Fan, J., Goldstein, A. H., Guenther, A. B., Jimenez, J. L., Kuang, C., Laskin, A., Martin, S. T., Ng, N. L., Petaja, T., Pierce, J. R., Rasch, P. J., Roldin, P., Seinfeld, J. H., Shilling, J., Smith, J. N., Thornton, J. A., Volkamer, R., Wang, J., Worsnop, D. R., Zaveri, R. A., Zelenyuk, A., and Zhang, Q.: Recent advances in understanding secondary organic aerosol: Implications for global climate forcing, Rev. Geophys., 55, 509–559, https://doi.org/10.1002/2016RG000540, 2017.
Slade, J. H., Ault, A. P., Bui, A. T., Ditto, J. C., Lei, Z., Bondy, A. L., Olson, N. E., Cook, R. D., Desrochers, S. J., Harvey, R. M., Erickson, M. H., Wallace, H. W., Alvarez, S. L., Flynn, J. H., Boor, B. E., Petrucci, G. A., Gentner, D. R., Griffin, R. J., and Shepson, P. B.: Bouncier particles at night: biogenic secondary organic aerosol chemistry and sulfate drive diel variations in the aerosol phase in a mixed forest, Environ. Sci. Technol., 53, 4977–4987, https://doi.org/10.1021/acs.est.8b07319, 2019.
Song, M., Liu, P. F., Hanna, S. J., Li, Y. J., Martin, S. T., and Bertram, A. K.: Relative humidity-dependent viscosities of isoprene-derived secondary organic material and atmospheric implications for isoprene-dominant forests, Atmos. Chem. Phys., 15, 5145–5159, https://doi.org/10.5194/acp-15-5145-2015, 2015.
Song, M., Liu, P. F., Hanna, S. J., Zaveri, R. A., Potter, K., You, Y., Martin, S. T., and Bertram, A. K.: Relative humidity-dependent viscosity of secondary organic material from toluene photo-oxidation and possible implications for organic particulate matter over megacities, Atmos. Chem. Phys., 16, 8817–8830, https://doi.org/10.5194/acp-16-8817-2016, 2016.
Song, M., Maclean, A. M., Huang, Y., Smith, N. R., Blair, S. L., Laskin, J., Laskin, A., DeRieux, W.-S. W., Li, Y., Shiraiwa, M., Nizkorodov, S. A., and Bertram, A. K.: Liquid–liquid phase separation and viscosity within secondary organic aerosol generated from diesel fuel vapors, Atmos. Chem. Phys., 19, 12515–12529, https://doi.org/10.5194/acp-19-12515-2019, 2019.
Song, Y. C., Haddrell, A. E., Bzdek, B. R., Reid, J. P., Bannan, T., Topping, D. O., Percival, C., and Cai, C.: Measurements and predictions of binary component aerosol particle viscosity, J. Phys. Chem. A, 120, 8123–8137, https://doi.org/10.1021/acs.jpca.6b07835, 2016.
Stark, H., Yatavelli, R. L. N., Thompson, S. L., Kimmel, J. R., Cubison, M. J., Chhabra, P. S., Canagaratna, M. R., Jayne, J. T., Worsnop, D. R., and Jimenez, J. L.: Methods to extract molecular and bulk chemical information from series of complex mass spectra with limited mass resolution, Int. J. Mass Spectrom., 389, 26–38, https://doi.org/10.1016/j.ijms.2015.08.011, 2015.
Stark, H., Yatavelli, R. L., Thompson, S. L., Kang, H., Krechmer, J. E., Kimmel, J. R., Palm, B. B., Hu, W., Hayes, P. L., and Day, D. A.: Impact of thermal decomposition on thermal desorption instruments: advantage of thermogram analysis for quantifying volatility distributions of organic species, Environ. Sci. Technol., 51, 8491–8500, https://doi.org/10.1021/acs.est.7b00160, 2017.
Surratt, J. D., Chan, A. W. H., Eddingsaas, N. C., Chan, M., Loza, C. L., Kwan, A. J., Hersey, S. P., Flagan, R. C., Wennberg, P. O., and Seinfeld, J. H.: Reactive intermediates revealed in secondary organic aerosol formation from isoprene, P. Natl. Acad. Sci. USA, 107, 6640–6645, https://doi.org/10.1073/pnas.0911114107, 2010.
Thomas, L. H., Meatyard, R., Smith, H., and Davies, G. H.: Viscosity behavior of associated liquids at lower temperatures and vapor pressures, J. Chem. Eng. Data, 24, 161–164, https://doi.org/10.1021/je60082a011, 1979.
Thompson, S. L., Yatavelli, R. L. N., Stark, H., Kimmel, J. R., Krechmer, J. E., Day, D. A., Hu, W., Isaacman-VanWertz, G., Yee, L., Goldstein, A. H., Khan, M. A. H., Holzinger, R., Kreisberg, N., Lopez-Hilfiker, F. D., Mohr, C., Thornton, J. A., Jayne, J. T., Canagaratna, M., Worsnop, D. R., and Jimenez, J. L.: Field intercomparison of the gas/particle partitioning of oxygenated organics during the Southern Oxidant and Aerosol Study (SOAS) in 2013, Aerosol Sci. Tech., 51, 30–56, https://doi.org/10.1080/02786826.2016.1254719, 2017.
Tsimpidi, A. P., Karydis, V. A., Pozzer, A., Pandis, S. N., and Lelieveld, J.: ORACLE (v1.0): module to simulate the organic aerosol composition and evolution in the atmosphere, Geosci. Model Dev., 7, 3153–3172, https://doi.org/10.5194/gmd-7-3153-2014, 2014.
US EPA: Estimation Programs Interface Suite™ for Microsoft Windows v4.1, United States Environmental Protection Agency, Washington, DC, USA, 2015.
Vander Wall, A. C., Lakey, P. S. J., Rossich Molina, E., Perraud, V., Wingen, L. M., Xu, J., Soulsby, D., Gerber, R. B., Shiraiwa, M. and Finlayson-Pitts, B. J.: Understanding interactions of organic nitrates with the surface and bulk of organic films: implications for particle growth in the atmosphere, Environ. Sci. Processes Impacts, 20, 1593–1610, https://doi.org/10.1039/C8EM00348C, 2018.
Virtanen, A., Joutsensaari, J., Koop, T., Kannosto, J., YliPirilä, P., Leskinen, J., Mäkelä, J. M., Holopainen, J. K., Pöschl, U., Kulmala, M., Worsnop, D. R., and Laaksonen, A.: An amorphous solid state of biogenic secondary organic aerosol particles, Nature, 467, 824–827, https://doi.org/10.1038/nature09455, 2010.
Xu, L., Suresh, S., Guo, H., Weber, R. J., and Ng, N. L.: Aerosol characterization over the southeastern United States using high-resolution aerosol mass spectrometry: spatial and seasonal variation of aerosol composition and sources with a focus on organic nitrates, Atmos. Chem. Phys., 15, 7307–7336, https://doi.org/10.5194/acp-15-7307-2015, 2015.
Xu, W., Xie, C., Karnezi, E., Zhang, Q., Wang, J., Pandis, S. N., Ge, X., Zhang, J., An, J., Wang, Q., Zhao, J., Du, W., Qiu, Y., Zhou, W., He, Y., Li, Y., Li, J., Fu, P., Wang, Z., Worsnop, D. R., and Sun, Y.: Summertime aerosol volatility measurements in Beijing, China, Atmos. Chem. Phys., 19, 10205–10216, https://doi.org/10.5194/acp-19-10205-2019, 2019.
Yatavelli, R. L. N., Mohr, C., Stark, H., Day, D. A., Thompson, S. L., Lopez-Hilfiker, F. D., Campuzano-Jost, P., Palm, B. B., Vogel, A. L., Hoffmann, T., Heikkinen, L., Äijälä, M., Ng, N. L., Kimmel, J. R., Canagaratna, M. R., Ehn, M., Junninen, H., Cubison, M. J., Petäjä, T., Kulmala, M., Jayne, J. T., Worsnop, D. R., and Jimenez, J. L.: Estimating the contribution of organic acids to northern hemispheric continental organic aerosol, Geophys. Res. Lett., 42, 6084–6090, https://doi.org/10.1002/2015gl064650, 2015.
Ye, Q., Robinson, E. S., Ding, X., Ye, P., Sullivan, R. C., and Donahue, N. M.: Mixing of secondary organic aerosols versus relative humidity, P. Natl. Acad. Sci. USA, 113, 12649–12654, https://doi.org/10.1073/pnas.1604536113, 2016.
Ye, Q., Upshur, M. A., Robinson, E. S., Geiger, F. M., Sullivan, R. C., Thomson, R. J., and Donahue, N. M.: Following particle-particle mixing in atmospheric secondary organic aerosols by using isotopically labeled terpenes, Chem, 4, 318–333, https://doi.org/10.1016/j.chempr.2017.12.008, 2018.
Yli-Juuti, T., Pajunoja, A., Tikkanen, O.-P., Buchholz, A., Faiola, C., Väisänen, O., Hao, L., Kari, E., Peräkylä, O., Garmash, O., Shiraiwa, M., Ehn, M., Lehtinen, K., and Virtanen, A.: Factors controlling the evaporation of secondary organic aerosol from α-pinene ozonolysis, Geophys. Res. Lett., 44, 2562–2570, https://doi.org/10.1002/2016GL072364, 2017.
Zaveri, R. A., Shilling, J. E., Zelenyuk, A., Liu, J., Bell, D. M., D'Ambro, E. L., Gaston, C. J., Thornton, J. A., Laskin, A., Lin, P., Wilson, J., Easter, R. C., Wang, J., Bertram, A. K., Martin, S. T., Seinfeld, J. H. and Worsnop, D. R.: Growth kinetics and size distribution dynamics of viscous secondary organic aerosol, Environ. Sci. Technol., 52, 1191–1199, https://doi.org/10.1021/acs.est.7b04623, 2018.
Zhang, Y., Sanchez, M. S., Douet, C., Wang, Y., Bateman, A. P., Gong, Z., Kuwata, M., Renbaum-Wolff, L., Sato, B. B., Liu, P. F., Bertram, A. K., Geiger, F. M., and Martin, S. T.: Changing shapes and implied viscosities of suspended submicron particles, Atmos. Chem. Phys., 15, 7819–7829, https://doi.org/10.5194/acp-15-7819-2015, 2015.
Zhang, Y., Katira, S., Lee, A., Lambe, A. T., Onasch, T. B., Xu, W., Brooks, W. A., Canagaratna, M. R., Freedman, A., Jayne, J. T., Worsnop, D. R., Davidovits, P., Chandler, D., and Kolb, C. E.: Kinetically controlled glass transition measurement of organic aerosol thin films using broadband dielectric spectroscopy, Atmos. Meas. Tech., 11, 3479–3490, https://doi.org/10.5194/amt-11-3479-2018, 2018.
Zhang, Y., Nichman, L., Spencer, P., Jung, J. I., Lee, A., Heffernan, B. K., Gold, A., Zhang, Z., Chen, Y., Canagaratna, M. R., Jayne, J. T., Worsnop, D. R., Onasch, T. B., Surratt, J. D., Chandler, D., Davidovits, P., and Kolb, C. E.: The cooling rate and volatility dependent glass forming properties of organic aerosols measured by Broadband Dielectric Spectroscopy, Environ. Sci. Technol., 53, 12366–12378, https://doi.org/10.1021/acs.est.9b03317, 2019.
Zhou, S., Hwang, B. C. H., Lakey, P. S. J., Zuend, A., Abbatt, J. P. D., and Shiraiwa, M.: Multiphase reactivity of polycyclic aromatic hydrocarbons is driven by phase separation and diffusion limitations, P. Natl. Acad. Sci. USA, 116, 11658–11663, https://doi.org/10.1073/pnas.1902517116, 2019.
Zobrist, B., Marcolli, C., Pedernera, D. A., and Koop, T.: Do atmospheric aerosols form glasses?, Atmos. Chem. Phys., 8, 5221–5244, https://doi.org/10.5194/acp-8-5221-2008, 2008.
Zuend, A. and Seinfeld, J. H.: Modeling the gas-particle partitioning of secondary organic aerosol: the importance of liquid-liquid phase separation, Atmos. Chem. Phys., 12, 3857–3882, https://doi.org/10.5194/acp-12-3857-2012, 2012.
- Abstract
- Introduction
- Methods
- Application in field observations
- Comparison with global simulations
- Conclusions and implications
- Appendix A: Parameterizations of Tg based on elemental compositions
- Appendix B: Comparison of Tg predictions with Zhang et al. (2019)
- Data availability
- Author contributions
- Acknowledgements
- Financial support
- Review statement
- References
- Supplement