the Creative Commons Attribution 4.0 License.
the Creative Commons Attribution 4.0 License.
 | 03 Jul 2020
Decadal changes in anthropogenic source contribution of PM2.5 pollution and related health impacts in China, 1990–2015
Yixuan Zheng
Guannan Geng
Chaopeng Hong
Meng Li
Xin Li
Kebin He
Qiang Zhang
Air quality in China has changed dramatically in response to rapid development of the economy and to policies. In this work, we investigate the changes in anthropogenic source contribution to ambient fine particulate matter (PM2.5) air pollution and related health impacts in China during 1990–2015 and elucidate the drivers behind the decadal transition. We estimate the contribution of five anthropogenic emitting sectors to ambient PM2.5 exposure and related premature mortality over China during 1990–2015 with 5-year intervals, by using an integrated model framework of a bottom-up emission inventory, a chemical transport model, and the Global Exposure Mortality Model (GEMM). The national anthropogenic PM2.5-related premature mortality estimated with the GEMM for nonaccidental deaths due to noncommunicable diseases and lower respiratory infections rose from 1.26 million (95 % confidence interval (CI) [1.05, 1.46]) in 1990 to 2.18 million (95 % CI [1.84, 2.50]) in 2005; then, it decreased to 2.10 million (95 % CI [1.76, 2.42]) in 2015. In 1990, the residential sector was the leading source of the PM2.5-related premature mortality (559 000, 95 % CI [467 000, 645 900], 44 % of total) in China, followed by industry (29 %), power (13 %), agriculture (9 %), and transportation (5 %). In 2015, the industrial sector became the largest contributor of PM2.5-related premature mortality (734 000, 95 % CI [615 500, 844 900], 35 % of total), followed by the residential sector (25 %), agriculture (23 %), transportation (10 %), and power (6 %). The decadal changes in source contribution to PM2.5-related premature mortality in China represent a combined impact of socioeconomic development and clean-air policy. For example, active control measures have successfully reduced pollution from the power sector, while contributions from the industrial and transportation sectors have continuously increased due to more prominent growth in activity rates. A transition in fuel consumption has dominated the decrease in the contribution from residential sector. Meanwhile, the contribution from the agriculture sector has continuously increased due to persistent NH3 emissions and enhanced formation of secondary inorganic aerosols under an NH3-rich environment.
- Article
(3940 KB) - Full-text XML
-
Supplement
(1216 KB) - BibTeX
- EndNote


Ambient air pollution is one of the most harmful environmental issues arising from development. It is a major risk factor to public health and is linked to various adverse health outcomes (Lim et al., 2012; GBD 2015 Risk Factors Collaborators, 2016). Globally, ambient air pollution caused millions of deaths (Lelieveld et al., 2015; Cohen et al., 2017; Burnett et al., 2018), ranging from 4.2 million (Cohen et al., 2017) to 8.9 million (Burnett et al., 2018) in 2015, depending on the adoption of risk functions. The associated economic costs were valued at between 3.8 % (World Bank, 2007) and 9.9 % of the gross domestic product (GDP; World Bank, 2016). The largest number of deaths occurred in China (Cohen et al., 2017; Burnett et al., 2018), with a combination of severe air pollution and high population density (Lelieveld et al., 2015; J. Liu et al., 2016b). Urgent actions are needed to reduce air pollution and improve public health (Zhang et al., 2012).
Driven by the rapid socioeconomic development and by environmental policies (Zheng et al., 2018), air quality in China has changed dramatically over the past decades (Xing et al., 2015). Between 1990 and 2015 the country increased its total energy consumption by a factor of 3.5, thermal power generation by a factor of 7.6, pig iron production by a factor of 10, and civil vehicle population by a factor of 28 (National Bureau of Statistics, 2016). Consequently, China has experienced increasingly adverse impacts from worsening air quality (Xing et al., 2015) and associated diseases for decades (Lim et al., 2012; Cohen et al., 2017). Over large areas, the ambient concentrations of fine particulate matter with an aerodynamic diameter equal to or smaller than 2.5 µm (PM2.5) far exceeded the World Health Organization (WHO) air quality guidelines as well as China's national air quality standards (Wang et al., 2014, 2015; Zhang and Cao, 2015). During 2013–2014, only 3 out of the 31 provincial capital cities in China had the PM2.5 annual concentration below the national standard grade II of 35 µg m−3, and the highest concentration of 144 µg m−3 in occurred Shijiazhuang, which was over 3 times higher than the standard (Wang et al., 2014).
China began responding to air pollution in the 1970s. The Law on the Prevention and Control of Atmospheric Pollution was formulated in 1987. Starting from 2005, national targets for sulfur dioxide (SO2) and nitrogen oxide (NOx) emission reductions were successively included in the 11th and 12th five-year plans (FYPs), and abatements have been achieved in the power, industrial, and transportation sectors in recent years (Huo et al., 2015; Liu et al., 2015; F. Liu et al., 2016; van der A et al., 2017). In 2013, to tackle the severe and widespread air pollution, the Chinese Government launched the national Air Pollution Prevention and Control Action Plan. Even more aggressive measures were implemented to reduce PM2.5 concentrations by up to 25 % in major metropolitan areas by 2017 (Zheng et al., 2018; Cheng et al., 2019).
The complex interactions between economic development and environmental regulations have caused air pollutant emissions over China to change significantly in the past 25 years. After growing rapidly during the early stages of economic development (Lu et al., 2011; Zhao et al., 2013), SO2 and NOx emissions (observed by satellite instruments) peaked in 2007 and 2011–2012 (Krotkov et al., 2016; F. Liu et al., 2016; van der A et al., 2017). Studies on the historical PM2.5 air pollution and related health impacts and the decadal transition of source contributions provide opportunities to evaluate the effectiveness of past policies and set the direction for prioritized control strategies in the future.
In China, annual estimates of mortality attributable to PM2.5 exposure ranged from 1.10 to 1.37 million during 2010–2015 (Lelieveld et al., 2015; J. Liu et al., 2016b; Hu et al., 2017; Zheng et al., 2017), and studies have identified industrial and residential sectors and coal burning activities as the leading contributors to premature deaths attributable to PM2.5 during 2010–2013 (Hu et al., 2017; Ma et al., 2017; Gu et al., 2018). However, constrained by the availability of long-term emission datasets, limited efforts have been made to explore the decadal transitions of source contributions to PM2.5 air pollution and related premature mortality in response to socioeconomic development and clean-air policy. Recently, Zheng et al. (2019) have evaluated the emission source contributions to PM2.5-related mortality during 2005–2015 and revealed the leading role of the agricultural and industrial sectors. But studies with longer temporal coverage to illustrate the decadal transition of different source sectors are still lacking. The changing patterns of sectoral emissions will result in varied source contributions at different stages of development (Zheng et al., 2018). Learning from the past is helpful for formulating future policies to optimize benefits.
In this study, we combine a state-of-the-art Chinese long-term emission dataset with a regional air quality model and the Global Exposure Mortality Model (GEMM; Burnett et al., 2018) and investigate the decadal changes in the anthropogenic source contribution of PM2.5 air pollution and related health impacts in China from 1990 to 2015 for every 5-year period. We quantify the contribution from the power, industrial, residential, transportation, and agricultural sectors in each year; illustrate different transition routes for different source categories; and highlight the opportunities for further mitigation.
2.1 Bottom-up emission inventories
The bottom-up emission inventory used in this study for mainland China during 1990–2015 was obtained from the Multi-resolution Emission Inventory for China (MEIC; http://www.meicmodel.org/, last access: 21 June 2020). The emissions from other Asian countries and regions were taken from the MIX emission inventory (M. Li et al., 2017b). The MEIC model, developed by Tsinghua University, is a technology-based, bottom-up, anthropogenic emission model. By integrating a dynamic methodology with up-to-date activity and local emission factors, it can provide model-ready emission inventories from 1990 to the present. The MEIC model includes more than 700 anthropogenic emission sources and quantifies emissions for 10 pollutants and greenhouse gases: SO2, NOx, carbon monoxide (CO), nonmethane volatile organic compounds (NMVOCs), ammonia (NH3), carbon dioxide (CO2), PM2.5, PM10, black carbon (BC), and organic carbon (OC). The road transportation emissions were estimated at the county level and distributed across grids with the China Digital Road-network Map (Zheng et al., 2014). Emissions from coal-fired power plants were constructed from the unit-based China coal-fired Power plant Emissions Database (CPED), which improved the spatial and temporal resolution of power emissions (Liu et al., 2015). In addition, the model has an improved speciation framework to generate anthropogenic NMVOC emissions for various chemical mechanisms (Li et al., 2014). Model-ready emissions of SO2, PM2.5, NOx, NH3, CO, OC, BC, and NMVOCs with the Carbon Bond version 5 (CB05) mechanism (Whitten et al., 2010) chemical mechanism were generated for the period from 1990 to 2015 in 5-year intervals using the MEIC and used as the Models-3 Community Multiscale Air Quality (CMAQ) input to simulate the PM2.5 concentrations over China.
2.2 PM2.5 exposure and source contributions
We used the Weather Research and Forecasting (WRF) model version 3.5.1 and the CMAQ model version 5.0.1 (https://www.cmascenter.org/cmaq/, last access: 21 June 2020) to simulate the PM2.5 concentrations over China at a horizontal resolution of 36 km. Our WRF-CMAQ domain covers East Asia, including China, North and South Korea. Japan, and other Asian countries (Fig. S1 in the Supplement). The National Centers for Environmental Prediction Final Analysis (NCEP-FNL) data were used as meteorological initial and boundary conditions to drive the WRF model. Since NCEP-FNL data were only available after 2000, for the years 1990 and 1995, we used the meteorological data in 2000 to drive the WRF model. The meteorological fields simulated by the WRF and the emissions generated by the MEIC model were then used as the inputs to the CMAQ model. Biogenic emissions were calculated by MEGAN v2.1 (Guenther et al., 2012). In the CMAQ model, the CB05 gas-phase chemistry and AERO6 aerosol chemistry with the ISORROPIA II thermodynamic equilibrium module (Fountoukis and Nenes, 2007) were used. The boundary conditions were generated with the global transport model GEOS-Chem (Bey et al., 2001). For each year, the CMAQ model ran continuously for the entire year; the 7 d at the end of the previous December were used for model spin-up. Details concerning the model configuration were provided in our previous study (Zheng et al., 2015). To evaluate the performance of the WRF-CMAQ model, we conducted a detailed validation of the meteorological field simulations of the WRF and PM2.5 mass concentrations by the CMAQ. More details are provided in the Supplement (Table S1, Figs. S2 and S3).
In addition to CMAQ standard simulations between 1990 and 2015 at 5-year intervals, we conducted five zero-out sensitivity simulations for each year by subtracting the emissions of each source sector from the total emissions. The source sectors comprised power, industry, residential, transportation, and agriculture. Then, the contribution of each source sector was determined by the difference between the standard and sensitivity simulations. Since we focused on the contribution and relative importance of anthropogenic source sectors, we conducted another “clean” simulation for each year by removing all the Chinese anthropogenic emissions in the total model emissions, to exclude the contributions of boundary conditions and emissions from biogenic sources, dust, sea salt, and other countries. Finally, to manage mass conservation, we implemented a grid-level normalization for the six sensitivity simulations to match the total PM2.5 concentrations in the standard simulations.
2.3 Estimates of health impacts attributable to long-term PM2.5 exposure
Long-term exposure to PM2.5 has adverse impacts on human health; the most serious impact is death. Besides PM2.5, ozone also has adverse health effects. In this study, we focus on the premature mortality due to long-term PM2.5 exposure and did not consider the impact of ozone. The premature mortality attributable to PM2.5 can be determined by the application of the GEMM functions (Burnett et al., 2018). The GEMM was developed based only on cohort studies from 16 countries with outdoor air pollution that covers the global exposure range. It predicts hazard ratios between the long-term exposure to PM2.5 and the nonaccidental deaths due to noncommunicable diseases and lower respiratory infections (NCD+LRI) and deaths to five specific causes (5-COD). The hazard ratio function of the GEMM is described in Eq. (1).
where , with cf representing the counterfactual PM2.5 concentration of 2.4 µg m−3, below which no additional risk is assumed. The parameters θ, α, μ, and ν describe the shape of the hazard ratio faction.
Following Burnett et al. (2018), we estimated the premature mortality attributable to PM2.5 for both NCD+LRI and 5-COD. The latter includes death due to ischemic heart disease (IHD), stroke, lung cancer (LC), chronic obstructive pulmonary disease (COPD), and LRI. The premature mortality attributable to PM2.5 was calculated for population subgroups by year, age, sex, and cause using Eq. (2), and the uncertainty and 95 % confidence interval were estimated through the standard error (SE) of parameter θ in Eq. (1).
where is the premature mortality attributable to PM2.5 exposure level z in year yr for sex s, age group a, and cause c; is the baseline mortality rate in year yr for sex s, age group a, and cause c; is the population exposed to PM2.5 in year yr for sex s and age group a; and GEMMa, c(z) is the hazard ratio associated with PM2.5 exposure at level z for cause c in age group a.
The national baseline mortality rates of NCD, IHD, stroke, LC, COPD, and LRI by age and sex and population estimates by age and sex for each year were obtained from the Global Burden of Disease Study 2016 (Global Burden of Disease Collaborative Network, 2017a, b). The year-specific population distributions were obtained from the Gridded Population of the World version 4 (GPWv4; http://sedac.ciesin.columbia.edu/data/collection/gpw-v4; Doxsey-Whitfield et al., 2015), which has a horizontal resolution of . The 1990–2015 gridded population and annual average PM2.5 concentration (36 km×36 km) simulated by the CMAQ were then regridded to a uniform domain over China for mortality estimation at a horizontal resolution of . The PM2.5-related premature mortality contributed by each sector was estimated using the gridded relative source contributions determined by the CMAQ sensitivity simulations.
Besides, to identify the driving factors underlying the changes in long-term health impact, we calculated the contributions from four factors to the net changes in PM2.5-related premature mortality between the neighboring years, i.e., population growth, population aging, baseline mortality rates, and PM2.5 exposure. Following the previous decomposition method (Cohen et al., 2017), we calculated the average factor contributions through all the change sequences in the four factors.
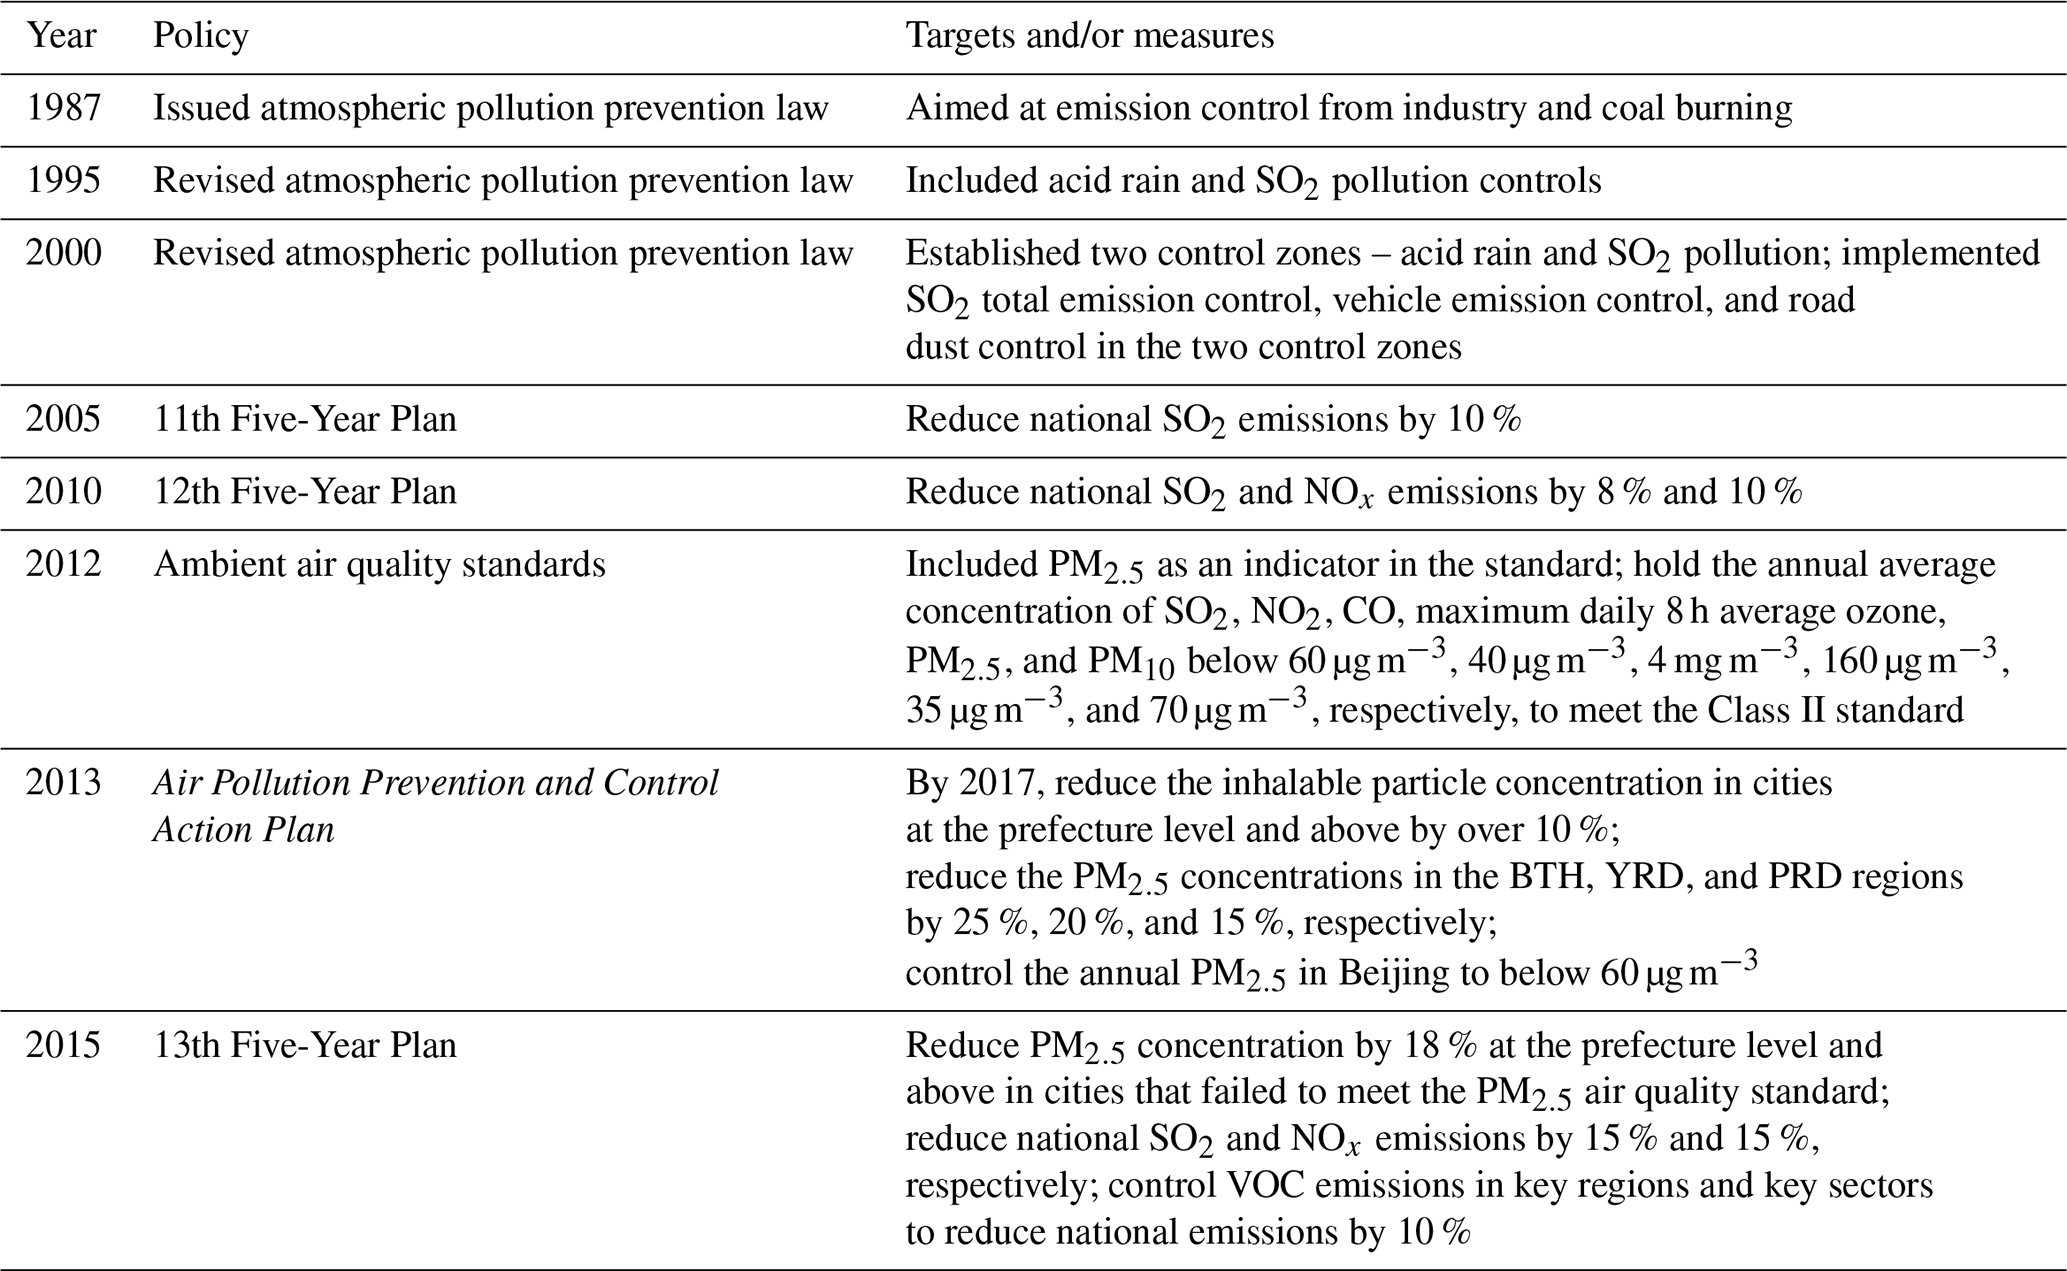
In recognition of the importance of air pollution prevention, China has implemented air pollution controls since the 1970s. Table 1 lists the development sequence of the major air quality regulations in China; Fig. S4 shows the timetable of the emission standards implemented in the major sectors during the past decades, and Table 2 presents the annual emissions of SO2, NOx, PM2.5, and NH3 contributed by the agriculture, industry, power, residential, and transportation sectors. Historically, coal has been dominant in the energy system, contributing between 60 % and 70 % of the primary energy. Coal burning has caused high levels of SO2 and total suspended particulates (TSP) in the air. In 1987, the Law on the Prevention and Control of Atmospheric Pollution was formulated with the intent of reducing emissions from industry and from coal burning. Subsequently, the law was revised in 1995 and again in 2000. During this period, the Two Control Zones policy (with acid rain and SO2 pollution control zones) was established, and SO2 emission controls were implemented to mitigate the acid rain and SO2 pollution problems. A series of emission standards was established in the power (GB13223-1991, GB13223-1996, and GB13223-2003) and industrial sectors (GB4915-1996, GB 9078-1996, GB4915-2004) to reduce the SO2, particulate matter, and NOx emissions (Fig. S4). In the transportation sector, China followed the vehicle emission standard system developed by the European Commission. Since 1998 China has taken a series of measures to address vehicle emissions, including implementing and updating vehicle emission standards for new vehicles and phasing out old, high-emission vehicles (Huo et al., 2015). In 2000 and 2011, China implemented the national state I emission standards for light-duty gasoline vehicles and heavy-duty diesel vehicles, respectively. However, these measures did not keep up with the rapid growth of the economy and fossil fuel use, and the national emissions of SO2, NOx, and PM2.5 increased by 142 %, 207 %, and 54 % from 1990 to 2005. Since 2005, national targets for reducing SO2 and NOx emissions have been included in the 11th and 12th five-year plans (FYPs). Installation of flue gas desulfurization (FGD) systems, selective catalytic reduction (SCR), and selective noncatalytic reduction (SNCR) equipment in coal-fired power plants and high-emission industries (such as iron and steel and cement); phaseout of small power plants; and more stringent vehicle emission standards have been mandated to achieve these targets (Liu et al., 2015; F. Liu et al., 2016; van der A et al., 2017; Zheng et al., 2018). In response, national SO2 emissions dropped from 33.0 to 27.8 Mt by 16 % in the period of 2005–2010, which was even greater than the target reduction rate of 10 %. But NOx emissions kept growing during the 11th FYP due to limited end-of-pipe measures and started to drop during the 12th FYP. In 2012, PM2.5 was included as an indicator in the new ambient air quality standards (GB 3095–2012). Subsequently, in 2013, China issued the national Air Pollution Prevention and Control Action Plan (hereafter the Action Plan), which for the first time made a commitment to reducing ambient PM2.5 concentrations by up to 25 % during 2013–2017. To fulfill the air quality targets, the government proposed 10 pollution control measures and implemented a series of more stringent emission standards for the power, industrial, and transportation sectors (Fig. S4) that have significantly reduced air pollutant emissions and substantially improved the air quality in China (Zheng et al., 2018; Cheng et al., 2019; Xue et al., 2019). As a result, the SO2, NOx, and PM2.5 emissions in 2015 had decreased dramatically by 39 %, 10 %, and 22 %, compared with the levels in 2010. The 13th FYP was published recently. In addition to SO2 and NOx emissions, control targets were also established for VOC (volatile organic compound) emissions.
Table 1Milestones of major air quality regulations in China over the past decades. BTH is Beijing–Tianjin–Hebei; YRD is Yangtze River Delta; PRD is Pearl River Delta.
4.1 Trends in annual average anthropogenic PM2.5
As shown in Table 2, during 1990–2015, the SO2, NOx, PM2.5, and NH3 emissions in China increased from 13.6, 6.4, 8.9, and 7.2 to 16.9, 23.7, 9.1, and 10.5 Mt, with peaks occurring in 2005, 2010, 2005, and 2015, respectively. In response, the ambient PM2.5 concentration over China has changed markedly during the 25-year study period. Figure 1 illustrates the annual average anthropogenic PM2.5 concentrations in China from 1990 to 2015. The overall spatial pattern looked similar for all the years. High levels of PM2.5 concentrations occurred in northern, central, and eastern China, covering most of the populous city clusters such as the Beijing–Tianjin–Hebei (BTH) region, the Yangtze River Delta (YRD), the Pearl River Delta (PRD), and the Sichuan–Chongqing region. Despite a short-term slowdown caused by the Asian economic crisis in 1997, a pronounced increase in nationwide PM2.5 concentrations occurred during 1990–2005, driven by the dramatic growth in SO2, NOx, NH3, and primary PM2.5 emissions (Table 2). The population-weighted PM2.5 concentration increased from 36.0 µg m−3 in 1990 to 63.5 µg m−3 in 2005. From 2005 to 2015, under the air quality regulations during the 11th and 12th FYPs and the recent Action Plan (Table 1), the national SO2 and PM2.5 emissions were reduced by 49 % and 33 %, respectively (Table 2). During the same period, NOx emissions rose by 20 % but reached their peak during 2012–2013. As a result, the annual average PM2.5 concentrations have decreased, and the population-weighted PM2.5 concentration dropped to 49.9 µg m−3 in 2015. During the entire period from 1990 to 2015, the effectiveness of control policies was offset by increased emissions from expanding development; therefore, the annual PM2.5 concentrations increased substantially in most of the regions. However, the more aggressive control measures resulted in improved air quality in some metropolitan areas, such as Beijing, the Yangtze River Delta, and the Pearl River Delta.
Table 2SO2, NOx, PM2.5, and NH3 emissions; population-weighted PM2.5 concentration; and PM2.5-related premature mortality contributed by the agricultural (Agr), industrial (Ind), power (Pow), residential (Res), and transportation (Tra) sectors.
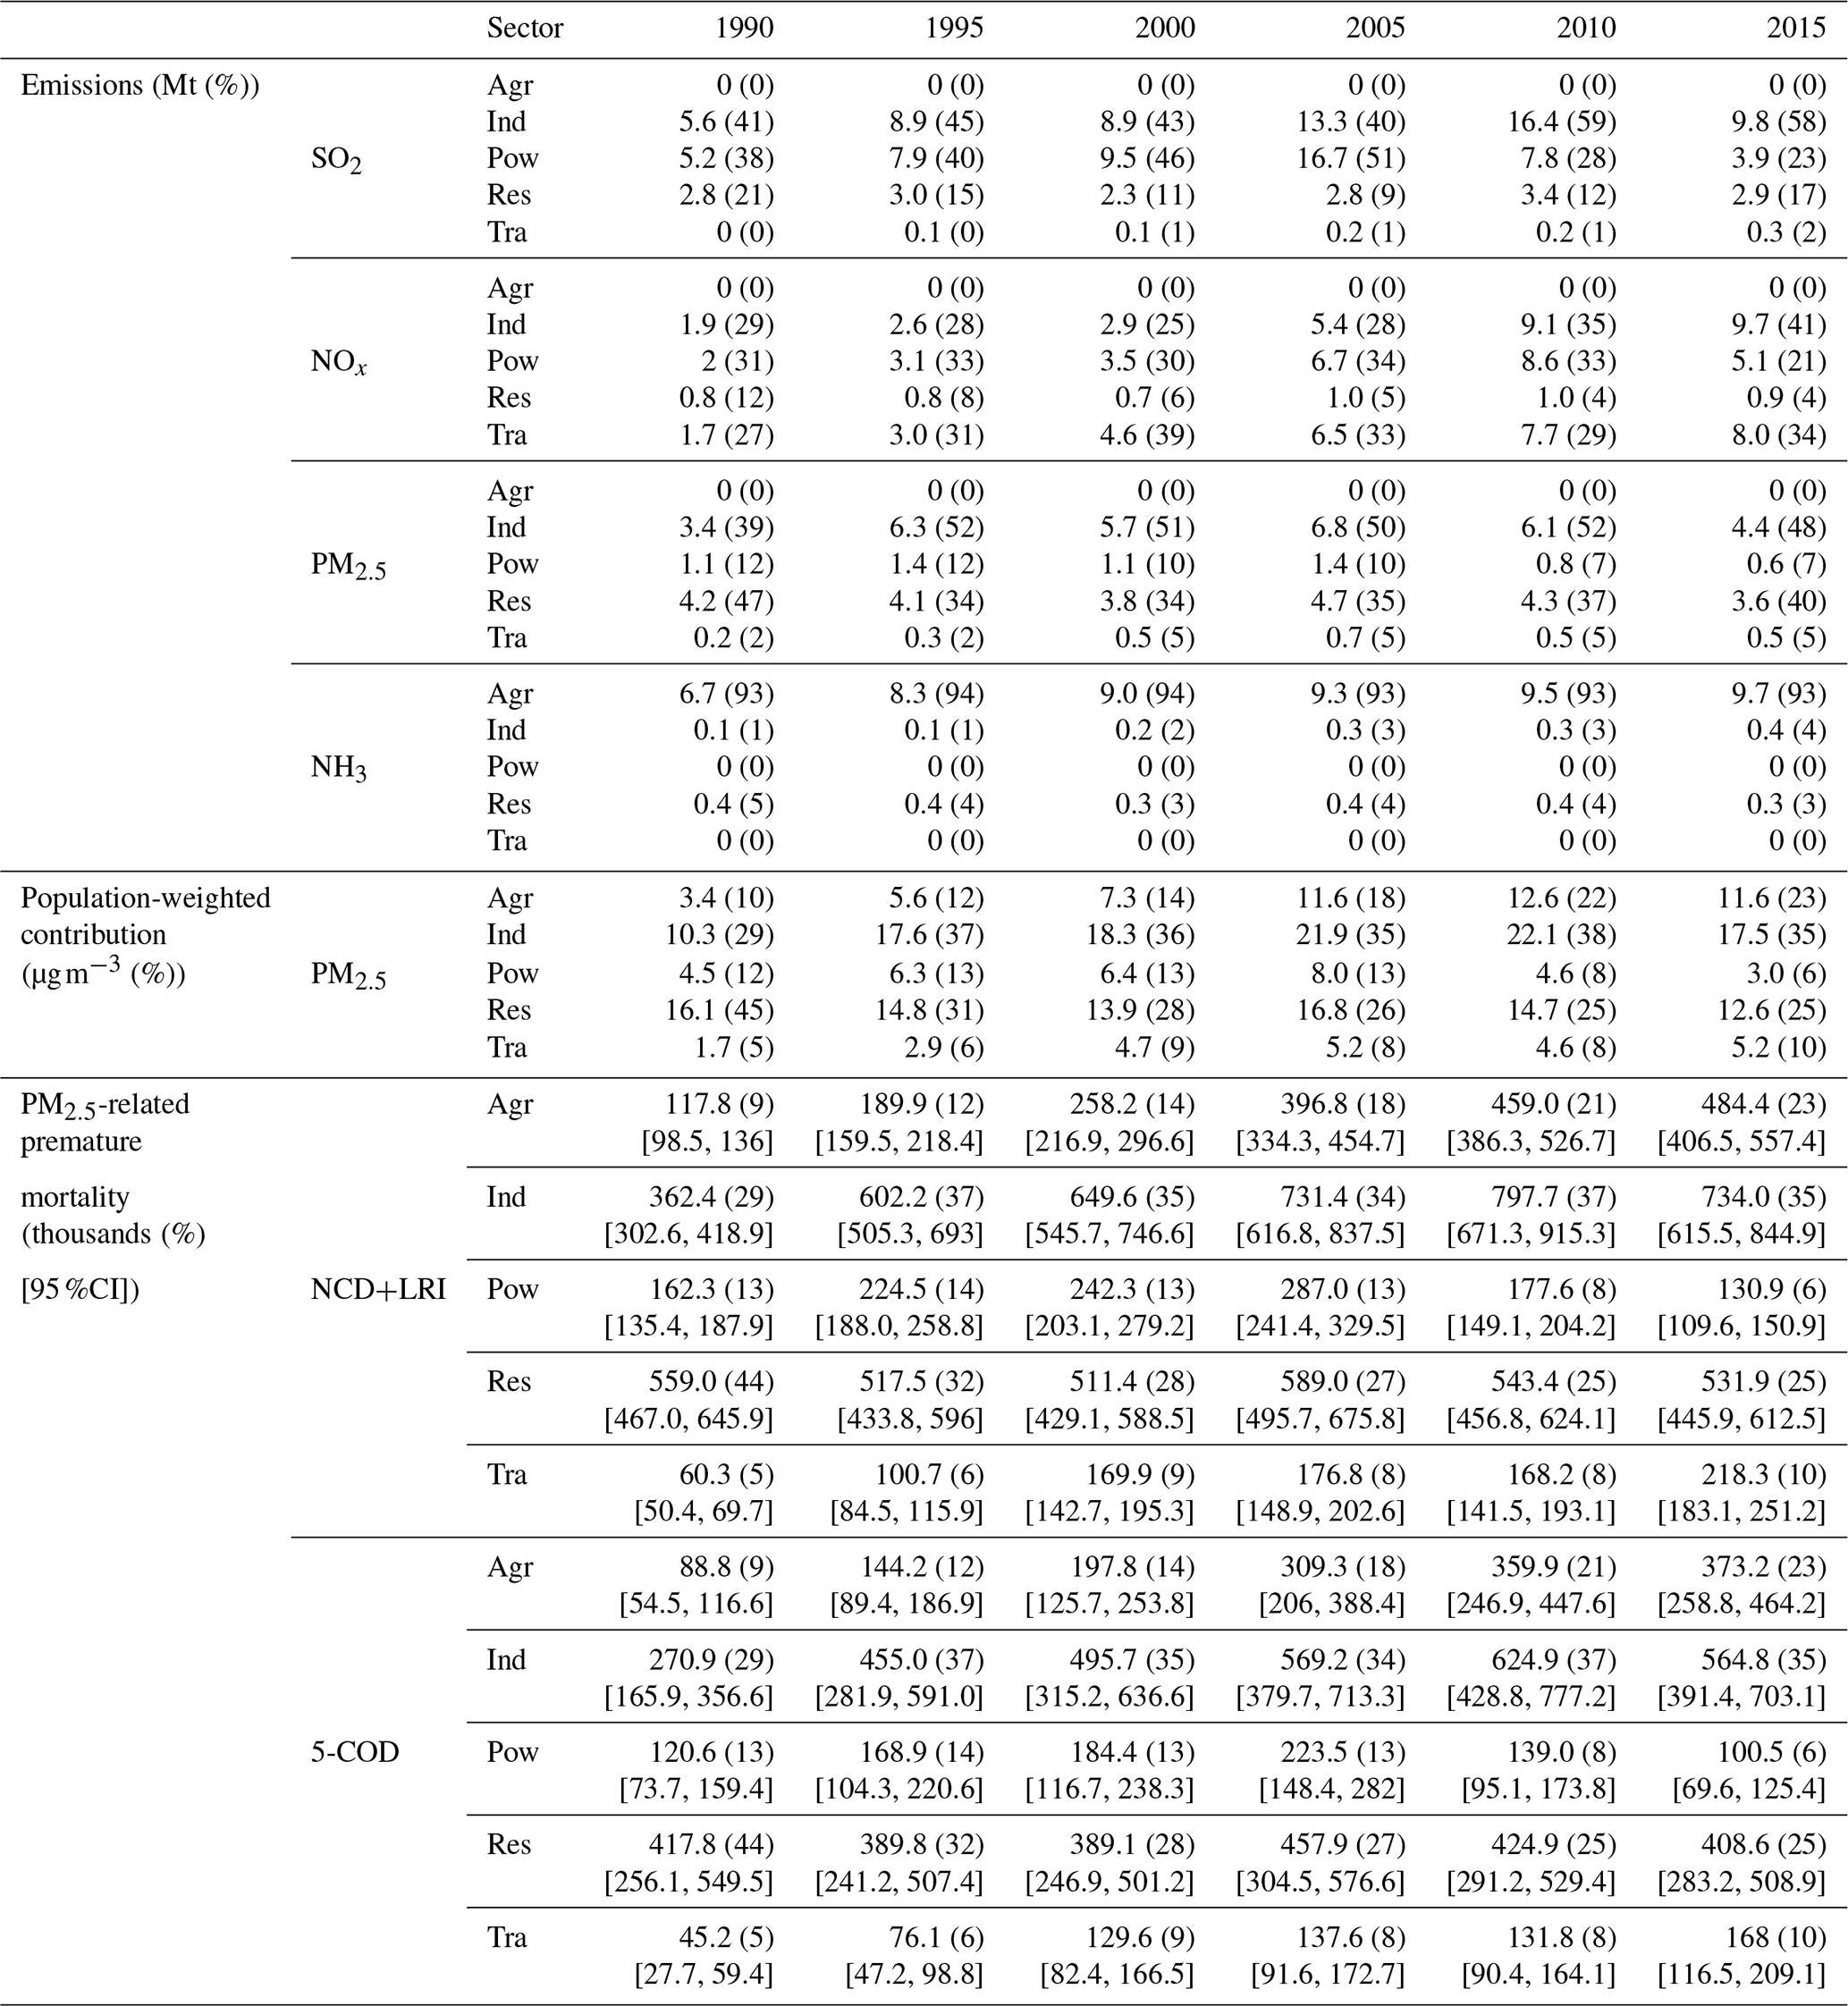
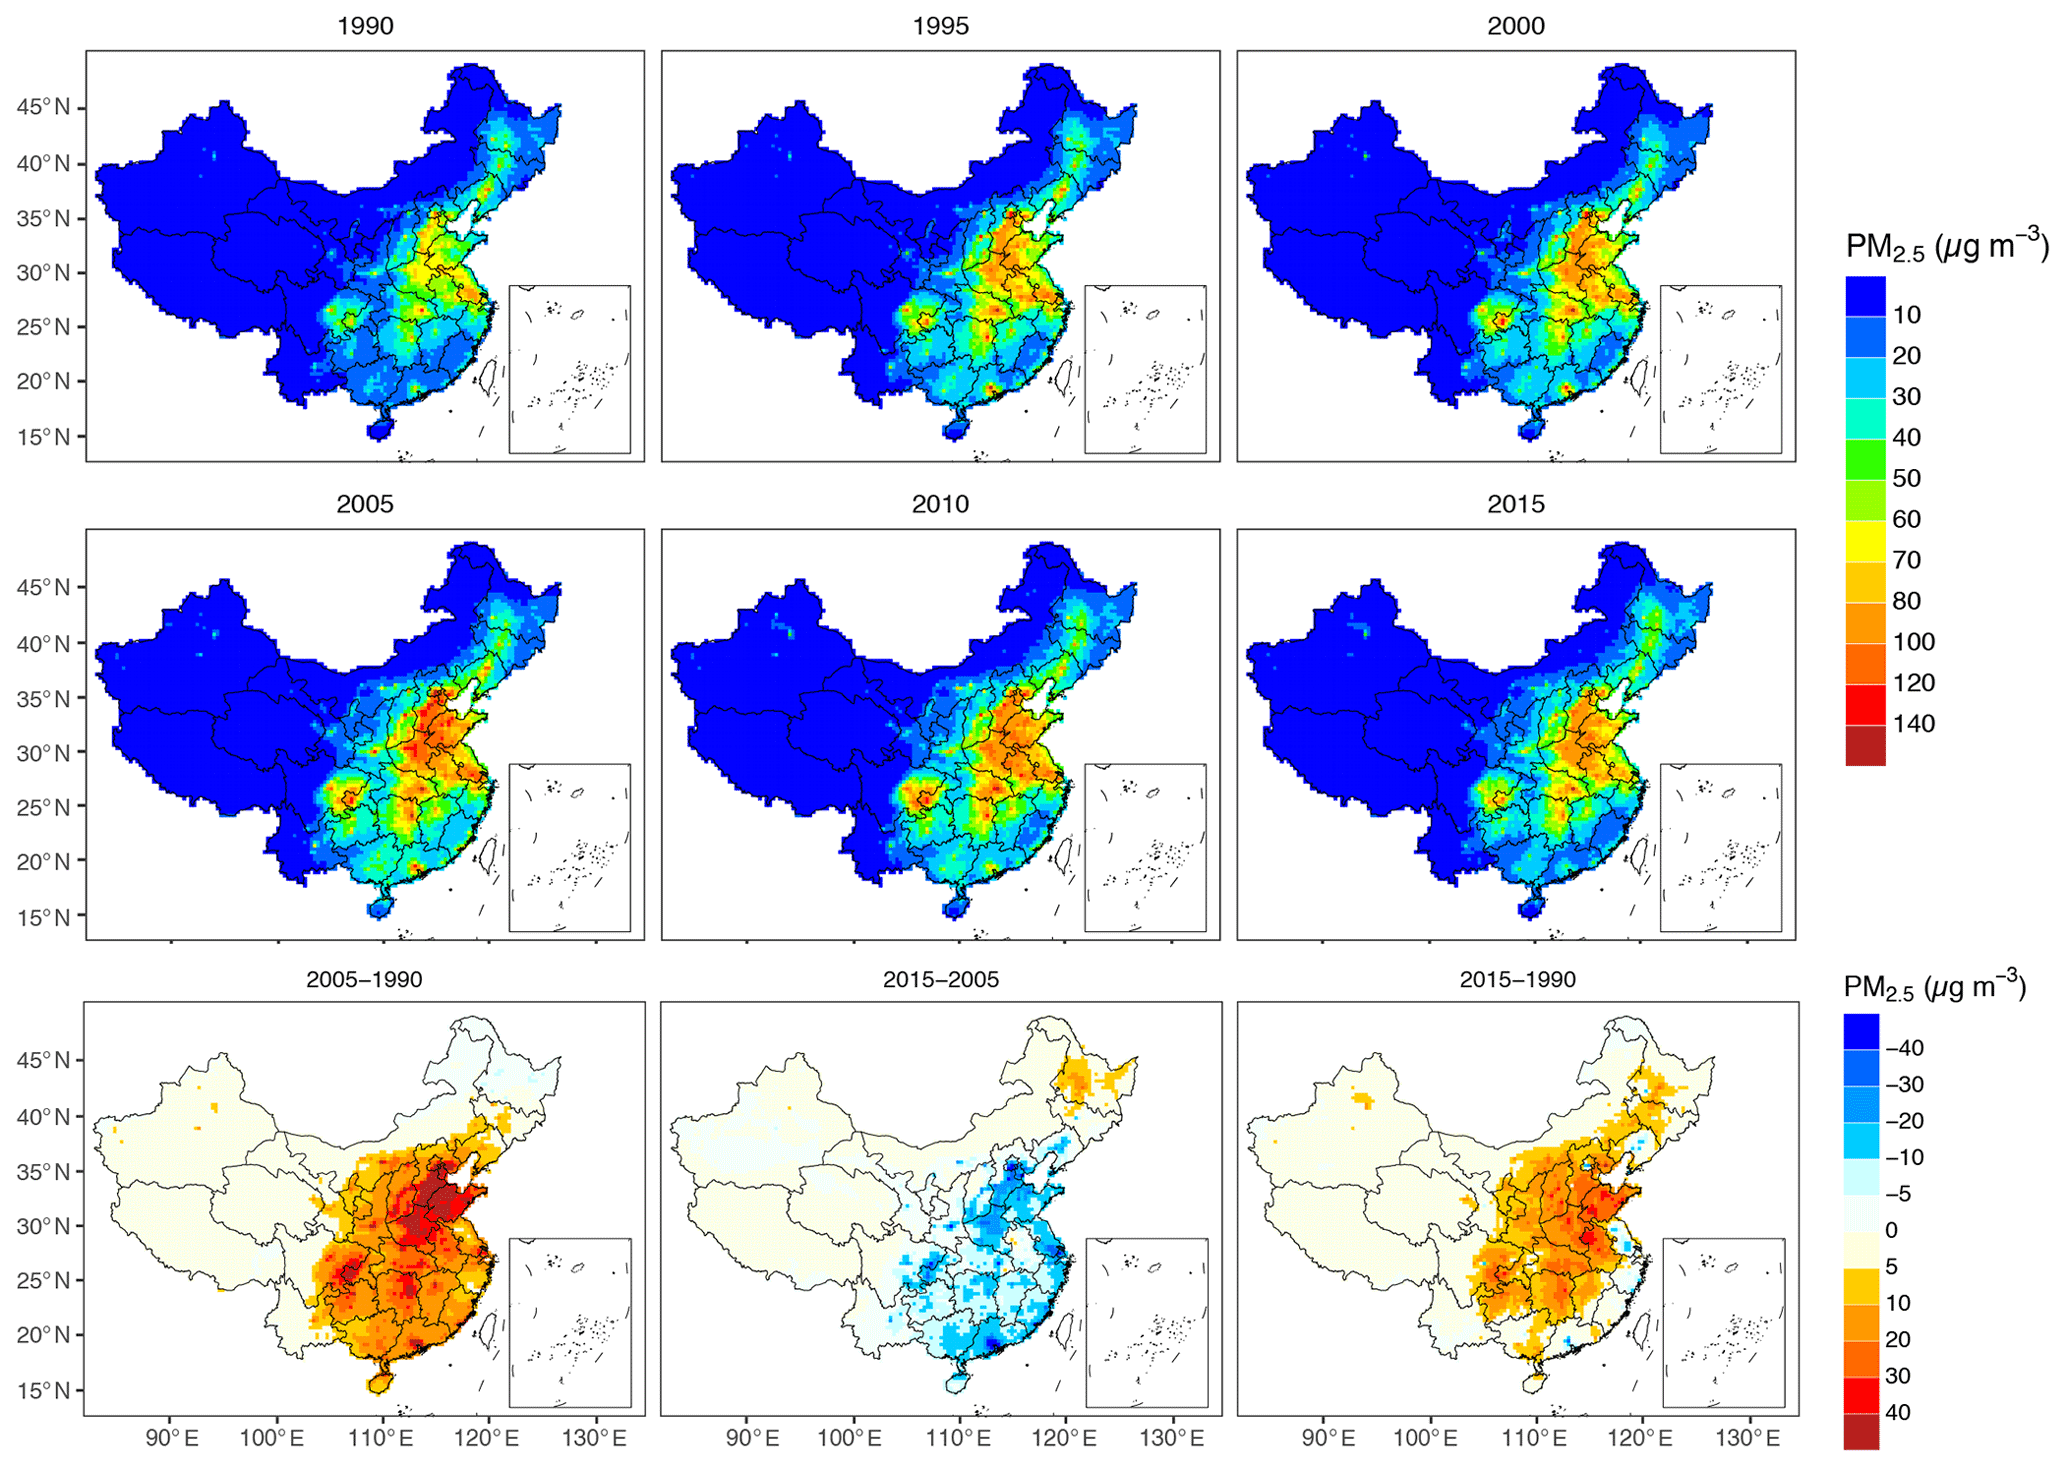
Figure 1Annual average PM2.5 concentrations and concentration changes from 1990 to 2015 (µg m−3).
4.2 Trends in premature mortality attributable to PM2.5
As shown in Fig. 2, the national premature mortality attributable to anthropogenic PM2.5 exposure estimated with GEMM NCR+LRI functions rose from 1.26 million (95 % confidence interval (CI) [1.05, 1.46]) in 1990 to 2.18 million (95 % CI [1.84, 2.50]) in 2005; then, it slightly decreased to 2.10 million (95 % CI [1.76, 2.42]) in 2015. When adopting the GEMM 5-COD function, the excess deaths rose from 0.94 million (95 % CI [0.58, 1.24]) in 1990 to 1.70 million (95 % CI [1.13, 2.13]) in 2005; then, it decreased to 1.62 million (95 % CI [1.12, 2.01]) in 2015. The mortality impacts of PM2.5 exposure based on mortality rates of NCD+LRI were 27 %–33 % higher than those based on mortality rates of 5-COD, indicating that the PM2.5 exposure may contribute to mortality from causes other than these five-specific causes of death as we already knew (Burnett et al., 2018). The overall trend of PM2.5-related premature mortality reflected the trend of national population-weighted PM2.5 concentrations but exhibited a milder decline when the PM2.5 concentrations fell after 2005, due to the impetus from other demographic factors (Fig. 3). From 1990 to 2015, premature mortality caused by LRI remained relatively stable, and premature mortality caused by COPD declined, while premature mortality caused by IHD, LC, and stroke increased, reflecting the demographic and epidemiological transitions over time (Yang et al., 2013). The rapid rise of these noncommunicable diseases poses challenges to China's public health.
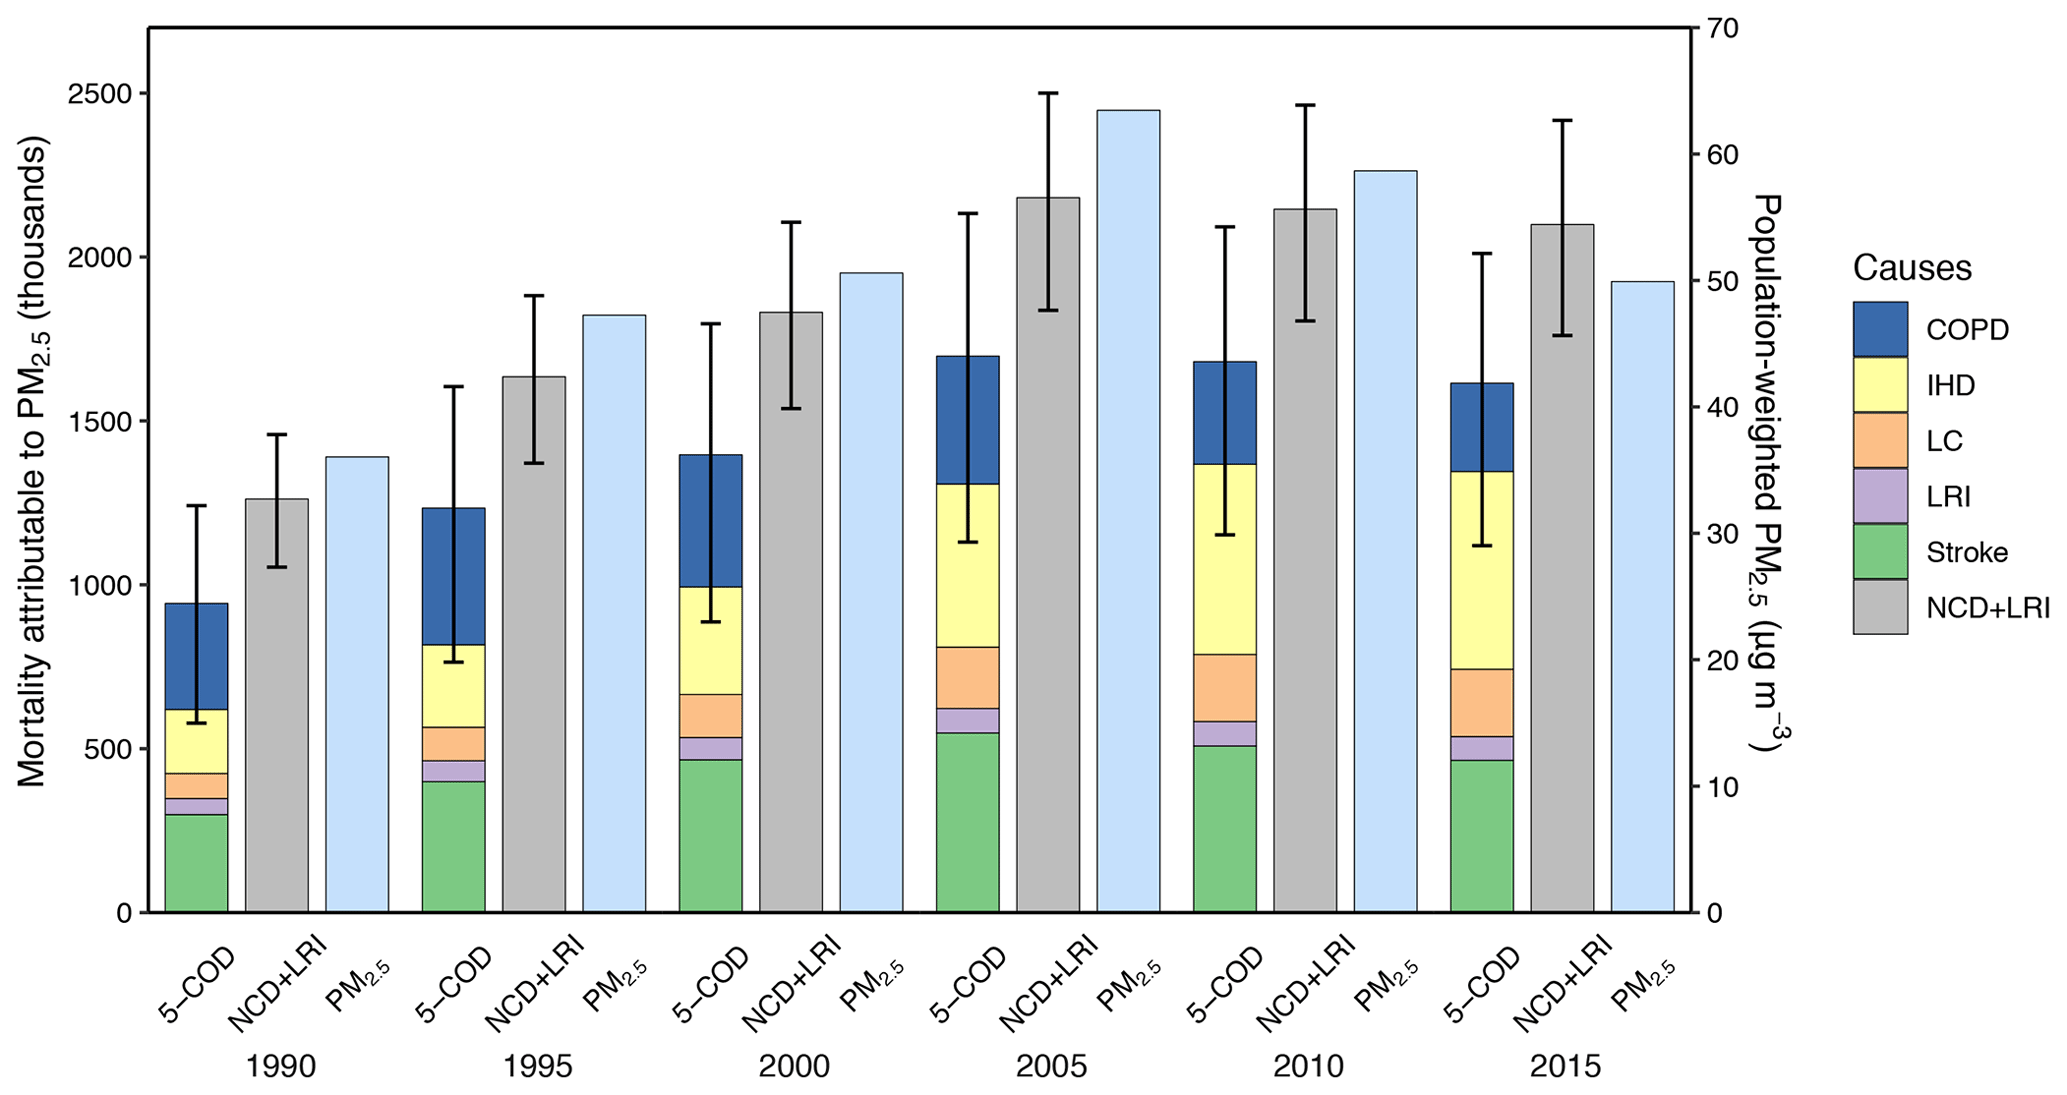
Figure 2Historical trends of national population-weighted PM2.5 concentrations (µg m−3) and PM2.5-related premature mortality shared by disease causes (thousands) estimated with GEMM NCD+LRI and GEMM 5-COD functions.
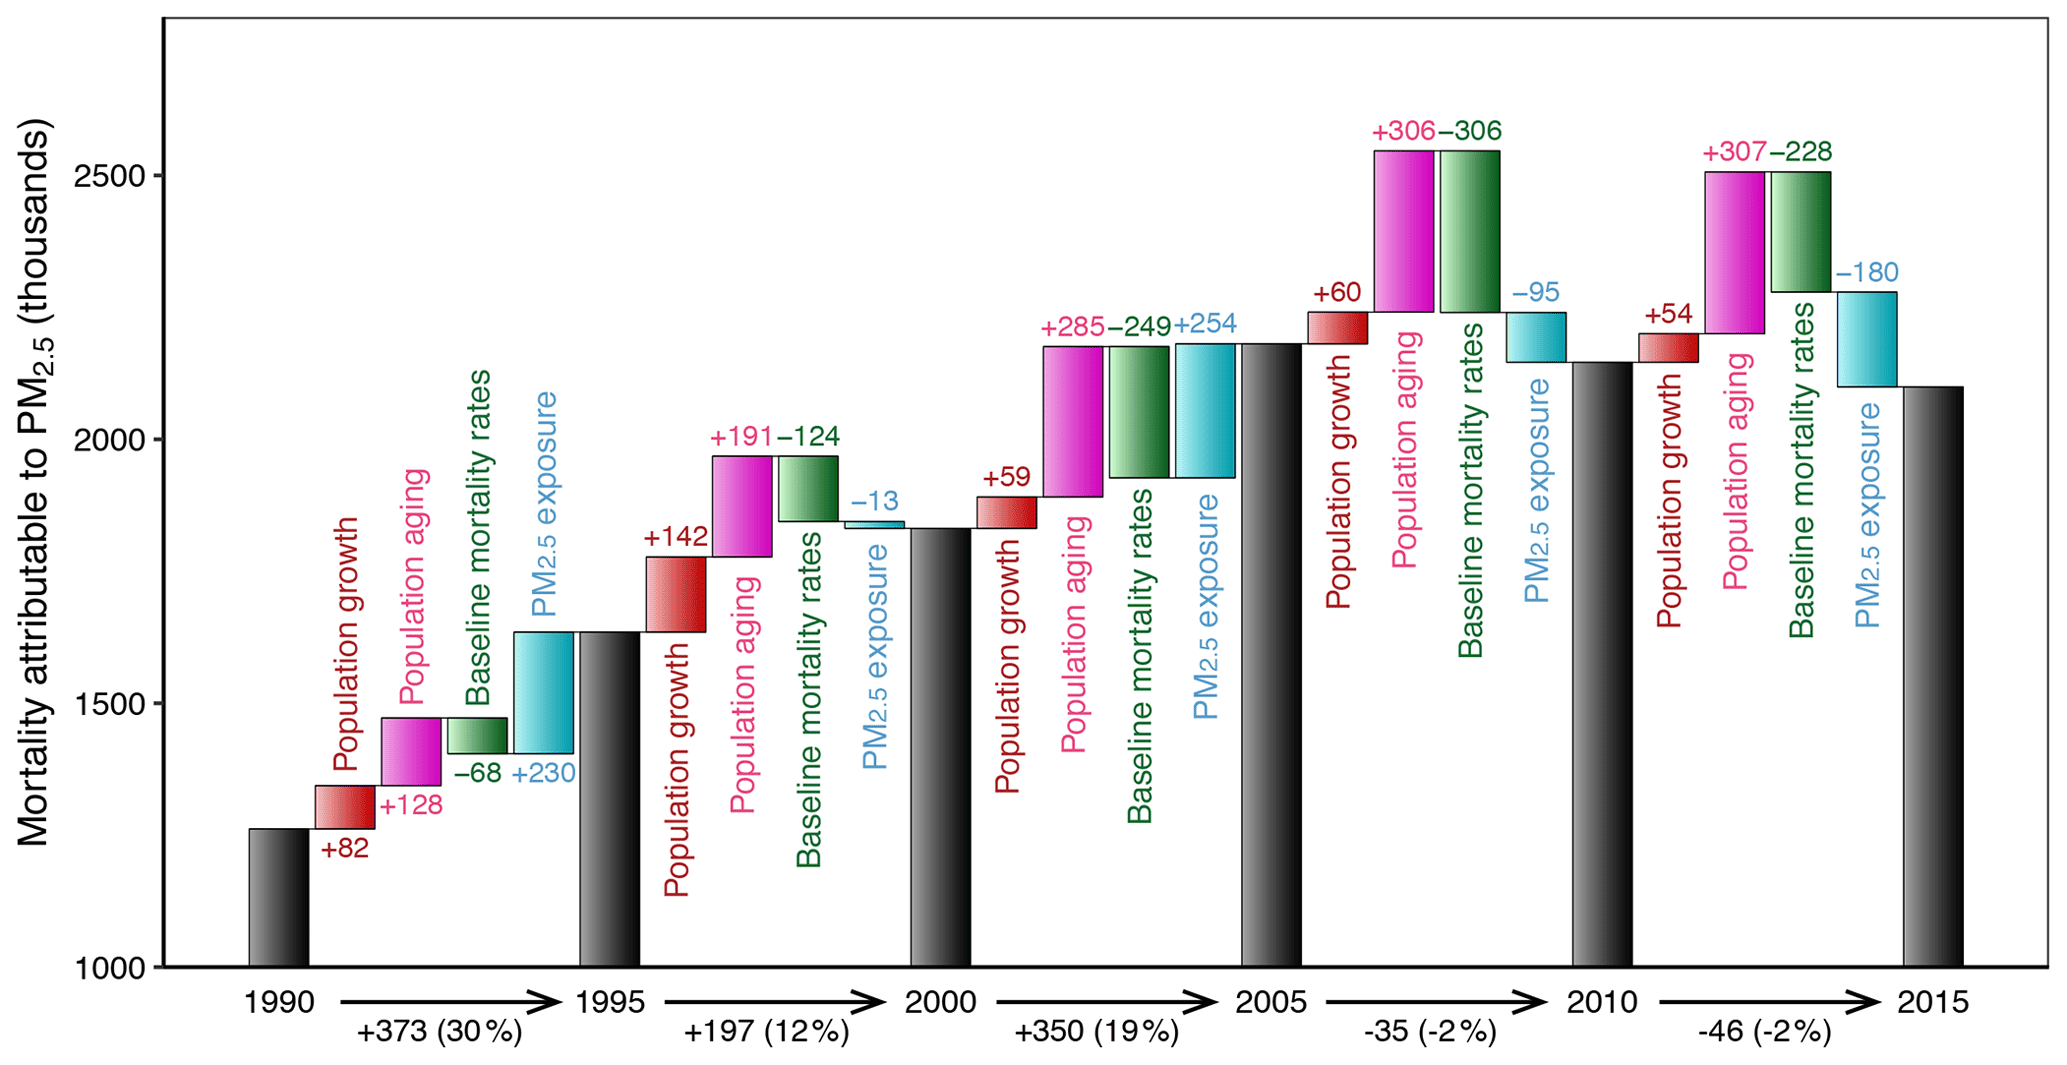
Figure 3Contribution of factors to the changes in national PM2.5-related premature mortality estimated with GEMM NCD+LRI functions for each 5-year interval (in thousands). The length of each bar reflects the contribution of each factor.
The trends in premature mortality attributable to PM2.5 are driven by changes in air quality, demographic factors, and baseline mortality rates. As shown in Fig. 3, reductions in baseline mortality rates continuously contributed to the decrease in PM2.5-related mortality, but these benefits were counterbalanced by increases resulting from population growth and aging. Before 2005, the deteriorating air quality contributed to the growth of PM2.5-related mortality, whereas the notable improvements of air quality in the past 10 years have contributed to a decrease in PM2.5-related mortality. Overall, however, the net reductions were rather small compared with the total premature mortality (for example, the reduction was only −2 % from 2010 to 2015). With the population still growing and the accelerating aging of the population, it has become crucial to take further steps to sharply reduce PM2.5 concentrations to effectively improve the related health benefits.
4.3 Source contributions to PM2.5 air pollution and related premature mortality
We determined the source contributions from the power, industrial, transportation, residential, and agricultural sectors to PM2.5 air pollution and related premature mortality through a series of CMAQ sensitivity simulations. Figure 4 shows the spatial distribution of the PM2.5 concentration contributed by each source sector in 1990, 2000, 2010, and 2015, and Fig. 5 shows the relative and absolute source contributions to the national population-weighted PM2.5 concentration and related premature mortality from 1990 to 2015. The relative contributions of the source sectors to PM2.5 concentrations and related premature mortality are similar (Table 2), and the nonaccidental mortality (NCD+LRI) was found to have enhanced statistical power to characterize the shape of the GEMM functions compared to specific causes of death (Burnett et al., 2018). Therefore, we discuss the source contributions from a health perspective estimated with GEMM NCD+LRI functions in more detail, and the estimates with GEMM 5-COD are also listed in Table 2.
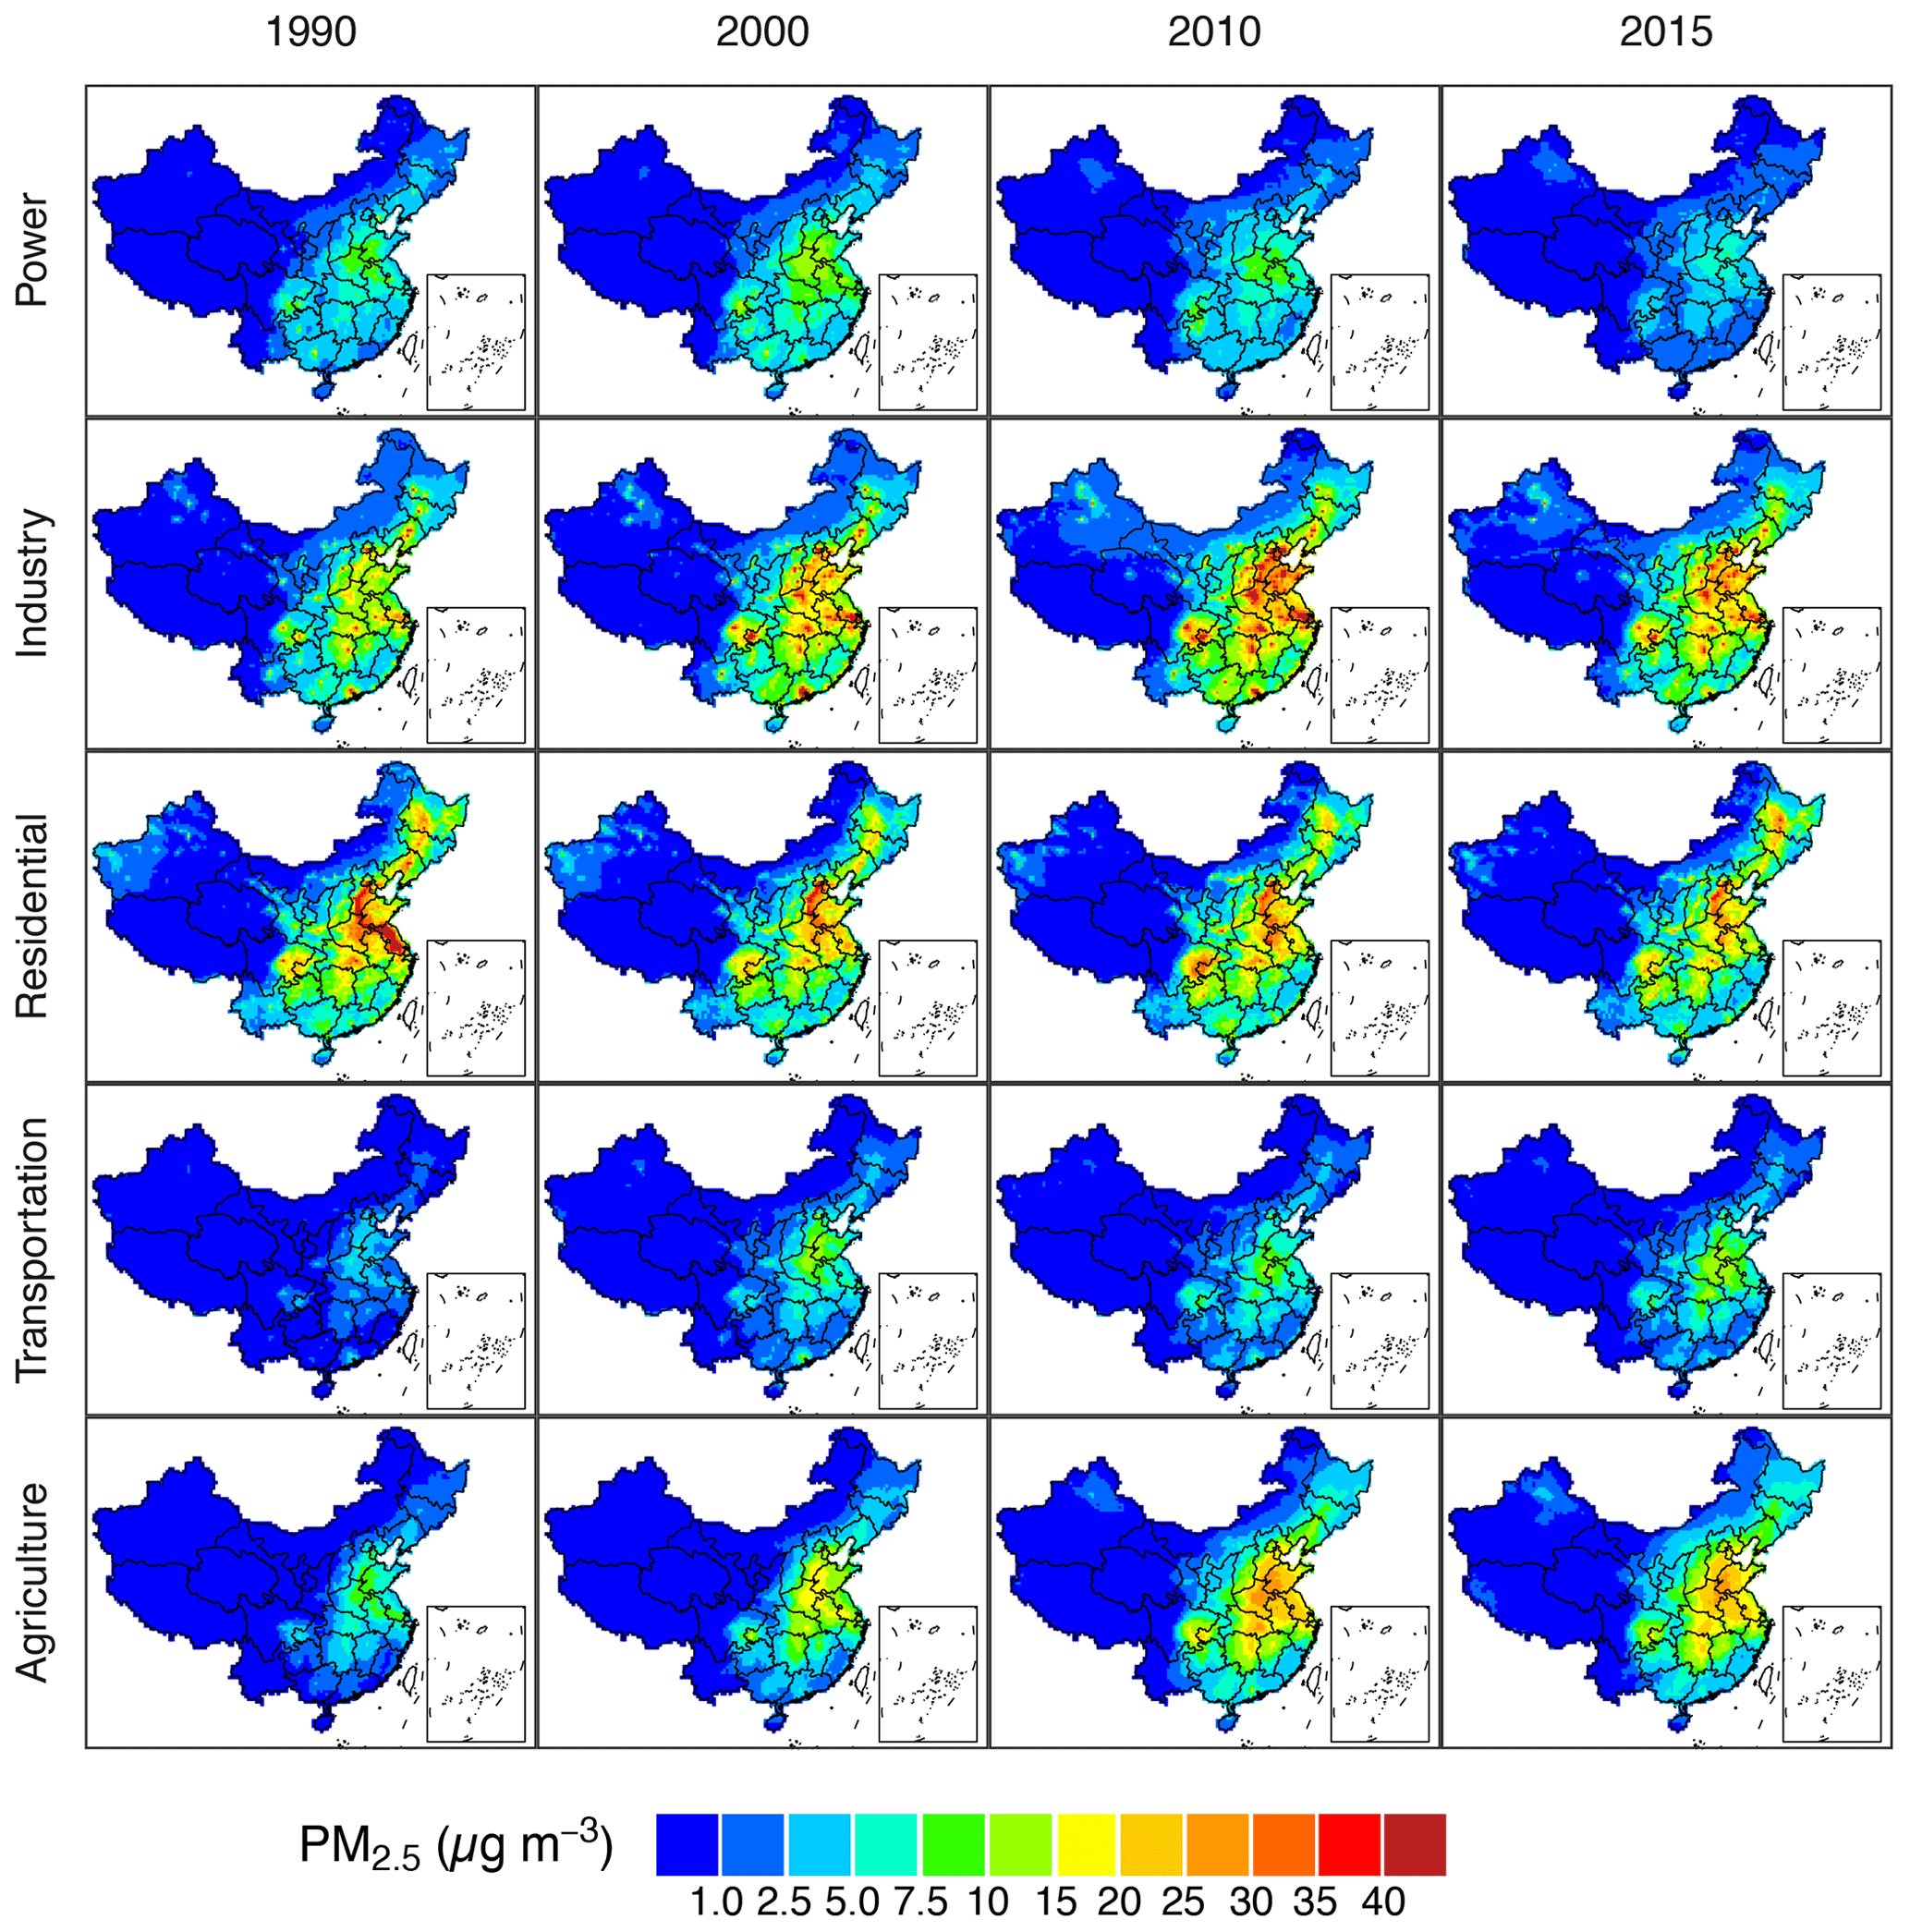
Figure 4Source contributions to annual average PM2.5 concentration (µg m−3) in 1990, 2000, 2010, and 2015.
In general, the industrial sector is the prime source of PM2.5-related premature mortality. This sector's contribution grew from 29 % in 1990 to 37 % in 2010, driven by the increasing demand for industrial production, but fell to 35 % in 2015 under strengthened emission control measures during the Action Plan. The residential sector was the dominant source in 1990 but has had a decreasing trend over the past 25 years. The relative contribution of the power sector was almost stable from 1990 to 2005 but then began to decrease, owing to active emission control over the past 10 years. In contrast, the transportation and agricultural sectors have experienced increasing trends; their source contributions to PM2.5-related mortality increased from 5 % and 9 %, respectively, in 1990 to 10 % and 23 %, respectively, in 2015. These growing contributions indicate the necessity for attention when planning future mitigations.
Historically, the power sector is the largest coal consumer and is considered to be an important emission source in China. Since 1990, driven by the growing demand for electricity, the power sector has prominently increased its emissions and became the leading source of SO2 and NOx emissions in 2005 (Table 2). As a result, the population-weighted PM2.5 concentration contributed by the power sector increased from 4.5 µg m−3 in 1990 to 8.0 µg m−3 in 2005. Sulfate, nitrate, and ammonium (SNA) were the major chemical components, accounting for approximately 80 % of the total PM2.5 mass concentrations (Fig. S5). Correspondingly, the absolute contribution of the power sector to PM2.5-related mortality increased from 162 300 (95 % CI [135 400, 187 900]) in 1990 to 287 000 (95 % CI [241 400, 329 500]) in 2005. However, after 2005, a series of control measures were actively enforced in the power plants to meet the new emission standards (GB13223-2003, GB13223-2011), including installations of FGD systems in the 11th FYP, SCR and SNCR systems in the 12th FYP, and more stringent measures under the Action Plan (Zheng et al., 2018), which have continuously reduced power plant SO2 and NOx emissions. Until 2015, the power sector accounted for only 130 900 (95 % CI [109 600, 150 900]) or 6 % of the PM2.5-related deaths.
The industrial sector was the largest contributor to PM2.5 air pollution and related mortality during 1995–2015, responsible for between 602 200 and 797 700 (34 %–37 %) deaths. Industrial emissions are emitted from both stationary combustion and industrial processes. Cement plants, iron and steel plants, and industrial boilers are the major contributors. Driven by the relentless growth of industrial production, the industrial SO2 and NOx emissions increased continuously from 1990 to 2010 (Table 2). But the industrial PM2.5 emissions exhibit a different trend: they first increased from 1990 to 1995 and then stabilized during 1995–2010, since the PM2.5 emission mitigation from the switch from shaft kilns to precalciner kilns just counterbalanced the emission growth from other industrial sectors (M. Li et al., 2017a). Driven by those emission changes, the population-weighted PM2.5 concentration contributed by the industrial sector increased from 10.3 to 22.1 µg m−3 from 1990 to 2010 (Table 2), and the premature mortality contributed by the industrial sector increased prominently from 362 400 (95 % CI [302 600, 418 900]; 29 %) in 1990 to 797 700 (95 % CI [671 300, 915 300]; 37 %) in 2010. SNA and other unspeciated primary PM2.5 emissions are the major chemical components of population-weighted PM2.5, accounting for 42 %–58 % and 31 %–48 % of the mass concentration, respectively (Fig. S5). Until recently, the growing trend of industrial contributions has been effectively reversed by a series of enhanced control measures under the Action Plan, including more stringent industrial emission standards; the elimination of outdated industrial capacity; the phasing out of small, polluted factories; and the elimination of small coal-fired industrial boilers (Zheng et al., 2018). In 2015, the industrial NOx emissions flattened out and SO2 and PM2.5 emissions were remarkably reduced by 40 % and 28 % compared with their levels in 2010 (Table 2), which consequently drove down the premature mortality shared by the industrial sector to 734 000 (95 % CI [615 500, 844 900]; 35 %).
The residential sector is another major emitter of anthropogenic pollutants, including PM2.5, BC, OC, and NMVOCs, due to poor combustion efficiency and lack of emission controls (M. Li et al., 2017a). The prime cause of residential emissions is the consumption of fossil fuels and biofuels for heating and cooking. It is a major ambient air pollution source, especially during the winter heating season in northern China (Li et al., 2015; J. Liu et al., 2016a). On average, the residential sector was the second-largest source of population-weighted PM2.5 in China. The major chemical components are organic matter (OM) and BC, which comprise approximately 46 % and 16 %, respectively, of the PM2.5 concentration contributed by the residential sector (Fig. S5). In 1990, the residential sector was the leading contributor, accounting for 44 % of the PM2.5-related deaths, but it experienced an overall decreasing trend over time. There are several reasons for this decrease. First, China has undergone an accelerating urbanization process. Hundreds of millions of rural people have migrated from the countryside into the cities. The urbanization-induced migration reduced emissions due to the switch from solid fuels to cleaner fuels after migration (Shen et al., 2017). Second, driven by the socioeconomic development, clean-energy transitions from solid fuels to clean fuels such as natural gas and electricity gradually happened in rural households (Chen et al., 2016), resulting in a decrease in residential emissions. Third, from 2013 to 2017, China strove to replace the direct use of coal with electricity and gas-powered heating in millions of households in northern China to mitigate air pollution in the countryside (Zheng et al., 2018; Cheng et al., 2019). Therefore, the contribution of the residential sector gradually declined from 44 % in 1990 to 25 % in 2015 (Fig. 5).
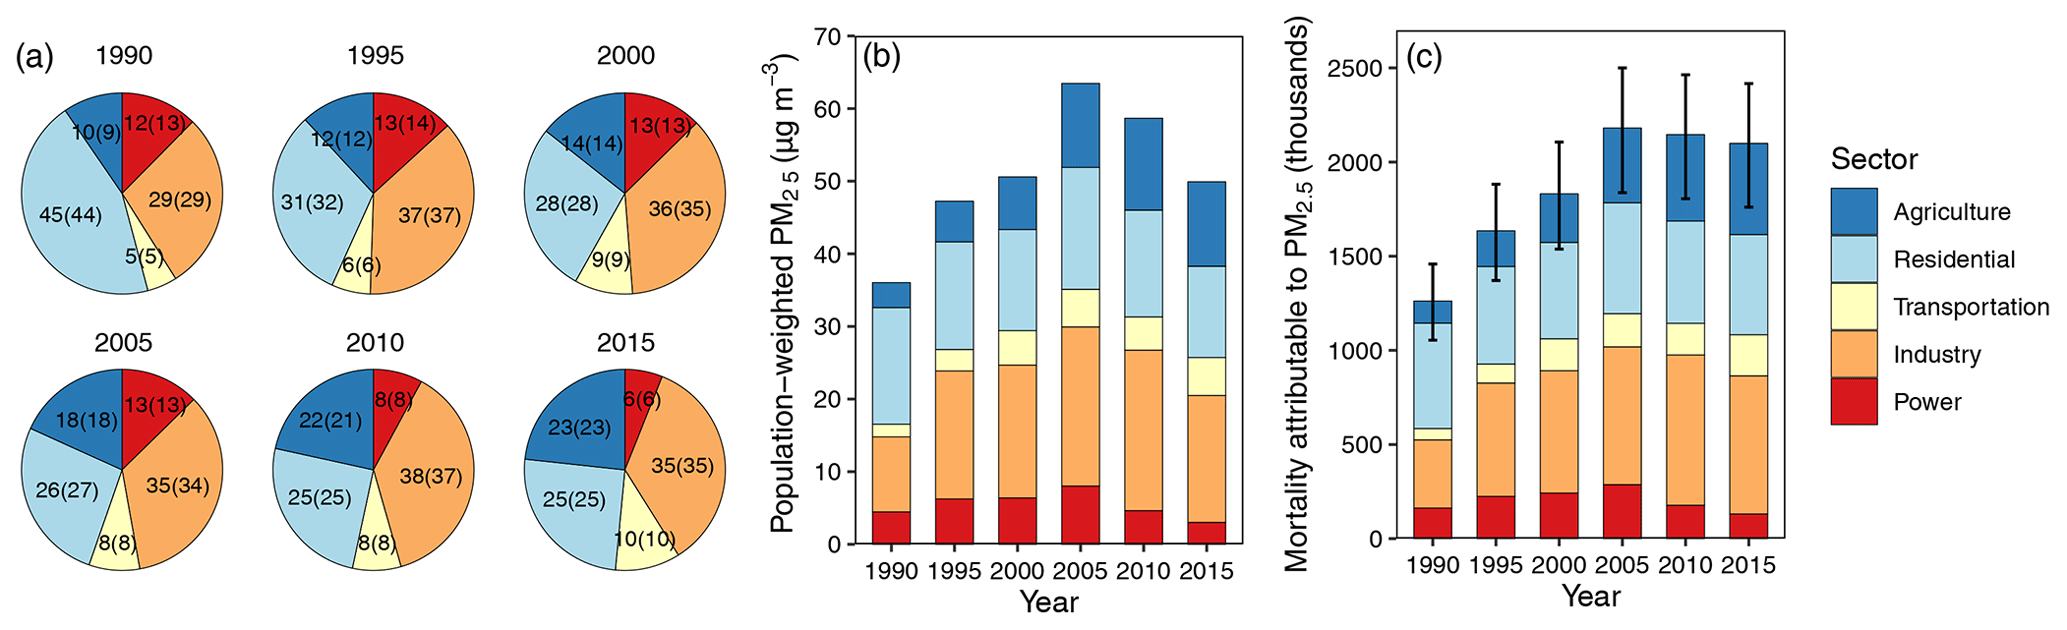
Figure 5Relative and absolute source contributions to national population-weighted PM2.5 concentrations and related premature mortality estimated with GEMM NCD+LRI functions. (a) Relative source contributions (%) to national population-weighted PM2.5 concentrations (numbers outside brackets) and related premature mortality (numbers inside brackets). (b) Absolute source contributions to national population-weighted PM2.5 concentrations (µg m−3). (c) Absolute source contributions to national PM2.5-related premature mortality (thousands) estimated with GEMM NCD+LRI functions.
The transportation sector is a growing source and is a major NOx, NMVOC, and BC emitter. Before 2000, China was in the prestage of the current vehicle emission standard system (Fig. S4), and emission control efficiencies were very limited in the transportation sector. Driven by vehicle population growth, NOx and PM2.5 emissions increased by 167 % and 229 % from 1990 to 2000, and the population-weighted PM2.5 contributed by the transportation sector increased from 1.7 to 4.7 µg m−3 (Table 2). Nitrate and BC are the major chemical components, accounting for 55 % and 16 % of the PM2.5 mass concentration contributed by the transportation on average (Fig. S5). The PM2.5-related mortality caused by transportation emissions increased from 60 300 (95 % CI [50 400, 69 700]; 5 %) in 1990 to 169 900 (95 % CI [142 700, 195 300]; 9 %) in 2000 (Fig. 5). Then between 2000 and 2001, China implemented the national state I emission standards for light-duty gasoline vehicles and heavy-duty diesel vehicles. Subsequently, the emission standards were strengthened to stage II, stage III, and stage IV standards during 2003–2015 (Fig. S4). With these policy measures, vehicle emissions did not increase as rapidly as the number of vehicles, and the NMVOC and PM2.5 emissions from this sector have been declining since 2005 (Huo et al., 2015). NOx emissions have stabilized but are still growing. From 2000 to 2010, the contribution of the transportation sector to PM2.5-related mortality was relatively stable; however, by 2015, when pronounced reductions were achieved in the power and industrial sectors, the prominence of the transportation sector increased, with a contribution of 218 300 (95 % CI [183 100, 251 200]) PM2.5-related deaths, or 10 % of the total, revealing a growing threat to public health.
The agricultural sector is another growing source with a surge of NH3 emissions. During 1990–2015, the PM2.5-related mortality shared by the agricultural sector increased from 117 800 (95 % CI [98 500, 136 000]; (9 %) to 484 400 (95 % CI [406 500, 557 400]; 23 %; Fig. 5). This increase was driven not only by the rising NH3 emissions but also by the abruptly growing NOx emissions. NH3 is an important precursor of ambient PM2.5 that exists in the secondary forms of ammonium sulfate and ammonium nitrate. Over 90 % of NH3 emissions stem from agricultural activities, including synthetic nitrogen fertilizer applications and livestock manure management. Because of the increasing demand for agricultural products and the lack of effective control measures, agricultural NH3 emissions increased from 6.7×10⁶ t in 1990 to 9.7 ×10⁶ t in 2015. Consequently, the population-weighted PM2.5 concentration contributed by the agricultural sector increased from 3.4 to 12.6 µg m−3 during 1990–2010. However, it subsequently decreased to 11.6 µg m−3 in 2015 due to NOx emission reductions imposed by the Action Plan (Table 2). Ammonium, nitrate, and sulfate were the major chemical components of the agricultural population-weighted PM2.5, accounting for over 98 % of the mass concentration (Fig. S5). Sulfate and nitrate are formed through the oxidation and neutralization of precursor gases SO2, NOx, and NH3. (NH4)2SO4 is the preferential species due to its stability; the semivolatile NH4NO3 is formed when excess NH3 is available beyond sulfate requirements (Seinfeld et al., 2006). In the sensitivity simulations, when the agricultural NH3 emissions were removed, most nitrate formation was inhibited due to lack of NH3. In contrast, sulfate can exist in the form of acid particles. Therefore, the amount of nitrate is much higher than the amount of sulfate in the PM2.5 (Fig. S5) contributed by the agriculture sector.
5.1 Comparison with other studies
We compared our estimates of anthropogenic source contributions to national PM2.5-related premature mortality with those of previous studies in China (Table 3). Most of the studies focused on 1 particular year for the period of 2010–2014 (Lelieveld et al., 2015; Hu et al., 2017; Gu et al., 2018; Reddington et al., 2019), and one study investigated the changes in source contributions during 2005–2015 (Zheng et al., 2019), whereas our study has a longer temporal coverage of 25 years, from 1990 to 2015. The differences between studies could arise from the differences in emission inventories and air quality models. The residential sector was highlighted in all the studies, sharing a contribution ranging from 15 % (Zheng et al., 2019) to 42 % (Reddington et al., 2019). The industrial sector was also identified as the leading source in five out of the six studies. A decreasing trend in the contribution from the power sector during 2005–2015 was illustrated by all the studies. Large discrepancies occurred in the agricultural sector, with the contribution ranging from 0.1 % (Reddington et al., 2019) to over 30 % (Lelieveld et al., 2015; Zheng et al., 2019). The magnitude of the contribution from the transportation sector was relatively close in all the studies. Overall, our estimates of relative source contributions were generally consistent with previous studies, well within the ranges of their estimates, and closest to those from Hu et al. (2017) and Gu et al. (2018), who estimated the same order of source contributions as our study before 2015, i.e., industry, residential, agriculture, power, and transportation, from the highest to the lowest.
Table 3Comparison of anthropogenic source contributions to PM2.5-related premature mortality with previous studies (%). The source sectors include Power (Pow), Industry (Ind), Residential (Res), Transportation (Tra), and Agriculture (Agr).
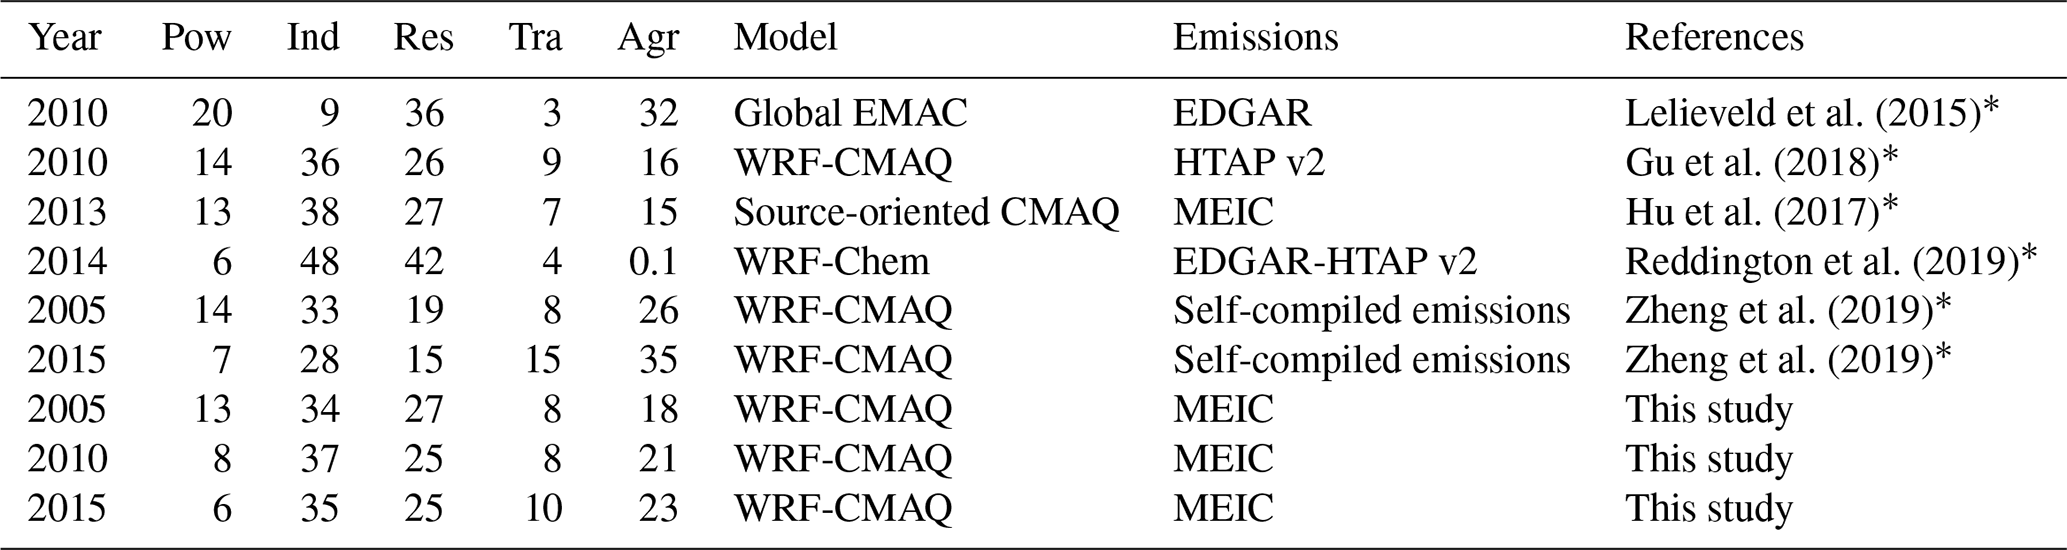
* Relative anthropogenic source contributions are derived from a normalization across all anthropogenic source sectors.
5.2 Uncertainties and limitations
Our study has a number of uncertainties and limitations. First, we estimated the long-term exposure of PM2.5 using CMAQ model simulations rather than satellite-based estimates. In practice, the satellite-based estimates utilize information from satellite and observations, resulting in improvements in estimates (Ma et al., 2016; van Donkelaar et al., 2016; Xue et al., 2017). However, satellite remote sensing data were unavailable prior to 1998. If we had combined the CMAQ simulations for 1990–1995 and satellite-based estimates for 2000–2015, we would have introduced additional uncertainties, which may have perturbed the long-term trends of source contributions to PM2.5 and weakened the information conveyed from the decadal sectoral emission changes. To illustrate the impacts, we calculated the PM2.5-related mortality with both CMAQ simulations and satellite-based estimates of van Donkelaar et al. (2016) and Ma et al. (2016) for 3 overlapping years: 2005, 2010, and 2015. The results showed that the PM2.5-related premature mortality estimated with the CMAQ simulations were comparable to those using satellite-based PM2.5 (Fig. 6). These differences were acceptable considering the uncertainty ranges from the GEMM functions. Previous studies on long-term trends in the chemical composition of population-weighted PM2.5 (C. Li et al., 2017) and on the attribution of source contributions to PM2.5-related mortality to emission changes (Lelieveld et al., 2015; Ma et al., 2017; Gu et al., 2018; Zheng et al., 2019) also applied the chemical transport model simulations to estimate exposure.
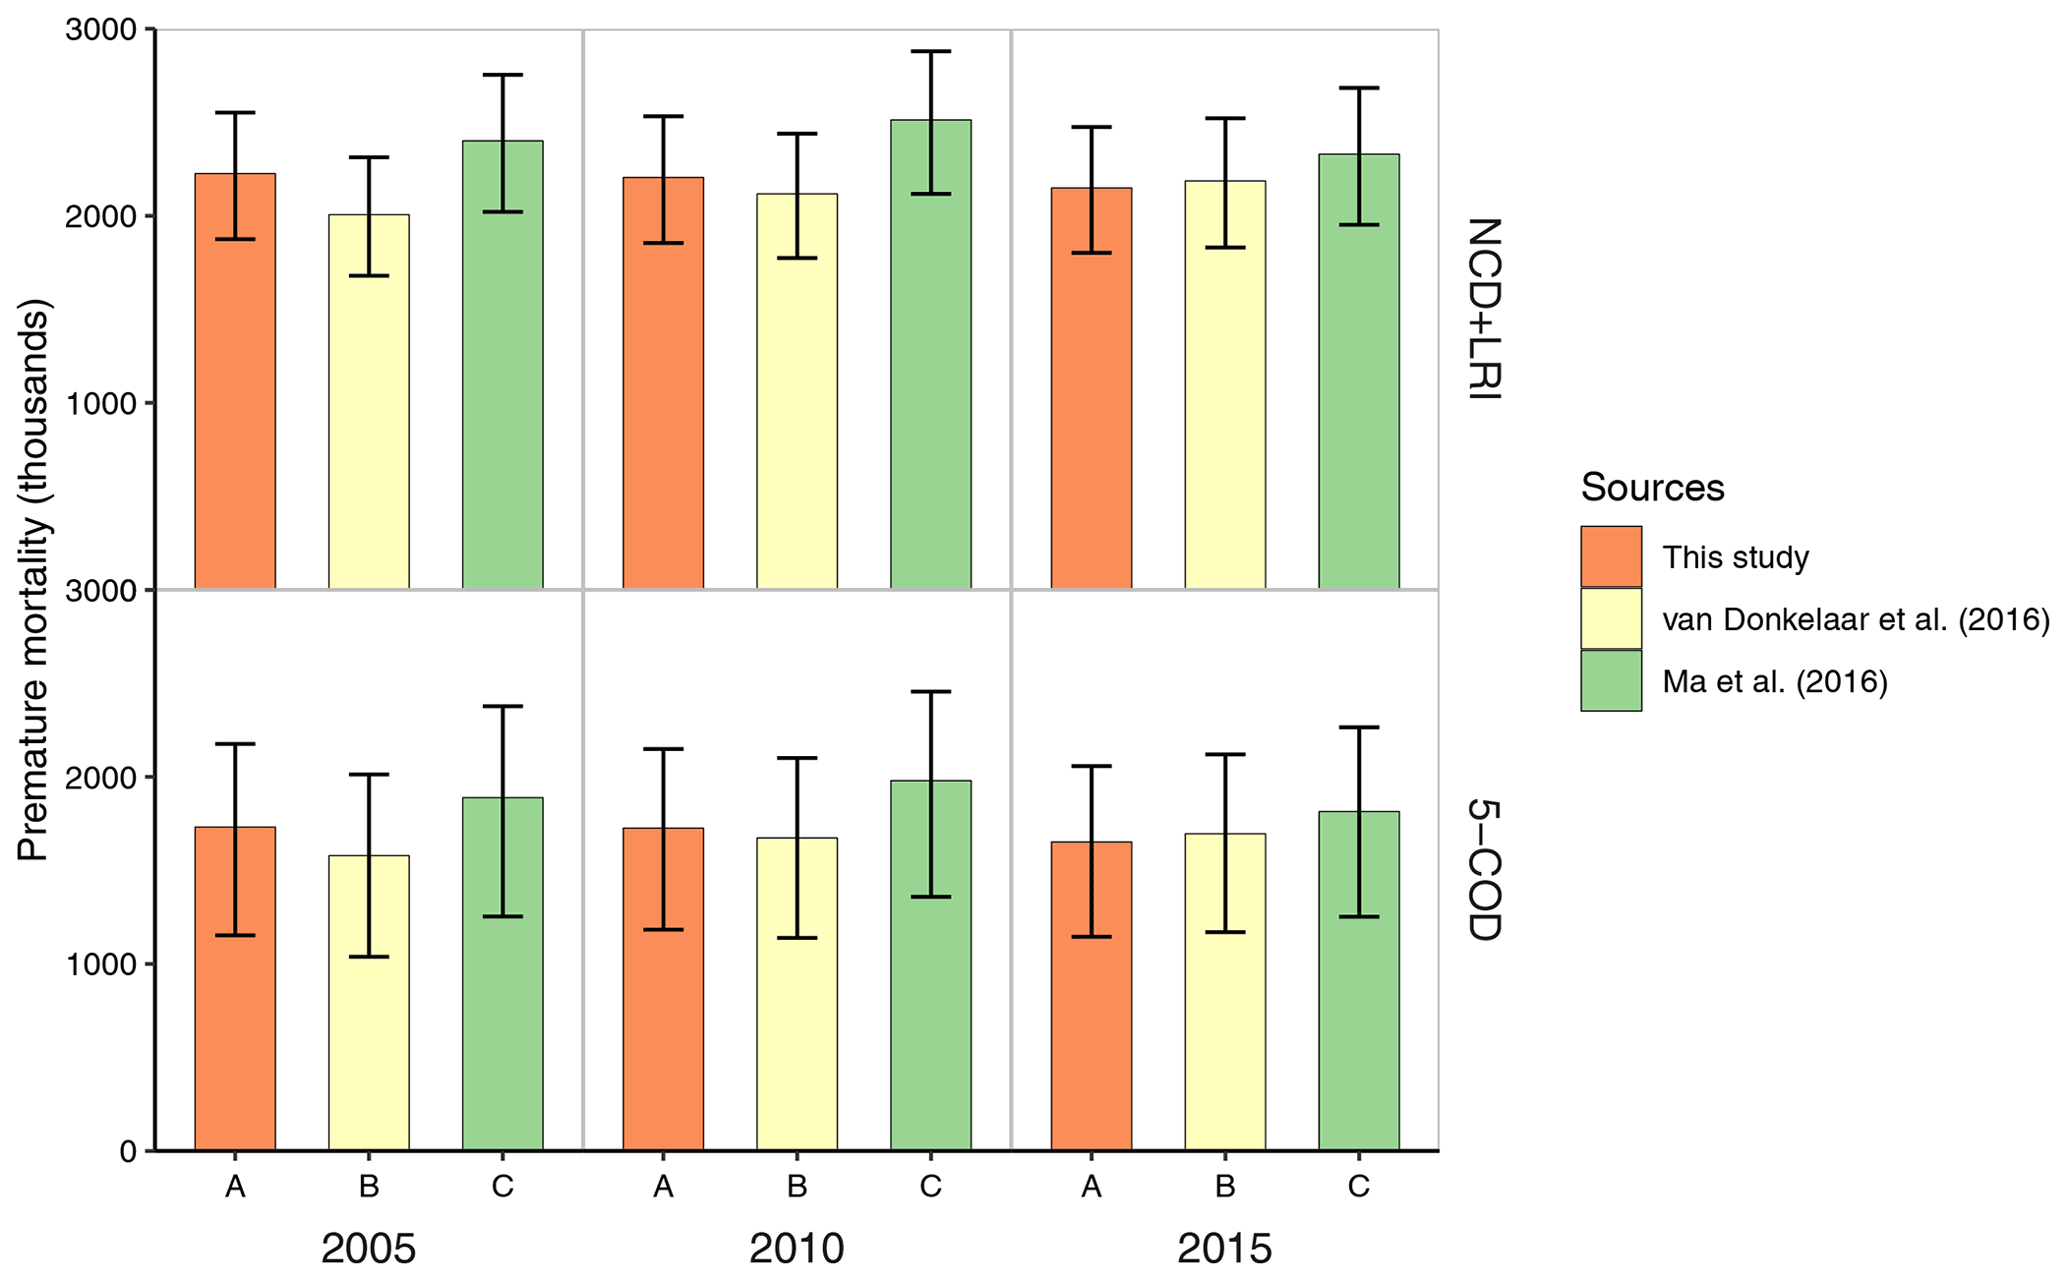
Figure 6National PM2.5-related premature mortality estimated by PM2.5 estimates from CMAQ simulations (this study) and satellite-based methods (thousands).
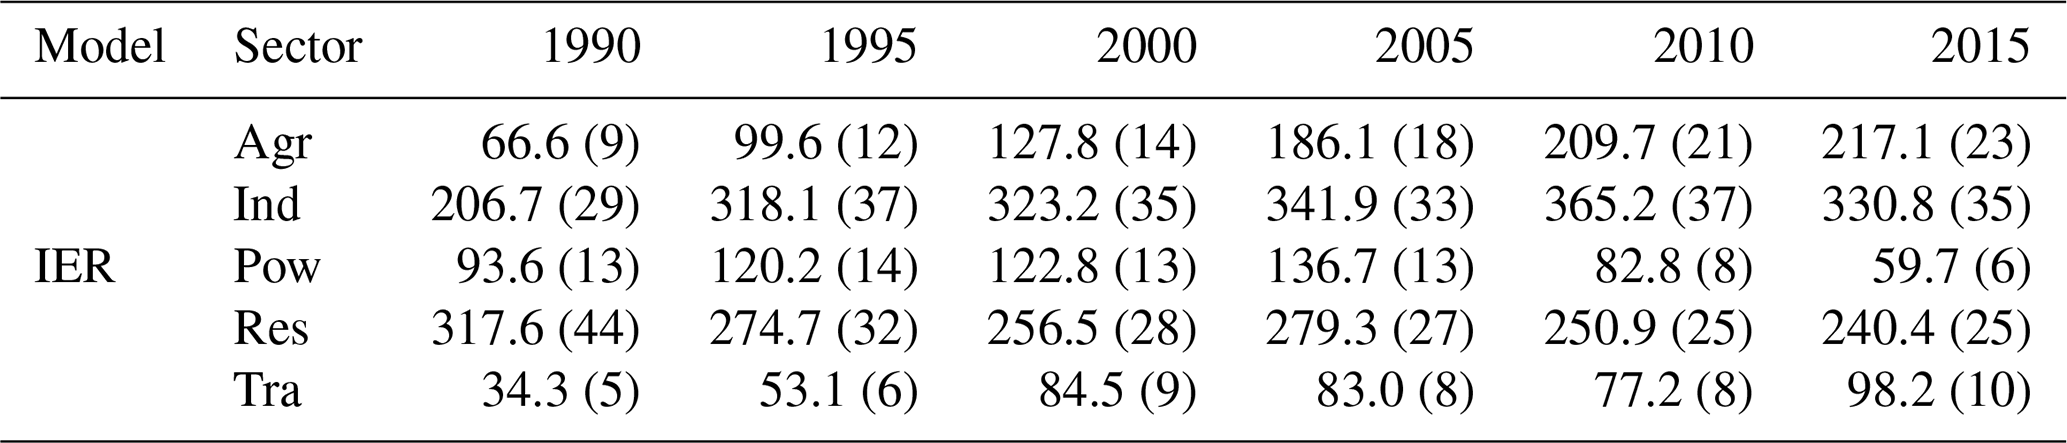
Second, the uncertainty in this study also stems from PM2.5 exposure–response functions. Globally, the excess mortality associated with PM2.5 air pollution in 2015 ranged from 4.2 million (Cohen et al., 2017) to 8.9 million (Burnett et al., 2018), depending on the choice of exposure–response functions. Burnett et al. (2018) constructed the up-to-date GEMM functions based only on cohort studies of outdoor air pollution which cover the global exposure range and estimated 2.47 million (GEMM NCD+LRI) and 1.95 million (GEMM 5-COD) deaths in China due to ambient PM2.5 exposure. Our calculation with the GEMM risk functions illustrated 2.10 million and 1.62 million excess deaths related to the anthropogenic PM2.5 exposure in 2015 by GEMM NCD+LRI and GEMM 5-COD functions. Our results were rather close to the estimates of Burnett et al. (2018) but prominently higher than the previous estimates of 0.87–1.37 million during 2010–2015 (Lelieveld et al., 2015; J. Liu et al., 2016b; Hu et al., 2017; Zheng et al., 2017, 2019), which applied the integrated exposure–response (IER) functions developed in the Global Burden of Disease (GBD) project (Burnett et al., 2014; Cohen et al., 2017). We conducted a sensitivity analysis by repeating the calculations with the IER risk functions used in GBD 2015 and estimated the anthropogenic PM2.5-related mortality in China in 2015 was 0.97 million (Table 4), which was close to the estimate of 0.87 million in 2015 by Zheng et al. (2019). The sensitivity analysis shows that different PM2.5 exposure–response functions exhibit large discrepancies in the estimates of PM2.5-related mortality, which calls for more additional cohort studies in China to improve the health risk models and narrow the gaps between different studies. However, since our study focuses more on the relative fraction of source contributions to the population-weighted PM2.5 and PM2.5-related mortality, the results and conclusions do not change no matter which version of exposure–response functions we choose.
Table 4PM2.5-related premature mortality contributed by the agricultural (Agr), industrial (Ind), power (Pow), residential (Res) and transportation (Tra) sectors. Estimated with IER risk function [unit: thousand (%)].
Third, uncertainties are also introduced by the meteorological conditions. In the study, we applied the NCEP-FNL meteorological data in 2000 to drive the WRF model for the years 1990 and 1995. Initially, we intended to combine the NCEP Climate Forecast System Reanalysis (NCEP-CFSR) for 1990–1995 and NCEP-FNL for 2000–2015, since the NCEP-CFSR was available before 2011 and the NCEP-FNL was available after 1999. However, when we ran the WRF-CMAQ model for the overlapping year 2000 with both products, we found the differences in the chemical composition of the population-weighted PM2.5 could be as high as 1.0 µg m−3, which may introduce extra bias into the trend of relative source contributions. Therefore, we applied the same meteorological product to drive the WRF model. To quantify the influence from the interannual variations in meteorological conditions, we carried out three sensitivity simulations with the same meteorology in year 2000 and the year-specific emissions in 2005, 2010, and 2015. The differences between the base and the sensitivity simulation denote the impacts of meteorology. It shows that the impacts of the interannual variations in meteorological conditions differ with regions and leads to an overall change in the population-weighted PM2.5 concentration below 5 %. The interannual changes in PM2.5 concentrations were dominated by the changes in emissions.
Fourth, uncertainties also arise from the uncertainties in the demographic factors. To present the long-term trends in PM2.5-related premature mortality, we utilized the year-specific national population age structure and the cause-specific mortality shared in GBD 2016 (Global Burden of Disease Collaborative Network, 2017a, b). However, there are substantial provincial heterogeneities in age structures and mortality due to differences in social economics, geographic distributions, and health services that were not studied in this work. The existing data from statistics and other sources are not sufficient to provide such details. Besides, the variations in different versions of GBD cause-specific mortality data may also introduce uncertainties into the short-term contributions of the demographic factors in the decomposition analysis. For example, it was estimated that the health benefits contributed by the decrease in baseline mortality rates ranged from 11 000 (Ding et al., 2019) to 32 000 (Yue et al., 2020) from national air pollution control actions for the period of 2013 to 2017, with the same exposure–response function utilized for the same study period. However, since our study mainly focuses on the trends of PM2.5 exposure and the transitions in relative source contributions, the adoption of different versions of GBD baseline mortality data will not change the major results and conclusions.
Finally, we differentiated the contributions from various source categories with a series of zero-out sensitivity simulations. To address the mass nonconservation resulting from the zero-out method, we normalized the sensitivity simulations to match the total PM2.5 concentrations in the standard simulation, which could introduce uncertainties. In fact, the zero-out method estimates the upper value for the contribution from gaseous precursors to secondary PM2.5, especially for the agricultural sector, where NH3 dominates most of the emissions. The agricultural contribution estimated in this study includes the nonagricultural nitrate. According to our estimation, the agricultural sector accounted for 21 %–23 % of the total premature mortality during 2010–2015, which is higher than the estimation (15 %) using the source-oriented CMAQ model (Hu et al., 2017) but lower than the estimation (32 %–35 %) that used the zero-out method in the global chemical transport model (Lelieveld et al., 2015) and the CMAQ model (Zheng et al., 2019; Table 3).
5.3 Policy implications
Ambient PM2.5 pollution contributed substantially to premature mortality in China. To mitigate air pollution problems, the government launched air quality regulations decades ago. The transition of source contributions calls for adjustments to how policy focuses on emission sectors.
Pronounced emission abatements have been achieved in the power sector. Recently, the penetration rates of FGD and SCR–SNCR systems have reached over 95 %, and in 2017 approximately 71 % of current power plants operated close to the level of “ultralow emission” (Zheng et al., 2018). Thus, the potential to reduce future emissions is limited in the power sector. Currently, industry is the largest contributor. To fulfill the air quality targets, a series of measures have been implemented in the industrial sector, including phasing out outdated capacity; strengthening emission standards; and eliminating small, high-polluting factories (Zheng et al., 2018). However, the industry sector still accounted for 35 % of the anthropogenic PM2.5-related premature mortality in 2015. Further reductions by the industrial sector are essential to achieving the air quality targets in the 13th FYP. The residential sector was once the largest contributor to PM2.5-related premature mortality, but its contribution has decreased over time. This decreasing trend was accelerated when millions of households switched from direct coal use to electricity and gas-fired heating during 2013–2017. The wider promotion of clean-fuel use in suburban and rural households promises to further reduce emissions from the residential sector.
Although emissions from the power, industrial, and residential sectors are decreasing, contributions from the transportation and agricultural sectors have gradually increased. Emissions from the transportation sector have stabilized in recent years because strengthened policy measures have counterbalanced the growing vehicle population. If there were no emission standards during 2000–2012, the vehicle emission levels in China would have increased by 2–6 times the levels measured in 2000 (Huo et al., 2015). Given that vehicle ownership per 1000 people in China is still much lower than that in developed countries, implementing more stringent standards and accelerating the phaseout of older high-emission vehicles are important to further reduce vehicle emissions. In fact, China is planning to implement the latest national VI emission standards for light-duty vehicles from 2020 and for diesel-fueled heavy-duty vehicles from 2021, which makes even larger emission reductions in the near future likely. Currently, the agricultural sector lacks mitigation policies, and growing NH3 emissions are predicted to grow in the future. The NH3 emissions growth will offset the air quality benefits from SO2 and NOx reductions (Wang et al., 2013) and pose challenges for future air quality management. Technologies to improve manure management and reduce ammonia applications in fields and optimizing human diets are potential strategies to mitigate ammonia emissions from the agricultural sector (Zhao et al., 2017). Thus, the emphasis of future mitigations should also be put on controlling vehicle and agricultural emissions.
Ambient PM2.5 pollution contributed substantially to premature mortality in China. In this study, we investigated the decadal changes in the anthropogenic source contribution of PM2.5 air pollution and related health impacts in China. Accompanied with the development of the economy and the implementation of environmental policies, the emissions of major air pollutants have changed dramatically during the past 25 years. The SO2, NOx, PM2.5, and NH3 emissions increased from 13.6, 6.4, 8.9, and 7.2 Mt in 1990 to 16.9, 23.7, 9.1, and 10.5 Mt in 2015, with peaks in 2005, 2010, 2005, and 2015, respectively. In response, the population-weighted PM2.5 concentration increased from 36.0 µg m−3 in 1990 to 63.5 µg m−3 in 2005 and then gradually decreased to 49.9 µg m−3 in 2015. We estimated that the total premature mortality attributable to anthropogenic PM2.5 with GEMM NCD+LRI functions rose from 1.26 million (95 % CI [1.05, 1.46]) in 1990 to 2.18 million (95 % CI [1.84, 2.50]) in 2005 and fell to 2.10 million (95 % CI [1.76, 2.42]) in 2015. Besides the influence of the changes in air quality, the reductions in baseline mortality rates contributed to the decrease in PM2.5-related mortality, while the population growth and aging contributed to the increases in PM2.5-related mortality.
Investigating the decadal transition in source contribution of PM2.5 air pollution and related premature mortality can help to evaluate the effectiveness of past efforts and provide important insights for prioritizing strategies in the future. We found that the contributions of various sectors to anthropogenic PM2.5-related premature mortality changed substantially during 1990–2015. In 1990, the residential sector was the leading source of PM2.5-related mortality (44 % of total) in China, followed by industry (29 %), power (13 %), agriculture (9 %), and transportation (5 %). Whereas in 2015, the industrial sector became the largest contributor (35 %), followed by the residential sector (25 %), agriculture (23 %), transportation (10 %), and power (6 %). Limited potential to further reduce emissions remains in the power sector after effective controls since 2005. The industrial and residential sectors are still the leading contributors to PM2.5-related premature mortality, despite their declining trends. The importance of the transportation and agricultural sectors are also highlighted with their continuously increasing contributions. Emphasis should be directed onto the last four sectors when planning future mitigations.
Data generated from this study are available from the corresponding author upon reasonable request.
The supplement related to this article is available online at: https://doi.org/10.5194/acp-20-7783-2020-supplement.
QZ conceived the study; CH, ML, XL, FL, DT, and BZ calculated emissions; JL, YZ, and RW conducted WRF-CMAQ simulations; GG conducted GEOS-Chem simulations; JL conducted estimates of health impacts; QZ, JL, YZ, and DT interpreted the data; JL and QZ prepared the manuscript with contributions from all coauthors.
The authors declare that they have no conflict of interest.
We acknowledge Aaron J. Cohen from the Health Effects Institute for sharing the IER 2015 parameters. We also acknowledge Randall V. Martin and Aaron van Donkelaar from Dalhousie University and Yang Liu from Emory University for sharing the satellite-based PM2.5 estimates. We are also grateful for the comments and the valuable suggestions of the anonymous reviewers.
This research has been supported by the National Key R&D program (grant no. 2016YFC0201506), the National Natural Science Foundation of China (grant nos. 41921005, 91744310, and 41625020), the Foundation for China Heavy Air Pollution Causes and Management (DQGG0302-03), Beijing Natural Science Foundation (grant no. 8192024), and China Postdoctoral Science Foundation (grant no. 2018M641382).
This paper was edited by Aijun Ding and reviewed by three anonymous referees.
Bey, I., Jacob, D. J., Yantosca, R. M., Logan, J. A., Field, B. D., Fiore, A. M., Li, Q., Liu, H. Y., Mickley, L. J., and Schultz, M. G.: Global modeling of tropospheric chemistry with assimilated meteorology: Model description and evaluation, J. Geophys. Res., 106, 23073–23095, https://doi.org/10.1029/2001JD000807, 2001.
Burnett, R., Chen, H., Szyszkowicz, M., Fann, N., Hubbell, B., Pope, C. A., Apte, J. S., Brauer, M., Cohen, A., Weichenthal, S., Coggins, J., Di, Q., Brunekreef, B., Frostad, J., Lim, S. S., Kan, H., Walker, K. D., Thurston, G. D., Hayes, R. B., Lim, C. C., Turner, M. C., Jerrett, M., Krewski, D., Gapstur, S. M., Diver, W. R., Ostro, B., Goldberg, D., Crouse, D. L., Martin, R. V., Peters, P., Pinault, L., Tjepkema, M., Donkelaar, A. van, Villeneuve, P. J., Miller, A. B., Yin, P., Zhou, M., Wang, L., Janssen, N. A. H., Marra, M., Atkinson, R. W., Tsang, H., Thach, T. Q., Cannon, J. B., Allen, R. T., Hart, J. E., Laden, F., Cesaroni, G., Forastiere, F., Weinmayr, G., Jaensch, A., Nagel, G., Concin, H., and Spadaro, J. V.: Global estimates of mortality associated with long-term exposure to outdoor fine particulate matter, P. Natl. Acad. Sci. USA, 115, 9592–9597, https://doi.org/10.1073/pnas.1803222115, 2018.
Burnett, R. T., Pope, C. A., Ezzati, M., Olives, C., Lim, S. S., Mehta, S., Shin, H. H., Singh, G., Hubbell, B., Brauer, M., Anderson, H. R., Smith, K. R., Balmes, J. R., Bruce, N. G., Kan, H. D., Laden, F., Pruss-Ustun, A., Michelle, C. T., Gapstur, S. M., Diver, W. R., and Cohen, A.: An Integrated Risk Function for Estimating the Global Burden of Disease Attributable to Ambient Fine Particulate Matter Exposure, Environ. Health Persp., 122, 397–403, 2014.
Chen, Y., Shen, H., Zhong, Q., Chen, H., Huang, T., Liu, J., Cheng, H., Zeng, E. Y., Smith, K. R., and Tao, S.: Transition of household cookfuels in China from 2010 to 2012, Appl. Energ., 184, 800–809, https://doi.org/10.1016/j.apenergy.2016.07.136, 2016.
Cheng, J., Su, J., Cui, T., Li, X., Dong, X., Sun, F., Yang, Y., Tong, D., Zheng, Y., Li, Y., Li, J., Zhang, Q., and He, K.: Dominant role of emission reduction in PM2.5 air quality improvement in Beijing during 2013–2017: a model-based decomposition analysis, Atmos. Chem. Phys., 19, 6125–6146, https://doi.org/10.5194/acp-19-6125-2019, 2019,
Cohen, A. J., Brauer, M., Burnett, R., Anderson, H. R., Frostad, J., Estep, K., Balakrishnan, K., Brunekreef, B., Dandona, L., Dandona, R., Feigin, V., Freedman, G., Hubbell, B., Jobling, A., Kan, H., Knibbs, L., Liu, Y., Martin, R., Morawska, L., Pope, C. A., Shin, H., Straif, K., Shaddick, G., Thomas, M., Dingenen, R. van, Donkelaar, A. van, Vos, T., Murray, C. J. L., and Forouzanfar, M. H.: Estimates and 25-year trends of the global burden of disease attributable to ambient air pollution: an analysis of data from the Global Burden of Diseases Study 2015, Lancet, 389, 1907–1918, https://doi.org/10.1016/S0140-6736(17)30505-6, 2017.
Ding, D., Xing, J., Wang, S., Liu, K., and Hao, J.: Estimated Contributions of Emissions Controls, Meteorological Factors, Population Growth, and Changes in Baseline Mortality to Reductions in Ambient PM2.5 and PM2.5-Related Mortality in China, 2013–2017, Environ Health Persp., 127, 067009, https://doi.org/10.1289/EHP4157, 2019.
Doxsey-Whitfield, E., MacManus, K., Adamo, S. B., Pistolesi, L., Squires, J., Borkovska, O., and Baptista, S. R.: Taking Advantage of the Improved Availability of Census Data: A First Look at the Gridded Population of the World, Version 4, Papers in Applied Geography, 1, 226–234, https://doi.org/10.1080/23754931.2015.1014272, 2015.
Fountoukis, C. and Nenes, A.: ISORROPIA II: a computationally efficient thermodynamic equilibrium model for K+–Ca2+–Mg2+––Na+–––Cl−–H2O aerosols, Atmos. Chem. Phys., 7, 4639–4659, https://doi.org/10.5194/acp-7-4639-2007, 2007.
GBD 2015 Risk Factors Collaborators: Global, regional, and national comparative risk assessment of 79 behavioural, environmental and occupational, and metabolic risks or clusters of risks, 1990–2015: a systematic analysis for the Global Burden of Disease Study 2015, Lancet, 388, 1659–1724, https://doi.org/10.1016/S0140-6736(16)31679-8, 2016.
Global Burden of Disease Collaborative Network: Global Burden of Disease Study 2016 (GBD 2016) Cause-Specific Mortality 1980–2016, Institute for Health Metrics and Evaluation (IHME), Seattle, United States, 2017a.
Global Burden of Disease Collaborative Network: Global Burden of Disease Study 2016 (GBD 2016) Population Estimates 1950–2016, Institute for Health Metrics and Evaluation (IHME), Seattle, USA, 2017b.
Gu, Y., Wong, T. W., Law, C. K., Dong, G. H., Ho, K. F., Yang, Y., and Yim, S. H. L.: Impacts of sectoral emissions in China and the implications: air quality, public health, crop production, and economic costs, Environ. Res. Lett., 13, 084008, https://doi.org/10.1088/1748-9326/aad138, 2018.
Guenther, A. B., Jiang, X., Heald, C. L., Sakulyanontvittaya, T., Duhl, T., Emmons, L. K., and Wang, X.: The Model of Emissions of Gases and Aerosols from Nature version 2.1 (MEGAN2.1): an extended and updated framework for modeling biogenic emissions, Geosci. Model Dev., 5, 1471–1492, https://doi.org/10.5194/gmd-5-1471-2012, 2012.
Hu, J., Huang, L., Chen, M., Liao, H., Zhang, H., Wang, S., Zhang, Q., and Ying, Q.: Premature Mortality Attributable to Particulate Matter in China: Source Contributions and Responses to Reductions, Environ. Sci. Technol., 51, 9950–9959, https://doi.org/10.1021/acs.est.7b03193, 2017.
Huo, H., Zheng, B., Wang, M., Zhang, Q., and He, K.-B.: Vehicular air pollutant emissions in China: evaluation of past control policies and future perspectives, Mitig. Adapt. Strat. Gl., 20, 719–733, https://doi.org/10.1007/s11027-014-9613-0, 2015.
Krotkov, N. A., McLinden, C. A., Li, C., Lamsal, L. N., Celarier, E. A., Marchenko, S. V., Swartz, W. H., Bucsela, E. J., Joiner, J., Duncan, B. N., Boersma, K. F., Veefkind, J. P., Levelt, P. F., Fioletov, V. E., Dickerson, R. R., He, H., Lu, Z., and Streets, D. G.: Aura OMI observations of regional SO2 and NO2 pollution changes from 2005 to 2015, Atmos. Chem. Phys., 16, 4605–4629, https://doi.org/10.5194/acp-16-4605-2016, 2016.
Lelieveld, J., Evans, J. S., Fnais, M., Giannadaki, D., and Pozzer, A.: The contribution of outdoor air pollution sources to premature mortality on a global scale, Nature, 525, 367–371, https://doi.org/10.1038/nature15371, 2015.
Li, C., Martin, R. V., van Donkelaar, A., Boys, B. L., Hammer, M. S., Xu, J.-W., Marais, E. A., Reff, A., Strum, M., Ridley, D. A., Crippa, M., Brauer, M., and Zhang, Q.: Trends in Chemical Composition of Global and Regional Population-Weighted Fine Particulate Matter Estimated for 25 Years, Environ. Sci. Technol., 51, 11185–11195, https://doi.org/10.1021/acs.est.7b02530, 2017.
Li, M., Zhang, Q., Streets, D. G., He, K. B., Cheng, Y. F., Emmons, L. K., Huo, H., Kang, S. C., Lu, Z., Shao, M., Su, H., Yu, X., and Zhang, Y.: Mapping Asian anthropogenic emissions of non-methane volatile organic compounds to multiple chemical mechanisms, Atmos. Chem. Phys., 14, 5617–5638, https://doi.org/10.5194/acp-14-5617-2014, 2014.
Li, M., Liu, H., Geng, G., Hong, C., Liu, F., Song, Y., Tong, D., Zheng, B., Cui, H., Man, H., Zhang, Q., and He, K.: Anthropogenic emission inventories in China: a review, Natl. Sci. Rev., 4, 834–866, https://doi.org/10.1093/nsr/nwx150, 2017a.
Li, M., Zhang, Q., Kurokawa, J.-I., Woo, J.-H., He, K., Lu, Z., Ohara, T., Song, Y., Streets, D. G., Carmichael, G. R., Cheng, Y., Hong, C., Huo, H., Jiang, X., Kang, S., Liu, F., Su, H., and Zheng, B.: MIX: a mosaic Asian anthropogenic emission inventory under the international collaboration framework of the MICS-Asia and HTAP, Atmos. Chem. Phys., 17, 935–963, https://doi.org/10.5194/acp-17-935-2017, 2017b.
Li, X., Zhang, Q., Zhang, Y., Zheng, B., Wang, K., Chen, Y., Wallington, T. J., Han, W., Shen, W., Zhang, X., and He, K.: Source contributions of urban PM2.5 in the Beijing–Tianjin–Hebei region: Changes between 2006 and 2013 and relative impacts of emissions and meteorology, Atmos. Environ., 123, 229–239, https://doi.org/10.1016/j.atmosenv.2015.10.048, 2015.
Lim, S. S., Vos, T., Flaxman, A. D., et al.: A comparative risk assessment of burden of disease and injury attributable to 67 risk factors and risk factor clusters in 21 regions, 1990–2010: a systematic analysis for the Global Burden of Disease Study 2010, Lancet, 380, 2224–2260, 2012.
Liu, F., Zhang, Q., Tong, D., Zheng, B., Li, M., Huo, H., and He, K. B.: High-resolution inventory of technologies, activities, and emissions of coal-fired power plants in China from 1990 to 2010, Atmos. Chem. Phys., 15, 13299–13317, https://doi.org/10.5194/acp-15-13299-2015, 2015.
Liu, F., Zhang, Q., A, R. J. van der, Zheng, B., Tong, D., Yan, L., Zheng, Y., and He, K.: Recent reduction in NOx emissions over China: synthesis of satellite observations and emission inventories, Environ. Res. Lett., 11, 114002, https://doi.org/10.1088/1748-9326/11/11/114002, 2016.
Liu, J., Mauzerall, D. L., Chen, Q., Zhang, Q., Song, Y., Peng, W., Klimont, Z., Qiu, X., Zhang, S., Hu, M., Lin, W., Smith, K. R., and Zhu, T.: Air pollutant emissions from Chinese households: A major and underappreciated ambient pollution source, P. Natl. Acad. Sci. USA, 113, 7756–7761, 2016a.
Liu, J., Han, Y., Tang, X., Zhu, J., and Zhu, T.: Estimating adult mortality attributable to PM2.5 exposure in China with assimilated PM2.5 concentrations based on a ground monitoring network, Sci. Total Environ., 568, 1253–1262, https://doi.org/10.1016/j.scitotenv.2016.05.165, 2016b.
Lu, Z., Zhang, Q., and Streets, D. G.: Sulfur dioxide and primary carbonaceous aerosol emissions in China and India, 1996–2010, Atmos. Chem. Phys., 11, 9839–9864, https://doi.org/10.5194/acp-11-9839-2011, 2011.
Ma, Q., Cai, S., Wang, S., Zhao, B., Martin, R. V., Brauer, M., Cohen, A., Jiang, J., Zhou, W., Hao, J., Frostad, J., Forouzanfar, M. H., and Burnett, R. T.: Impacts of coal burning on ambient PM2.5 pollution in China, Atmos. Chem. Phys., 17, 4477–4491, https://doi.org/10.5194/acp-17-4477-2017, 2017.
Ma, Z., Hu, X., Sayer, A. M., Levy, R., Zhang, Q., Xue, Y., Tong, S., Bi, J., Huang, L., and Liu, Y.: Satellite-Based Spatiotemporal Trends in PM2.5 Concentrations: China, 2004–2013, Environ. Health Persp., 124, 184–192, https://doi.org/10.1289/ehp.1409481, 2016.
National Bureau of Statistics: China Statistical Yearbook, China Statistics Press, Beijing, 2016.
Reddington, C. L., Conibear, L., Knote, C., Silver, B. J., Li, Y. J., Chan, C. K., Arnold, S. R., and Spracklen, D. V.: Exploring the impacts of anthropogenic emission sectors on PM2.5 and human health in South and East Asia, Atmos. Chem. Phys., 19, 11887–11910, https://doi.org/10.5194/acp-19-11887-2019, 2019.
Seinfeld, J. H. and Pandis, S. N.: Atmospheric Chemistry and Physics: From Air Pollution to Climate Change, 2nd edn., John Wiley & Sons, New Jersey, 2006.
Shen, H., Tao, S., Chen, Y., Ciais, P., Güneralp, B., Ru, M., Zhong, Q., Yun, X., Zhu, X., Huang, T., Tao, W., Chen, Y., Li, B., Wang, X., Liu, W., Liu, J., and Zhao, S.: Urbanization-induced population migration has reduced ambient PM2.5 concentrations in China, Sci. Adv., 3, e1700300, https://doi.org/10.1126/sciadv.1700300, 2017.
van der A, R. J., Mijling, B., Ding, J., Koukouli, M. E., Liu, F., Li, Q., Mao, H., and Theys, N.: Cleaning up the air: effectiveness of air quality policy for SO2 and NOx emissions in China, Atmos. Chem. Phys., 17, 1775–1789, https://doi.org/10.5194/acp-17-1775-2017, 2017.
van Donkelaar, A., Martin, R. V., Brauer, M., Hsu, N. C., Kahn, R. A., Levy, R. C., Lyapustin, A., Sayer, A. M., and Winker, D. M.: Global Estimates of Fine Particulate Matter using a Combined Geophysical-Statistical Method with Information from Satellites, Models, and Monitors, Environ. Sci. Technol., 50, 3762–3772, https://doi.org/10.1021/acs.est.5b05833, 2016.
Wang, S., Li, G., Gong, Z., Du, L., Zhou, Q., Meng, X., Xie, S., and Zhou, L.: Spatial distribution, seasonal variation and regionalization of PM2.5 concentrations in China, Sci. China Chem., 58, 1435–1443, https://doi.org/10.1007/s11426-015-5468-9, 2015.
Wang, Y., Zhang, Q. Q., He, K., Zhang, Q., and Chai, L.: Sulfate-nitrate-ammonium aerosols over China: response to 2000–2015 emission changes of sulfur dioxide, nitrogen oxides, and ammonia, Atmos. Chem. Phys., 13, 2635–2652, https://doi.org/10.5194/acp-13-2635-2013, 2013.
Wang, Y., Ying, Q., Hu, J., and Zhang, H.: Spatial and temporal variations of six criteria air pollutants in 31 provincial capital cities in China during 2013–2014, Environ. Int., 73, 413–422, https://doi.org/10.1016/j.envint.2014.08.016, 2014.
Whitten, G. Z., Heo, G., Kimura, Y., McDonald-Buller, E., Allen, D. T., Carter, W. P. L., and Yarwood, G.: A new condensed toluene mechanism for Carbon Bond: CB05-TU, Atmos. Environ., 44, 5346–5355, https://doi.org/10.1016/j.atmosenv.2009.12.029, 2010.
World Bank: Cost of Pollution in China: Economic Estimates of Physical Damages, available at: http://documents.worldbank.org/curated/en/782171468027560055/Cost-of-pollution-in-China-economic-estimates-of-physical-damages (last access: 16 September 2019), 2007.
World Bank: The cost of air pollution: strengthening the economic case for action, available at: http://documents.worldbank.org/curated/en/781521473177013155/The-cost-of-air-pollution-strengthening-the-economic-case-for-action (last access: 16 September 2019), 2016.
Xing, J., Mathur, R., Pleim, J., Hogrefe, C., Gan, C.-M., Wong, D. C., Wei, C., Gilliam, R., and Pouliot, G.: Observations and modeling of air quality trends over 1990–2010 across the Northern Hemisphere: China, the United States and Europe, Atmos. Chem. Phys., 15, 2723–2747, https://doi.org/10.5194/acp-15-2723-2015, 2015.
Xue, T., Zheng, Y., Geng, G., Zheng, B., Jiang, X., Zhang, Q., and He, K.: Fusing Observational, Satellite Remote Sensing and Air Quality Model Simulated Data to Estimate Spatiotemporal Variations of PM2.5 Exposure in China, Remote Sens., 9, 221, https://doi.org/10.3390/rs9030221, 2017.
Xue, T., Liu, J., Zhang, Q., Geng, G., Zheng, Y., Tong, D., Liu, Z., Guan, D., Bo, Y., Zhu, T., He, K., and Hao, J.: Rapid improvement of PM2.5 pollution and associated health benefits in China during 2013–2017, Sci. China Earth Sci., 62, 1847–1856, https://doi.org/10.1007/s11430-018-9348-2, 2019.
Yang, G. H., Wang, Y., Zeng, Y. X., Gao, G. F., Liang, X. F., Zhou, M. G., Wan, X., Yu, S. C., Jiang, Y. H., Naghavi, M., Vos, T., Wang, H. D., Lopez, A. D., and Murray, C. J. L.: Rapid health transition in China, 1990–2010: findings from the Global Burden of Disease Study 2010, Lancet, 381, 1987–2015, 2013.
Yue, H., He, C., Huang, Q., Yin, D., and Bryan, B. A.: Stronger policy required to substantially reduce deaths from PM2.5 pollution in China, Nat. Commun., 11, 1462, https://doi.org/10.1038/s41467-020-15319-4, 2020.
Zhang, Q., He, K., and Huo, H.: Policy: Cleaning China's air, Nature, 484, 161–162, https://doi.org/10.1038/484161a, 2012.
Zhang, Y.-L. and Cao, F.: Fine particulate matter (PM2.5) in China at a city level, Sci. Rep., 5, 14884, https://doi.org/10.1038/srep14884, 2015.
Zhao, B., Wang, S. X., Liu, H., Xu, J. Y., Fu, K., Klimont, Z., Hao, J. M., He, K. B., Cofala, J., and Amann, M.: NOx emissions in China: historical trends and future perspectives, Atmos. Chem. Phys., 13, 9869–9897, https://doi.org/10.5194/acp-13-9869-2013, 2013.
Zhao, Z. Q., Bai, Z. H., Winiwarter, W., Kiesewetter, G., Heyes, C., and Ma, L.: Mitigating ammonia emission from agriculture reduces PM2.5 pollution in the Hai River Basin in China, Sci. Total Environ., 609, 1152–1160, https://doi.org/10.1016/j.scitotenv.2017.07.240, 2017.
Zheng, B., Huo, H., Zhang, Q., Yao, Z. L., Wang, X. T., Yang, X. F., Liu, H., and He, K. B.: High-resolution mapping of vehicle emissions in China in 2008, Atmos. Chem. Phys., 14, 9787–9805, https://doi.org/10.5194/acp-14-9787-2014, 2014.
Zheng, B., Tong, D., Li, M., Liu, F., Hong, C., Geng, G., Li, H., Li, X., Peng, L., Qi, J., Yan, L., Zhang, Y., Zhao, H., Zheng, Y., He, K., and Zhang, Q.: Trends in China's anthropogenic emissions since 2010 as the consequence of clean air actions, Atmos. Chem. Phys., 18, 14095–14111, https://doi.org/10.5194/acp-18-14095-2018, 2018.
Zheng, G. J., Duan, F. K., Su, H., Ma, Y. L., Cheng, Y., Zheng, B., Zhang, Q., Huang, T., Kimoto, T., Chang, D., Pöschl, U., Cheng, Y. F., and He, K. B.: Exploring the severe winter haze in Beijing: the impact of synoptic weather, regional transport and heterogeneous reactions, Atmos. Chem. Phys., 15, 2969–2983, https://doi.org/10.5194/acp-15-2969-2015, 2015.
Zheng, H., Zhao, B., Wang, S., Wang, T., Ding, D., Chang, X., Liu, K., Xing, J., Dong, Z., Aunan, K., Liu, T., Wu, X., Zhang, S., and Wu, Y.: Transition in source contributions of PM2.5 exposure and associated premature mortality in China during 2005–2015, Environ. Int., 132, 105111, https://doi.org/10.1016/j.envint.2019.105111, 2019.
Zheng, Y., Xue, T., Zhang, Q., Geng, G., Tong, D., Li, X., and He, K.: Air quality improvements and health benefits from China's clean air action since 2013, Environ. Res. Lett., 12, 114020, https://doi.org/10.1088/1748-9326/aa8a32, 2017.