the Creative Commons Attribution 4.0 License.
the Creative Commons Attribution 4.0 License.
 | 02 Jul 2020
Atmospheric mercury in the Southern Hemisphere – Part 1: Trend and inter-annual variations in atmospheric mercury at Cape Point, South Africa, in 2007–2017, and on Amsterdam Island in 2012–2017
Franz Slemr
Lynwill Martin
Casper Labuschagne
Thumeka Mkololo
Hélène Angot
Olivier Magand
Aurélien Dommergue
Philippe Garat
Michel Ramonet
Johannes Bieser
The Minamata Convention on Mercury (Hg) entered into force in 2017, committing its 116 parties (as of January 2019) to curb anthropogenic emissions. Monitoring of atmospheric concentrations and trends is an important part of the effectiveness evaluation of the convention. A few years ago (in 2017) we reported an increasing trend in atmospheric Hg concentrations at the Cape Point Global Atmosphere Watch (GAW) station in South Africa (34.3535∘ S, 18.4897∘ E) for the 2007–2015 period. With 2 more years of measurements at Cape Point and the 2012–2017 data from Amsterdam Island (37.7983∘ S, 77.5378∘ E) in the remote southern Indian Ocean, a more complex picture emerges: at Cape Point the upward trend for the 2007–2017 period is still significant, but no trend or a slightly downward trend was detected for the period 2012–2017 at both Cape Point and Amsterdam Island. The upward trend at Cape Point is driven mainly by the Hg concentration minimum in 2009 and maxima in 2014 and 2012. Using ancillary data on 222Rn, CO, O3, CO2, and CH4 from Cape Point and Amsterdam Island, the possible reasons for the trend and its change are investigated. In a companion paper this analysis is extended for the Cape Point station by calculations of source and sink regions using backward-trajectory analysis.
- Article
(1696 KB) - Full-text XML
- Companion paper
-
Supplement
(699 KB) - BibTeX
- EndNote


Mercury (Hg) is an environmental toxicant emitted by both natural and anthropogenic sources – the latter regulated by the Minamata Convention. This convention, which entered into force in August 2017, requires periodic effectiveness evaluation (Article 22) to ensure that it meets its objectives. This evaluation will be based on a combination of Hg monitoring data, including levels of Hg and Hg compounds in air, biota, and humans. A few years ago, we reported an upward trend in atmospheric mercury concentrations at the Cape Point Global Atmosphere Watch (GAW) station at Cape Point (CPT; 34.3535∘ S, 18.4897∘ E) in South Africa for the 2007–2015 period (Martin et al., 2017). An upward trend was surprising because manual mercury measurements at the same site in 1995–2004 showed a downward trend. Downward trends in atmospheric mercury concentrations and in mercury wet deposition have also been reported for many sites in the Northern Hemisphere (Temme et al., 2007; Cole et al., 2014; Steffen et al., 2015; Weigelt et al., 2015; Weiss-Penzias et al., 2016; Marumoto et al., 2019), but Cape Point has been the only station in the Southern Hemisphere with a long-enough mercury concentration record to calculate trends. The northern hemispheric downward trend has been attributed to decreasing emissions from the North Atlantic Ocean due to decreasing mercury concentrations in subsurface water (Soerensen et al., 2012) and more recently to decreasing global anthropogenic emissions mainly due to the decline in mercury release from commercial products and the changes in Hg0 and Hg2+ speciation in flue gas of coal-fired utilities after implementation of NOx and SO2 emission controls (Zhang et al., 2016). Mercury uptake by terrestrial vegetation has also been recently proposed as contributing to the downward trend (Jiskra et al., 2018).
In the meantime, mercury measurements at several other sites in the Southern Hemisphere have become available (Sprovieri et al., 2016, 2017). Atmospheric mercury is quite uniformly distributed throughout the Southern Hemisphere (Slemr et al., 2015), and its concentrations (∼1.0 ng m−3) are substantially lower than those found at remote sites in the Northern Hemisphere (∼1.4 ng m−3; Sprovieri et al., 2016). Contrary to a pronounced seasonal variation with a maximum in early spring and a minimum in autumn in the Northern Hemisphere (Sprovieri et al., 2016), hardly any seasonal variation has been observed at Cape Point and Amsterdam Island (Slemr et al., 2015). The absence of a pronounced seasonal variation in the Southern Hemisphere has been recently attributed to mercury uptake by the terrestrial vegetation which, due to land distribution, is smaller in the Southern Hemisphere (Jiskra et al., 2018).
In this paper we analyse the Cape Point (CPT) data for the 2007–2017 period and compare them with the data from Amsterdam Island (AMS) obtained in the years 2012–2017. Mercury concentrations remain nearly constant at both sites during the 2012–2017 period. Using simultaneously measured 222Rn, CO, O3, CO2, and CH4 concentrations at CPT and AMS, we investigate the possible reasons for the trend and its change.
The locations of the Cape Point (CPT) and Amsterdam Island (AMS) stations are shown in Fig. 1. The Cape Point station (CPT; 34.3535∘ S, 18.4897∘ E) is located on the southern tip of the Cape Peninsula within the Cape Point National Park at the summit of a 230 m a.s.l. peak about 60 km south of Cape Town. The site is operated as one of the Global Atmosphere Watch (GAW) baseline monitoring observatories of the World Meteorological Organization (WMO) by the South African Weather Service, and its current continuous measurements include Hg, CO, O3, CH4, CO2, 222Rn, N2O, several halocarbons, particles, and meteorological parameters (Martin et al., 2017).
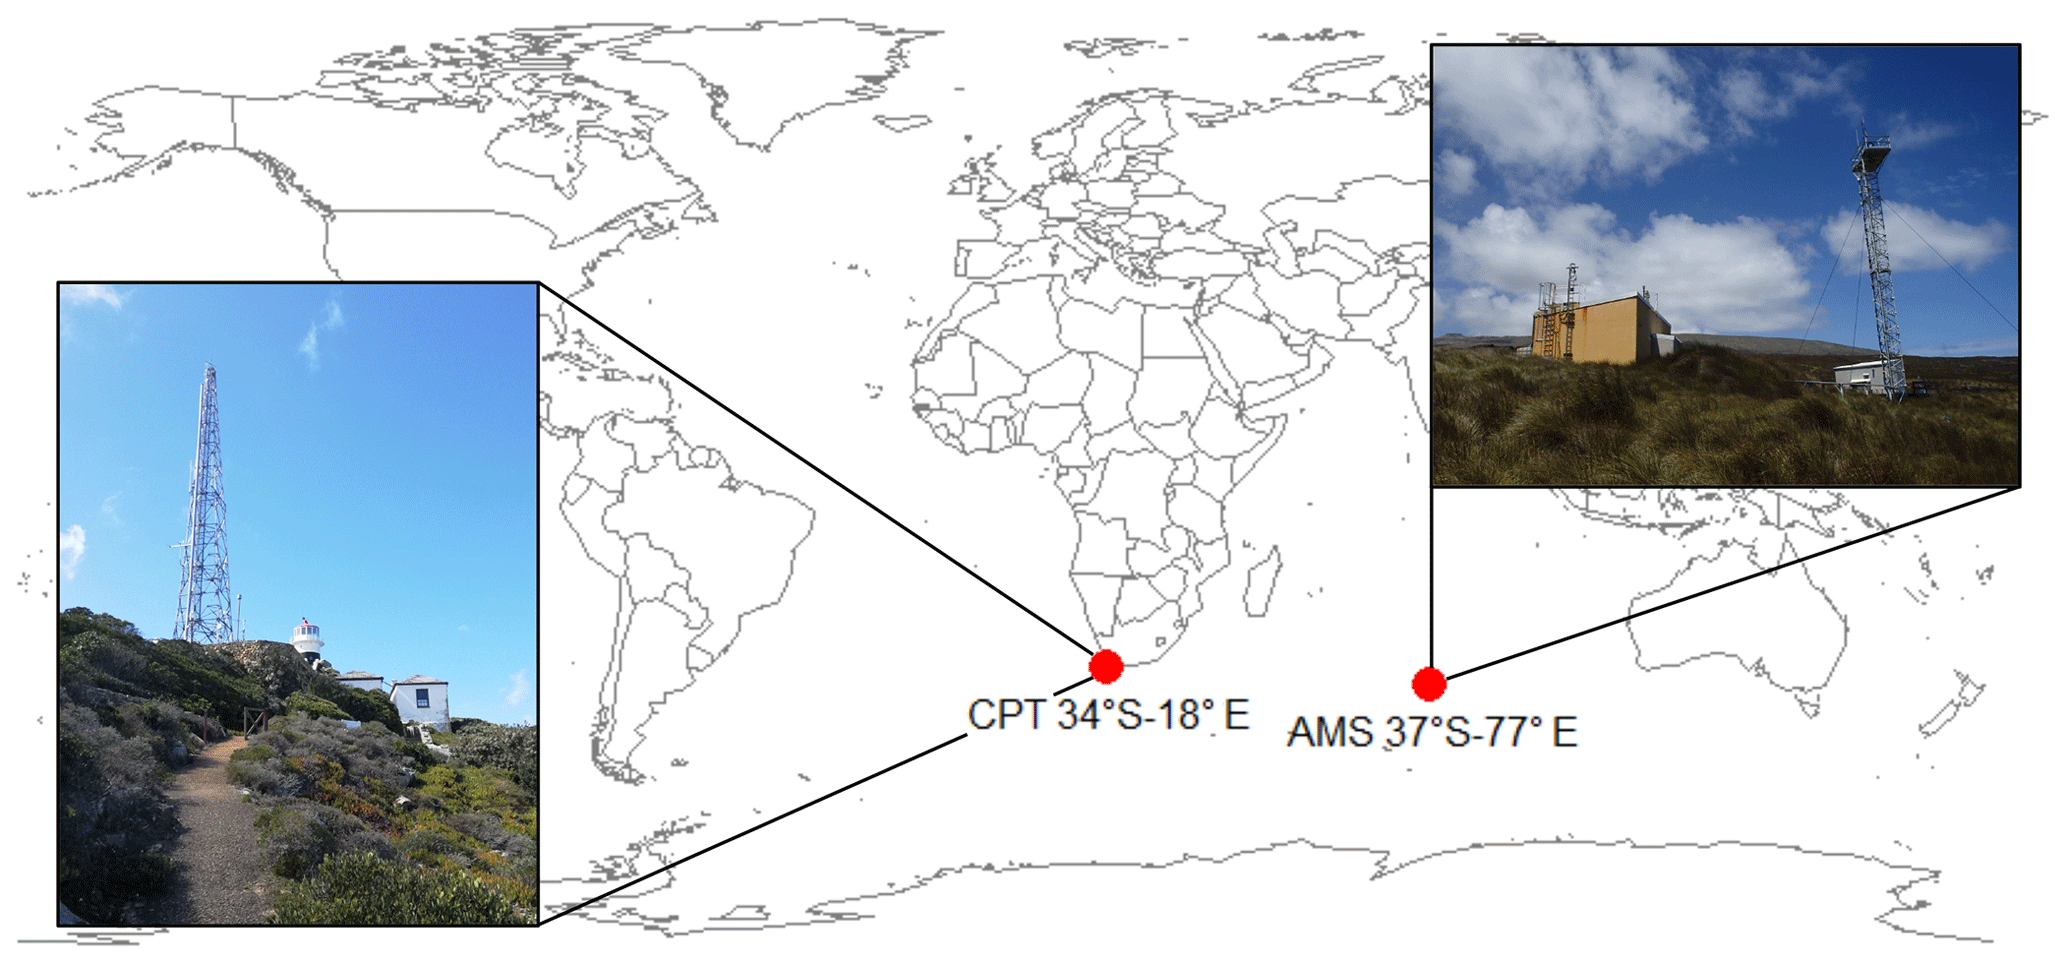
Figure 1Location of the Cape Point (CPT) and Amsterdam Island (AMS) stations.
Amsterdam Island (AMS; 37.7983∘ S, 77.5378∘ E) is a small island (55 km2) in the southern Indian Ocean, 3400 and 5000 km downwind of Madagascar and South Africa, respectively. The station is located at Pointe Bénédicte, at the northwest end of the island at an altitude of 55 m a.s.l. Labelled a GAW WMO global site, the Amsterdam site hosts instruments occurring in the framework of the French national observation service named ICOS-France Atmosphère and of the Global Observation System for Mercury (GOS4M), for long-term monitoring of greenhouse gases and mercury species, respectively. The site is under the administration of Terres Australes et Antarctiques Françaises (TAAF), the French Southern and Antarctic Lands, and scientifically operated by the French Polar Institute (IPEV). Currently, CO, O3, CO2, CH4, 222Rn, total aerosol number, carbonaceous aerosol, and meteorological parameters are continuously monitored at the site (Angot et al., 2014).
Atmospheric mercury has been measured since March 2007 at CPT and since January 2012 at AMS using Tekran 2537 (Tekran Inc., Toronto, Canada) at both sites. The instruments are based on mercury enrichment on a gold cartridge, followed by a thermal desorption and a detection by cold vapour atomic fluorescence spectroscopy (CVAFS). Switching between two cartridges allows for alternating sampling and desorption and thus results in a full temporal coverage of the mercury measurement. The instruments are automatically calibrated every 25 h at CPT and every 69 h at AMS using internal mercury permeation sources which in turn are annually checked by manual injections of saturated Hg vapour from a temperature-controlled vessel. To ensure the comparability of the mercury measurements, Tekran instruments at both sites have been operated according to the Global Mercury Observation System (GMOS) standard operating procedures (SOPs; Munthe et al., 2011).
The instrument at CPT has been operated with a 15 min resolution since March 2007. At AMS, a Tekran speciation unit (Tekran 1130 and 1135) coupled to a Tekran 2537B analyser (Tekran Inc. Toronto, Canada) was in operation from January 2012 until 10 December 2015. Gaseous elemental mercury (GEM) was measured with a 5 min resolution during this period. Concentrations of gaseous oxidised mercury (GOM) and particulate mercury (PM) were below the detection limit for most of the time (Angot et al., 2014). Consequently, only GEM has been continuously measured with a Tekran 2537A/B analyser since 14 December 2015, with a resolution of 15 min as at Cape Point, while GOM and PM species continued to be collected on cation exchange membrane filters at weekly frequencies.
With GEM concentrations of ∼1 ng m−3 and a sampling flow rate of 1 L min−1 (STP), mercury loads on gold cartridges are ∼5 pg and ∼15 pg with 5 and 15 min long sampling, respectively. A measurement bias with loads <10 ng m−3 due to an internal Tekran integration procedure (Swartzendruber et al., 2009; Slemr et al., 2016a; Ambrose, 2017) can impair comparability of the measurements made with a 5 min resolution with those made with a 15 min resolution. The possible bias of the measurements at AMS in 2012–2015 was eliminated by optimising the integration parameters (Swartzendruber et al., 2009). The absence of bias was shown by calculating the monthly variation coefficients of the 5 and the 15 min measurements at AMS. The average monthly variation coefficients were 5.81±2.15 % (n=48) and 5.83±1.48 % (n=24) for the 5 and 15 min resolutions, respectively, and they are statistically not distinguishable. We thus conclude that the measurements at AMS with a 5 min resolution are comparable to those with a 15 min resolution.
3.1 Seasonal variation
Figure 2 shows seasonal GEM variations at CPT (panel a) and AMS (panel b). They were calculated by the averaging of monthly medians over the period of 2012–2017. Similar plots were obtained by the averaging of monthly averages in the same period. The amplitude of the seasonal variation at AMS is with >0.1 ng m−3 somewhat larger than at CPT (∼0.08 ng m−3). The standard deviations of monthly average concentrations are larger at CPT than at AMS, indicating higher inter-annual variation at CPT. Smaller standard deviations at AMS enable the detection of significant differences between the months with the highest (June, July, and August) and the lowest (November, February, and October) three GEM concentrations. GEM concentrations in December and January lie outside an otherwise nearly sinusoidal seasonal variation, but their differences to GEM averages in other months are not significant. No significant differences between monthly averages at CPT were found.
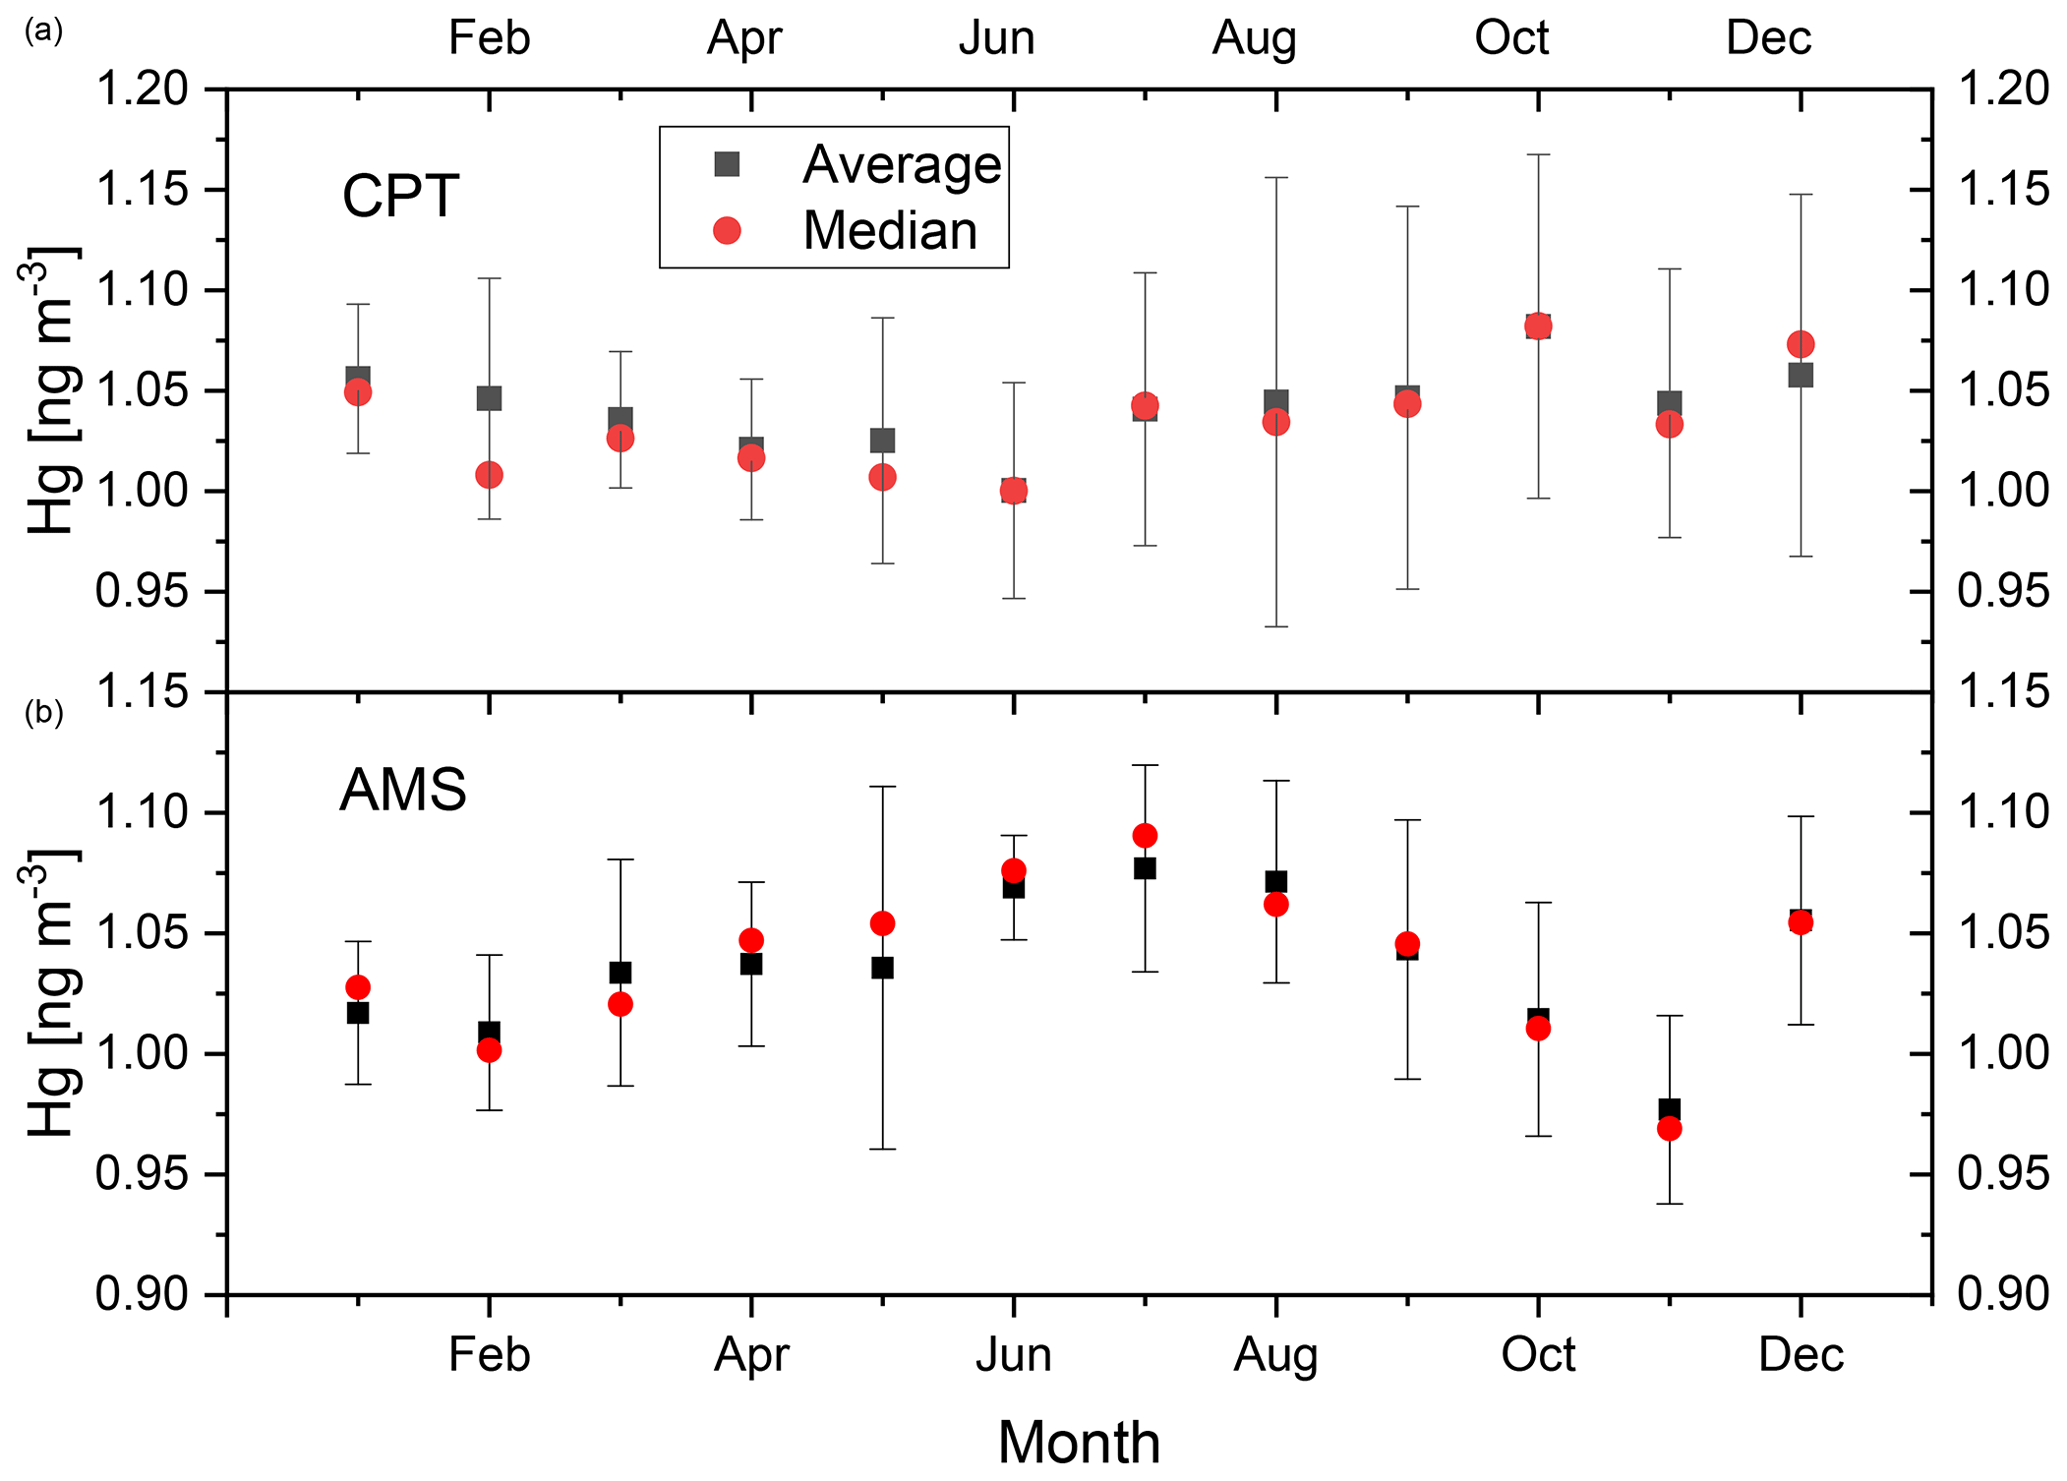
Figure 2Seasonal variation in GEM in 2012–2017 at CPT (a) and AMS (b). The points represent averages and medians of monthly medians over the 2012–2017 period. The bars represent the standard deviations of the monthly averages.
In summary, maximum GEM concentrations at AMS are observed in austral winter (June–August) and the lowest GEM concentrations in austral summer. Austral winter is the season with the most frequent fast transport from southern Africa to AMS (June–October; Miller et al., 1993), coinciding also with maximum 222Rn concentrations at AMS (May–August) as another indicator of continental influence (Polian et al., 1986). The most frequent events at AMS in 1996–1997 with high CO mixing ratios occurred also in austral winter (June–October; Gros et al., 1999). Biomass burning in southern Africa peaks in austral winter and spring (July–October; Duncan et al., 2003), and we therefore conclude, in agreement with Angot et al. (2014), that mercury from biomass burning in southern Africa combined with its fast transport to AMS is mostly responsible for the seasonal variation observed there. The reduced uptake of atmospheric GEM by terrestrial biomass of southern Africa in austral winter (Jiskra et al., 2018) can also contribute.
3.2 Trends at CPT in 2007–2017
Figure 3 shows annual median GEM concentrations at CPT (2007–2017) and at AMS (2012–2017). Table 1 shows the trends in GEM, CO2, 222Rn, CO, CH4, and O3 at CPT in the 2007–2017 period as calculated by least-squares fit of monthly averages or medians (medians are shown in Fig. S1 of the Supplement). Monthly average and median GEM concentrations show a significant upward trend of 7.69±2.11 and 7.01±2.11 pg m−3 yr−1, respectively. The upward trends in CO2 (2.07±0.03 ppm yr−1 for averages and 2.08 ± 0.02 ppm yr−1 for medians) and CH4 (5.70±0.66 ppb yr−1 for averages and 5.85±0.53 ppb yr−1 for medians) are comparable to worldwide trends of 2.24 ppm yr−1 for CO2 and 6.9 ppb yr−1 for CH4 in 2008–2017 (WMO Greenhouse Gas Bulletin, 2018). For the interpretation of the GEM trend, the most revealing is the non-significant trend in 222Rn and the significant downward trend in CO. 222Rn is a radioactive gas of predominantly terrestrial origin with a half-life of 3.8 d. The non-significant 222Rn trend thus implies a nearly constant ratio of oceanic to continental air masses over the 2007–2017 period and rules out larger shifts in climatology at CPT as the cause of the observed GEM trend. Biomass burning is a major source of CO in the Southern Hemisphere (Duncan et al., 2003; Pirrone et al., 2010) and at the same time a major source of Hg (Friedli et al., 2009). The downward trend in CO thus rules out increasing Hg emissions from biomass burning being responsible for the upward GEM trend at CPT. The downward trend in CO at CPT is consistent with the decreasing CO emissions in 2001–2015 (Jiang et al., 2017). They report decreasing CO emissions from biomass burning from boreal North America, boreal Asia, and South America but no change in Africa.
Table 1Trends at Cape Point for the 2007–2017 period. Calculated by least-squares fitting (LSQF) from monthly averages and medians.


Figure 3Annual median GEM concentrations at Cape Point (CPT) from March 2007 until December 2017 and at Amsterdam Island (AMS) from February 2012 until December 2017.
3.3 Trends at CPT and AMS in 2012–2017
Monthly GEM averages and medians at AMS and CPT in the 2012–2017 period are not statistically distinguishable according to the paired Student t test. Monthly CO2 averages at CPT are significantly higher than at AMS (at >99.9 % significance level), but medians cannot be distinguished. Medians of CO2, 222Rn, CO, and CH4 are less influenced by occasional events with extremely high values and as such tend to be smaller than averages. Because such events are less frequent at AMS than at CPT, the differences between monthly averages and medians are always higher at CPT than at AMS. This explains why the CO2 monthly averages are significantly higher at CPT than at AMS but the medians are not. Similarly, the significance of the monthly differences between higher CO at CPT and lower CO at AMS is >99.9 % for averages but only >99 % for medians. Monthly CH4 mixing ratios are always higher at CPT than at AMS with >99.9 % significance for both averages and medians. The most pronounced difference between CPT and AMS is in 222Rn concentrations: monthly averages and medians at CPT are on average 16.6 and 12.6 times higher, respectively, than at AMS. In summary, higher monthly CO2, CO, CH4, and especially 222Rn averages and medians at CPT than at AMS clearly demonstrate a higher influence of continental air masses at CPT because all these species are predominantly of terrestrial origin. Statistically comparable GEM concentrations at AMS and CPT in 2012–2017, on the contrary, suggest that terrestrial GEM sources do not play a major role and oceanic sources dominate at CPT. This conclusion is supported by an analysis of GEM∕222Rn ratios in events with enhanced 222Rn concentrations observed at CPT (Slemr et al., 2013), which found the terrestrial surface of southern Africa to be a sink of GEM rather than a source. This is further discussed in the companion paper (Bieser et al., 2020).
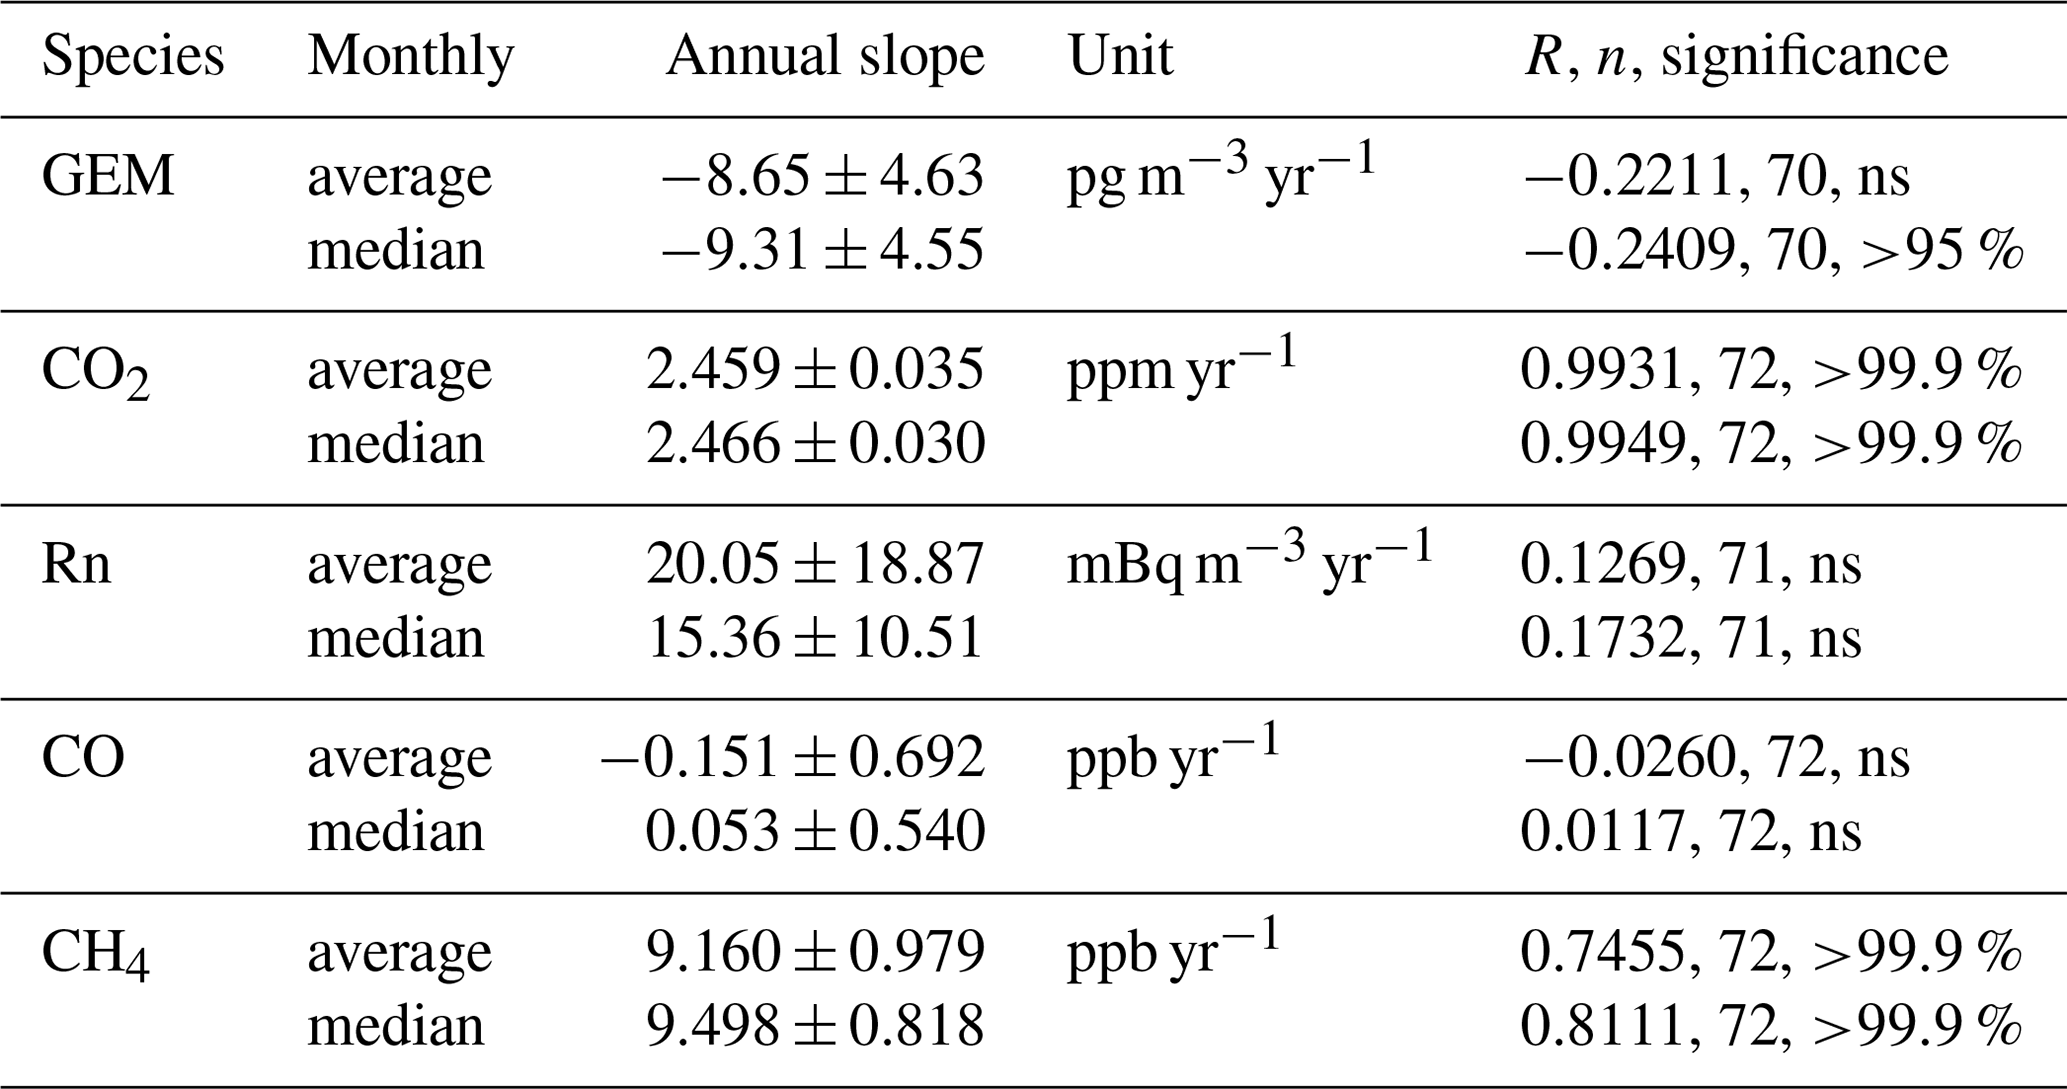
Tables 2 and 3 show the 2012–2017 trends in GEM, CO2, 222Rn, CO, and CH4 at AMS and CPT, respectively. The AMS monthly average and median GEM concentrations do not show any significant trend. At CPT monthly average GEM concentrations do not show any significant trend, whereas median GEM concentrations show a significant slight downward trend (at >95 % significance level). As in the 2007–2017 period the neutral to slightly downward GEM trend at CPT is accompanied by no significant trend in 222Rn. Contrary to the 2007–2017 period CO does not show any significant downward trend whereas O3 (not listed) shows a small significant upward trend in monthly averages but not in monthly medians.
Table 2Trends at Amsterdam Island for the 2012–2017 period. Calculated by LSQF from monthly averages and medians.
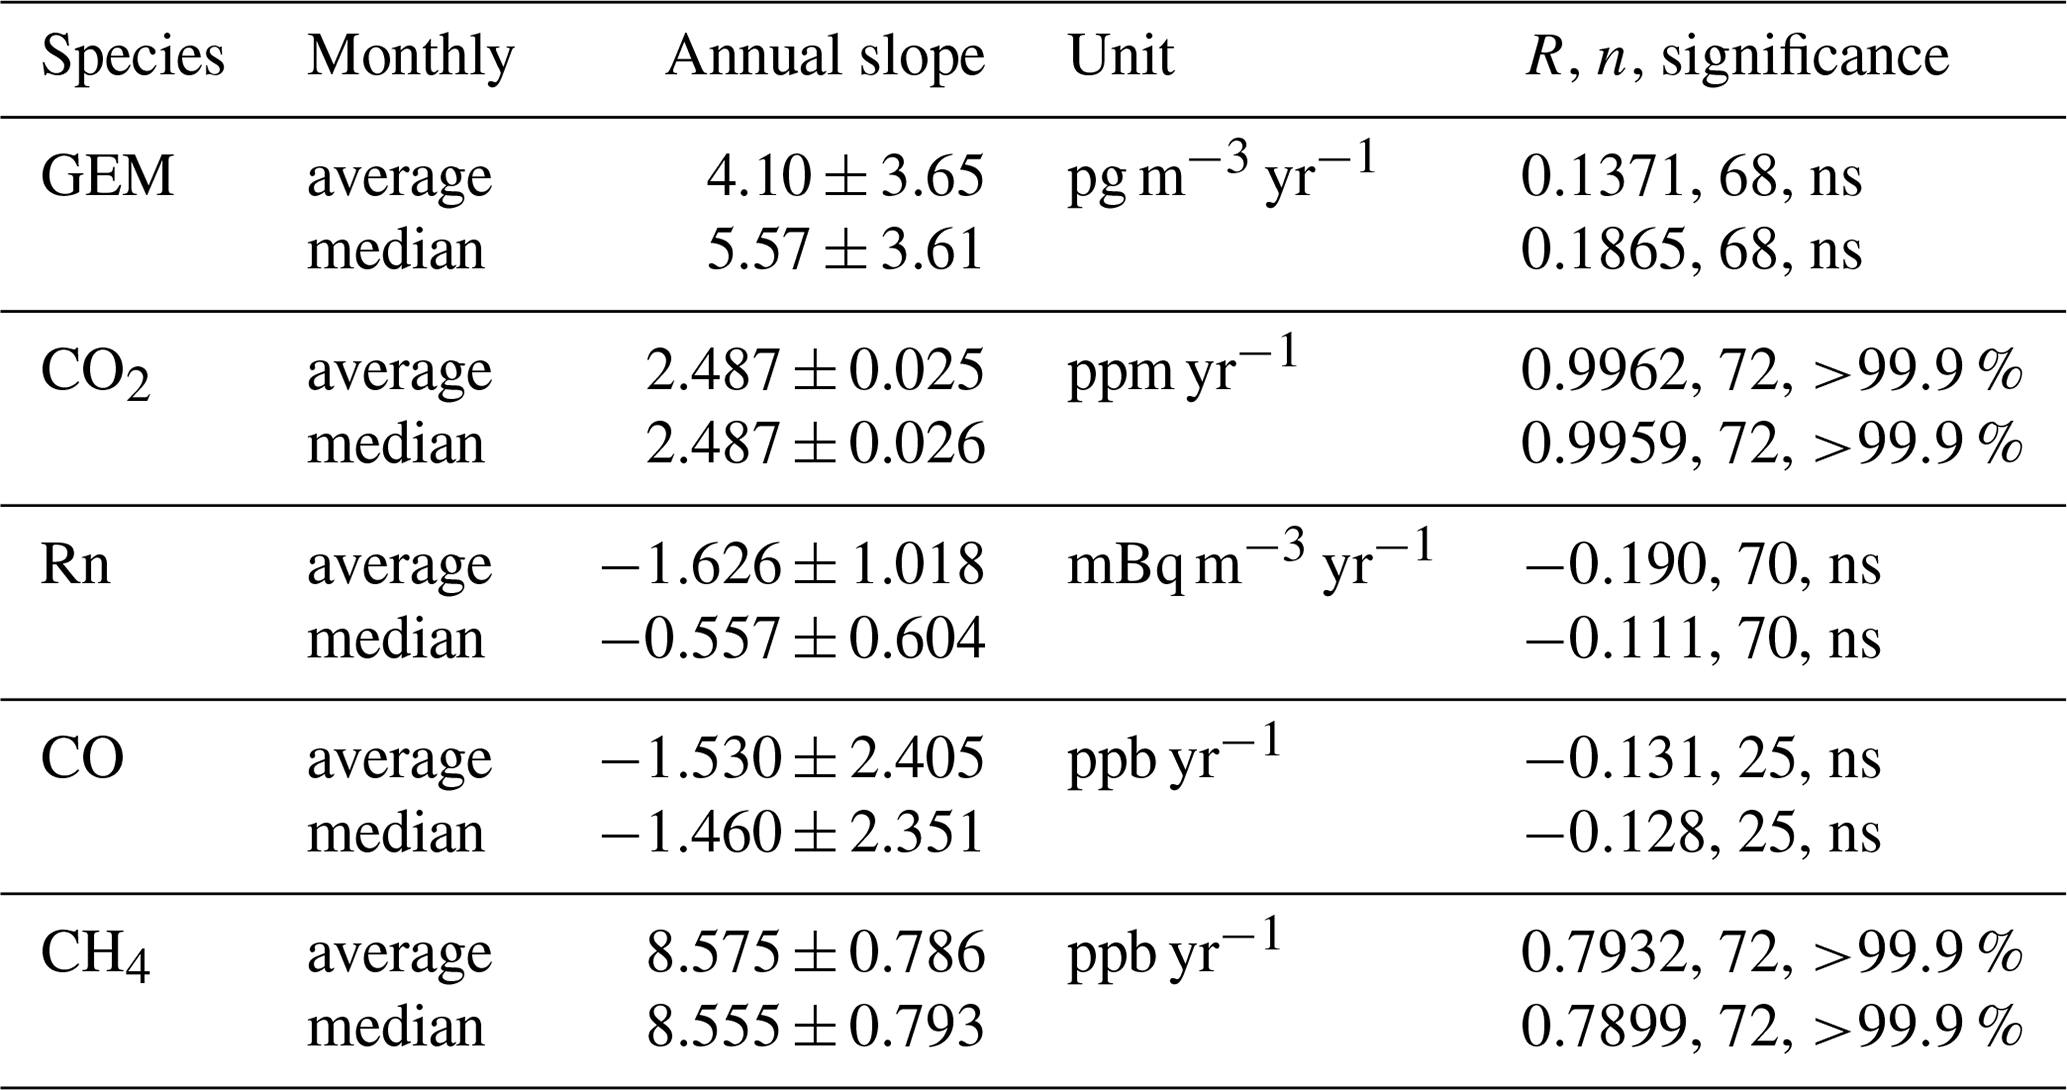
Table 3Trends at Cape Point for the 2012–2017 period. Calculated by LSQF from monthly averages and medians.
An inspection of Fig. 3 shows that the GEM trend at CPT in the 2007–2017 period is driven mainly by the minimum in 2009 and the maxima in 2012 and 2014. Table S1 of the Supplement shows the trends in GEM, 222Rn, CO, CH4, and O3 at CPT for the 2007–2014 period. Monthly average and median GEM concentrations increased by 16.91±3.60 and 16.18±3.61 pg m−3 yr−1, respectively. This upward GEM trend is accompanied by no trend in 222Rn and O3 and a small downward trend in monthly CO mixing ratio averages but not in medians.
In summary, the 2007–2017 time series of GEM concentrations at CPT consists of two parts: one starting in 2007 and ending approximately in 2014 with a pronounced upward trend and the other without any trend (medians and averages at AMS and averages at CPT) or with even a slightly downward trend (medians at CPT) starting in 2012. The absence of the GEM trend in averages in 2012–2017 at CPT is in agreement with the absence of the GEM trend at AMS in the same period. The upward trend thus appears to have changed between 2012 and 2014. The absence of 222Rn trends at CPT for 2007–2017 and the subperiods 2007–2014 and 2012–2017 points to a nearly constant ratio of marine and continental air masses over the years and thus rules out shifts in regional climatology being responsible for the GEM trends. A downward trend in CO over the 2007–2017 period and no trend or just a slightly downward one for the subperiods 2007–2014 and 2012–2017 make it unlikely that increasing Hg emissions from biomass burning could be the reason for the upward trend in GEM concentrations at CPT. We note that both 222Rn concentrations and CO mixing ratios have very pronounced seasonal variations which make it difficult to determine significant trends over shorter periods.
3.4 Inter-annual variations in GEM concentrations
A plot of annual median GEM concentrations in Fig. 3 (annual averages provide a very similar pattern and are not shown) shows that median concentrations in 2007 and 2008 are only slightly lower than in 2015–2017. It is the steady increase from the lowest GEM concentrations in 2009 to the highest ones in 2014 at CPT (2014 being also the year with the second-highest GEM concentration at AMS in the 2012–2017 period) which seems to be responsible for the upward trend in 2007–2017 at CPT and no trend for the 2012–2017 period for both CPT and AMS. Exceptionally low annual GEM concentrations in 2009 (average and median of 0.918 and 0.913 ng m−3, respectively) and exceptionally high ones in 2014 (average and median of 1.090 and 1.094 ng m−3, respectively, at CPT and 1.050 and 1.053 ng m−3, respectively, at AMS) seem to be a near-global phenomenon. The years 2009 and 2014 show the largest deviations (a negative one in 2009, a positive one in 2014) from the linear 2000–2014 trend in annual GEM average concentrations recorded at 18 sites in North America (Fig. 8b of Streets et al., 2019). At Mace Head, a site in Ireland, GEM annual average and median concentrations in 2009 were the lowest over the 1996–2013 period (Supplementary Information of Weigelt et al., 2015). The reasons for these near-global inter-annual variations are not clear. Global anthropogenic Hg emissions do not vary much from year to year (mostly by less than 5 %) and have been steadily increasing over the 2010–2015 period (Streets et al., 2019). Between 2000 and 2010 they steadily increased by ∼10 % (Streets et al., 2017 and 2019). These emission estimates do not include Hg from biomass burning, but CO emissions from biomass burning, as a proxy for Hg emissions, were somewhat lower in 2008 and 2009 but not exceptionally high in 2014 (Jiang et al., 2017). Annual volcanic SO2 emissions, as a proxy for volcanic Hg emissions, also do not show exceptionally low emissions in 2009, although the emissions in 2014 were the second highest on record (after 2011) in the 1996–2018 period (https://disc.gsfc.nasa.gov/datasets/MSVOLSO2L4_V3/summary, last access: 19 November 2019).
Tropospheric mercury concentrations were found to be influenced by the El Niño–Southern Oscillation (ENSO; Slemr et al., 2016b). Such influence could also be a reason for the observed inter-annual variation in GEM concentrations at Cape Point. Table 4 shows correlations of 3-month running averages and medians of GEM concentrations at CPT with 3-month running average of the Southern Oscillation Index (SOI) for 2007–2014 and 2012–2017 and compares them with the 2012–2017 period at AMS. Instead of monthly averages, 3-month running averages and medians were taken to take account of the time of intra-hemispheric mixing. Correlations of CO mixing ratios with SOI (https://www.cpc.ncep.noaa.gov/data/indices/soi.3m.txt, last access: 19 June 2019) at CPT for 2007–2014 and 2012–2017 are also listed. CO vs. SOI correlations for AMS were not calculated because the CO mixing ratios are available only from December 2015 until December 2017.
Table 4Correlation of 3-month running average and median GEM concentrations and CO mixing ratios with 3-month running average of SOI (https://www.cpc.ncep.noaa.gov/data/indices/soi.3m.txt (last access: 19 June 2019). The CPT GEM data for 2007–2014 were detrended and the CPT CO data for 2007–2014 and 2012–2017 deseasonalised using the average monthly averages or medians over the period. No CO correlation is presented for AMS because CO data are available only from December 2015 until December 2017. The delay given in the last column is the one with the highest R. The delays in the brackets are significant correlations with the second- and third-highest R.
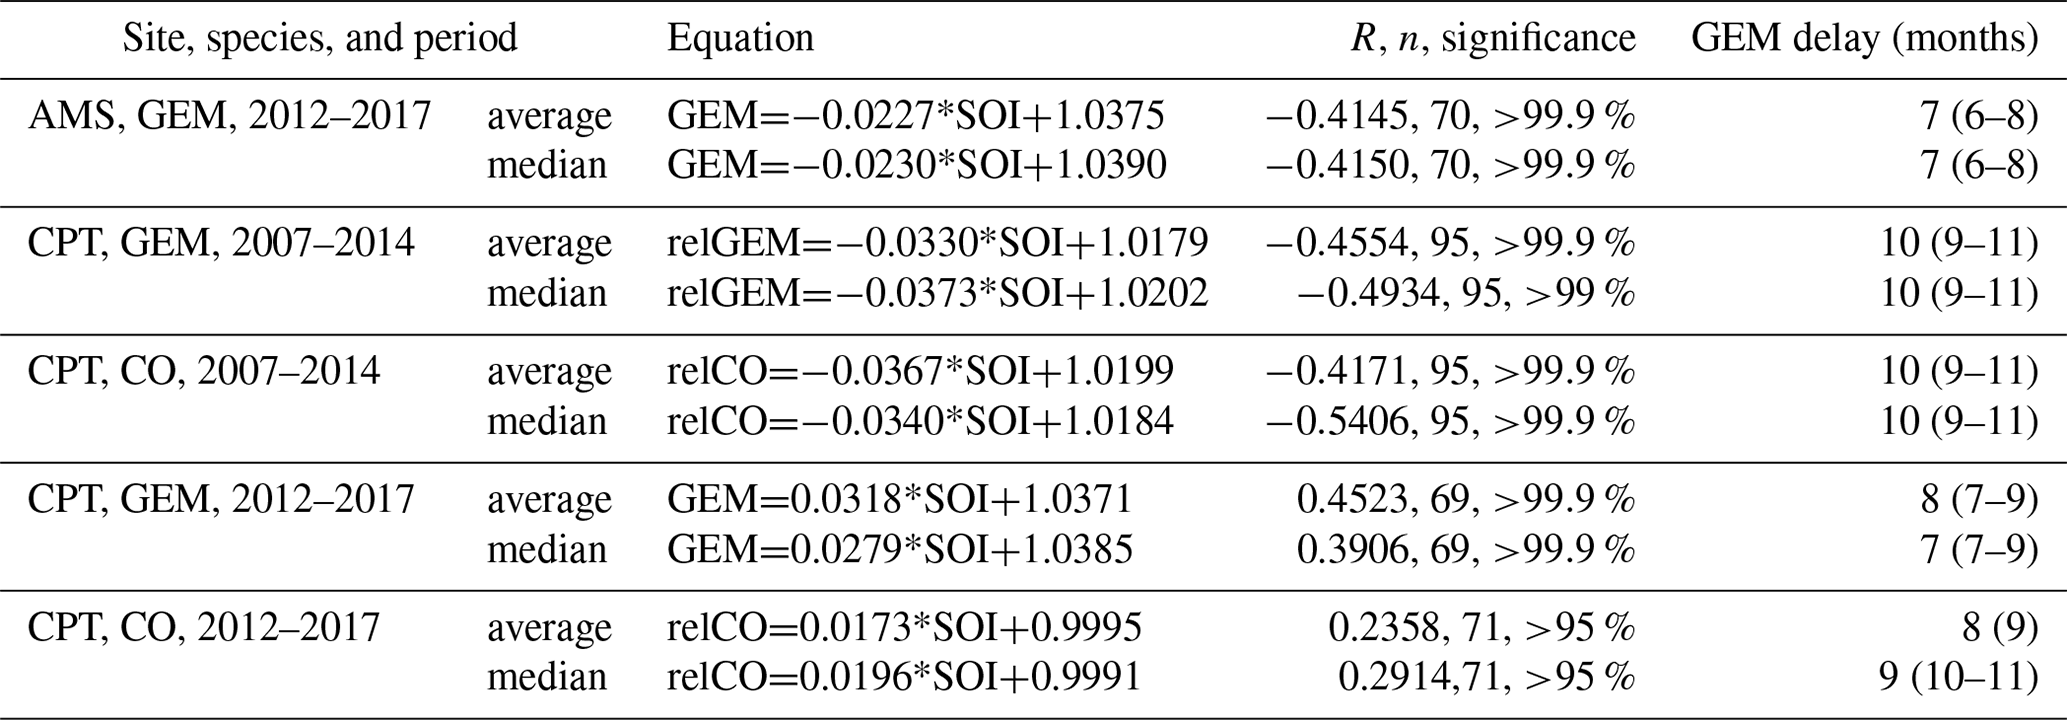
Table 4 shows inverse correlations of GEM concentrations with SOI at AMS for 2012–2017 with a lag of 6–8 months for both averages and medians. Relative GEM (after detrending) at CPT also correlates inversely with SOI at CPT in the 2007–2014 period as does the CO mixing ratio (deseasonalised) in the same period, both with a slightly longer lag of 9–11 months. Inverse correlations of GEM concentrations and CO mixing ratios with SOI with similar lags were reported by Slemr et al. (2016b), who interpreted them as a sign of biomass burning being the driving force for the inter-annual variation in GEM and CO. The correlations of GEM and CO with SOI for the 2012–2017 period at CPT are both positive and the CO vs. SOI correlation is significant only at a >95 % level. For the 2007–2017 period at CPT, encompassing both periods, an inverse correlation of GEM vs. SOI was found but with a lower significance level of only >95 %. The different correlations of GEM and CO with SOI at CPT for the period 2012–2017 from those at CPT in 2007–2014 and of GEM vs. SOI at AMS in 2012–2017 clearly show that at least at CPT the mechanism for inter-annual variations changed.
Correlations of detrended monthly GEM averages and medians at CPT with the North Atlantic Oscillation (NAO) index (https://www.cpc.ncep.noaa.gov/products/precip/CWlink/pna/norm.nao.monthly.b5001.current.ascii, last access: 12 November 2019) over the period 2007–2017 were not significant for medians and just significant (>95 %) for averages with a lag of 11 months. In the 2012–2017 period the correlations of GEM with the NAO index were significant (>95 %) with a delay of 0 and 8 months both for monthly medians and averages (both not detrended). The correlation with the 0-month delay is inverse, and that with the 8-month delay is positive. At AMS monthly GEM averages correlate with the NAO index with a delay of 3, 5, and 6 months, all at a significance level of >95 %. Monthly medians correlate with a delay of 5 and 6 months, the latter even at a significance level of >99 %. In summary, there seems to be some influence of the NAO on GEM concentration. The influence is more pronounced at AMS than at CPT, probably because of more regional influence at the latter site.
The annual GEM minimum in 2009 and the maxima in 2012 and 2014 at CPT as well as the annual minima in 2015 and 2017 and maxima in 2014 and 2016 at AMS fit a biennial tendency already mentioned by Martin et al. (2017), with mostly lower annual GEM concentrations in odd years and higher ones in even years. The biennial tendency is also apparent in the annual median and average CO mixing ratios at CPT (there are only 2 years with CO measurements at AMS), with mostly lower values in odd years and higher ones in even years, similar to GEM concentrations. Meehl and Arblaster (2001, 2002) note a relation between the tropospheric biennial oscillation (TBO) and ENSO, the latter also with a biennial tendency.
In summary, a part of the inter-annual variation in GEM concentrations seems to be related to teleconnections like the ENSO, TBO, and NAO.
Martin et al. (2017) reported an upward trend in GEM concentrations at CPT from March 2007 to June 2015. With 2.5 more years of measurements at CPT until December 2017 and GEM measurements at AMS from February 2012 until December 2017 a more complex picture emerged.
No significant trend in GEM concentrations was found at CPT and AMS for the period of AMS measurements, i.e. 2012–2017. An upward trend in GEM concentrations at CPT in 2007–2015 reported by Martin et al. (2017) is driven mainly by the 2009–2014 data with a minimum in 2009 and maxima in 2012 and 2014. The latter 2 years with high annual GEM concentrations seem to be the reason for an absent trend in the 2012–2017 period, although the upward trend over the whole 2007–2017 period at CPT is still significant. A minimum of GEM concentrations in 2009 was also reported for stations in North America and at Mace Head, Ireland. In addition, annual average and median GEM concentrations at CPT and AMS show a biennial pattern with lower concentrations in odd years and higher ones in even years. Because of the pronounced inter-annual variations, the calculated GEM trends will depend on the year when the observations start and end and increasingly so, how short the observation period is.
No trend in 222Rn concentrations and a slight downward trend in CO mixing ratios were found at CPT in 2007–2017. Changing ratios of marine and continental air masses at CPT as well as increasing mercury emissions from biomass burning can, therefore, be ruled out as the cause of the upward GEM trend at CPT.
Monthly average GEM concentrations at CPT and AMS in 2012–2017 are statistically indistinguishable, while concentrations of species of terrestrial origin such as CO2, CH4, CO, and especially 222Rn clearly show substantially higher values at CPT in comparison with those at AMS. Comparable GEM concentrations at CPT and AMS despite the much higher influence of terrestrial air masses at CPT thus indicate that terrestrial GEM sources are of minor importance and the oceanic GEM sources dominate at CPT. This major conclusion will be substantiated by a companion paper in which the GEM concentration will be, with the help of backward trajectories, attributed to different source and sink regions.
Cape Point data are available on the GMOS website at http://sdi.iia.cnr.it/geoint/publicpage/GMOS/gmos_historical.zul (GMOS, 2020a). Amsterdam Island GEM data are freely available in the catalogue section at https://gmos.aeris-data.fr/catalogue/ (GMOS, 2020b). Those used in this article (AMS site, L2) have the unique identifier bcb74d91-d6ea-4f83-a897-f98f8ecd044c.
The supplement related to this article is available online at: https://doi.org/10.5194/acp-20-7683-2020-supplement.
LM, CL, TM, HA, OM, AD, PG, and MR provided the data on which this work is based. FS made the statistical analysis and prepared the manuscript in collaboration with LM, HA, OM, and JB.
The authors declare that they have no conflict of interest.
This article is part of the special issue “Research results from the 14th International Conference on Mercury as a Global Pollutant (ICMGP 2019), MercOx project, and iGOSP and iCUPE projects of ERA-PLANET in support of the Minamata Convention on Mercury (ACP/AMT inter-journal SI)”. It is not associated with a conference.
This publication forms part of the output of the Biogeochemistry Research Infrastructure Platform (BIOGRIP) of the Department of Science and Innovation of South Africa. We thank the CPT team for providing the data on which this paper is based. We also thank Andreas Weigelt and Ralf Ebinghaus from the Helmholtz-Zentrum in Geesthacht who for years supported mercury measurements at CPT and Ernst-Günther Brunke who was responsible for the CPT operation until he retired in 2015. Olivier Magand, Aurelien Dommergue and Hélène Angot deeply thank all overwintering staff at AMS and the French Polar Institute Paul-Emile Victor (IPEV) staff and scientists who helped with the setup and maintenance of the experiment at AMS in the framework of the GMOStral-1028 IPEV program. We also thank the IPEV RAMCES-416 program which provided greenhouse gas and 222Rn data for AMS. Last but not least we would also like to thank the reviewers for their insightful and constructive feedback, which has helped to improve the clarity and utility of the revised manuscript.
Logistical and financial support for AMS has been provided by IPEV (GMOstral-1028 program) since 2012.
Funds obtained through the European Union Seventh Framework Programme project Global Mercury
Observation System (GMOS; http://www.gmos.eu/), Labex OSUG@2020 (ANR10 LABX56) and LEFE
CNRS-INSU (SAMOA program) also contributed to this work.
The article processing charges for this open-access
publication were covered by the Max Planck Society.
This paper was edited by Ralf Ebinghaus and reviewed by two anonymous referees.
Ambrose, J. L.: Improved methods for signal processing in measurements of mercury by Tekran® 2537A and 2537B instruments, Atmos. Meas. Tech., 10, 5063–5073, https://doi.org/10.5194/amt-10-5063-2017, 2017.
Angot, H., Barret, M., Magand, O., Ramonet, M., and Dommergue, A.: A 2-year record of atmospheric mercury species at a background Southern Hemisphere station on Amsterdam Island, Atmos. Chem. Phys., 14, 11461–11473, https://doi.org/10.5194/acp-14-11461-2014, 2014.
Bieser, J., Angot, H., Slemr, F., and Martin, L.: Atmospheric mercury in the Southern Hemisphere – Part 2: Source apportionment analysis at Cape Point station, South Africa, Atmos. Chem. Phys. Discuss., https://doi.org/10.5194/acp-2020-63, in review, 2020.
Cole, A. S., Steffen, A., Eckley, C. S., Narayan, J., Pilote, M., Tordon, R., Graydon, J. A., Louis, V. L. St., Xu, X., and Branfireun, B. A.: A survey of mercury in air and precipitation across Canada: Patterns and trends, Atmosphere, 5, 635–668, 2014.
Duncan, B. N., Martin, R. V., Staudt, A. C., Yevich, R., and Logan, J. A.: Interannual and seasonal variability of biomass burning emissions constrained by satellite observations, J. Geophys. Res., 108, 4100, https://doi.org/10.1029/2002JD002378, 2003.
Friedli, H. R., Arellano, A. F., Cinnirella, S., and Pirrone, N.: Initial estimates of mercury emissions to the atmosphere from global biomass burning, Environ. Sci. Technol., 43, 3507–3513, 2009.
GMOS (Global Mercury observation System): Cape Point data, available at: http://sdi.iia.cnr.it/geoint/publicpage/GMOS/gmos_historical.zul, last access: 21 June 2020a.
GMOS (Global Mercury observation System): Amsterdam Island GEM data, available at: https://gmos.aeris-data.fr/catalogue/, last access: 21 June 2020b.
Gros, V., Bonsang, B., Martin, D., Novelli, P. C., and Kazan, V.: Carbon monoxide short term measurements at Amsterdam Island: estimation of biomass burning emission rates, Chemosphere Global Change Sci., 1, 163–172, 1999.
Jiang, Z., Worden, J. R., Worden, H., Deeter, M., Jones, D. B. A., Arellano, A. F., and Henze, D. K.: A 15-year record of CO emissions constrained by MOPITT CO observations, Atmos. Chem. Phys., 17, 4565–4583, https://doi.org/10.5194/acp-17-4565-2017, 2017.
Jiskra, M., Sonke, J. E., Obrist, D., Bieser, J., Ebinghaus, R., Lund Myhre, C., Pfaffhuber, K. A., Wängberg, I., Kyllönen, K., Worthy, D., Martin, L. G., Labuschagne, C., Mkololo, T., Ramonet, M., Magand, O., and Dommergue, A.: A vegetation control on seasonal variations in global atmospheric mercury concentrations, Nature Geosci., 11, 244–250, 2018.
Martin, L. G., Labuschagne, C., Brunke, E.-G., Weigelt, A., Ebinghaus, R., and Slemr, F.: Trend of atmospheric mercury concentrations at Cape Point for 1995–2004 and since 2007, Atmos. Chem. Phys., 17, 2393–2399, https://doi.org/10.5194/acp-17-2393-2017, 2017.
Marumoto, K., Suzuki, N., Shibata, Y., Takeuchi, A, Takami, A., Fukuzaki, N., Kawamoto, K., Mizohata, A., Kato, S., Yamamoto, T., Chen, J., Hattori, T., Nagasaka, H., and Saito, M.: Long-term observation of atmospheric speciated mercury during 2007–2018 at Cape Hedo, Okinawa, Japan, Atmosphere, 10, 362, https://doi.org/10.3390/atmos10070362, 2019.
Meehl, G. A. and Arblaster, J. M.: The tropospheric biennial oscillation and Indian monsoon rainfall, Geophys. Res. Lett., 28, 1731–1734, 2001.
Meehl, G. A. and Arblaster, J. M.: The tropospheric biennial oscillation and Asian – Australian monsoon rainfall, J. Climate, 15, 722–743, 2002.
Miller, J. M., Moody, J. L., Harris, J. M., and Gaudry, A.: A 10-year trajectory flow climatology for Amsterdam Island, 1980–1989, Atmos. Environ., 27A, 1909–1916, 1993.
Munthe, J., Sprovieri, F., Horvat, M., and Ebinghaus, R.: SOPs and QA/QC protocols regarding measurements of TGM, GEM, RGM, TPM and mercury in precipitation in cooperation with WP3, WP4, and WP5, GMOS deliverable 6.1, CNR-IIA, IVL, available at http://www.gmos.eu (last access: 21 June 2020), 2011.
Pirrone, N., Cinnirella, S., Feng, X., Finkelman, R. B., Friedli, H. R., Leaner, J., Mason, R., Mukherjee, A. B., Stracher, G. B., Streets, D. G., and Telmer, K.: Global mercury emissions to the atmosphere from anthropogenic and natural sources, Atmos. Chem. Phys., 10, 5951–5964, https://doi.org/10.5194/acp-10-5951-2010, 2010.
Polian, G., Lambert, G., Ardouine, B., and Jegou, A.: Long-range transport of continental radon in subantarctic and antarctic areas, Tellus, 38B, 178–189, 1986.
Slemr, F., Brunke, E.-G., Whittlestone, S., Zahorowski, W., Ebinghaus, R., Kock, H. H., and Labuschagne, C.: 222Rn-calibrated mercury fluxes from terrestrial surface of southern Africa, Atmos. Chem. Phys., 13, 6421–6428, https://doi.org/10.5194/acp-13-6421-2013, 2013.
Slemr, F., Angot, H., Dommergue, A., Magand, O., Barret, M., Weigelt, A., Ebinghaus, R., Brunke, E.-G., Pfaffhuber, K. A., Edwards, G., Howard, D., Powell, J., Keywood, M., and Wang, F.: Comparison of mercury concentrations measured at several sites in the Southern Hemisphere, Atmos. Chem. Phys., 15, 3125–3133, https://doi.org/10.5194/acp-15-3125-2015, 2015.
Slemr, F., Weigelt, A., Ebinghaus, R., Kock, H. H., Bödewadt, J., Brenninkmeijer, C. A. M., Rauthe-Schöch, A., Weber, S., Hermann, M., Becker, J., Zahn, A., and Martinsson, B.: Atmospheric mercury measurements onboard the CARIBIC passenger aircraft, Atmos. Meas. Tech., 9, 2291–2302, https://doi.org/10.5194/amt-9-2291-2016, 2016a.
Slemr, F., Brenninkmeijer, C. A., Rauthe-Schöch, A., Weigelt, A. Ebinghaus, R., Brunke, E. G., Martin, L., Spain, T. G., and O'Doherty, S.: El Niño-Southern Oscillation influence on tropospheric mercury concentrations, Geophys. Res. Lett., 43, 1766–1771, 2016b.
Soerensen, A. L., Jacob, D. J., Streets, D. G., Witt, M. L. I., Ebinghaus, R., Mason, R. P., Andersson, M., and Sunderland, E. M.: Multi-decadal decline of mercury in the North Atlantic atmosphere explained by changing subsurface seawater concentrations, Geophys. Res. Lett., 39, L21810, https://doi.org/10.1029/2012GL053736, 2012.
Sprovieri, F., Pirrone, N., Bencardino, M., D'Amore, F., Carbone, F., Cinnirella, S., Mannarino, V., Landis, M., Ebinghaus, R., Weigelt, A., Brunke, E.-G., Labuschagne, C., Martin, L., Munthe, J., Wängberg, I., Artaxo, P., Morais, F., Barbosa, H. D. M. J., Brito, J., Cairns, W., Barbante, C., Diéguez, M. D. C., Garcia, P. E., Dommergue, A., Angot, H., Magand, O., Skov, H., Horvat, M., Kotnik, J., Read, K. A., Neves, L. M., Gawlik, B. M., Sena, F., Mashyanov, N., Obolkin, V., Wip, D., Feng, X. B., Zhang, H., Fu, X., Ramachandran, R., Cossa, D., Knoery, J., Marusczak, N., Nerentorp, M., and Norstrom, C.: Atmospheric mercury concentrations observed at ground-based monitoring sites globally distributed in the framework of the GMOS network, Atmos. Chem. Phys., 16, 11915–11935, https://doi.org/10.5194/acp-16-11915-2016, 2016.
Sprovieri, F., Pirrone, N., Bencardino, M., D'Amore, F., Angot, H., Barbante, C., Brunke, E.-G., Arcega-Cabrera, F., Cairns, W., Comero, S., Diéguez, M. D. C., Dommergue, A., Ebinghaus, R., Feng, X. B., Fu, X., Garcia, P. E., Gawlik, B. M., Hageström, U., Hansson, K., Horvat, M., Kotnik, J., Labuschagne, C., Magand, O., Martin, L., Mashyanov, N., Mkololo, T., Munthe, J., Obolkin, V., Ramirez Islas, M., Sena, F., Somerset, V., Spandow, P., Vardè, M., Walters, C., Wängberg, I., Weigelt, A., Yang, X., and Zhang, H.: Five-year records of mercury wet deposition flux at GMOS sites in the Northern and Southern hemispheres, Atmos. Chem. Phys., 17, 2689–2708, https://doi.org/10.5194/acp-17-2689-2017, 2017.
Steffen, A., Lehnherr, I., Cole, A., Ariya, P., Dastoor, A., Durnford, D., Kirk, J., and Pilote, M.: Atmospheric mercury in the Canadian Arctic. Part I: A review of recent field measurements, Sci. Total Environ., 509–510, 3–15, 2015.
Streets, D. G., Horowitz, H. M., Jacob, D. J., Lu, Z., Levin, L., ter Schure, A. F. H., and Sunderland, E. M.: Total mercury released to the environment by human activities, Environ. Sci. Technol., 51, 5969–5977, 2017.
Streets, D. G., Horowitz, H. M., Lu, Z., Levin, L., Thackray, C. P., and Sunderland, E. M.: Global and regional trends in mercury emissions and concentrations, 2010–2015, Atmos. Environ., 201, 417–427, 2019.
Swartzendruber, P. C., Jaffe, D. A., and Finley, B.: Improved fluorescence peak integration in the Tekran 2537 for applications with sub-optimal sample loadings, Atmos. Environ., 43, 3648–3651, 2009.
Temme, C., Blanchard, P., Steffen A., Banic, C., Beauchamp, S., Poissant, L., Tordon, R., and Wiens, B.: Trend, seasonal and multivariate analysis study of total gaseous mercury data from the Canadian atmospheric mercury measurement network (CAMNet), Atmos. Environ., 41, 5423–5441, 2007.
Weigelt, A., Ebinghaus, R. Manning, A. J., Derwent, R. G., Simmonds, P. G., Spain, T. G., Jennings, S. G., and Slemr, F.: Analysis and interpretation of 18 years of mercury observations since 1996 at Mace Head, Ireland, Atmos. Environ., 100, 85–93, 2015.
Weiss-Penzias, P. S., Gay, D. A., Brigham, M. E., Parsons, M. T., Gustin, M. S., and ter Schure, A.: Trends in mercury wet deposition and mercury air concentrations across the U.S. and Canada, Sci. Total Environ., 568, 546–556, 2016.
WMO Greenhouse Gas Bulletin, No. 14, World Meteorological Organization, Geneva, Switzerland, 22 November 2018.
Zhang, Y., Jacob, D. J., Horowitz, H. M., Chen, L., Amos, H. M., Krabbenhoft, D. P., Slemr, F., Louis, V. L.S t., and Sunderland, E. M.: Observed decrease in atmospheric mercury explained by global decline in anthropogenic emissions, P. Natl. Acad. Sci., 113, 526–531, 2016.