the Creative Commons Attribution 4.0 License.
the Creative Commons Attribution 4.0 License.
 | 26 Jun 2020
Long-term brown carbon and smoke tracer observations in Bogotá, Colombia: association with medium-range transport of biomass burning plumes
Juan Manuel Rincón-Riveros
Maria Alejandra Rincón-Caro
Amy P. Sullivan
Juan Felipe Mendez-Espinosa
Luis Carlos Belalcazar
Miguel Quirama Aguilar
Ricardo Morales Betancourt
Light-absorbing aerosols emitted during open biomass burning (BB) events such as wildfires and agricultural burns have a strong impact on the Earth's radiation budget through both direct and indirect effects. Additionally, BB aerosols and gas-phase emissions can substantially reduce air quality at local, regional, and global scales, negatively affecting human health. South America is one of largest contributors to BB emissions globally. After Amazonia, the BB emissions from wildfires and agricultural burns in the grassland plains of northern South America (NSA) are the most significant in the region. However, few studies have analyzed the potential impact of NSA BB emissions on regional air quality. Recent evidence suggests that seasonal variations in air quality in several major cities in NSA could be associated with open biomass burning emissions, but it is still uncertain to what extent those sources impact air quality in the region. In this work, we report on 3 years of continuous equivalent black carbon (eBC) and brown carbon (BrC) observations at a hilltop site located upwind of the city of Bogotá, and we demonstrate its association with fires detected by the MODerate-resolution Imaging Spectroradiometer (MODIS) in a 3000 km × 2000 km domain. Offline PM2.5 filter samples collected during three field campaigns were analyzed to quantify water-soluble organic carbon (WSOC), organic and elemental carbon (OC∕EC), and biomass burning tracers such as levoglucosan, galactosan, and potassium. MODIS active fire data and HYSPLIT back trajectories were used to identify potential biomass burning plumes transported to the city. We analyzed the relationship between BrC, WSOC, water-soluble potassium, and levoglucosan to identify signals of the regional transport of BB aerosols. Our results confirm that regional biomass burning transport from wildfires occurs annually during the months of January and April. The seasonality of eBC closely followed that of PM2.5 at the city air quality stations; however, the observed seasonality of BrC is distinctly different to that of eBC and strongly associated with regional fire counts. The strong correlation between BrC and regional fire counts was observed at daily, weekly, and monthly timescales. WSOC at the measurement site was observed to increase linearly with levoglucosan during high BB periods and to remain constant at ∼2.5 µgC m−3 during the low BB seasons. Our findings show, for the first time in this region, that aged BB plumes can regularly reach densely populated areas in the Central Andes of northern South America. A source footprint analysis involving BrC observations, back trajectories, and remotely sensed fire activity shows that the eastern savannas in NSA are the main BB source region for the domain analyzed.
- Article
(2871 KB) - Full-text XML
-
Supplement
(1198 KB) - BibTeX
- EndNote


Open biomass burning is a significant source of atmospheric aerosol particles and gas-phase pollutants (e.g., Bond et al., 2004; Aurell and Gullett, 2013; Tsimpidi et al., 2016). The particles emitted during biomass burning (BB) have a complex chemical composition dominated by primary organic matter (POM), elemental carbon (EC), and inorganic material such as sulfates, nitrates, and potassium (e.g., Yamasoe et al., 2000; Akagi et al., 2011). These species can contribute to deteriorated air quality levels in urban centers (e.g., Phuleria et al., 2005; Garcia-Hurtado et al., 2014; Kollanus et al., 2016). The impacts of BB plumes on air quality for sites located several thousand kilometers away from the BB sources have been demonstrated (e.g., Forster et al., 2001; Cottle et al., 2014). Many studies have documented the negative effects of BB emissions on human health (Youssouf et al., 2014; Haikerwal et al., 2015; Reid et al., 2016). Additionally, the carbonaceous components of BB particles, which are typically internally mixed, significantly contribute to the absorption of visible and ultraviolet (UV) light (Kirchstetter et al., 2004). Elemental carbon is known to have a visible light absorption coefficient larger than that of any other aerosol component and to substantially impact Earth's radiation budget and climate. Due to its optical properties, EC is sometimes measured through light absorption techniques and when measured this way is referred to as equivalent black carbon (eBC) (Petzold et al., 2013). BC is the second-largest contributor to anthropogenic radiative forcing, with open burning of forests and savannas being the largest source (Stohl et al., 2015; Bond et al., 2013). The organic material (OM) present in aerosol particles, mainly those produced in BB, biofuel combustion, and from other sources, has been shown to absorb light in UV wavelengths more efficiently than BC. The absorption increases proportionally to the amount of OM present in the aerosol (Yan et al., 2017; Mkoma et al., 2013). The UV-light-absorbing organic compounds present in aerosol particles are often termed brown carbon (BrC) (e.g., Kirchstetter et al., 2004; Andreae and Gelencsér, 2006; Wang et al., 2018), which is also a contributor to radiative forcing.
Biomass burning emissions from South America contribute the most to the global BC inventory, with 16 % of the global emissions, surpassing those of other critical areas such as Asia and Africa (e.g., Koch et al., 2007; van der Werf et al., 2010). In particular, the Brazilian Amazonia and Cerrado regions produce substantial BB emissions, whose impacts have been the subject of numerous studies (e.g., Crutzen and Andreae, 1991; de Oliveira Alves et al., 2015; Gonçalves et al., 2016). Emissions from Amazonia and Cerrado typically occur between May and September, which corresponds to the dry season in the region (Marengo et al., 2011). Fires in the savannas and tropical forests thousands of kilometers north of the Brazilian Amazonia, an area known as northern South America (NSA), can also have significant global and local impacts (van der Werf et al., 2010). However, due to the significance of BB emissions from Amazonia, emissions from NSA have often been overlooked despite their potential impacts on air quality and climate (Thornhill et al., 2018). The equatorward location of NSA causes its annual precipitation and BB emission patterns to differ strongly from those of Amazonia. Peak emissions in the former occur between January and April, with minimum BB activity between June and October. Those BB activity patterns in NSA are mostly determined by the dynamics of the wet and dry seasons, which are in turn controlled by the annual south–north migration of the Intertropical Convergence Zone (ITCZ) (Pulwarty et al., 1998; Poveda et al., 2006; Mendez-Espinosa et al., 2019). Interannual variability in the intensity and length of the dry season, controlled by the El Niño–Southern Oscillation (ENSO), modulates the intensity of the peak BB emissions in NSA (Poveda et al., 2006).
The BB plumes generated in these fires can negatively impact the air quality experienced by over 60 million people that live in Venezuela, Colombia, and Ecuador. Only recently have some studies focused on the air quality impacts of BB emissions in this region. Observational studies performed at the Pico Espejo mountain (Venezuela), over 4000 m in altitude, detected the passage of BB plumes during the dry season (Hamburger et al., 2013). Because of its vertical elevation, the Pico Espejo site has often sampled free-troposphere aerosols, showing the potential long-range transport of aged BB plumes (Schmeissner et al., 2011). More recently, PM2.5 and ozone observations in the sparsely populated savannas in NSA showed extremely high concentrations, even in small towns where measurements were performed (Hernandez et al., 2019). These high PM2.5 and ozone levels were associated with distant fires in the Venezuelan savannas. The potential regional-scale air quality impacts of BB emissions in NSA was recently explored by Mendez-Espinosa et al. (2019). In their work, a systematic analysis of air-mass back trajectories and MODerate-resolution Imaging Spectroradiometer (MODIS) hotspots for a 10-year period was conducted, indicating a strong association between fire counts in NSA and PM2.5 concentrations in cities located hundreds of kilometers from the BB sources. Mendez-Espinosa et al. (2019) showed that BB emissions from the NSA savannas could be transported westward, impacting air quality in several large metropolitan areas. However, there were no direct measurements of BB available to confirm the presence of BB aerosols in the urban areas considered. Since the main BB source regions are located hundreds of kilometers from the most densely populated areas, these BB plumes are likely aged. Atmospheric aging of BB aerosols has been shown to increase the oxidative potential of the particles (e.g., Wong et al., 2019a), potentially increasing the particle toxicity in addition to contributing to aerosol mass.
Detection of BB aerosols using chemical tracers is necessary to confirm the contribution of fires to aerosol loading at a given location. Traditionally, potassium (K), levoglucosan, BrC, water-soluble organic carbon (WSOC), and other species have been used as biomass burning particle tracers (e.g., Sullivan and Weber, 2006a, b; Laskin et al., 2015; Shen et al., 2017; Martinsson et al., 2017). Potassium has been extensively used as a BB tracer, but there are significant non-biomass-burning-related sources of K, and it does not always correlate well with BB smoke (Pachón et al., 2013). Levoglucosan and other anhydrosugars, which are formed through the pyrolysis of cellulose, are more specific BB tracers (Simoneit et al., 1999). A potential limiting factor in the use of levoglucosan as a BB tracer is its oxidation in the atmosphere, with a lifetime of a few days when exposed to the OH radical (Hennigan et al., 2010), reducing its abundance in long-range-transported BB plumes that have aged in the atmosphere. Furthermore, aerosol mass spectrometer data have shown that mass fractions associated with levoglucosan correlate strongly with light-absorbing carbonaceous material (e.g., Cubison et al., 2011; Lack et al., 2013). BB is also a significant primary source of WSOC (Sullivan and Weber, 2006b), but WSOC can also be formed through the gas-to-particle conversion of gas-phase organics (e.g., Weber et al., 2007). WSOC has also been shown to be a strong absorber in the UV part of the spectrum, as indicated by measurements of the absorption Ängström exponent from filter extracts (Hecobian et al., 2010). Because of their optically active components, BB aerosols can be detected through multi-wavelength particle light absorption measurements (e.g., Jeong et al., 2004).
In this work, we determine for the first time, to our knowledge, the presence of BB plumes in a large metropolitan area in NSA by using long-term observations of BB tracers. We linked the smoke tracer observations with regional BB activity, showing the role of the medium-range transport of BB plumes in urban air pollution in northern South America. We approach this problem by carrying out measurements on a hilltop site in Bogotá, Colombia. Continuous brown carbon and black carbon observations during a 3-year period were used to establish temporal patterns in the BB tracer signal. The potential origin of the BB aerosols at the site was explored by analyzing the time series of MODIS active fire data in the NSA domain together with a systematic back-trajectory analysis (Mendez-Espinosa et al., 2019). Specific smoke tracers such as levoglucosan and water-soluble potassium were quantified. Our results show that smoke tracers in Bogotá are strongly associated with regional BB activity. The wildfires and agricultural burns in NSA from January to April particularly contribute to the OC and WSOC concentration in the city of Bogotá.
We measured BrC and eBC continuously during a 3-year period at a hilltop site within the city limits of Bogotá, Colombia (Sect. 2.1). The site is known as the Monserrate site. Filter-based aerosol samples were also collected at this site over three different field campaigns spanning both high and low BB activity in NSA. These samples were analyzed for smoke markers such as levoglucosan and other sugars. Water-soluble organic carbon (WSOC), inorganic ions, and OC∕EC were also measured from these filter samples. Observations at our site were contrasted against those routinely collected at the Air Quality Monitoring Network of Bogotá (Sect. 2.5). Additionally, we combined MODIS active fire data with back-trajectory analysis to explore the potential transport of BB-affected air masses by performing statistical association analysis between fire counts and smoke tracer concentrations (Sect. 2.4).
2.1 Measurement site description
The broader study domain covers a vast area of nearly 3.9 million km2 (Fig. 1a). The western part of NSA, dominated by the Andes mountain range, is a densely populated region with more than 60 million inhabitants. The eastern part of NSA includes the tropical grasslands and woodland plains of the Orinoco River basin. The Orinoco River basin is sparsely populated, and its economy is based on agricultural activities. The annual cycle of precipitation over the region is controlled by the meridional displacement of the ITCZ (Poveda et al., 2006). The ITZC southernmost location typically occurs during DJF. These months are therefore characterized by drier weather in NSA as the deep convection areas are displaced southward towards Amazonia (Mendez-Espinosa et al., 2019). This mechanism, in turn, largely explains the seasonality of BB activity in the region.
The measurement instruments were deployed at the Monserrate sanctuary (long. ∘, lat. =4.60582∘). This sanctuary is located on a hilltop on the eastern margin of the urban perimeter of Bogotá, Colombia (Fig. 1b). The altitude of the Monserrate site is 3152 m above sea level and 550 m above the mean height of the Andean plateau were the city of Bogotá lies (Fig. 1). Easterly winds prevail at the site, placing it upwind from the densely populated metropolitan area with 9 million people (Fig. 1b). According to the air quality monitoring stations in the city, the annual average PM2.5 concentration was 19 µg m−3 during 2019, with a strong seasonal cycle during which monthly mean PM2.5 between February and March can reach 35 µg m−3 and decrease to 11 µg m−3 in July. Primary aerosol emissions are estimated to be 2600 t yr−1, with a large contribution from diesel-powered public transport buses and cargo trucks (Pachón et al., 2018). Road dust resuspension emissions are highly uncertain but are thought to significantly contribute to primary emissions (Pachón et al., 2018). There are no significant emission sources or urbanized areas east of the city (Fig. 1b). Therefore, the Monserrate site location was intended to minimize the impact from the urban background, allowing for the detection of regional signals. Wind speed and direction, UV radiation, relative humidity, and barometric pressure were also recorded on site with a frequency of 10 min using a meteorological station Vantage-Pro2 (Davis Instruments, CA, USA).
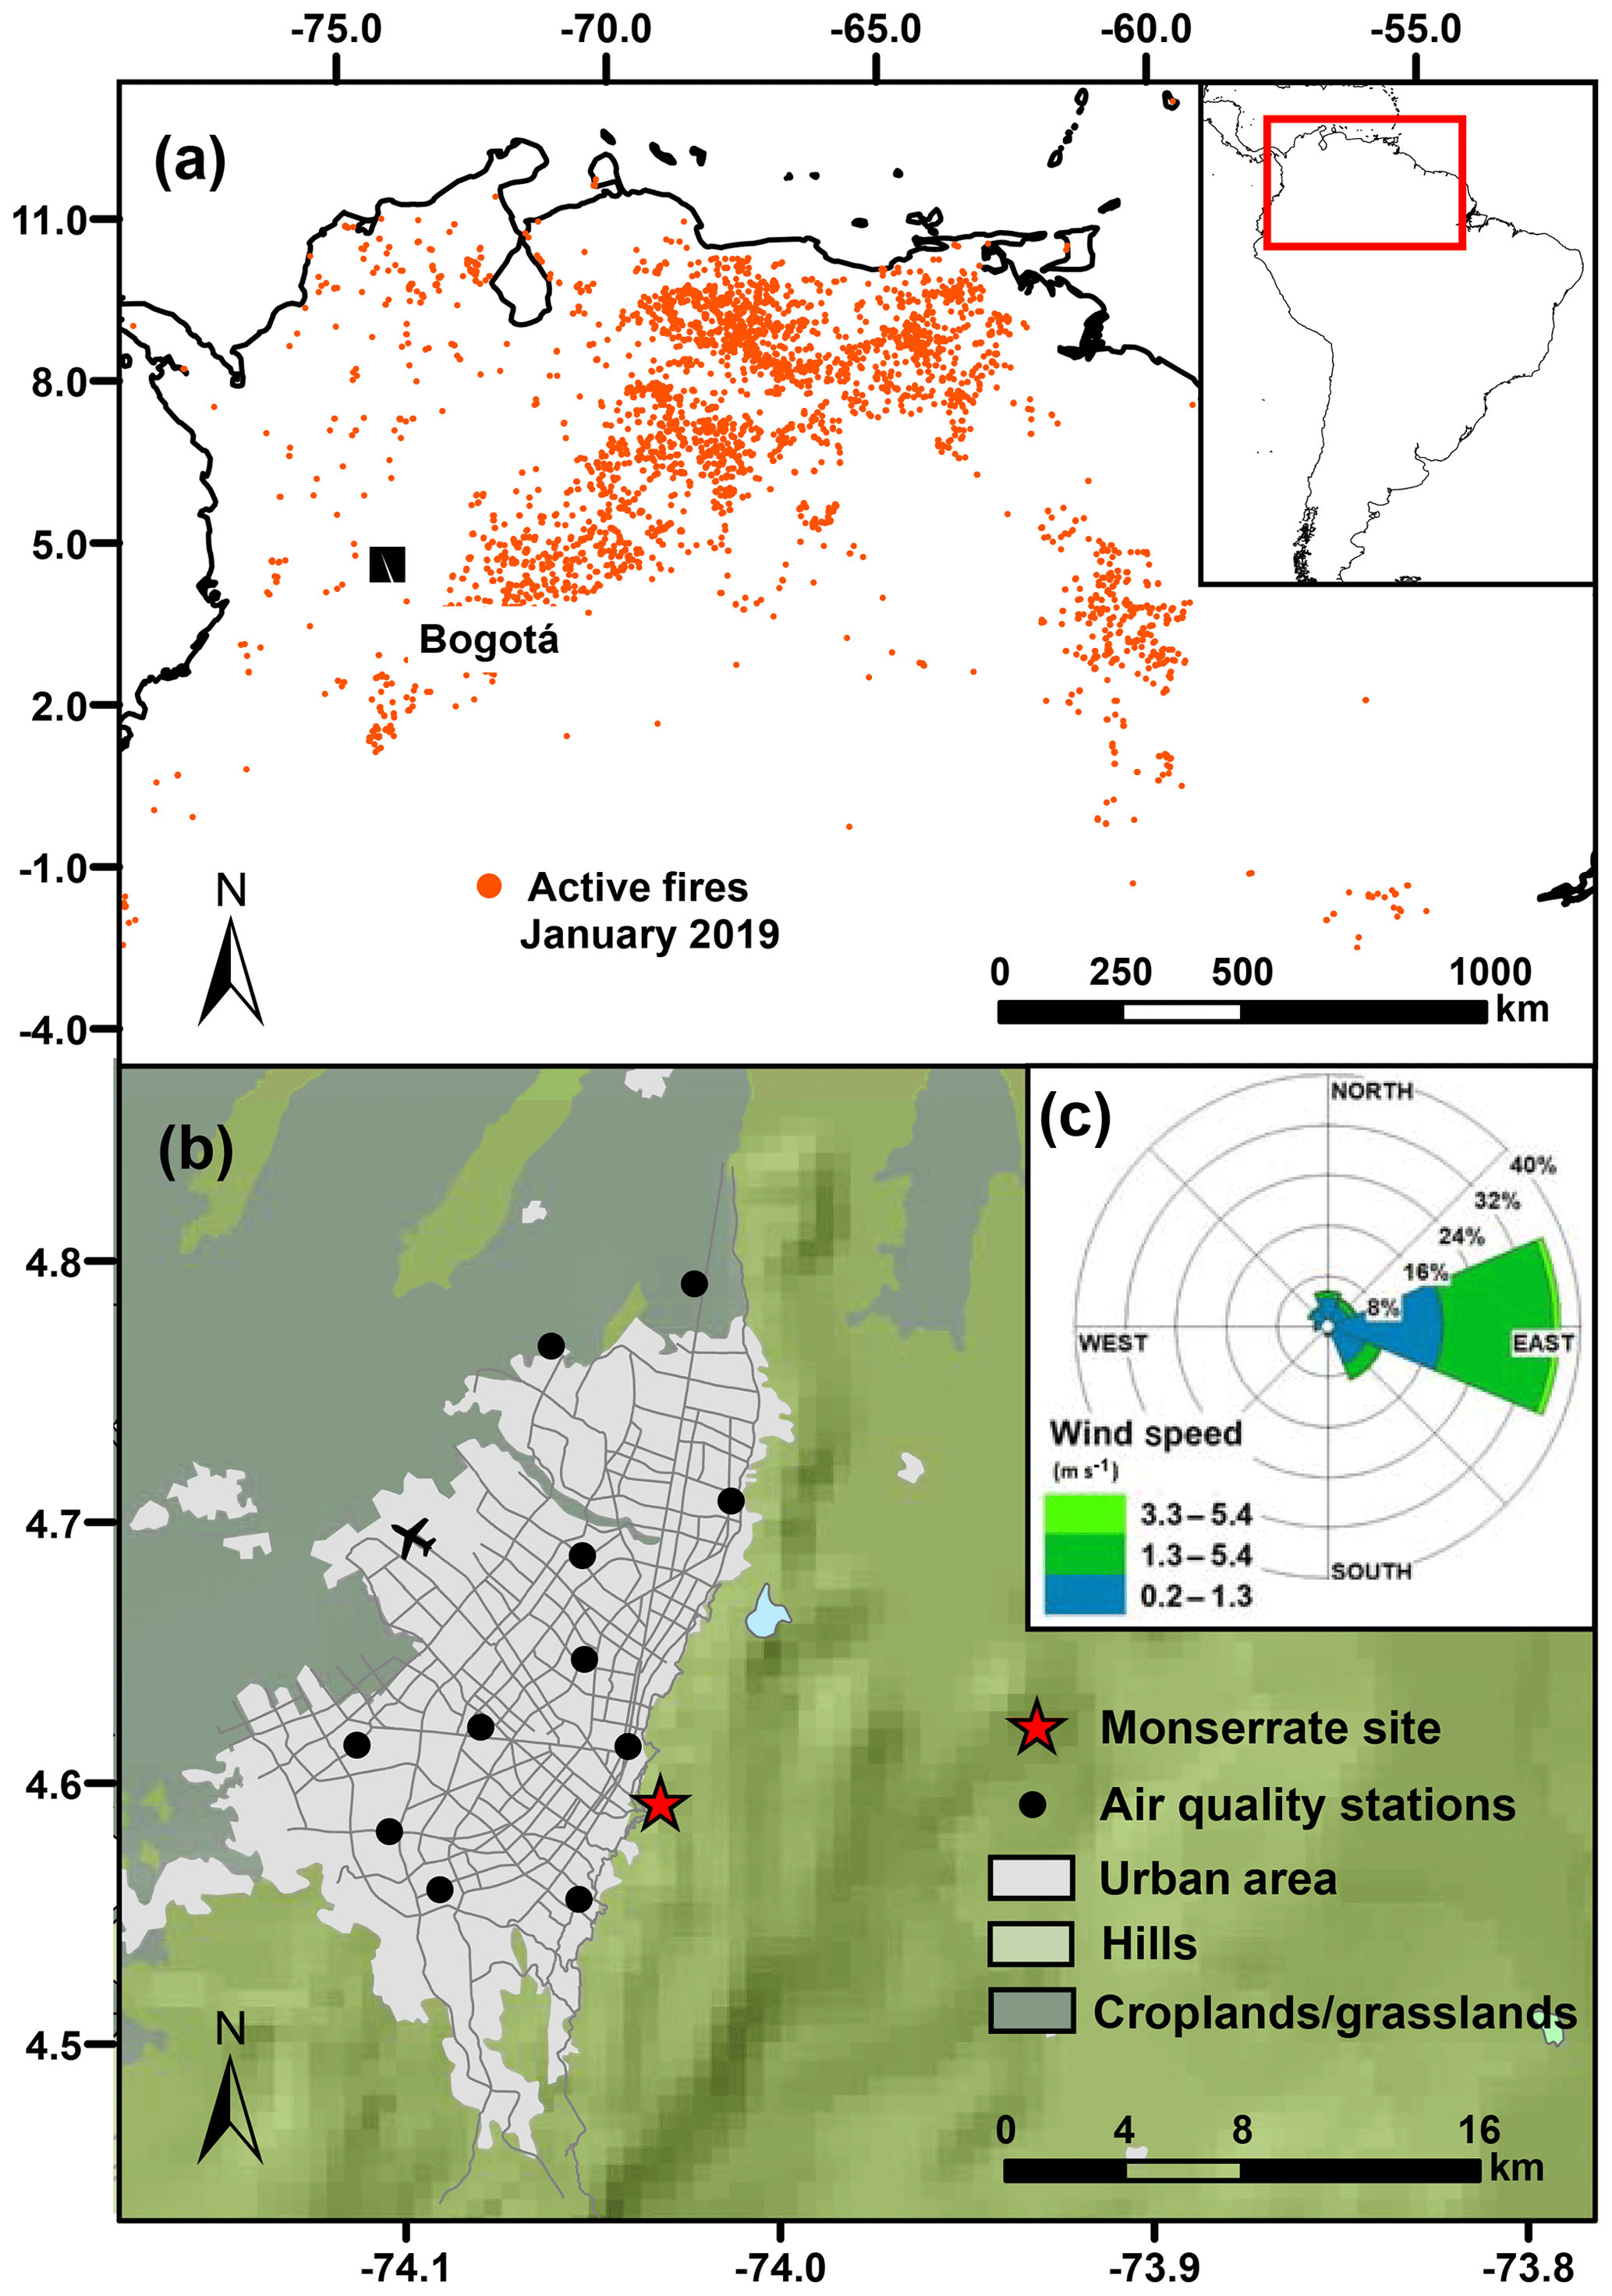
Figure 1(a) Geographic location of the northern South America (NSA) domain as defined in this study and locations of MODIS hotspots during January 2019. The inset shows the location of NSA relative to South America. (b) Location of the Monserrate site (star) near Bogotá and the air quality (AQ) stations (filled circles). Colors in the map indicate land-use type, and the shading shows terrain height variations. (c) Wind direction observed at the Monserrate site during the period May 2016–April 2019.
2.2 BrC and BC measurements
The aerosol light absorption coefficient, babs (Mm−1), was measured continuously using a seven-wavelength (370, 470, 520, 590, 660, 880, 950 nm) Aethalometer (Aerosol Inc., model AE-33) described by Drinovec et al. (2015). The measurements were carried out at the Monserrate site during the 3-year period from May 2016 to April 2019. Data were logged every 60 s. The sampling rate was 2 L min−1 through a PM1.0 inlet (BGI model SCC0.732) to avoid potential mineral dust absorption interference on the measurements since most of the fresh or aged BB aerosol particles are in the sub-micrometer size range (Janhäll et al., 2010). The babs raw data were corrected to account for filter loading effects (Virkkula et al., 2007). The loading correction parameter for each wavelength, kλ, is automatically computed by asymmetrically splitting the sample flow and simultaneously measuring attenuation at two deferentially loaded filter spots (Drinovec et al., 2015). Absorption is also corrected for scattering using a multiple-scattering parameter C=1.57, i.e., . The equivalent black carbon concentration, eBC (µg m−3), was computed from corrected babs measured at the 880 nm channel. This wavelength is customarily used in Aethalometer measurements to define equivalent black carbon. At 880 nm the absorption from organics is minimized. Following the recommendations of Petzold et al. (2013), we report the mass absorption cross section used to convert babs to eBC. We used a mass absorption cross section σ=7.77 m2 g−1, i.e., eBC. The estimated eBC limit of detection was 40 ng m−3 for a 1 h interval. A lower limit of detection is achieved with longer integration periods.
The spectral dependence of babs was characterized with the Ängström absorption exponent, α, which is the logarithmic slope of the relation between babs and wavelength, λ, i.e.,
where babs(λi) is the absorption coefficient at wavelength λi. Several different methods to apportion absorption to either fossil fuels or biomass burning have been developed (e.g., Sandradewi et al., 2008; Massabò et al., 2015; Chen et al., 2018). In this work, the deconvolution of babs between the contribution from fossil fuel and from biomass burning was done by applying the two-component model described by Sandradewi et al. (2008). In their model, aerosol absorption at any given wavelength is separated into the contributions from BB and fossil fuel aerosols, i.e., . Furthermore, it is assumed that the spectral dependence of absorption for each component is characterized by a specific Ängström exponent. This is and . Observational studies suggest that αFF≈1 (e.g., Sandradewi et al., 2008; Lack and Langridge, 2013); however, there is a large variability in published Ängström exponent values for biomass burning aerosols (e.g., Hecobian et al., 2010; Harrison et al., 2013; Lack and Langridge, 2013; Kirchstetter et al., 2004).
The Ängström exponent was computed using a wavelength in the near-UV range, at which absorption from organic compounds can be significant, and a near-infrared wavelength, at which absorption is dominated by black carbon. However, as the 370 nm channel had a smaller signal-to-noise ratio, the limit of detection of this channel was considerably higher and was not used in the analysis. Equation (1) was then applied to babs measured at 470 and 880 nm wavelengths to compute an observed α. Sensitivity analyses were also carried out for α calculated between the 470 and 950 nm channel. The fraction of light-absorbing aerosol attributable to BB, i.e., fBB, is inferred from α by applying the two-component model (Sandradewi et al., 2008), i.e.,
A detailed derivation of Eq. (2) can be found in the Supplement. We assumed fBB to be zero for α≤αFF and 1 for α≥αBB. Another method to apportion absorption to sources that uses five wavelengths was tested (Massabò et al., 2015). However, this method was found to be more sensitive to assumed parameters than the simpler Sandradewi et al. (2008) used here.
Since BrC absorption results from the contribution of many different compounds, quantifying BrC concentrations from absorption measurements is challenging, as there is no single mass absorption cross section that can be applied. The BrC mass concentration was estimated here as the fraction of absorption that is attributable to BB, computed as . This is likely an underestimation of BrC as its mass absorption cross section is lower than that of eBC. We used the parameters αFF=1, as has been suggested in several studies, and assumed a central value of αBB=2. However, as there is significant uncertainty in αBB, we performed parameter sensitivity analyses by varying and (Sandradewi et al., 2008; Lack and Langridge, 2013; Harrison et al., 2013). The BrC estimates from optical absorption measurements are also compared with the analytical quantification of levoglucosan and other BB combustion tracers (Sect. 2.3) known to be strongly related to BrC (Lack et al., 2013).
2.3 Biomass burning tracers
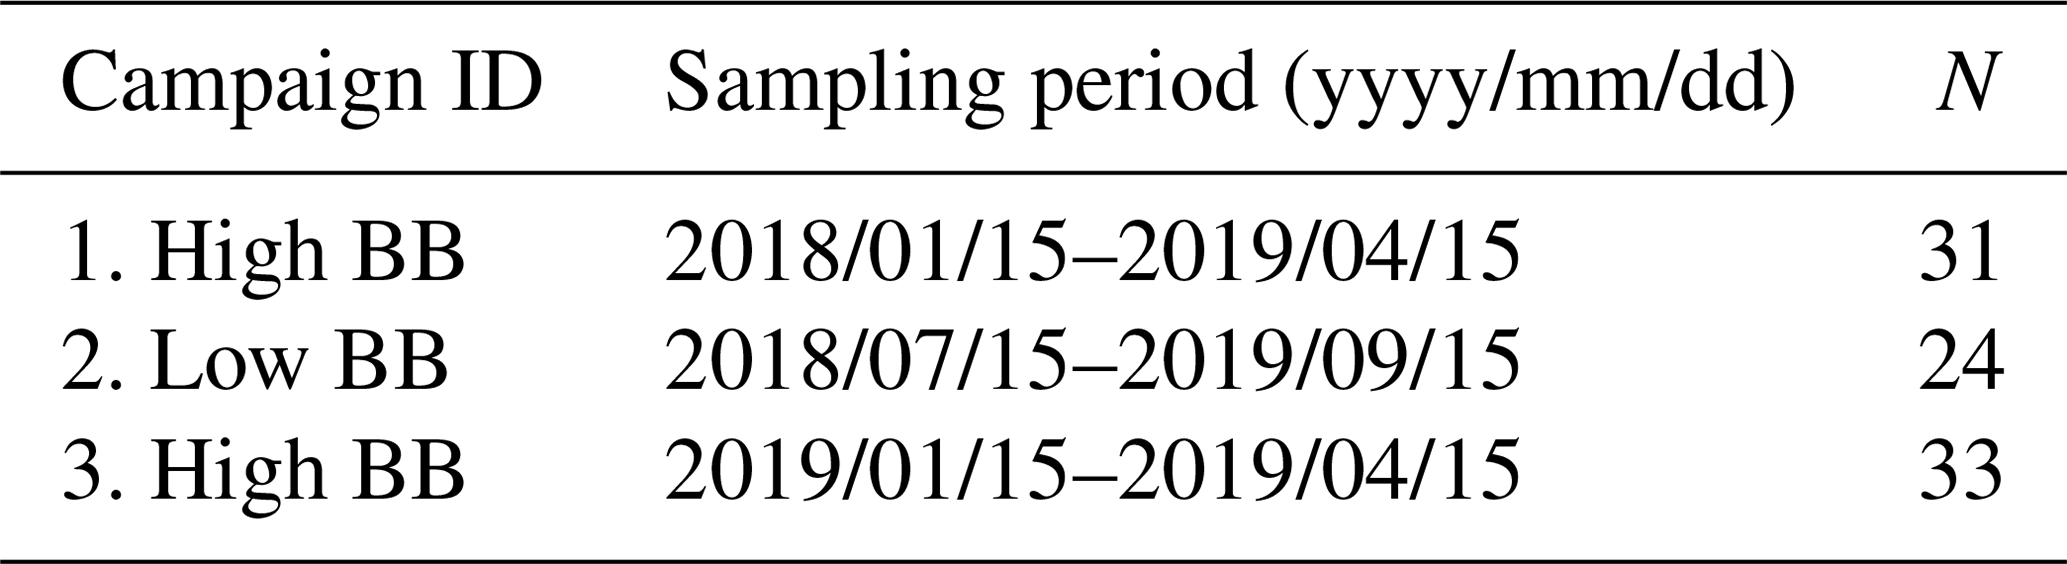
Filter-based aerosol samples were collected during three different field campaigns (Table 1) at the Monserrate site described in Sect. 2.1. The campaigns were designed to span high and low BB activity periods in NSA. Two of these campaigns were carried out during the high BB season (Campaigns 1 and 3) from January to April of 2018 and 2019, respectively, and one campaign was carried out during the NSA rainy season (Campaign 2) from July to September 2018. Samples were collected onto 37 mm quartz filters for 24 h periods (starting at midnight) every other day using a low-volume sampler. The sampler has a PM2.5 inertial impaction stage and a sampling flow rate of 10 L min−1. A total of 88 samples were collected and analyzed to quantify BB tracers on the aerosol samples. Blank samples at each sampling site were also analyzed. These handling blank filters were carried to the sampling site and placed in the sampling instrument with the vacuum pump turned off.
Table 1PM2.5 sampling campaigns carried out on the Monserrate site; N stands for the number of filter samples.
Prior to deployment for sampling, the quartz filters were prebaked at 550 ∘C for 12 h to reduce their organic background and later placed in a desiccator to prevent water vapor absorption. After sampling, the filters were stored in a freezer at −80 ∘C in plastic Petri dishes. At the end of each field campaign samples were sent overnight in a refrigerated container for chemical analysis to the Collett Laboratory at Colorado State University.
Organic carbon (OC) and elemental carbon (EC) were determined from a 1.4 cm2 punch in each filter using a thermal–optical transmission (TOT) EC∕OC semicontinuous analyzer (Sunset Labs Inc.) following the NIOSH method 5040 (Birch and Cary, 1996). The limit of detection (LOD) was 0.2 and 0.5 µgC m−3 for OC and EC, respectively. The remainder of the 37 mm filter was extracted in 15 mL of deionized water, and the extracts were filtered with a 0.2 µm PTFE syringe filter to remove insoluble particles. Water-soluble organic carbon (WSOC) was measured with a total organic carbon (TOC) analyzer (Sievers model M9 Turbo). This instrument measures WSOC by converting all organic carbonaceous material in the water extract to carbon dioxide using chemical oxidation by ultraviolet (UV) light and ammonium persulfate. The LOD for WSOC in this study was 0.1 µgC m−3. The overall measurement uncertainty for compounds analyzed is estimated to be ∼10 % (Sullivan et al., 2008).
A fraction of the aqueous extract was used to analyze for carbohydrates (including levoglucosan) through high-performance anion-exchange chromatography with pulsed amperometric detection (HPAEC-PAD) (Sullivan et al., 2011). This technique uses a Dionex DX-500 series ion chromatograph with a Dionex GP-50 pump and a Dionex ED-50 electrochemical detector operating in integrating amperometric mode using waveform A. Detailed descriptions of this method can be found elsewhere (e.g,. Sullivan et al., 2008, 2011). The LOD for carbohydrates quantification is less than ∼0.1 ng m−3.
Another portion of the aqueous extract was used to quantify inorganic anions and cations, including water-soluble potassium (WSK). For this analysis we used a Dionex ICS-3000 ion chromatograph with a conductivity detector, an isocratic pump, and a self-regenerating cation–anion suppressor. Cations were separated using a Dionex IonPac CS12A analytical column with a flow rate at 0.5 mL min−1 of 20 mM methanesulfonic acid eluent. The LOD for the various cations was 0.02 µg m−3. In the case of anions, a Dionex IonPac AS11-HC anion-exchange column with a flow rate at 1.5 mL min−1 of sodium hydroxide eluent was employed. The LOD for anions was 0.01 µg m−3. This type of method has been applied by other studies (Tzompa-Sosa et al., 2016; Prenni et al., 2012), and further method details are presented by Sullivan et al. (2008).
2.4 Active fires and back-trajectory analysis
MODerate-resolution Imaging Spectroradiometer (MODIS) observations were used to locate and count fires and their fire radiative power (FRP) daily in the NSA domain (long. ∘, lat. ∘ – Fig. 1b; long. ∘, lat. =13.1∘ – Fig. 1a) during May 2016 to April 2019. Only those active fires labeled with a ≥75 % confidence level were included in the analysis (Justice et al., 2002). The spatial distribution of fires during January 2019 is shown in Fig. 1a, where the substantial dry season BB activity on the eastern savannas of the Orinoco River basin can be seen.
We constructed several time series of daily fire counts, Nf, in the NSA domain by applying a variety of criteria. In the simplest criterion, all active fire counts in the domain, , with confidence ≥75 % were considered. Next, a set of distance criteria were applied and only the subset of fire counts within a circular region with radius R from Bogotá was included. Time series considering radii of 200, 400, 600, 1000, and 1500 km were built following this method. Similarly, additional time series of only those fires in an annular region, , defined by distances R1 and R2 were considered, i.e., those fires within .
MODIS active fire data were combined with Lagrangian back-trajectory analysis to explore the potential transport of BB-affected air masses following the methods of Mendez-Espinosa et al. (2019). Air-mass back trajectories arriving with 3 h intervals (00:00, 03:00, 06:00, 09:00, 12:00, 15:00, 18:00, and 21:00 GMT−5) at the Monserrate site at 1000 m a.g.l., i.e., eight daily, were computed using the NOAA HYSPLIT model (Stein et al., 2015; Draxler and Hess, 1998; Donnelly et al., 2015). Each trajectory was calculated for 96 h prior to arrival in order to account for distant emission sources and avoid uncertainties in regional analysis due to longer trajectories (Donnelly et al., 2015). The Lagrangian trajectories were driven by GDAS1 meteorological fields, which have a horizontal resolution of (Su et al., 2015). The trajectory data were systematically analyzed using the OpenAir package (Carslaw and Ropkins, 2012) and the SplitR package of the open-source programming language R. With this method, we constructed a time series of upwind fire counts, , using an algorithm to select only upwind fires according to the trajectory analysis (Mendez-Espinosa et al., 2019). For this, a buffer zone of 150 km was defined around each of the 96-hourly locations defining one of the eight back trajectories reaching the receptor city on any given day. Then, only active fires in these buffer zones were included in the analysis. This method should account for any time lag between the occurrence of a fire and the effect over concentrations at a distant site. Additionally, time series of daily FRP data were constructed following the same procedures described here for Nf. A statistical association analysis was then carried out between the data collected on site and the time series of fire counts and FRP. A source footprint analysis was performed by combining the BrC observations, back trajectories, and MODIS-retrieved FRP (the Supplement).
2.5 PM2.5 and eBC from the city monitoring stations
We retrieved PM2.5 concentrations from the public air quality monitoring data repository of the Air Quality Monitoring Network of Bogotá. The air quality network data were used to contrast their magnitude and temporal patterns to those of the eBC and BrC observations at the Monserrate site. The PM2.5 record from the air quality network covers the entire monitoring period. The air quality network has 11 stations across the city (Fig. 1).
Multi-wavelength observations of babs were used to apply Eq. (2) as described in Sect. 2.2 to obtain eBC, the absorption Ängström exponent, fBB, babs,BB (at 470 and 880 nm), and the corresponding estimated BrC, all with hourly and daily temporal resolution. The complete time series of daily mean observations of eBC and BrC at the Monserrate site can be seen in Fig. 2. Two short maintenance and calibration periods are seen in the dataset as missing values. Mean total aerosol absorption babs at 880 nm for the observation period was . The large variability in the data occurs at both daily and monthly timescales. There is a marked seasonal cycle, with mean babs=15.0 Mm−1 for January to March (JFM) and 5.0 Mm−1 for June to August (JJA). Similarly, the mean absorption attributable to BB, babs,BB (470 nm), for the entire campaign was 2.41±2.87 Mm−1, with a statistically significant difference between the high BB periods (JFM) and those of low BB activity (JJA). The JFM babs,BB (470 nm) was 4.05 Mm−1, while the JJA mean was 0.71 Mm−1.

Figure 2Time series of (a) PM2.5 (µg m−3) from Bogotá air quality monitoring stations, (b) equivalent black carbon (µg m−3) from the Monserrate site (left axis is babs,880 nm; Mm−1), (c) brown carbon (µg m−3) from the Monserrate site (left axis is bbb,880 nm; Mm−1), and (d) daily MODIS active fire counts in NSA within 600 and 1000 km of Bogotá. Thick lines are 7 d moving averages from the original time series of daily mean values. Faded lines in all panels show daily mean values.
Accordingly, the observed daily mean eBC concentration (Fig. 2b) ranged from 0.02 to 5.0 µg m−3. The inferred BrC concentration were lower, with a maximum daily mean of 0.44 µg m−3. The highest fBB was detected during the 2018–2019 dry season (DJF), reaching up to a monthly mean of 15 % for February. The campaign mean absorption Ängström exponent was close to 1, indicating a strong influence from fossil fuel combustion sources. Observed α was found to vary according to the wavelength pair chosen in its calculation, i.e., and . A sensitivity analysis on the babs,BB (470 nm) depending on the specific wavelengths chosen to calculate the absorption Ängström exponent is included in the Supplement. Additionally, daily mean PM2.5 retrieved from the air quality (AQ) monitoring stations is shown in Fig. 2a, and constructed according to Sect. 2.4 is shown in Fig. 2d.
Day-to-day variations in PM2.5 measured at the AQ monitoring network and eBC observed at the Monserrate site have a similar temporal pattern (Fig. 2a and b). A simple linear correlation analysis between the two datasets using the Spearman correlation, , confirms this relationship as . The high correlation between the two datasets suggests that eBC at the Monserrate site is closely associated with urban emissions. According to a recent emission inventory in Bogotá, mobile and industrial emissions are the dominant primary combustion particle sources in the city. Furthermore, cargo and public transportation have the largest emissions share, and most of those vehicles are diesel-powered (Pachón et al., 2018). To examine the degree of influence of the city emissions at the Monserrate site we analyzed mixed layer height from daily radiosonde data at the airport station (SKBO station). We found that the Monserrate site is typically above the mixed layer early in the morning until 09:30 when the mixing layer expands, surpassing the site altitude (the Supplement). Diurnal concentration patterns for eBC at the Monserrate site and at the air quality monitoring stations support this hypothesis, since morning peak concentrations are observed with a lag of 1.5 to 2 h at the Monserrate site compared to the city AQ stations (the Supplement).
Contrastingly, the BrC observations in Fig. 2 show a significantly different temporal structure compared to both PM2.5 and eBC. A correlation analysis shows a substantially lower correlation, , compared to that of eBC and PM2.5. This dissimilarity in the observed temporal patterns is indicative of a difference in the activity of sources of BrC and those of eBC, suggesting that the BrC signal is controlled by BB outside the city.
3.1 Monthly mean BrC and eBC
The annual cycle for eBC at the Monserrate site (Fig. 3b) is similar to that of PM2.5 registered at the air quality monitoring stations within the city (Fig. 3a), with a bimodal concentration pattern exhibiting maxima from February to March and from October to November. Part of the seasonal pattern in PM2.5 has been previously explained by higher mixing heights during JJA and by lower mixing heights and increased static stability from December to March (Mendez-Espinosa et al., 2019). Monthly mean eBC at the Monserrate site ranges from 0.25 µg m−3 in July to 1.70 µg m−3 during February and November. Consistent with what is observed at a daily timescale, the similarity between the annual eBC and PM2.5 variations is expected as the site is within the urban mixed layer during most of the day and is therefore heavily impacted by urban traffic emissions. BrC seasonality at the Monserrate site, however, is distinctly different from that of either eBC or PM2.5, with a lone maximum from February to April and no second peak in the last months of the year (Fig. 3b). This discrepancy between the seasonal cycles of eBC and BrC strongly suggest that sources of both types of light-absorbing particles have different activity patterns along the year. Since eBC seems to be related to local emissions, the sources of BrC must be regional.
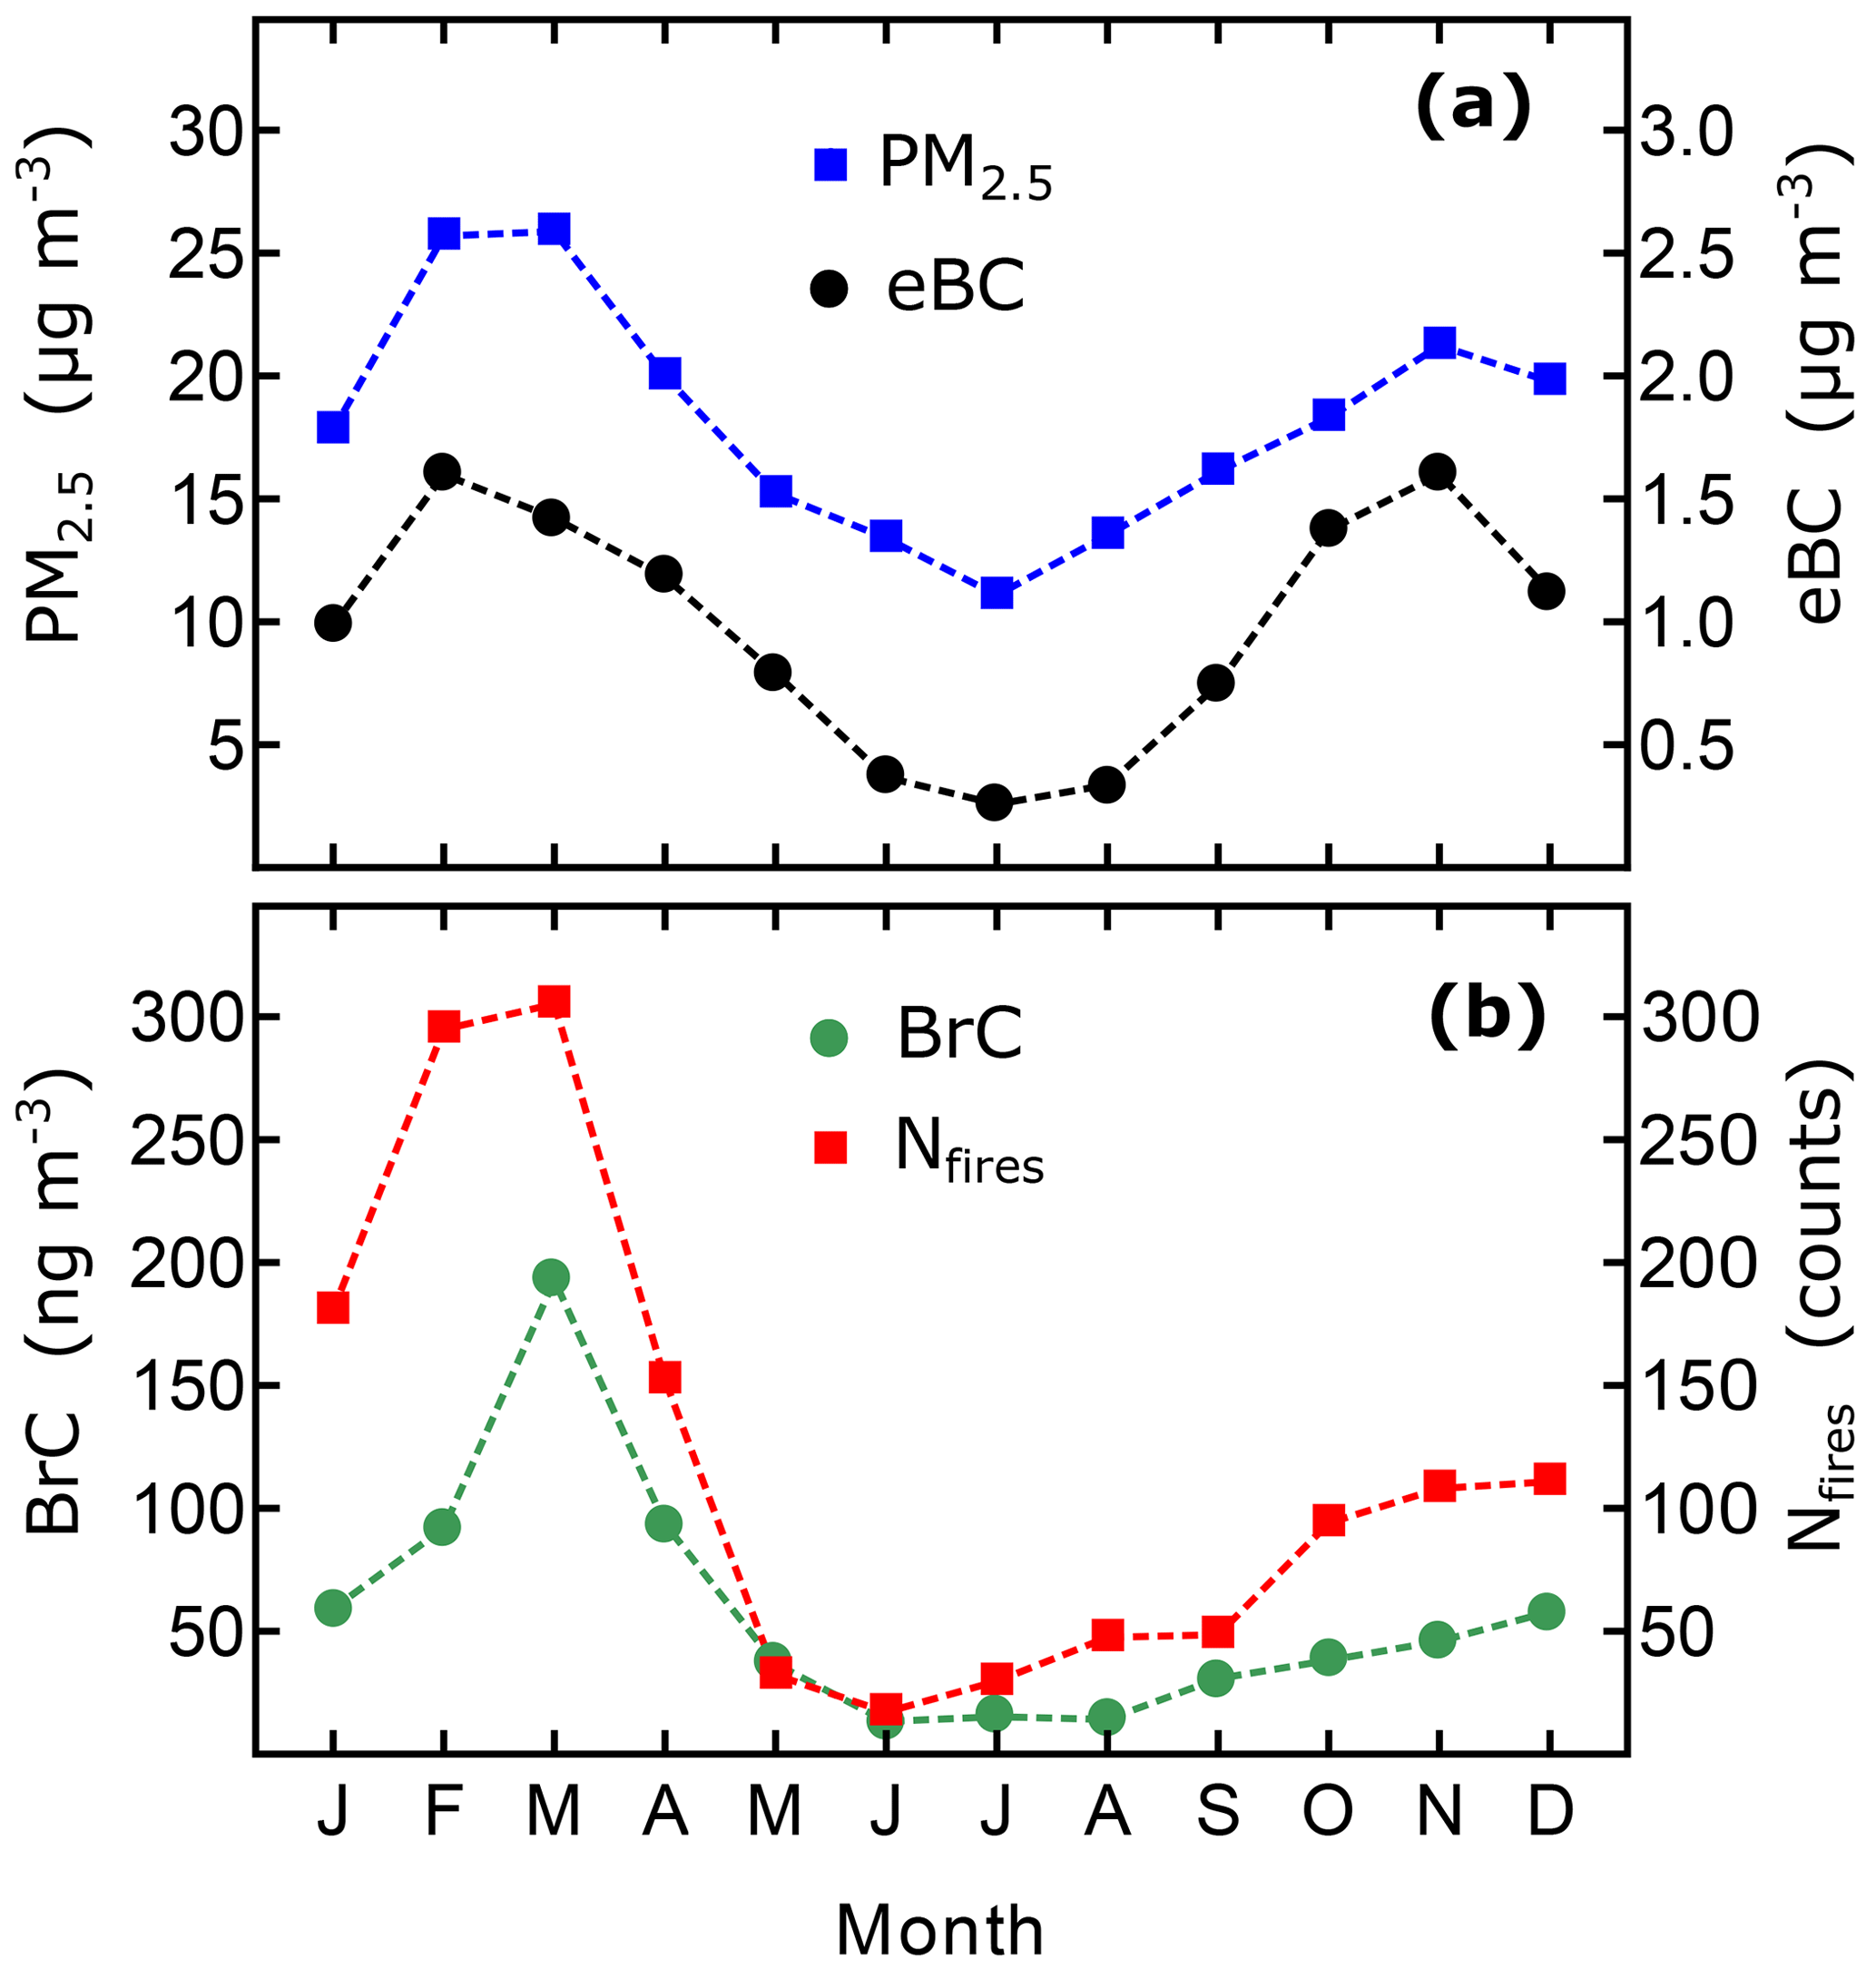
Figure 3Monthly mean time series of Bogotá's PM2.5 (µg m−3), equivalent black carbon (µg m−3), brown carbon (µg m−3), and fire counts. BrC and eBC are measured at the Monserrate site, while the PM2.5 are observations from the air quality monitoring network. Nf is the monthly mean of daily fire counts.
A potential explanation for the distinct seasonality of BrC at the site is found when analyzing the BB activity through MODIS active fire data after applying the fire counting algorithms described in Sect. 2.4. Figure 3b shows that the seasonality of BB activity is similar to that observed for BrC at the site, further suggesting a potential association between BrC measured at the Monserrate site and regional BB activity. Our observations are broadly consistent with other available studies of aerosol absorption in the region that have reported an increase in babs and the Ängström exponent during the dry season. Observations at the ATTO tower in central Amazonia show Mm−1 during the dry season (Saturno et al., 2018). Other observations at Pico Espejo in NSA show Mm−1 during the dry season, corresponding to 3 times the mean value observed during the wet season. However, both sites correspond to locations near the source areas, while our observation site is an urban site far away from the main biomass burning areas.
3.2 Association with MODIS fire counts
To establish whether observed BrC at the Monserrate site is related to regional BB activity, we performed a systematic statistical association analysis between BrC observations and the different fire counting methods described in Sect. 2.4. The Spearman correlation for the daily mean as well as the 7 d moving average for eBC and BrC with Nf were calculated and are summarized in Table 2. Overall, a weak statistical association was found between eBC and Nf, with values much lower than those observed between eBC and PM2.5, confirming that a large fraction of the eBC measured at the site is likely from local fossil fuel combustion sources. Furthermore, regardless of the fire counting scheme applied, the statistical association between BrC and Nf is stronger in all cases than that of eBC and Nf. Thus, despite the proximity of the measurement site to the city and the impact of local emissions, the association between regional BB activity in NSA and BrC suggests that the measurements at the site are able to differentiate the relatively small signal of regional BB from that of local emissions.
Table 2Statistical association expressed through the Spearman correlation between the different fire counting methods and eBC and BrC measured at the Monserrate site. “Mov. avg.” is the Spearman correlation between smoothed time series with a 7 d moving average, and “Daily” represents the Spearman correlations between daily mean variables.
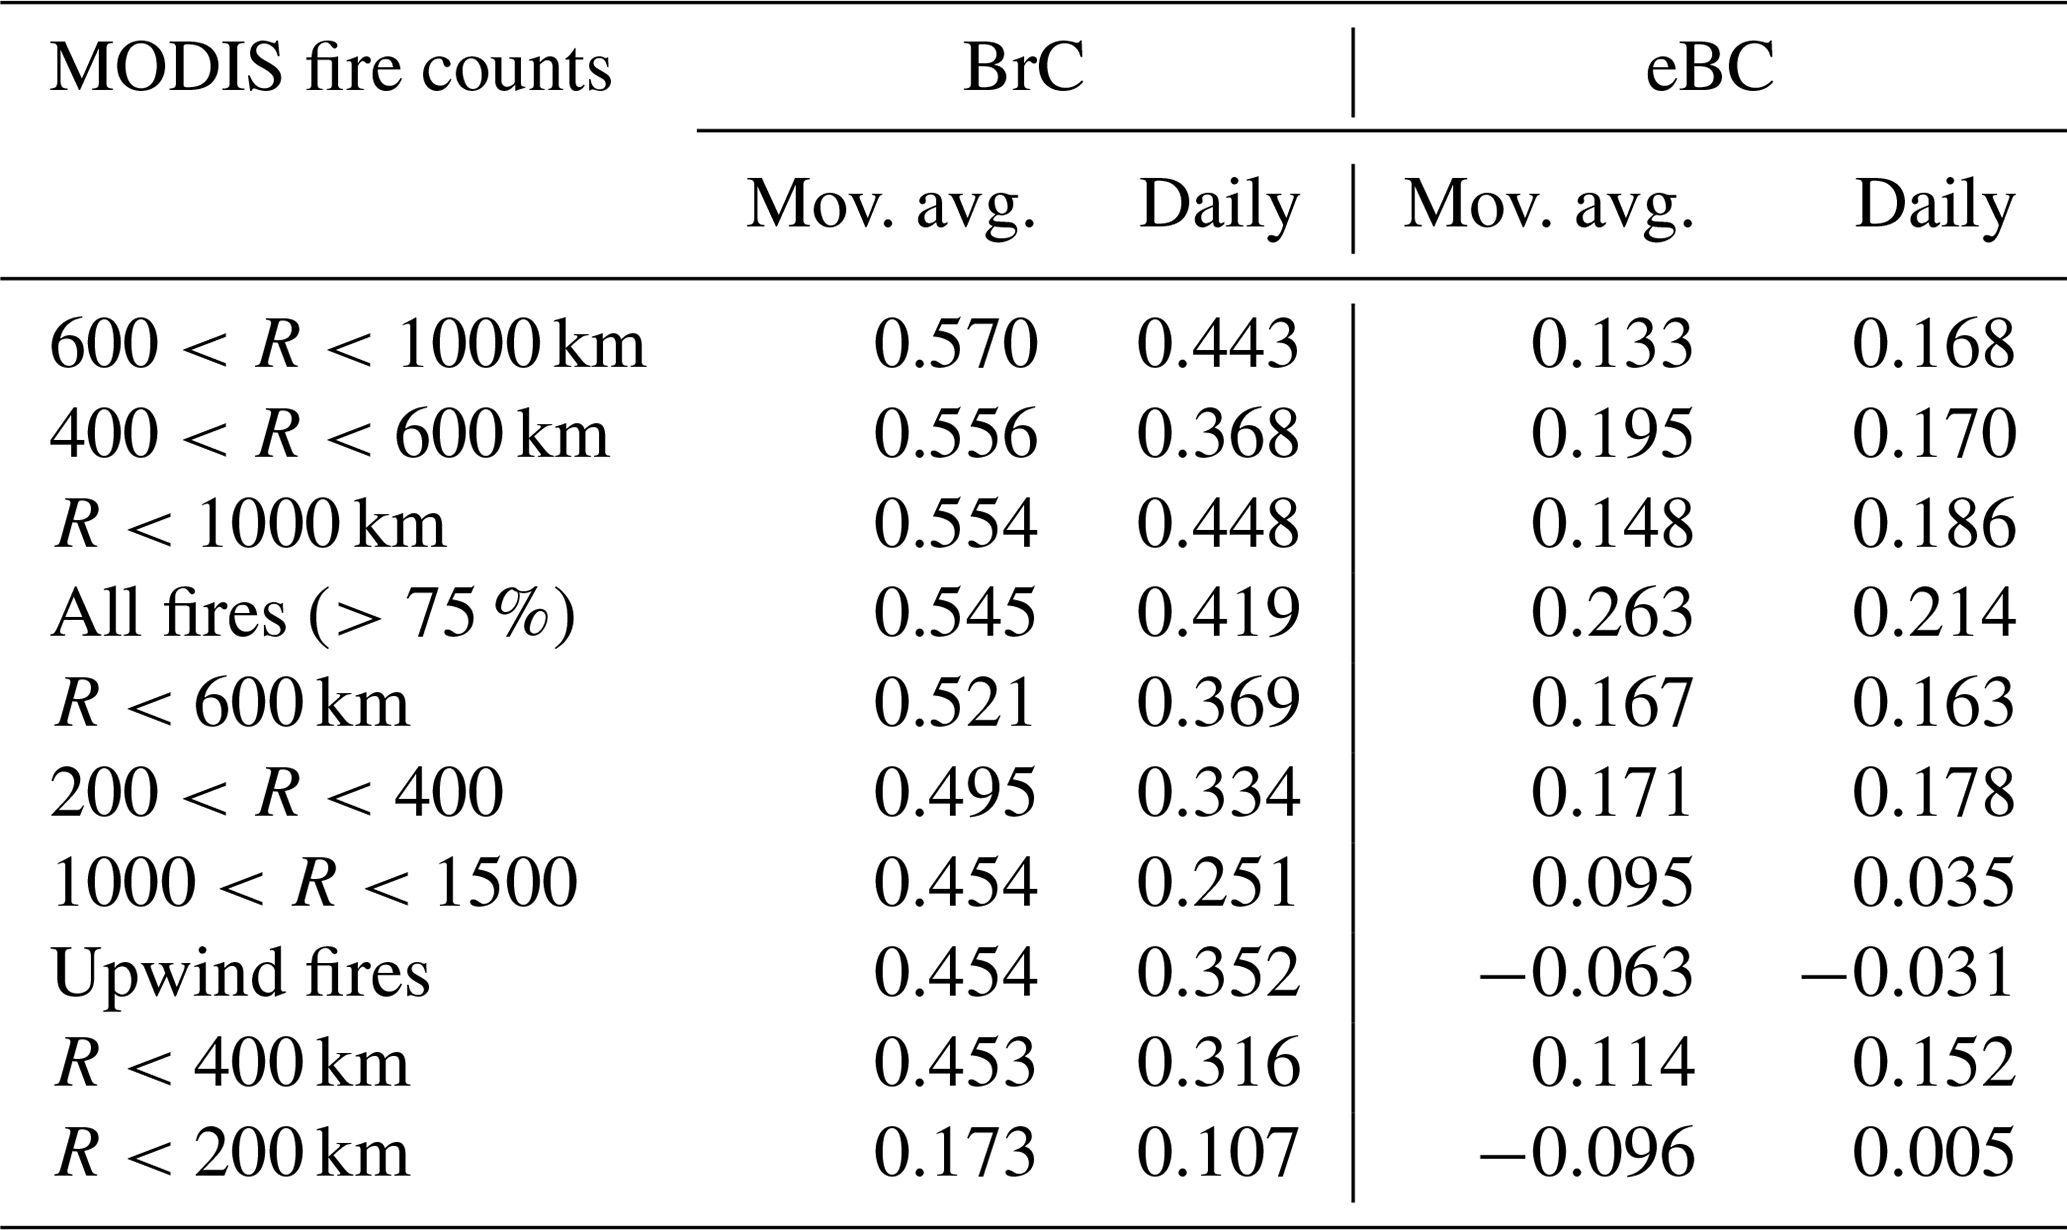
Table 2 is sorted according to the Spearman correlation between the 7 d moving average fire counts and BrC. The result of the analysis shows a stronger association between BrC and distant fires, and the weakest association is for those fires within 200 km of Bogotá. This is likely due to the lower number of nearby fires compared to the abundant hotspots in the savannas and tropical forests in NSA. Therefore, either at a daily or weekly timescale, the concentration of UV-absorbing carbonaceous material in Bogotá is more closely associated with regional BB activity than with local emissions. The fire counting method that only includes upwind fires does not perform much better than the other methods considered. These results are consistent with an increase in the regional BB aerosol background during the dry season. A spatial footprint analysis of BB source areas shows that in the period from December to March, the savannas in the Orinoco River basin are the likely source regions impacting BrC at the Monserrate measurement site (see the Supplement). The travel time of the air masses from the savannas to the measurement site suggests that aging of the organic aerosols can occur.
3.3 Brown carbon and smoke tracers
The continuous BrC measurements described in Sect. 3.1 are a strong indicator of the enhanced presence of UV-absorbing aerosols. However, due to the uncertainties in mass absorption cross sections, aerosol absorption measurements alone are not straightforward to translate into BB aerosol concentrations. To establish the relationship between Aethalometer-based BrC (Sect. 2.2) and analytical methods to quantify BB aerosols (Sect. 2.3), we compared 24 h average BrC concentrations with the smoke markers levoglucosan, galactosan, WSK, and WSOC, as well as EC. The analysis was done for those specific dates on which collocated filter-based samples and optical BrC observations were available, totalling 58 valid dates. A strong linear association was found between BrC and levoglucosan (R2=0.87, slope =0.32), with the linearity spanning the full range of measurements (Fig. 4a), suggesting that the optical measurements of BrC are indeed a good BB tracer. However, recent observational studies of ambient BB particles have shown poor correlation between levoglucosan and brown carbon in aged BB plumes, likely due to BrC photobleaching and the oxidation of levoglucosan (e.g., Wong et al., 2019b). The strong correlation in our samples might indicate atmospheric transport times of up to 2 d, consistent with the lifetime of levoglucosan (Hennigan et al., 2010) and that of BrC recently estimated between 13 and 30 h (Wong et al., 2019b). These atmospheric transport times are consistent with the strong association between BrC and MODIS active fires within 600 km of the sampling site (Table 2).
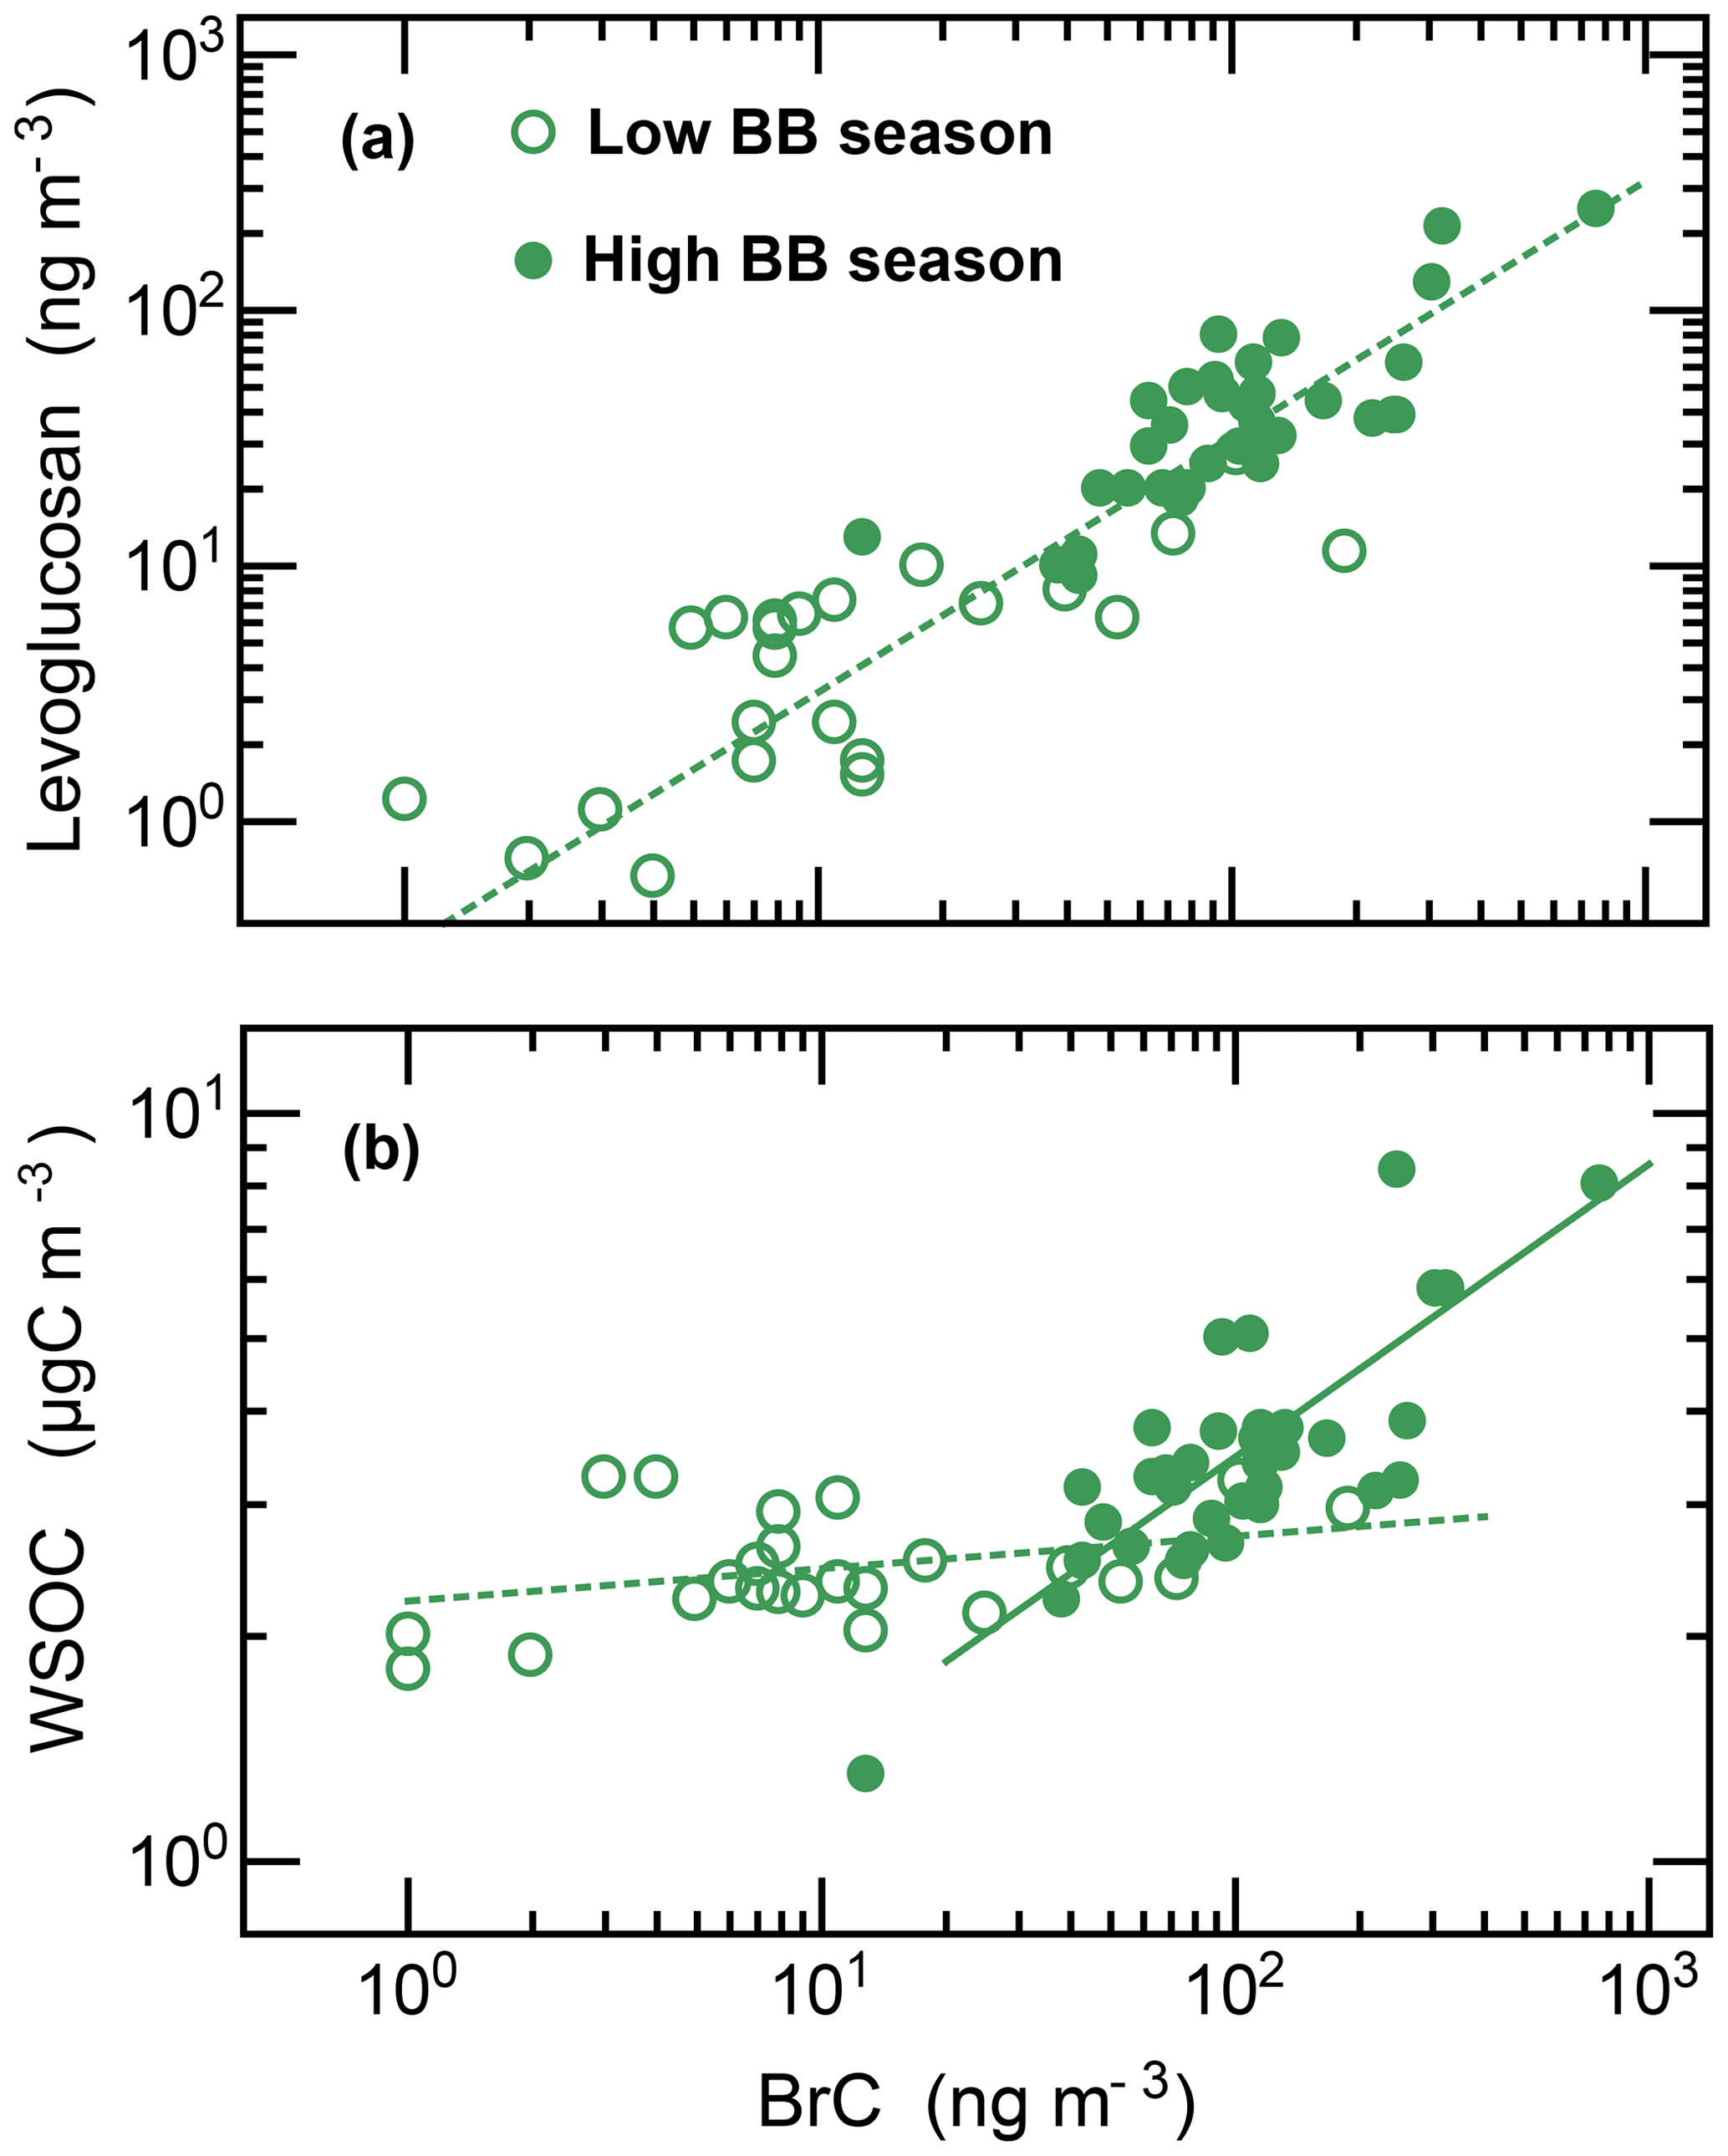
Figure 4Scatter plot of the daily mean concentration of (a) levoglucosan and BrC, as well as (b) WSOC and BrC, measured at the Monserrate site. Filled circles are samples collected during the high BB seasons, and open circles were collected during low BB activity.
Table 3Spearman correlation between optical measurements of carbonaceous aerosol brown carbon (BrC) and black carbon (eBC) as well as the selected smoke tracers levoglucosan (Lev.), galactosan (Gal.), WSOC, WSK, OC, and EC measured at the Monserrate site. Correlation coefficients are shown for all data, as well as for the low and high BB seasons; N represents the number of samples.
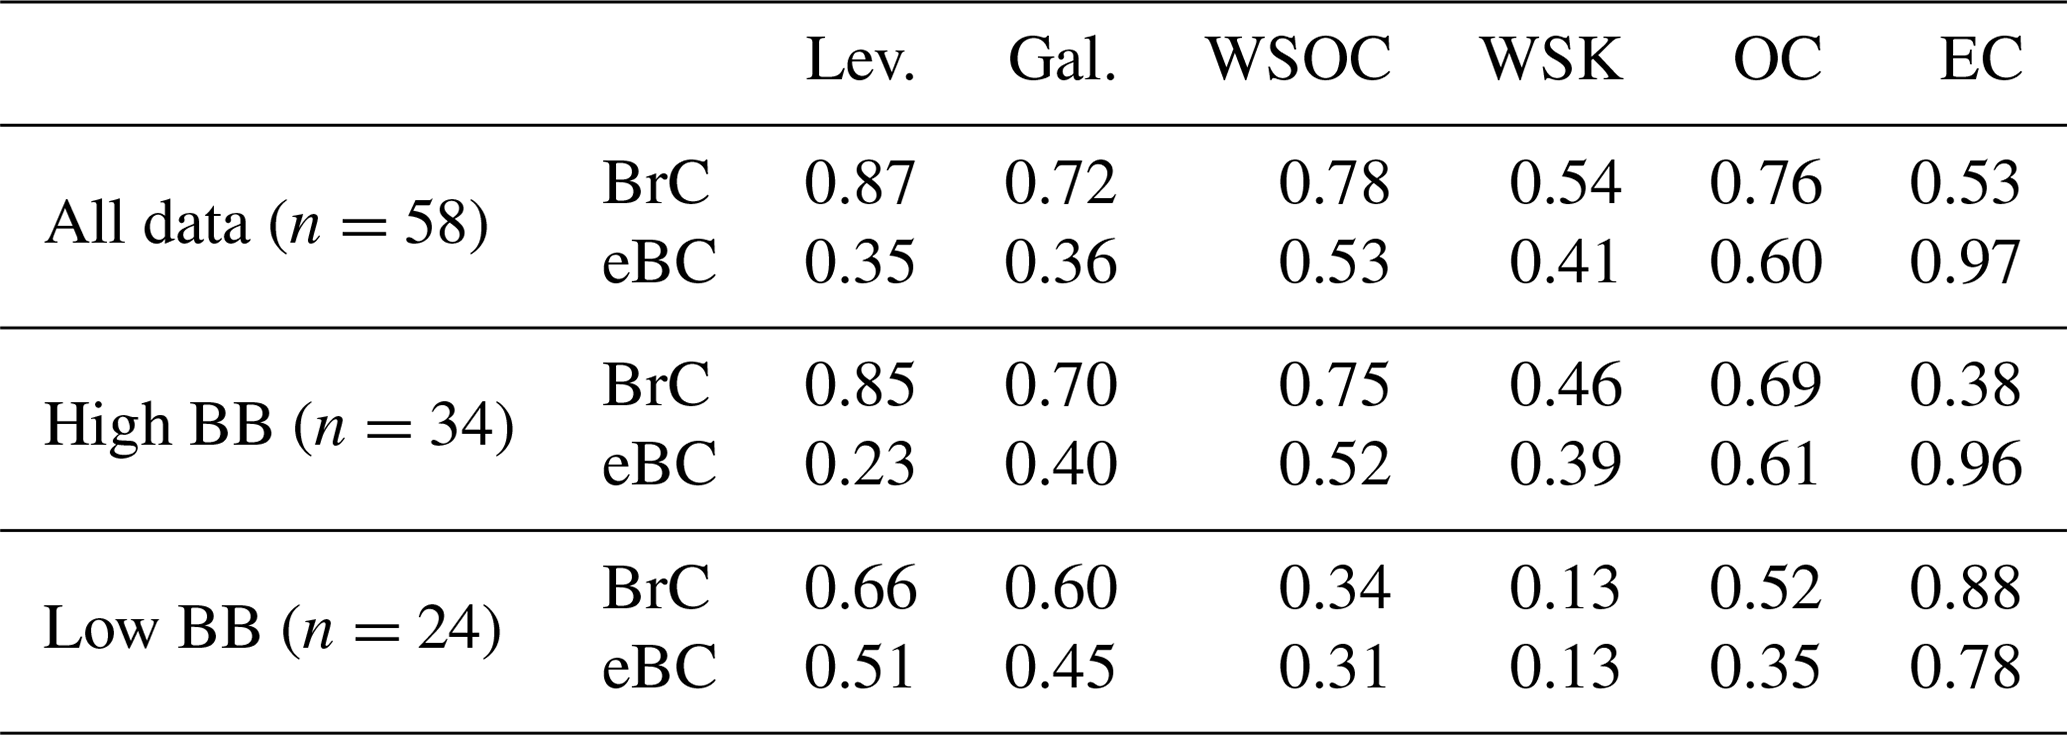
Similarly strong associations were established for WSOC and other tracers (Table 3). When the association analysis is repeated only for data collected during the low BB season (i.e., Campaign 2) the degree of association between BrC and WSOC drops significantly to just 0.34. This indicates that during low BB months (JJA) WSOC has local sources likely not associated with BB. This is further supported by the much stronger association between levoglucosan and WSOC during high BB seasons (0.73) compared to the low BB season (0.38). WSOC remained at values between 2 and 3 µgC m−3, independent of BrC concentration, during the low BB season (Fig. 4b). However, it was seen to increase steeply as a function of BrC for the high BB season. The mean WSOC observed for low BB activity was 2.5 µgC m−3, while for the high BB period it was 4.2 µgC m−3, reaching a maximum daily mean of 8 µgC m−3.
The observed levoglucosan concentrations are relatively low compared to what has been observed in other studies (e.g., Hecobian et al., 2010). However, the measured concentrations of BB tracers are significant considering the distance between the measurement site and the source regions (see the Supplement).
In this study we determine for the first time the presence of medium-range-transported biomass burning aerosols to urban areas in northern South America by direct measurement of biomass burning tracers. The presence of BB-affected air masses was confirmed by multi-wavelength optical measurements of brown carbon and black carbon, as well as by the high-sensitivity detection of the specific smoke tracers levoglucosan and galactosan. Continuous brown carbon measurements were performed during a 3-year period with hourly time resolution. These long-term observations allowed for the characterization of annual patterns of black carbon and brown carbon concentrations at the measurement site.
Despite the close proximity of the measurement site to the city center of a large, relatively polluted urban area, the statistical association between BrC and MODIS active fire data was strong on a daily basis. Furthermore, the association between BrC and fire counts was stronger for distant fires, i.e., those further than 400 km from the measurement site. This finding strongly supports the regional origin of the BB aerosol detected at the site. A source footprint analysis involving remotely sensed fire radiative power data, back-trajectory calculations, and observed BrC concentration further suggests that the eastern grasslands are the main biomass burning source region in NSA actually impacting populated urban areas. Our observations show that the annual pattern of brown carbon at the monitoring site was observed to have a single peak during February and March, coinciding with the peak in biomass burning activity in the region.
High-sensitivity levoglucosan, galactosan, and potassium measurements collocated with optical brown carbon observations were highly linearly correlated and showed excellent agreement. Therefore, the online optical observations at the measurement site were shown to be accurate tracers of BB aerosols when compared with well-established analytical methods. Water-soluble organic carbon (WSOC) was measured during high and low BB seasons. These observations suggest there is 2.5 µgC m−3 of WSOC not related to BB and that BB can contribute to WSOC, which can reach up to 8 µgC m−3 for a 24 h period.
The findings of this work demonstrate that background aerosol levels are increased every year due to the presence of biomass burning aerosols. The observed brown carbon and smoke tracer concentrations increase in close relation to the number of MODIS-detected fires. Despite the overwhelming black carbon signal coming from traffic emissions, a clear relation between the brown carbon signal and regional biomass burning aerosols is established. These results highlight the fact that even distant biomass burning sources resulting from uncontrolled agricultural burns and deforestation negatively impact air quality in densely populated areas hundreds of kilometers away and that they do so on a regular basis. During our observation period, the month with the largest contribution of BB aerosols to light-absorbing material was March, with 10 %±5 %. The month with the largest load of BB aerosols was February 2019, with 15 %±6 %. The uncertainty estimates in this fraction are due to uncertainty in the assumed absorption Ängström exponent for biomass burning and fossil fuel burning used in the attribution algorithm.
The data used in this article are available and will be provided upon request.
The supplement related to this article is available online at: https://doi.org/10.5194/acp-20-7459-2020-supplement.
RMB and LCB were responsible for conceptualization. JMRR, MARC, MQA, RMB, and APS conducted the investigation. RMB, JFME, and APS cooperated on the methodology. JMRR and RMB wrote the original draft. APS, JFME, and LCB were responsible for review and editing. RMB, JMRR, and MARC created the visualization.
The authors declare that they have no conflict of interest.
The authors thank the Sanctuary of Monserrate administration and Mons. Sergio Pulido Gutierrez for kindly allowing the display of measurement devices and providing sustained logistic support throughout the measurement period.
This research has been supported by the Colombian Administrative Department of Science, Technology and Innovation – COLCIENCIAS (grant no. FP44842-050-2017) and the Office of the Vice Dean for Research of Universidad de los Andes (FAPA program).
This paper was edited by Manish Shrivastava and reviewed by three anonymous referees.
Akagi, S. K., Yokelson, R. J., Wiedinmyer, C., Alvarado, M. J., Reid, J. S., Karl, T., Crounse, J. D., and Wennberg, P. O.: Emission factors for open and domestic biomass burning for use in atmospheric models, Atmos. Chem. Phys., 11, 4039–4072, https://doi.org/10.5194/acp-11-4039-2011, 2011. a
Andreae, M. O. and Gelencsér, A.: Black carbon or brown carbon? The nature of light-absorbing carbonaceous aerosols, Atmos. Chem. Phys., 6, 3131–3148, https://doi.org/10.5194/acp-6-3131-2006, 2006. a
Aurell, J. and Gullett, B. K.: Emission Factors from Aerial and Ground Measurements of Field and Laboratory Forest Burns in the Southeastern U.S.: PM2.5, Black and Brown Carbon, VOC, and PCDD/PCDF, Environ. Sci. Technol., 47, 8443–8452, https://doi.org/10.1021/es402101k, 2013. a
Birch, M. E. and Cary, R. A.: Elemental Carbon-Based Method for Monitoring Occupational Exposures to Particulate Diesel Exhaust, Aerosol Sci. Tech., 25, 221–241, https://doi.org/10.1080/02786829608965393, 1996. a
Bond, T. C., Streets, D. G., Yarber, K. F., Nelson, S. M., Woo, J.-H., and Klimont, Z.: A technology-based global inventory of black and organic carbon emissions from combustion, J. Geophys. Res.-Atmos., 109, D14203, https://doi.org/10.1029/2003JD003697, 2004. a
Bond, T. C., Doherty, S. J., Fahey, D. W., Forster, P. M., Berntsen, T., DeAngelo, B. J., Flanner, M. G., Ghan, S., Kärcher, B., Koch, D., Kinne, S., Kondo, Y., Quinn, P. K., Sarofim, M. C., Schultz, M. G., Schulz, M., Venkataraman, C., Zhang, H., Zhang, S., Bellouin, N., Guttikunda, S. K., Hopke, P. K., Jacobson, M. Z., Kaiser, J. W., Klimont, Z., Lohmann, U., Schwarz, J. P., Shindell, D., Storelvmo, T., Warren, S. G., and Zender, C. S.: Bounding the role of black carbon in the climate system: A scientific assessment, J. Geophys. Res.-Atmos., 118, 5380–5552, https://doi.org/10.1002/jgrd.50171, 2013. a
Carslaw, D. C. and Ropkins, K.: Openair – An R package for air quality data analysis, Environ. Model. Softw., 27/28, 52–61, https://doi.org/10.1016/j.envsoft.2011.09.008, 2012. a
Chen, S., Russell, L., Cappa, C., Zhang, X., Kleeman, M., Kumar, A., Liu, D., and Ramanathan, V.: Comparing black and brown carbon absorption from AERONET and surface measurements at wintertime Fresno, Atmos. Environ., 199, 164–176, https://doi.org/10.1016/j.atmosenv.2018.11.032, 2018. a
Cottle, P., Strawbridge, K., and McKendry, I.: Long-range transport of Siberian wildfire smoke to British Columbia: Lidar observations and air quality impacts, Atmos. Environ., 90, 71–77, https://doi.org/10.1016/j.atmosenv.2014.03.005, 2014. a
Crutzen, P. J. and Andreae, M. O.: Biomass Burning in the Tropics : Impact on Atmospheric Chemistry and Biogeochemical Cycles, Science, 250, 1669–1678, https://doi.org/10.1126/science.250.4988.1669, 1991. a
Cubison, M. J., Ortega, A. M., Hayes, P. L., Farmer, D. K., Day, D., Lechner, M. J., Brune, W. H., Apel, E., Diskin, G. S., Fisher, J. A., Fuelberg, H. E., Hecobian, A., Knapp, D. J., Mikoviny, T., Riemer, D., Sachse, G. W., Sessions, W., Weber, R. J., Weinheimer, A. J., Wisthaler, A., and Jimenez, J. L.: Effects of aging on organic aerosol from open biomass burning smoke in aircraft and laboratory studies, Atmos. Chem. Phys., 11, 12049–12064, https://doi.org/10.5194/acp-11-12049-2011, 2011. a
de Oliveira Alves, N., Brito, J., Caumo, S., Arana, A., de Souza Hacon, S., Artaxo, P., Hillamo, R., Teinilä, K., de Medeiros, S. R. B., and de Castro Vasconcellos, P.: Biomass burning in the Amazon region: Aerosol source apportionment and associated health risk assessment, Atmos. Environ., 120, 277–285, https://doi.org/10.1016/j.atmosenv.2015.08.059, 2015. a
Donnelly, A. A., Broderick, B. M., and Misstear, B. D.: The effect of long-range air mass transport pathways on PM10 and NO2 concentrations at urban and rural background sites in Ireland: Quantification using clustering techniques, J. Environ. Sci. Heal. Pt A, 50, 647–658, https://doi.org/10.1080/10934529.2015.1011955, 2015. a, b
Draxler, R. and Hess, G.: An Overview of the HYSPLIT_4 Modelling System for Trajectories, Dispersion, and Deposition, Aust. Meteorol. Mag., 47, 295–308, 1998. a
Drinovec, L., Močnik, G., Zotter, P., Prévôt, A. S. H., Ruckstuhl, C., Coz, E., Rupakheti, M., Sciare, J., Müller, T., Wiedensohler, A., and Hansen, A. D. A.: The “dual-spot” Aethalometer: An improved measurement of aerosol black carbon with real-time loading compensation, Atmos. Meas. Tech., 8, 1965–1979, https://doi.org/10.5194/amt-8-1965-2015, 2015. a, b
Forster, C., Wandinger, U., Wotawa, G., James, P., Mattis, I., Althausen, D., Simmonds, P., O'Doherty, S., Jennings, S. G., Kleefeld, C., Schneider, J., Trickl, T., Kreipl, S., Jäger, H., and Stohl, A.: Transport of boreal forest fire emissions from Canada to Europe, J. Geophys. Res., 106, 22887–22906, https://doi.org/10.1029/2001JD900115, 2001. a
Garcia-Hurtado, E., Pey, J., Borrás, E., Sánchez, P., Vera, T., Carratalá, A., Alastuey, A., Querol, X., and Vallejo, V. R.: Atmospheric PM and volatile organic compounds released from Mediterranean shrubland wildfires, Atmos. Environ., 89, 85–92, https://doi.org/10.1016/j.atmosenv.2014.02.016, 2014. a
Gonçalves, C., Figueiredo, B. R., Alves, C. A., Cardoso, A. A., Da Silva, R., Kanzawa, S. H., and Vicente, A. M.: Chemical characterisation of total suspended particulate matter from a remote area in Amazonia, Atmos. Res., 182, 102–113, https://doi.org/10.1016/J.ATMOSRES.2016.07.027, 2016. a
Haikerwal, A., Akram, M., Del Monaco, A., Smith, K., Sim, M. R., Meyer, M., Tonkin, A. M., Abramson, M. J., and Dennekamp, M.: Impact of Fine Particulate Matter (PM2.5) Exposure During Wildfires on Cardiovascular Health Outcomes., J. Am. Heart Assoc., 4, e001653, https://doi.org/10.1161/JAHA.114.001653, 2015. a
Hamburger, T., Matisāns, M., Tunved, P., Ström, J., Calderon, S., Hoffmann, P., Hochschild, G., Gross, J., Schmeissner, T., Wiedensohler, A., and Krejci, R.: Long-term in situ observations of biomass burning aerosol at a high altitude station in Venezuela: Sources, impacts and interannual variability, Atmos. Chem. Phys., 13, 9837–9853, https://doi.org/10.5194/acp-13-9837-2013, 2013. a
Harrison, R. M., Beddows, D. C., Jones, A. M., Calvo, A., Alves, C., and Pio, C.: An evaluation of some issues regarding the use of Aethalometers to measure woodsmoke concentrations, Atmos. Environ., 80, 540–548, https://doi.org/10.1016/j.atmosenv.2013.08.026, 2013. a, b
Hecobian, A., Zhang, X., Zheng, M., Frank, N., Edgerton, E. S., and Weber, R. J.: Water-Soluble Organic Aerosol material and the light-absorption characteristics of aqueous extracts measured over the Southeastern United States, Atmos. Chem. Phys., 10, 5965–5977, https://doi.org/10.5194/acp-10-5965-2010, 2010. a, b, c
Hennigan, C. J., Sullivan, A. P., Collett Jr., J. L., and Robinson, A. L.: Levoglucosan stability in biomass burning particles exposed to hydroxyl radicals, Geophys. Res. Lett., 37, L09806, https://doi.org/10.1029/2010GL043088, 2010. a, b
Hernandez, A. J., Morales-Rincon, L. A., W., D., Mallia, D., Lin, J., and Jimenez, R.: Transboundary transport of biomass burning aerosols and photochemical pollution in the Orinoco River Basin, Atmos. Environ., 205, 1–8, https://doi.org/10.1016/j.atmosenv.2019.01.051, 2019. a
Janhäll, S., Andreae, M. O., and Pöschl, U.: Biomass burning aerosol emissions from vegetation fires: particle number and mass emission factors and size distributions, Atmos. Chem. Phys., 10, 1427–1439, https://doi.org/10.5194/acp-10-1427-2010, 2010. a
Jeong, C., Hopke, P., Kim, E., and Lee, D.: The comparison between thermal-optical transmittance Elemental Carbon and Aethalometer Black Carbon measured at multiple monitoring sites, Atmos. Environ., 38, 5193–5204, https://doi.org/10.1016/j.atmosenv.2004.02.065, 2004. a
Justice, C. O., Giglio, L., Korontzi, S., Owens, J., Morisette, J. T., Roy, D., Descloitres, J., Alleaume, S., Petitcolin, F., and Kaufman, Y.: The MODIS fire products, Remote Sens. Environ., 83, 244–262, https://doi.org/10.1016/S0034-4257(02)00076-7, 2002. a
Kirchstetter, T. W., Novakov, T., and Hobbs, P. V.: Evidence that the spectral dependence of light absorption by aerosols is affected by organic carbon, J. Geophys. Res., 109, D21208, https://doi.org/10.1029/2004JD004999, 2004. a, b, c
Koch, D., Bond, T. C., Streets, D., Unger, N., and van der Werf, G. R.: Global impacts of aerosols from particular source regions and sectors, J. Geophys. Res., 112, D02205, https://doi.org/10.1029/2005JD007024, 2007. a
Kollanus, V., Tiittanen, P., Niemi, J. V., and Lanki, T.: Effects of long-range transported air pollution from vegetation fires on daily mortality and hospital admissions in the Helsinki metropolitan area, Finland, Environ. Res., 151, 351–358, https://doi.org/10.1016/J.ENVRES.2016.08.003, 2016. a
Lack, D. A. and Langridge, J. M.: On the attribution of black and brown carbon light absorption using the Ångström exponent, Atmos. Chem. Phys., 13, 10535–10543, https://doi.org/10.5194/acp-13-10535-2013, 2013. a, b, c
Lack, D. A., Bahreini, R., Langridge, J. M., Gilman, J. B., and Middlebrook, A. M.: Brown carbon absorption linked to organic mass tracers in biomass burning particles, Atmos. Chem. Phys., 13, 2415–2422, https://doi.org/10.5194/acp-13-2415-2013, 2013. a, b
Laskin, A., Laskin, J., and Nizkorodov, S. A.: Chemistry of Atmospheric Brown Carbon, Chem. Rev., 115, 4335–4382, https://doi.org/10.1021/cr5006167, 2015. a
Marengo, J. A., Tomasella, J., Alves, L. M., Soares, W. R., and Rodriguez, D. A.: The drought of 2010 in the context of historical droughts in the Amazon region, Geophys. Res. Lett., 38, L12703, https://doi.org/10.1029/2011GL047436, 2011. a
Martinsson, J., Abdul Azeem, H., Sporre, M. K., Bergström, R., Ahlberg, E., Öström, E., Kristensson, A., Swietlicki, E., and Eriksson Stenström, K.: Carbonaceous aerosol source apportionment using the Aethalometer model – evaluation by radiocarbon and levoglucosan analysis at a rural background site in southern Sweden, Atmos. Chem. Phys., 17, 4265–4281, https://doi.org/10.5194/acp-17-4265-2017, 2017. a
Massabò, D., Caponi, L., Bernardoni, V., Bove, M., Brotto, P., Calzolai, G., Cassola, F., Chiari, M., Fedi, M., Fermo, P., Giannoni, M., Lucarelli, F., Nava, S., Piazzalunga, A., Valli, G., Vecchi, R., and Prati, P.: Multi-wavelength optical determination of black and brown carbon in atmospheric aerosols, Atmos. Environ., 108, 1–12, 2015. a, b
Mendez-Espinosa, J., Belalcazar, L., and Morales Betancourt, R.: Regional Air Quality Impact of Northern South America Biomass Burning Emissions, Atmos. Environ., 203, 131–140, https://doi.org/10.1016/j.atmosenv.2019.01.042, 2019. a, b, c, d, e, f, g, h
Mkoma, S. L., Kawamura, K., and Fu, P. Q.: Contributions of biomass/biofuel burning to organic aerosols and particulate matter in Tanzania, East Africa, based on analyses of ionic species, organic and elemental carbon, levoglucosan and mannosan, Atmos. Chem. Phys., 13, 10325–10338, https://doi.org/10.5194/acp-13-10325-2013, 2013. a
Pachón, J. E., Weber, R. J., Zhang, X., Mulholland, J. A., and Russell, A. G.: Revising the use of potassium (K) in the source apportionment of PM2.5, Atmos. Poll. Res., 4, 14–21, 2013. a
Pachón, J. E., Galvis, B., Lombana, O., Carmona, L. G., Fajardo, S., Rincón, A., Meneses, S., Chaparro, R., Nedbor-Gross, R., and Henderson, B.: Development and Evaluation of a Comprehensive Atmospheric Emission Inventory for Air Quality Modeling in the Megacity of Bogotá, Atmosphere, 9, 49 pp., https://doi.org/10.3390/atmos9020049, 2018. a, b, c
Petzold, A., Ogren, J. A., Fiebig, M., Laj, P., Li, S.-M., Baltensperger, U., Holzer-Popp, T., Kinne, S., Pappalardo, G., Sugimoto, N., Wehrli, C., Wiedensohler, A., and Zhang, X.-Y.: Recommendations for reporting “black carbon” measurements, Atmos. Chem. Phys., 13, 8365–8379, https://doi.org/10.5194/acp-13-8365-2013, 2013. a, b
Phuleria, H. C., Fine, P. M., Zhu, Y. F., and Sioutas, C.: Air quality impacts of the October 2003 Southern California wildfires, J. Geophys. Res., 110, D07S20–D07S20, https://doi.org/10.1029/2004JD004626, 2005. a
Poveda, G., Waylen, P. R., and Pulwarty, R. S.: Annual and inter-annual variability of the present climate in northern South America and southern Mesoamerica, Palaeogeogr. Palaeocl., 234, 3–27, https://doi.org/10.1016/j.palaeo.2005.10.031, 2006. a, b, c
Prenni, A. J., Demott, P. J., Sullivan, A. P., Sullivan, R. C., Kreidenweis, S. M., and Rogers, D. C.: Biomass burning as a potential source for atmospheric ice nuclei: Western wildfires and prescribed burns, Geophys. Res. Lett., 39, 1–5, https://doi.org/10.1029/2012GL051915, 2012. a
Pulwarty, R. S., Barry, R. G., Hurst, C. M., Sellinger, K., and Mogollon, L. E.: Meteorology , and Atmospheric Physics Precipitation in the Venezuelan Andes in the Context of Regional Climate, Meteorol. Atmos. Phys., 237, 217–237, 1998. a
Reid, C. E., Jerrett, M., Tager, I. B., Petersen, M. L., Mann, J. K., and Balmes, J. R.: Differential respiratory health effects from the 2008 northern California wildfires: A spatiotemporal approach, Environ. Res., 150, 227–235, https://doi.org/10.1016/J.ENVRES.2016.06.012, 2016. a
Sandradewi, J., Prévot, A. S. H., Szidat, S., Perron, N., Alfarra, M. R., Lanz, V. A., Weingartner, E., and Baltensperger, U.: Using Aerosol Light Absorption Measurements for the Quantitative Determination of Wood Burning and Traffic Emission Contributions to Particulate Matter, Environ. Sci. Technol., 42, 3316–3323, https://doi.org/10.1021/es702253m, 2008. a, b, c, d, e, f
Saturno, J., Holanda, B. A., Pöhlker, C., Ditas, F., Wang, Q., Moran-Zuloaga, D., Brito, J., Carbone, S., Cheng, Y., Chi, X., Ditas, J., Hoffmann, T., Hrabe de Angelis, I., Könemann, T., Lavrič, J. V., Ma, N., Ming, J., Paulsen, H., Pöhlker, M. L., Rizzo, L. V., Schlag, P., Su, H., Walter, D., Wolff, S., Zhang, Y., Artaxo, P., Pöschl, U., and Andreae, M. O.: Black and brown carbon over central Amazonia: long-term aerosol measurements at the ATTO site, Atmos. Chem. Phys., 18, 12817–12843, https://doi.org/10.5194/acp-18-12817-2018, 2018. a
Schmeissner, T., Krejci, R., Ström, J., Birmili, W., Wiedensohler, A., Hochschild, G., Gross, J., Hoffmann, P., and Calderon, S.: Analysis of number size distributions of tropical free tropospheric aerosol particles observed at Pico Espejo (4765 m a.s.l.), Venezuela, Atmos. Chem. Phys., 11, 3319–3332, https://doi.org/10.5194/acp-11-3319-2011, 2011. a
Shen, Z., Zhang, Q., Cao, J., Zhang, L., Lei, Y., Huang, Y., Huang, R., Gao, J., Zhao, Z., Zhu, C., Xiuli, Y., Zheng, C., Xu, H., and Liu, S.: Optical properties and possible sources of brown carbon in PM2.5 over Xian, China, Atmos. Environ., 150, 322–330, https://doi.org/10.1016/j.atmosenv.2016.11.024, 2017. a
Simoneit, B., Schauer, J., Nolte, C., Oros, D., Elias, V., Fraser, M., Rogge, W., and Cass, G.: Levoglucosan, a tracer for cellulose in biomass burning and atmospheric particles, Atmos. Environ., 33, 173–182, https://doi.org/10.1016/S1352-2310(98)00145-9, 1999. a
Stein, A. F., Draxler, R. R., Rolph, G. D., Stunder, B. J., Cohen, M. D., and Ngan, F.: NOAA's HYSPLIT atmospheric transport and dispersion modeling system, Bull. Am. Meteorol., 96, 2059–2077, https://doi.org/10.1175/BAMS-D-14-00110.1, 2015. a
Stohl, A., Aamaas, B., Amann, M., Baker, L. H., Bellouin, N., Berntsen, T. K., Boucher, O., Cherian, R., Collins, W., Daskalakis, N., Dusinska, M., Eckhardt, S., Fuglestvedt, J. S., Harju, M., Heyes, C., Hodnebrog, Hao, J., Im, U., Kanakidou, M., Klimont, Z., Kupiainen, K., Law, K. S., Lund, M. T., Maas, R., MacIntosh, C. R., Myhre, G., Myriokefalitakis, S., Olivié, D., Quaas, J., Quennehen, B., Raut, J. C., Rumbold, S. T., Samset, B. H., Schulz, M., Seland, Shine, K. P., Skeie, R. B., Wang, S., Yttri, K. E., and Zhu, T.: Evaluating the climate and air quality impacts of short-lived pollutants, Atmos. Chem. Phys., 15, 10529–10566, https://doi.org/10.5194/acp-15-10529-2015, 2015. a
Su, L., Yuan, Z., Fung, J. C., and Lau, A. K.: A comparison of HYSPLIT backward trajectories generated from two GDAS datasets, Sci. Total Environ., 506/507, 527–537, https://doi.org/10.1016/J.SCITOTENV.2014.11.072, 2015. a
Sullivan, A. P. and Weber, R. J.: Chemical characterization of the ambient organic aerosol soluble in water: 1. Isolation of hydrophobic and hydrophilic fractions with a XAD-8 resin, J. Geophys. Res., 111, D05314, https://doi.org/10.1029/2005JD006485, 2006a. a
Sullivan, A. P. and Weber, R. J.: Chemical characterization of the ambient organic aerosol soluble in water: 2. Isolation of acid, neutral, and basic fractions by modified size-exclusion chromatography, J. Geophys. Res., 111, D05315, https://doi.org/10.1029/2005JD006486, 2006b. a, b
Sullivan, A. P., Holden, A. S., Patterson, L. A., McMeeking, G. R., Kreidenweis, S. M., Malm, W. C., Hao, W. M., Wold, C. E., and Collett Jr., J. L.: A method for smoke marker measurements and its potential application for determining the contribution of biomass burning from wildfires and prescribed fires to ambient PM2.5 organic carbon, J. Geophys. Res.-Atmos., 113, D22302, https://doi.org/10.1029/2008JD010216, 2008. a, b, c
Sullivan, A. P., Frank, N., Kenski, D. M., and Collett, J. L.: Application of high-performance anion-exchange chromatography-pulsed amperometric detection for measuring carbohydrates in routine daily filter samples collected by a national network: 1 Determination of the impact of biomass burning in the upper Midwest, J. Geophys. Res., 116, D08302, https://doi.org/10.1029/2010JD014169, 2011. a, b
Thornhill, G. D., Ryder, C. L., Highwood, E. J., Shaffrey, L. C., and Johnson, B. T.: The effect of South American biomass burning aerosol emissions on the regional climate, Atmos. Chem. Phys., 18, 5321–5342, https://doi.org/10.5194/acp-18-5321-2018, 2018. a
Tsimpidi, A. P., Karydis, V. A., Pandis, S. N., and Lelieveld, J.: Global
combustion sources of organic aerosols: model
comparison with
84 AMS factor-analysis data sets, Atmos. Chem. Phys., 16, 8939–8962,
https://doi.org/10.5194/acp-16-8939-2016, 2016. a
Tzompa-Sosa, Z. A., Sullivan, A. P., Retama, A., and Kreidenweis, S. M.: Contribution of Biomass Burning to Carbonaceous Aerosols in Mexico City during May 2013, Aerosol Air Qual. Res., 16, 114–124, https://doi.org/10.4209/aaqr.2015.01.0030, 2016. a
van der Werf, G. R., Randerson, J. T., Giglio, L., Collatz, G. J., Mu, M., Kasibhatla, P. S., Morton, D. C., DeFries, R. S., Jin, Y., and van Leeuwen, T. T.: Global fire emissions and the contribution of deforestation, savanna, forest, agricultural, and peat fires (1997–2009), Atmos. Chem. Phys., 10, 11707–11735, https://doi.org/10.5194/acp-10-11707-2010, 2010. a, b
Virkkula, A., Mäkelä, T., Hillamo, R., Yli-Tuomi, T., Hirsikko, A., Hämeri, K., and Koponen, I.: A Simple Procedure for Correcting Loading Effects of Aethalometer Data, J. Air Waste Manage. Assoc., 57, 1214–1222, https://doi.org/10.3155/1047-3289.57.10.1214, 2007. a
Wang, J., Nie, W., Cheng, Y., Shen, Y., Chi, X., Wang, J., Huang, X., Xie, Y., Sun, P., Xu, Z., Qi, X., Su, H., and Ding, A.: Light absorption of brown carbon in eastern China based on 3-year multi-wavelength aerosol optical property observations and an improved absorption Ångström exponent segregation method, Atmos. Chem. Phys., 18, 9061–9074, https://doi.org/10.5194/acp-18-9061-2018, 2018. a
Weber, R. J., Sullivan, A. P., Peltier, R. E., Russell, A., Yan, B., Zheng, M., de Gouw, J., Warneke, C., Brock, C., Holloway, J. S., Atlas, E. L., and Edgerton, E.: A study of secondary organic aerosol formation in the anthropogenic-influenced southeastern United States, J. Geophys. Res., 112, D13302, https://doi.org/10.1029/2007JD008408, 2007. a
Wong, J. P., Tsagkaraki, M., Tsiodra, I., Mihalopoulos, N., Violaki, K., Kanakidou, M., Sciare, J., Nenes, A., and Weber, R. J.: Effects of Atmospheric Processing on the Oxidative Potential of Biomass Burning Organic Aerosols, Environ. Sci. Technol., 53, 6747–6756, https://doi.org/10.1021/acs.est.9b01034, 2019a. a
Wong, J. P. S., Tsagkaraki, M., Tsiodra, I., Mihalopoulos, N., Violaki, K., Kanakidou, M., Sciare, J., Nenes, A., and Weber, R. J.: Atmospheric evolution of molecular-weight-separated brown carbon from biomass burning, Atmos. Chem. Phys., 19, 7319–7334, https://doi.org/10.5194/acp-19-7319-2019, 2019b. a, b
Yamasoe, M. A., Artaxo, P., Miguel, A. H., and Allen, A. G.: Chemical composition of aerosol particles from direct emissions of vegetation fires in the Amazon Basin: water-soluble species and trace elements, Atmos. Environ., 34, 1641–1653, https://doi.org/10.1016/S1352-2310(99)00329-5, 2000. a
Yan, C., Zheng, M., Bosch, C., Andersson, A., Desyaterik, Y., A.P., S., Collett, J., Zhao, B., Wang, S., He, K., and Gustagsson, O.: Important fossil source contribution to brown carbon in Beijing during winter, Sci. Rep., 7, 43182, https://doi.org/10.1038/srep43182, 2017. a
Youssouf, H., Liousse, C., Roblou, L., Assamoi, E. M., Salonen, R. O., Maesano, C., Banerjee, S., and Annesi-Maesano, I.: Quantifying wildfires exposure for investigating health-related effects, Atmos. Environ., 97, 239–251, https://doi.org/10.1016/j.atmosenv.2014.07.041, 2014. a