the Creative Commons Attribution 4.0 License.
the Creative Commons Attribution 4.0 License.
Heavy air pollution with a unique “non-stagnant” atmospheric boundary layer in the Yangtze River middle basin aggravated by regional transport of PM2.5 over China
Chao Yu
Tianliang Zhao
Yongqing Bai
Lei Zhang
Shaofei Kong
Xingna Yu
Jinhai He
Chunguang Cui
Yinchang You
Guoxu Ma
Ming Wu
Jiacheng Chang
The regional transport of air pollutants, controlled by emission sources and meteorological factors, results in a complex source–receptor relationship of air pollution change. Wuhan, a metropolis in the Yangtze River middle basin (YRMB) of central China, experienced heavy air pollution characterized by hourly PM2.5 concentrations reaching 471.1 µg m−3 in January 2016. To investigate the regional transport of PM2.5 over central eastern China (CEC) and the meteorological impact on wintertime air pollution in the YRMB area, observed meteorological and other relevant environmental data from January 2016 were analyzed. Our analysis presented noteworthy cases of heavy PM2.5 pollution in the YRMB area with unique “non-stagnant” meteorological conditions of strong northerly winds, no temperature inversion, and additional unstable structures in the atmospheric boundary layer. This unique set of conditions differed from the stagnant meteorological conditions characterized by near-surface weak winds, air temperature inversion, and stable structure in the boundary layer that are typically observed in heavy air pollution over most regions in China. The regional transport of PM2.5 over CEC aggravated PM2.5 levels, thus creating heavy air pollution in the YRMB area. This demonstrates a source–receptor relationship between the originating air pollution regions in CEC and the receiving YRMB region. Furthermore, a backward trajectory simulation using a Flexible Particle dispersion (FLEXPART) Weather Research and Forecasting (WRF) model to integrate the air pollutant emission inventory over China was used to explore the patterns of regional transport of PM2.5 governed by the strong northerly winds in the cold air activity of the East Asian winter monsoon season. It was estimated that the regional transport of PM2.5 from non-local air pollutant emissions contributes more than 65 % of the PM2.5 concentrations to the heavy air pollution in the YRMB region during the study period, revealing the importance of the regional transport of air pollutants over China as a causative factor of heavy air pollution over the YRMB area.
- Article
(8367 KB) - Full-text XML
-
Supplement
(1563 KB) - BibTeX
- EndNote
Haze pollution can result in serious environmental problems that adversely influence human health, climate change, and other significant aspects (An et al., 2019; Fuzzi et al., 2015; Nel, 2005). Based on observations in China, there is a well-established association between haze pollution and high concentrations of PM2.5 (particulate matter with an aerodynamic diameter equal to or less than 2.5 µm). Air pollution levels are highly dependent on the emissions of air pollutants and changes in meteorology (An et al., 2019; Tie et al., 2017; J. Xu et al., 2016; X. Xu et al., 2016). The accumulation, maintenance, and dissipation of haze pollution events are generally determined by meteorological changes (Zhang et al., 2013, 2015), among which boundary layer structures play the most important role (Zhao et al., 2013). Meteorological conditions of stagnation, characterized by near-surface low winds, high humidity, and stable boundary layers, could govern the periodic variations in haze pollution, which present as typical wintertime air pollution in China (Huang et al., 2018; X. Xu et al., 2016; Zhang et al., 2013). Major anthropogenic pollutant sources exist over the vast flatland in central eastern China (CEC), from the eastern edges of the Tibetan Plateau and the Loess Plateau to China's Pacific coast. In the CEC, four major regions of emission sources that exhibit haze pollution with excessive PM2.5 concentrations and overall poor air quality are centered over the North China Plain (NCP), the Yangtze River Delta (YRD) in east China, the Pearl River Delta (PRD) in south China, and the Sichuan Basin (SCB) in southwest China. Over recent years, severe haze pollution events that have swept over much of CEC have been attributed to the regional transport of air pollutants (Cheng et al., 2008; Deng et al., 2011; Qiao et al., 2019; Tie et al., 2017; Wang et al., 2016; Zhang et al., 2012). The regional transport of air pollutants with a source–receptor relationship is an important issue in our understanding of changes in air quality.
The source–receptor relationship of air pollution describes the impacts of emissions from an upwind source region to pollutant concentrations or deposition at a downwind receptor area (Seibert and Frank, 2004). The regional transport of source–receptor air pollutants is generally complicated by two types of factors: emissions and meteorology (Voulgarakis et al., 2010; Zhao et al., 2012). The emission factor includes emission source strength of air pollutants and the precursors. Meanwhile, the meteorological factor determines the transport pathway from the source to receptor regions, exchanges between the boundary layer and free troposphere, the chemical transformation and the removal processes occurring over the source and receptor regions as well as along the transport pathways. Driven by atmospheric circulations, the regional transport of PM2.5 from source regions can deteriorate air quality in the downwind receptor regions, leading to the regional haze pollution observed in a large area over China (Chang et al., 2018; He et al., 2017; Hu et al., 2018; Jiang et al., 2015; Wang et al., 2014).
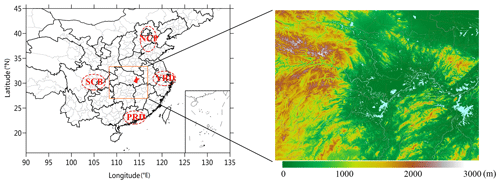
Figure 1(a) Distribution of the YRMB (orange rectangle) with the location of Wuhan (red area) and the major haze pollution regions of NCP, YRD, PRD, and SCB in CEC as well as (b) the YRMB region with terrain height (color contours, m in a.s.l.). The river and lake network (blue areas) are downloaded from https://worldview.earthdata.nasa.gov (last access: 13 June 2020).
The Yangtze River middle basin (YRMB) covers the lower subbasin of two provinces, Hubei and Hunan, in central China. It is geographically surrounded by four major haze pollution regions, the NCP to the north, the YRD to the east, the PRD to the south, and the SCB to the west (Fig. 1a). Due to the specialized location of the YRMB as a regional air pollutant transport hub with subbasin topography (Fig. 1b), the regional transport of air pollutants driven by the cold air flows of the East Asian winter monsoon over the CEC can create a special source–receptor relationship between the source regions of haze pollution in the upstream and the downwind YRMB region (Zhong et al., 2019). However, there are unresolved questions regarding the meteorological processes involved in the regional transport of air pollutants and the patterns of regional transport over CEC that may contribute to the air pollution changes observed in the YRMB area.
Wuhan, a metropolis located in the YRMB, has confronted environmental problems associated with urban air pollution, especially the heavy PM2.5 pollution events that occur frequently in the winter (Gong et al., 2015; Xu et al., 2017). Local emissions of air pollutants from urban transportation, industrial exhaust, and bio-combustion play an important role in the YRMB urban air pollution (Acciai et al., 2017; Zhang et al., 2015). Previous observational and modeling studies on air pollution in this area have been conducted (Wu et al., 2018; Zheng et al., 2019). However, the regional transport routes of PM2.5 across CEC are governed by meteorological drivers and their contribution to air pollution over the YRMB area are poorly understood, especially in relation to heavy air pollution events. This study selected Wuhan as a representative area within the YRMB for investigating the meteorological changes in air pollution events in January 2016 and assessing the contribution of regional transport of PM2.5 over CEC to heavy air pollution in the YRMB area.
2.1 Data
Wuhan, the capital of the Hubei province, is located across the Yangtze River where its surrounding water network contributes to its humid environment (Fig. 1b). In order to analyze the air quality changes in Wuhan, hourly concentrations of air pollutants, including PM2.5 in January 2016, were collected from the national air quality monitoring network operated by the Ministry of Ecology and Environment (http://www.mee.gov.cn/, last access: 13 June 2020), including 10 observational sites in Wuhan, 9 of which were urban sites in residential and industrial zones and 1 of which was suburban (Fig. S1). The air quality observation data are released by the Ministry of Ecology and Environment under quality control that is based on China's national standard of air quality observation.
The meteorological data of surface observations and air sounding in Wuhan and other observatories in CEC were obtained from the Meteorological Data Sharing Network of the China Meteorological Administration (http://data.cma.cn/, last access: 13 June 2020). The data selected for this study included air temperature, relative humidity, air pressure, and wind speed and wind direction. In order to analyze the meteorological variations in the atmospheric boundary layer at the time of our study, we used data with temporal resolutions of 3 h for surface observations and 12 h for sounding observations.
The surface PM2.5 concentrations, averaged over the 10 observational sites in Wuhan, were used to characterize the variations in air pollution in January 2016 over this urban area. Correlation coefficients were calculated between the 10-site averages and the observed meteorological elements, including wind speed and air temperature, in Wuhan to explore the local meteorological influences on the changes in ambient PM2.5 concentrations.
The ERA-Interim reanalysis data from the European Centre for Medium-Range Weather Forecasts (ECMWF) (https://apps.ecmwf.int/datasets/, last access: 13 June 2020) were applied to explore the cold air flows of East Asian winter monsoonal winds in January 2016 and their anomalies during heavy PM2.5 pollution over CEC.
2.2 FLEXPART-WRF modeling
2.2.1 Model description
The Flexible Particle dispersion (FLEXPART) model (Stohl et al., 2003, 2005) is a Lagrangian particle diffusion model developed by the Norwegian Institute for Air Research (NIAR). In this model, the trajectory of a large number of particles released from a source is simulated, considering the processes of tracer transport, turbulent diffusion, and wet and dry depositions in the atmosphere (Brioude et al., 2013). Applying a backward trajectory simulation can determine the distribution of potential source regions that may have an impact on a target point or receptor region (B. Chen et al., 2017; S. Chen et al., 2017; Seibert and Frank, 2004; Zhai et al., 2016).
Initially, the FLEXPART model could be driven by the global reanalysis meteorological data obtained from the ECMWF or the National Centers of Environmental Prediction (NCEP). However, since this study focuses on the fine and multiscale modeling of air pollutant sources and regional transport, the FLEXPART model was driven by the Weather Research and Forecasting (WRF) model to effectively devise the combined model FLEXPART-WRF (Fast and Easter, 2006; Brioude et al., 2013), which has been widely used to investigate the potential sources of air pollutants regarding environmental change (An et al., 2014; De Foy et al., 2011; Sauvage et al., 2017; Stohl et al., 2003).
2.2.2 WRF modeling configuration and meteorological validation
In this study, the WRF model was configured with two nested domains, coarse and fine. The coarse domain covered the entirety of Asia with a 30×30 km horizontal resolution, and the nested fine domain included most of China and its surrounding regions with a 10×10 km horizontal resolution (Fig. S2). The physical parameterizations used in WRF modeling were selected with the Morrison microphysics scheme (Morrison et al., 2009), the Rapid Radiative Transfer Model (RRTM) scheme for long- and shortwave radiation (Mlawer et al., 1997), the Yonsei University (YSU) boundary layer scheme (Hong et al., 2006), the Grell 3D cumulus parameterization, and the Noah land surface scheme (Grell et al., 2005). Using the reanalysis meteorological data in the horizontal resolutions of obtained from NCEP for initial and boundary meteorological conditions, the WRF simulation ran 12 h each time, where the first 6 h simulations constituted spin-up time.
The WRF-simulated meteorological fields, which included wind speed and direction, air temperature, relative humidity, and air pressure, were compared with observations at five typical sites (Wuhan, Changsha, Hefei, Zhengzhou, and Nanchang) over CEC (Fig. 2). The correlation coefficients were calculated and found to pass the significance level of 0.001, and the normalized standardized deviations were determined to be low (Taylor, 2001) (Fig. 2). Based on these results, it was evaluated that the WRF modeled meteorology was reasonably consistent with observations and could be used to drive the FLEXPART backward trajectory simulation.
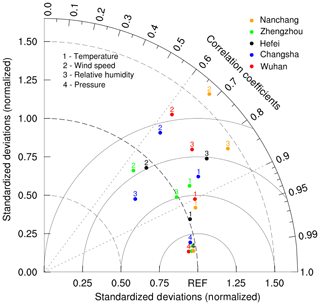
Figure 2A Taylor plot with the normalized standard deviations and correlation coefficients between WRF-simulated and observed meteorological fields. The radian of the sector represents the correlation coefficient. The solid line indicates the ratio of standard deviation between simulations and observations. The distance from the marker to “REF” reflect the normalized root-mean-square error (NRMSE).
2.3 Estimating the contribution of regional transport of PM2.5 to air pollution
In the FLEXPART-WRF model, the trajectory of particles released from a source is simulated. Using this Lagrangian method could result in a Jacobian matrix (footprint) with units of mass per volume per unit flux. Stohl et al. (2005) mathematically derived the residence time for particles out of FLEXPART. Generally, in the backward trajectory of FLEXPART modeling, many particles are released at a receptor and transported backward in time. Then the residence time (not the lifetime) of all particles, normalized by the total number of released particles, is determined on a uniform grid. Selecting Wuhan as the receptor in the YRMB, the residence time for a thickness of 100 m above the surface was calculated and considered as the “footprint” (in units of s). By multiplying the residence time with the air pollutant emission flux in the respective grid cell (in units of µg m−2 s−1) calculated from the air pollutant emission inventory of 2016 for China (http://www.meicmodel.org/, last access: 13 June 2020), the emission source contribution (in units of µg m−2) from this grid cell to the receptor's air pollution change could be estimated (Stohl et al., 2003, 2005; Ding et al., 2009).
In this study, the FLEXPART-WRF simulation was conducted for a 48 h backward trajectory with the release of 50 000 air particles in the first hours from Wuhan (30.61∘ N, 114.42∘ E) for three heavy pollution events in January 2016. The results were output with the residence time of air particles in a horizontal resolution of . The simulations of particle residence time over the 48 h backward trajectory pathways were multiplied with the regional primary PM2.5 emission fluxes to quantify the contribution of regional transport of PM2.5 to air quality change in the YRMB area while identifying patterns of regional transport of PM2.5 over CEC. The primary PM2.5 emission data from the Multi-resolution Emission Inventory for China (MEIC) (http://www.meicmodel.org/, last access: 13 June 2020) in 2016 were selected for use as the regional PM2.5 emission fluxes in this study.
Based on this backward trajectory simulation, the upstream sources of PM2.5 emissions for heavy air pollution in Wuhan were identified. The contribution ratesi,j of regional transport of PM2.5 from the upstream sources to air pollution in the downstream receptor region of the YRMB were calculated by Eq. (1), and the total contribution R of regional transport from the non-local emission sources are estimated by Eq. (2) (S. Chen et al., 2017; Ding et al., 2009).
where the subscripts i and j represent a grid location (i,j) over the 48 h backward trajectory from the first grid (i=1, j=1) in Wuhan to the last grid (i=N, j=S) over CEC; ri,j represents the residence time of PM2.5 particles simulated by FLEXPART-WRF; and Ei,j represents the PM2.5 emission flux over the grid. In Eq. (2), the first grid location (N1, S1) and the last grid location (N2, S2) over the non-local emission sources and the local area of Wuhan were determined, respectively, by the regional transport of PM2.5 pathways and the YRMB area in Wuhan as simulated by the FLEXPART-WRF model.
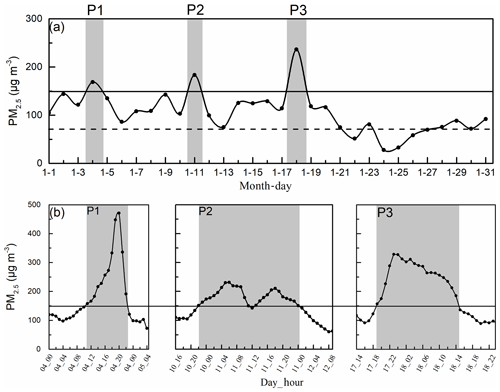
Figure 3(a) Daily changes in surface PM2.5 concentrations in Wuhan in January 2016 with PM2.5 concentrations exceeding 75 µg m−3 (dashed line) and 150 µg m−3 (solid lines) for light and heavy haze pollution, respectively. (b) The hourly variations in surface PM2.5 concentrations in three heavy air pollution events, P1, P2, and P3, with excessive PM2.5 levels (> 150 µg m−3) marked by the shaded areas.
3.1 Variations in local PM2.5 concentrations and meteorology in January 2016
Based on the National Ambient Air Quality Standards of China released by the Ministry of Ecology and Environment in 2012 (http://www.mee.gov.cn/, last access: 13 June 2020), light and heavy air pollution levels of PM2.5 are categorized by the daily average PM2.5 concentrations exceeding 75 and 150 µg m−3 in ambient air, respectively. The average monthly PM2.5 concentration reached 105.8 µg m−3 in Wuhan, where the daily PM2.5 concentrations exceeded 75 µg m−3 on 27 d during the entire month of January 2016 (Fig. 3a), indicating that this YRMB urban area was under significant PM2.5 pollution during this wintertime period. As shown in Fig. 3a, a 21 d prolonged air pollution event resulted from high levels of daily PM2.5 concentrations (> 75 µg m−3) from 1 to 21 January. During this period, three notably heavy air pollution events occurred on 4 January, 10–12 January, and 17–18 January with excessive daily PM2.5 concentrations (> 150 µg m−3). These three events are marked as P1, P2, and P3, respectively (Fig. 3b). Based on these observations, we found the interesting phenomenon of an approximately 7 d cycle of heavy air pollution, reflecting an important modulation of meteorological oscillation in the East Asian winter monsoonal winds affecting air pollution over the YRMB region (J. Xu et al., 2016). A period analysis on long-term observation data of air quality could provide further understanding on air quality changes associated with meteorological drivers.
Figure 3b presents the hourly changes in PM2.5 concentrations during the three heavy air pollution events P1, P2, and P3. P1 began at 11:00 (local time is used for all events) and ended at 23:00 the same day with an observed PM2.5 concentration peak of 471.1 µg m−3. P2 occurred from 22:00 on 10 January to 00:00 on 12 January. Over the 26 h duration, it had two peaks: 231.4 and 210.6 µg m−3. P3 occurred between 19:00 on 17 January and 14:00 on the 18 January with an explosive growth rate of 42.9 µg m−3 h−1. These events were characterized by short durations of less than 26 h from rapid accumulation to fast dissipation.
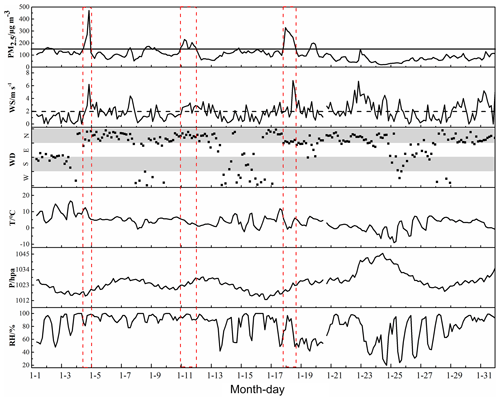
Figure 4Hourly variations in meteorological elements and PM2.5 concentrations in Wuhan in January 2016. Heavy air pollution periods are marked with columns in red dashed lines and PM2.5 concentrations exceeding 150 µg m−3 (solid line in the upper panel).
The changes in PM2.5 concentrations presented few differences between the suburban and urban sites. Both had similar patterns and peaks of hourly changes during the heavy pollution periods (Figs. S3, S4, and S5), demonstrating that regional heavy air pollution in a large area of the YRMB region is, in part, due to regional transport over CEC. The only obvious differences in air pollutant concentrations were measured during the clean-air periods (PM2.5 concentration < 75 µg m−3) with the relatively high and low concentrations of PM2.5 at urban and suburban sites, respectively (Figs. S3, S4, and S5). This shows the important influence of high air pollutant emissions over urban areas on local air quality.
Using the environmental and meteorological data observed in Wuhan in January 2016, the effects of the meteorological conditions on PM2.5 concentrations in the YRMB region were statistically analyzed with regard to hourly variations in surface PM2.5 concentrations, near-surface wind speed (WS), wind direction (WD), surface air temperature (T) and pressure (P), and relative humidity (RH) (Fig. 4). Among the observed changes shown in Fig. 4, the changes in PM2.5 concentrations were found to have obviously positive correlations to T and RH, as well as a pronounced negative correlation to P and a weak positive correlation to WS (Table 1). There are several reasons for these results. Firstly, the lower WS could alter the concentrations of air pollutants with a weaker advection of cold air in conjunction with strong subsidence and stable atmospheric stratification, thus easily producing a stagnation area in the lower troposphere and resulting in regional pollutant accumulations for the development of haze events. Secondly, in the presence of high soil moisture, strong surface evaporation could increase the near-surface RH, which is conducive to the hygroscopic growth of participles for haze formation (Dawson et al., 2014; J. Xu et al., 2016). Additionally, high air temperature and strong solar radiation could enhance chemical conversions for the formation of secondary aerosols in the atmosphere (He et al., 2012; Huang et al., 2014). Furthermore, precipitation could impact the emissions of fugitive dust and depositions of air pollutants (Dawson et al., 2007; Cheng et al., 2016). These observations could reflect the special influences of meteorological factors, such as winds, air temperature, humidity, and precipitation, on the physical and chemical processes in the ambient atmosphere that affect air quality change in the YRMB region.
Table 1Correlation coefficients between hourly PM2.5 concentrations and near-surface meteorological elements WS (wind speed), T (air temperature), P (air pressure), and RH (relative humidity) in Wuhan in January 2016.

3.2 A unique meteorological condition of “non-stagnation” for heavy PM2.5 pollution
3.2.1 Strong northerly winds
When we focused on the meteorological changes leading to high PM2.5 levels exceeding 150 µg m−3 during the heavy air pollution events, it is noteworthy that all three episodes, P1, P2, and P3, were accompanied by strong WSs in the northerly direction, as well as evident turning points in prevailing conditions leading to falling T and increasing P (Fig. 4). The conditions observed during these episodes present the typical meteorological characteristics of cold air invasion with high air pressure over the East Asian monsoon region. The southward advance of a cold front could drive the regional transport of air pollutants over CEC (Kang et al., 2019). Climatologically, a strong northerly wind, low air temperature, and high air pressure are typical features of an incursion of cold air during the East Asian winter monsoon season that could disperse air pollutants, thus improving air quality in the NCP region (Miao et al., 2018; X. Xu et al., 2016). This differs from the meteorological conditions of stagnation with weak winds observed for heavy air pollution events in the major air pollution regions of CEC (Ding et al., 2017; Huang et al., 2018), and the strong near-surface wind that anomalously accompanied the intensification of PM2.5 during heavy air pollution periods over the study area (Fig. 4). This could imply that the regional air pollutant transport is worsening air quality over the YRMB, driven by the strong northerly winds during the East Asian winter monsoon season.
To further investigate the connection between meteorological elements in the near-surface layer and changes in air quality affected by PM2.5 concentrations in the YRMB region, we carried out a more detailed correlation analysis of PM2.5 concentrations in Wuhan with WS and air temperature for three different levels of PM2.5 concentrations: clean-air environment (PM2.5 < 75 µg m−3), light air pollution (75 µg m−3 ≤ PM2.5 < 150 µg m−3) and heavy air pollution (PM2.5≥150 µg m−3) periods (Table 2). The surface PM2.5 concentrations were positively correlated with air temperature and negatively correlated with wind speeds during the periods of clean-air environment and light air pollution. It should be emphasized here that a significantly negative correlation () of PM2.5 concentrations to WS for the light air pollution period could indicate that weak winds are favorable for local PM2.5 accumulation, reflecting an important effect of local air pollutant emissions on light air pollution periods over the YRMB area. In January 2016, the overall wind speed of Wuhan was weak with a monthly mean value of 2.0 m s−1, which could help maintain the high PM2.5 levels in the prolonged air pollution events experienced in the YRMB area. However, a significantly positive correlation (R=0.41) existed between heavy air pollution levels of PM2.5 concentrations (PM2.5 > 150 µg m−3) and strong WSs during the heavy air pollution periods, which was inconsistent with the meteorological conditions of stagnation observed in the near-surface layer where weak winds were associated with heavy air pollution in east China (Cao et al., 2012; Deng et al., 2011). The meteorology and environmental conditions in the YRMB region indicate the close association of heavy air pollution periods enhancing PM2.5 concentrations with strong winds (Fig. 4, Table 2), therefore reflecting a key role of regional transport of air pollutants in the development of the YRMB's heavy air pollution periods.
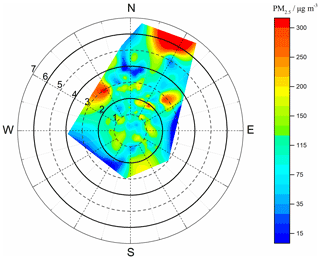
Figure 5A polar plot of the hourly variations in wind speed (round radius, in units of m s−1) and direction (angles) to surface PM2.5 concentrations (color contours, in units of µg m−3) in Wuhan in January 2016.
In order to clearly illustrate the impact of wind speed and direction on the PM2.5 concentrations associated with the regional transport of upwind air pollutants, Fig. 5 presents the relation of hourly changes in surface PM2.5 concentrations to WS and wind direction in Wuhan during January 2016. As seen in Fig. 5, strong northerly winds accompanied extremely high PM2.5 concentrations (> 150 µg m−3) during the heavy air pollution periods, including a northeast gale exceeding 5 m s−1 during the extremely heavy pollution periods with extremely high PM2.5 concentrations (> 300 µg m−3). These results reveal a unique meteorological condition of “non-stagnation” with strong winds during events of heavy air pollution over the YRMB area. Conversely, the observed PM2.5 concentrations ranging between 75 and 150 µg m−3 for light air pollution periods generally corresponded with low wind speeds (< 2 m s−1) (Fig. 5). Therefore, it is the meteorological condition of stagnation, characterized by weak winds, involved in the accumulation of local air pollutants that is responsible for the light air pollution periods. Meteorological impacts on air quality could include not only the stagnant condition of meteorology with weak winds and a stable boundary layer but also air temperature, humidity, precipitation, and atmospheric radiation in close connection with atmospheric physical and chemical processes. The meteorological drivers of air quality change are complicated by a series of physical and chemical processes in the atmosphere, especially the formation of secondary air pollutants with strong hygroscopic growth in the humid air environment overlying the dense water network (Fig. 1b) in the YRMB region (Cheng et al., 2014; He et al., 2012; Huang et al., 2014).
3.2.2 Unstable structures in the atmospheric boundary layer
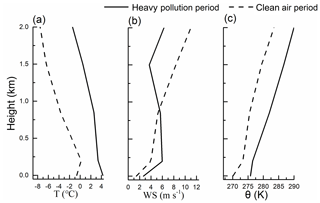
The air sounding data observed in Wuhan were used to compare the structures of the atmospheric boundary layer during the heavy air pollution and clean-air periods. Figure 6 presents the vertical profiles of air temperature, wind velocity, and potential temperature averaged for the heavy PM2.5 pollution and clean-air periods in January 2016. It can be seen that the inversion layer of air temperature did not exist during the heavy pollution periods, while a near-surface inversion layer appeared at the height of about 200 m during the clean-air periods (Fig. 6a). Compared to the clean-air period, the heavy air pollution events had stronger winds within the 1000 m layer but weaker winds above the 1000 m layer (Fig. 6b), indicating that the regional transport of PM2.5 was mainly limited to the 1000 m layer, especially between 250 and 800 m. These vertical structures of horizontal wind could conduce to the downward mixing of the regionally transported air pollutants and produce the near-surface accumulations of air pollutants over the YRMB area with elevated ambient PM2.5 concentrations, thus contributing to heavy air pollution.
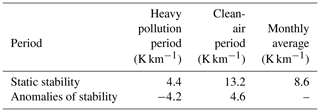
To quantitatively characterize the stability of the atmospheric boundary layer, the vertical profiles of potential air temperature (θ) were calculated with air temperature and pressure (Fig. 6c). In this study, the vertical change rate of θ was used to quantify the static stability of the boundary layer (Oke, 2002). A lower vertical change rate of θ generally indicates decreasing stability or increasing instability of the boundary layer. The averaged static stability values of the near-surface layer below a height of 200 m during the heavy pollution and clean-air periods were approximately 4.4 and 13.2 K km−1, respectively (Table 3). This obvious decrease in stability of the boundary layer from clean-air to heavy pollution periods indicates an anomalous tendency of the unstable boundary layer for the heavy pollution periods during January 2016 in the YRMB area.
Table 3Atmospheric static stability below heights of 200 m in the boundary layer during heavy pollution and clean-air periods with anomalies relative to the average over January 2016 in Wuhan.
The meteorological conditions of stagnation characterized by weak wind, temperature inversion, and a stable vertical structure of the atmospheric boundary layer are generally accepted as the typical meteorological drivers for heavy air pollution (An et al., 2019; Ding et al., 2017). Nevertheless, this study revealed a unique meteorological condition of “non-stagnation” in the atmospheric boundary layer during heavy air pollution periods characterized by strong wind, lack of an inversion layer, and a more unstable structure of the atmospheric boundary layer. These “non-stagnant” meteorological conditions could be generally regarded as the typical pattern of atmospheric circulation that facilitates the regional transport of air pollutants from upstream sources to downwind receptor regions. The regional transport of PM2.5 connected with the source–receptor relationship between the air pollution regions in CEC and the YRMB area was further investigated with the following observational and modeling analyses.
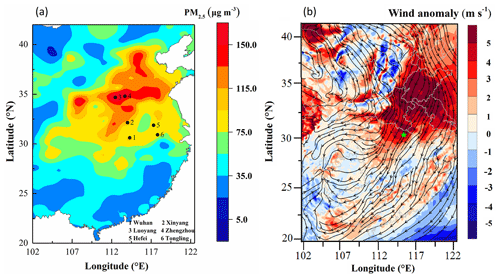
Figure 7(a) Distribution of the monthly averages of surface PM2.5 concentrations observed in January 2016 over CEC with the locations of six sites (black dots): (1) Wuhan, (2) Xinyang, (3) Luoyang, (4) Zhengzhou, (5) Hefei, and (6) Tongling. (b) Distribution of anomalies (color contours) of 200 m wind speeds averaged during the three heavy air pollution periods relative to the monthly wind averages (streamlines) in January 2016 over CEC with the location of Wuhan (a light blue star).
3.3 Regional transport of PM2.5 in northerly winds observed over CEC
The monthly averages of PM2.5 concentrations and the anomalies of wind speed averaged in three heavy air pollution periods relative to the monthly mean wind speed in January 2016 observed over CEC are shown in Fig. 7. Note that a large area of CEC experienced air pollution with high levels of PM2.5 > 75 µg m−3 that were especially severe in the NCP region and the Fenhe–Weihe Plain in central China (Fig. 7a). As seen in Fig. 7, Wuhan (site 1 in Fig. 7a) and the surrounding YRMB region were situated in the downwind southern edge of the air pollution area blanketing CEC (Fig. 7a), where the northerly winds prevailed (Fig. 7b). Climatologically, CEC is a typical region of East Asian monsoons dominated by wintertime northerly winds (Ding, 1993). Note that the anomalously stronger northerly winds were observed over upstream CEC during the three periods of wintertime heavy PM2.5 pollution (Fig. 7b). Driven by the stronger northerly winds, the regional transport of air pollutants from the source regions in windward CEC could largely contribute to heavy air pollution in the downwind receptor region of YRMB.
In order to explore the connection between the regional transport of PM2.5 over CEC and the three events of heavy air pollution in the YRMB region, six observational sites were selected from the northwestern, northern, and northeastern directions over upstream CEC (Fig. 7a). These sites represent three different routes of the regional transport of PM2.5 to Wuhan (site 1 in Fig. 7a) and are governed by the southward incursion of stronger northerly winds (Fig. 7b). Figure 8 presents the temporal changes in PM2.5 concentration and wind speed along three typical routes of regional transport of PM2.5 over CEC. The southeastward movement of heavy PM2.5 pollution was driven by stronger northerly winds from Luoyang and Xinyang to Wuhan (sites 3, 2, and 1 in Fig. 7) and presented a northwestern route of regional transport of PM2.5 for P1 (see Fig. 8a). The westward advance of PM2.5 peaks was governed by the northeastern winds from Tongling and Hefei to Wuhan (sites 6, 5, and 1 in Fig. 7a). The regional transport of PM2.5 across eastern China to the YRMB in central China exerted a significant impact on P2 (see Fig. 8b). A northern pathway of regional transport of PM2.5 connected Zhengzhou and Xinyang to Wuhan (sites 4, 2, and 1 in Fig. 7a) during P3 with anomalously strong northerly winds (see Fig. 7b and Fig. 8c). Note, in Fig. 8, that the heavy PM2.5 pollution periods at the upstream sites of Hefei, Tongling, Luoyang, Xinyang, and Zhengzhou (sites 2–6 in Fig. 7a) were generally dispelled by strong northerly winds. At the same time, these winds could trigger the periods of heavy PM2.5 pollution in the YRMB region (Wuhan, site 1 in Fig. 7a). Such inverse effects of strong winds on heavy air pollution in CEC and the YRMB region show the important role that the regional transport of air pollutants can have in cleaning and worsening air pollution in the upstream CEC source regions and the downstream YRMB receptor region, respectively.
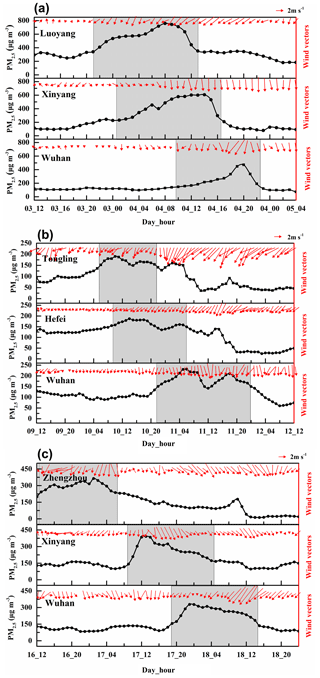
Figure 8Temporal changes in PM2.5 concentrations (dotted lines) and near-surface winds (vectors) observed at five upstream sites (Fig. 6) and Wuhan with shifts in PM2.5 peaks (marked with shaded areas) to the YRMB's heavy PM2.5 pollution periods P1 (a), P2 (b) and P3 (c), in January 2016.
The regional transport over CEC that is associated with the source–receptor relationship directing heavy PM2.5 pollution to the YRMB region was revealed via observational analysis. The FLEXPART-WRF backward trajectory modeling was used to further identify the patterns of regional transport of PM2.5 and estimate the resulting contribution to heavy air pollution in the YRMB region in the following section.
3.4 Contribution of regional transport of PM2.5 to heavy pollution
In this study, for the receptor of Wuhan, the PM2.5 contributions of regional transport over CEC to air pollution in the downwind receptor region could be approximately estimated. These estimations were based on the product of the residence time of air particles during regional transport as simulated by the FLEXPART-WRF model and the PM2.5 emission flux over the source grid in CEC determined by Eq. (1). The data yielded a so-called potential source contribution map, which is the geographical distribution of the regional transport contribution rates (%) of the emission source grid cell to PM2.5 pollution at the receptor of Wuhan (Fig. 9).
The non-local emission sources that affected PM2.5 concentrations during P1, P2, and P3 were quantified over CEC using the PM2.5 contribution rates calculated with Eq. (1). Combining the distribution of high PM2.5 contribution rates with the prevailing winds experienced during the three heavy PM2.5 pollution periods, the major pathways of regional transport of PM2.5 over CEC could be recognized (Fig. 9). During P1 in the YRMB region, the regional transport of air pollutants was centered along a northwestern route from the Fenhe–Weihe Plain in central China and a northeastern route from the YRD region in eastern China (Fig. 9a). The YRD emission sources of air pollutants exerted a large impact on P2 through regional transport of PM2.5 across eastern China to the YRMB region along the north side of Yangtze River (Fig. 9b). Two major regional transport pathways of PM2.5 indicated by the spatial distribution of high contribution rates of PM2.5 from the NCP and YRD regions contributed to the elevated PM2.5 concentrations during P3 (Fig. 9c). Governed by the anomalous northerly winds in January 2016 (Fig. 7b), the regional transport of PM2.5 from the air pollutant emission source regions in CEC provided a significant contribution to the wintertime heavy PM2.5 pollution observed in the YRMB region (Figs. 7–9). This was confirmed by the results of the FLEXPART-WRF backward trajectory simulation utilized in this study.
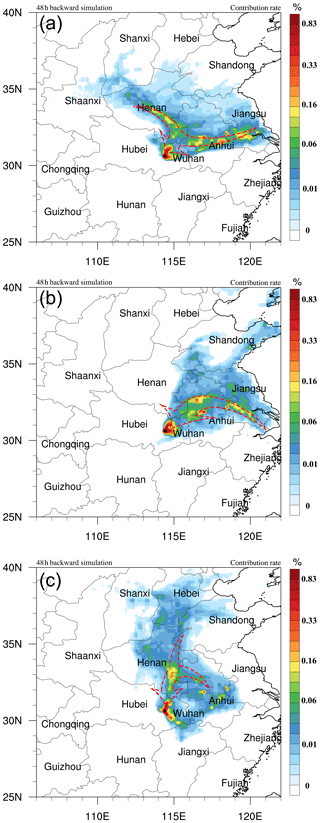
Figure 9Spatial distribution of contribution rates (color contours) to PM2.5 concentrations in Wuhan with the major pathways of regional transport over CEC (dash arrows) for three heavy pollution periods (a) P1, (b) P2, and (c) P3 in January 2016 simulated by the FLEXPART-WRF model.
Table 4The relative contributions of regional transport over CEC to three PM2.5 heavy pollution periods, P1, P2, and P3, in the YRMB with local contributions.

The PM2.5 contributions of regional transport over CEC to the PM2.5 concentrations in the YRMB area during P1, P2, and P3 were estimated using Eq. (2) with the resulting high contribution rates of 68.1 %, 60.9 %, and 65.3 %, respectively (Table 4). The regional transport of PM2.5 from non-local air pollutant emissions could contribute more than 65 % of the PM2.5 concentrations to the heavy air pollution in the YRMB region during the study period, revealing a large contribution of regional transport of PM2.5 over CEC to the enhancement of PM2.5 levels in the YRMB area for the wintertime heavy air pollution.
Note that the potential source contribution is estimated based on transport alone, ignoring chemical and removal processes. We understand that these processes, including complex deposition and chemical conversion for the formation of secondary particles, were not introduced in the FLEXPART-WRF simulation, which could represent the basic features of contribution and patterns of regional PM2.5 transport over CEC when limited to the primary PM2.5 particles highlighted in this study.
Normally researchers rely on 3D numerical models with process analysis capability, such as integrated process rates (IPRs), in order to quantify the contributions of regional transport to the occurrence of air pollution episodes (Gao et al., 2011; Hu et al., 2018; Jiang et al., 2015). In this study, simulations with a Lagrange particle dispersion FLEXPART-WRF model were utilized to calculate the percentage contribution of regional transport while identifying the transport pathway. The major uncertainty of this method for such calculations, as compared to other methods such as IPRs, is that the physical and chemical processes, including chemical conversion for the formation of secondary particles, were not introduced in the FLEXPART-WRF simulation. Considering that there is less precipitation in the winter monsoon season over CEC, this methodology has proven its robustness to quantify the regional transport contribution within the uncertainty range by relying on a portion of secondary organic and inorganic aerosols that resulted from the complex physical and chemical processes in the atmosphere.
This study investigated the ambient PM2.5 variations over Wuhan, a typical YRMB area in central China in January 2016, by analyzing the observational data of the environment and meteorology. In addition to this, we did a FLEXPART-WRF simulation to explore the meteorological processes involved in the regional transport of air pollutants and the regional transport patterns of PM2.5 and how it contributes to heavy air pollution in the YRMB region. Focusing our study on three heavy PM2.5 pollution periods we found a unique non-stagnant atmospheric boundary layer for wintertime heavy air pollution that was aggravated by the regional transport of PM2.5 over CEC. This boundary layer was characterized by strong winds, no inversion layer, and a more unstable structure. These non-stagnant conditions during heavy air pollution periods with high PM2.5 concentrations facilitate our understanding of the air pollutant source–receptor relationship of regional transport in air quality change. Our study is of great interest to the air quality community given the unique features of the air pollution meteorology, which are very different from “stagnant” meteorological conditions presented in textbooks.
Although emissions and local accumulation of air pollutants can lead to the formation of light air pollution, with regard to PM2.5 over the YRMB region, the regional transport of PM2.5 from upstream source regions of air pollutant emissions in CEC contributed significantly (more than 65 %) to the excessive PM2.5 concentrations during wintertime heavy air pollution in the downwind YRMB region in January 2016, as governed by the strong northerly winds in the East Asian winter monsoon season over CEC.
Based on the variations in air quality and meteorology in a typical urban YRMB region, this study revealed a unique non-stagnant meteorological condition for heavy air pollution with a strong contribution of regional transport of PM2.5 over China. These conditions and contributions can be investigated further with climate analyses of long-term observations and more comprehensive modeling of air quality and meteorology.
The data used in this paper can be provided by Chao Yu (ychao012@foxmail.com) upon request.
The supplement related to this article is available online at: https://doi.org/10.5194/acp-20-7217-2020-supplement.
CY, TZ, and YB conducted the study design. XY, LZ, and SK provided the observational data. LZ assisted with data processing. CY wrote the paper with the help of TZ and XY. YB, SK, JH, CC, JY, YY, GM, MW, and JC were involved in the scientific interpretation and discussion. All authors provided commentary on the paper.
The authors declare that they have no conflict of interest.
This study was jointly funded by the National Natural Science Foundation of China (41830965; 91744209), the National Key R&D Program Pilot Projects of China (2016YFC0203304), and the Postgraduate Research & Practice Innovation Program of Jiangsu Province (KYCX18_1027).
This research has been supported by the National Natural Science Foundation of China (grant no. 41830965; 91744209), the National Key R&D Program Pilot Projects of China (grant no. 2016YFC0203304), and the Postgraduate Research & Practice Innovation Program of Jiangsu Province (KYCX18_1027).
This paper was edited by Xiaohong Liu and reviewed by two anonymous referees.
Acciai, C., Zhang, Z., Wang, F., Zhong, Z., and Lonati, G.: Characteristics and source Analysis of trace Elements in PM2.5 in the Urban Atmosphere of Wuhan in Spring, Aerosol Air Qual. Res., 17, 2224–2234, https://doi.org/10.4209/aaqr.2017.06.0207, 2017.
An, X., Yao, B., Li, Y., Li, N., and Zhou, L.: Tracking source area of Shangdianzi station using Lagrangian particle dispersion model of FLEXPART, Meteorol. Appl., 21, 466–473, https://doi.org/10.1002/met.1358, 2014.
An, Z., Huang, R. J., Zhang, R., Tie, X., Li, G., Cao, J., Zhou, W., Shi, Z., Han, Y., Gu, Z., and Ji, Y.: Severe haze in northern China: A synergy of anthropogenic emissions and atmospheric processes, P. Natl. Acad. Sci. USA, 116, 8657–8666, https://doi.org/10.1073/pnas.1900125116, 2019.
Brioude, J., Arnold, D., Stohl, A., Cassiani, M., Morton, D., Seibert, P., Angevine, W., Evan, S., Dingwell, A., Fast, J. D., Easter, R. C., Pisso, I., Burkhart, J., and Wotawa, G.: The Lagrangian particle dispersion model FLEXPART-WRF version 3.1, Geosci. Model Dev., 6, 1889–1904, https://doi.org/10.5194/gmd-6-1889-2013, 2013.
Cao, J.-J., Wang, Q.-Y., Chow, J. C., Watson, J. G., Tie, X.-X., Shen, Z.-X., Wang, P., and An, Z.-S.: Impacts of aerosol compositions on visibility impairment in Xi'an, China, Atmos. Environ., 59, 559–566, https://doi.org/10.1016/j.atmosenv.2012.05.036, 2012.
Chang, X., Wang, S., Zhao, B., Cai, S., and Hao, J.: Assessment of inter-city transport of particulate matter in the Beijing–Tianjin–Hebei region, Atmos. Chem. Phys., 18, 4843–4858, https://doi.org/10.5194/acp-18-4843-2018, 2018.
Chen, B., Xu, X.-D., and Zhao, T.: Quantifying oceanic moisture exports to mainland China in association with summer precipitation, Clim. Dynam., 51, 4271–4286, https://doi.org/10.1007/s00382-017-3925-1, 2017.
Chen, S., Zhou, G., and Zhu, B.: A method for fast quantification of air pollutant sources, Acta Scientiae Circumstantiae, 37, 2474–2481, https://doi.org/10.13671/j.hjkxxb.2017.0045, 2017 (in Chinese).
Cheng, H., Gong, W., Wang, Z., Zhang, F., Wang, X., Lv, X., Liu, J., Fu, X., and Zhang, G.: Ionic composition of submicron particles (PM1.0) during the long-lasting haze period in January 2013 in Wuhan, central China, J. Environ. Sci., 26, 810–817, https://doi.org/10.1016/s1001-0742(13)60503-3, 2014.
Cheng, X., Zhao, T., Gong, S., Xu, X., Han, Y., Yin, Y., Tang, L., He, H., and He, J.: Implications of East Asian summer and winter monsoons for interannual aerosol variations over central-eastern China, Atmos. Environ., 129, 218–228, https://doi.org/10.1016/j.atmosenv.2016.01.037, 2016.
Cheng, Y. F., Wiedensohler, A., Eichler, H., Heintzenberg, J., Tesche, M., Ansmann, A., Wendisch, M., Su, H., Althausen, D., and Herrmann, H.: Relative humidity dependence of aerosol optical properties and direct radiative forcing in the surface boundary layer at Xinken in Pearl River Delta of China: An observation based numerical study, Atmos. Environ., 42, 6373–6397, https://doi.org/10.1016/j.atmosenv.2008.04.009, 2008.
Dawson, J. P., Adams, P. J., and Pandis, S. N.: Sensitivity of PM2.5 to climate in the Eastern US: a modeling case study, Atmos. Chem. Phys., 7, 4295–4309, https://doi.org/10.5194/acp-7-4295-2007, 2007.
Dawson, J. P., Bloomer, B. J., Winner, D. A., and Weaver, C. P.: Understanding the Meteorological Drivers of U.S. Particulate Matter Concentrations in a Changing Climate, B. Am. Meteorol. Soc., 95, 521–532, https://doi.org/10.1175/bams-d-12-00181.1, 2014.
de Foy, B., Burton, S. P., Ferrare, R. A., Hostetler, C. A., Hair, J. W., Wiedinmyer, C., and Molina, L. T.: Aerosol plume transport and transformation in high spectral resolution lidar measurements and WRF-Flexpart simulations during the MILAGRO Field Campaign, Atmos. Chem. Phys., 11, 3543–3563, https://doi.org/10.5194/acp-11-3543-2011, 2011.
Deng, J., Wang, T., Jiang, Z., Xie, M., Zhang, R., Huang, X., and Zhu, J.: Characterization of visibility and its affecting factors over Nanjing, China, Atmos. Res., 101, 681–691, https://doi.org/10.1016/j.atmosres.2011.04.016, 2011.
Ding, A., Wang, T., Xue, L., Gao, J., Stohl, A., Lei, H., Jin, D., Ren, Y., Wang, X., and Wei, X.: Transport of north China air pollution by midlatitude cyclones: Case study of aircraft measurements in summer 2007, J. Geophys. Res.-Atmos., 114, D08304, https://doi.org/10.1029/2008JD011023, 2009.
Ding, Y.: Monsoons over china, Springer Science & Business Media, 1993.
Ding, Y., Wu, P., Liu, Y., and Song, Y.: Environmental and Dynamic Conditions for the Occurrence of Persistent Haze Events in North China, Engineering, 3, 266–271, https://doi.org/10.1016/j.eng.2017.01.009, 2017.
Fast, J. D. and Easter, R. C.: A Lagrangian particle dispersion model compatible with WRF, 7th WRF Users Workshop, NCAR, 19–22, 2006.
Fuzzi, S., Baltensperger, U., Carslaw, K., Decesari, S., Denier van der Gon, H., Facchini, M. C., Fowler, D., Koren, I., Langford, B., Lohmann, U., Nemitz, E., Pandis, S., Riipinen, I., Rudich, Y., Schaap, M., Slowik, J. G., Spracklen, D. V., Vignati, E., Wild, M., Williams, M., and Gilardoni, S.: Particulate matter, air quality and climate: lessons learned and future needs, Atmos. Chem. Phys., 15, 8217–8299, https://doi.org/10.5194/acp-15-8217-2015, 2015.
Gao, Y., Liu, X., Zhao, C., and Zhang, M.: Emission controls versus meteorological conditions in determining aerosol concentrations in Beijing during the 2008 Olympic Games, Atmos. Chem. Phys., 11, 12437–12451, https://doi.org/10.5194/acp-11-12437-2011, 2011.
Gong, W., Zhang, T., Zhu, Z., Ma, Y., Ma, X., and Wang, W.: Characteristics of PM1.0, PM2.5, and PM10, and Their Relation to Black Carbon in Wuhan, Central China, Atmosphere, 6, 1377–1387, https://doi.org/10.3390/atmos6091377, 2015.
Grell, G. A., Peckham, S. E., Schmitz, R., McKeen, S. A., Frost, G., Skamarock, W. C., and Eder, B.: Fully coupled “online” chemistry within the WRF model, Atmos. Environ., 39, 6957–6975, https://doi.org/10.1016/j.atmosenv.2005.04.027, 2005.
He, J., Mao, H., Gong, S., Yu, Y., Wu, L., Liu, H., Chen, Y., Jing, B., Ren, P., and Zou, C.: Investigation of Particulate Matter Regional Transport in Beijing Based on Numerical Simulation, Aerosol Air Qual. Res., 17, 1181–1189, https://doi.org/10.4209/aaqr.2016.03.0110, 2017.
He, K., Zhao, Q., Ma, Y., Duan, F., Yang, F., Shi, Z., and Chen, G.: Spatial and seasonal variability of PM2.5 acidity at two Chinese megacities: insights into the formation of secondary inorganic aerosols, Atmos. Chem. Phys., 12, 1377–1395, https://doi.org/10.5194/acp-12-1377-2012, 2012.
Hong, S.-Y., Noh, Y., and Dudhia, J.: A new vertical diffusion package with an explicit treatment of entrainment processes, Mon. Weather Rev., 134, 2318–2341, https://doi.org/10.1175/MWR3199.1,2006, 2006.
Hu, J., Li, Y., Zhao, T., Liu, J., Hu, X.-M., Liu, D., Jiang, Y., Xu, J., and Chang, L.: An important mechanism of regional O3 transport for summer smog over the Yangtze River Delta in eastern China, Atmos. Chem. Phys., 18, 16239–16251, https://doi.org/10.5194/acp-18-16239-2018, 2018.
Huang, Q., Cai, X., Wang, J., Song, Y., and Zhu, T.: Climatological study of the Boundary-layer air Stagnation Index for China and its relationship with air pollution, Atmos. Chem. Phys., 18, 7573–7593, https://doi.org/10.5194/acp-18-7573-2018, 2018.
Huang, R. J., Zhang, Y., Bozzetti, C., Ho, K. F., Cao, J. J., Han, Y., Daellenbach, K. R., Slowik, J. G., Platt, S. M., Canonaco, F., Zotter, P., Wolf, R., Pieber, S. M., Bruns, E. A., Crippa, M., Ciarelli, G., Piazzalunga, A., Schwikowski, M., Abbaszade, G., Schnelle-Kreis, J., Zimmermann, R., An, Z., Szidat, S., Baltensperger, U., El Haddad, I., and Prevot, A. S.: High secondary aerosol contribution to particulate pollution during haze events in China, Nature, 514, 218–222, https://doi.org/10.1038/nature13774, 2014.
Jiang, C., Wang, H., Zhao, T., Li, T., and Che, H.: Modeling study of PM2.5 pollutant transport across cities in China's Jing-Jin-Ji region during a severe haze episode in December 2013, Atmospheric Chemistry and Physics, 15, 5803–5814, https://doi.org/10.5194/acp-15-5803-2015, 2015.
Kang, H., Zhu, B., Gao, J., He, Y., Wang, H., Su, J., Pan, C., Zhu, T., and Yu, B.: Potential impacts of cold frontal passage on air quality over the Yangtze River Delta, China, Atmos. Chem. Phys., 19, 3673–3685, https://doi.org/10.5194/acp-19-3673-2019, 2019.
Miao, Y., Guo, J., Liu, S., Zhao, C., Li, X., Zhang, G., Wei, W., and Ma, Y.: Impacts of synoptic condition and planetary boundary layer structure on the trans-boundary aerosol transport from Beijing-Tianjin-Hebei region to northeast China, Atmos. Environ., 181, 1–11, https://doi.org/10.1016/j.atmosenv.2018.03.005, 2018.
Mlawer, E. J., Taubman, S. J., Brown, P. D., Iacono, M. J., and Clough, S. A.: Radiative transfer for inhomogeneous atmospheres: RRTM, a validated correlated-k model for the longwave, J. Geophys. Res.-Atmos., 102, 16663–16682, https://doi.org/10.1029/97jd00237, 1997.
Morrison, H., Thompson, G., and Tatarskii, V.: Impact of Cloud Microphysics on the Development of Trailing Stratiform Precipitation in a Simulated Squall Line: Comparison of One- and Two-Moment Schemes, Mon. Weather Rev., 137, 991–1007, https://doi.org/10.1175/2008mwr2556.1, 2009.
Nel, A.: Air pollution-related illness: effects of particles, Science, 308, 804–806, https://doi.org/10.1126/science.1108752, 2005.
Oke, T. R.: Boundary layer climates, Routledge, 2002.
Qiao, X., Guo, H., Tang, Y., Wang, P., Deng, W., Zhao, X., Hu, J., Ying, Q., and Zhang, H.: Local and regional contributions to fine particulate matter in the 18 cities of Sichuan Basin, southwestern China, Atmos. Chem. Phys., 19, 5791–5803, https://doi.org/10.5194/acp-19-5791-2019, 2019.
Sauvage, B., Fontaine, A., Eckhardt, S., Auby, A., Boulanger, D., Petetin, H., Paugam, R., Athier, G., Cousin, J.-M., Darras, S., Nédélec, P., Stohl, A., Turquety, S., Cammas, J.-P., and Thouret, V.: Source attribution using FLEXPART and carbon monoxide emission inventories: SOFT-IO version 1.0, Atmos. Chem. Phys., 17, 15271–15292, https://doi.org/10.5194/acp-17-15271-2017, 2017.
Seibert, P. and Frank, A.: Source-receptor matrix calculation with a Lagrangian particle dispersion model in backward mode, Atmos. Chem. Phys., 4, 51–63, https://doi.org/10.5194/acp-4-51-2004, 2004.
Stohl, A., Forster, C., Eckhardt, S., Spichtinger, N., Huntrieser, H., Heland, J., Schlager, H., Wilhelm, S., Arnold, F., and Cooper, O.: A backward modeling study of intercontinental pollution transport using aircraft measurements, J. Geophys. Res.-Atmos., 108, 4370, https://doi.org/10.1029/2002jd002862, 2003.
Stohl, A., Forster, C., Frank, A., Seibert, P., and Wotawa, G.: Technical note: The Lagrangian particle dispersion model FLEXPART version 6.2, Atmos. Chem. Phys., 5, 2461–2474, https://doi.org/10.5194/acp-5-2461-2005, 2005.
Taylor, K. E.: Summarizing multiple aspects of model performance in a single diagram, J. Geophys. Res.-Atmos., 106, 7183–7192, https://doi.org/10.1029/2000jd900719, 2001.
Tie, X., Huang, R. J., Cao, J., Zhang, Q., Cheng, Y., Su, H., Chang, D., Poschl, U., Hoffmann, T., Dusek, U., Li, G., Worsnop, D. R., and O'Dowd, C. D.: Severe Pollution in China Amplified by Atmospheric Moisture, Sci. Rep., 7, 15760, https://doi.org/10.1038/s41598-017-15909-1, 2017.
Voulgarakis, A., Savage, N. H., Wild, O., Braesicke, P., Young, P. J., Carver, G. D., and Pyle, J. A.: Interannual variability of tropospheric composition: the influence of changes in emissions, meteorology and clouds, Atmos. Chem. Phys., 10, 2491–2506, https://doi.org/10.5194/acp-10-2491-2010, 2010.
Wang, H. L., Qiao, L. P., Lou, S. R., Zhou, M., Ding, A. J., Huang, H. Y., Chen, J. M., Wang, Q., Tao, S. K., Chen, C. H., Li, L., and Huang, C.: Chemical composition of PM2.5 and meteorological impact among three years in urban Shanghai, China, J. Clean. Prod., 112, 1302–1311, https://doi.org/10.1016/j.jclepro.2015.04.099, 2016.
Wang, S. X., Zhao, B., Cai, S. Y., Klimont, Z., Nielsen, C. P., Morikawa, T., Woo, J. H., Kim, Y., Fu, X., Xu, J. Y., Hao, J. M., and He, K. B.: Emission trends and mitigation options for air pollutants in East Asia, Atmos. Chem. Phys., 14, 6571–6603, https://doi.org/10.5194/acp-14-6571-2014, 2014.
Wu, J., Kong, S., Wu, F., Cheng, Y., Zheng, S., Yan, Q., Zheng, H., Yang, G., Zheng, M., Liu, D., Zhao, D., and Qi, S.: Estimating the open biomass burning emissions in central and eastern China from 2003 to 2015 based on satellite observation, Atmospheric Chemistry and Physics, 18, 11623-11646, https://doi.org/10.5194/acp-18-11623-2018, 2018.
Xu, G., Jiao, L., Zhang, B., Zhao, S., Yuan, M., Gu, Y., Liu, J., and Tang, X.: Spatial and Temporal Variability of the PM2.5/PM10 Ratio in Wuhan, Central China, Aerosol and Air Quality Research, 17, 741-751, https://doi.org/10.4209/aaqr.2016.09.0406, 2017.
Xu, J., Chang, L., Qu, Y., Yan, F., Wang, F., and Fu, Q.: The meteorological modulation on PM2.5 interannual oscillation during 2013 to 2015 in Shanghai, China, Science of the Total Environment, 572, 1138-1149, https://doi.org/10.1016/j.scitotenv.2016.08.024, 2016.
Xu, X., Zhao, T., Liu, F., Gong, S. L., Kristovich, D., Lu, C., Guo, Y., Cheng, X., Wang, Y., and Ding, G.: Climate modulation of the Tibetan Plateau on haze in China, Atmospheric Chemistry and Physics, 16, 1365-1375, https://doi.org/10.5194/acp-16-1365-2016, 2016.
Zhai, S., An, X., Liu, Z., Sun, Z., and Hou, Q.: Model assessment of atmospheric pollution control schemes for critical emission regions, Atmos. Environ., 124, 367–377, https://doi.org/10.1016/j.atmosenv.2015.08.093, 2016.
Zhang, F., Wang, Z. W., Cheng, H. R., Lv, X. P., Gong, W., Wang, X. M., and Zhang, G.: Seasonal variations and chemical characteristics of PM2.5 in Wuhan, central China, Sci. Total Environ., 518–519, 97–105, https://doi.org/10.1016/j.scitotenv.2015.02.054, 2015.
Zhang, R., Li, Q., and Zhang, R.: Meteorological conditions for the persistent severe fog and haze event over eastern China in January 2013, Sci. China Earth Sci., 57, 26–35, https://doi.org/10.1007/s11430-013-4774-3, 2013.
Zhang, X. Y., Wang, Y. Q., Niu, T., Zhang, X. C., Gong, S. L., Zhang, Y. M., and Sun, J. Y.: Atmospheric aerosol compositions in China: spatial/temporal variability, chemical signature, regional haze distribution and comparisons with global aerosols, Atmos. Chem. Phys., 12, 779–799, https://doi.org/10.5194/acp-12-779-2012, 2012.
Zhao, T. L., Gong, S. L., Huang, P., and Lavoué, D.: Hemispheric transport and influence of meteorology on global aerosol climatology, Atmos. Chem. Phys., 12, 7609–7624, https://doi.org/10.5194/acp-12-7609-2012, 2012.
Zhao, X. J., Zhao, P. S., Xu, J., Meng,, W., Pu, W. W., Dong, F., He, D., and Shi, Q. F.: Analysis of a winter regional haze event and its formation mechanism in the North China Plain, Atmos. Chem. Phys., 13, 5685–5696, https://doi.org/10.5194/acp-13-5685-2013, 2013.
Zheng, H., Kong, S., Wu, F., Cheng, Y., Niu, Z., Zheng, S., Yang, G., Yao, L., Yan, Q., Wu, J., Zheng, M., Chen, N., Xu, K., Yan, Y., Liu, D., Zhao, D., Zhao, T., Bai, Y., Li, S., and Qi, S.: Intra-regional transport of black carbon between the south edge of the North China Plain and central China during winter haze episodes, Atmos. Chem. Phys., 19, 4499–4516, https://doi.org/10.5194/acp-19-4499-2019, 2019.
Zhong, J., Zhang, X., Wang, Y., Wang, J., Shen, X., Zhang, H., Wang, T., Xie, Z., Liu, C., Zhang, H., Zhao, T., Sun, J., Fan, S., Gao, Z., Li, Y., and Wang, L.: The two-way feedback mechanism between unfavorable meteorological conditions and cumulative aerosol pollution in various haze regions of China, Atmos. Chem. Phys., 19, 3287–3306, https://doi.org/10.5194/acp-19-3287-2019, 2019.


