the Creative Commons Attribution 4.0 License.
the Creative Commons Attribution 4.0 License.
 | 10 Jun 2020
Asian summer monsoon anticyclone: trends and variability
M. Venkat Ratnam
Pangaluru Kishore
The Asian summer monsoon anticyclone (ASMA) has been a topic of intensive research in recent times regarding its variability in dynamics, chemistry and radiation. This work explores the spatial variability and the trends of the ASMA using observational and reanalysis data sets. Our analysis indicates that the spatial extent and magnitude of the ASMA is greater during July and August than in June and September. The decadal variability of the anticyclone is very large at the edges of the anticyclone compared with the core region. Significant decadal variability is observed in the northeastern and southwestern parts of the ASMA with reference to the 1951–1960 period. The strength of the ASMA shows a drastic increase in zonal wind anomalies in terms of temporal variation. Furthermore, our results show that the extent of the anticyclone is greater during the active phase of the monsoon, strong monsoon years, and La Niña events. Significant warming with strong westerlies is observed exactly over the Tibetan Plateau from the surface to the tropopause during the abovementioned periods. Our results support the existence of transport process over the Tibetan Plateau and the Indian region during active, strong monsoon years and during strong La Niña years. Therefore, it is recommended that the different phases of the monsoon be taken into account when interpreting the variability of pollutants and trace gases in the anticyclone.
- Article
(11254 KB) - Full-text XML
-
Supplement
(495 KB) - BibTeX
- EndNote


The Asian summer monsoon anticyclone (ASMA) is a dominant circulation in the Northern Hemisphere (NH) summer that extends from Asia to the Middle East in the upper troposphere and lower stratosphere (UTLS). The ASMA is bordered by the subtropical westerly jet in the north and easterly jets in the south. The Asian summer monsoon (ASM) dynamics act as a pathway for the transport of trace gases and pollutants both vertically (through convection) and horizontally (via the low-level jet and tropical easterly jet). The ASMA circulation responds to heating corresponding to the deep convection of the south Asian monsoon (Hoskins and Rodwell, 1995; Highwood and Hoskins, 1998). This strong anticyclone circulation isolates the air and is tied to the outflow of deep convection, which has distinct maximum characteristics in terms of dynamic and chemical variability (Randel and Park, 2006; Park et al., 2007). Recently, the anticyclone circulation in UTLS has been paid more attention by researchers in order to understand the dynamics, chemistry and radiation of the region. This problem has been discussed by several authors (e.g., Park et al., 2007; Fadnavis et al., 2014; Glatthor et al., 2015; Vernier et al., 2015; Santee et al., 2017). Deep convection during the monsoon can transport tropospheric tracers from the surface to the UTLS (Vogel et al., 2015; Tissier and Legras, 2016). The tracers that are transported are confined in the anticyclone and, consequently, affect the trace gas concentrations in the UTLS, resulting in significant changes in radiative forcing (Solomon et al., 2010; Riese et al., 2012; Hossaini et al., 2015). The center of the anticyclone is located either over the Iranian Plateau or over the Tibetan Plateau, where the distribution of pollutants and tracers vary significantly (Yan et al., 2011).
The spatial extent, strength and location of the anticyclone vary on several temporal scales due to the internal dynamic variability of the Asian monsoon (Zhang et al., 2002; Randel and Park, 2006; Garny and Randel, 2013; Vogel et al., 2015; Pan et al., 2016). However, the variability of the anticyclone structure and the response to the Indian monsoon activity are not understood and, consequently, neither is the variability of the tracers (e.g., O3 and CO) trapped in the anticyclone during the same period in the UTLS region. Since the anticyclone extends from the Middle East to East Asia, trapped pollutants are expected to make a large radiative forcing contribution to the background atmosphere. Thus, it is essential to understand the variability of anticyclone structure itself in detail as well as its response to the Indian summer monsoon (ISM). Therefore, in the first part of the study, we investigate the spatial, interannual and decadal variations of the anticyclone. Since the Indian monsoon responds at different timescales, we also investigate the anticyclone variability with respect to the active and break phases of the Indian monsoon, strong and weak monsoon years, and the stronger El Niño–Southern Oscillation (ENSO) years. For this, we utilize the National Center for Environmental Prediction/National Center for Atmospheric Research (NCEP/NCAR) reanalysis geopotential height from 1951 to 2016. The structure of the paper is as follows: the data sets used in this study are described in Sect. 2; Sect. 3 contains the seasonal and decadal variation of the anticyclone; Sect. 4 shows the influence of the ISM on the anticyclone, i.e., active and break phases, strong and weak monsoon years, and ENSO's effects on the anticyclone; and, finally, the results are presented in Sect. 5.
2.1 NCEP/NCAR reanalysis
The National Center for Environmental Prediction (NCEP) in collaboration with the National Center for Atmospheric Research (NCAR) produces reanalysis data from a consistent assimilation and modeling procedure that incorporates all of the available observed conditions obtained from conventional and satellite information from 1951 to the present (Kalnay et al., 1996). We used NCEP/NCAR reanalysis daily geopotential height (GPH) and wind data from 1951 to 2016. The NCEP/NCAR data assimilation uses a 3D-variational analysis scheme with 28 pressure levels and triangular truncation of 62 waves (at a horizontal resolution of 200 m). Both GPH and temperature at the chosen standard levels are described as class output variables (Kalnay et al., 1996), i.e., they are strongly influenced by observed data. Only the Indian summer monsoon months (June, July, August and September) containing gridded daily data were considered in this study. The NCEP/NCAR reanalysis data have a spatial resolution of 2.5∘. The seasonal values are estimated from daily data. To identify the spatial and temporal variations of the anticyclone center, we used the monthly mean values of the GPH and the zonal wind component. The quality of NCEP GPH reanalysis data is discussed in Bromwich et al. (2007).
2.2 IMD gridded precipitation data
The India Meteorological Department (IMD) high-resolution (0.25∘ × 0.25∘) gridded precipitation data are used to identify the active and break phases during June, July and August from 1951 to 2016 (Pai et al., 2016). These precipitation data have been validated extensively with observational and reanalysis data sets and display a very good correlation (Kishore et al., 2016). We identified the active and break phases based on daily rainfall over the monsoon core zone of India (which roughly spans from 18 to 28∘ N and from 65 to 88∘ E) during July and August, as reported by Rajeevan et al. (2010). The normalized anomaly estimated from the averaged daily rainfall in the monsoon core zone is subtracted from its long-term (1951–2000) mean by dividing it by its daily standard deviation. The active (break) phases were identified from the normalized anomaly when rainfall is greater (less) than −1.0 (+1.0) for 3 consecutive days or more.
2.3 GNSS radio occultation (RO) data
We also used the Global Navigation Satellite System (GNSS) radio occultation (RO) data to investigate the temperature anomaly. The basic measurement principle of RO exploits the atmosphere-induced phase delay in the GNSS signals, which are recorded in the low Earth-orbiting satellite. This technique provides vertical profiles of refractivity, density, pressure, temperature and water vapor (Kursinski et al., 1997). The temperature profiles from this technique are available with low horizontal (∼200–300 km) and high vertical resolutions (10–35 km) with an accuracy of <0.5 K. We used CHAllenging Minisatellite Payload (CHAMP) and Constellation Observing System for Meteorology, Ionosphere, and Climate (COSMIC) data covering the period from 2002 to 2016.
The CHAMP satellite was launched into a circular orbit by Germany on 15 July 2000 to measure the Earth's gravity and magnetic field and to provide global RO soundings (Wickert et al., 2001). About ∼230 RO profiles per day have been measured by the CHAMP payload since 2002. The CHAMP payload was solely designed to track the setting occultations, and the RO event is terminated when the signal is lost – this results in a decrease in the number of occultations with decreasing altitude (Beyerle et al., 2006). This receiver measures the phase delay of radio wave signals that are occulted by the Earth's atmosphere. From this phase delay, it is possible to retrieve the bending angle and refractivity vertical profiles.
COSMIC consists of a constellation of six satellites, which were launched into a circular, 72∘ inclination orbit at a 512 km altitude in April 2006 and are capable of receiving signals from the Global Positioning System (GPS; Anthes et al., 2008). Compared with previous satellites, COSMIC satellites employ an open-loop mode, which can track both the rising and setting of occultations (Schreiner et al., 2007). The open-loop tracking technique significantly reduces the GPS RO inversion biases by eliminating tracking errors (Sokolovskiy et al., 2006). The COSMIC temperature profiles display a very good agreement with radiosonde data, reanalyses and models (Rao et al., 2009; Kishore et al., 2011, 2016). The CHAMP and COSMIC GPS RO data were interpolated to 200 m from their native resolution. We derived the cold-point tropopause altitude/temperature over the ASMA region, as discussed by Ratnam et al. (2014) and Ravindra Babu et al. (2015). Both the CHAMP and COSMIC data were obtained from the COSMIC Data Analysis and Archive Center (CDAAC; https://cdaac-www.cosmic.ucar.edu/cdaac/products.html, last access: 30 June 2019).
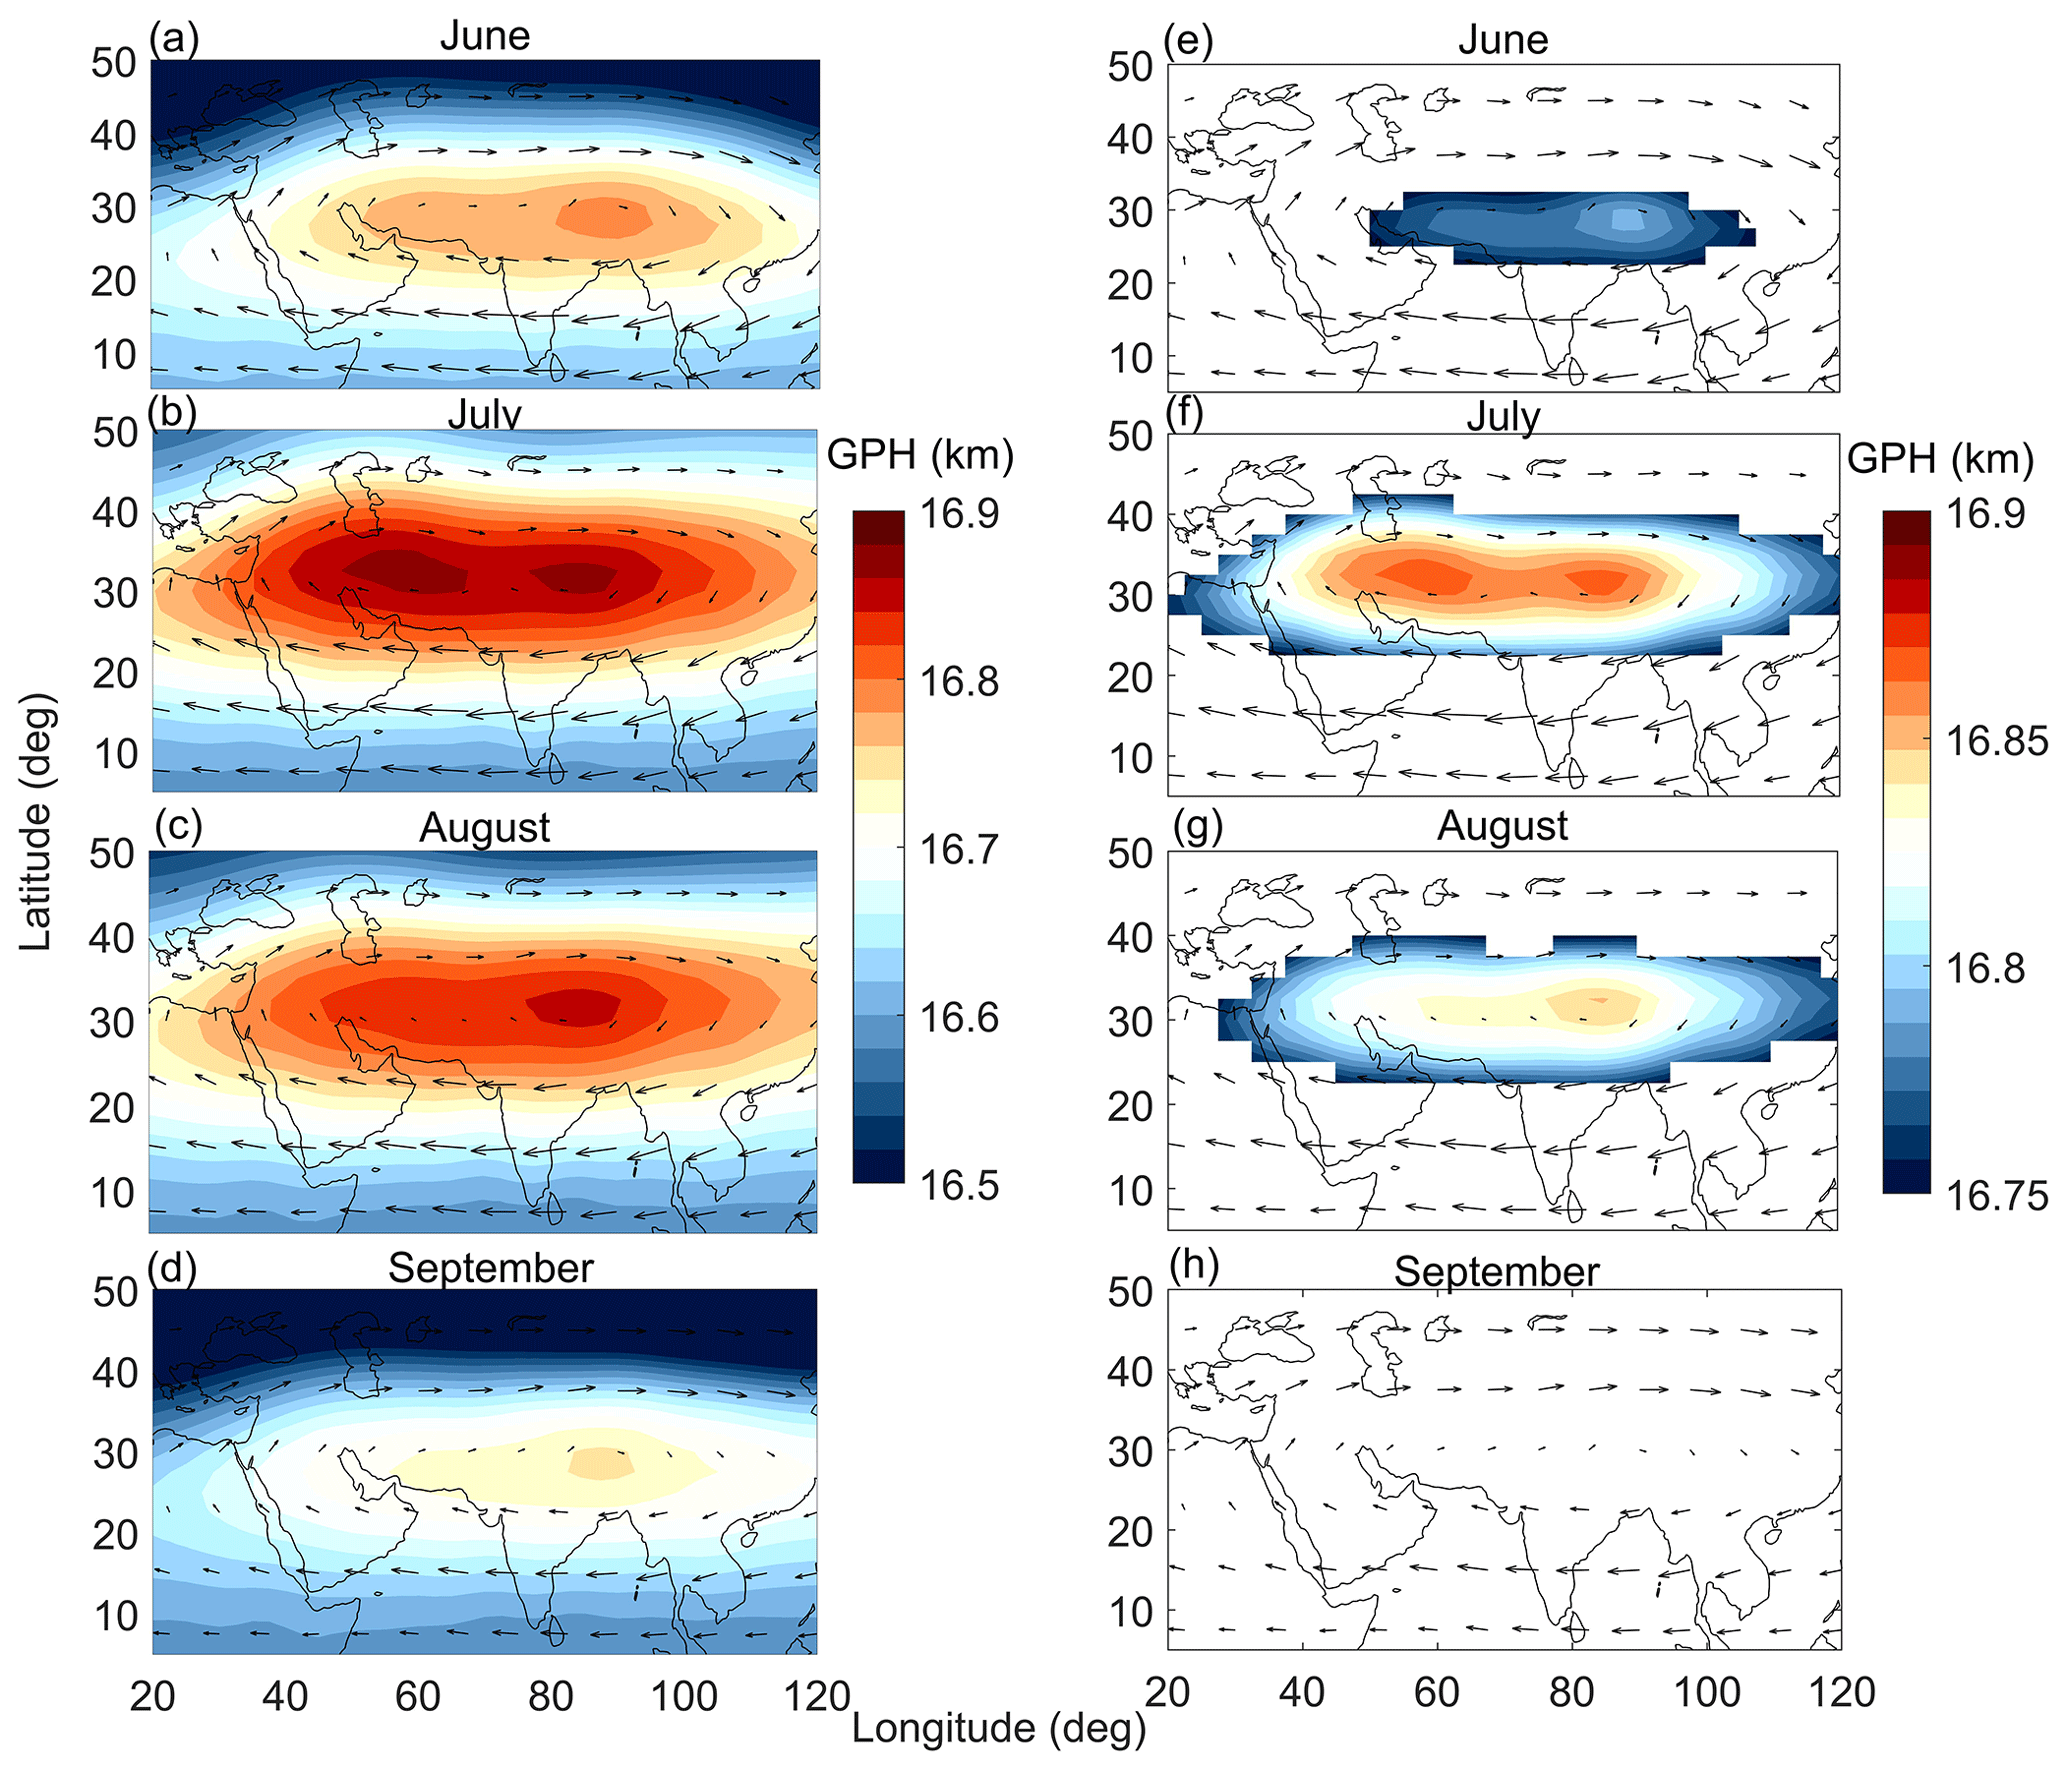
Figure 1Spatial distribution of geopotential height (GPH) and wind vectors at 100 hPa during (a) June, (b) July, (c) August and (d) September from NCEP reanalysis data averaged from 1951 to 2016. The core of the anticyclone region was chosen based on the GPH values ranging from 16.75 to 16.9 km. The spatial extent and magnitude of the anticyclone after applying the GPH criteria for (e) June, (f) July, (g) August and (h) September.
Variability of the anticyclone
The climatological spatial variability of the GPH and wind vectors at 100 hPa during June, July, August and September from NCEP reanalysis data is shown in Fig. 1a–d. The anticyclone circulation is clearly depicted by wind vectors during the abovementioned months (Fig. 1). During the months of September and June, the GPH values, which represent the spatial extent of the anticyclone, are low compared with July and August. Thus, the spatial extent and intensity of the anticyclone are greater during July than in the other months. During July and August, the anticyclone extends from East Asia to the Middle East. The spatial extent of the anticyclone circulation is clearly evident in the grid from 15 to 45∘ N and from 30 to 120∘ E at 100 hPa, and the climatological averaged GPH values vary from 16.5 to 17 km in the NCEP reanalysis between 1951 and 2016. Using the modified potential vorticity equation, Randel et al. (2006) showed the spatial variation of the anticyclone where GPH values are stationary in the range from 16.75 to 16.9 km. Similarly, Park et al. (2007) showed the anticyclone structure from the strongest wind at 100 hPa using the streamline function. Bian et al. (2012) reported the spatial variability of the anticyclone using 16.77 and 16.90 km in the GPH contour as the lower and the upper boundaries, respectively; thus, these empirically selected GPH values represent the anticyclone boundaries. Therefore, in this present study, we have chosen the values from 16.75 to 16.9 km to investigate the spatial features of the anticyclone, and the results are depicted in Fig. 1e–h. The spatial extent and existence of the anticyclone are highly prominent during July and August compared with June. During September, very low GPH values are seen compared with July and August. Therefore, we considered the average of the July and August GPH values from 1951 to 2016 for further analysis, as shown in Fig. S1 in the Supplement. The core region and the spatial extent of the anticyclone are clearly evident in Fig. S1. The core region of the anticyclone shows a bimodal distribution, i.e., one core located at the southwestern flank of the Himalayas and another over Iran. The core region over the southwestern flank of the Himalayas is due to large-scale updraft, which is caused by the moist energy over the Indo-Gangetic Plain, heating of the Tibetan Plateau and the orographic forcing of the Himalayas. Severe heating over the Arabian Peninsula supports the formation of the mid-tropospheric anticyclone in the west. This anticyclone can merge intermittently with the ASMA. It is also observed that the spatial extent of the anticyclone varies drastically at different temporal scales. Therefore, seasonal variation is much more pronounced.
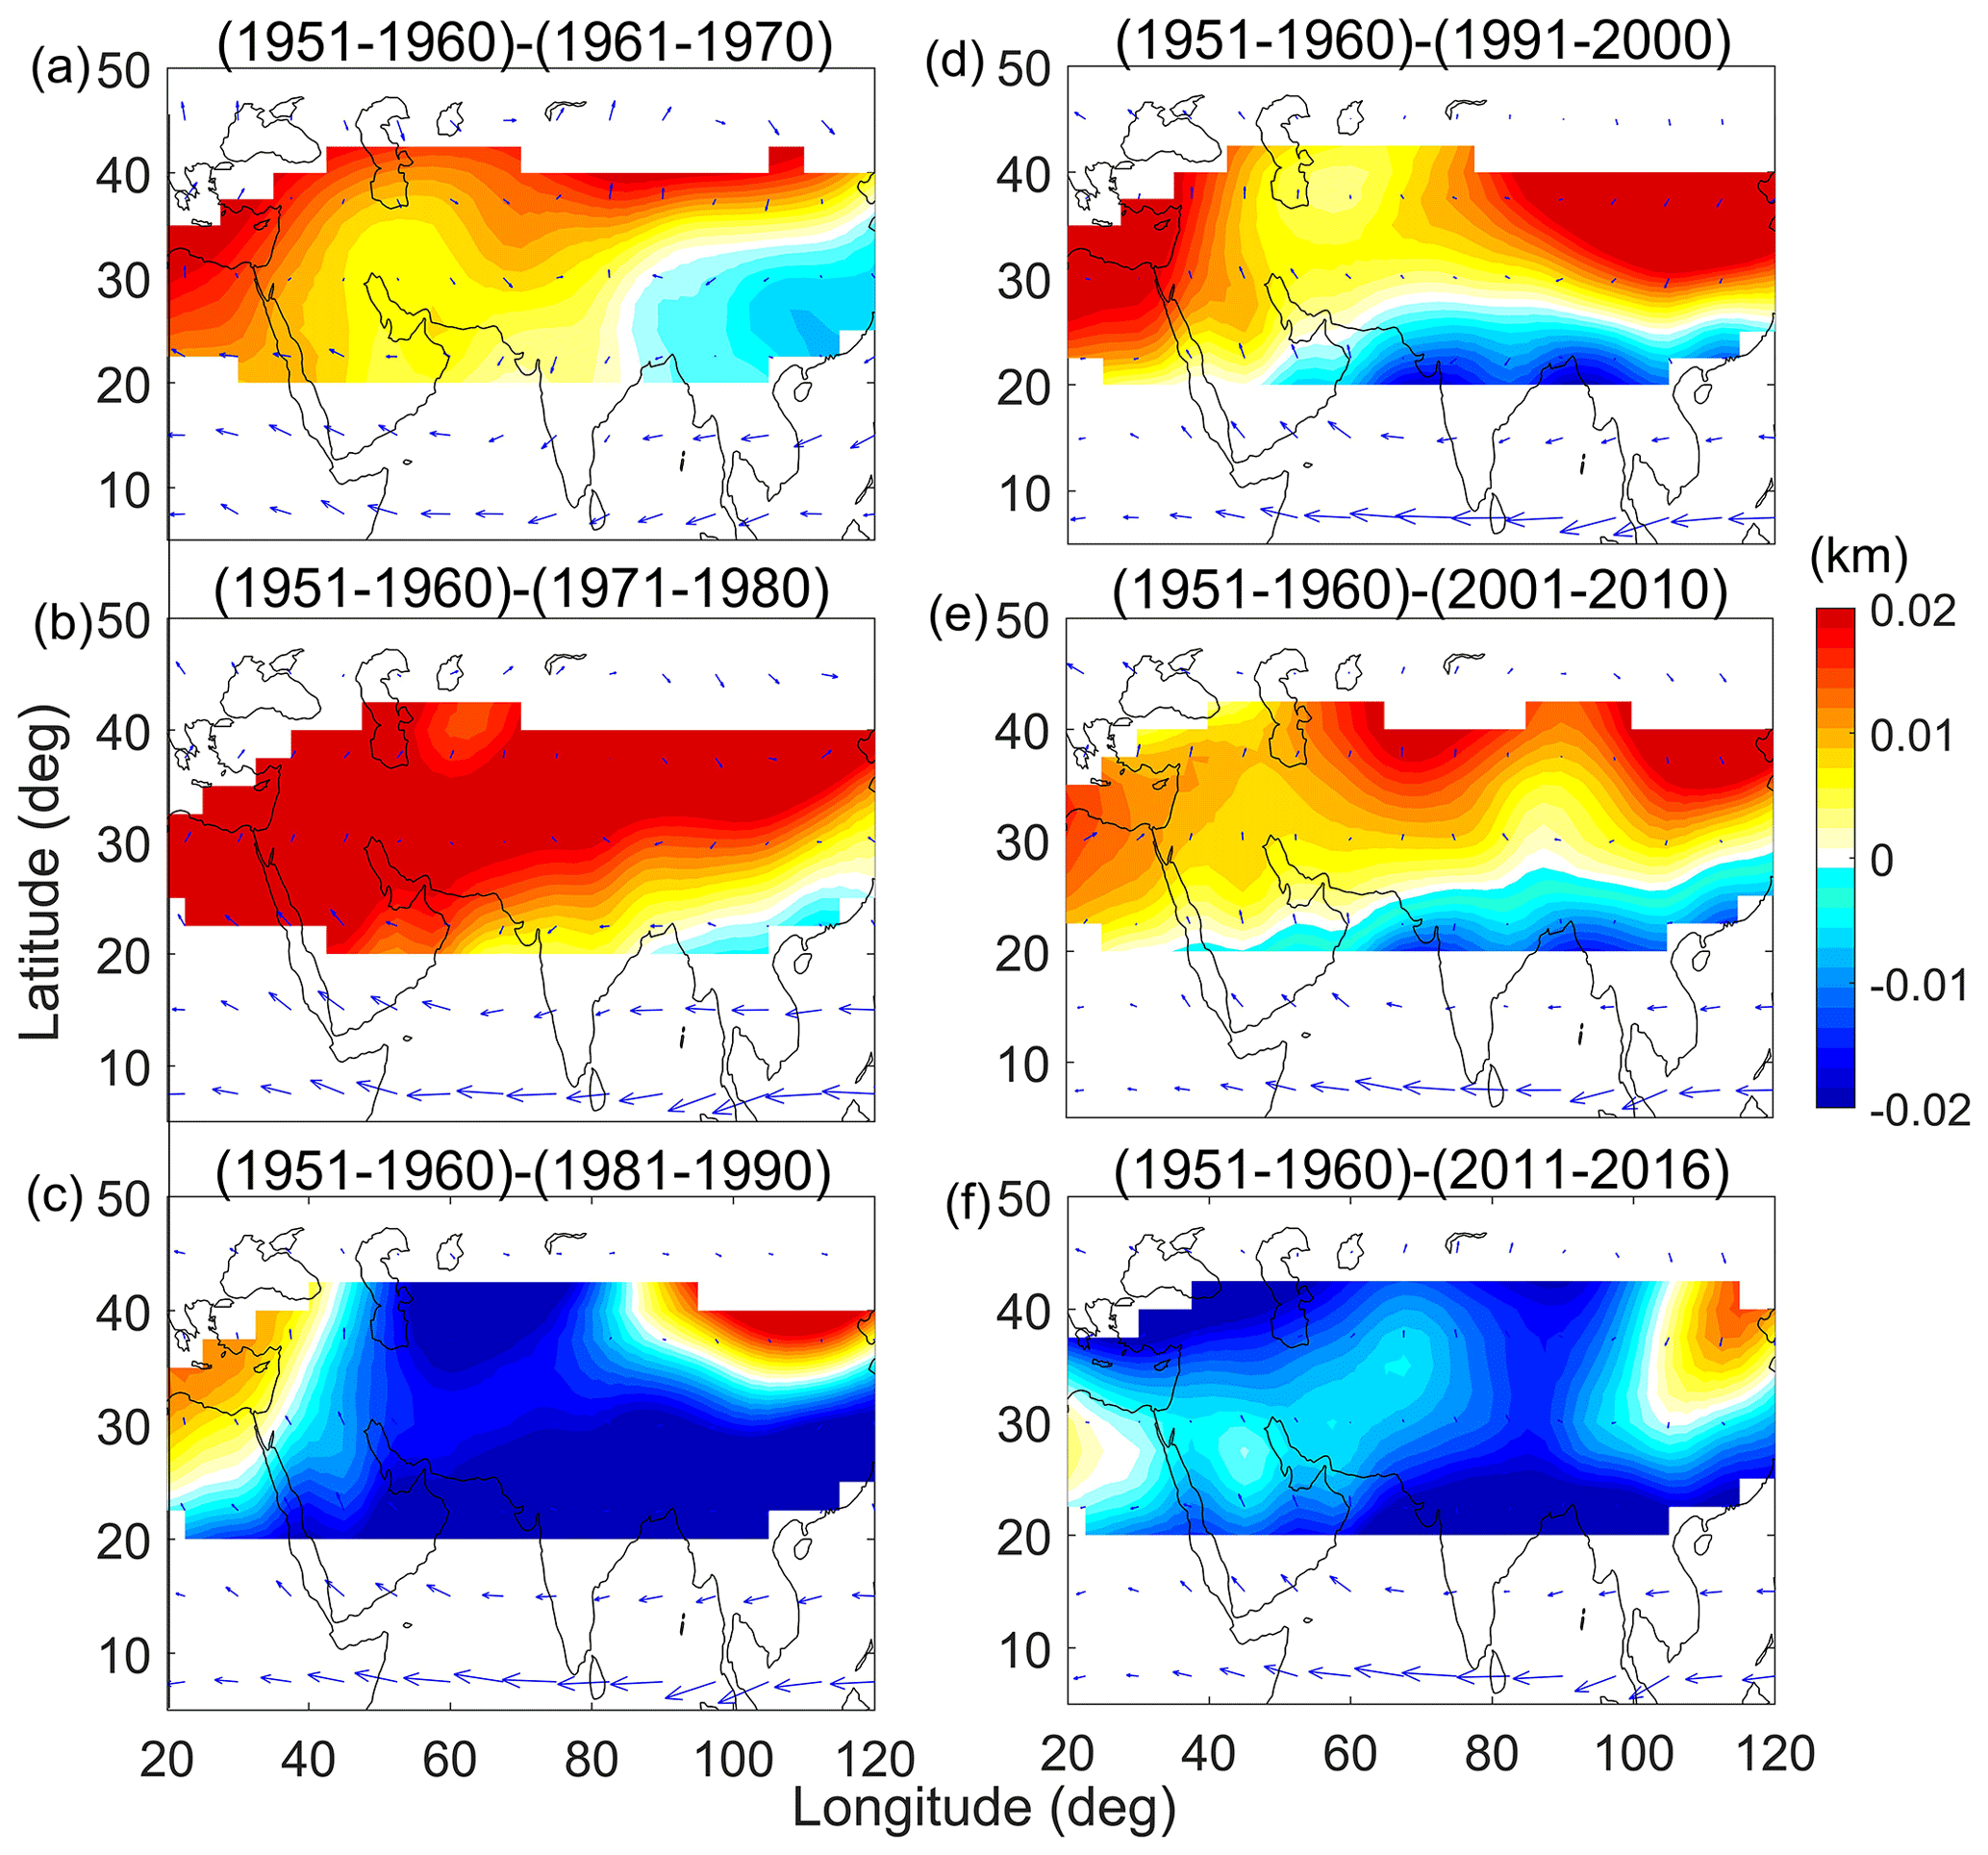
Figure 2Decadal variation of the anticyclone obtained from the GPH and wind vectors with reference to the 1951–1960 period.
The decadal variation of the anticyclone is studied with respect to the spatial variability. Figure 2 shows the decadal spatial variation of the anticyclone with reference to the 1951–1960 period. The significant difference in the decadal variation is noticed in Fig. 2. The edges (east, north and west) of the anticyclone undergo drastic changes during the 1961–1970 period. With respect to the 1971–1980 period, except for a small portion in the east, the whole anticyclone shows drastic changes. During the decade from 1971 to 1980, the recorded GPH values in the anticyclone are also ∼25 m lower compared with the values from 1951 to 1960. The inverse is seen from 1981 to 1990, as high GPH values (∼30 m) are observed compared with those from the reference period. The GPH difference is significant over the western, northeastern and southern regions of the anticyclone during the 1991–2000 period. Similar changes are observed from 2001 to 2010. Compared with all of the decadal differences, 2011–2016 shows a completely different picture: changes are only seen in the western and northeastern corners, whereas other parts of the anticyclone do not show any change. From this analysis, we observed significant changes in the anticyclone even from one decade to another, which can result in a change in chemical and dynamic variability over this region.
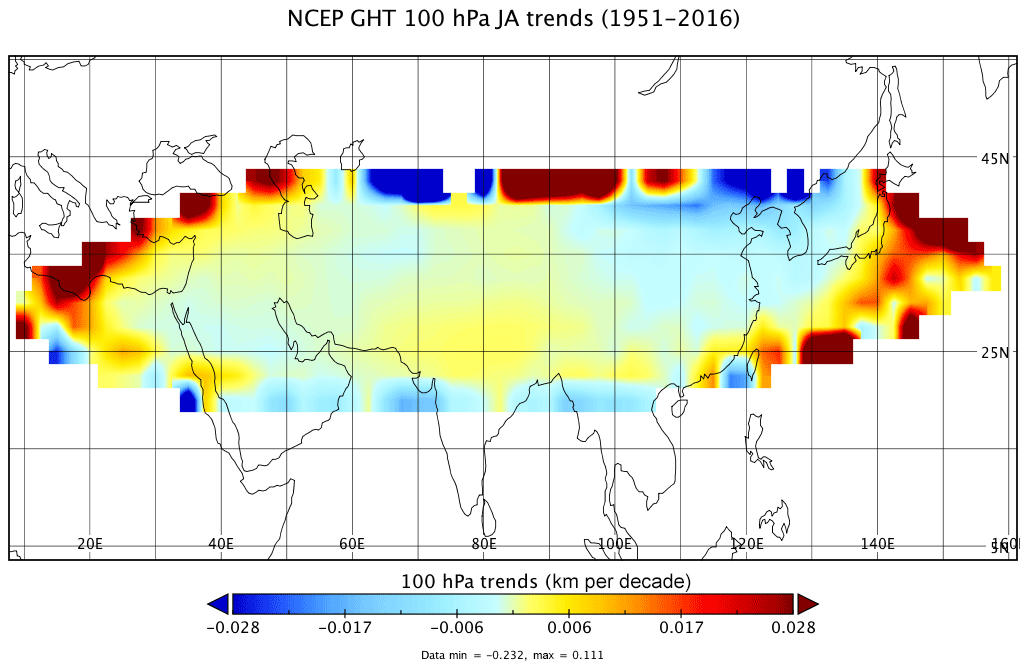
Figure 3Spatial trend analysis obtained using robust regression analysis at a 95 % confidence interval.
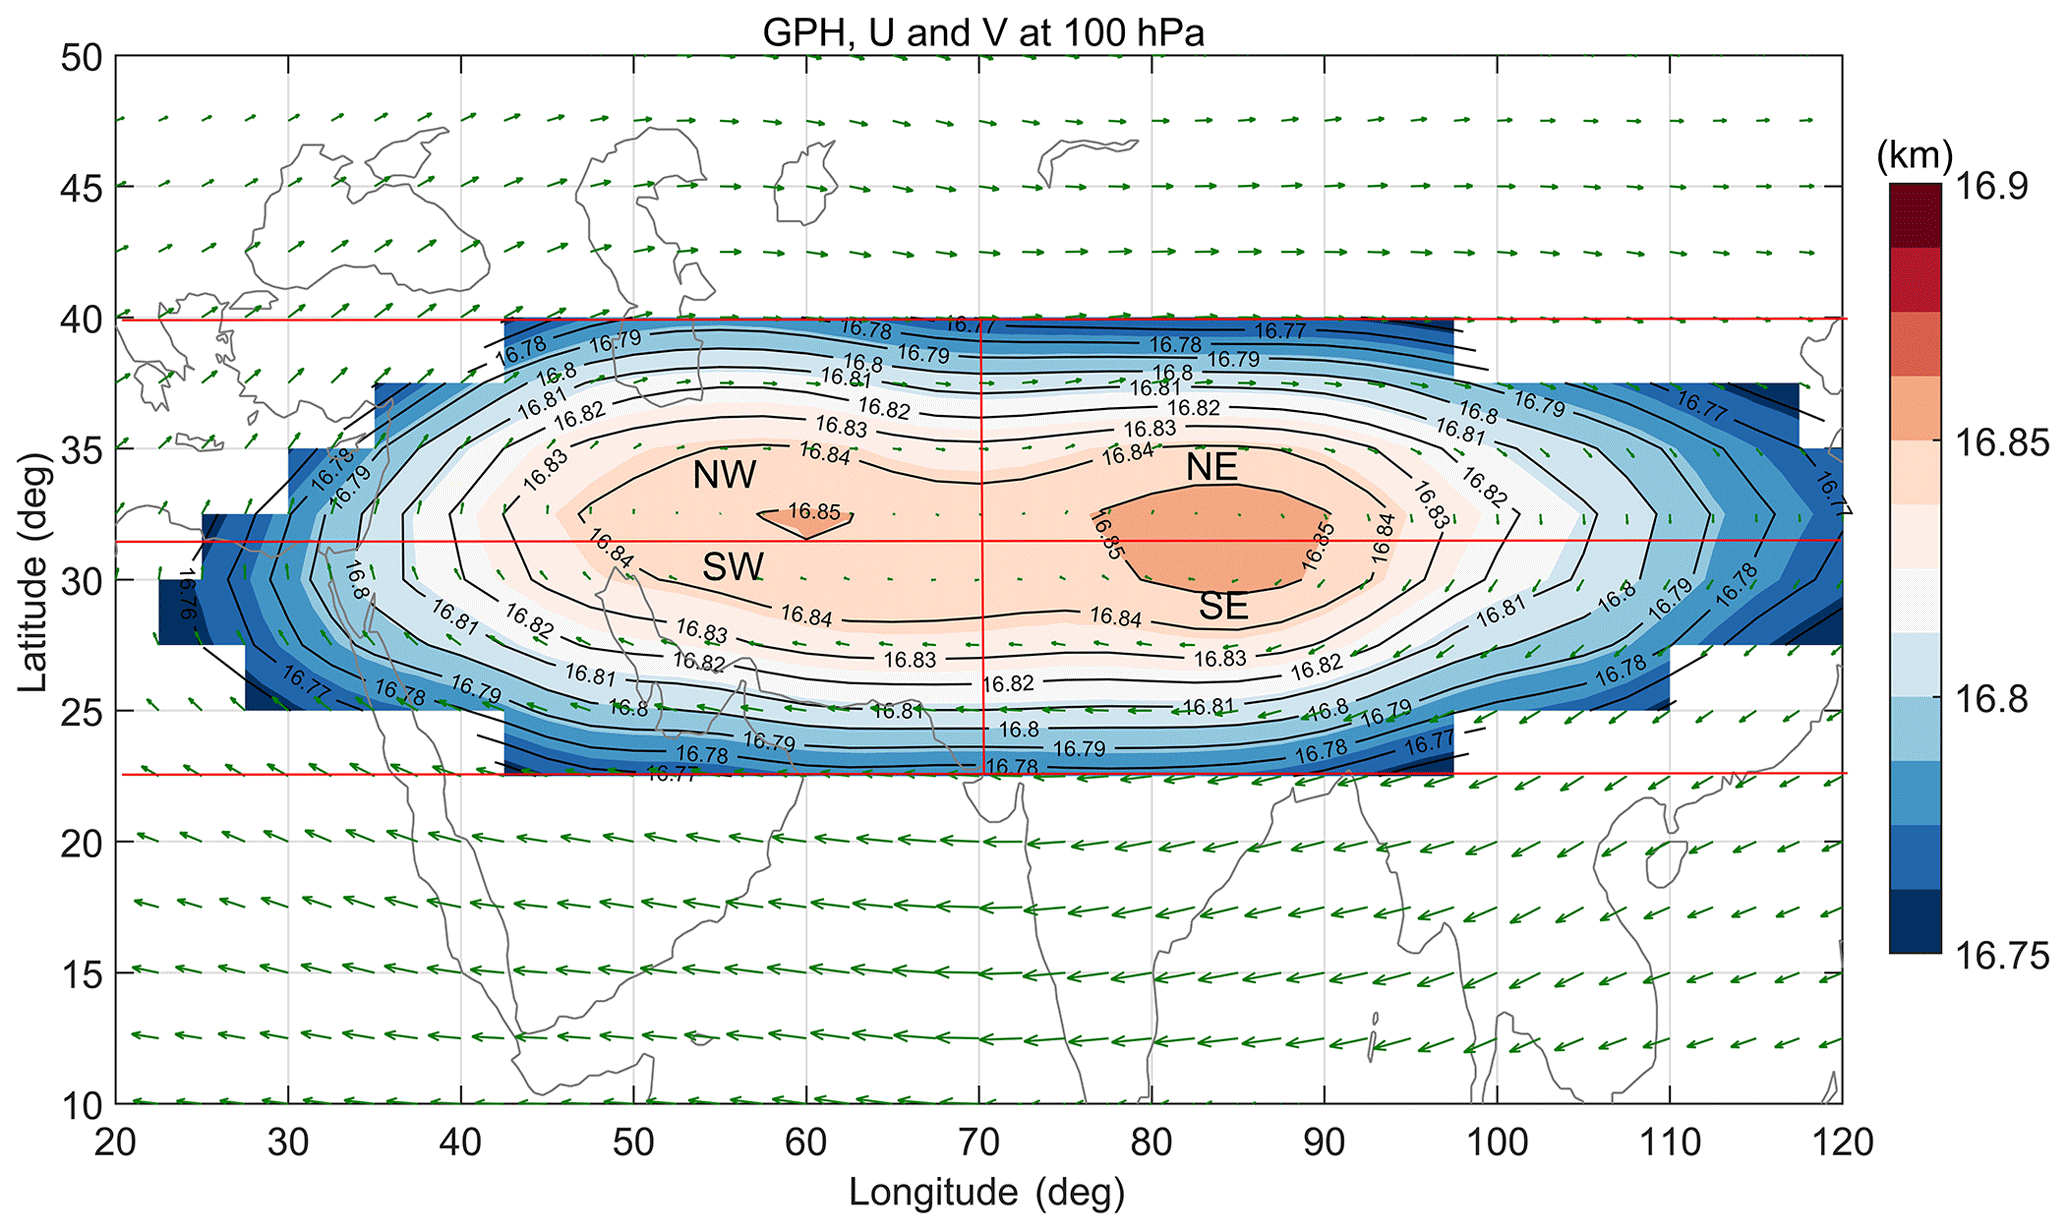
Figure 4The climatological distribution of the GPH (from 16.75 to 16.9 km) and wind vectors averaged during July and August from NCEP reanalysis data along with contour lines at 100 hPa from 1951 to 2016. The GPH values' peak centers at 32.5∘ N in latitude and 70∘ E in longitude. Thus, the anticyclone region is further divided in to four sectors based on the peak values of the GPH: southeast (SE; 22.5–32.5∘ N) and northeast (NE;32.5–40∘ N) with respect to the longitude band from 70 to 120∘ E and southwest (SW; 22.5–32.5∘ N) and northwest (NW; 32.5–40∘ N) with respect to the longitude band from 20 to 70∘ E.
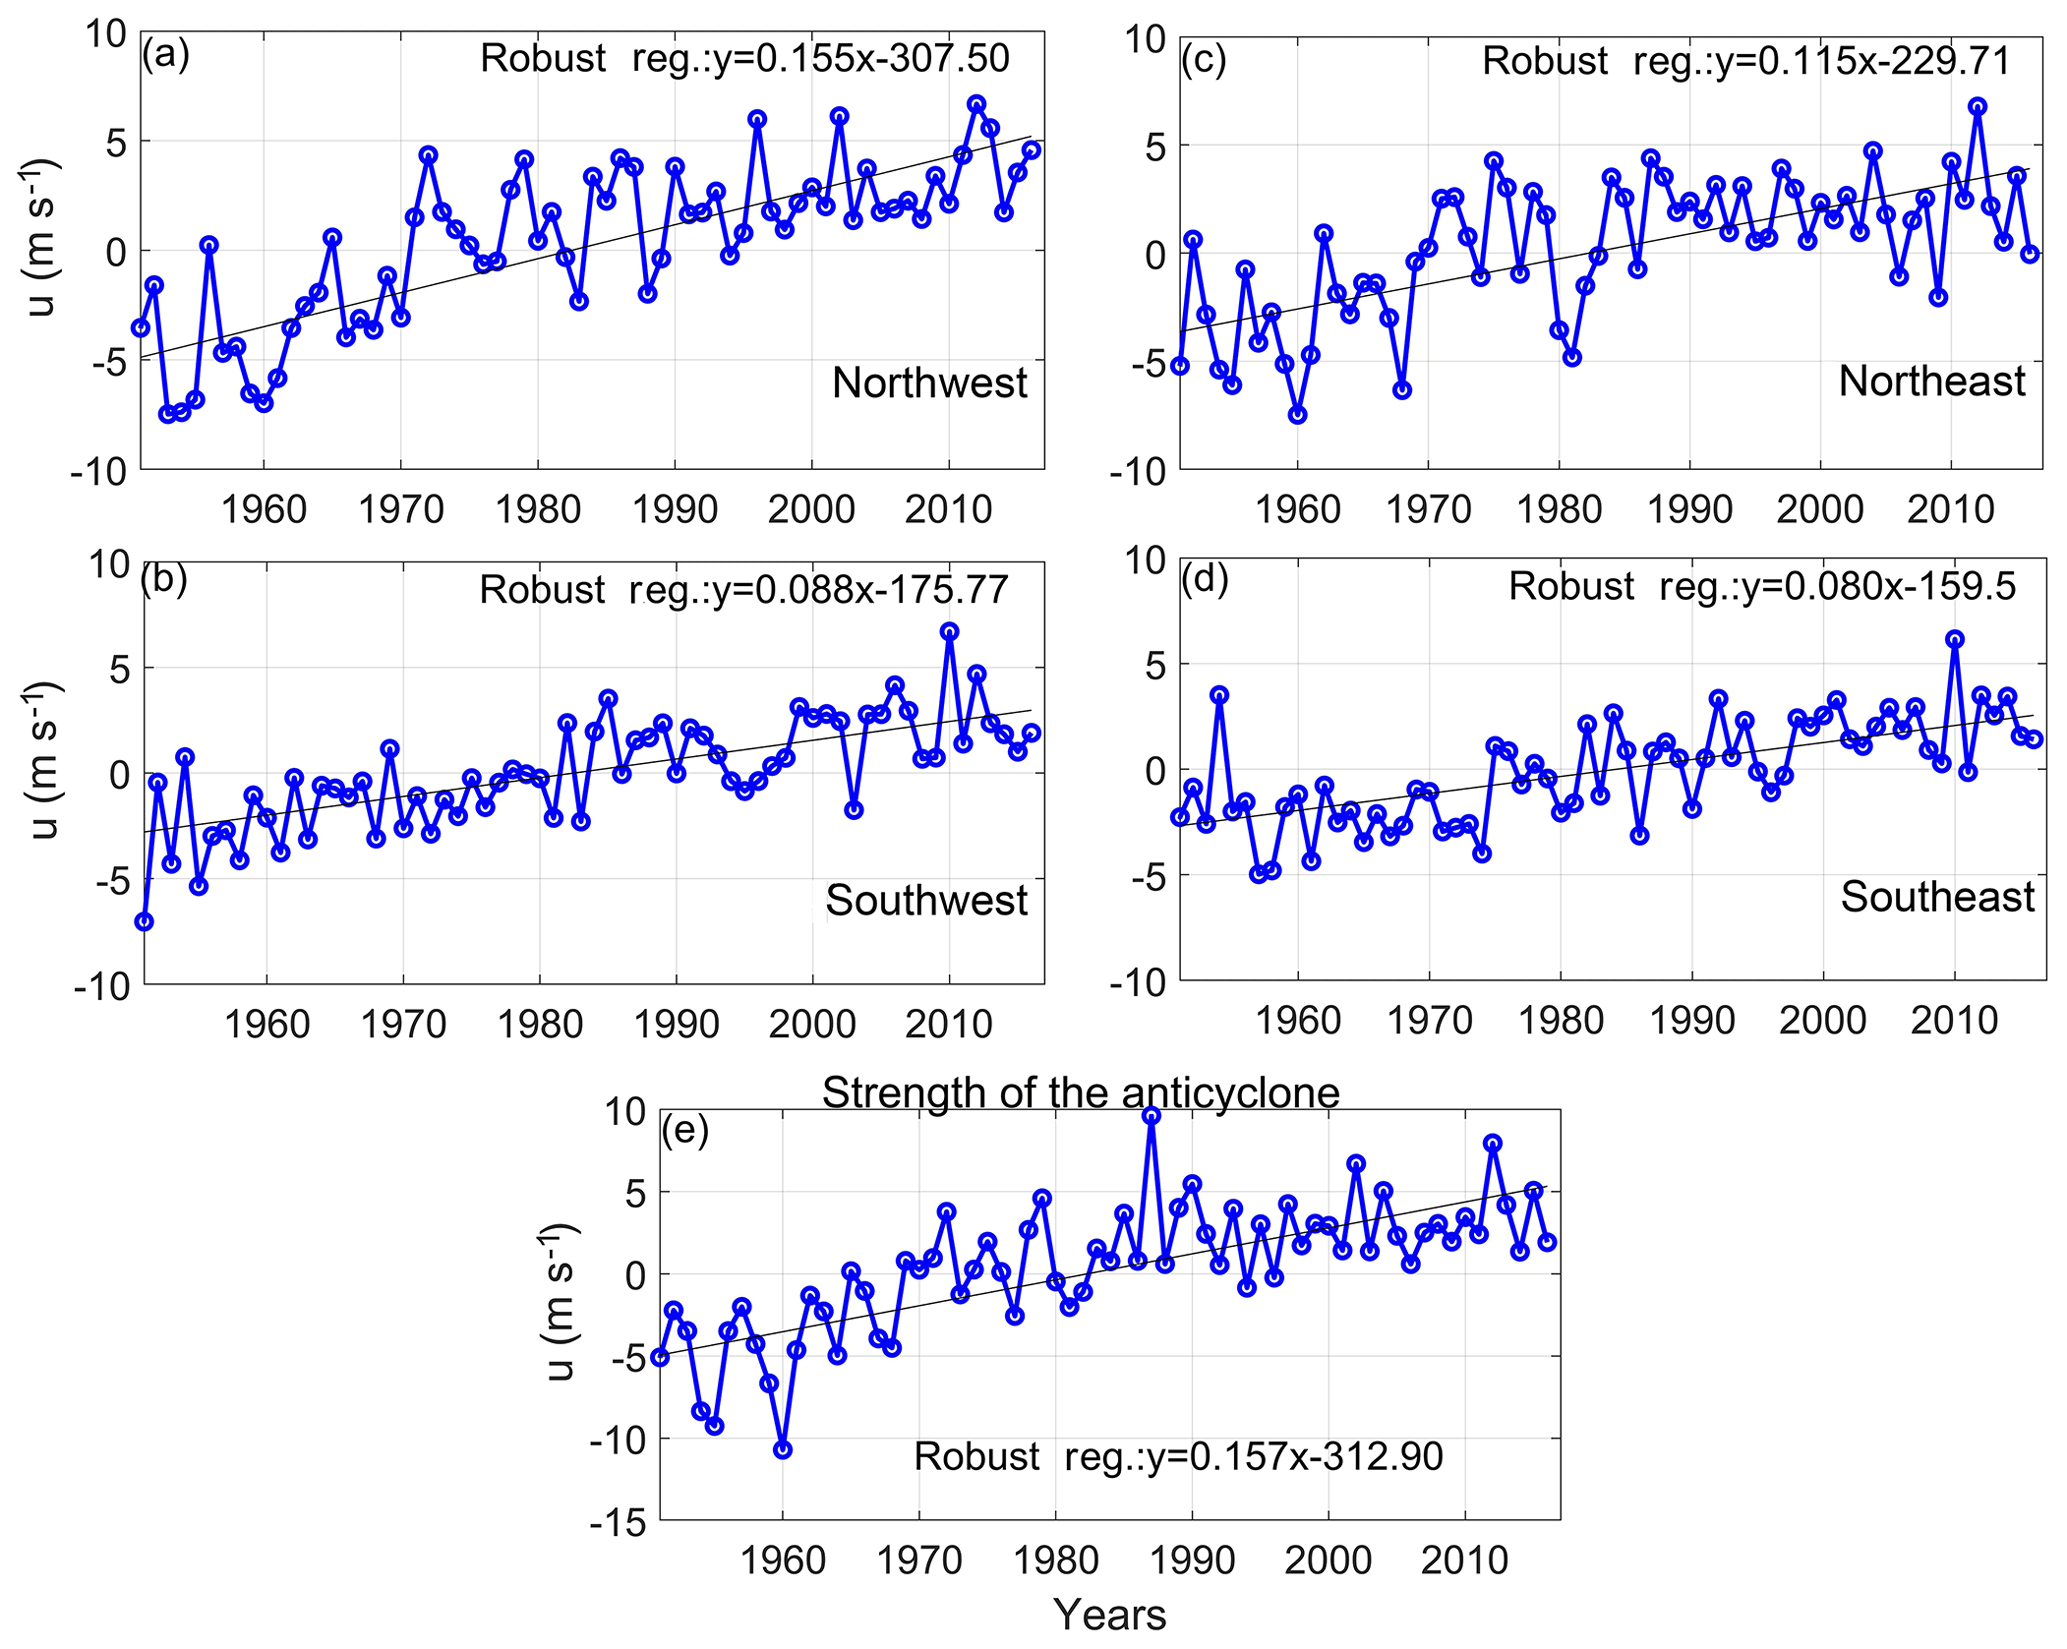
Figure 5Time series of zonal wind anomalies estimated for the (a) northwest, (b) southwest, (c) northeast and (d) southeast sectors of the ASMA. The trend analysis was performed at a 95 % confidence interval using robust regression analysis. (e) The strength of the anticyclone was estimated from the zonal wind difference between 30–40∘ N and 10–20∘ N in the longitude band from 50 to 90∘ E.
Furthermore, the spatial distribution of the trend is estimated from 1951 to 2016 using robust regression analysis at a 95 % confidence interval, as displayed in Fig. 3. The edges on all sides of the anticyclone undergo noticeable changes compared with the core region. The eastern and northwestern sides of the anticyclone show an increasing trend compared with the other regions. The trends at the northern end are more significant than at the southern end. A few areas on the northern side of the anticyclone show a reduction in strength. Therefore, in order to understand the asymmetry in the anticyclone variability, we divided the anticyclone region into four different sectors, as shown in Fig. 4, based on the peak values of the GPH along latitude and longitude cross sections. The center values of the GPH are located at a latitude of 32.5∘ N and a longitude of 70∘ E . The four sectors can be divided into southeast (SE; 22.5–32.5∘ N) and northeast (NE; 32.5–40∘ N) in the longitude band from 70 to 120∘ E and southwest (SW; 22.5–32.5∘ N) and northwest (NW; 32.5–40∘ N) in the longitude band from 20 to 70∘ E. The area-averaged time series (July and August) of zonal wind anomalies in these sectors from 1951 to 2016 are shown in Fig. 5. The zonal wind anomalies show a clearly increasing trend in all sectors. From 1951 to 1980, the zonal wind anomalies are negative and shift to positive in all sectors. The year 1980 represents the beginning of industrialization globally (Basha et al., 2017). The change is highly significant in the northwestern and northeastern sectors with a magnitude of variability of 7.59 m s−1 from 1951 to 2016, whereas it is 5.44 m s−1 in the southeastern and southwestern sectors. In addition, we estimated the strength of the anticyclone during the monsoon season using the difference in the zonal wind between the northern (30–40∘ N) and southern (10–20∘ N) flanks of the anticyclone, which is depicted in Fig. 5e. A significant increase in the strength of the anticyclone is noticed at a rate of 0.157 (10.36 from 1951 to 2016; Fig. 5e).
It is well known that the Indian monsoon rainfall varies at different timescales, i.e., daily, sub-seasonal, interannual, decadal and centennial scales (Rajeevan et al., 2010). Precipitation during the monsoon varies from intra-seasonal scales between active (good rainfall) and break (less rainfall) phases. Any small change in the precipitation pattern will affect the anticyclone due to the thermodynamics involved in rainfall. In this study, we also investigated the anticyclone variability during the active and break phases of the Indian monsoon. The active and break periods were identified in July and August using the high-resolution gridded (0.25∘ × 0.25∘) rainfall data from 1951 to 2016 as defined by Pai et al. (2016).
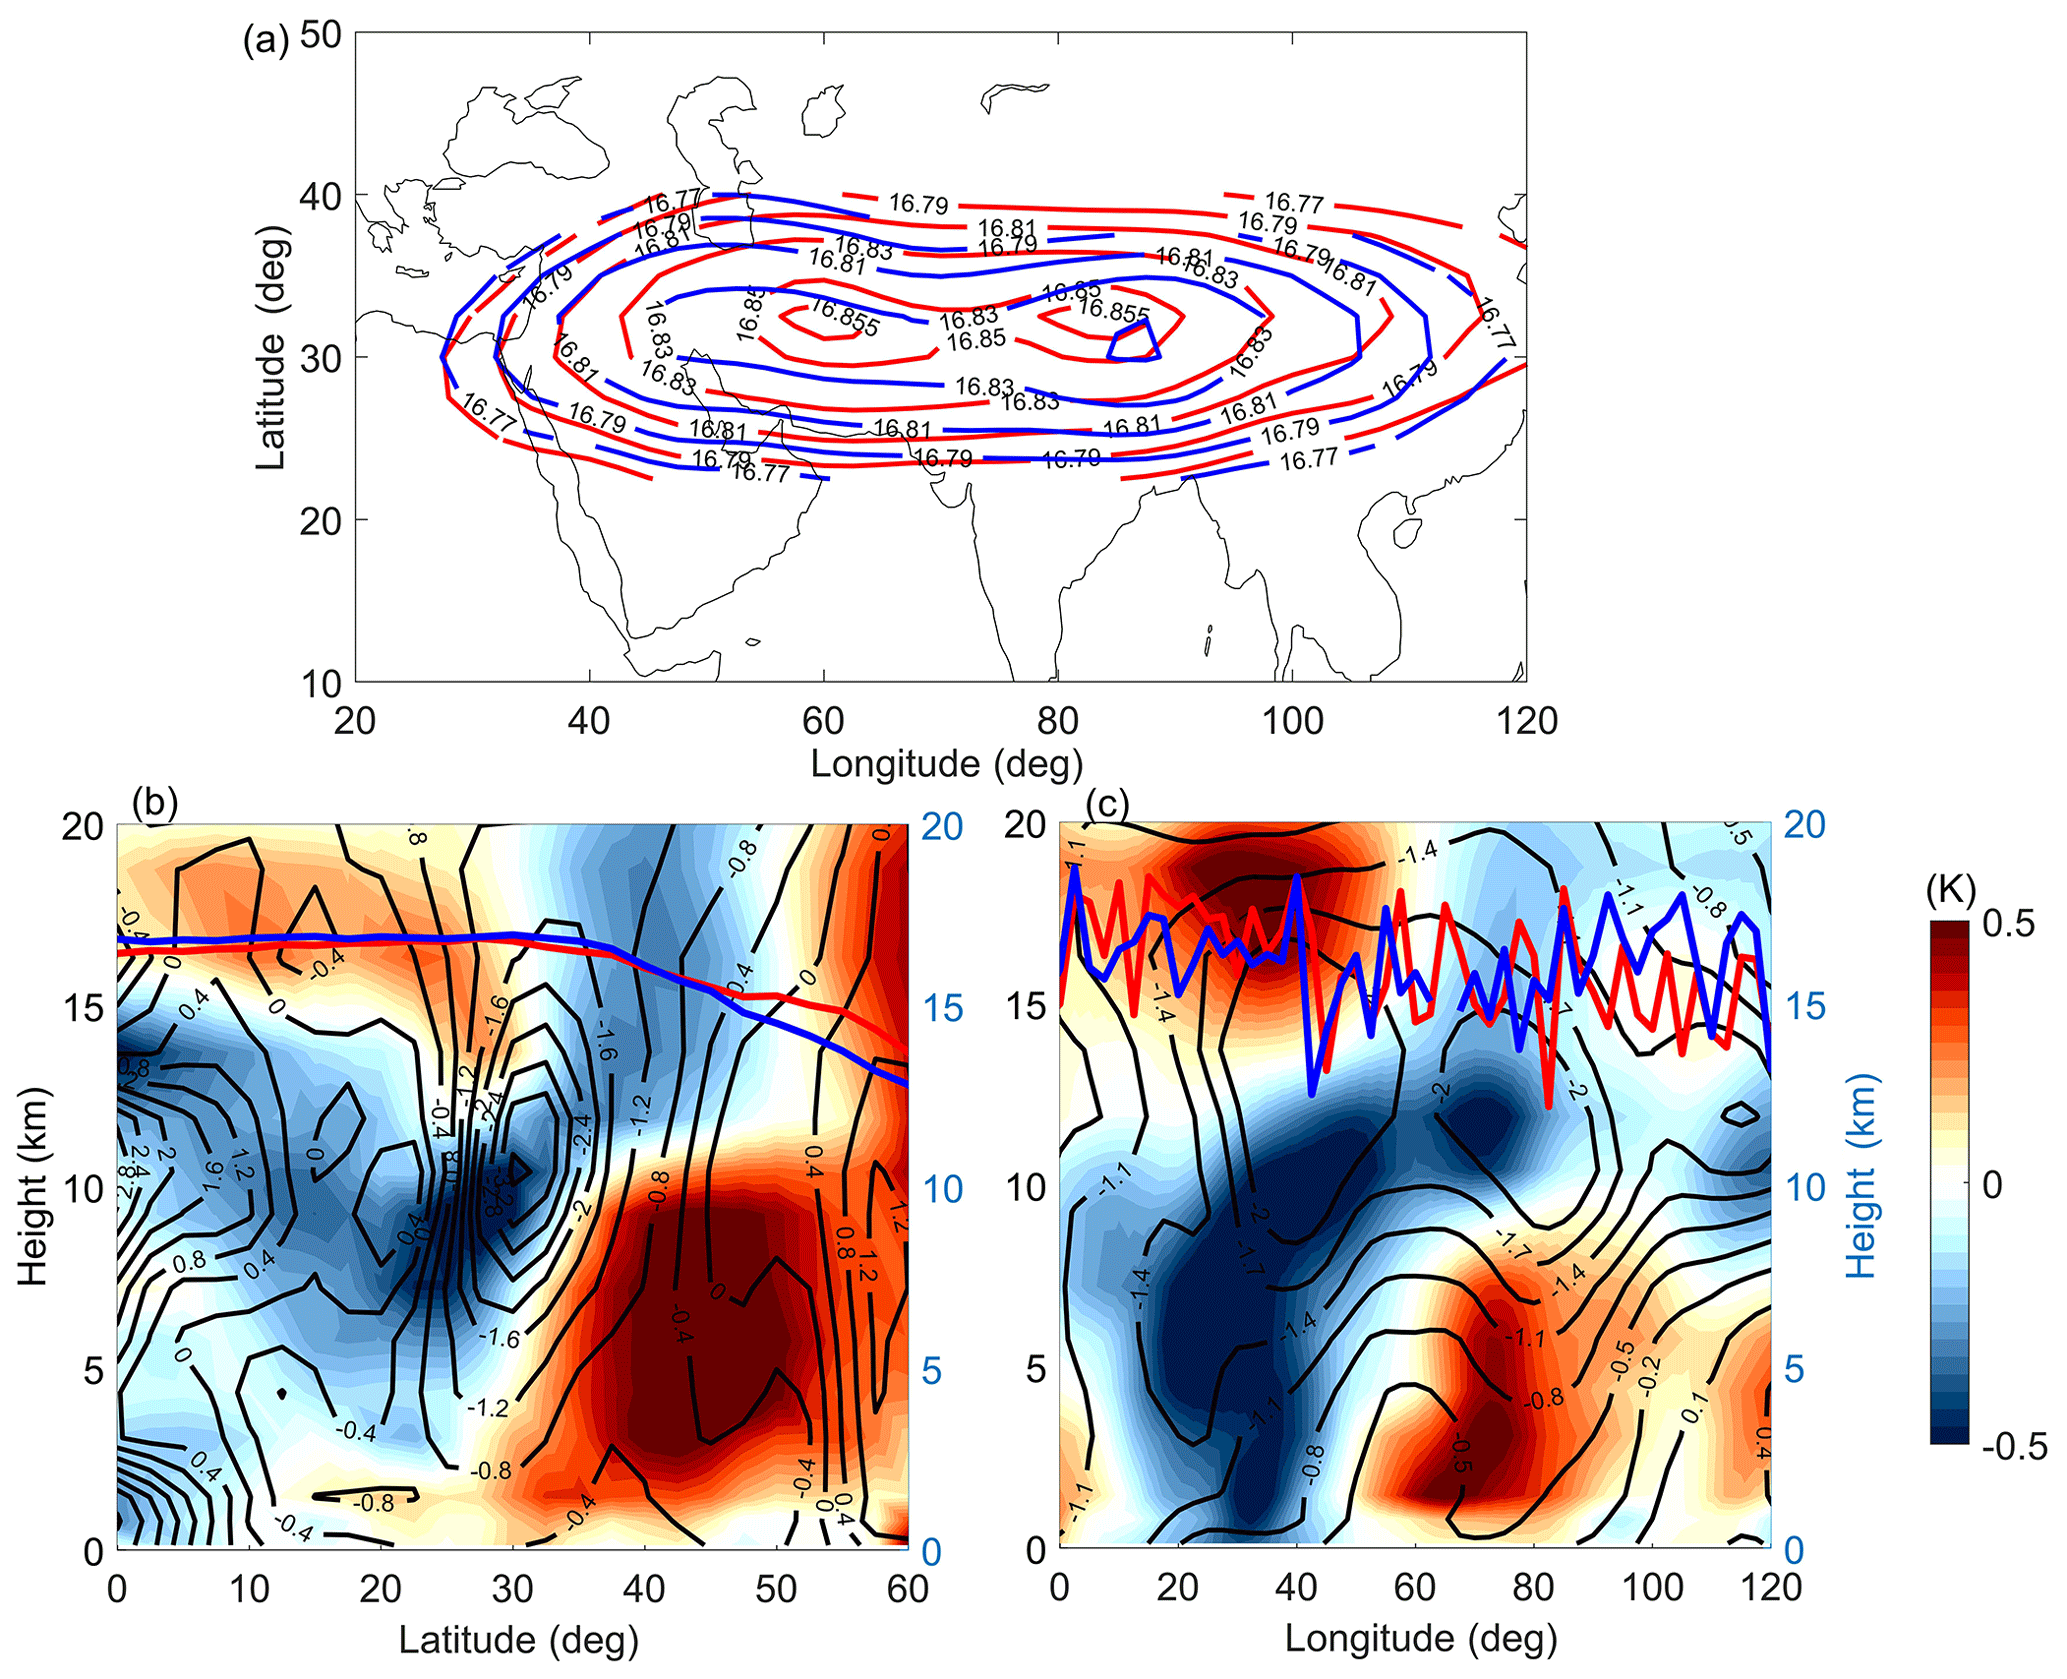
Figure 6(a) The ASMA variability during active and break phases of Indian monsoon obtained from the GPH at 100 hPa. The red line indicates the active phases of the Indian monsoon, and the blue line indicates the break phases. (b) Latitude–altitude cross section of temperature (colored shading, K) and zonal wind anomalies (contour lines, m s−1) estimated from the difference between the active and break phases of the Indian monsoon in the longitude band from 80 to 90∘ E. (c) Longitude–altitude cross section of temperature and wind anomalies averaged between 30 and 40∘ N. The red and blue lines in panels (b) and (c) denote the tropopause altitude during the respective active and break phases of Indian monsoon estimated using GNSS RO data.
The number of active and break days is derived from the precipitation data shown in Fig. S2a and b. Daily GPH, temperature and zonal wind are taken from the NCEP reanalysis, whereas the tropopause altitude is derived from the GNSS RO data for active and break days. The anticyclone structure during active (red line) and break (blue line) days is shown in Fig. 6a. Two interesting aspects of the anticyclone variability can be noticed between active and break days: (1) the extent of the anticyclone is large during active days compared with break days, and (2) there are two-cell structures in the anticyclone core region during active days. The extent of the anticyclone is large in the eastern and northern sectors on active days. The zonal (meridional) cross section of temperature (colored shading), zonal wind (contour lines) and the difference between the active and break phases averaged in the longitude band from 80 to 90∘ E (latitude band from 30 to 40∘ N) along with the cold-point tropopause for active and break days are illustrated in Fig. 6b and c. During active days, the temperature shows cooling at tropical latitudes, whereas it shows warming in the midlatitudes from the surface to the tropopause. Significant warming is observed during the active days in the mid-troposphere over the Tibetan Plateau and its northern side. Westerly (easterly) winds exist over the cooler (warmer) regions. The warm temperature anomalies stretch from 1.5 to 12 km between 25 and 60∘ N. The tropopause altitude is low (high) during the active (break) phases of the Indian monsoon, as shown in Fig. 6b. The meridional cross section of temperature anomalies displays significant warming from ∼1.5 to 8 km over the Indian region. The tropopause altitude exemplifies random variability in the meridional cross section.

Figure 7(a) The ASMA variability obtained from GPH at 100 hPa during strong and weak monsoon years calculated based on high-resolution rainfall data in the band from 5 to 30∘ N and from 70∘ N to 95∘ E. The red line indicates strong monsoon years, and the blue line indicates weak monsoon years. (b) Latitude–altitude cross section of temperature (colored shading, K) and zonal wind anomalies (contour lines, m s−1) estimated from the difference between strong and weak monsoon years in the longitude band from 80 to 90∘ E. (c) Longitude–altitude cross section of temperature and wind anomalies averaged between 30 and 40∘ N. The red and blue lines in panels (b) and (c) denote the tropopause altitude during respective strong and weak monsoon years estimated using GNSS RO data.
As discussed previously, the anticyclone circulation is significant during the months of July and August when most of the precipitation occurs over India (Basha and Ratnam, 2013; Basha et al., 2015; Kishore et al., 2015; Narendra Reddy et al., 2018). Thus, the influence of strong and weak monsoon years will have a drastic impact on anticyclone circulation. In order to understand these changes, we have divided the years into strong and weak monsoon years based on gridded precipitation data over the domain from 5 to 30∘ N and from 70 to 95∘ E between 1951 and 2016. This region is known to have heavy precipitation and orographic forcing, which helps transport water vapor via deep convection to the UTLS (Houze et al., 2007; Medina et al., 2010; Pan et al., 2016). The detrended precipitation represents the strong and weak monsoon years. Years with positive (negative) precipitation values correspond to strong (weak) monsoon years as shown in Fig. S2b. The composite of the mean distribution of the anticyclone circulation during strong and weak monsoon years is shown in Fig. 7a based on GPH values at 100 hPa from NCEP reanalysis data. The circulation expands on the eastern and western sides of the anticyclone during the strong monsoon years (red line). The core of the anticyclone is significant during strong monsoon years. A clear eye structure is observed in the core of the anticyclone on left (right) during the strong (weak) monsoon years. The composite mean difference of temperature and zonal wind between the strong and weak monsoon years along with the tropopause altitude averaged over the longitude range from 80 to 85∘ E is shown in Fig. 7b. The warmest temperature anomalies are observed over the Tibetan Plateau. Positive (warm) temperature anomalies exactly above the Tibetan Plateau (11 km) and negative (cooling) anomalies on both sides are seen in the lower troposphere in Fig. 7b. Strong easterly (westerly) winds are observed on the left (right) side of the Tibetan Plateau. The whole Tibetan Plateau acts as a barrier that drives cold air to upper altitudes during strong monsoon years. Strong anticyclone circulation with strong westerlies at 35∘ N and easterlies on both sides of the Tibetan Plateau along with an elevated tropopause represent the impacts of the strong monsoon vertically above the anticyclone. The rising motion over East Asia is excited by the local heating of the Tibetan Plateau and links to the single stretch vertically. The longitude–altitude cross section of temperature and wind anomalies shown in Fig. 7c is averaged between a latitude band from 35 to 40∘ N. Positive temperature anomalies are observed from the surface to 12 km in the longitude band from 60 to 80∘ E and stretch towards the west. This process clearly demonstrates that a large-scale ascent develops over the Asian monsoon region. The tropopause altitude is high (low) during strong vertical motion, and heavy precipitation is observed over a region similar to that reported by Lau et al. (2018). The transport processes from the boundary layer to the tropopause occur on the eastern side of the anticyclone, i.e., the southern flank of Tibetan Plateau, northeast India and the head of the Bay of Bengal. This result is consistent with a previous study by Bergman et al. (2013).
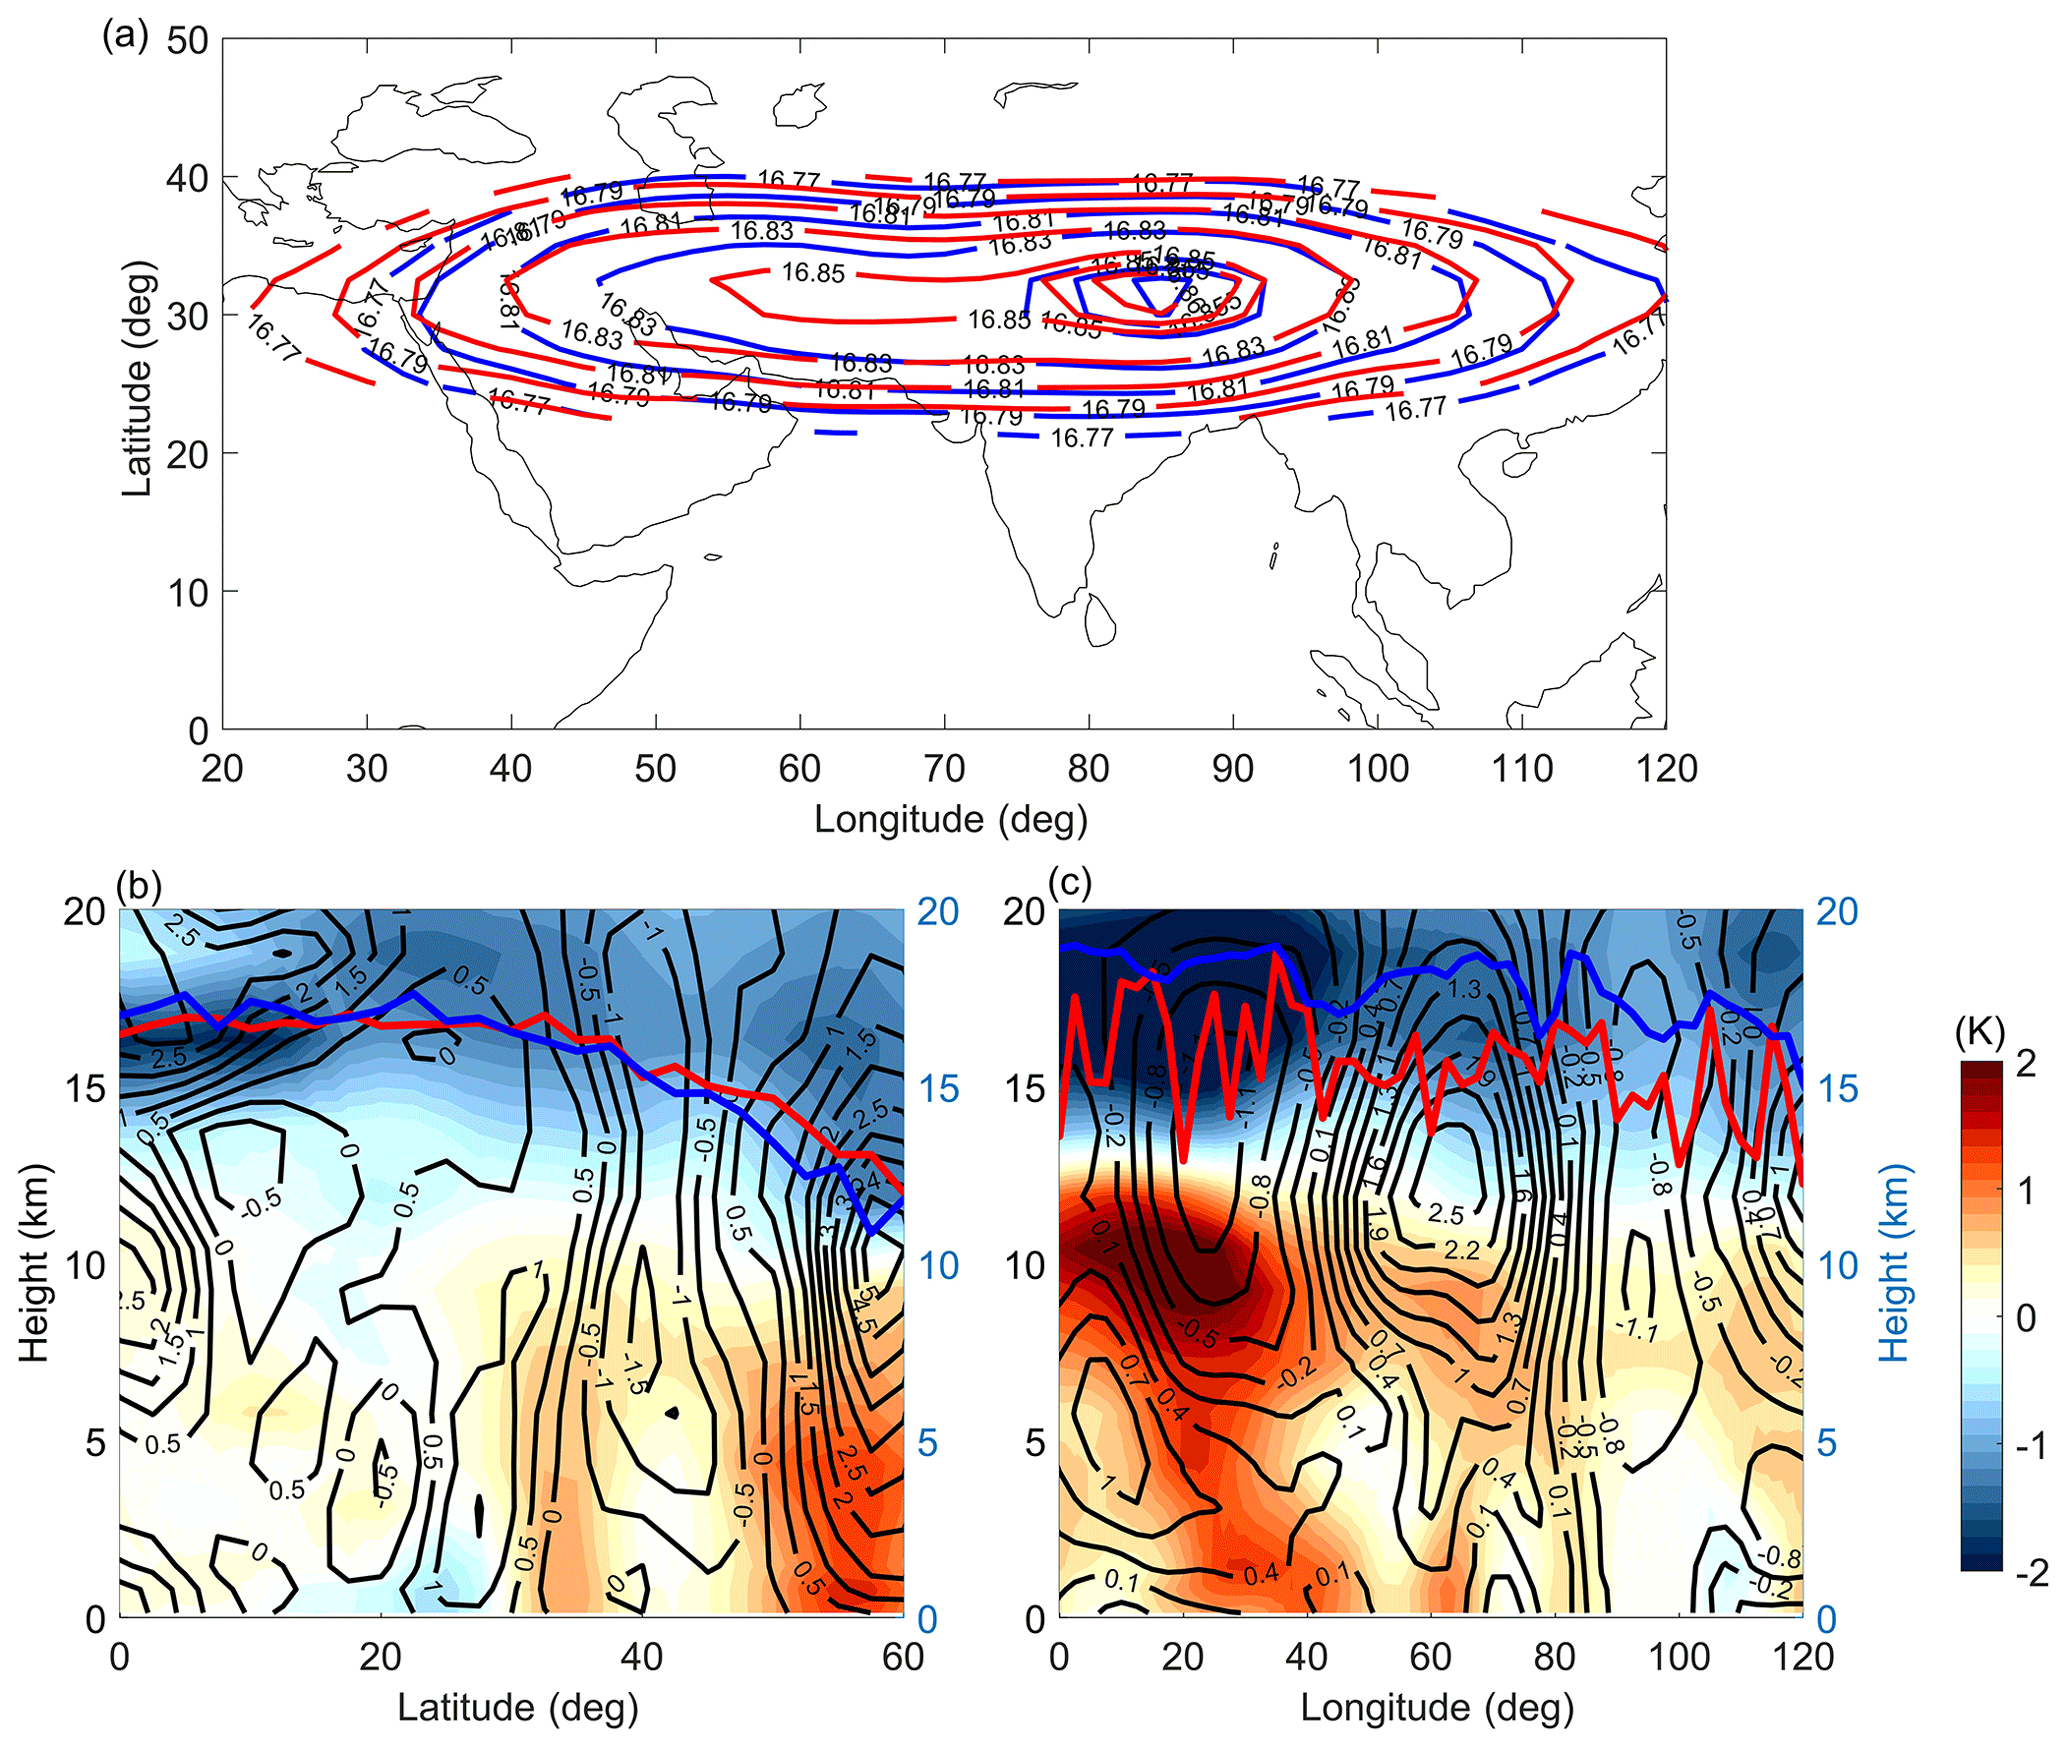
Figure 8(a) The ASMA variability obtained from GPH at 100 hPa during strong La Niña and El Niño years. The red and blue lines indicate the La Niña and El Niño years, respectively. (b) Latitude altitude cross section of temperature (colored shading, K) and zonal wind anomalies (contour lines, m s−1) estimated from the difference between La Niña and El Niño years in the longitude band from 80 to 90∘ E. (c) Longitude–altitude cross section of temperature and zonal wind anomalies averaged between 30 and 40∘ N. The red and blue lines in panels (b) and (c) denote the tropopause altitude during respective La Niña and El Niño years estimated from GNSS RO data.
ENSO typically shows the strongest signal in boreal winter, but it can affect the atmospheric circulation and constituent distributions until the next fall (McPhaden et al., 2006). It is well known that strong ENSO events have a significant influence on tropical upwelling and stratosphere–troposphere exchange (Yan et al., 2018). This change can impact the distribution of the composition and structure of the UTLS region. In the UTLS, the tropopause responds to the annual and interannual variability associated with ENSO (Trenberth, 1990) and the quasi-biennial oscillation (Baldwin et al., 2001). Several studies have focused on the effects of the different impacts of El Niño in the tropopause and lower stratosphere (Hu and Pan, 2009; Zubiaurre and Calvo, 2012; Xie et al., 2012). In the present study, we investigated the changes in the anticyclone circulation and tropical upwelling associated with strong ENSO events during July and August. Therefore, we have also separated the GPH for the strongest El Niño (1958, 1966, 1973, 1983, 1988, 1992, 1998 and 2015) and La Niña (1974, 1976, 1989, 1999, 2000, 2008 and 2011) years to verify the change in the circulation pattern of the anticyclone. For this, we chose July and August GPH data at 100 hPa, as shown in Fig. 8. The red and blue colors indicate the composite of the La Niña and El Niño circulation, respectively. During La Niña years, the anticyclone circulation expands compared with El Niño years at 100 hPa, as shown in Fig. 8a. On the eastern and southern sides of the anticyclone, the expansion is greater during La Niña years. Warm temperatures and strong westerlies are observed in the latitude band from 43 to 55∘ N during La Niña, as shown in Fig. 8b (Lau et al., 2018). The cooling impact is significant over the Tibetan Plateau during La Niña events compared with El Niño events. The significant cooling observed over the Tibetan Plateau distributes towards tropical latitudes between 600 and 100 hPa. The zonal wind shows a convergence of easterly winds over the Tibetan Plateau from the mid to the upper tropospheric region. On the right side of the Tibetan Plateau, strong westerly winds exist from the surface to tropopause altitudes along with strong warming. The meridional cross section of temperature and the zonal wind difference between La Niña and El Niño is shown in Fig. 8c. Significant cooling is observed during La Niña in the longitude band from 80 to 100∘ E with strong easterlies from the surface to the tropopause. From this analysis, it is clear that the Indian summer monsoon variability has a significant impact on the ASMA; thus, it is necessary to consider the different phases of the monsoon while dealing with UTLS pollutants. In addition, we investigated the zonal mean vertical cross section in the longitude band from 50 to 60∘ E, which represents the Iranian mode. Figure S3 depicts the difference between the active and break phases, strong and weak monsoon years, and La Niña and El Niño years along with the tropopause altitude. Significant warming is observed during La Niña years and strong monsoon years compared with the active phase of the Indian monsoon in the troposphere. Compared with the Tibetan mode, the Iranian mode warming is lower. The tropopause altitude is slightly higher during the active phase of the Indian monsoon, strong monsoon years and La Niña years. A moderate increase in the tropopause from the Equator to 40∘ N is observed, and it decreases drastically afterward.
Several authors have discussed the interannual and decadal variability of pollutants and tracers in the ASMA region from model, observational and reanalysis data sets (Kunze et al., 2016; Santee et al., 2017; Yuan et al., 2019). In this study, we have investigated the spatial variability, trends of the anticyclone and the influence of Indian monsoon activity, i.e., active and break days, strong and weak monsoon years, and strong La Niña and El Niño years, on the ASMA using long-term reanalysis, satellite and observational data sets that were not investigated earlier. In this study, we have considered the GPH values from 16.75 to 16.9 km, which represent the spatial structure of the anticyclone at 100 hPa. Our analysis shows that the spatial extent (magnitude) of the anticyclone structure is very large (strong) during July and August, whereas it is very weak in June at 100 hPa. The bimodal distribution (Tibetan and Iranian modes) of the anticyclone is clearly observed during the month of July, but it is absent during other months (June and August). The anticyclone variability undergoes significant decadal variation from one decade to another. The edges of the ASMA change drastically compared with the core of the anticyclone. However, there are significant spatial differences in the structure of the anticyclone at 100 hPa. The anticyclone undergoes a decreasing trend on the northern side, whereas an increasing trend is observed on the western side. A significant increasing trend is observed in the spatially averaged zonal wind in the four different sectors (Fig. 5). The zonal wind anomalies show an increasing trend in all the sectors at 100 hPa. The change is significant in the northwestern and northeastern sectors with a magnitude of variability of 7.59 m s−1 from 1951 to 2016, whereas it is 5.44 m s−1 in the southeastern and southwestern sectors. The strength of the anticyclone increases at a rate of 0.157 (10.36 from 1951 to 2016) in the anticyclone region (Fig. 5e). Yuan et al. (2019) also reported an increasing trend in the strength of the anticyclone when considering the MERRA 2 reanalysis data from 2001 to 2015.
Furthermore, we investigated the Indian monsoon influence on the anticyclone region. Our results reveal that the spatial extent of the anticyclone expands during the active phase of the Indian monsoon, strong monsoon years and during strong La Niña years on the northern and eastern sides. A similar expansion of the anticyclone was noticed by Yuan et al. (2019) during strong monsoon years when considering MERRA 2 data. However, the ASMA boundaries are not always well defined in all the events. The zonal mean cross section of temperature shows significant warming over the Tibetan Plateau and from the surface to 12 km during the active phase of the Indian monsoon, strong monsoon years and strong La Niña years. Similarly, the rise of the tropopause during the abovementioned periods is also noticed. Since the Tibetan Plateau acts as a strong heat source in summer with the strongest heating layer located in the lower layers, thermal adaptation results in a shallow and weak cyclonic circulation near the surface and a deep and strong anticyclonic circulation above it. During summer, the Tibetan Plateau acts as a strong heat source that influences the whole UTLS region. The warm ascending air above pulls the air from below; the surrounding air in the lower troposphere converges towards the Tibetan Plateau area and climbs up the heated sloping surfaces (Bergman et al., 2013; Garny and Randel, 2016). Thus, significant warming is observed over the Tibetan Plateau and causes the strong transport of pollutants into the tropopause during the active phase of the Indian monsoon, the strong monsoon years and the strong La Niña years. Pan et al. (2016) reported the transport of carbon monoxide through the southern flank of the Tibetan Plateau from the model analysis. The abovementioned results indicate that the high mountain regions play a significant role as elevated heat sources during the formation and maintenance of the anticyclones over Asia. This also emphasizes the role of the thermal forcing of the Tibetan Plateau on the temporal and the spatial evolution of the South Asian high. Lau et al. (2018) reported the transport of the dust and pollutants from the Himalayas–Gangetic Plain and the Sichuan Basin.
Overall, we demonstrate the ASMA variability during different phases of the Indian monsoon. The uplifting of boundary layer pollutants to the tropopause primarily occurs on the eastern side of the anticyclone, centered near the southern flank of the Tibetan Plateau, northeastern India, Nepal and north of the Bay of Bengal. The variability in the tropopause altitude and temperature as well as trace gases (water vapor, ozone, carbon monoxide and aerosols) shows a distinct behavior in ASMA region. The ASMA itself is highly dynamic in nature and the confinement of tracers and aerosols results in changes in its chemistry and radiation (Basha et al., 2019). However, a more detailed and higher quality data set is needed to further understand the effects of the Tibetan Plateau on the transport of different tracers and pollutants to the UTLS region (Ravindrababu et al., 2019).
The NCEP/NCAR reanalysis data are available from the NOAA website: https://www.esrl.noaa.gov/psd/data/gridded/data.ncep.reanalysis.pressure.html (last access: 30 June 2019; Kalnay et al., 1996). The COSMIC and CHAMP data are available from the COSMIC CDAAC website. IMD gridded precipitation data are available from the National Climate Data Management Group, Pune, India. All the data used in the present study are freely available from the respective websites.
The supplement related to this article is available online at: https://doi.org/10.5194/acp-20-6789-2020-supplement.
GB and MVR conceived and designed the scientific questions investigated in the study. PK estimated the active and break phases of the Indian monsoon. GB performed the analysis and wrote the first draft of the paper in close association with MVR. All authors edited the paper.
The authors declare that they have no conflict of interest.
This article is part of the special issue “Interactions between aerosols and the South West Asian monsoon”. It is not associated with a conference.
We thank NCEP/NCAR reanalysis for providing reanalysis data. We are grateful to CDAAC for the production of the COSMIC and CHAMP GPS RO data and acknowledge the India Meteorological Department for the provision of the IMD gridded precipitation data from National Climate Data Management Group, Pune, India.
This paper was edited by Mathias Palm and reviewed by three anonymous referees.
Anthes, R. A., Bernhardt, P. A., Chen, Y., Cucurull, L., Dymond,K. F., Ector, D., Healy, S. B., Ho, S.-H., Hunt, D. C., Kuo, Y.-H., Liu, H., Manning, K., McCormick, C., Meehan, T. K., Randel, W. J., Rocken, C., Schreiner, W. S., Sokolovskiy, S. V., Syndergaard, S., Thompson, D. C., Trenberth, K. E., Wee, T.-K., Yen, N. L., and Zeng, Z.: The COSMIC/Formosat/3 mission: Early results, B. Am. Meteorol. Soc., 89, 313–333, 2008.
Baldwin, M. P., Gray, L. J., Dunkerton, T. J., Hamilton, K., Haynes, P. H., Randel, W. J., Holton, J. R., Alexander, M. J., Hirota, I., Horinouchi, T., Jones, D. B. A., Kinnersley, J. S., Marquardt, C., Sato, K., and Takahashi, M.: The quasi-biennial oscillation, Rev. Geophys., 39, 179–229, https://doi.org/10.1029/1999RG000073, 2001.
Basha, G. and Ratnam, M. V.: Moisture variability over Indian monsoon regions observed using high resolution radiosonde measurements, Atmos. Res., 132–133, 35–45, https://doi.org/10.1016/j.atmosres.2013.04.004, 2013.
Basha, G., Kishore, P., Ratnam, M. V., Ouarda, T. B. M. J., Velicogna, I., and Sutterly, T.: Vertical and latitudinal variation of the intertropical convergence zone derived using GPS radio occultation measurements, Remote Sens. Environ., 163, 262–269, https://doi.org/10.1016/j.rse.2015.03.024, 2015.
Basha, G., Kishore, P., Ratnam, M. V., Jayaraman, A., Kouchak, A. A., and Taha, B. J. M.: Historical and projected surface temperature over India during the 20th and 21st century, Sci. Rep.-UK, 7, 2987, https://doi.org/10.1038/s41598-017-02130-3, 2017.
Basha, G., Ratnam, M. V., Kishore, P., Ravindrababu, S., and Velicogna, I.: Influence of Asian Summer Monsoon Anticyclone on the Trace gases and Aerosols over Indian region, Atmos. Chem. Phys. Discuss., https://doi.org/10.5194/acp-2019-743, in review, 2019.
Bergman, J. W., Fierli, F., Jensen, E. J., Honomichl, S., and Pan, L. L.: Boundary layer sources for the Asian anticyclone: Regional contributions to a vertical conduit, J. Geophys. Res., 118, 2560–2575, https://doi.org/10.1002/jgrd.50142, 2013.
Beyerle, G., Schmidt, T., Wickert, J., Heise, S., Rotacher, M., Koenig-Langlo, G., and Lauritsen, K. B.: Observations and simulations of receiver-induced refractivity biases in GPS radio occultation, J. Geophys. Res., 111, D12101, https://doi.org/10.1029/2005JD006673, 2006.
Bian, J., Pan, L. L., Paulik, L., Vömel, H., and Chen, H.: In situ water vapor and ozone measurements in Lhasa and Kunmin during the Asian summer monsoon, Geophys. Res. Lett., 39, L19808, https://doi.org/10.1029/2012GL052996, 2012.
Bromwich, D. H., Fogt, R. L., Hodges, K. I., and Walsh, J. E.: A tropospheric assessment of the ERA-40, NCEP, and JRA-25 global reanalyses in the polar regions, J. Geophys. Res.-Atmos., 112, D10111, https://doi.org/10.1029/2006JD007859, 2007.
Fadnavis, S., Schultz, M. G., Semeniuk, K., Mahajan, A. S., Pozzoli, L., Sonbawne, S., Ghude, S. D., Kiefer, M., and Eckert, E.: Trends in peroxyacetyl nitrate (PAN) in the upper troposphere and lower stratosphere over southern Asia during the summer monsoon season: regional impacts, Atmos. Chem. Phys., 14, 12725–12743, https://doi.org/10.5194/acp-14-12725-2014, 2014.
Garny, H. and Randel, W. J.: Dynamic variability of the Asian monsoon anticyclone observed in potential vorticity and correlations with 5 tracer distributions, J. Geophys. Res., 118, 13421–13433, https://doi.org/10.1002/2013JD020908, 2013.
Garny, H. and Randel, W. J.: Transport pathways from the Asian monsoon anticyclone to the stratosphere, Atmos. Chem. Phys., 16, 2703–2718, https://doi.org/10.5194/acp-16-2703-2016, 2016.
Glatthor, N., Höpfner, M., Stiller, G. P., von Clarmann, T., Funke, B., Lossow, S., Eckert, E., Grabowski, U., Kellmann, S., Linden, A., A. Walker, K., and Wiegele, A.: Seasonal and interannual variations in HCN amounts in the upper troposphere and lower stratosphere observed by MIPAS, Atmos. Chem. Phys., 15, 563–582, https://doi.org/10.5194/acp-15-563-2015, 2015.
Highwood, E. J. and Hoskins, B. J.: The tropical tropopause, Q. J. Roy. Meteor. Soc., 124, 1579–1604, 1998.
Hoskins, B. J. and Rodwell, M. J.: A model of the Asian summer monsoon, I: The global scale, J. Atmos. Sci., 52, 1329–1340, 1995.
Hossaini, R., Chipperfield, M., Montzka, M. P., Rap, S. A., Dhomse, S., and Feng, W.: Efficiency of short-lived halogens at influencing climate through depletion of stratopsheric ozone, Nat. Geosci., 8, 186–190, https://doi.org/10.1038/ngeo2363, 2015.
Houze, R. A., Wilton, D. C., and Smull, B. F.: Monsoon convection in the Himalayan region as seen by the TRMM 345 Precipitation Radar, Q. J. Roy. Meteor. Soc., 133, 1389–1411, https://doi.org/10.1002/qj.106, 2007.
Hu, Y. and Pan, L.: Arctic stratospheric winter warming forced by observed SSTs, Geophys. Res. Lett., 36, L11707, https://doi.org/10.1029/2009GL037832, 2009.
Kalnay, E., Kanamitsu, M., Kistler, R., Collins, W., Deaven, D., Gandin, L., Iredell, M., Saha, D., White, G., Woollen, J., Zhu, Y., Chelliah, M., Ebisuzaki, W., Higgins, W., Janowiak, J., Mo, K. C., Ropelewski, C., Wang, J., Leetma, A., Reynolds, R., and Dennis, J.: The NCEP/NCAR 40-years reanalysis project, B. Am. Meteorol. Soc., 77, 437–472, 1996 (data available at: https://www.esrl.noaa.gov/psd/data/gridded/data.ncep.reanalysis.pressure.html, last access: 30 June 2019.
Kishore, P., Ratnam, M. V., Namboothiri, S., Velicogna, I., Basha, G., Jiang, J., Igarashi, K., Rao, S., and Sivakumar, V.: Global (50∘ S–50∘ N) distribution of water vapor observed by COSMIC GPS RO: Comparison with GPS radiosonde, NCEP, ERAInterim, and JRA-25 reanalysis data sets, J. Atmos. Sol.-Terr. Phy., 73, 1849–1860, https://doi.org/10.1016/j.jastp.2011.04.017, 2011.
Kishore, P., Jyothi, S., Basha, G., Rao, S. V. B., Rajeevan, M., Velicogna, I., and Sutterley, T. C.: Precipitation climatology over India: validation with observations and reanalysis datasets and spatial trends, Clim. Dynam., 121, 541–556, https://doi.org/10.1007/s00382-015-2597-y, 2015.
Kishore, P., Basha, G., VenkatRatnam, M., Velicogna, I., Ouarda, T. B. M. J., and Narayana Rao, D.: Evaluating CMIP5 models using GPS radio occultation COSMIC temperature in UTLS region during 2006–2013: twenty-first century projection and trends, Clim. Dynam., 47, 3253–3270, https://doi.org/10.1007/s00382-016-3024-8, 2016.
Kursinski, E. R., Hajj, G. A., Schofield, J. T., Linfield, R. P., and Hardy, K. R.: Observing Earth's atmosphere with radio occultation measurements using the Global Positioning System, J. Geophys. Res.-Atmos., 102, 23429–23465, 1997.
Kunze, M., Braesicke, P., Langematz, U., and Stiller, G.: Interannual variability of the boreal summer tropical UTLS in observations and CCMVal-2 simulations, Atmos. Chem. Phys., 16, 8695–8714, https://doi.org/10.5194/acp-16-8695-2016, 2016.
Lau, W. K. M., Cheng, Y., and Li, Z.: Origin, maintenance and variability of the Asian Tropopause Aerosol Layer (ATAL): Roles of monsoon dynamics, Sci. Rep.-UK, 8, 3960, https://doi.org/10.1038/s41598-018-22267-z, 2018.
McPhaden, M. J., Zebiak, S. E., and Glantz, M. H.: ENSO as an integrating concept in earth science, Science, 314, 1740–1745, 2006.
Medina, S., Houze, R. A., Kumar, A., and Niyogi, D.: Summer monsoon convection in the Himalayan region: terrain and land cover effects, Q. J. Roy. Meteor. Soc., 136, 593–616, https://doi.org/10.1002/qj.601, 2010.
Narendra Reddy, N., Venkat Ratnam, M., Basha, G., and Ravikiran, V.: Cloud vertical structure over a tropical station obtained using long-term high-resolution radiosonde measurements, Atmos. Chem. Phys., 18, 11709–11727, https://doi.org/10.5194/acp-18-11709-2018, 2018.
Pai, D. S., Sridhar, L., and Ramesh Kumar, M. R.: Active and break events of Indian summer monsoon during 1901–2014, Clim. Dynam., 46, 3921–3939, https://doi.org/10.1007/s00382-015-2813-9, 2016.
Pan, L. L., Honomichl, S. B., Kinnison, D. E., Abalos, M., Randel, W. J., Bergman, J. W., and Bian, J.: Transport of chemical tracers from the boundary layer to stratosphere associated with the dynamics of the Asian summer monsoon, J. Geophys. Res.-Atmos., 121, 14159–14174, https://doi.org/10.1002/2016JD025616, 2016.
Park, M., Randel, W. J., Gettleman, A., Massie, S. T., and Jiang, J. H.: Transport above the Asian summer monsoon anticyclone inferred from Aura Microwave Limb Sounder tracers, J. Geophys. Res., 112, D16309, https://doi.org/10.1029/2006JD008294, 2007.
Rajeevan, M., Gadgil, S., and Bhate, J.: Active and break spells of the Indian summer monsoon, J. Earth Syst. Sci., 119, 229–247, https://doi.org/10.1007/s12040-010-0019-4, 2010.
Randel, W. J. and Park, M.: Deep convective influence on the Asian summer monsoon anticyclone and associated tracer variability observed with Atmospheric Infrared Sounder (AIRS), J. Geophys. Res., 111, D12314, https://doi.org/10.1029/2005JD006490, 2006.
Rao, D. N., Ratnam, M. V., Mehta, S., Nath, D., Ghouse Basha, S., Jagannadha Rao, V. V. M., Krishna Murthy, B. V., Tsuda, T., and Nakamura, K.: Validation of the COSMIC radio occultation data over Gadanki (13.48∘ N, 79.2∘ E): A tropical region, Terr. Atmos. Ocean. Sci., 20, 59–70, https://doi.org/10.3319/TAO.2008.01.23.01(F3C), 2009.
Ratnam, M. V., Sunilkumar, S., Parameswaran, K., Murthy, B. K., Ramkumar, G., Rajeev, K., Basha, G., Babu, S. R., Muhsin, M., and Mishra, M. K.: Tropical tropopause dynamics (TTD) campaigns over Indian region: An overview, J. Atmos. Sol.-Terr. Phy., 121, 229–239, 2014.
Ravindra Babu, S., Venkat Ratnam, M., Basha, G., Krishnamurthy, B. V., and Venkateswararao, B.: Effect of tropical cyclones on the tropical tropopause parameters observed using COSMIC GPS RO data, Atmos. Chem. Phys., 15, 10239–10249, https://doi.org/10.5194/acp-15-10239-2015, 2015.
Ravindrababu, S., Ratnam, M. V., Basha, G., Liou, Y.-A., and Reddy, N. N.: Large Anomalies in the Tropical Upper Troposphere Lower Stratosphere (UTLS) Trace Gases Observed during the Extreme 2015–16 El Niño Event by Using Satellite Measurements, Remote Sens., 11, 687, https://doi.org/10.3390/rs11060687, 2019.
Riese, M., Ploeger, F., Rap, A., Vogel, B., Konopka, P., Dameris, M., and Forster, P.: Impact of uncertainties in atmospheric mixing on simulated UTLS composition and related radiative effects, J. Geophys. Res., 117, D16305, https://doi.org/10.1029/2012JD017751, 2012.
Santee, M. L., Manney, G. L., Livesey, N. J., Schwartz, M. J., Neu, J. L., and Read, W. G.: A comprehensive overview of the climatological composition of the Asian summer monsoon anticyclone based on 10 years of Aura Microwave Limb Sounder measurements, J. Geophys. Res.-Atmos., 122, 5491–5514, https://doi.org/10.1002/2016JD026408, 2017.
Schreiner, W., Rocken, C., Sokolovskiy, S., Syndergaard, S., and Hunt, D.: Estimates of the precision of GPS radio occultations from the COSMIC/FORMOSAT-3 mission, Geophys. Res. Lett., 34, L04808, https://doi.org/10.1029/2006GL027557, 2007.
Sokolovskiy, S. V., Kuo, Y.-H., Rocken, C., Schreiner, W. S., Hunt, D., and Anthes, R. A.: Monitoring the atmospheric boundary layer by GPS radio occultation signals recorded in the open-loop mode, Geophys. Res. Lett., 33, L12813, https://doi.org/10.1029/2006GL025955, 2006.
Solomon, S., Rosenlof, K., Portmann, R., Daniel, J., Davis, S., Sanford, T., and Plattner, G.-K.: Contributions of stratospheric water vapor to 5 decadal changes in the rate of global warming, Science, 327, 1219–1223, https://doi.org/10.1126/science.1182488, 2010.
Tissier, A.-S. and Legras, B.: Convective sources of trajectories traversing the tropical tropopause layer, Atmos. Chem. Phys., 16, 3383–3398, https://doi.org/10.5194/acp-16-3383-2016, 2016.
Trenberth, K. E.: Recent observed interdecadal climate changes in the Northern Hemisphere, B. Am. Meteorol. Soc., 71, 988–993, https://doi.org/10.1175/1520-0477(1990)071<0988:ROICCI>2.0.CO;2, 1990.
Vernier, J. P., Fairlie, T. D., Natarajan, M., Wienhold, F. G., Bian, J., Martinsson, B. G., Crumeyrolle, S., Thomason, L. W., and Bedka, K. M.: Increase in upper tropospheric and lower stratospheric aerosol levels and its potential connection with Asian pollution, J. Geophys. Res., 120, 1608–1619, https://doi.org/10.1002/2014JD022372, 2015
Vogel, B., Günther, G., Müller, R., Grooß, J.-U., and Riese, M.: Impact of different Asian source regions on the composition of the Asian monsoon anticyclone and of the extratropical lowermost stratosphere, Atmos. Chem. Phys., 15, 13699–13716, https://doi.org/10.5194/acp-15-13699-2015, 2015.
Wickert, J., Reigber, C., Beyerle, G., Konig, R., Marquardt, C., Schmidt, T., Grunwaldt, L., Galas, R., Meehan, T. K., Melbourne, W. G., and Hocke, K.: Atmosphere sounding by GPS radio occultation: First results from CHAMP, Geophys. Res. Lett., 28, 3263–3266, 2001.
Xie, F., Li, J., Tian, W., Feng, J., and Huo, Y.: Signals of El Niño Modoki in the tropical tropopause layer and stratosphere, Atmos. Chem. Phys., 12, 5259–5273, https://doi.org/10.5194/acp-12-5259-2012, 2012.
Yan, R.-C., Bian, J.-C., and Fan, Q.-J.: The impact of the South Asia high bimodality on the chemical composition of the upper troposphere and lower stratosphere, Atmos. Ocean. Sci. Lett., 4, 229–234, 2011.
Yan, X., Konopka, P., Ploeger, F., Tao, M., Müller, R., Santee, M. L., Bian, J., and Riese, M.: El Niño Southern Oscillation influence on the Asian summer monsoon anticyclone, Atmos. Chem. Phys., 18, 8079–8096, https://doi.org/10.5194/acp-18-8079-2018, 2018.
Yuan, C., Lau, W. K. M., Li, Z., and Cribb, M.: Relationship between Asian monsoon strength and transport of surface aerosols to the Asian Tropopause Aerosol Layer (ATAL): interannual variability and decadal changes, Atmos. Chem. Phys., 19, 1901–1913, https://doi.org/10.5194/acp-19-1901-2019, 2019.
Zhang, Q., Wu, G., and Qian, Y.: The Bimodality of the 100 hPa South Asia High and its Relationship to the Climate Anomaly over East Asia in summer, J. Meteorol. Soc. Jpn., 80, 733–744, 2002.
Zubiaurre, I. and Calvo, N.: The El Nino–Southern Oscillation (ENSO) Modoki signal in the stratosphere, J. Geophys. Res., 117, D04104, https://doi.org/10.1029/2011JD016690, 2012.