the Creative Commons Attribution 4.0 License.
the Creative Commons Attribution 4.0 License.
 | 05 Jun 2020
Variability in lidar-derived particle properties over West Africa due to changes in absorption: towards an understanding
Igor Veselovskii
Qiaoyun Hu
Philippe Goloub
Thierry Podvin
Mikhail Korenskiy
Yevgeny Derimian
Michel Legrand
Patricia Castellanos
Measurements performed in western Africa (Senegal) during the SHADOW field campaign are analyzed to show that spectral dependence of the imaginary part of the complex refractive index (CRI) of dust can be revealed by lidar-measured particle parameters. Observations in April 2015 provide good opportunity for such study, because, due to high optical depth of the dust, exceeding 0.5, the extinction coefficient could be derived from lidar measurements with high accuracy and the contribution of other aerosol types, such as biomass burning, was negligible. For instance, in the second half of April 2015, AERONET observations demonstrated a temporal decrease in the imaginary part of the CRI at 440 nm from approximately 0.0045 to 0.0025. This decrease is in line with a change in the relationship between the lidar ratios (the extinction-to-backscattering ratio) at 355 and 532 nm (S355 and S532). For instance in the first half of April, S355∕S532 is as high as 1.5 and the backscatter Ångström exponent, Aβ, is as low as −0.75, while after 15 April and Aβ is close to zero. The aerosol depolarization ratio δ532 for the whole of April exceeded 30 % in the height range considered, implying that no other aerosol, except dust, occurred. The performed modeling confirmed that the observed S355∕S532 and Aβ values match the spectrally dependent imaginary part of the refractive index as can be expected for mineral dust containing iron oxides. The second phase of the SHADOW campaign was focused on evaluation of the lidar ratio of smoke and estimates of its dependence on relative humidity (RH). For five studied smoke episodes the lidar ratio increases from 44±5 to 66±7 sr at 532 nm and from 62±6 to 80±8 sr at 355 nm, when RH varied from 25 % to 85 %. Performed numerical simulations demonstrate that observed ratio S355∕S532, exceeding 1.0 in the smoke plumes, can indicate an increase in the imaginary part of the smoke particles in the ultraviolet (UV) range.
- Article
(14781 KB) - Full-text XML
- BibTeX
- EndNote


Atmospheric dust has significant impact on the Earth's climate system, and this impact remains highly uncertain (IPCC, 2013). In modeling the direct aerosol effect, the vertical profile of the aerosol extinction is one of the basic input parameters, and when this profile is derived from the elastic backscatter lidar observations, knowledge of the extinction-to-backscatter ratio (so-called lidar ratio) is essential (Klett, 1985). Although the desert dust in source regions is sometimes qualified as “pure dust”, it is always a mixture of various elements, e.g., iron oxides, clays, quartz and calcium-rich species, whose proportions can vary (Sokolik and Toon, 1999; Kandler et al., 2011; Wagner et al., 2012; Di Biagio et al., 2017, 2019, and references therein). Thus, the dust optical properties, and hence the lidar ratio (S), can vary, depending on the relative abundance of various minerals in emission sources. The imaginary part of the complex refractive index (CRI) of different minerals can vary spectrally and often exhibits an increase in the UV spectral region for dust containing iron oxides. Therefore, the retrieval of the dust extinction profiles from elastic backscatter lidar observations should account for the spectral variation in the lidar ratio.
Raman and HSRL lidars are capable of providing independent profiling of aerosol backscattering and extinction coefficients (Ansmann et al., 1992) and therefore are widely used to measure the lidar ratios of dust from different origins (e.g., Sakai et al., 2003; Papayannis et al., 2008, 2012; Xie et al., 2008; Ansmann et al., 2011; Mamouri et al., 2013; Burton et al., 2014; Nisantzi et al., 2015; Giannakaki et al., 2016; Hofer et al., 2017, 2020; Soupiona et al., 2018, 2019). The African deserts are the largest sources of mineral dust, and numerous studies have been conducted to quantify the particle intensive parameters (parameters independent of concentration) during dust transport from this source region to Europe and over the Atlantic Ocean (Mattis et al., 2002; Amiridis et al., 2005; Mona et al., 2006; Papayannis et al., 2008; Preißler et al., 2013; Groß et al., 2015; Rittmeister et al., 2017; Haarig et al., 2017). The dust properties are, however, modified during this transport, experiencing mixing and aging processes; thus the characterization of the dust properties near the source regions is highly important for the evaluation of the parameters of pure dust.
The lidar ratios at 355 and 532 nm (S355 and S532) were measured during the SAMUM-1 and SAMUM-2 experiments in Morocco and Cabo Verde, respectively (Esselborn et al., 2009; Tesche et al., 2009, 2011; Groß et al., 2011; Ansmann et al., 2011), as well as during the more recent SHADOW experiment in Senegal (Veselovskii et al., 2016, 2018). The lidar ratios S355 and S532 measured during the SAMUM experiments did not present significant spectral dependence. For example, for the SAMUM-2 campaign, the averaged values of S355 and S532 were 53±10 and 54±10 sr, respectively (Tesche et al., 2011). During SHADOW, however, S355 significantly exceeded S532 in many dust episodes, which was linked to an increase in the imaginary part of the CRI of dust at 355 nm (Veselovskii et al., 2016).
The dust backscattering coefficient, in contrast to the extinction coefficient, is sensitive to the imaginary part of the CRI (Perrone et al., 2004; Veselovskii et al., 2010; Gasteiger et al., 2011). Recall that the particle extinction is the sum of absorption and scattering, and an increase in absorption is accompanied by a decrease in scattering, leading to a weak dependence of the extinction on the imaginary part (Veselovskii et al., 2010, Fig. 6). Thus, it is expected that enhanced absorption in the UV should increase the lidar ratio. In turn, the ratio S355∕S532 should characterize the spectral variation in the imaginary part of the CRI. The latest version of AERONET products (3.0) provides inversions of the lidar-related properties, including the lidar ratio, from almucantar scans with ground-based sun photometers. For these products, the shortest available wavelength is 440 nm. Despite the imaginary part at 440 nm (Im440) being lower than at 355 nm (Im355), AERONET observations still show an increase in absorption at 440 nm with respect to 675 nm which yields a ratio of S440∕S675 close to 1.4 for Saharan dust (Shin et al., 2018). The goal of this work is to analyze the correlation of variations in Im440 from AERONET with measured values from lidar to reveal the effect of dust absorption on lidar-derived aerosol properties. We focus on height and day-to-day variations in the dust intensive properties, such as S355 and S532 and the depolarization ratio (δ), as well as the extinction and backscatter Ångström exponents (Aα and Aβ, respectively) measured during several strong dust episodes in April 2015 during the SHADOW campaign.
The smoke aerosol particles, typically originated from biomass burning, can also have a pronounced spectral dependence of absorption (Nicolae et al., 2013). This is generally due to the presence of carbonaceous particles with organic compounds, so-called brown carbon (BrC; Sun et al., 2007; Kirchstetter, et al., 2004). The Sahel region is known for seasonal biomass burning caused by human activity through combustion of agricultural waste that can produce an abundant amount of BrC. The smoke can also be mixed with mineral dust during long-range transport or in the emission origin (Haywood et al., 2008). During SHADOW the observation period included the biomass burning season; thus an additional effort was dedicated to the examination of the spectral lidar ratio variability in transported biomass burning aerosol under different environmental conditions and presents a supplementary subject of the current study.
The paper is organized as follows. Section 2 describes the lidar system and provides the main expressions used for the data analysis. Several strong dust episodes, in April 2015, are analyzed in Sect. 3. In Sect. 4, the smoke episodes occurring from December 2015 to January 2016 are used to evaluate the variation in the smoke lidar ratio with relative humidity. The paper is finalized with a conclusion.
The observations were performed with a LILAS multiwavelength Raman lidar during the SHADOW campaign at Mbour, Senegal. Information related to the SHADOW and observation site is presented in Veselovskii et al. (2016). The LILAS is based on a tripled Nd:YAG laser with a 20 Hz repetition rate and pulse energy of 90/100/100 mJ at 355/532/1064 nm. The aperture of the receiving telescope is 400 mm. During the campaign, the LILAS configuration () allowed the measurement of three particle backscattering coefficients (β355, β532, β1064), two extinction coefficients (α355, α532) and the depolarization ratio at 532 nm (δ532). To improve the performance of the system at 532 nm the rotational Raman channel was used instead of the vibrational one (Veselovskii et al., 2015). The measurements were performed at a 47∘ angle to the horizon. The backscattering coefficients and depolarization ratios were calculated with a 7.5 m range resolution (corresponding to a 5.5 m vertical resolution), while the range resolution of the extinction coefficients varied from 50 (at 1000 m) to 125 m (at 7000 m). Particle extinction and backscattering coefficients at 355 and 532 nm are calculated from elastic and Raman backscatter signals, as described in Ansmann et al. (1992), and corresponding uncertainties are shown in the plots. An additional Raman reception channel at 408 nm was set up for profiling the water vapor mixing ratio (WVMR; Whiteman et al., 1992).
The particle depolarization ratio δ, determined as a ratio of cross- and copolarized components of the particle backscattering coefficient, was calculated and calibrated in the same way as described in Freudenthaler et al. (2009). The relative uncertainty in depolarization measurements due to calibration is estimated to be ±10 %. To analyze the complex aerosol mixtures, containing dust (d) and smoke (s), we can write and . The depolarization ratio of such a mixture is therefore
Here δd and δs are the particle depolarization ratios of dust and smoke components, respectively.
To characterize the spectral dependence of the extinction (α) and backscattering (β) coefficients, the corresponding Ångström exponents are introduced as
where , and , are the extinction and backscattering coefficients at wavelengths λ1 and λ2. For the mixture of smoke and dust, the extinction Ångström exponent (EAE) can be calculated from the ratio :
Here and are the Ångström exponents of dust and smoke. The Ångström exponent of the mixture is obtained from Eq. (3):
The backscattering Ångström exponent (BAE) can be calculated in a similar way. And finally, the lidar ratio of the aerosol mixture is calculated as
where Sd and Ss are the lidar ratios of dust and smoke.
The aerosol over West Africa presents strong seasonal variations. The spring is characterized by strong dust emissions, while, during the winter season, intense forest fires occurring in the equatorial regions emit smoke particles that are transported over Senegal (Veselovskii et al., 2018). The SHADOW campaign included the following periods of measurements: 13 March–25 April 2015, 8–25 December 2015 and 5–24 January 2016, so numerous dust and smoke episodes were observed. In our analysis of lidar-derived aerosol properties, we also considered aerosol columnar properties provided by AERONET (Holben et al., 1998) and aerosol profiles predicted by the Modern-Era Retrospective analysis for Research and Applications, Version 2 (MERRA-2) aerosol reanalysis (Gelaro et al., 2017; Randles et al., 2017). MERRA-2 is the first long-term global reanalysis to assimilate space-based aerosol observations and include their radiative coupling with atmospheric dynamics. MERRA-2 is driven by the Goddard Earth Observing System (GEOS) model version 5 that includes the Goddard Chemistry, Aerosol, Radiation and Transport (GOCART) module. GOCART models the sources, sinks and transformation of the following five aerosol species as external mixtures: dust, organic carbon (OC), black carbon (BC), sulfates (SU) and sea salt (SS). Dust and sea salt are represented by five noninteracting size bins and have wind-speed-dependent emissions. The MERRA-2 reanalysis assimilates aerosol optical depth (AOD) observations from the twin Moderate Resolution Imaging Spectroradiometer (MODIS) instruments, MODIS Terra and MODIS Aqua, as well as the AERONET ground-based sun photometer network. In addition, the profiles of meteorological variables (P, T, RH), provided by radiosondes at the Léopold Sédar Senghor International Airport, located ∼70 km from the Mbour site, were also available. The relative humidity (RH) profiles over the Mbour site were calculated from a combination of lidar-derived WVMR and temperature profile from radiosounding.

Figure 1The aerosol optical depth (AOD) at 532 nm (open circles) and AODs of the main aerosol components, such as dust, organic carbon (OC), black carbon (BC), sulfates (SU) and sea salt (SS), provided by the MERRA-2 for (a) March, (b) April and (c) December 2015 over Mbour. Green squares show AOD532 provided by AERONET.
Figure 1 shows the aerosol optical depth at 532 nm (AOD532) for March, April and December 2015 recalculated from AERONET AOD at 500 nm using the 440–675 nm Ångström exponent. The same figure shows the AODs for the five aerosol species used in the MERRA-2 model, such as dust, organic carbon (OC), black carbon (BC), sulfates (SU) and sea salt (SS). The optical depths provided by MERRA-2 and AERONET are in a good agreement. Dust is the predominant aerosol component for all 3 months with the highest values of AOD in April. The contribution of organic carbon (the main component of the biomass burning products) is significant in December, when the forest fire season starts in equatorial regions, though a noticeable amount of OC is also predicted for March and for the beginning of April. The contribution of BC and SU to the total AOD is low: the sum of the corresponding AODs is below 0.1 for all 3 months.
The single-scattering albedo (SSA) over the Mbour site in 2015 provided by AERONET at 440 and 675 nm is shown in Fig. 2. The SSA675 is above 0.97 for the March–April period, but at 440 nm dust absorption is stronger, and, in March, SSA440 is about 0.9. However, in the middle of April, SSA440 increases up to 0.95, indicating that aerosols become less absorbing at shorter wavelengths. We can thus expect that variation in SSA at 355 nm between April and March should be even stronger. In our study we consider two groups of observations. The first group corresponds to the beginning of April, when SSA at 440 nm was lower. The second group covers the second half of April, when SSA at 440 nm increased. By analyzing these two groups we expect to reveal the effect of aerosol absorption on lidar-derived aerosol properties.
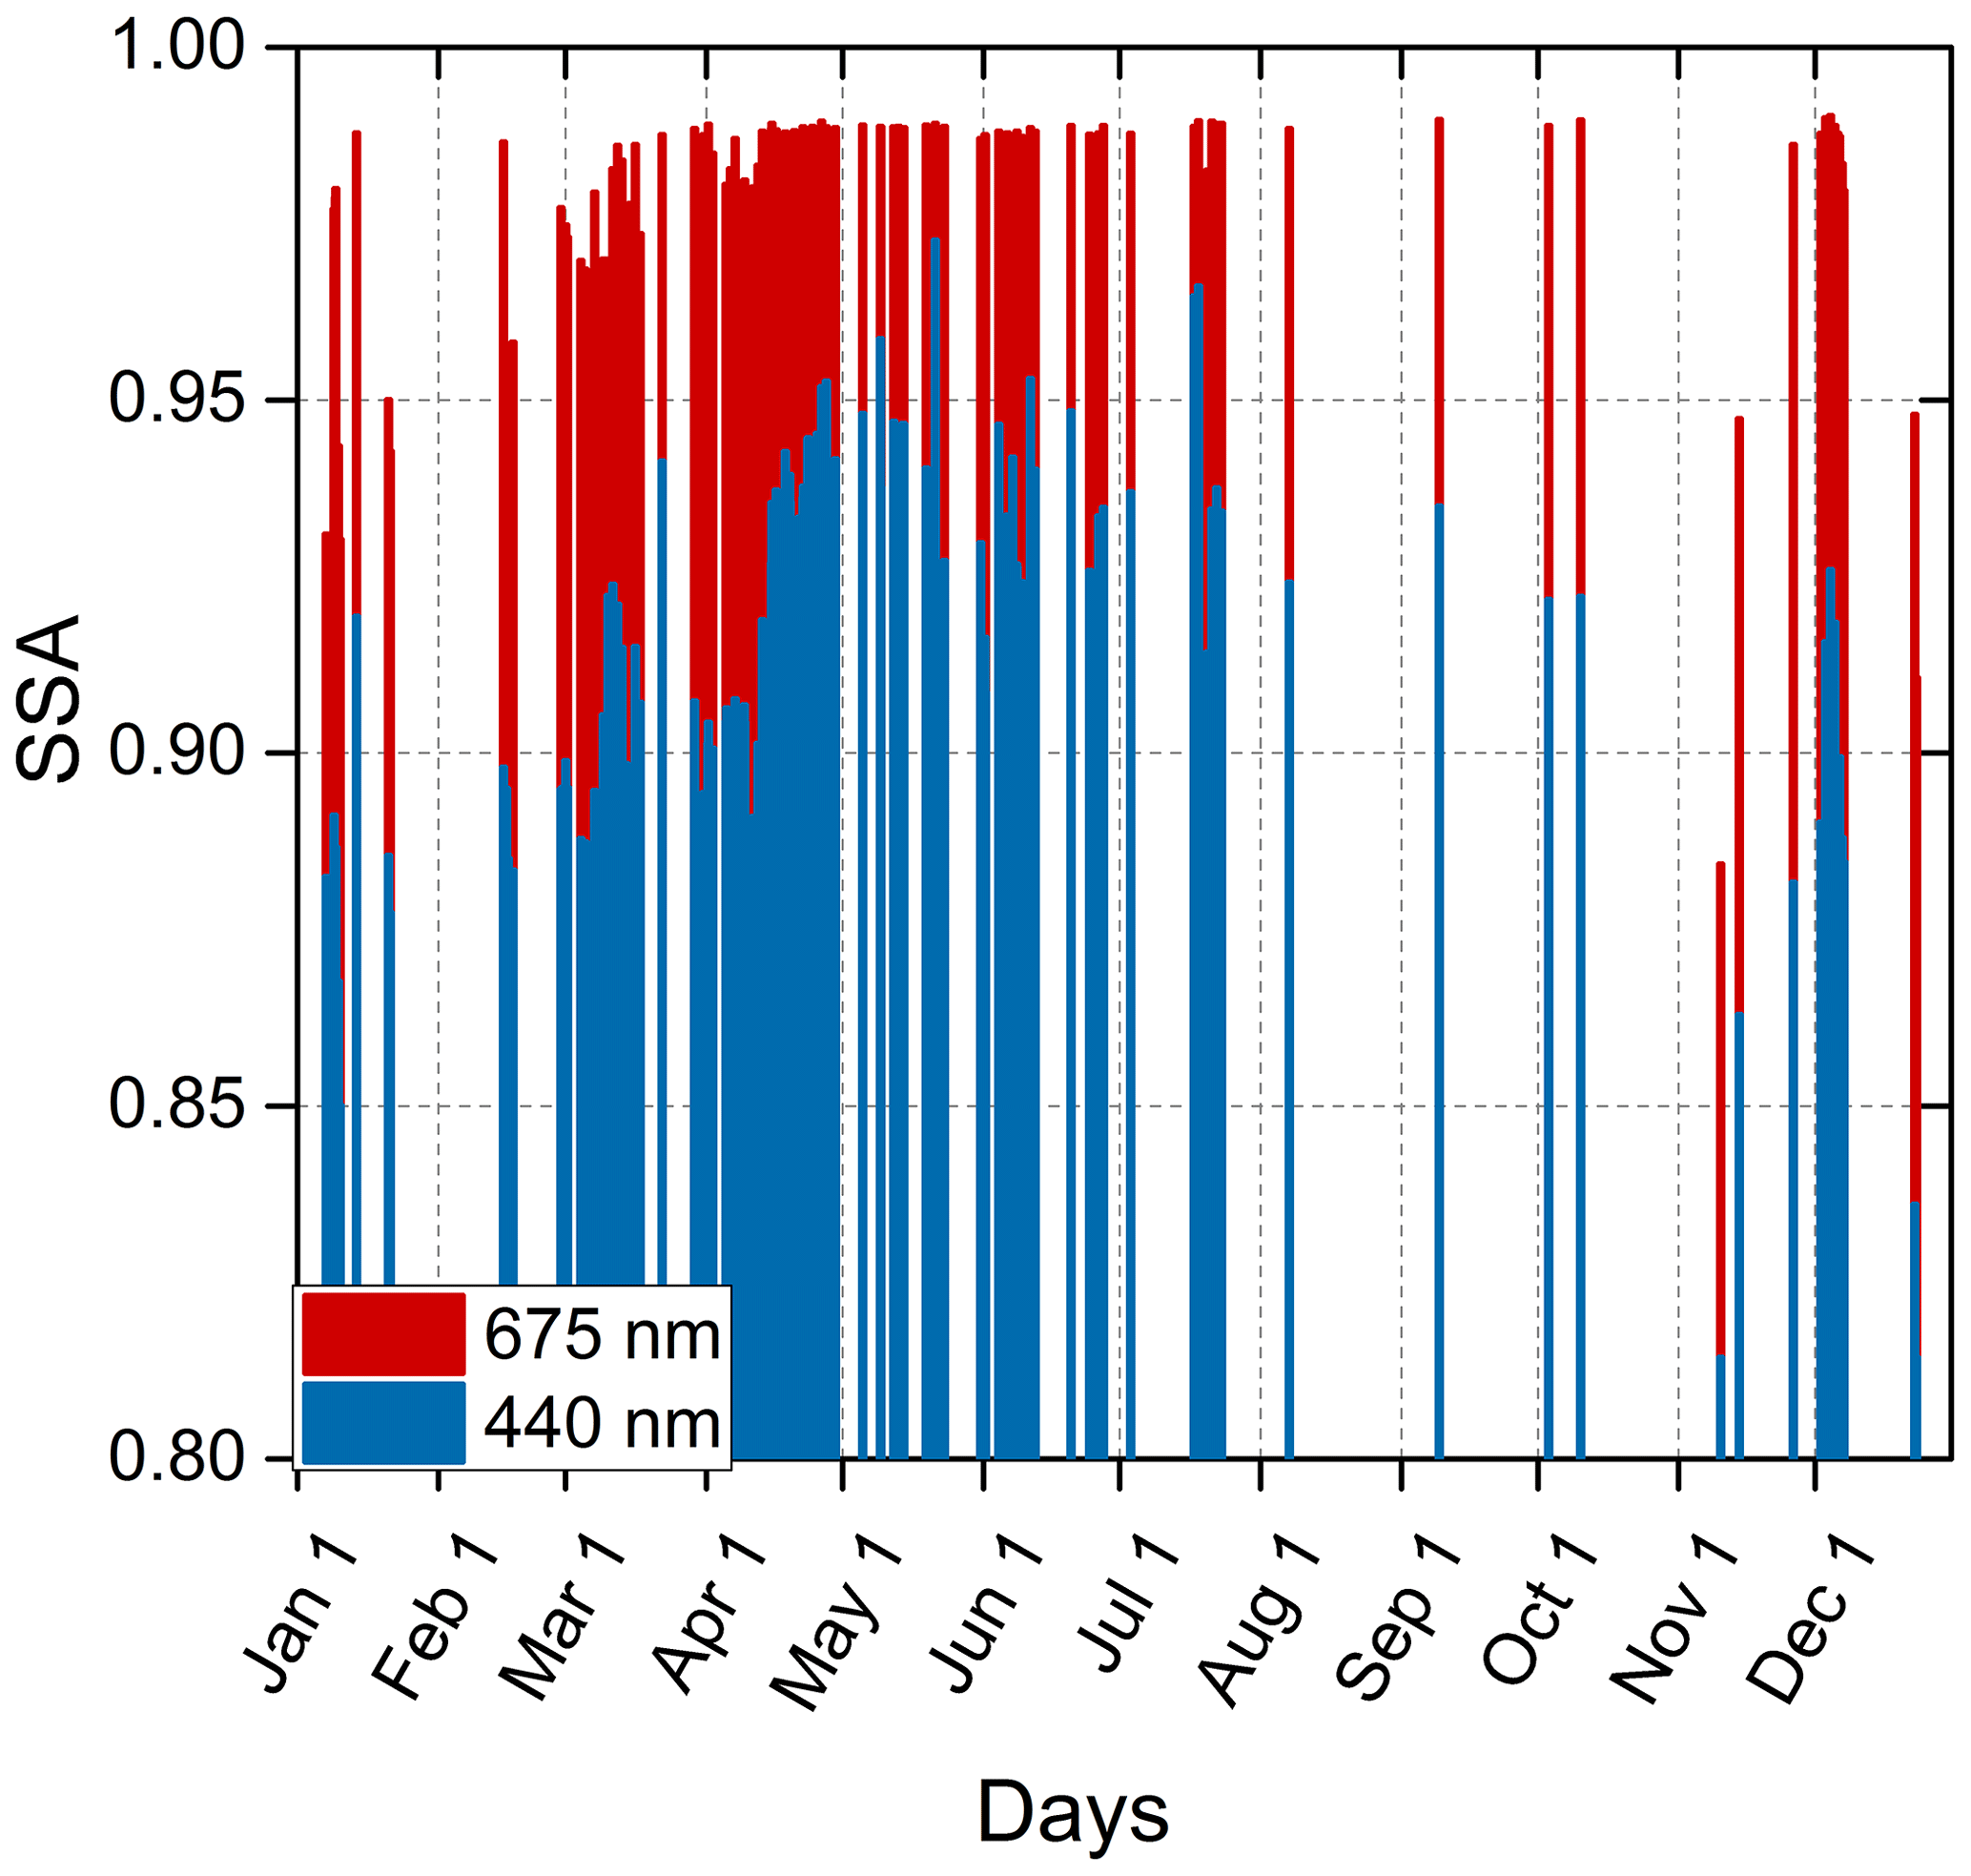
Figure 2Aerosol single-scattering albedo (SSA) at 675 and 440 nm provided by AERONET for Mbour site in 2015.

Figure 3Spatiotemporal distributions of aerosol backscattering coefficient β532 (a, d, g), particle depolarization ratio δ532 (b, e, h) and water vapor mixing ratio (c, f, i) for the nights 1–2 April (a, b, c), 2–3 April (d, e, f) and 3–4 April 2015 (g, h, i).
3.1 Dust episode on 1–4 April 2015
In the beginning of April the dust was transported by continental trades (Harmattan) from the northeastern and eastern drylands. For the period 1–4 April, as follows from Fig. 1b, the AOD532 over Dakar increased up to 1.0. Figure 3 shows the spatiotemporal distributions of the aerosol backscattering coefficient β532, particle depolarization ratio δ532, and water vapor mixing ratio for the nights 1–2, 2–3 and 3–4 April 2015. The corresponding air mass back trajectories, shown in Fig. 4, demonstrate that on 1–2 and 2–3 April air masses at all heights arrive from the northeast, whereas on 3–4 April the air masses above 2500 m are advected from the east. These air masses are characterized by higher humidity and may contain biomass burning products. During these three nights, the linear particle depolarization ratio and WVMR present some evolution. On 1–2 April δ532 exceeds 30 % and does not change significantly within the dust layer, even if some decrease is observed above 2000 m after 03:00 UTC. By 3–4 April the depolarization ratio above 2500 m decreases below 25 %, simultaneously with an increase in the WVMR. During the dust episode, the relative humidity did not exceed 20 % on 1–3 April, but on 3–4 April it increased up to 40 % above 2500 m.
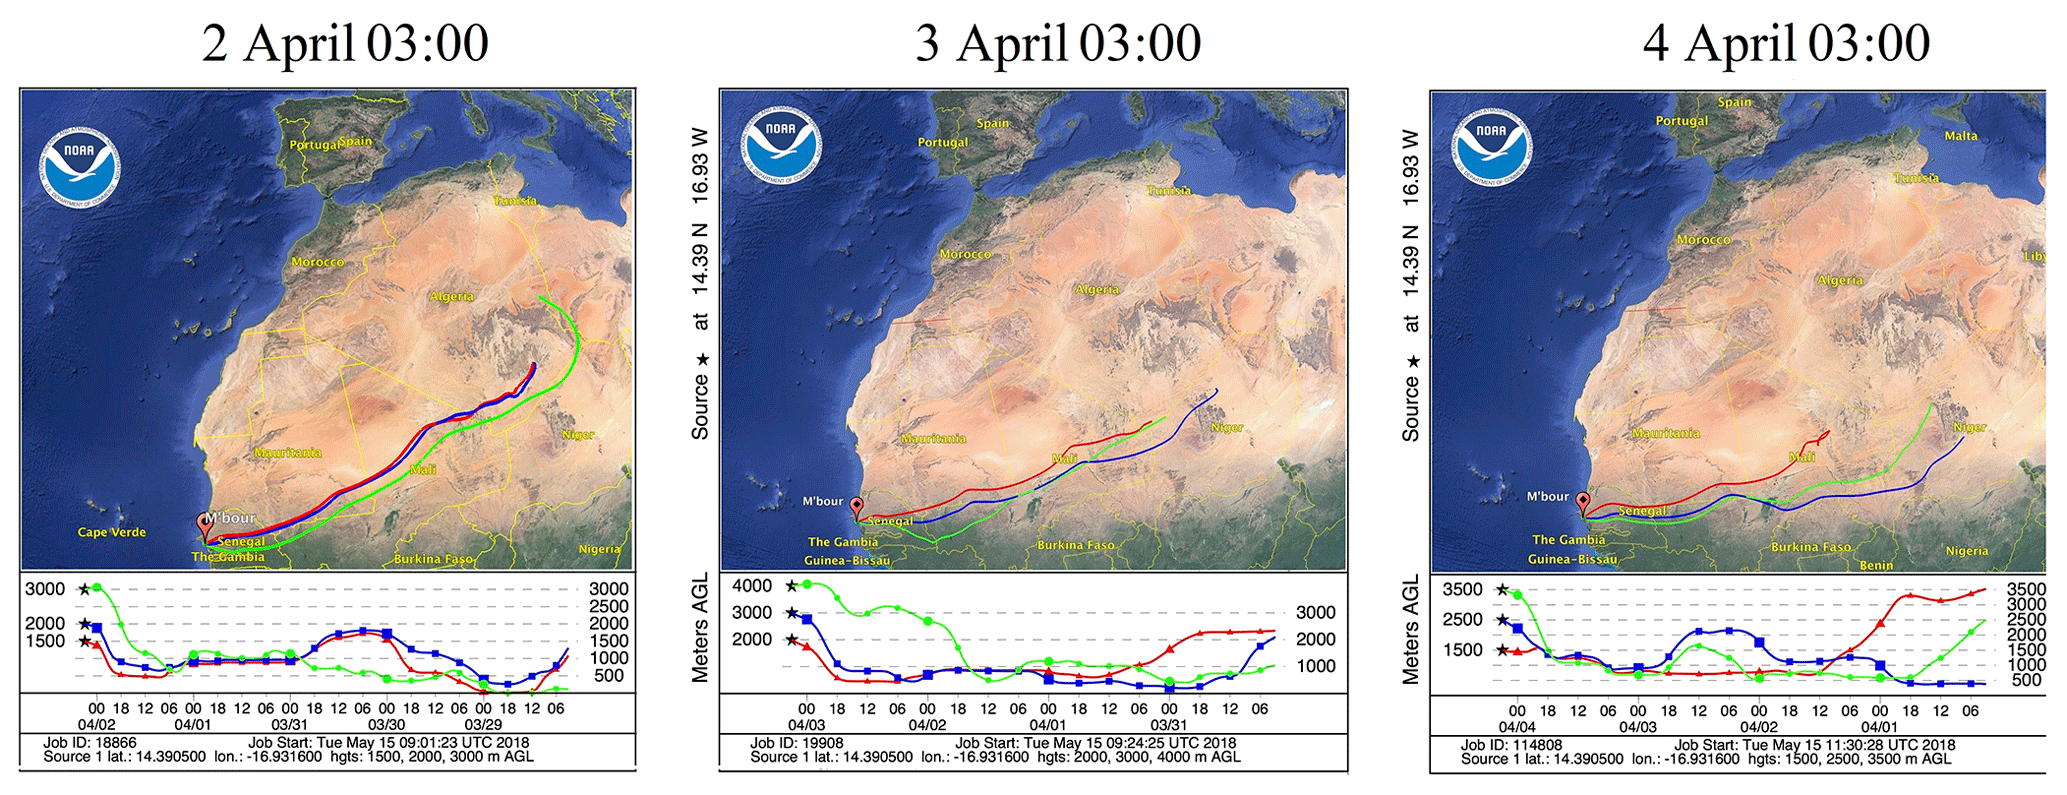
Figure 4For the air mass in Mbour, 3 d backward trajectories on 2, 3, and 4 April 2015 at 03:00 UTC obtained with the HYSPLIT model.
Vertical profiles of dust particle properties such as aerosol extinction coefficients α355 and α532, particle depolarization ratio δ532, and lidar ratios S355 and S532 are shown in Fig. 5 for the three observation periods on 1, 2–3 and 3–4 April 2015. The profiles of backscattering coefficients for 2–3 and 3–4 April are given in Fig. 6, while the extinction and backscatter Ångström exponents, calculated at 355 and 532 nm wavelengths for three temporal intervals from Fig. 5, are presented in Fig. 7. During all three observation periods Aα is slightly negative () up to 2000 m. For the dust component, MERRA-2 provides value of , which agrees with observations. Above 2000 m, Aα exhibits some increase, which is most significant on 3–4 April, when Aα reaches 0.3±0.1 at 4000 m height. A simultaneous decrease in δ532 indicates the possible presence of smoke particles above 2000 m. The backscatter Ångström exponent Aβ, in contrast with Aα, is sensitive to the spectral dependence of the imaginary part of CRI, thus yielding complicated vertical variability in Aβ. In particular, on 2–3 April Aβ decreases from −0.5 to −0.7 within a 1500–2500 m height range, when Aα remains stable.

Figure 5Vertical profiles of extinction coefficients (α355, α532) and lidar ratios (S355, S532) at 355 and 532 nm together with the particle depolarization ratio δ532 measured on 1 April (20:40–22:20 UTC), 2–3 April (23:40–04:30 UTC) and 3–4 April 2015 (23:00–02:00 UTC). Symbols show the lidar ratios of dust provided by the MERRA-2 model (S355M, S532M).
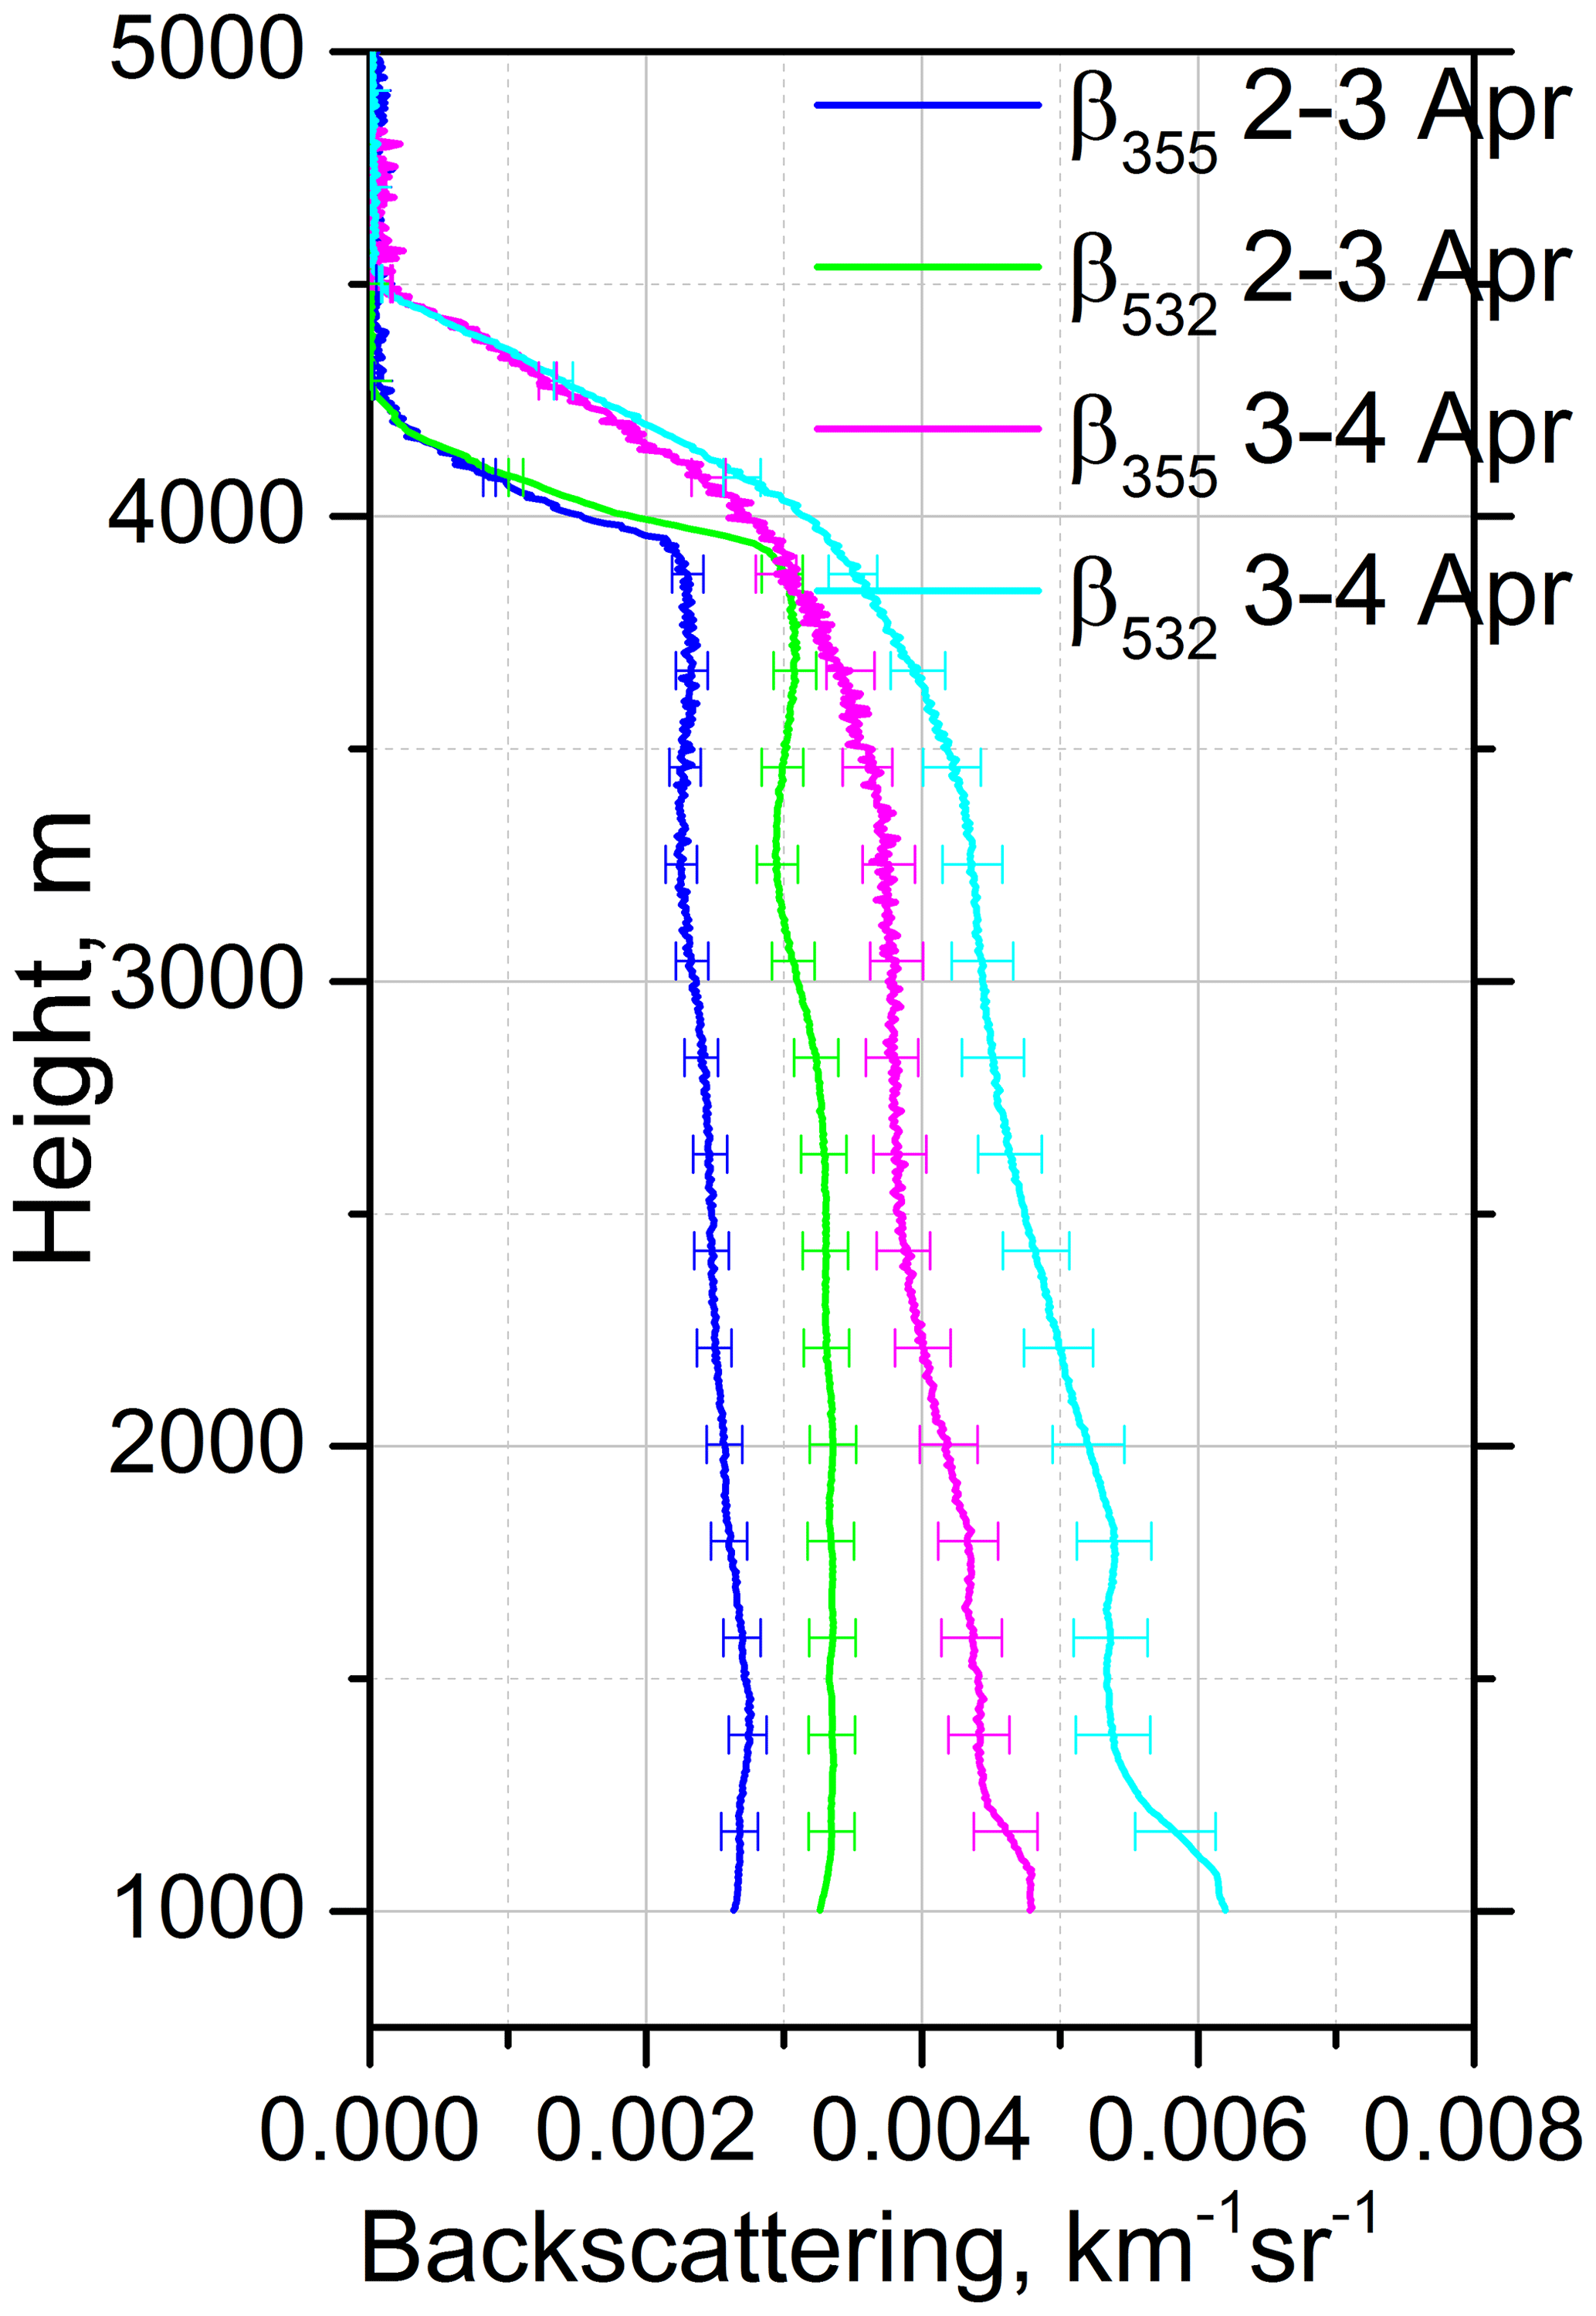
Figure 6Backscattering coefficients for observations presented in Fig. 5 for 2–3 and 3–4 April.
As follows from Fig. 5, on 1 April the lidar ratio sr does not change with height, while S532 gradually decreases from 60±5 sr at 1000 m to 50±4 sr at 3000 m in height. In sessions that followed (Fig. 5b, c) the lidar ratios at both 355 and 532 nm decreased. Thus, the range of lidar ratio variation for the dust episode on 1–4 April is 60–70 sr at 355 nm and 45–60 sr at 532 nm. The lidar ratios (S355 and S532) modeled by MERRA-2 for the dust component are also shown in Fig. 5. The corresponding lidar ratio values are 70 and 42 sr, respectively, and do not vary with altitude as the model optical properties of all dust size bins based on spectral complex refractive indices from the Optical Properties of Aerosols and Clouds (OPAC) tables (Hess et al., 1998) and the spheroidal-shape models developed by Meng et al. (2010) are the same and fixed, as dust is treated as hydrophobic. The modeled S355 value is near the top of the range of observed values, while modeled S532 underestimates the observations.
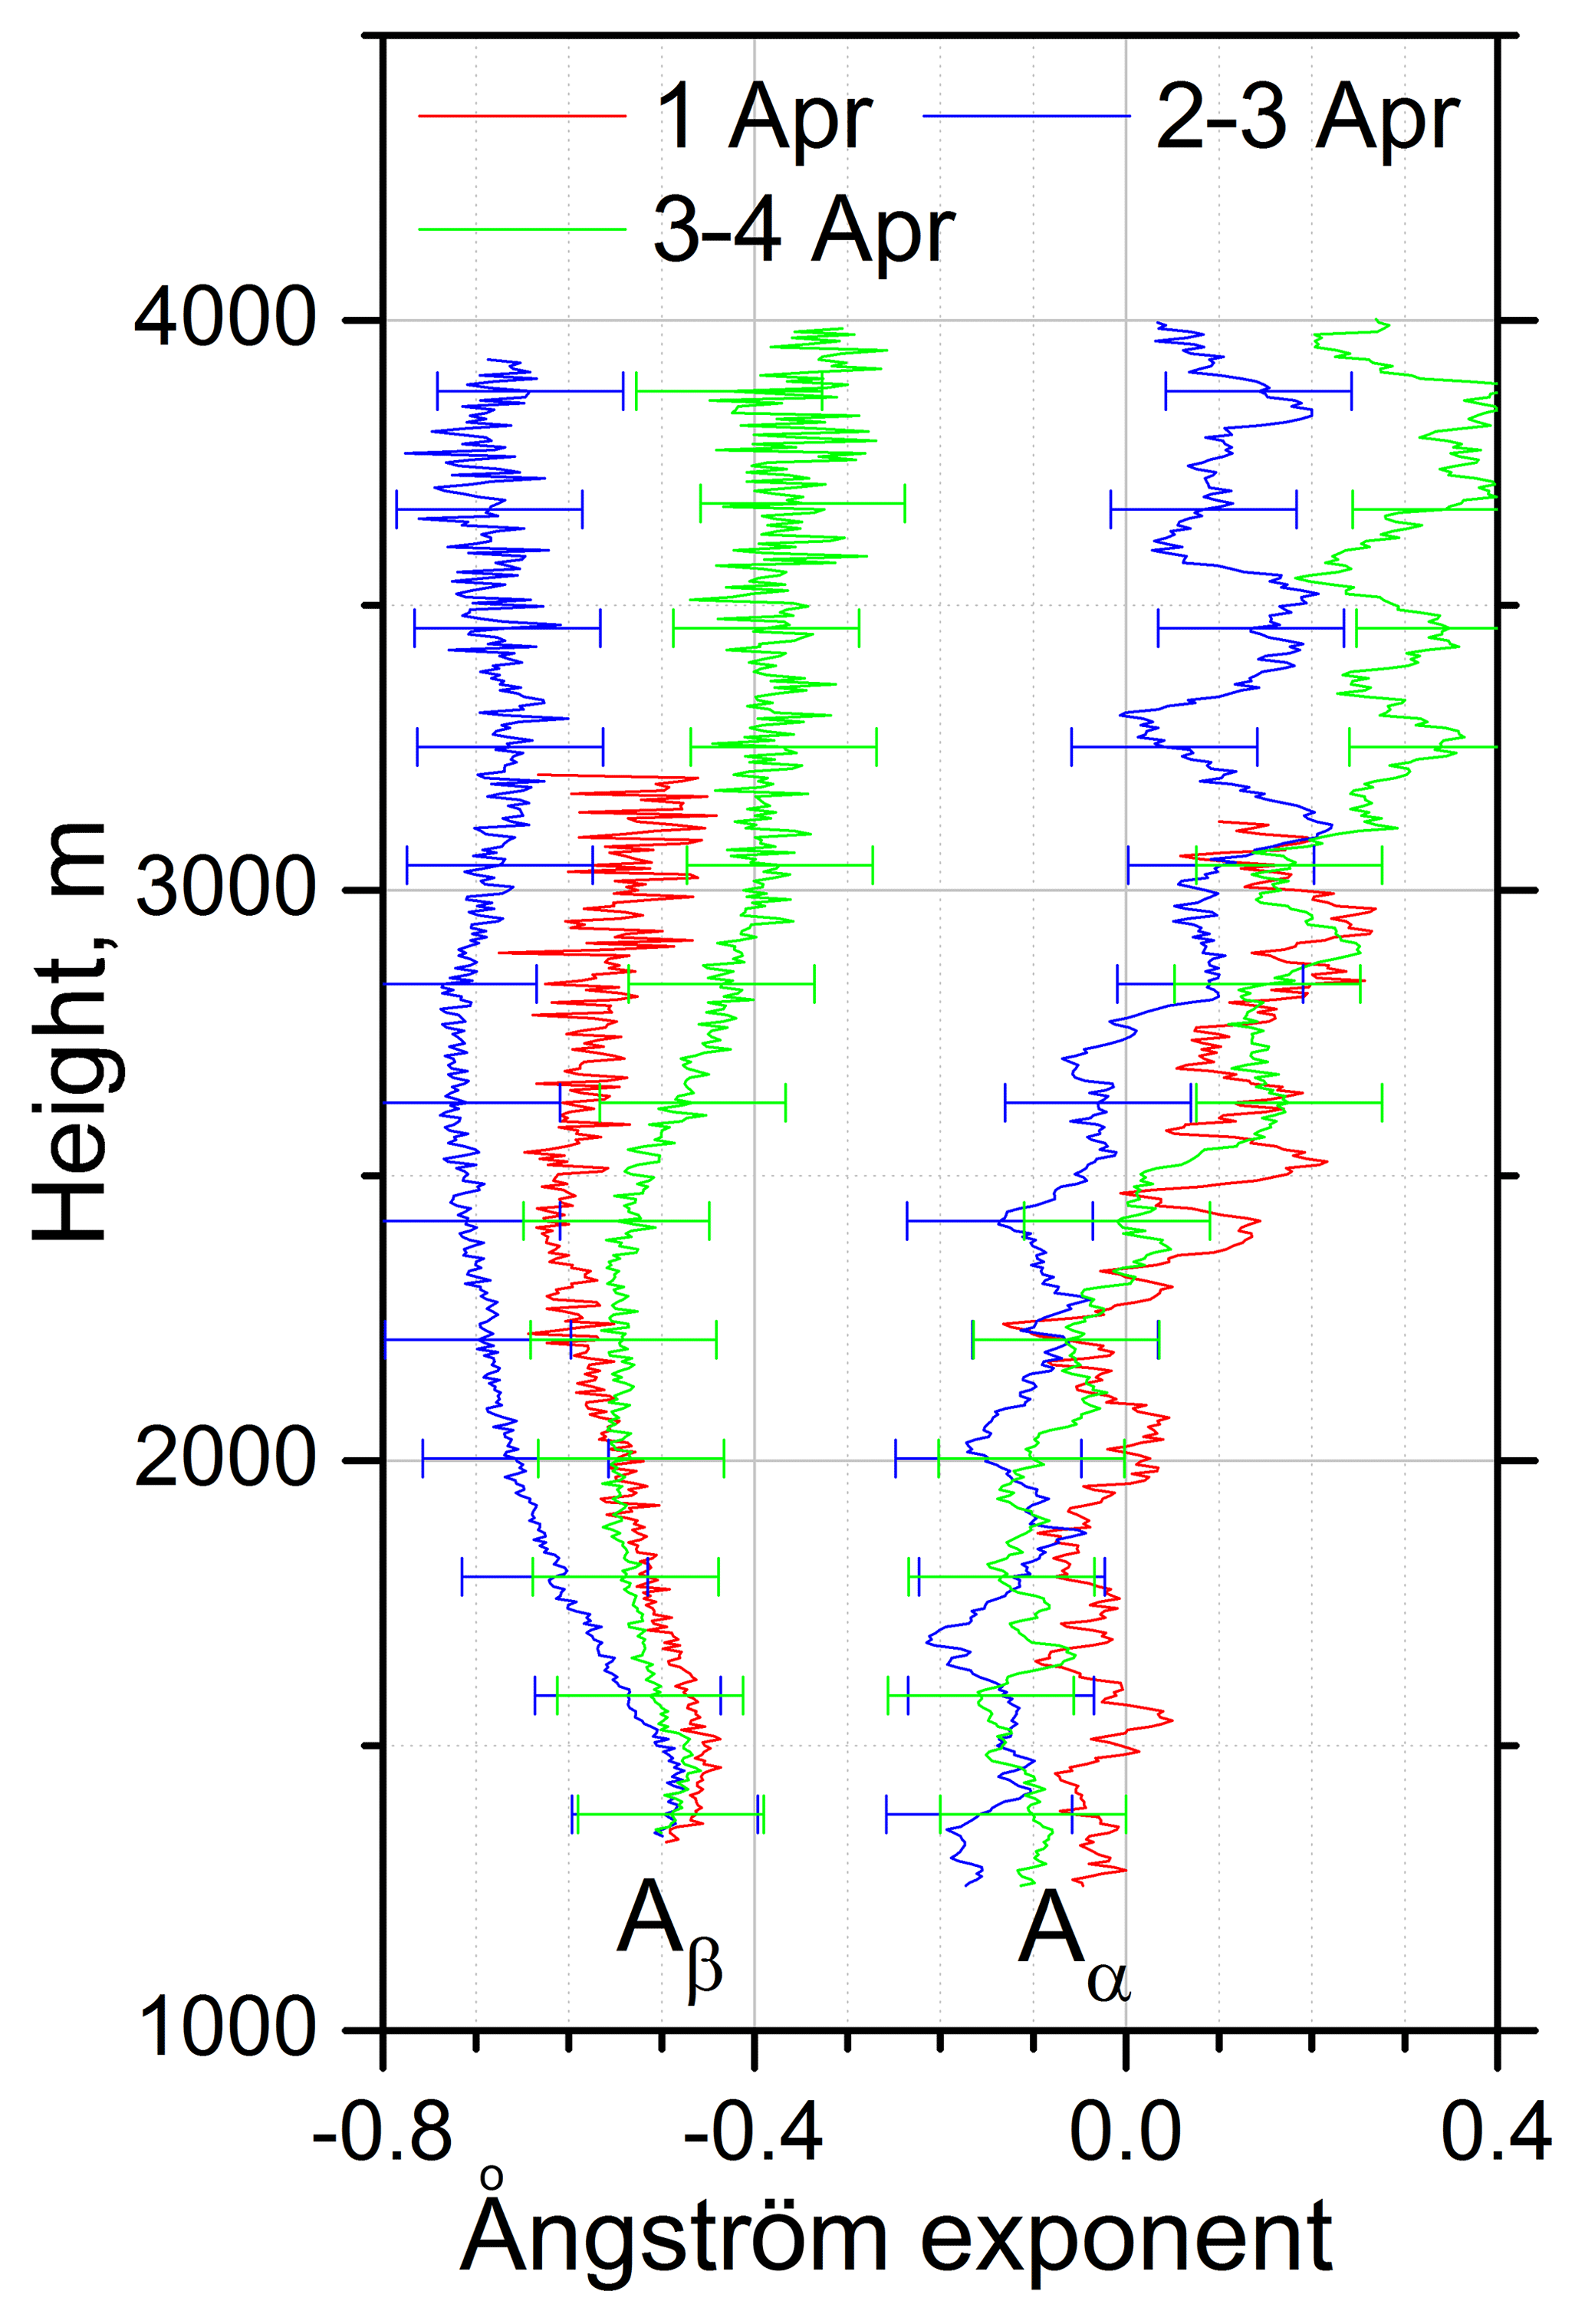
Figure 7Vertical profiles of the extinction and backscattering Ångström exponents (Aα and Aβ) at 355–532 nm for three temporal intervals from Fig. 5.
The gradual decrease in S532 with height in Fig. 5a and c is however unusual. There are, at least, two possible reasons to explain S532 height variation. The first one is the presence of nondust particles, for example, smoke. The second reason is that the properties (composition) of dust change with height. If nondust particles are present, the particle intensive properties, such as S, δ and Aα, should vary with height in a consistent way. The MERRA-2 modeling reported in Fig. 1 shows that in the beginning of April the organic carbon is the second main contributor to the AOD, after dust. We should recall, however, that while the model can provide a realistic range of OC variation, it does not necessarily reproduce the exact spatiotemporal distribution of the OC extinction coefficient.
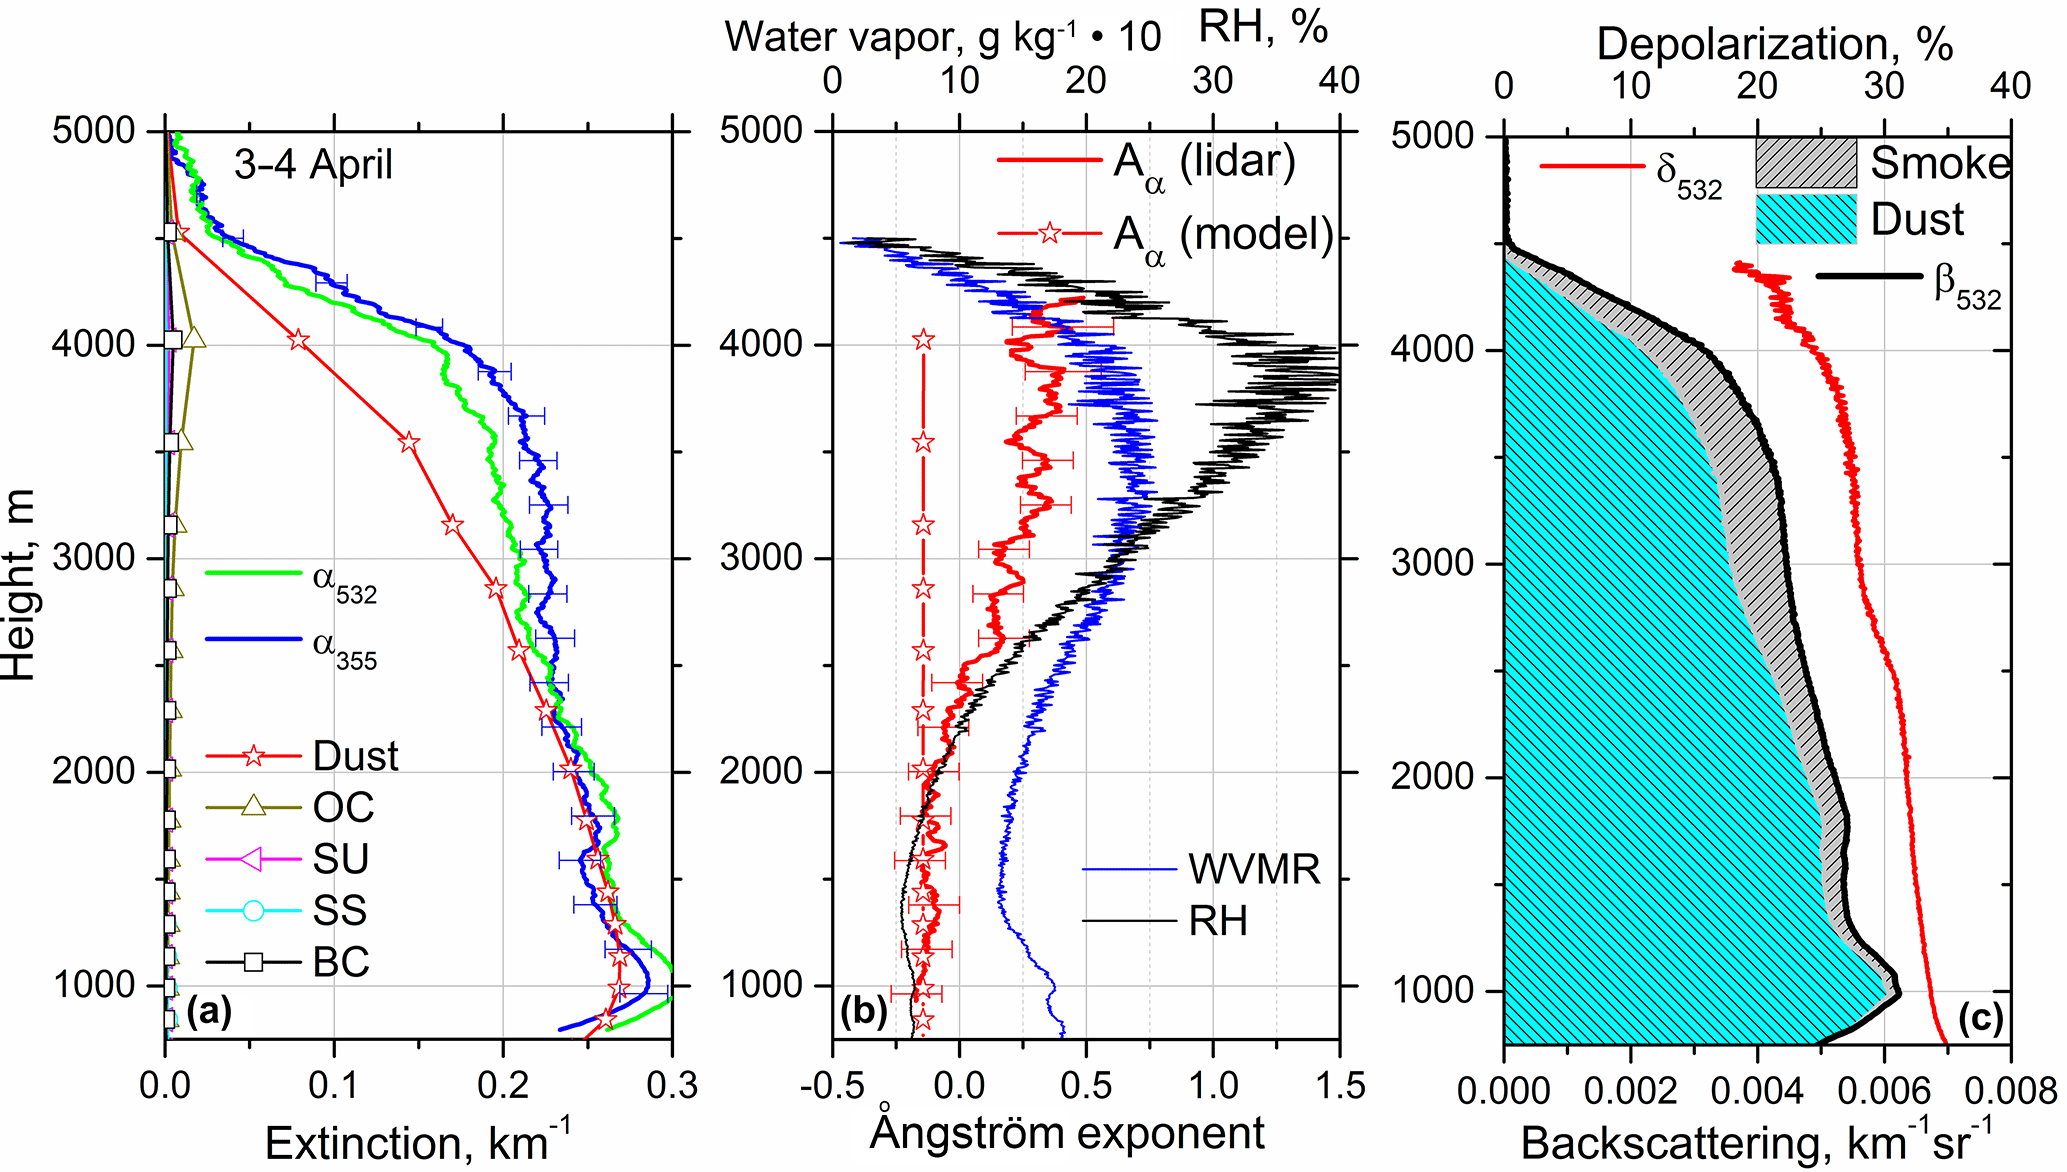
Figure 8Vertical profiles of (a) extinction coefficients at 355 and 532 nm (α355, α532) measured by lidar (lines) and modeled by MERRA-2 (line + symbol) for five aerosol components at 532 nm; (b) extinction Ångström exponents at 355–532 nm obtained from lidar observations and modeled by MERRA-2 for pure dust (stars) together with water vapor mixing ratio (WVMR) and the relative humidity; (c) contribution of dust and smoke particles to β532 together with particle depolarization ratio δ532. Values of WVMR are multiplied by a factor of 10. Lidar measurements were performed on 3–4 April 2015 for the period 23:00–02:00 UTC. Modeling results are given for 4 April 00:00 UTC.
In the dust episode considered, the most significant smoke contribution was observed on 3–4 April. Figure 8a shows the profiles of measured α355 and α532 together with MERRA-2 modeled extinction coefficients at 532 nm for five aerosol components. The extinction Ångström exponents measured by lidar and modeled by MERRA-2 for dust components are given in Fig. 8b. The same figure also shows the lidar-derived water vapor mixing ratio profile together with the relative humidity. At low altitudes (below 2500 m), where aerosol is represented by pure dust, the measured and modeled values of extinction coefficients are close. Above 2500 m the measured value of α355 exceeds that of α532, indicating the presence of smoke particles, while the modeled contribution of OC to the total extinction is very low. The measured extinction Ångström exponent is about −0.1 below 2000 m, which agrees well with modeling results for pure dust. An increase in WVMR and RH above 2000 m coincides with growth in the Aα. For the considered case, the model reproduces correctly the dust loading but underestimates the smoke contribution. At 3500 m, the difference between measured and modeled α532 is about 0.045 km−1 which can be attributed to the smoke contribution.
Dust and smoke particles contributions to the total backscattering coefficient can be also separated on the basis of the depolarization measurements, assuming that depolarization ratios of these particles are known (Tesche et al., 2009). The results of such decomposition are presented in Fig. 8c, assuming 35 % and 7 % for the dust and smoke depolarization ratio, respectively. The δ532=7 % was the lowest value that we observed in elevated smoke layers during the SHADOW experiment (Veselovskii et al., 2018); however, due to a large difference in smoke and dust depolarization ratios, the choice of the exact value for the smoke did not influence significantly the results. The contribution of smoke to the total β532 at 3500 m is 0.0009 km−1 sr−1. For the smoke lidar ratio of 50 sr at 532 nm (validity of this choice will be discussed in Sect. 3.3), the smoke extinction coefficient is about 0.045 km−1. This value agrees well with the smoke contribution obtained from Fig. 8a at 3500 m and thus can be used for estimating the smoke effect on the intensive aerosols properties derived from lidar measurements.
The depolarization ratio of the dust–smoke mixture, calculated with Eq. (1), matches the observed value since decomposition in Fig. 8c is based on depolarization measurements. The Ångström exponent at 3500 m computed with Eq. (4) for km−1, km−1, and yields Aα=0.28, which is close to the observed value 0.26±0.08. Hence, the observed variation in Aα above 2000 m on 3–4 April is well explained by the smoke contribution. In a similar way, using Eq. (5) we can estimate the smoke lidar ratio () that would match the observed decrease in S532. To explain the decrease in the lidar ratio at 3500 m from 50 to 45 sr, the smoke lidar ratio should be about 25 sr, which is unrealistically small (Burton et al., 2012). Such a small lidar ratio could be attributed to the maritime aerosol, but then the lidar ratios at both wavelengths should decrease simultaneously. Recall that on 1–2 April the smoke contribution was significantly lower, while the decrease in S532 was about 10 sr. Thus, presence of smoke particles cannot explain the observed decrease in S532 and it should probably be attributed to changes in dust composition (and so the imaginary part) with height.
The smoke lidar ratio is usually assumed to be higher than that of dust (Tesche et al., 2011; Burton et all., 2012); meanwhile in Fig. 5c the lidar ratio S532 is not increased in the presence of the smoke particles. It should however be noticed that our results were obtained at low RH. The smoke particles are hygroscopic, and the lidar ratio should increase with RH. The way to characterize over the Dakar site can be based on the analysis of the lidar measurements during smoke episodes within a height range where smoke contribution becomes predominant. The results of such analysis will be discussed later in Sect. 3.3.
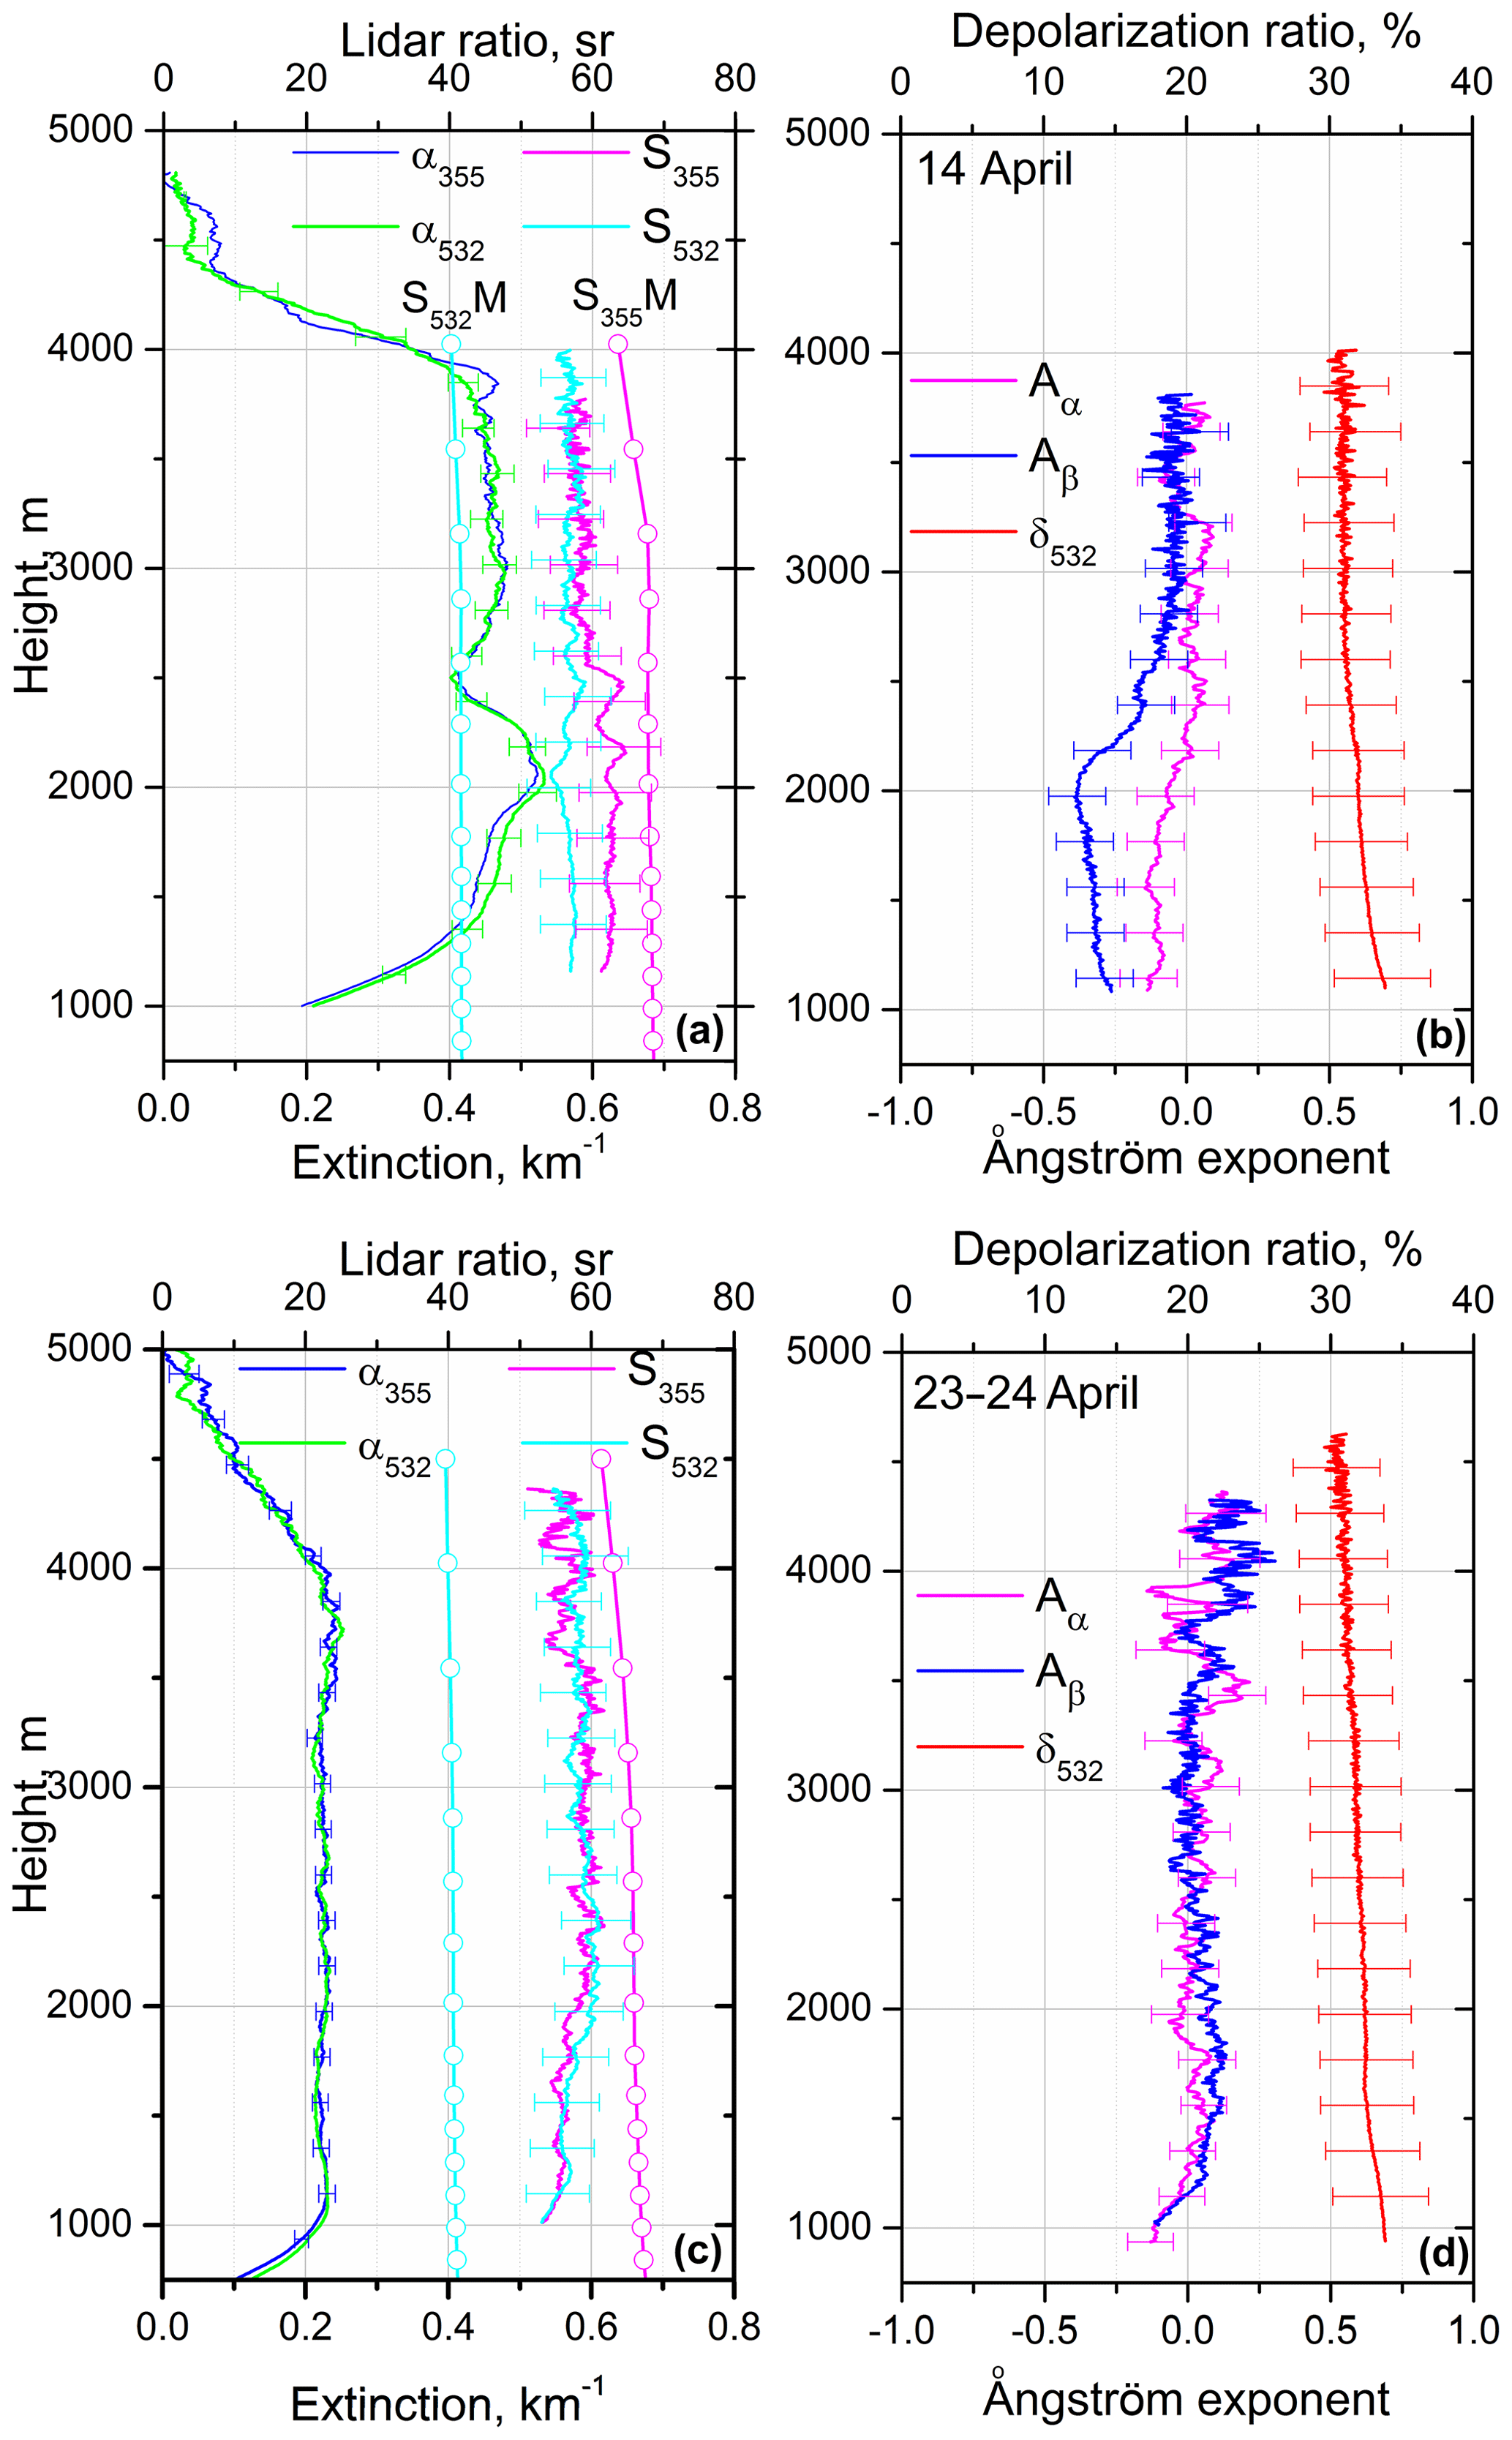
Figure 9(a, c) Vertical profiles of extinction coefficients (α355, α532) and lidar ratios (S355, S532) at 355 and 532 nm, together with (b, d) the particle depolarization ratio δ532 and extinction and backscattering Ångström exponents (Aα, Aβ) measured on (a, b) 14 April 2015 (00:00–05:00 UTC) and (c, d) the night 23–24 April (23:00–06:00 UTC). Open symbols on plots (a, c) show the lidar ratios S355M and S532M provided by the MERRA-2 model on 14 and 24 April at 00:00 UTC.
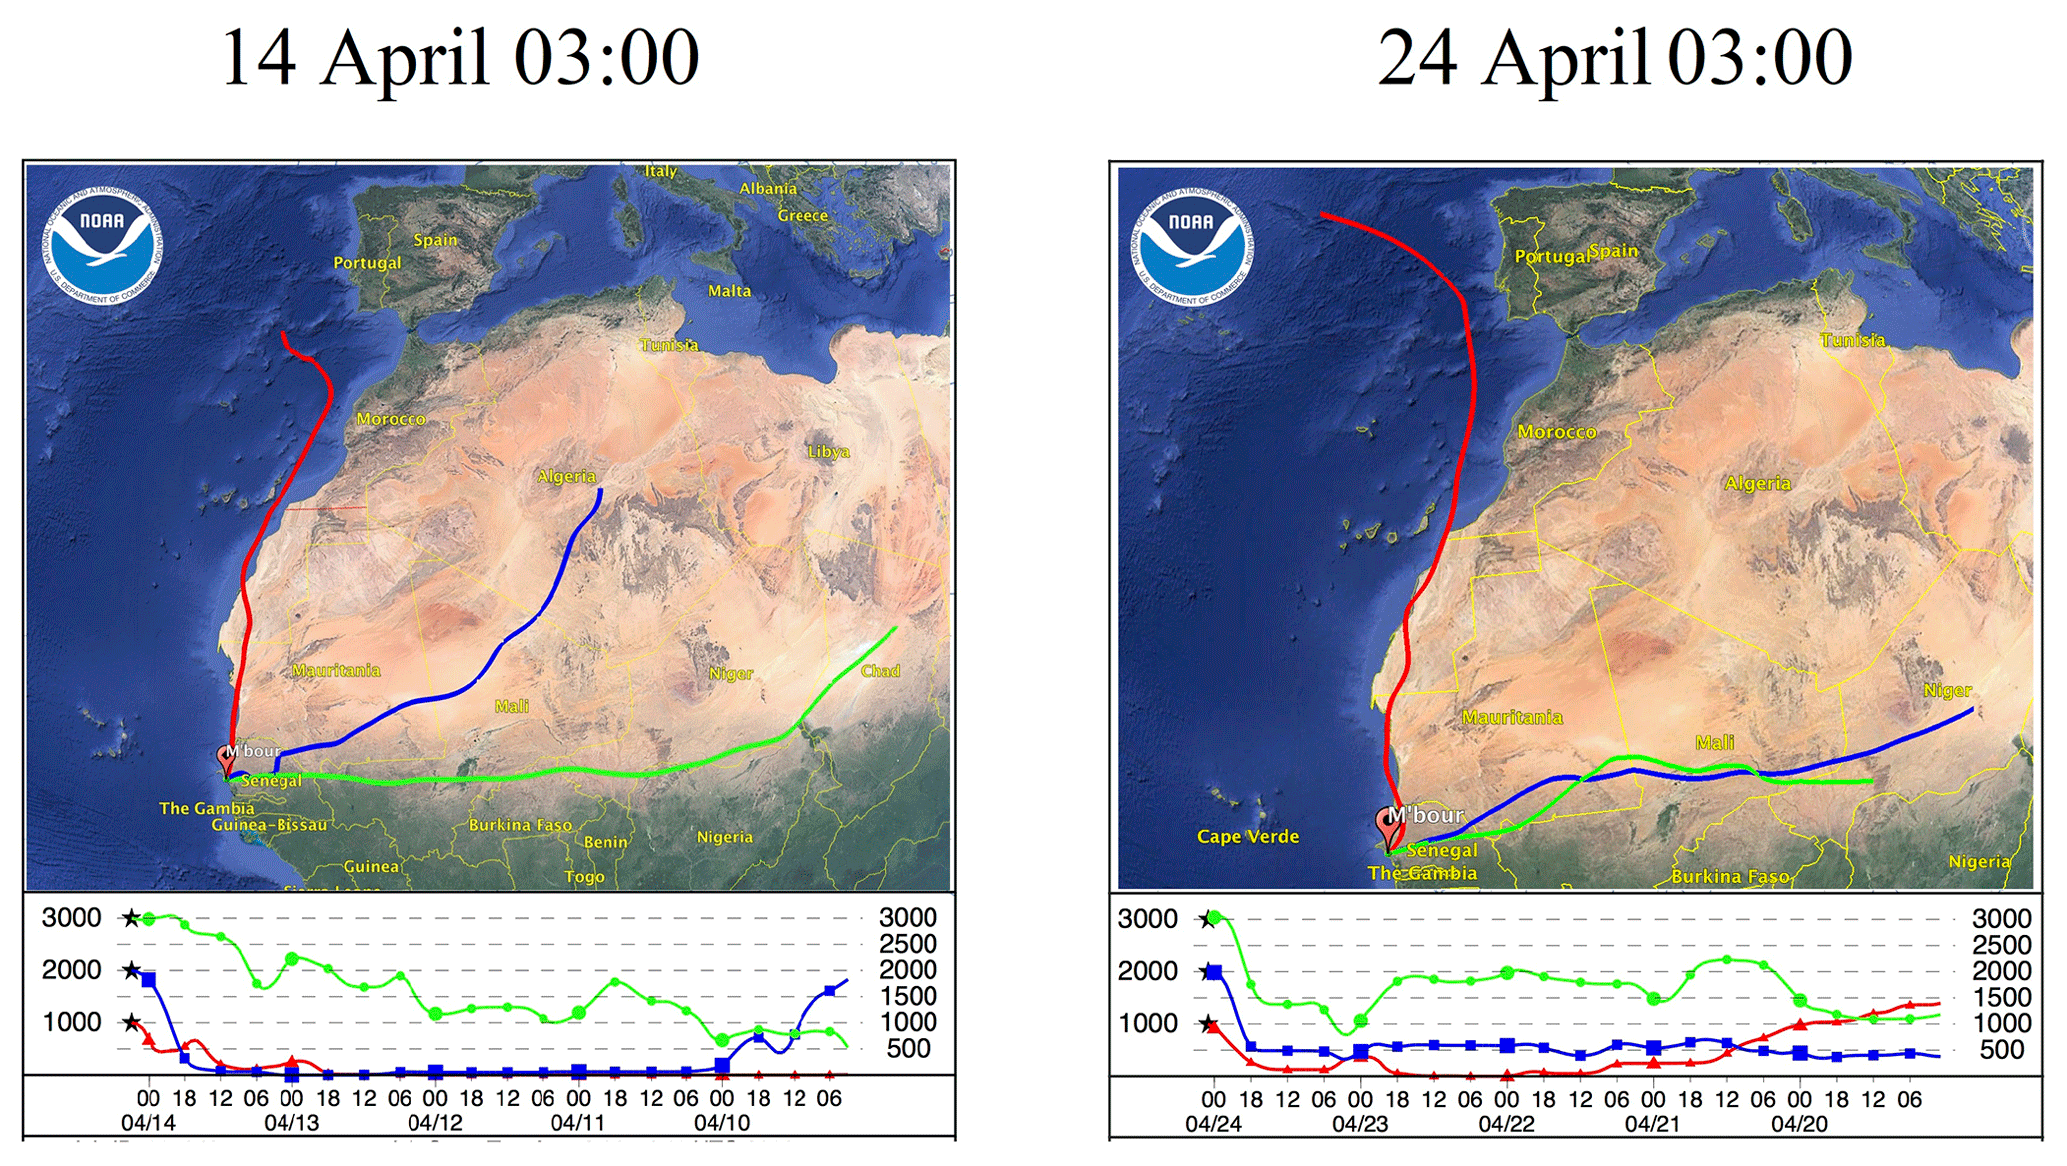
Figure 10For 14 April (03:00 UTC) and 24 April (00:00 UTC) 2015, 4 d backward trajectories obtained with the HYSPLIT model.
3.2 Dust episodes on 14 and 24 April 2015
In the second part of April 2015, dust AOD532 exceeded 1.0 (Fig. 1b) and contributions of other aerosol components were insignificant. Meanwhile, as follows from Fig. 2, SSA440 increased after 15 April; thus dust became less absorbing in the UV, which should influence the lidar-derived aerosol intensive properties. Figure 9 shows the values of the extinction coefficients and lidar ratios at 355 and 532 nm, together with the depolarization ratio δ532 and the Ångström exponents Aα and Aβ observed on 14 April (00:00–05:00 UTC) and 23–24 April (23:00–06:00 UTC). The first case is a transition day when SSA440 starts to increase. The aerosol extinction profiles presented in Fig. 9a show that two dust layers can be distinguished. In the first layer (below 2.5 km), aerosol intensive properties are similar to that of 1–4 April with S355 > S532, slightly negative and Aβ as low as −0.35. In the second layer, S355 and S532 coincide and both Aα and Aβ are close to zero. The depolarization ratio in the second layer is about 31 %, slightly lower than in the first one. Thus, we can assume that an increase in the imaginary part in UV in the first layer is more significant than in the second one. From the analysis of air mass back trajectories given in Fig. 10, we can conclude that the air masses in the first layer originate from the northeastern and eastern drylands, while in the second layer the air masses arrive from the east. After 14 April, S355 and S532 coincided for the whole height range, and results obtained on 23–24 April (Fig. 8c, d) are the example of such observations. Air mass back trajectories show that the air masses at both 2.0 and 3.0 km height are transported from the east. The ratio S355∕S532 is close to 1.0 within the whole dust layer, and both Ångström exponents Aα, Aβ are close to zero. Thus, the results from Figs. 9 and 10 indicate that lidar-derived aerosol properties depend on the dust source origin.
3.3 Analysis of lidar ratio variations in March–April 2015
Figure 11 summarizes the lidar ratio measurements for the period from 29 March to 24 April 2015 (first phase of SHADOW ended on 25 April). Here we focus on the properties of pure dust and thus do not show results before 29 March, when AOD was lower and the contribution of other aerosol types could be significant (Fig. 1). For Fig. 11 we have chosen height intervals where the S value is stable and δ exceeds 30 %. For example, on 14 and 24 April lidar ratios are averaged inside 2.7–3.7 and 2.0–4.0 km layers, respectively. For the period considered, S355 and S532 vary in the ranges of 50–80 and 45–60 sr, respectively, with mean values of 62 and 51 sr. Enhanced variability in S355 compared to in S532 can be explained by variation in the imaginary part at 355 nm. At the beginning of the 29 March and 8 April dust episodes, the S355∕S532 ratio is as high as 1.5 and then gradually decreases. After 14 April, the S355∕S532 ratio becomes close to 1.0; thus S presents no spectral dependence.
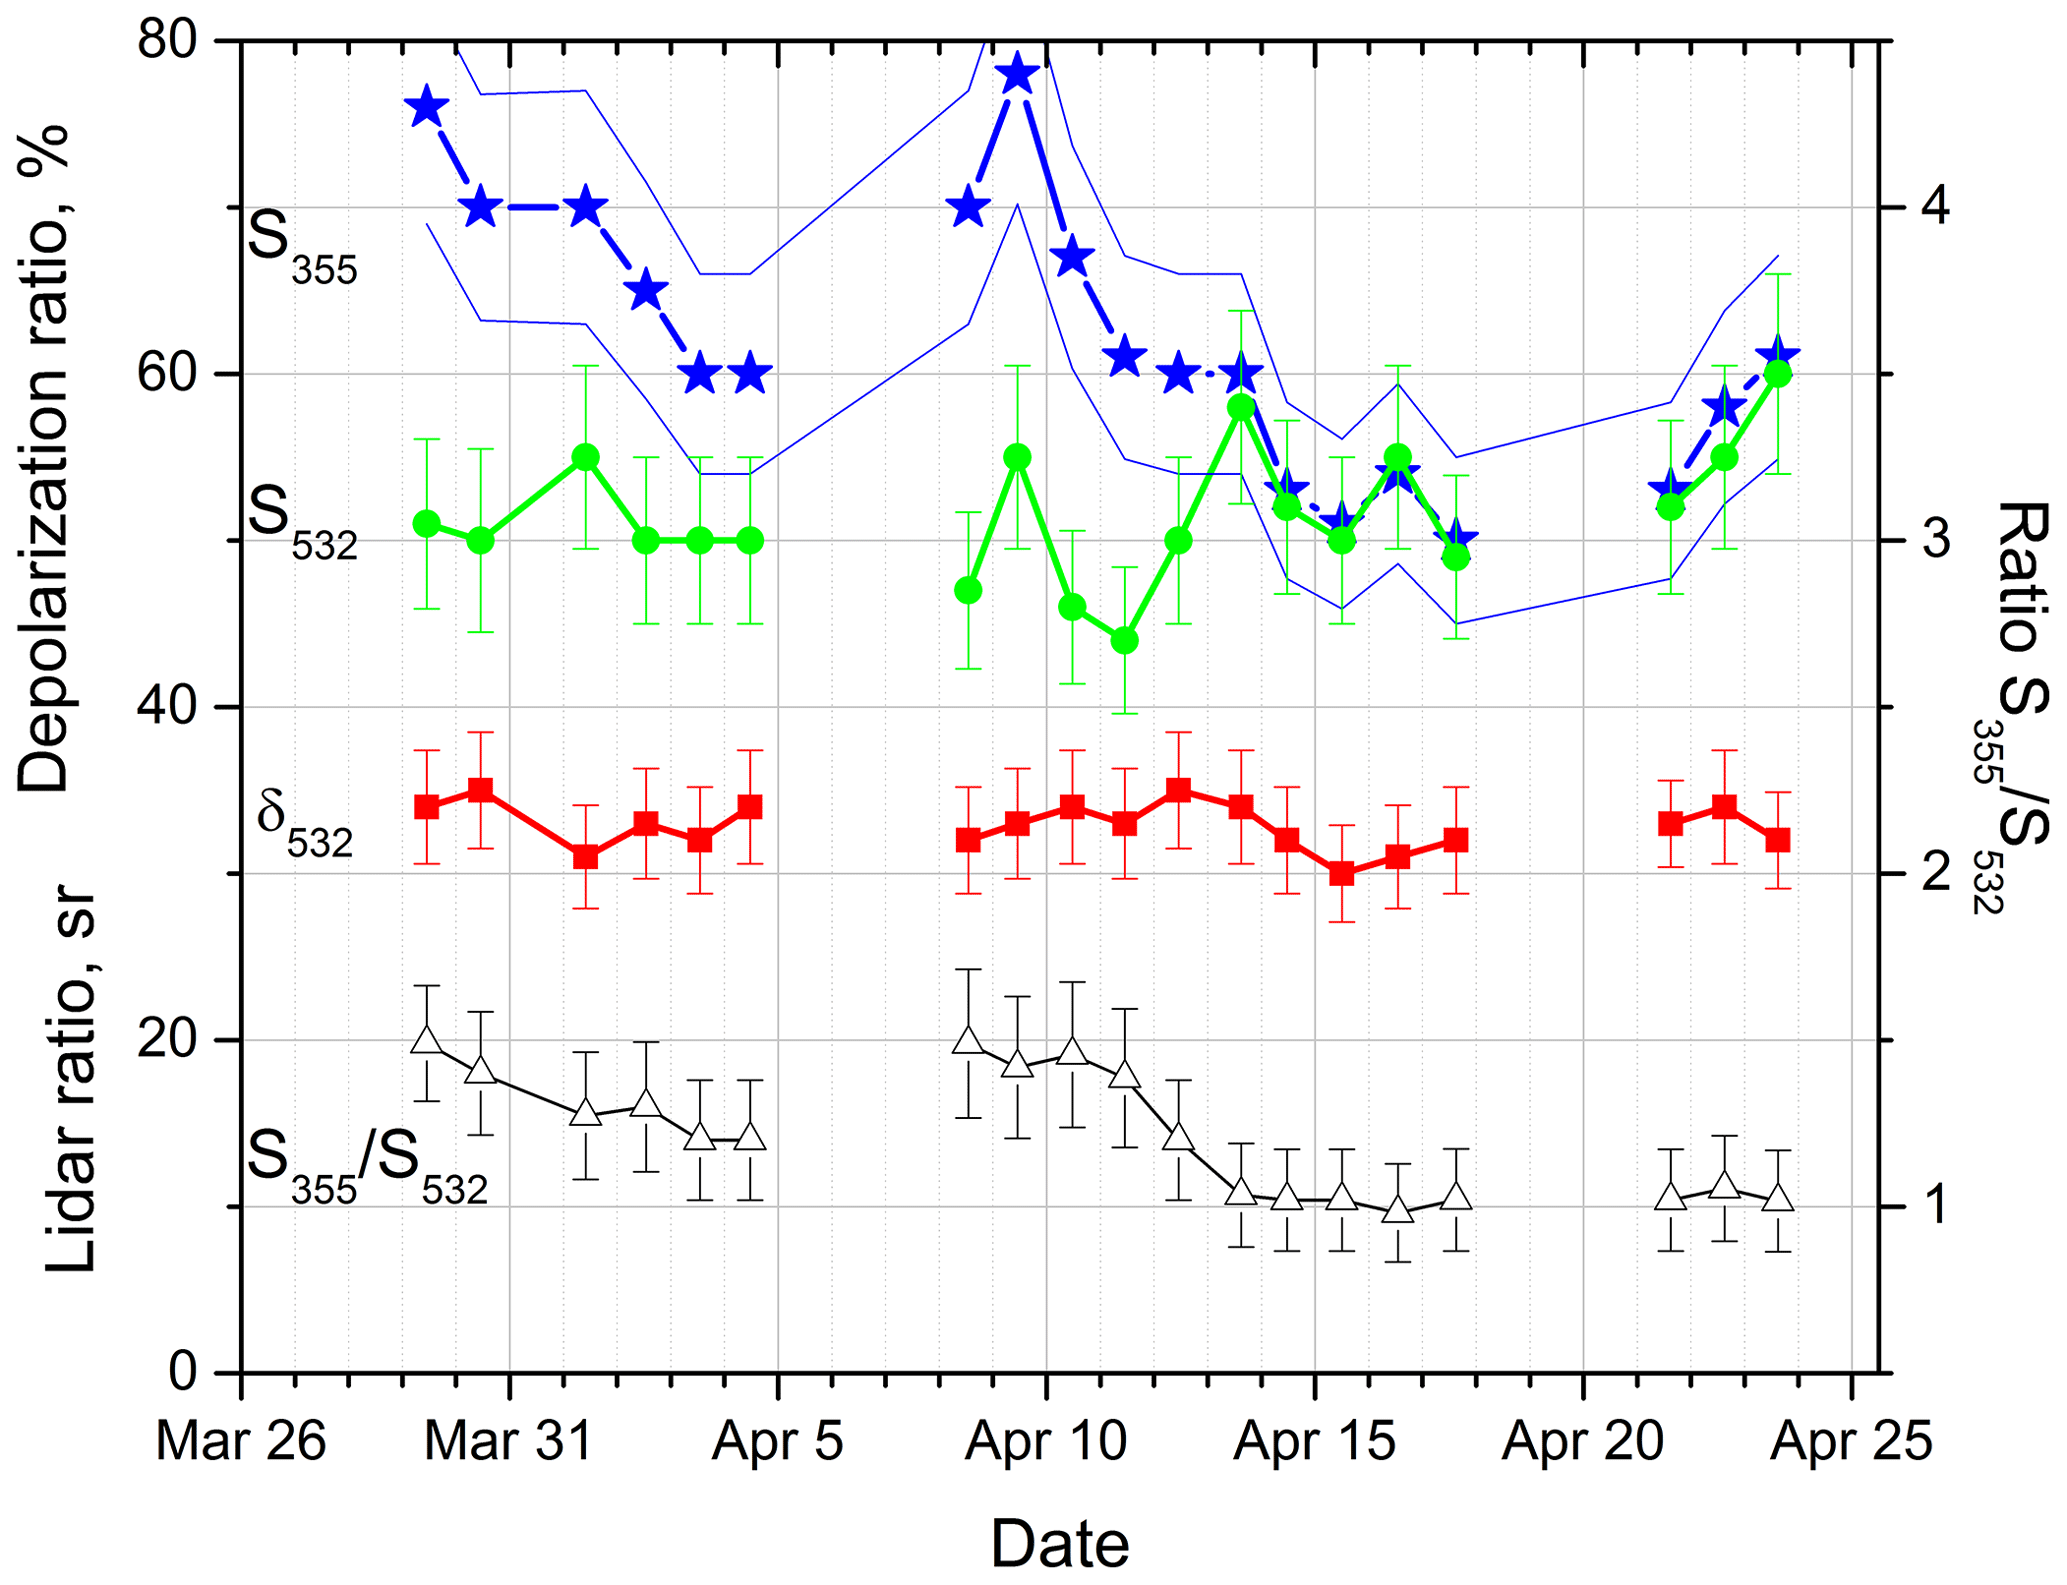
Figure 11Lidar ratios S355 and S532 and the particle depolarization ratio δ532 for dust episodes in March–April 2015. Open triangles show the ratio S355∕S532.
The day-to-day variation in the aerosol column properties, including the spectrally dependent complex refractive index, can be obtained from AERONET (Holben et al., 1998). Figure 12 shows the imaginary part of the aerosol refractive index at 440 and 675 nm (Im440, Im675) provided by AERONET for the same period of time as in Fig. 11. The Im440 strongly decreases after 14 April, correlating with the decrease in the S355∕S532 ratio in Fig. 11, which corroborates the suggestion that variations in the S355∕S532 ratio are related to variation in dust absorption in the UV range. The retrieved real part (Re) of the complex refractive index oscillates around Re =1.45 and shows no significant spectral dependence. Correlation between enhancement of Im440, with respect to Im675, and an increase in lidar-derived S355∕S532 is clearly seen in Fig. 13, showing time series of the Im440–Im675 difference and S355∕S532 ratio.
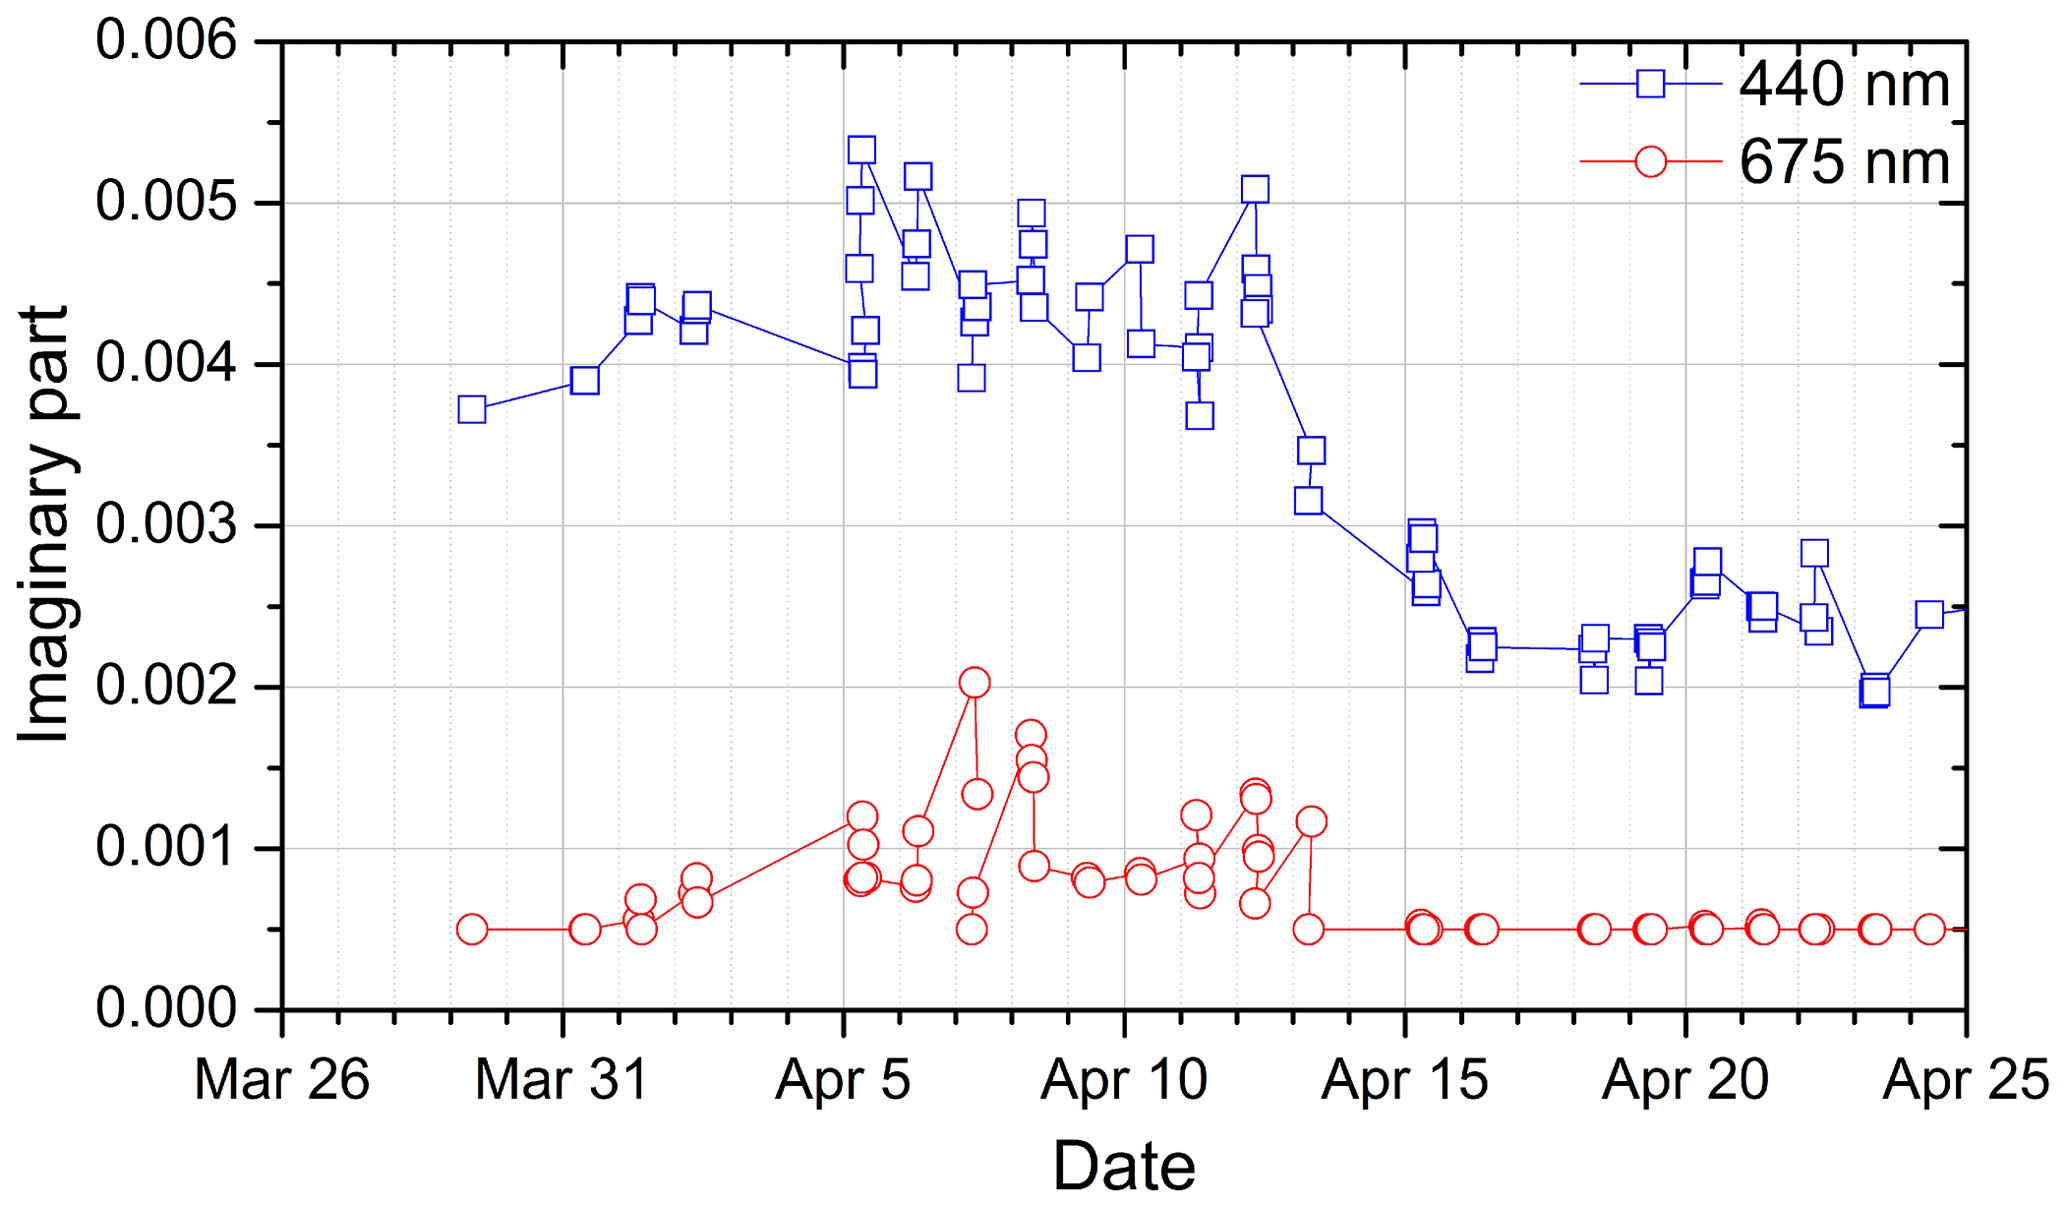
Figure 12Imaginary part of the refractive index at 440 and 675 nm provided by AERONET for March–April 2015.

Figure 13Difference of Im440–Im675 from Fig. 12 together with lidar measured values S355∕S532 from Fig. 11 for days in April 2015.
To analyze the variations in the observed lidar ratios and the Ångström exponents, a simplified numerical simulation has been performed. For a realistic modeling of the dust lidar ratio, various mixtures of different mineral components and particles shapes should be considered. Sensitivity of the modeling results to the dust mixture parameters was demonstrated in the study of Gasteiger et al. (2011). Such detailed modeling, however, is outside the scope of the present paper. Here we only intend to evaluate the main impact when the imaginary part of CRI is modified.
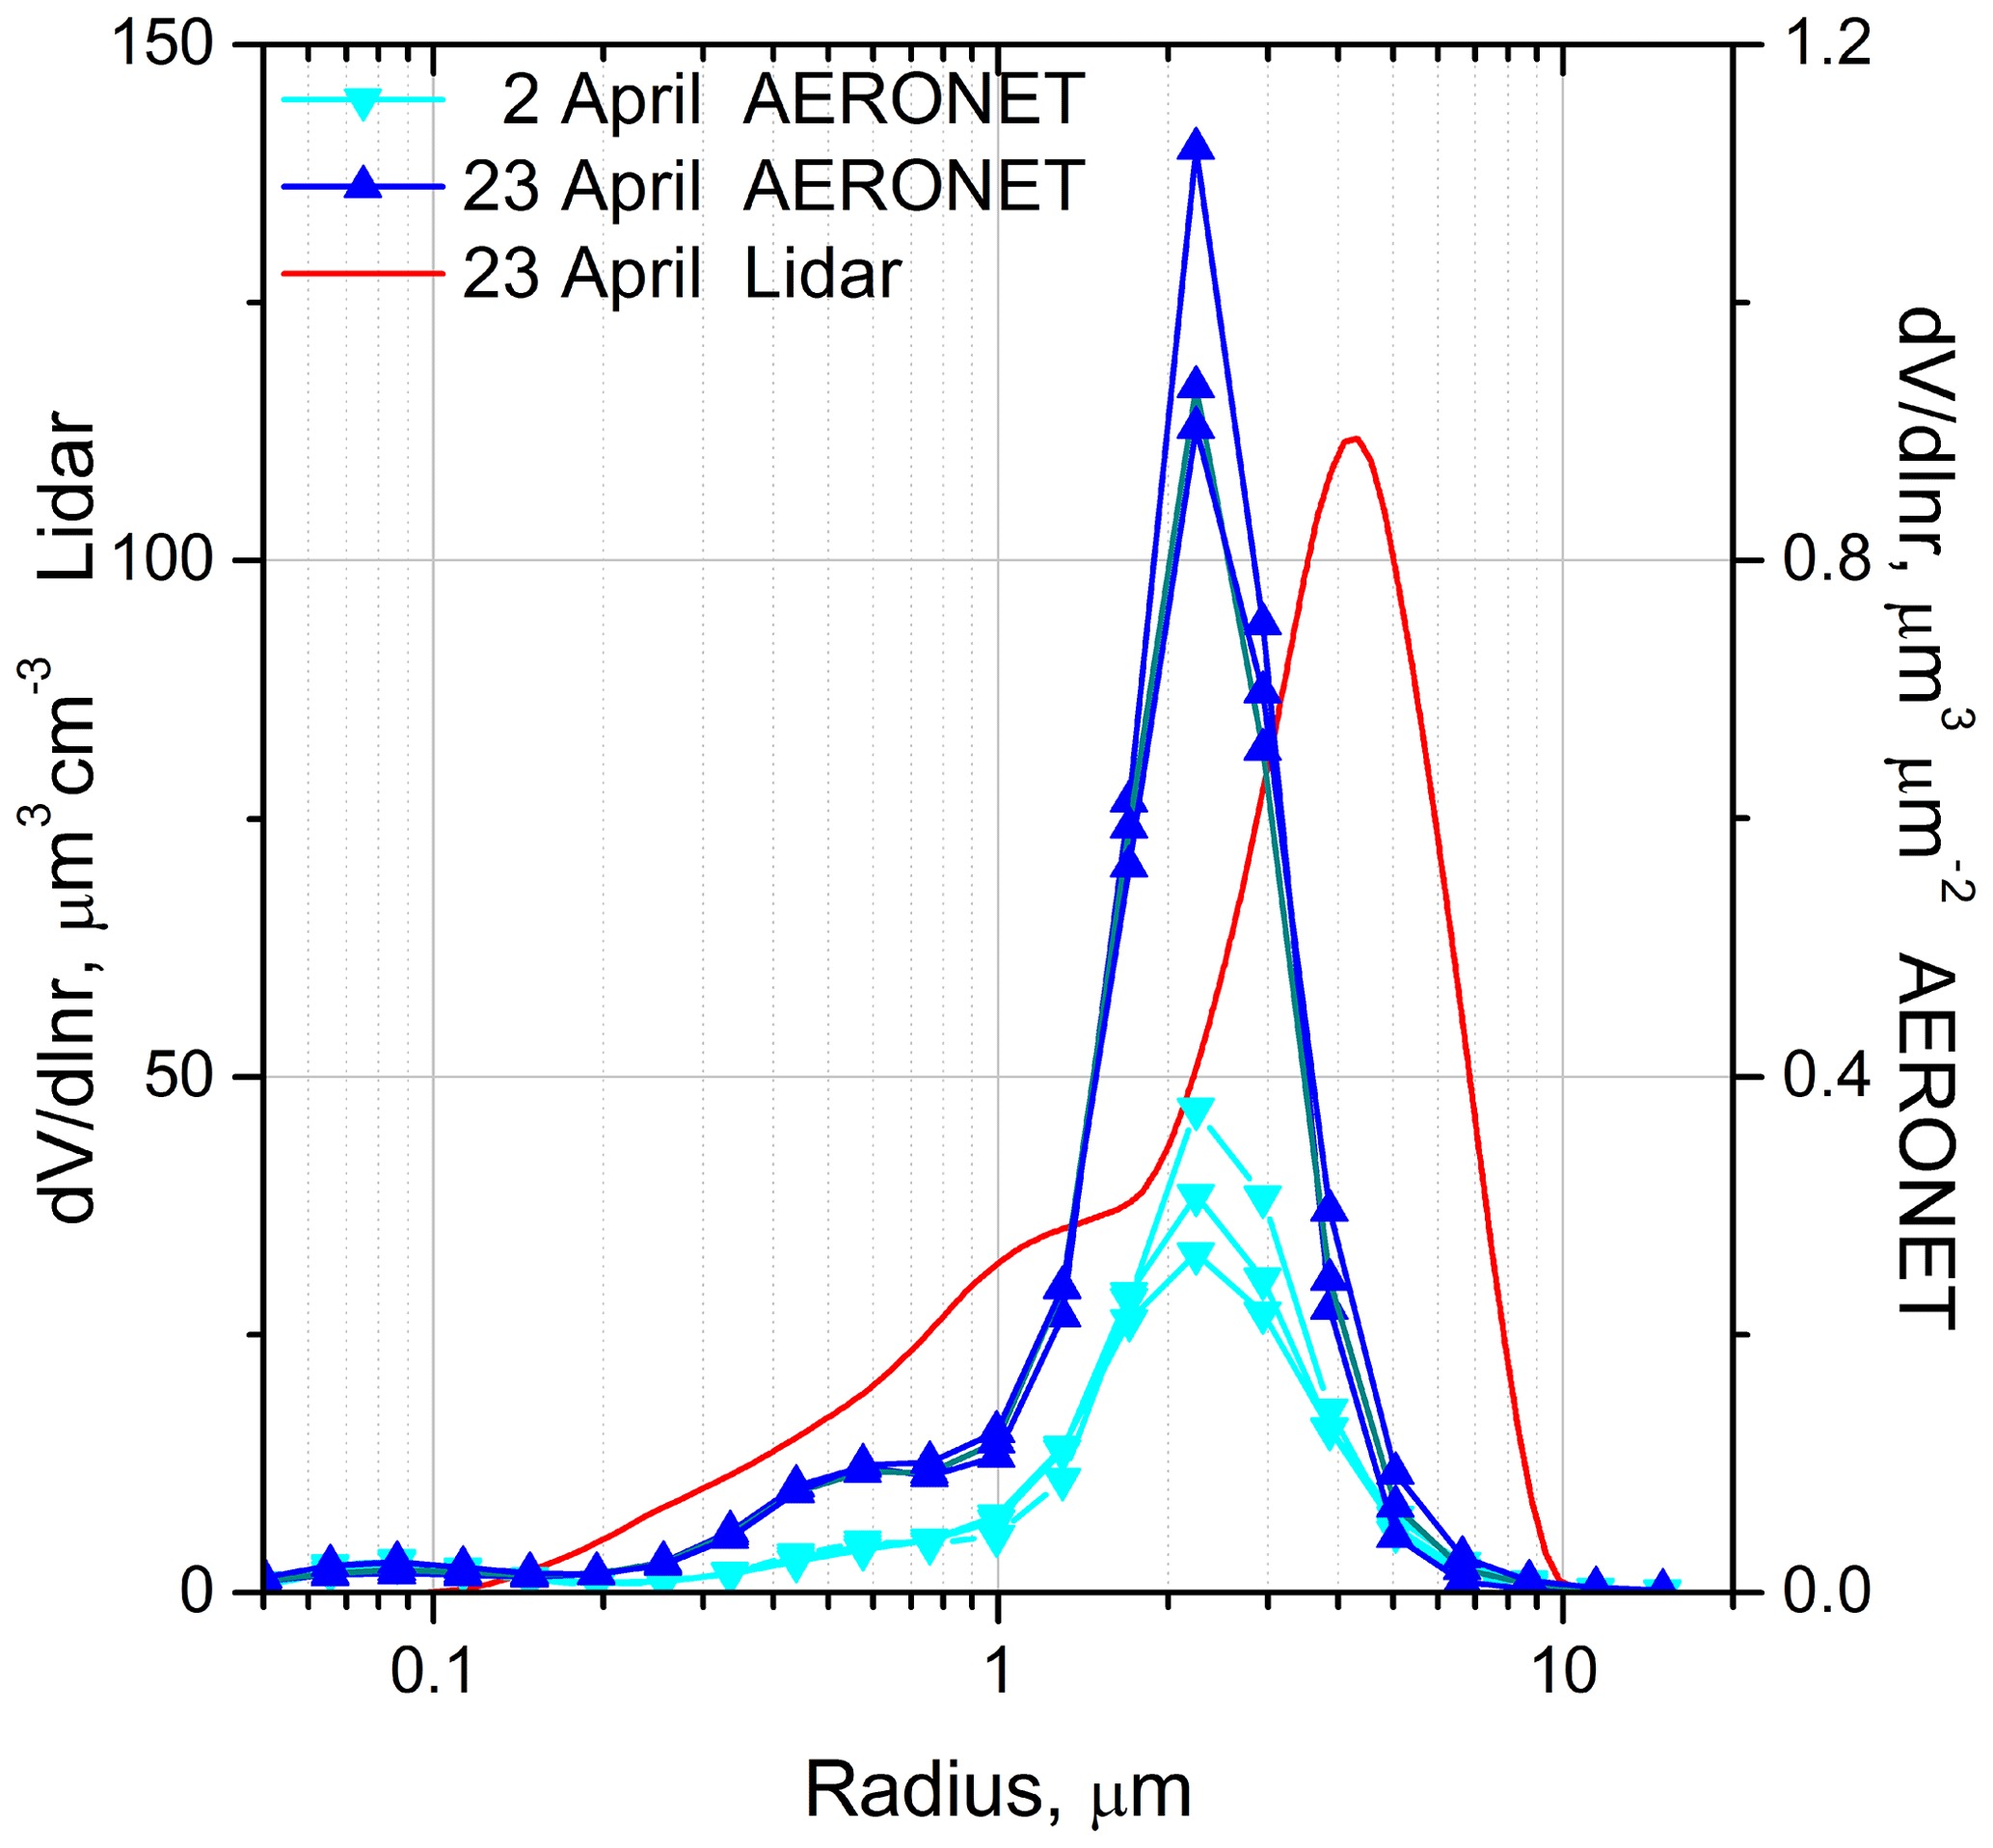
Figure 14The particle size distributions provided by AERONET on 2 and 23 April 2015 (three PSDs for each day). Red line shows the PSD derived from 3β+2α lidar measurements on 23–24 April within a 2.0–3.0 km height range.
The lidar ratio depends not only on the complex refractive index but also on the dust particle size distribution (PSD). The PSDs provided by AERONET on 2 and 23 April 2015 (three distributions for each day) are shown in Fig. 14. The PSDs are similar, and the effective radii for both days are about 0.75 µm; thus, differences in S observed for 2 and 23 April should be related mainly to the complex refractive index. Figure 15a presents modeled S355 and S532 lidar ratios together with the extinction and backscattering Ångström exponents Aα and Aβ as a function of the imaginary part. Computations were performed for the AERONET-derived size distribution on 23 April from Fig. 14 using the assembly of randomly oriented spheroids (Dubovik et al., 2006) with the real part Re =1.55. S355 and S532 increase with the imaginary part, and the ratio S355∕S532 is about 1.1. The extinction coefficient is slightly sensitive to the imaginary part; thus an increase in S in Fig. 15 is due to a decrease in the backscattering coefficient with Im. The modeled Aα is about Aα=0.1, while Aβ decreases with Im to . To estimate the influence of a spectrally dependent imaginary part Im(λ) on Aβ, we have also performed computations assuming a fixed Im532=0.002 and only Im355 is free to vary. Corresponding results are shown in Fig. 15a with open stars. Spectral dependence of the imaginary part significantly decreases Aβ: for Im355=0.005 (Im355–Im532=0.003), Aβ decreases to −0.75.
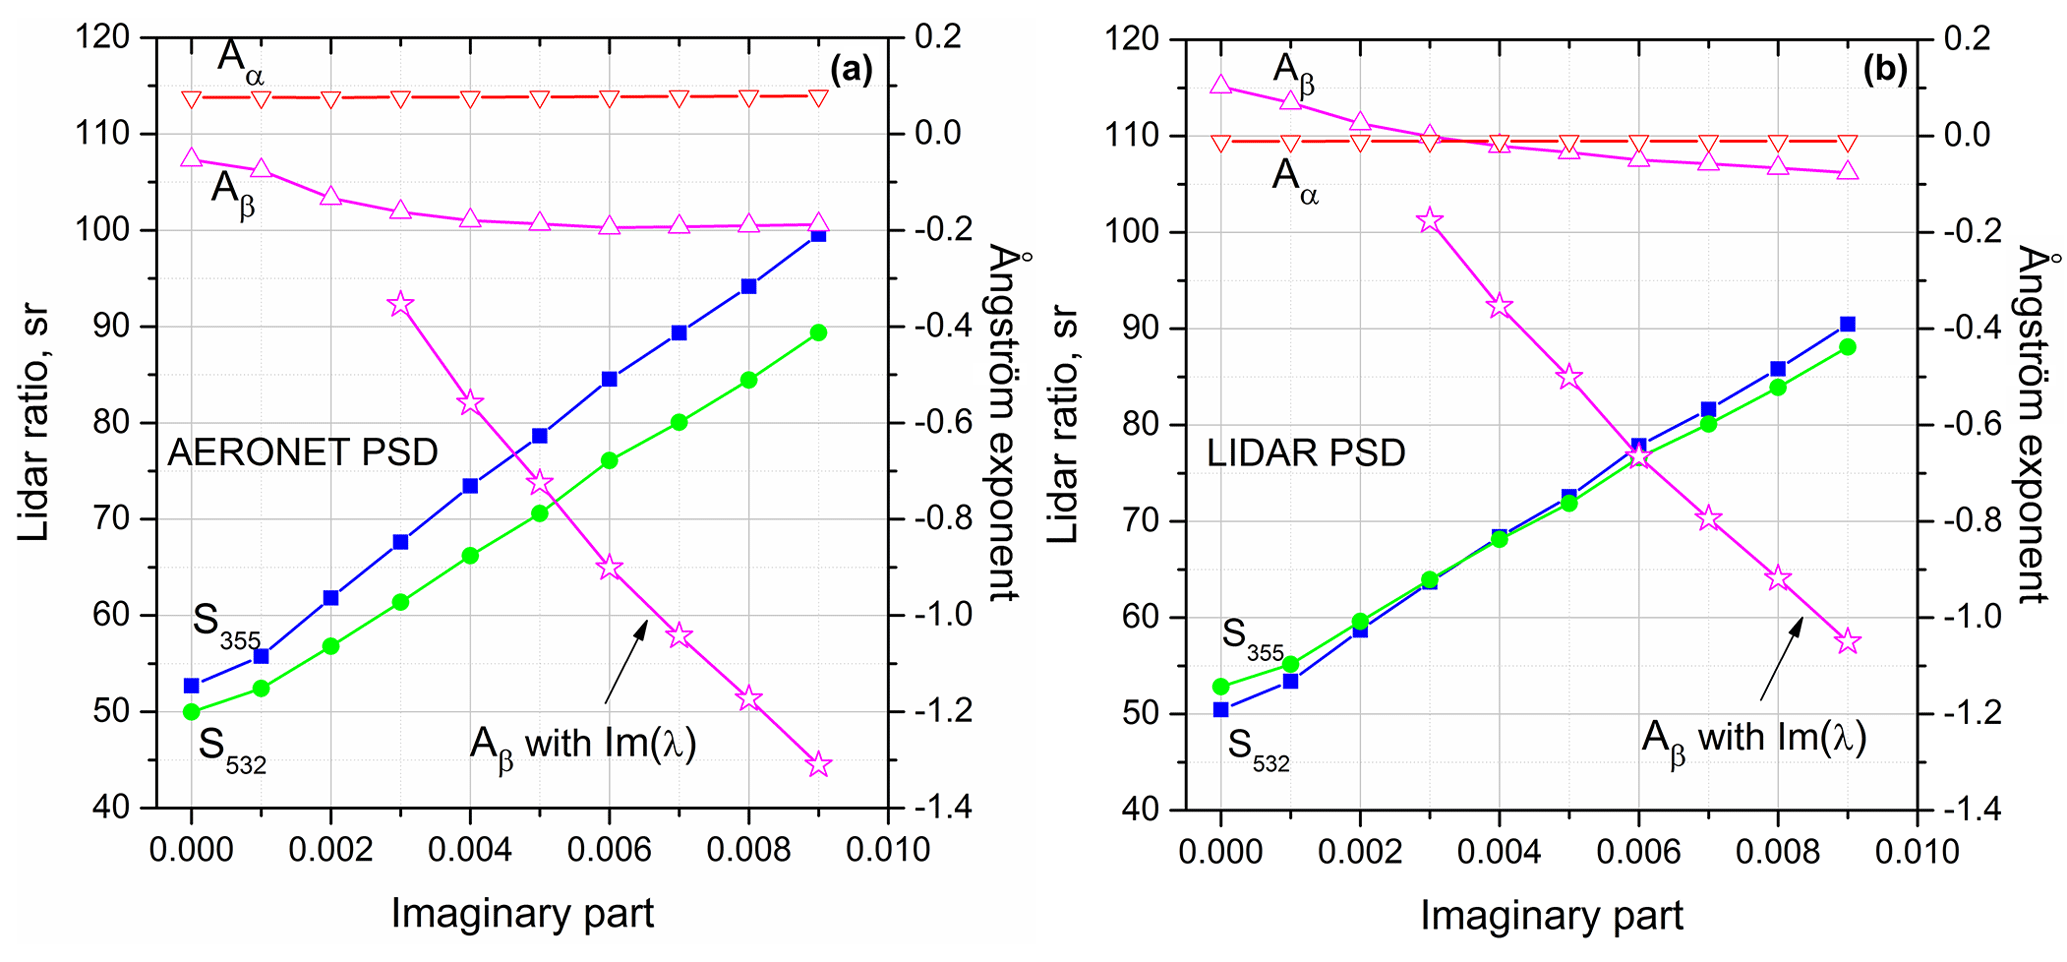
Figure 15Lidar ratios S355 and S532 together with the extinction and backscattering Ångström exponents Aα and Aβ calculated for (a) AERONET PSD on 23 April from Fig. 14 and (b) lidar-derived PSD from Fig. 14 as a function of the imaginary part. Open stars show Aβ for spectrally dependent imaginary part Im(λ), assuming that Im532=0.002 is fixed and only Im355 is free to vary. Computations are performed for the assembly of randomly oriented spheroids with the real part Re =1.55.
We should recall, however, that for the second half of April the observed ratio S355∕S532 was about 1.0 and both extinction and backscatter Ångström exponents were close to zero. To figure out the kind of PSD that would reproduce those observations, we retrieved the PSD from 3β+2α measurements, as described in Veselovskii et al. (2002, 2010). For that purpose, data from 23–24 April (Fig. 9), averaged within a 2–3 km layer, were inverted, and the corresponding PSD is shown in Fig. 14 with a red line. Inversion was performed for the assembly of randomly oriented spheroids, assuming a spectrally independent refractive index. Due to the limited number of input data (five) we are able to reproduce only the main features of the PSD. The maximum of this lidar-derived PSD is shifted towards larger radii, with respect to the AERONET size distribution, but at the same time, the retrieved PSD contains a significant contribution from the fine particles. The simulation results for this lidar-derived PSD, are given in Fig. 15b. The lidar ratios S355 and S532 for all values of the imaginary part are close. The backscatter and extinction Ångström exponents are close to zero, matching the observations of the second half of April 2015. Thus simulation results demonstrate dependence on the PSD chosen, but in both cases these lead to the same conclusion: observed low values of Aβ cannot be reproduced without accounting for spectral dependence of the imaginary part.
To compare computations and observations, information on Im355 and Im532 values is needed. The recently measured refractive indices of dust, sampled in different regions of Africa, are presented by Di Biagio et al. (2019). In particular, for the countries located north and east of Senegal, the aerosol imaginary parts at 370, 470, 520 and 660 nm are of 0.0043, 0.0033, 0.0026 and 0.0013 for Mauritania and 0.0048, 0.0038, 0.0030 and 0.0024 for Mali, respectively. The highest values of lidar ratios observed in our measurements are about 60 and 80 sr at 532 and 355 nm, respectively. Corresponding imaginary parts of the CRI from Fig. 15 can be estimated as Im532=0.002–0.003 and Im355=0.005–0.006, which agrees with results presented by Di Biagio et al. (2019). Assuming Im355=0.005 and Im532=0.002, the modeled ratio S355∕S532 is about 1.44 and Aβ is about −0.75 for both AERONET and lidar-derived PSDs, which again agrees reasonably with observations. The modeling performed is very simplified; still it confirms that the observed values of the S355∕S532 ratio and Aβ can be explained by the spectral dependence of the imaginary part of the CRI.
Thus, based on our measurement results, two types of dust can be distinguished. The first type has a high S355∕S532 ratio (up to 1.5). Such a kind of dust is characterized by an increase in the imaginary part in the UV range, and it was observed, for example, during 29 March and 10 April episodes. For the second type, the ratio , so variation in the imaginary part of the refractive index between 532 and 355 nm wavelengths should be smaller than for the first type. Such dust was observed in the second half of April 2015. Both types are characterized by a high depolarization ratio, δ532 values, exceeding 30 %, so depolarization measurements at 532 nm are not capable of discriminating between these two types of dust.
The difference in the observed dust properties is probably related to the mineralogical characteristics in the source region. From the back trajectories analysis presented in Figs. 4 and 10 one can suppose that the first type of dust was transported from the north–east, while the second type from the east. In order to verify if a difference in the dust emission source region and transport takes place, we also analyzed the Infrared Difference Dust Index (IDDI) derived from the Meteosat Second Generation (MSG) geostationary satellite imagery in the thermal infrared (TIR) range. The IDDI was originally developed by Legrand et al. (1989, 2001) for the Meteosat First Generation (MFG) and is based on the impact of the airborne mineral dust on the TIR radiation emitted by the terrestrial surface. The physical principle of the IDDI derivation is in the thermal contrast between terrestrial surface and atmosphere, and the best sensitivity is found at around noontime when the surface temperature is maximal (Legrand et al., 1989). The IDDI product shows that the brightness temperature of terrestrial surface observed by satellite can be reduced by up to about 50∘ K in the presence of airborne mineral dust, and a reduction by about 10∘ K already indicates a major dust event (Legrand et al., 2001). A direct relationship between the IDDI and aerosol optical thickness in the solar spectrum and visibility was also found (Legrand et al., 2001). It should be mentioned here that the IDDI was initially developed for MFG and the absolute consistency with the IDDI values from MSG should be examined due to differences in spatial and spectral resolutions between the two sensors. However, the physical principles used for the IDDI determination are the same, and a direct application of the MFG IDDI algorithm to MSG was found to be possible. Moreover, tests showed that the absolute values of the IDDI for a coincident overlapping period of MFG and MSG are very close. Nevertheless, employment of the IDDI from MSG is indeed applicable for the required purpose in the current analysis of solely dust spatial pattern detection.
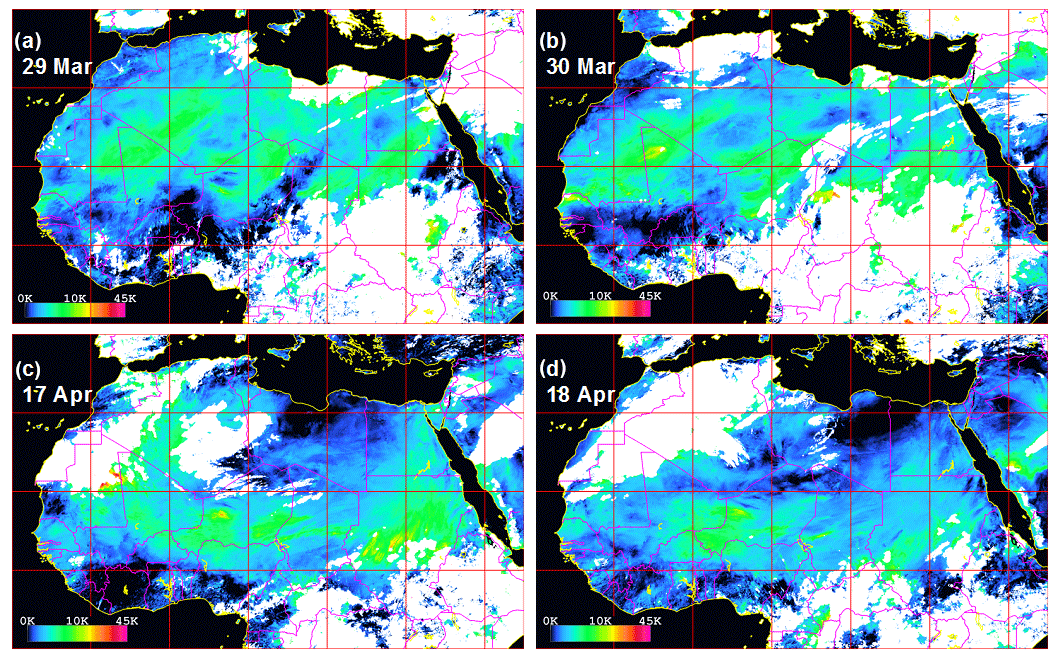
Figure 16Infrared Difference Dust Index (IDDI) derived from MSG geostationary satellite at noontime. Panels (a) and (b) show elevated IDDI values, representing airborne dust emission and transport, over central and northern Sahara on 29 and 30 March 2015. The dust transport regime is visibly changed a few days later (17, 18 April 2015; panels c, d); the elevated IDDI values are shifted to the south. The areas in white are cloud-screened pixels; the IDDI is derived only over land due to the algorithm physical principle.
The IDDI calculations, applied to the MSG images taken during the field campaign, clearly show a major dust event in northern and central Africa. The elevated IDDI values over Senegal are also visible. The IDDI images show distinguishable changes in the emission sources and transport features during the different phases of the observations. For instance, Fig. 16 shows that the dust emissions during the first phase of the event originated in south Algeria, Mauritania and Mali (examples of images from 29 and 30 March 2015). Weeks later, spatial patterns of the elevated IDDI are shifted to the south and show source regions in the south of Niger (Fig. 15c, d). Of course, attribution of emission sources mineralogy to aerosol spectral absorption is a complex task (Alfaro et al., 2004; Lafon et al., 2006; Di Biagio et al., 2017, 2019), and it is difficult to point to a specific source that could clearly explain the change in the aerosol absorbing properties observed in this study. However, the IDDI images clearly suggest a change in the dust transport regime that is consistent with the change in the dust optical properties.
During the SHADOW campaign, we had several strong smoke episodes in December 2015–January 2016, when air mass transported the products of biomass burning from the areas of intensive forest fires in the equatorial region. The relative humidity in the advected smoke layers varied from episode to episode, allowing evaluation of the RH influence on the smoke lidar ratios S355 and S532. We should keep in mind, however, that for different days the smoke particles could have different chemical compositions, so evaluated RH dependence can be considered as semiquantitative only. The spatiotemporal evolution of the particle backscattering coefficient and depolarization ratio at 532 nm, during the 14–15 December 2015 smoke episode, is given in Fig. 17. The same figure also shows the water vapor mixing ratio, a convenient tracer to identify wet air mass arriving from the equatorial region. The smoke particles are usually contained in elevated layers, being mixed with dust (Veselovskii et al., 2018). The height ranges where the smoke particles are predominant can be identified by a low depolarization ratio and enhanced WVMR. For the event considered, the smoke particles are predominant above 1500 m after midnight.
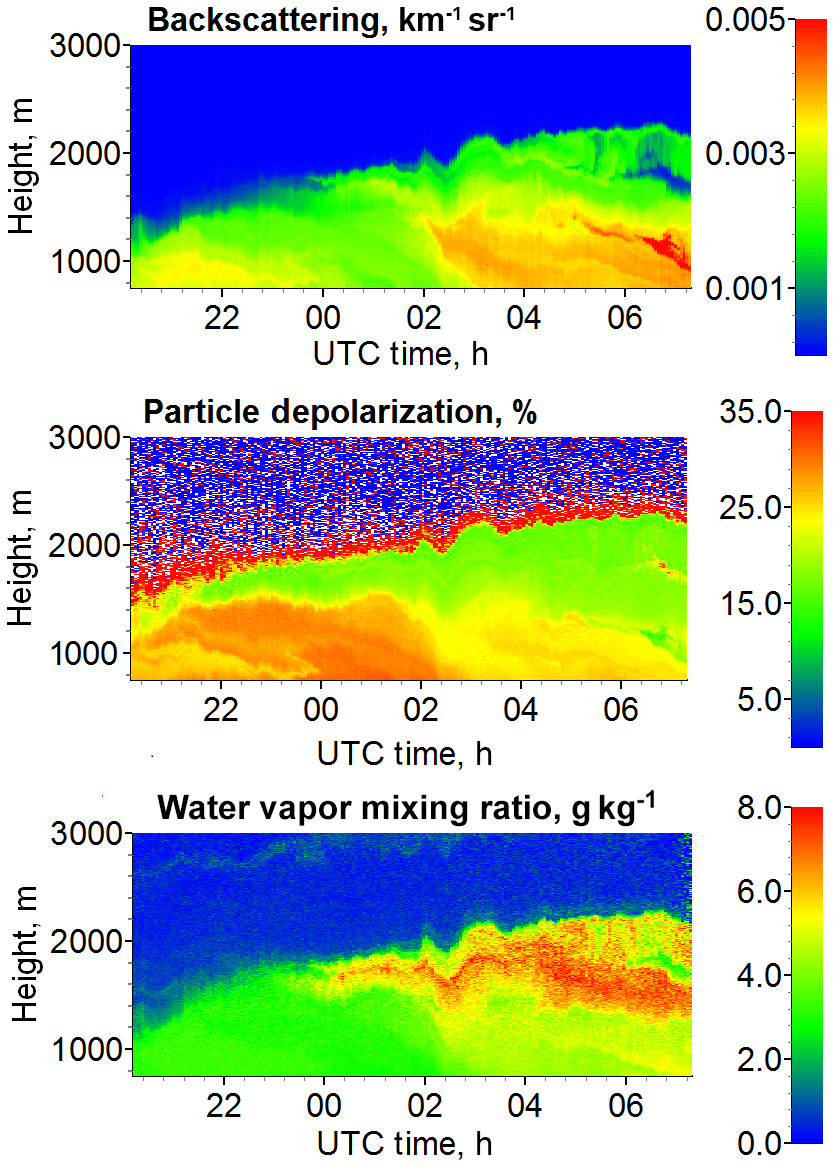
Figure 17Spatiotemporal distributions of aerosol backscattering coefficient β532, particle depolarization ratio δ532 and water vapor mixing ratio during smoke episode on the night 14–15 December 2015.
The vertical profiles of α355, α532, S355, S532, Aα and Aβ together with the water vapor mixing ratio and the relative humidity, for 15 December (04:00–06:00 UTC), are shown in Fig. 18. The same figure presents decomposition of β532 into the dust and smoke contributions, based on depolarization measurements (Tesche et al., 2011). The smoke episodes are characterized by different relative humidity within the elevated layer. On 15 December, RH is about 40 % in the 1500–2100 m range and the ratio is about 0.57 at 2000 m. The lidar ratio S532 decreases from 50 to 44 sr in a 1000–2000 m range, while S355 rises from 58 to 67 sr; thus S355 significantly exceeds S532. We should recall that lidar ratios presented in Fig. 18 are attributed to a dust–smoke mixture. In principle, we can estimate using Eq. (5), because the ratio is available. The corresponding profile obtained for assumed sr is shown in Fig. 18a (black line). is about 40 sr at 2000 m, and it is close to the measured S532 value. In the smoke layer, the extinction Ångström exponent Aα can exceed Aβ, due to the negative contribution of . In particular, on 15 December Aα is about 1.1, while Aβ is close to zero.
Table 1Lidar ratios S355 and S532 for five smoke episodes in December 2015–January 2016 and the corresponding relative humidity RH. The table also provides the height and temporal interval of observations. The contribution of the smoke particles to the total backscattering is derived from depolarization measurements.
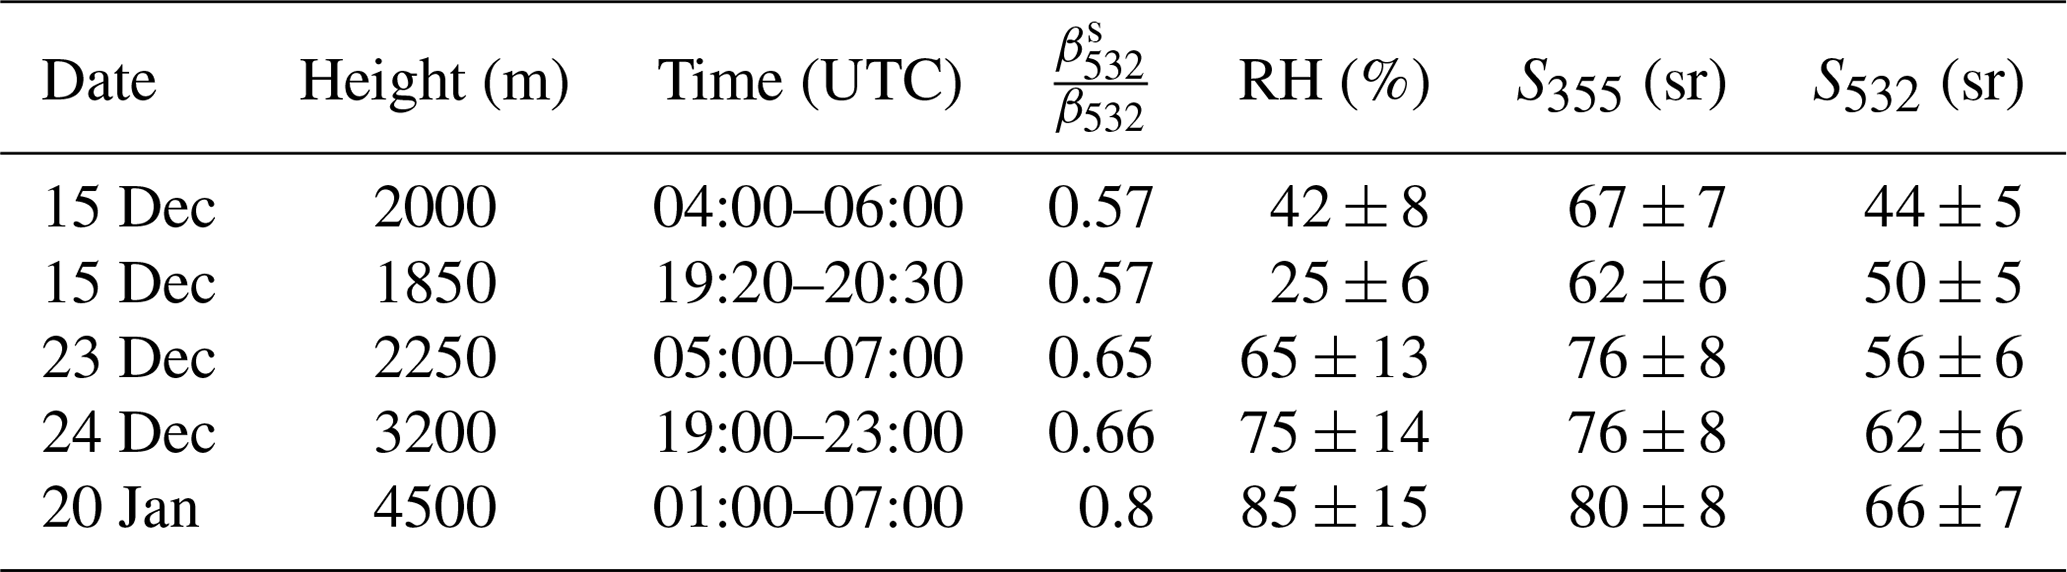
To estimate the dependence of smoke lidar ratios S355 and S532 on RH, five smoke episodes on 14–15, 15–16, 22–23 and 24–25 December 2015 and 19–20 January 2016 were analyzed. S532 and S355, together with relative humidity and the ratio, are summarized, for these episodes, in Table 1. The heights chosen correspond to the values of relative humidity close to maximum. The calculated values of RH are characterized by high uncertainties, because lidar and sonde measurements are not collocated. Estimations of the corresponding uncertainties are also given by Table 1. The lidar ratio values from Table 1 are plotted in Fig. 19 as a function of RH. These plots, however, should be taken with care, because, due to variation in chemical composition and the aging processes, results may depend not only on RH. Moreover, the dust particles occurring in the elevated layers, as discussed, can introduce an additional ambiguity in the results. Nevertheless, Fig. 19 demonstrates a clear increasing trend of S with RH, at both wavelengths. From this figure, one can also conclude that S355 always exceeds S532 and that S532 for smoke can be as small as 44±5 sr at low humidity. The small values of S532 for the fresh smoke (about 40 sr) were also reported by Burton et al. (2012).
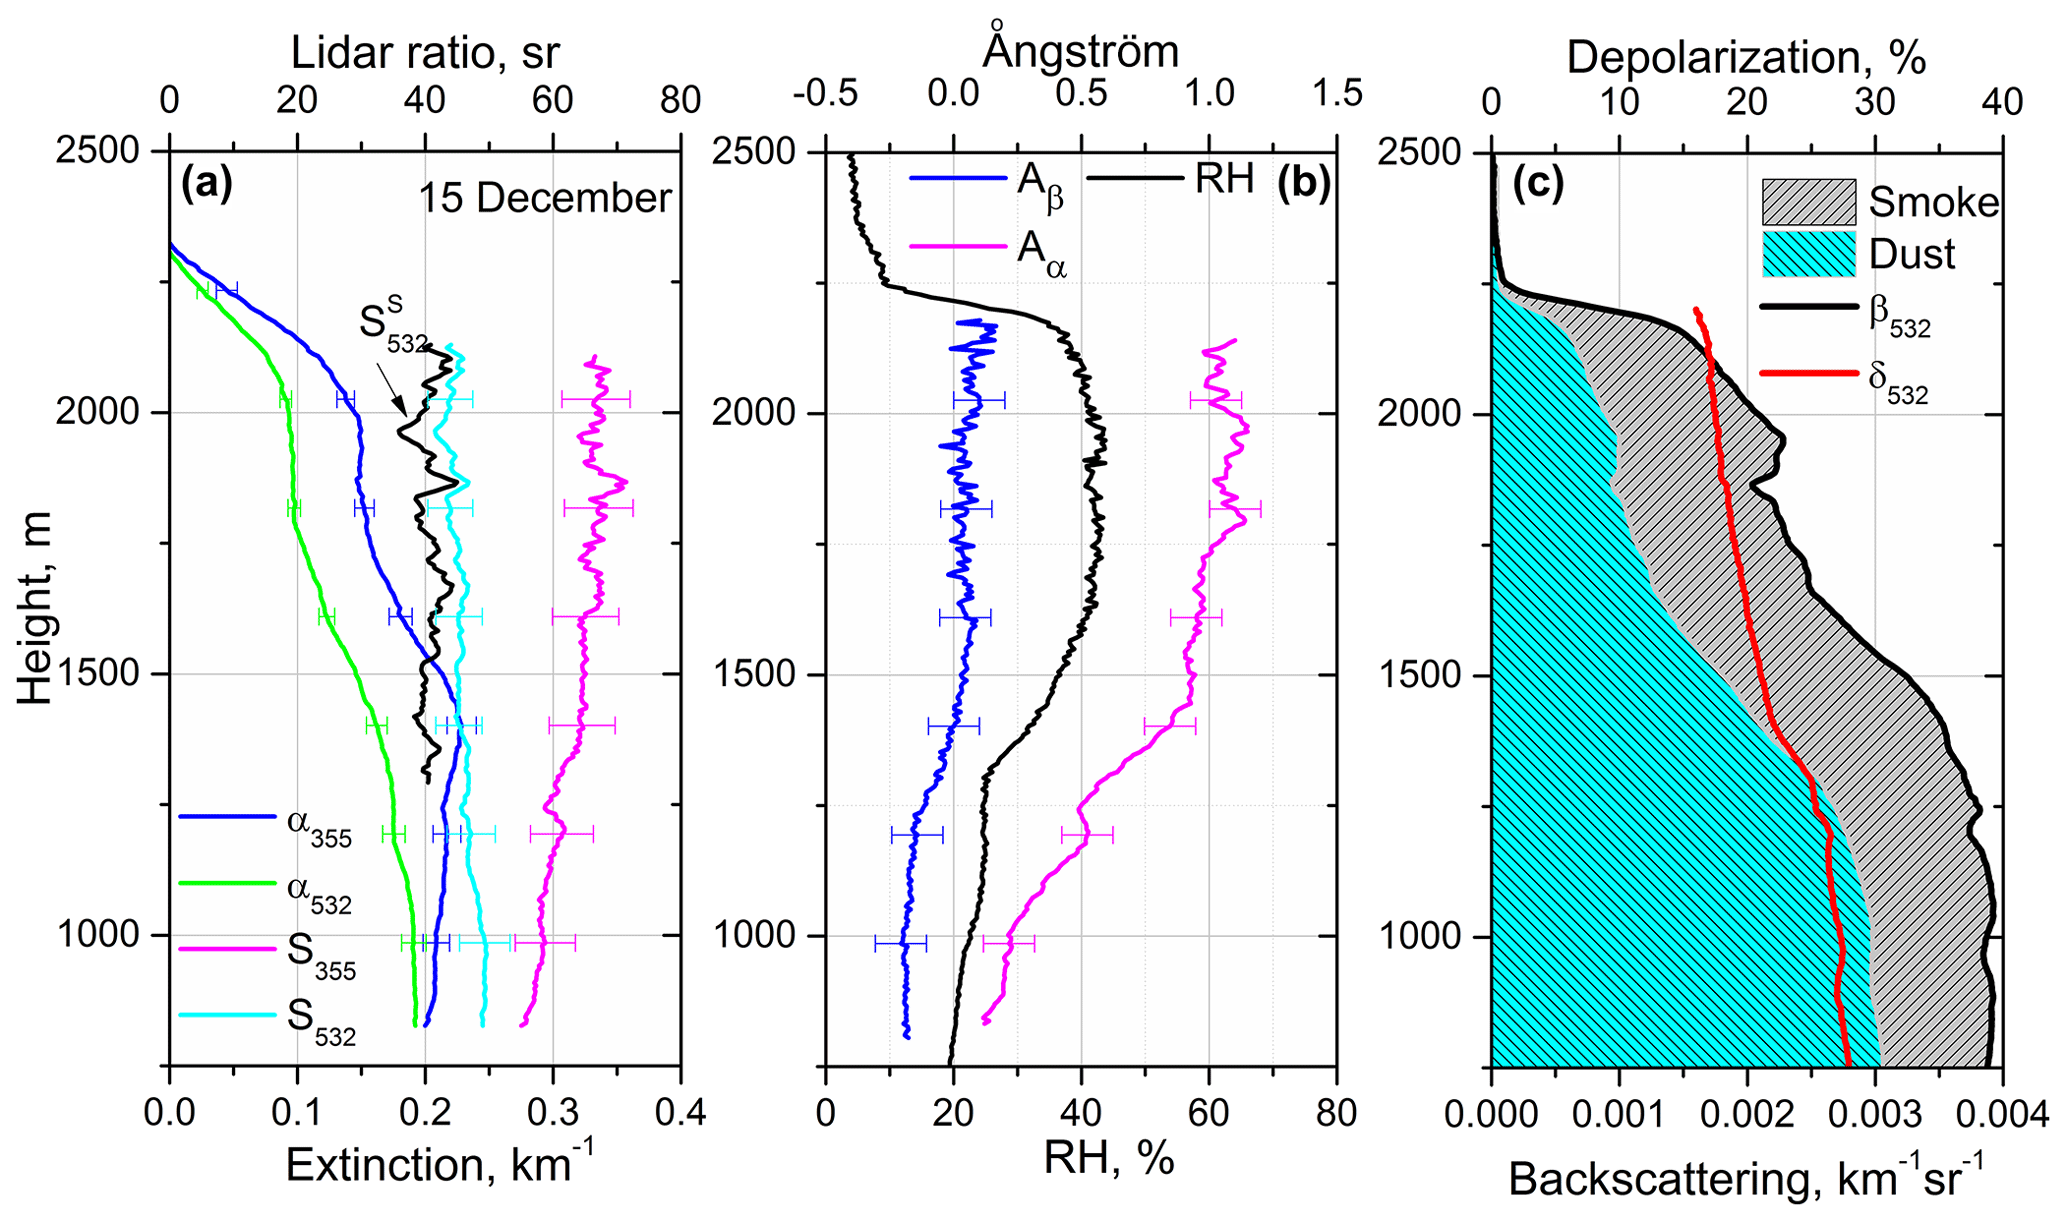
Figure 18Vertical profiles of (a) extinction coefficients (α355, α532) and lidar ratios (S355, S532); (b) extinction and backscattering Ångström exponents (Aα, Aβ) at 355–532 nm and relative humidity RH; (c) contribution of dust and smoke to β532 together with particle depolarization ratio δ532 on 15 December (04:00–06:00 UTC). Black line in plot (a) shows the lidar ratio of smoke calculated from Eq. (5).
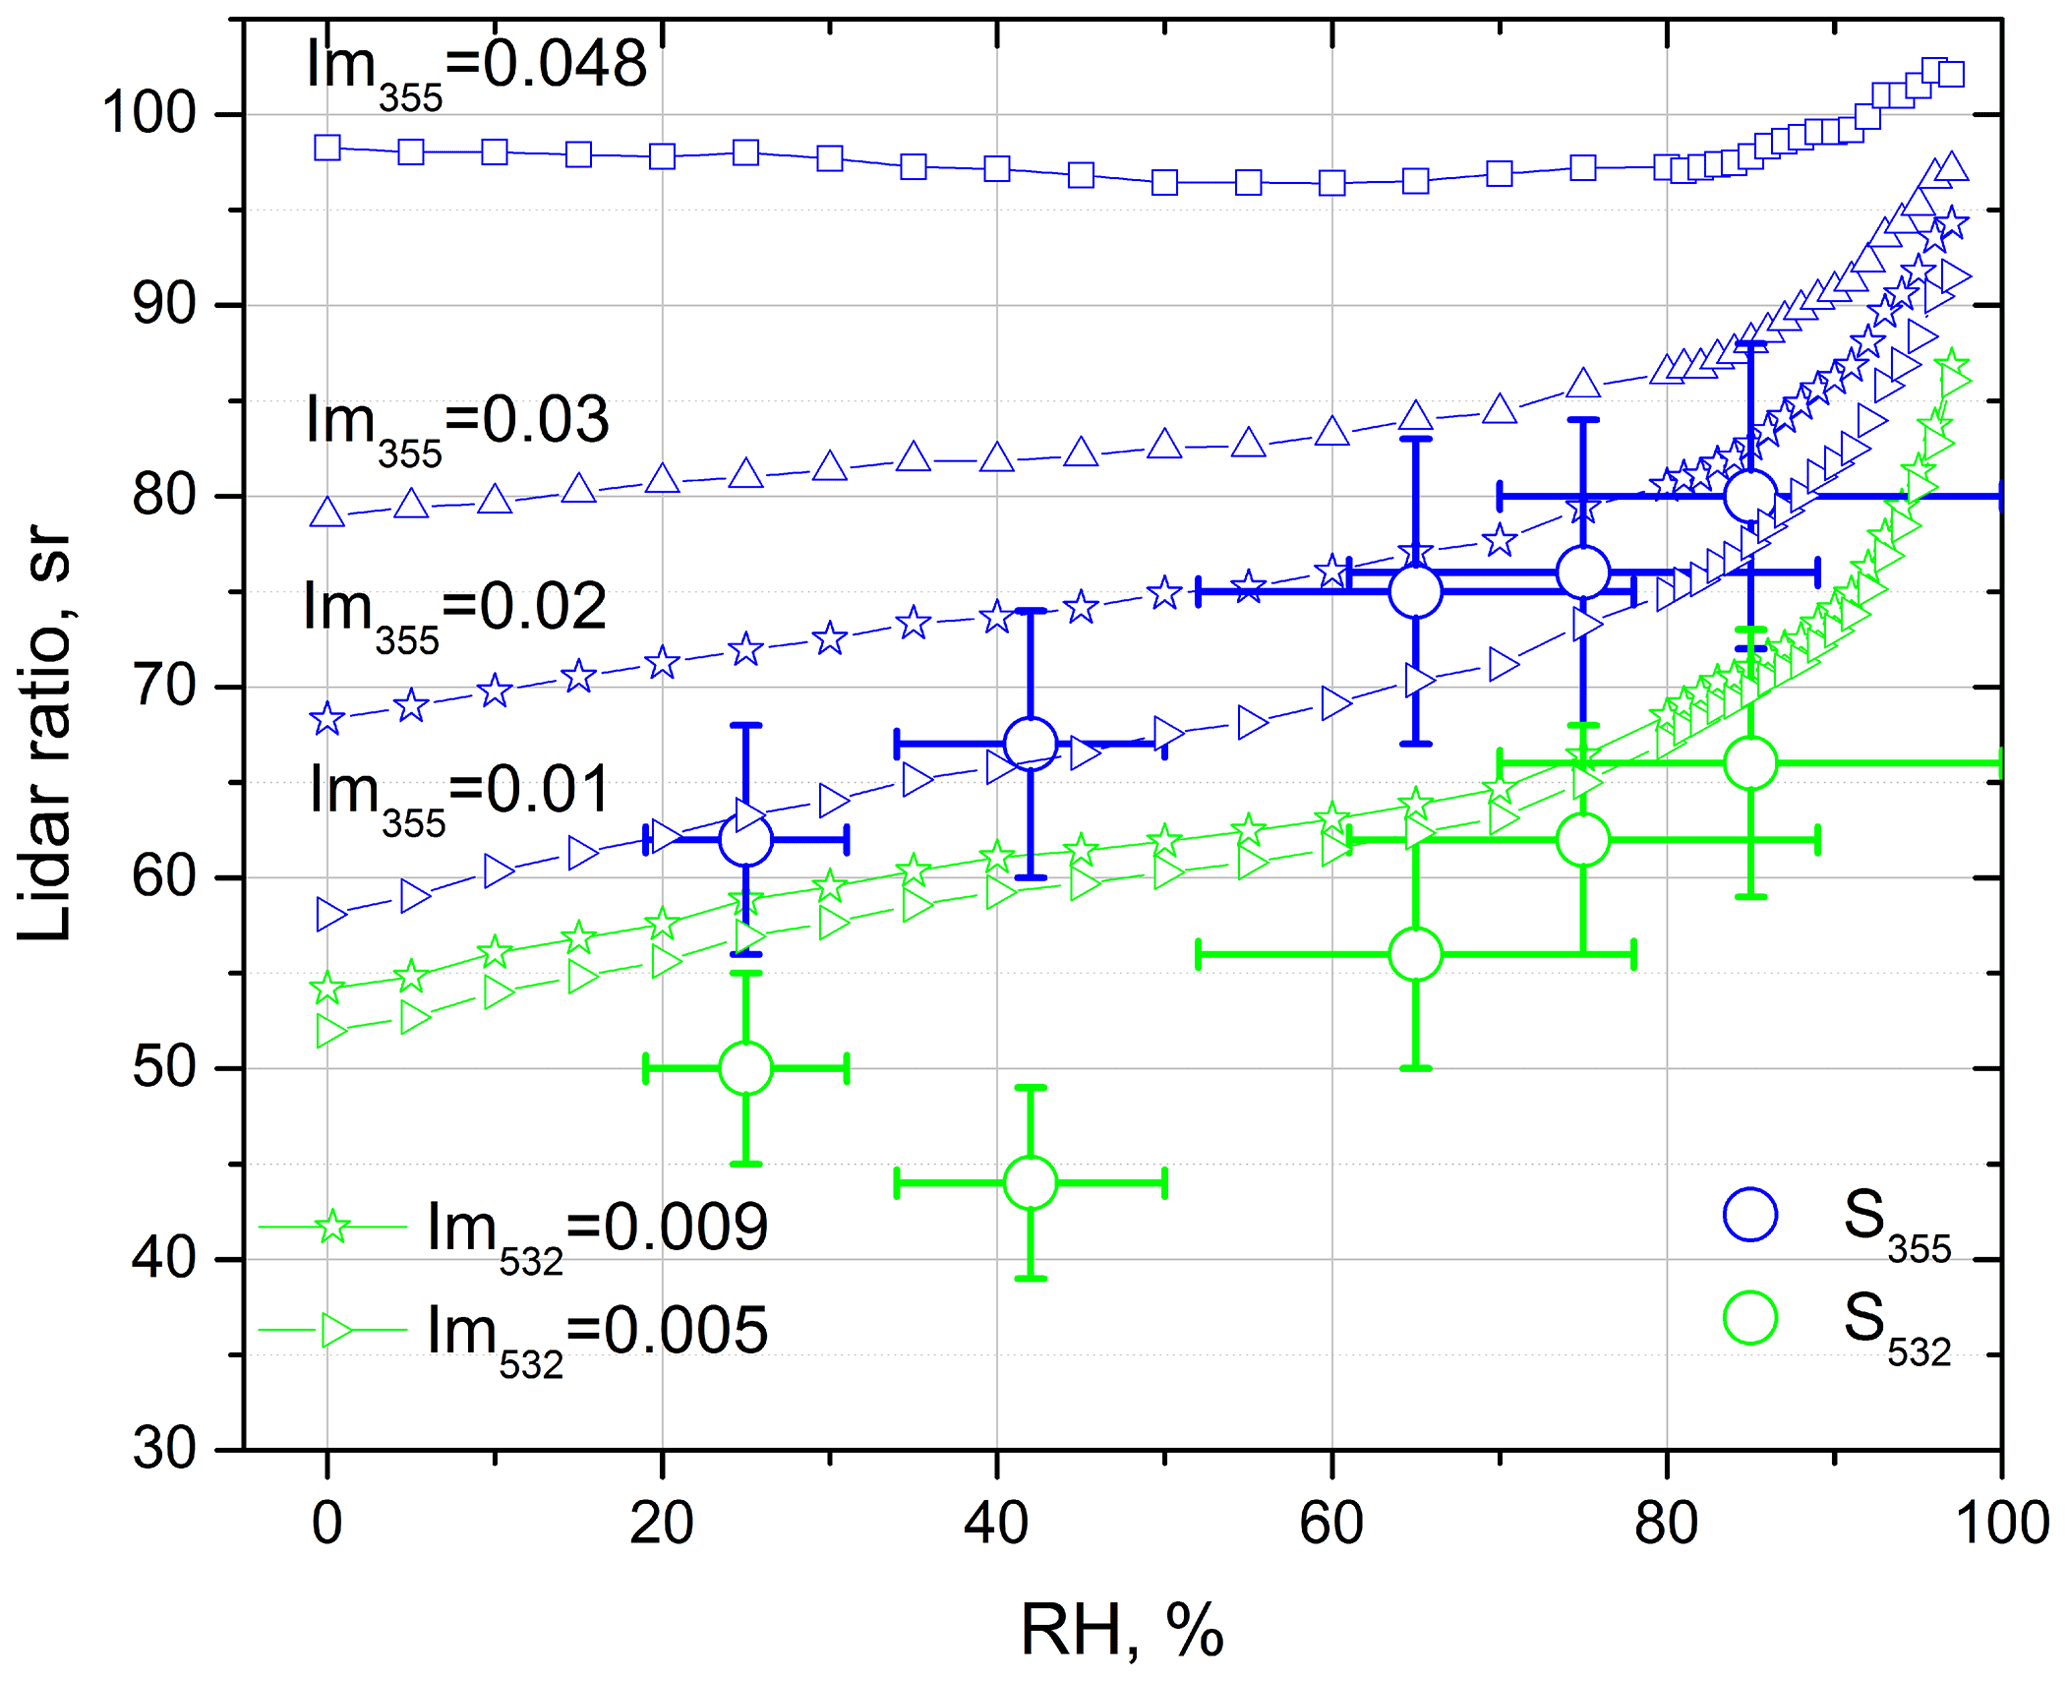
Figure 19Modeled lidar ratios of organic carbon at 355 and 532 nm (line + symbol) as a function of the relative humidity for the particle parameters used in the MERRA-2 model. At 355 nm results are given for four values of the imaginary part of dry particles: Im355=0.048, 0.03. 0.02, 0.01. At 532 nm two values, Im532=0.009 and 0.005, are considered. The scattered symbols (circles) show the lidar ratios (S355, S532) observed during five smoke episodes from Table 1.
To compare our observations with the lidar ratios used in the MERRA-2 model, we have also performed the simulation of (RH) and (RH) dependence for organic carbon (OC) based on the particle parameters and hygroscopic growth factor from the MERRA-2 model. In MERRA-2 the organic carbon is the main component of the biomass burning products. The imaginary part of the OC increases in the UV due to the presence of brown carbon (BrC), which is a subset of organic carbon with strong absorption in the UV region (Bergstrom et al., 2007; Torres et al., 2007). The majority of BrC is emitted into the atmosphere through low-temperature, incomplete combustion of biomass. In the newest development of GEOS, biomass burning OC is now emitted as a new BrC tracer species that uses Im532=0.009 and Im355=0.048 values (Hammer et al., 2016). Thus, the spectral behavior of the imaginary part of the organic carbon refractive index depends on the contribution of the BrC fraction to the primary organic carbon and on the physical–chemical processes in the smoke layer during its transportation. As a result, the spectral dependence of Im can present strong variations. In our study, the computations at 355 nm were performed for four values of the imaginary part of dry particles, Im355=0.048, 0.03, 0.02, 0.01. At 532 nm two values, Im532=0.005 and 0.009, were considered. The parameters of the dry particle size distribution, the real part of the CRI and the hygroscopic growth factor used in computations are given in Veselovskii et al. (2018). The particles are assumed to be homogeneous spheres, and an increase in the volume for every RH value (calculated from the growth factor) occurs due to water uptake. Thus both the real and the imaginary part of the CRI depend on RH.
The results of the simulations, shown in Fig. 19, demonstrate a strong dependence of the organic carbon lidar ratio on the imaginary part of dry particles and on the relative humidity. For Im355=0.048, for all RH, S355 is above 95 sr, which strongly exceeds the observed values. For lower Im355, the S355 (RH) dependence is more pronounced, and for Im355 within the range 0.01–0.02, computed S355 values are close to observed values. Computed S532 values at low RH exceed the measured ones, but for RH > 70 %, agreement between measurements and GEOS-assumed optical properties for OC becomes reasonable.
Our study shows the impact of the imaginary-part variation on the lidar-derived dust properties. In contrast to extinction, the backscattering coefficient and so the lidar ratio are sensitive to the imaginary part of the CRI. Hence, the S355∕S532 ratio can be an indicator of the imaginary refractive index enhancement in the UV. Measurements performed during the SHADOW campaign, in dust conditions, show a correlation between the decrease in Im440, derived from AERONET observations, and the decrease in the lidar-derived S355∕S532 ratio. Namely, in the second half of April 2015, S355∕S532 decreased from 1.5 to 1.0, when Im440 decreased from 0.0045 to 0.0025. Our numerical simulations confirm that observed S355∕S532 (ratio close to 1.5) and Aβ (value close to −0.75) can be due to spectral variation in the imaginary part, attributed to iron oxides contained in dust particles. The simulations were performed for the model of randomly oriented spheroids; however, we should recall that an increase in the particle lidar ratio with the imaginary part should occur for any particle shape.
Thus, April 2015 observations suggest the presence of different dust types, characterized by the distinct spectral dependence of Im(λ). The analysis of backward trajectories and the IDDI derived from the MSG geostationary satellite confirms different air mass and dust particles transport features in the beginning and at the end of April. Hence, the observed variations in S355∕S532 can be related to the source region mineralogy. During April, the particle depolarization systematically exceeded 30 %; therefore no discrimination between different types of dust was possible. Dependence of the S355∕S532 ratio on dust origin, in particular, could explain, why during SAMUM experiments no significant spectral dependence of the lidar ratio was observed.
The results presented in this study demonstrate also that, for the selected temporal interval, the dust lidar ratios may present significant variation with height. Dust of different size and mineralogical composition can have different deposition rates; hence, the complex refractive index can be height-dependent. For instance, on 1 April, the S532 decreased with height from 60 to 50 sr within a 1000–3000 m range, while the depolarization ratio exceeded 30 %. The analysis of this episode showed that variation in the lidar ratio is entirely attributed to variations in dust characteristics; the smoke aerosol contribution was insignificant. The data also demonstrate that a seemingly uniform dust layer may have quite a complex height variation. The results therefore suggest the relevance of including a varying mineralogy in radiative and climatic modeling of desert dust impacts. Dust mineralogy should also be taken into account when the possibility of the particle microphysical parameters' characterization on a base of multiwavelength lidar measurements is analyzed (Perez-Ramirez et al., 2019, 2020).
During December–January, the dry season in western Africa, our observations allowed in addition the analysis of biomass burning aerosol properties. These particles are a product of the seasonal forest fires and intensive agricultural waste combustion and can contain a substantial number of organic compounds, characterized by an enhanced imaginary part in the UV range (so-called BrC). For this aerosol type, the Im(λ) dependence should increase the lidar ratio at 355 nm and influence S355∕S532. The smoke particles can also be hydrophilic, and the lidar ratio can therefore exhibit a strong dependence on RH. Several strong smoke episodes were observed during the SHADOW campaign. While we were able to evaluate the RH profiles, the dependence of the smoke lidar ratio with RH has been estimated. The results obtained should be taken as semiqualitative only, due to possible variation in smoke particle composition from episode to episode and due to the presence of dust particles. Nevertheless, the results clearly demonstrate an increase in S532 from 44±5 to 66±7 sr and of S355 from 62±6 to 80±8 sr, when the RH increased from 25 % to 85 %.
We would like to conclude that the multiwavelengths Raman and depolarization lidar measurements in western Africa enabled quite unique and comprehensive profiling of dust and smoke spectral absorption properties. The results demonstrated a high variability in the lidar ratio and the presence of its spectral dependence. Our study is one of the first attempts to track aerosol composition variability using lidar measurements and to understand the mechanism underlying the observed variations. However, the results presented were obtained for a single region in western Africa. It is important to repeat such studies at different locations around the world, including the Middle East, central and east Asia, Australia, and North America, in order to improve our knowledge on real-world dust optical properties needed in climate-relevant atmospheric modeling.
Lidar measurements are available upon request (philippe.goloub@univ-lille.fr).
IV processed the data and wrote the paper. QH and TP performed the measurements. PG supervised the project and helped with paper preparation. MK developed software for data analysis. YD and ML analyzed the satellite data, and PC provided MERRA-2 simulations.
The authors declare that they have no conflict of interest.
The authors are very grateful to the CaPPA project (Chemical and Physical Properties of the Atmosphere), funded by the French National Research Agency (ANR) through the PIA (Programme d'Investissements d'Avenir) under contract ANR-11-LABX-0005-01. We would like to acknowledge the AERONET team at the NASA Goddard Space Flight Center in Greenbelt, MD, and Service National d'Observation PHOTONS from University of Lille, CNRS, INSU, operating under ACTRIS-FR research infrastructure, for providing high-quality data. Development of lidar data analysis algorithms was supported by the Russian Science Foundation (project 16-17-10241).
This paper was edited by Matthias Tesche and reviewed by four anonymous referees.
Alfaro, S. C., Lafon, S., Rajot, J. L., Formenti, P., Gaudichet, A., and Maille, M.: Iron oxides and light absorption by pure desert dust: An experimental study, J. Geophys. Res., 109, D08208, https://doi.org/10.01029/02003JD004374, 2004.
Amiridis, V., Balis, D. S., Kazadzis, S., Bais, A., Giannakaki, E., Papayannis, A., and Zerefos, C.: Four-year aerosol observations with a Raman lidar at Thessaloniki, Greece, in the framework of European Aerosol Research Lidar Network (EARLINET), J. Geophys. Res., 110, D21203, https://doi.org/10.1029/2005JD006190, 2005.
Ansmann, A., Wandinger, U., Riebesell, M., Weitkamp, C., and Michaelis, W.: Independent measurement of extinction and backscatter profiles in cirrus clouds by using a combined Raman elastic-backscatter lidar, Appl. Optics, 31, 7113–7131, 1992.
Ansmann, A., Petzold, A., Kandler, K., Tegen, I., Wendisch, M., Müller, D., Weinzierl, B., Müller, T., and Heintzenberg, J.: Saharan Mineral Dust Experiments SAMUM–1 and SAMUM–2: what have we learned?, Tellus, 63B, 403–429, 2011.
Bergstrom, R. W., Pilewskie, P., Russell, P. B., Redemann, J., Bond, T. C., Quinn, P. K., and Sierau, B.: Spectral absorption properties of atmospheric aerosols, Atmos. Chem. Phys., 7, 5937–5943, https://doi.org/10.5194/acp-7-5937-2007, 2007.
Burton, S. P., Ferrare, R. A., Hostetler, C. A., Hair, J. W., Rogers, R. R., Obland, M. D., Butler, C. F., Cook, A. L., Harper, D. B., and Froyd, K. D.: Aerosol classification using airborne High Spectral Resolution Lidar measurements – methodology and examples, Atmos. Meas. Tech., 5, 73–98, https://doi.org/10.5194/amt-5-73-2012, 2012.
Burton, S. P., Vaughan, M. A., Ferrare, R. A., and Hostetler, C. A.: Separating mixtures of aerosol types in airborne High Spectral Resolution Lidar data, Atmos. Meas. Tech., 7, 419–436, https://doi.org/10.5194/amt-7-419-2014, 2014.
Di Biagio, C., Formenti, P., Balkanski, Y., Caponi, L., Cazaunau, M., Pangui, E., Journet, E., Nowak, S., Caquineau, S., Andreae, M. O., Kandler, K., Saeed, T., Piketh, S., Seibert, D., Williams, E., and Doussin, J.-F.: Global scale variability of the mineral dust long-wave refractive index: a new dataset of in situ measurements for climate modeling and remote sensing, Atmos. Chem. Phys., 17, 1901–1929, https://doi.org/10.5194/acp-17-1901-2017, 2017.
Di Biagio, C., Formenti, P., Balkanski, Y., Caponi, L., Cazaunau, M., Pangui, E., Journet, E., Nowak, S., Andreae, M. O., Kandler, K., Saeed, T., Piketh, S., Seibert, D., Williams, E., and Doussin, J.-F.: Complex refractive indices and single-scattering albedo of global dust aerosols in the shortwave spectrum and relationship to size and iron content, Atmos. Chem. Phys., 19, 15503–15531, https://doi.org/10.5194/acp-19-15503-2019, 2019.
Dubovik, O., Sinyuk, A., Lapyonok, T., Holben, B. N., Mishchenko, M., Yang, P., Eck, T. F., Volten, H., Munoz, O., Veihelmann, B., van der Zande, W. J., Leon, J.-F., Sorokin, M., and Slutsker, I.: Application of spheroid models to account for aerosol particle nonsphericity in remote sensing of desert dust, J. Geophys. Res., 111, D11208, https://doi.org/10.1029/2005JD006619, 2006.
Esselborn, M., Wirth, M., Fix, A., Weinzierl, B., Rasp, K., Tesche, M., and Petzold, A.: Spatial distribution and optical properties of Saharan dust observed by airborne high spectral resolution lidar during SAMUM 2006, Tellus B, 61, 131–143, https://doi.org/10.1111/j.1600-0889.2008.00394.x, 2009.
Freudenthaler, V., Esselborn, M., Wiegner, M., Heese, B., Tesche, M., Ansmann, A., Müller, D., Althausen, D., Wirth, M., Fix, A., Ehret, G., Knippertz, P., Toledano, C., Gasteiger, J., Garhammer, M., and Seefeldner, M.: Depolarization ratio profiling at severalwavelengths in pure Saharan dust during SAMUM 2006, Tellus, 61B, 165–179, 2009.
Gasteiger, J., Wiegner, M., Groß, S., Freudenthaler, V., Toledano, C., Tesche, M., and Kandler, K.: Modeling lidar-relevant optical properties of complex mineral dust aerosols, Tellus B, 63, 725–741, 2011.
Gelaro, R., McCarty, W., Suarez, M. J., Todling, R., Molod, A., Takacs, L., Randles, C. A., Darmenov, A., Bosilovich, M. G., Reichle, R., Wargan, K., Coy, L., Cullather, R., Draper, C., Akella, S., Buchard, V., Conaty, A., Da Silva, A. M., Gu, W., Kim, G. K., Koster, R., Lucchesi, R., Merkova, D., Nielsen, J. E., Partyka, G., Pawson, S., Putman, W., Rienecker, M., Schubert, S. D., Sienkiewicz, M., and Zhao, B.: The Modern-Era Retrospective Analysis for Research and Applications, Version 2 (MERRA-2), J. Climate, 30, 5419–5454, 2017.
Giannakaki, E., van Zyl, P. G., Müller, D., Balis, D., and Komppula, M.: Optical and microphysical characterization of aerosol layers over South Africa by means of multi-wavelength depolarization and Raman lidar measurements, Atmos. Chem. Phys., 16, 8109–8123, https://doi.org/10.5194/acp-16-8109-2016, 2016.
Groß, S., Tesche, M., Freudenthaler, V., Toledano, C., Wiegner, M., Ansmann, A., Althausen, D., and Seefeldner, M.: Characterization of Saharan dust, marine aerosols and mixtures of biomassburning aerosols and dust by means of multi-wavelength depolarization and Raman lidar measurements during SAMUM 2, Tellus B, 63, 706724, https://doi.org/10.1111/j.1600-0889.2011.00556.x, 2011.
Groß, S., Freudenthaler, V., Schepanski, K., Toledano, C., Schäfler, A., Ansmann, A., and Weinzierl, B.: Optical properties of long-range transported Saharan dust over Barbados as measured by dual-wavelength depolarization Raman lidar measurements, Atmos. Chem. Phys., 15, 11067–11080, https://doi.org/10.5194/acp-15-11067-2015, 2015.
Haarig, M., Ansmann, A., Althausen, D., Klepel, A., Groß, S., Freudenthaler, V., Toledano, C., Mamouri, R.-E., Farrell, D. A., Prescod, D. A., Marinou, E., Burton, S. P., Gasteiger, J., Engelmann, R., and Baars, H.: Triple-wavelength depolarization-ratio profiling of Saharan dust over Barbados during SALTRACE in 2013 and 2014, Atmos. Chem. Phys., 17, 10767–10794, https://doi.org/10.5194/acp-17-10767-2017, 2017.
Hammer, M. S., Martin, R. V., van Donkelaar, A., Buchard, V., Torres, O., Ridley, D. A., and Spurr, R. J. D.: Interpreting the ultraviolet aerosol index observed with the OMI satellite instrument to understand absorption by organic aerosols: implications for atmospheric oxidation and direct radiative effects, Atmos. Chem. Phys., 16, 2507–2523, https://doi.org/10.5194/acp-16-2507-2016, 2016.
Haywood, J. M., Pelon, J., Formenti, P., Bharmal, N., Brooks, M., Capes, G., Chazette, P., Chou, C., Christopher, S., Coe, H., Cuesta, J., Derimian, Y., Desboeufs, K., Greed, G., Harrison, M., Heese, B., Highwood, E. J., Johnson, B., Mallet, M., Marticorena, B., Marsham, J., Milton, S., Myhre, G., Osborne, S. R., Parker, D. J., Rajot, J. L., Schulz, M., Slingo, A., Tanre, D., and Tulet, P.: Overview of the Dust and Biomass-burning Experiment and African Monsoon Multidisciplinary Analysis Special Observing Period-0, J. Geophys. Res.-Atmos., 113, 1–20, https://doi.org/10.1029/2008jd010077, 2008.
Hess, M., Koepke, P., and Schult, I.: Optical properties of aerosols and clouds: The software package OPAC, B. Am. Meteorol. Soc., 79, 831–844, 1998.
Hofer, J., Althausen, D., Abdullaev, S. F., Makhmudov, A. N., Nazarov, B. I., Schettler, G., Engelmann, R., Baars, H., Fomba, K. W., Müller, K., Heinold, B., Kandler, K., and Ansmann, A.: Long-term profiling of mineral dust and pollution aerosol with multiwavelength polarization Raman lidar at the Central Asian site of Dushanbe, Tajikistan: case studies, Atmos. Chem. Phys., 17, 14559–14577, https://doi.org/10.5194/acp-17-14559-2017, 2017.
Hofer, J., Ansmann, A., Althausen, D., Engelmann, R., Baars, H., Abdullaev, S. F., and Makhmudov, A. N.: Long-term profiling of aerosol light extinction, particle mass, cloud condensation nuclei, and ice-nucleating particle concentration over Dushanbe, Tajikistan, in Central Asia, Atmos. Chem. Phys., 20, 4695–4711, https://doi.org/10.5194/acp-20-4695-2020, 2020.
Holben, B. N., Eck, T. F., Slutsker, I., Tanre, D., Buis, J. P., Setzer, A., Vermote, E., Reagan, J. A., Kaufman, Y. J., Nakajima, T., Lavenu, F., Jankowiak, I., and Smirnov, A.: AERONET- A federated instrument network and data archive for aerosol characterization, Remote Sens. Environ., 66, 1–16, 1998.
IPCC: Climate Change 2013: The Physical Science Basis. Contribution of Working Group I to the Fifth Assessment Report of the Intergovernmental Panel on Climate Change, edited by: Stocker, T. F., Qin, D., Plattner, G.-K., Tignor, M., Allen, S. K., Boschung, J., Nauels, A., Xia, Y., Bex, V., and Midgley, P. M., Cambridge University Press, Cambridge, UK and New York, NY, USA, 1535 pp., https://doi.org/10.1017/CBO9781107415324, 2013.
Kandler, K., Lieke, K., Benker, N., Emmel, C., Küpper, M., Müller-Ebert,D., Ebert, M., Scheuvens, D., Schladitz, A., Schütz, L., and Weinbruch, S.: Electron microscopy of particles collected at Praia, Cape Verde, during the Saharan Mineral Dust Experiment: Particle chemistry, shape, mixing state and complex refractive index, Tellus, 63B, 475–496, 2011.
Kirchstetter, T. W., Novakov, T., and Hobbs, P. V.: Evidence that the spectral dependence of light absorption by aerosols is affected by organic carbon, J. Geophys. Res.-Atmos., 109, D21208, https://doi.org/10.1029/2004JD004999, 2004.
Klett, J. D.: Lidar inversion with variable backscatter/extinction ratios, Appl. Optics, 24, 1638–1643, 1985.
Lafon, S., Sokolik, I. N., Rajot, J. L., Caquineau, S., and Gaudichet, A.: Characterization of iron oxides in mineral dust aerosols: Implications for light absorption, J. Geophys. Res., 111, 1–19, https://doi.org/10.1029/2005JD007016, 2006.
Legrand, M., Bertrand, J. J., Desbois, M., Menenger, L., and Fouquart, Y.: The potential of infrared sattelite data for the retrieval of Saharan – dust optical depth over Africa, J. Appl. Meteorol., 28, 309–319, 1989.
Legrand, M., Plana-Fattori, A., and N'Doume, C.: Satellite detection of dust using the IR imagery of Meteosat 1. Infrared difference dust index, J. Geophys. Res.-Atmos., 106, 18251–18274, 2001.
Mamouri, R. E., Ansmann, A., Nisantzi, A., Kokkalis, P., Schwarz, A., and Hadjimitsis, D.: Low Arabian dust extinction-to- backscatter ratio, Geophys. Res. Lett., 40, 4762–4766, 2013.
Mattis, I., Ansmann, A., Müller, D., Wandinger, U., and Althausen, D.: Dual-wavelength Raman lidar observations of the extinction-to-backscatter ratio of Saharan dust, Geophys. Res. Lett., 29, 1306, https://doi.org/10.1029/2002GL014721, 2002.
Meng, Z., Yang, P., Kattawar, G. W., Bi, L., Liou, K. N., and Laszlo, I.: Single-scattering properties of tri-axial ellipsoidal mineral dust aerosols: A database for application to radiative transfer calculations, J. Aerosol Sci., 41, 501–512, 2010.
Mona, L., Amodeo, A., Pandolfi, M., and Pappalardo, G.: Saharan dust intrusions in the Mediterranean area: three years of Raman lidar measurements, J. Geophys. Res., 111, D16203, https://doi.org/10.1029/2005JD006569, 2006.
Nicolae D., Nemuc, A., Müller, D., Talianu, C., Vasilescu, J., Belegante, L., and Kolgotin, A.: Characterization of fresh and aged biomass burning events using multi-wavelength Raman lidar and mass spectrometry, J. Geophys. Res. 118, 2956–2965, https://doi.org/10.1002/jgrd.50324, 2013.
Nisantzi, A., Mamouri, R. E., Ansmann, A., Schuster, G. L., and Hadjimitsis, D. G.: Middle East versus Saharan dust extinction-to-backscatter ratios, Atmos. Chem. Phys., 15, 7071–7084, https://doi.org/10.5194/acp-15-7071-2015, 2015.
Papayannis, A., Amiridis, V., Mona, L., Tsaknakis, G., Balis, D., Bösenberg, J., Chaikovski, A., De Tomasi, F., Grigorov, I., Mattis, I., Mitev, V., Müller, D., Nickovic, S., Pérez, C., Pietruczuk, A., Pisani, G., Ravetta, F., Rizi, V., Sicard, M., Trickl, T., Wiegner, M., Gerding, M., Mamouri, R. E., D'Amico, G., and Pappalardo, G.: Systematic lidar observations of Saharan dust over Europe in the frame of EARLINET (2000–2002), J. Geophys. Res., 113, D10204, https://doi.org/10.1029/2007JD009028, 2008.
Papayannis, A., Mamouri, R. E., Amiridis, V., Remoundaki, E., Tsaknakis, G., Kokkalis, P., Veselovskii, I., Kolgotin, A., Nenes, A., and Fountoukis, C.: Optical-microphysical properties of Saharan dust aerosols and composition relationship using a multi-wavelength Raman lidar, in situ sensors and modelling: a case study analysis, Atmos. Chem. Phys., 12, 4011–4032, https://doi.org/10.5194/acp-12-4011-2012, 2012.
Perez-Ramirez, D., Whiteman D. N., Veselovskii, I., Colarco, P., Korenski, M., and da Silva, A.: Retrievals of aerosol single scattering albedo by multiwavelength lidar measurements: Evaluations with NASA Langley HSRL-2 during discover-AQ field campaigns, Remote Sens. Environ., 222, 144–164, 2019.
Perez-Ramirez, D., Whiteman, D. N., Veselovskii, I., Korenski, M., Colarco, P., and da Silva, A.: Optimized profile retrievals of aerosol microphysical properties from simulated spaceborne multiwavelength lidar, J. Quant. Spectrosc. Ra., 246, 106932, https://doi.org/10.1016/j.jqsrt.2020.106932, 2020.
Perrone, M. R., Barnaba, F., De Tomasi, F., Gobbi, G. P., and Tafuro, A. M.: Imaginary refractive-index effects on desert-aerosol extinction versus backscatter relationships at 351 nm: numerical computations and comparison with Raman lidar measurements, Appl. Optics, 43, 5531–5541, 2004.
Preißler, J., Wagner, F., Guerrero-Rascado, J. L., and Silva, A. M.: Two years of free-tropospheric aerosol layers observed over Portugal by lidar, J. Geophys. Res.-Atmos., 118, 3676–3686, https://doi.org/10.1002/jgrd.50350, 2013.
Randles, C. A., Da Silva, A. M., Buchard, V., Colarco, P. R., Darmenov, A., Govindaraju, R., Smirnov, A., Holben, B., Ferrare, R., Hair, J., Shinozuka, Y., and Flynn, J.: The MERRA-2 Aerosol Reanalysis, 1980 Onward. Part I: System Description and Data Assimilation Evaluation, J. Climate, 30, 6823–6850, 2017.
Rittmeister, F., Ansmann, A., Engelmann, R., Skupin, A., Baars, H., Kanitz, T., and Kinne, S.: Profiling of Saharan dust from the Caribbean to western Africa – Part 1: Layering structures and optical properties from shipborne polarization/Raman lidar observations, Atmos. Chem. Phys., 17, 12963–12983, https://doi.org/10.5194/acp-17-12963-2017, 2017.
Sakai, T., Nagai, T., Nakazato, M., Mano, Y., and Matsumura, T.: Ice clouds and Asian dust studied with lidar measurements of particle extinction-to-backscatter ratio, particle depolarization, and water-vapor mixing ratio over Tsukuba, Appl. Optics, 42, 7103–7116, 2003.
Shin, S.-K., Tesche, M., Kim, K., Kezoudi, M., Tatarov, B., Müller, D., and Noh, Y.: On the spectral depolarisation and lidar ratio of mineral dust provided in the AERONET version 3 inversion product, Atmos. Chem. Phys., 18, 12735–12746, https://doi.org/10.5194/acp-18-12735-2018, 2018.
Sokolik, I. N. and Toon, O. B.: Incorporation of mineralogical composition into models of the radiative properties of mineral aerosol from UV to IR wavelengths, J. Geophys. Res. 104, 9423–9444, 1999.
Soupiona, O., Papayannis, A., Kokkalis, P., Mylonaki, M., Tsaknakis, G., Argyrouli, A., and Vratolis, S.: Long-term systematic profiling of dust aerosol optical properties using the EOLE NTUA lidar system over Athens, Greece (2000–2016), Atmos. Environ., 183, 165–184, 2018.
Soupiona, O., Samaras, S., Ortiz-Amezcua, P., Böckmann, C., Papayannis, A., Moreira, G. A., Benavent-Oltra, J. A., Guerrero-Rascado, J. L., Bedoya-Velásquez, A. E., Olmo, F. J., Román, R., Kokkalis, P., Mylonaki, M., Alados-Arboledas, L., Papanikolaou, C. A., and Foskinis, R.: Retrieval of optical and microphysical properties of transported Saharan dust over Athens and Granada based on multi-wavelength Raman lidar measurements: Study of the mixing processes, Atmos. Environ., 214, 116824, https://doi.org/10.1016/j.atmosenv.2019.116824, 2019.
Sun, H., Biedermann, L., and Bond, T. C.: Color of brown carbon: A model for ultraviolet and visible light absorption by organic carbon aerosol, Geophys. Res. Lett., 34, L17813, https://doi.org/10.1029/2007GL029797, 2007.
Tesche, M., Ansmann, A., Müller, D., Althausen, D., Mattis, I., Heese, B., Freudenthaler, V., Wiegner, M., Eseelborn, M., Pisani, G., and Knippertz, P.: Vertical profiling of Saharan dust with Raman lidars and airborne HSRL in southern Morocco during SAMUM, Tellus B, 61, 144–164, 2009.
Tesche, M., Groß, S., Ansmann, A., Müller, D., Althausen, D., Freudenthaler, V., and Esselborn, M.: Profiling of Saharan dust and biomass-burning smoke with multiwavelength polarization Raman lidar at Cape Verde, Tellus B, 63, 649–676, https://doi.org/10.1111/j.1600-0889.2011.00548.x, 2011.
Torres, O., Tanskanen, A., Veihelmann, B., Ahn, C., Braak, R., Bhartia, P. K., Veefkind, P., and Levelt, P.: Aerosols and surface UV products from Ozone Monitoring Instrument observations: An overview, J. Geophys. Res., 112, D24S47, https://doi.org/10.1029/2007JD008809, 2007.
Veselovskii I., Kolgotin, A., Griaznov, V., Müller, D., Wandinger, U., and Whiteman, D.: Inversion with regularization for the retrieval of tropospheric aerosol parameters from multi-wavelength lidar sounding, Appl. Optics, 41, 3685–3699, 2002.
Veselovskii I., Dubovik, O., Kolgotin, A., Lapyonok, T., Di Girolamo, P., Summa, D., Whiteman, D. N., Mishchenko, M., and Tanré, D.: Application Of Randomly Oriented Spheroids For Retrieval Of Dust Particle Parameters From Multiwavelength Lidar Measurements, J. Geophys. Res., 115, D21203, https://doi.org/10.1029/2010JD014139, 2010.
Veselovskii, I., Whiteman, D. N., Korenskiy, M., Suvorina, A., and Pérez-Ramírez, D.: Use of rotational Raman measurements in multiwavelength aerosol lidar for evaluation of particle backscattering and extinction, Atmos. Meas. Tech., 8, 4111–4122, https://doi.org/10.5194/amt-8-4111-2015, 2015.
Veselovskii, I., Goloub, P., Podvin, T., Bovchaliuk, V., Derimian, Y., Augustin, P., Fourmentin, M., Tanre, D., Korenskiy, M., Whiteman, D. N., Diallo, A., Ndiaye, T., Kolgotin, A., and Dubovik, O.: Retrieval of optical and physical properties of African dust from multiwavelength Raman lidar measurements during the SHADOW campaign in Senegal, Atmos. Chem. Phys., 16, 7013–7028, https://doi.org/10.5194/acp-16-7013-2016, 2016.
Veselovskii, I., Goloub, P., Podvin, T., Tanre, D., da Silva, A., Colarco, P., Castellanos, P., Korenskiy, M., Hu, Q., Whiteman, D. N., Pérez-Ramírez, D., Augustin, P., Fourmentin, M., and Kolgotin, A.: Characterization of smoke and dust episode over West Africa: comparison of MERRA-2 modeling with multiwavelength Mie–Raman lidar observations, Atmos. Meas. Tech., 11, 949–969, https://doi.org/10.5194/amt-11-949-2018, 2018.
Wagner, R., Ajtai, T., Kandler, K., Lieke, K., Linke, C., Müller, T., Schnaiter, M., and Vragel, M.: Complex refractive indices of Saharan dust samples at visible and near UV wavelengths: a laboratory study, Atmos. Chem. Phys., 12, 2491–2512, https://doi.org/10.5194/acp-12-2491-2012, 2012.
Whiteman, D., Melfi, S., and Ferrare, R.: Raman lidar system for measurement of water vapor and aerosols in the Earth's atmosphere, Appl. Optics, 31, 3068–3082, 1992.
Xie, C., Nishizawa, T., Sugimoto, N., Matsui, I., and Wang, Z.: Characteristics of aerosol optical properties in pollution and Asian dust episodes over Beijing, China, Appl. Optics, 47, 4945–4951, 2008.