the Creative Commons Attribution 4.0 License.
the Creative Commons Attribution 4.0 License.
 | 27 Apr 2020
Modeling organic aerosol over Europe in summer conditions with the VBS-GECKO parameterization: sensitivity to secondary organic compound properties and IVOC (intermediate-volatility organic compound) emissions
Victor Lannuque
Florian Couvidat
Marie Camredon
Bernard Aumont
Bertrand Bessagnet
The VBS-GECKO (volatility basis set – Generator for Explicit Chemistry and Kinetics of Organics in the Atmosphere) parameterization for secondary organic aerosol (SOA) formation was integrated into the chemistry-transport model CHIMERE. Concentrations of organic aerosol (OA) and SOA were simulated over Europe for the July–August 2013 period. Simulated concentrations with VBS-GECKO were compared to results obtained with the former H2O parameterization implemented in CHIMERE and to observations from EMEP, ACTRIS and other observations available in the EBAS database. The model configuration using the VBS-GECKO parameterization slightly improves the performances compared to the model configuration using the former H2O parameterization. The VBS-GECKO model configuration performs well for stations showing a large SOA concentration from biogenic sources, especially in northern Europe, but underestimates OA concentrations over stations close to urban areas. Simulated OA was found to be mainly secondary (∼85 %) and from terpene oxidation. Simulations show negligible contribution of the oxidation of mono-aromatic compounds to SOA production. Tests performed to examine the sensitivity of simulated OA concentrations to hydro-solubility, volatility, aging rates and NOx regime have shown that the VBS-GECKO parameterization provides consistent results, with a weak sensitivity to changes in the parameters provided by the gas-phase mechanism included in CHIMERE (e.g., HOx or NOx concentrations). Different scenarios considering intermediate-volatility organic compound (IVOC) emissions were tested to examine the contribution of IVOC oxidation to SOA production. At the continental scale, these simulations show a weak sensitivity of OA concentrations to IVOC emission variations. At the local scale, accounting for IVOC emissions was found to lead to a substantial increase in OA concentrations in the plume from urban areas. This additional OA source remains too small to explain the gap between simulated and measured values at stations where anthropogenic sources are dominant.
- Article
(5978 KB) - Full-text XML
-
Supplement
(1280 KB) - BibTeX
- EndNote


For the past 20 years, fine particulate matter or PM2.5 (particles with diameters smaller than 2.5 µm) has been regulated due to its health impacts and the resulting costs (e.g., Lim et al., 2012; WHO Regional Office for Europe and OECD, 2015). Furthermore, fine particles degrade visibility (e.g., Han et al., 2012) and influence climate change (e.g., Boucher et al., 2013). Organic aerosol (OA) represents a large fraction of the total fine particle mass (e.g., Jimenez et al., 2009). This OA is either primary (directly emitted into the atmosphere) or secondary (formed by gas–particle partitioning of low volatility and/or highly soluble species produced during the oxidation of gaseous organic compounds) (e.g., Carlton et al., 2009; Kroll and Seinfeld, 2008). The secondary organic aerosol (SOA) dominates the primary organic aerosol (POA) in most environments (e.g., Gelencsér et al., 2007; Jimenez et al., 2009).
Chemistry-transport models (CTMs) are used to investigate and identify air quality regulation policies. Parameterizations are developed and used in CTMs to represent SOA formation. Different approaches have been followed to describe SOA formation as the two-product model (e.g., Odum et al., 1996; Schell et al., 2001), the molecular approach (e.g., Pun et al., 2002, 2003), the volatility basis set (VBS) approach (e.g., Donahue et al., 2006, 2012) or the statistical oxidation model (SOM) (e.g., Cappa and Wilson, 2012; Jathar et al., 2015). Parameterizations are constantly improved and additional processes were included in the parameterizations to improve the simulations of SOA concentrations, such as gas-phase aging of organic species (e.g., Rudich et al., 2007) and more comprehensive emissions and multiphase chemistry. Robinson et al. (2007) have indeed shown that POA provided in emission inventories is in part composed of semivolatile organic compounds (SVOCs) (existing both in particle and gas phases) and that a fraction of emitted organic compounds were missing from these inventories: the intermediate-volatility organic compounds (IVOCs) (forming SOA after several oxidation stages) (e.g., Ots et al., 2016; Robinson et al., 2007; Woody et al., 2015). Numerous experimental and modeling studies have since explored the volatility distribution of SVOCs from POA emissions and of IVOC emissions depending on the emission source (e.g., Akherati et al., 2019; Grieshop et al., 2009; Hatch et al., 2018; Jathar et al., 2017; Louvaris et al., 2017; Lu et al., 2018; May et al., 2013a, b, c; Woody et al., 2016).
New gas-phase reaction pathways are also expected to play a large role in SOA formation, like autoxidation reactions leading to a rapid formation of highly oxygenated compounds with low volatility (e.g., Crounse et al., 2013; Ehn et al., 2014; Molteni et al., 2018; Rissanen et al., 2015; Wang et al., 2017). Some SOA parameterizations already integrate these reaction pathways (e.g., Chrit et al., 2017). Other studies have highlighted the important role played by condensed-phase processes in SOA formation, in particular the reactivity of hydrophilic products in the condensed phase (e.g., Couvidat et al., 2012; Couvidat and Seigneur, 2011; Knote et al., 2014; Paulot et al., 2009; Pun et al., 2006b; Surratt et al., 2010), the oligomerization of SVOCs in the aerosol (e.g., Aksoyoglu et al., 2011; Couvidat et al., 2012; Denkenberger et al., 2007; Dommen et al., 2006; Kalberer et al., 2006; Lemaire et al., 2016; Trump and Donahue, 2014), the nonideal behavior of the organic aerosol (Couvidat et al., 2012; Couvidat and Sartelet, 2015; Pun et al., 2006b; Pye et al., 2018) or the effect of the aerosol viscosity (Couvidat and Sartelet, 2015; Shiraiwa et al., 2013). Comparisons with field observations have shown that CTMs using these parameterizations fall short to reproduce SOA concentration spatial and temporal variability (e.g., Aksoyoglu et al., 2011; Bessagnet et al., 2016; Ciarelli et al., 2016; Couvidat et al., 2012; Heald et al., 2005; Im et al., 2015; Petetin et al., 2014; Pun et al., 2006a; Solazzo et al., 2012; Tsigaridis et al., 2014; Volkamer et al., 2006).
Most of these SOA parameterizations are optimized and built on the basis of atmospheric chamber data. Experiments are, however, limited in number and are usually performed under conditions that differ from the atmosphere. In addition, SOA formation experiments can be subject to potential artifacts from chamber wall surfaces, such as aerosol and gaseous compound wall losses (e.g., La et al., 2016; Matsunaga and Ziemann, 2010; McMurry and Grosjean, 1985). Considering or not these artifacts for the parameterization development directly impacts SOA representation in air quality models (e.g., Cappa et al., 2016).
The development of the VBS-GECKO (volatility basis set – Generator for Explicit Chemistry and Kinetics of Organics in the Atmosphere) parameterization explores another track using the results of an explicit model to represent the organic gas-phase chemistry and gas–particle mass transfer instead of atmospheric chamber data. The VBS-GECKO parameterization for SOA formation (Lannuque et al., 2018a) is a VBS-type parameterization with gaseous aging. VBS-GECKO was optimized based on box modeling results using explicit oxidation mechanisms generated with the Generator for Explicit Chemistry and Kinetics of Organics in the Atmosphere (GECKO-A) modeling tool (Aumont et al., 2005; Camredon et al., 2007). Lannuque et al. (2018a) have shown that the VBS-GECKO parameterization is coherent compared to the explicit GECKO-A chemical mechanism. The reliability of the VBS-GECKO parameterization is by design directly linked to the accuracy of the GECKO-A mechanisms. The accuracy of the GECKO-A mechanisms to represent SOA formation has been evaluated against around 50 chamber experiments (Denjean et al., 2015; La et al., 2016; McVay et al., 2016; Valorso et al., 2011). Some processes relevant for SOA formation in the atmosphere can, however, be misrepresented in the GECKO-A mechanisms or are just not included (such as gaseous autoxidation reactions or the reactivity in the condensed phase). The reliability of the VBS-GECKO parameterization to represent SOA formation observed in the atmosphere has thus to be evaluated.
The objectives of this study are (i) to evaluate the behavior of the VBS-GECKO parameterization in the CTM CHIMERE (Menut et al., 2013; Mailler et al., 2017) by comparison with field measurements and previous simulations obtained with the H2O parameterization (Couvidat et al., 2012) already implemented in CHIMERE, (ii) to explore the sensitivity of simulated SOA concentrations to organic compound properties (volatility, solubility, aging rates or NOx regime) and (iii) to test the sensitivity of OA concentrations to the uncertainties in IVOC emission fluxes from traffic. The setup of the CHIMERE model and the implementation of VBS-GECKO in the CTM are described in Sect. 2. In Sect. 3, the VBS-GECKO, and is evaluated over Europe for a 2-month summer period, the sensitivity to organic compound properties is explored in Sect. 4, and the sensitivity to the uncertainties in IVOC emission fluxes from traffic is investigated in Sect. 5. Finally, results on simulated OA sources and concentrations are discussed in Sect. 6.
2.1 The CHIMERE chemical transport model
The evaluation of the VBS-GECKO parameterization and the exploration of SOA sensitivity were performed using the CHIMERE 2017 β version. This version is based on the CHIMERE 2013 version (Menut et al., 2013), which was modified to improve the representation of particles with the implementation of a new aerosol module. Details of the CHIMERE 2017 β version and its evaluation are given in Couvidat et al. (2018).
Briefly, the CHIMERE 2017 β version uses the MELCHIOR2 gas-phase chemical scheme, involving 44 species reacting according to 120 reactions. MELCHIOR2 is a reduced version of the MELCHIOR1 mechanism, obtained by the Carter's surrogate molecule method (Carter, 1990). In CHIMERE, the aerosol evolution is described by a sectional aerosol module (e.g., Bessagnet et al., 2004, 2009; Schmidt et al., 2001). The size distribution of aerosol particles is here represented using nine bins, ranging from 10 nm to 10 µm. Aerosol formation is represented in the model by nucleation for sulfuric acid (Kulmala et al., 1998), coagulation between particles (e.g., Debry et al., 2007; Jacobson et al., 1994) and condensation/evaporation via absorption according to the “bulk equilibrium” approach (e.g., Pandis et al., 1993). For inorganic species, the gas–particle equilibrium concentrations are calculated using the ISORROPIA v2.1 (Fountoukis and Nenes, 2007) thermodynamic module. For organic species, the equilibrium concentrations are calculated using the SOAP (Secondary Organic Aerosol Processor) thermodynamic module (Couvidat and Sartelet, 2015). The gaseous formation of secondary organic species able to partition between the gas and the condensed phases (so leading to SOA formation) are represented in the CHIMERE β version using the H2O mechanism. Here, the VBS-GECKO parameterization was also implemented. The H2O and VBS-GECKO organic aerosol modules are described hereafter.
The chemical speciation of emitted nonmethane volatile organic compounds (NMVOCs) is taken from Passant (2002) as described in Menut et al. (2013). POA from emission inventories are considered SVOC. A factor of 5 is applied to residential POA emissions, as wood burning emissions are underestimated in emission inventories (e.g., Denier Van Der Gon et al., 2015). This factor was shown to give satisfactory results on OA estimations (Couvidat et al., 2012, 2018). Biogenic emissions are computed with the Model of Emissions of Gases and Aerosols from Nature MEGAN 2.1 algorithm (Guenther et al., 2012). Dry deposition for gaseous organic species is described using the Wesely (1989) parameterization and according to their Henry's law constants, as described by Bessagnet et al. (2010).
2.2 The organic aerosol modules
The purpose of the comparison between the H2O and GECKO-VBS mechanisms for SOA formation is to evaluate the reliability of the VBS-GECKO parameterization. The simulations performed with CHIMERE were therefore setup using the same configuration of the model (meteorological data, emissions, deposition, inorganic and organic gaseous chemical mechanism, inorganic and organic gas–particle partitioning, etc.) but implementing either the H2O or the GECKO-VBS parameterizations. The implementation of a given parameterization for SOA formation induces anyway some differences related to the primary compounds considered and/or the processes taken into account in the parameterization. The differences between the H2O and VBS-GECKO are mentioned in the following parameterization presentation sections.
2.2.1 The H2O reference mechanism
The H2O mechanism, described in detail by Couvidat et al. (2018), considers SOA formation from the partitioning of hydrophilic species (condensing on an aqueous phase and an organic particulate phase) and hydrophobic species (condensing only on an organic particulate phase owing to their low affinity with water). Distinction between hydrophobic and hydrophilic compounds is based on their octanol/water coefficient (Pun et al., 2006b) or their partitioning between the organic and aqueous phases (Couvidat and Seigneur, 2011). H2O considers the formation of hydrophilic and/or hydrophobic species from the gaseous oxidation of isoprene, monoterpenes (α-pinene, β-pinene, the limonene and ocimene), sesquiterpenes (humulene) and mono-aromatic precursors (toluene and xylenes). Note that in H2O, limonene mechanism is used as a surrogate mechanism for ocimene (ocimene having its own OH, NO3 and O3 reaction rates). Each emitted SOA precursor is linked to a species of the H2O mechanism. POA provided by emissions inventories are split into three emitted SVOCs having different volatilities (saturation vapor pressures at 298 K of , and atm, respectively) with a fraction that follows the volatility distribution of POA emissions given by Robinson et al. (2007). In H2O, gaseous oxidation of these three compounds with OH leads to hydrophobic species with a lower volatility. No gaseous oxidation is considered for hydrophilic and hydrophobic species in H2O. Activity coefficients for the H2O species are computed with the thermodynamic model UNIFAC (UNIversal Functional group Activity Coefficient; Fredenslund et al., 1975). H2O has been evaluated over Europe (Couvidat et al., 2012, 2018) and the Paris area (Couvidat et al., 2013; Zhu et al., 2016a, b). The H2O reference mechanism is presented in Table S1 of the Supplement.
2.2.2 The VBS-GECKO parameterization
The VBS-GECKO parameterization is described in detail in a previous paper by Lannuque et al. (2018a). Briefly, VBS-GECKO is a volatility basis set (VBS) type parameterization that represents SOA formation from the partitioning of organic compounds having a low volatility onto an organic aerosol phase. The VBS-GECKO parameterization takes into account for the oxidation of a precursor k (precuk) (1) the formation of 7 VBk,i, where i is the number of the volatility bin (1 being the most volatile and 7 the less volatile) (Reactions R1, R2 and R3), (2) the gas-phase aging of the VBk,i (except for the lowest volatility bin 7) with OH redistributing the matter between the VBk,i (Reaction R4) and by photolysis leading to a loss of carbon matter (Reaction R4) and (3) the gas–particle partitioning of the precursor k (Reaction R6) and of the VBk,i (Reaction R7). The VBS-GECKO follows this structure for a given precursor k:
In VBS-GECKO, the production and gaseous aging of the VBk,i for a precursor k are adjusted by stoichiometric coefficients (, , , , for Reactions R1 to R4, respectively), which depend on the NOx regime. The formation of more volatile and less volatile bins can be assimilated to fragmentation and functionalization processes, respectively. The stoichiometric coefficients depend on the NOx according to the reaction rate ratio (RRR) of RO2 with NO:
where (set to cm3 molec.−1 s−1 according to Jenkin et al., 1997 at 298 K) and (set to cm3 molec.−1 s−1 according to Boyd et al., 2003, assuming a large carbon skeleton for RO2 at 298 K) are the rate constants for the reactions of the peroxy radicals with NO and HO2, respectively, and [NO] and [HO2] are the concentration of the radicals. The entire RRR range is covered by linear interpolation of the coefficients between the two closest tabulated values. The photolysis is considered a limiting process for SOA formation, leading to a loss of matter. The photolysis rates of the VBk,i are based on the acetone one multiplied by an optimized factor φk, different for each precursor k. Precursors and VBk,i condense on an organic particulate phase according to an equilibrium between the gas and the organic particulate phase that follows the Raoult's law (Reactions R6 and R7).
Table 1List of the VBS-GECKO species and associated properties.
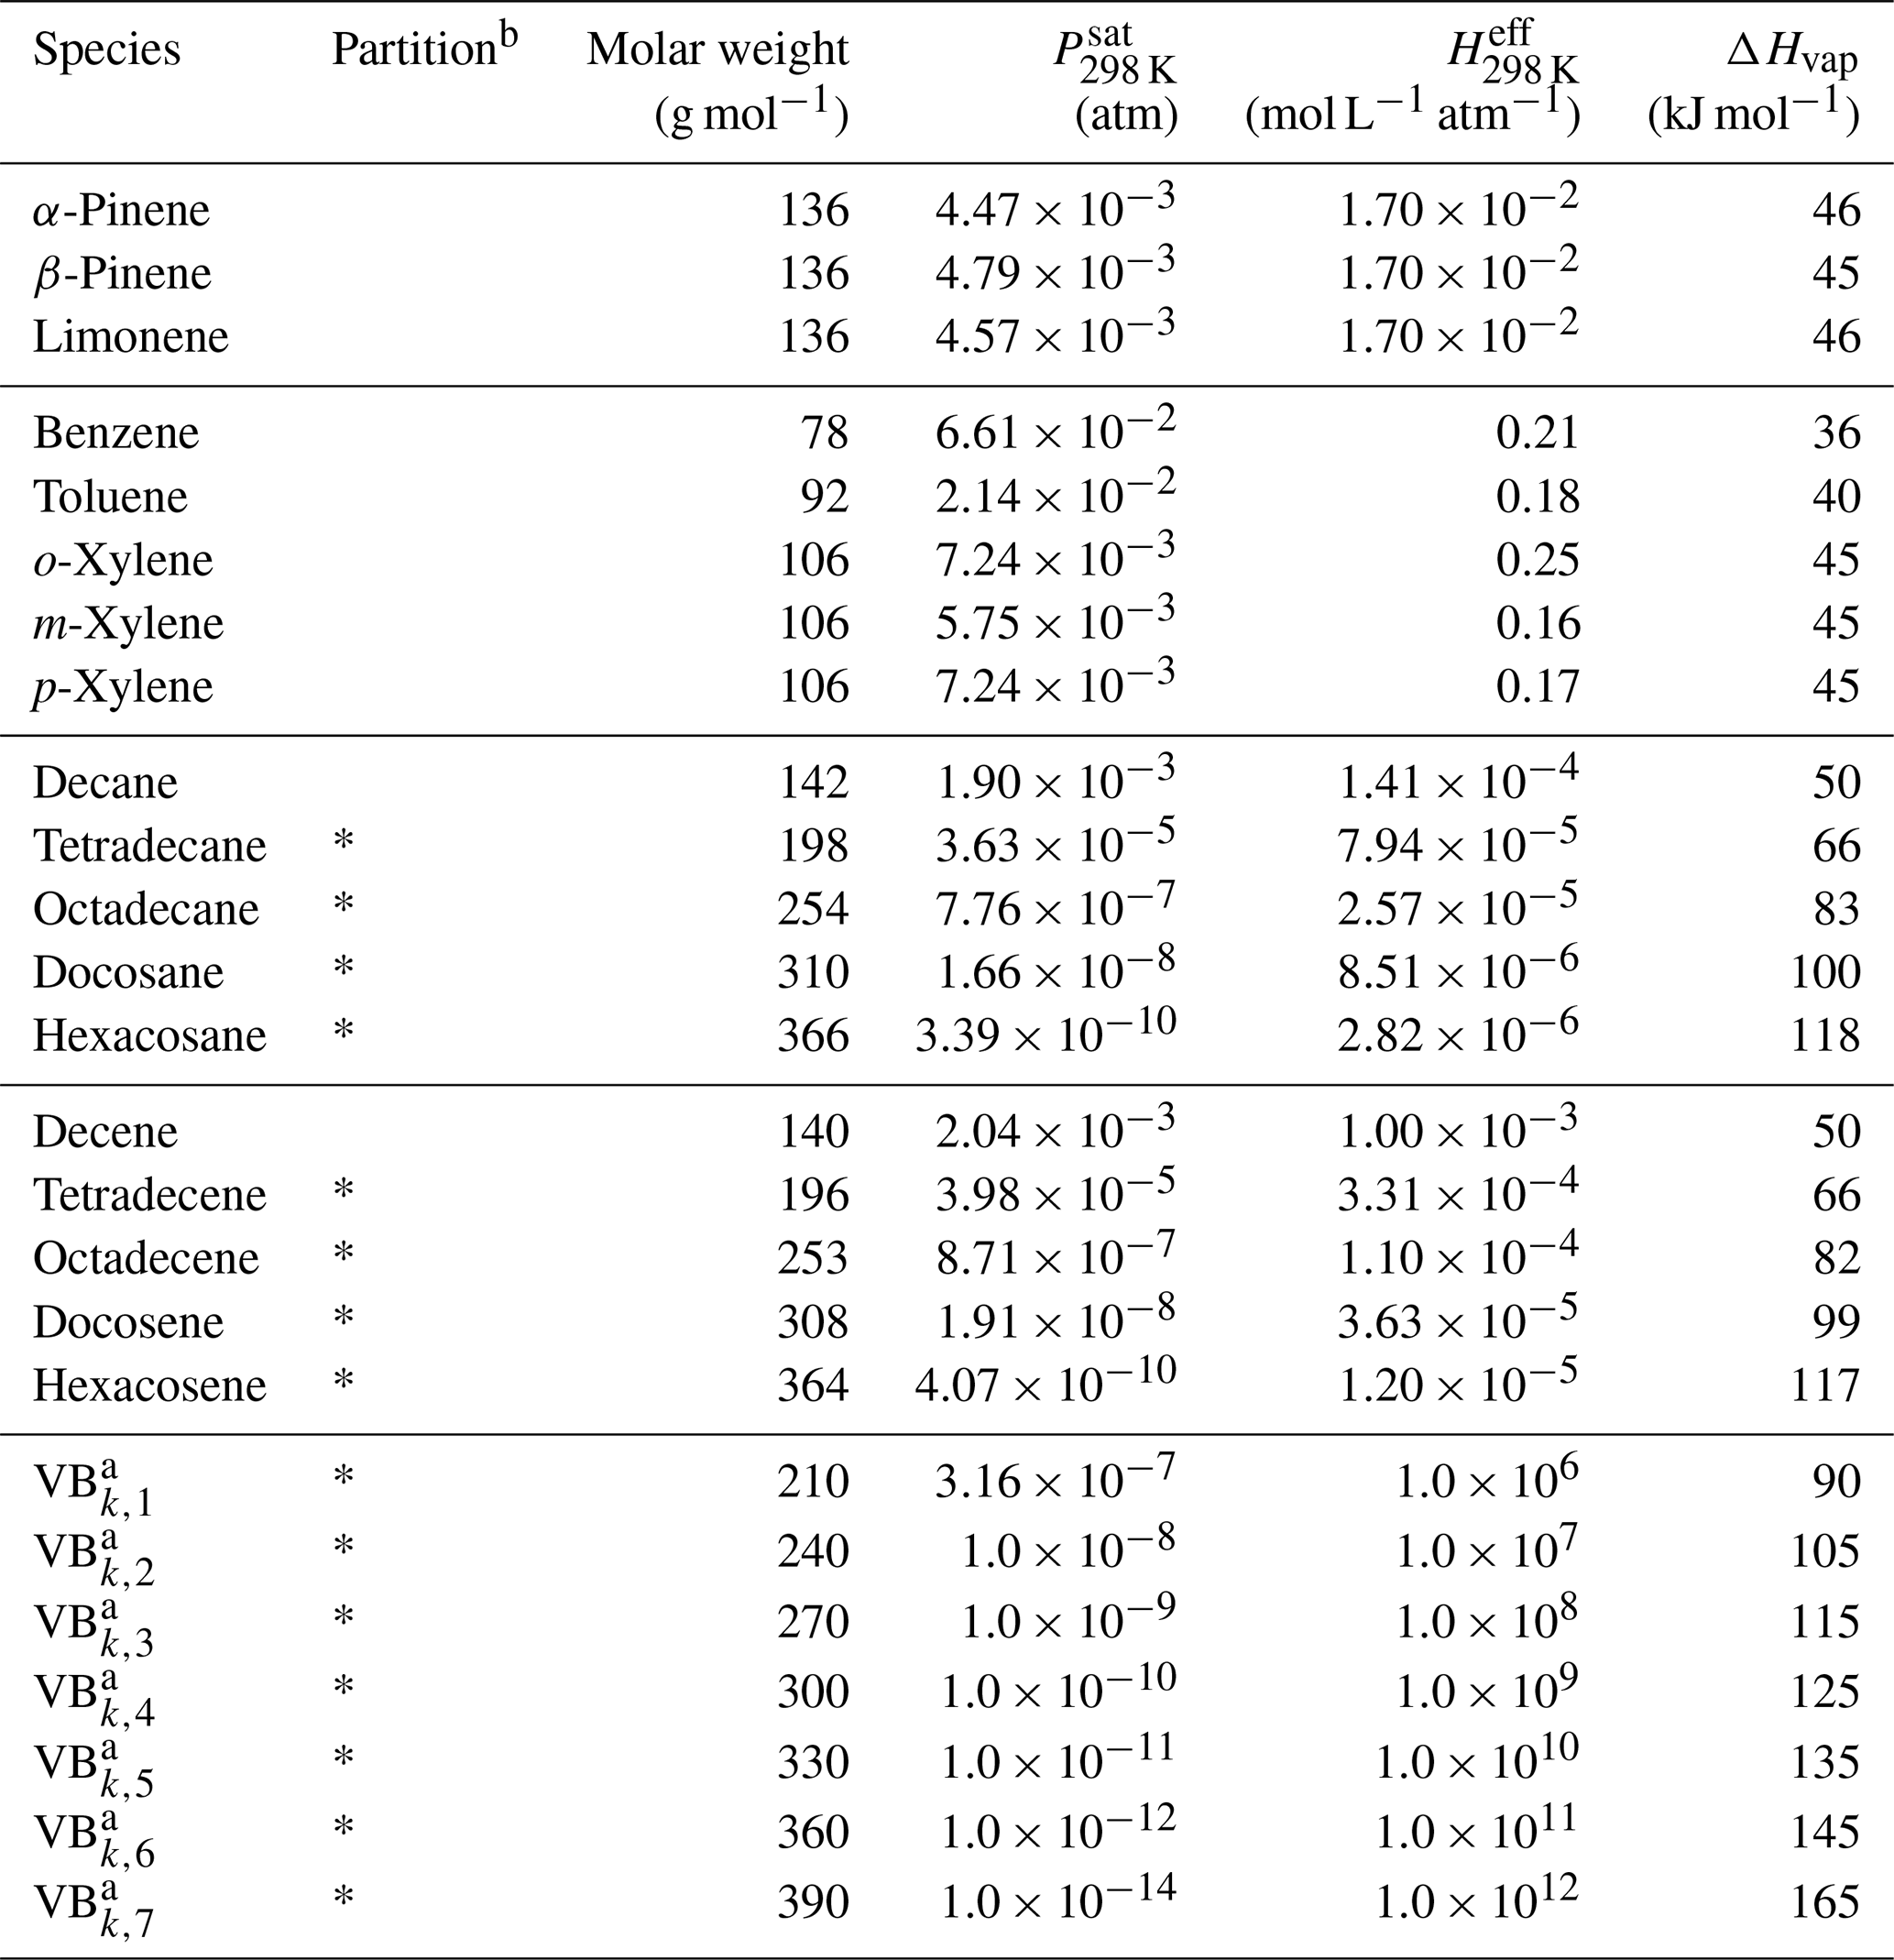
a Properties of the bins do not depend on the precursor k (see Lannuque et al., 2018a). b Gas–particle partitioning is implemented in CHIMERE for species with a * only.
The properties of the 7 VBk,i were considered to be independent of the precursor k and set for each volatility bin i to the mean values simulated with explicit GECKO-A simulations. Table 1 gives the molar weights (Mw), saturation vapor pressures (Psat) at 298 K, effective Henry's law constants (Heff) at 298 K and vaporization enthalpies (ΔHvap) used for each VBk,i VBS-GECKO species. The stoichiometric coefficients and factors φk were optimized on explicit GECKO-A simulations of gas-phase oxidation and SOA formation. The stoichiometric coefficients were optimized for five RRR values: 0, 0.1, 0.5, 0.9 and 1 (Lannuque et al., 2018a). Precursors considered in the current VBS-GECKO parameterization are mono-aromatic compounds (benzene; toluene; and o-, m-, and p-xylenes) and n-alkanes (decane, tetradecane, octadecane, docosane and hexacosane) reacting with OH and monoterpenes (α-pinene, β-pinene and limonene) and linear 1-alkenes (decene, tetradecene, octadecene, docosene and hexacosene) reacting with OH, O3 and NO3. Note that (1) the parameterization does not represent SOA formation from the partitioning of hydrophilic species, (2) recently identified chemical processes, such as autoxidation reactions or acid-catalyzed pathways, not included in the GECKO-A mechanisms, are thus not considered in the VBS-GECKO parameterization and (3) the high value of the reaction rate of the VBk,i ( cm3 molec.−1 s−1) was fixed before optimization and is compensated by lower or higher values of optimized coefficients (see details in Lannuque et al., 2018a). Tables of optimized stoichiometric coefficients are available in the supplementary material of Lannuque et al. (2018a).
Table 2Distribution of the NMVOC emission in the VBS-GECKO species.
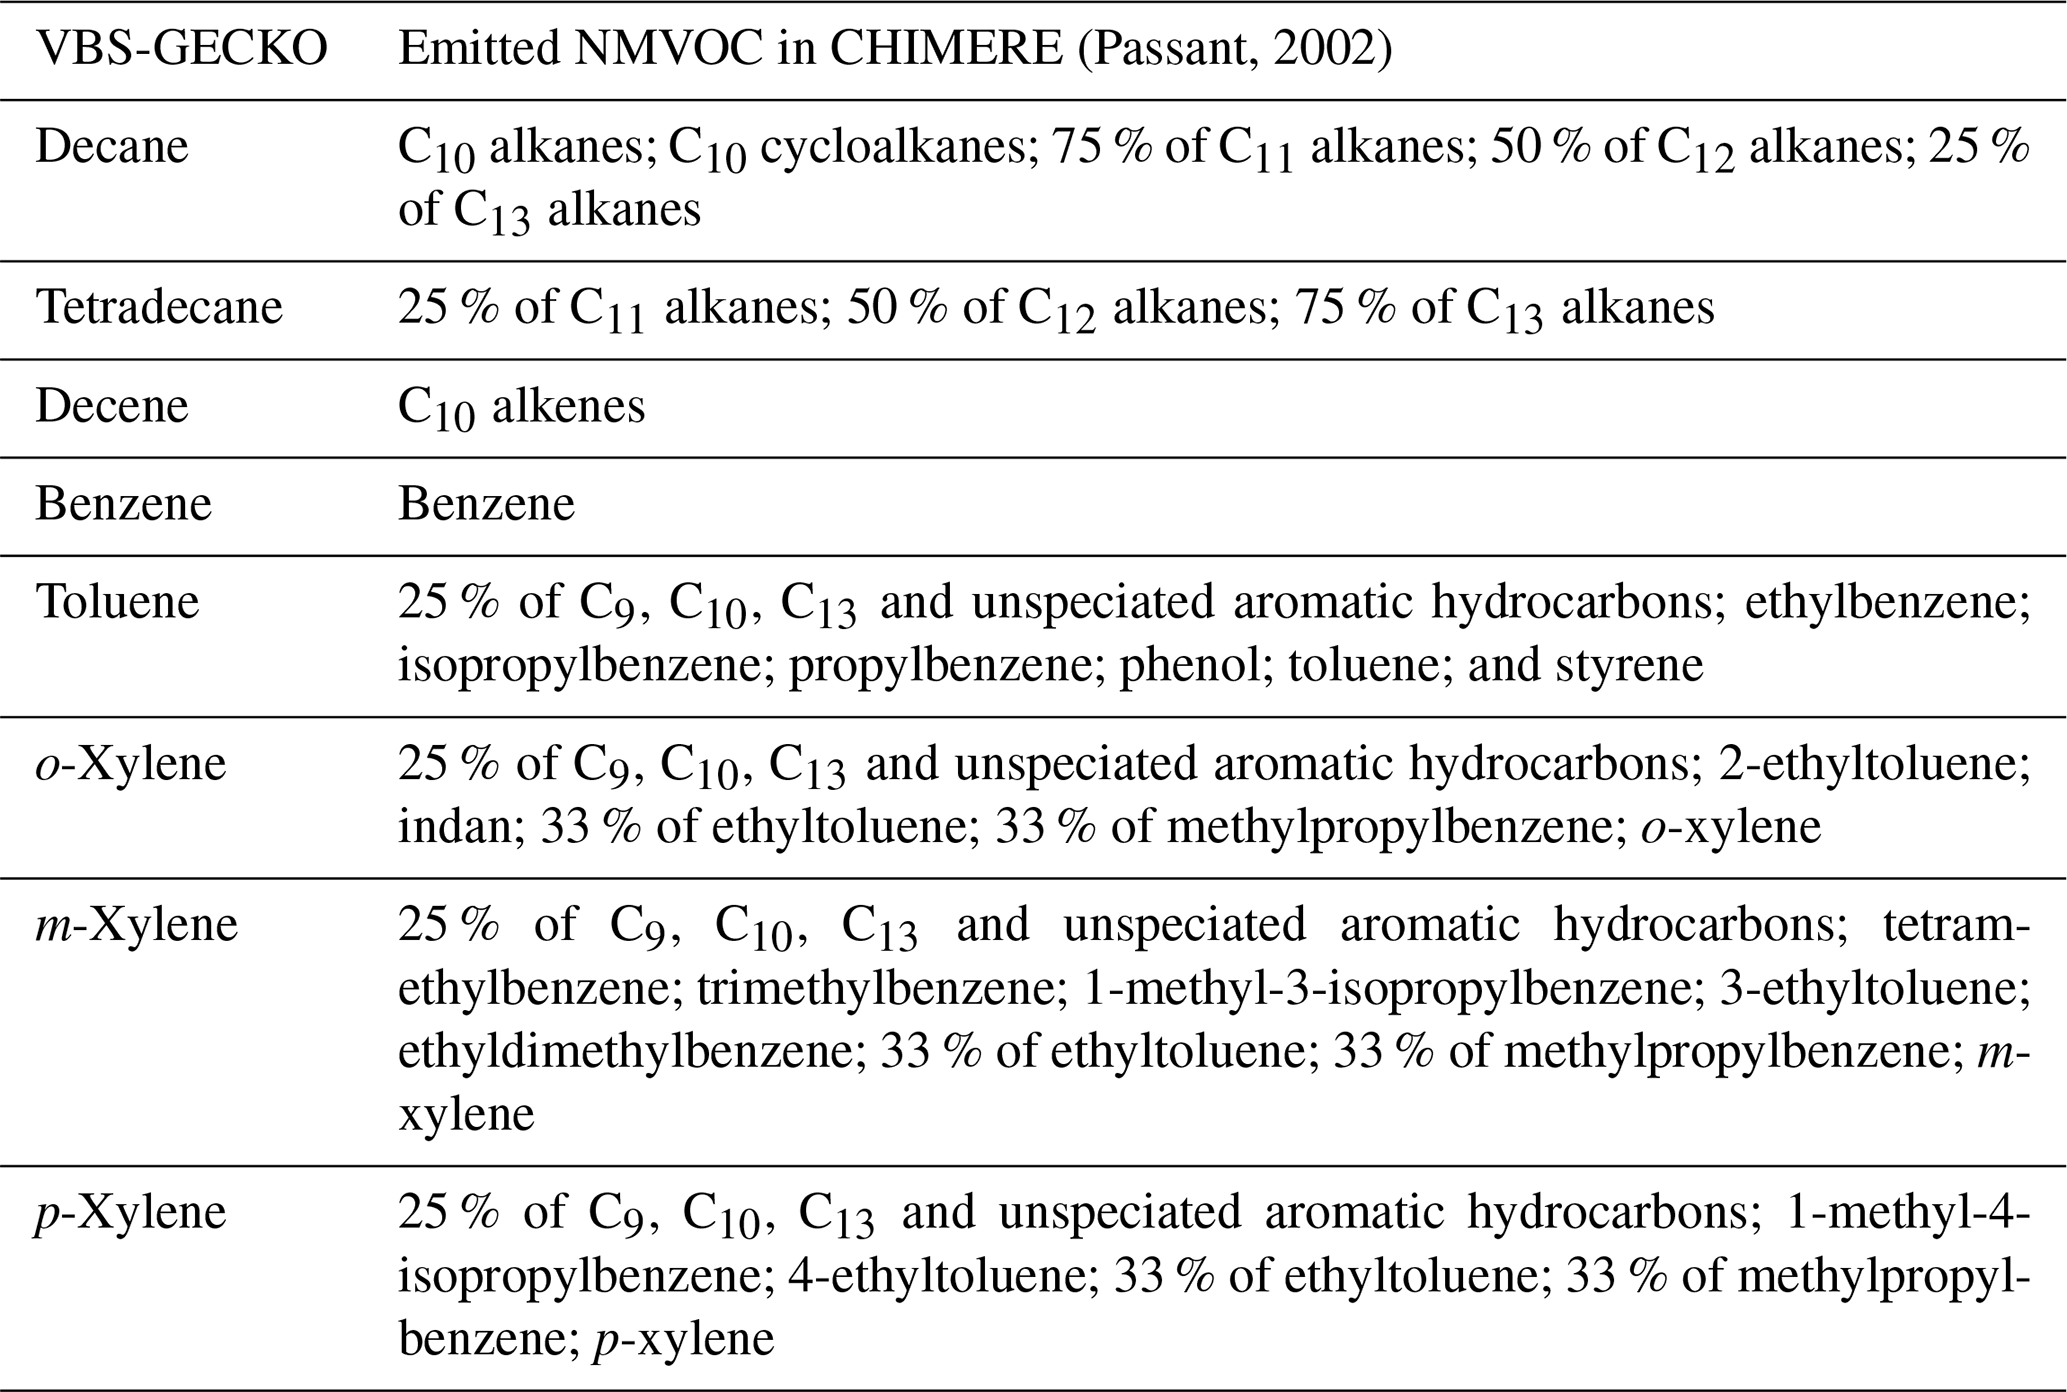
For SOA production from NMVOC oxidation, the former H2O parameterization in CHIMERE was replaced by the VBS-GECKO parameterization for terpenes and mono-aromatic compounds. The VBS-GECKO mechanisms were also implemented in CHIMERE for SOA formation from C10 to C13 alkanes and alkenes, gaseous species usually not considered in 3D models as SOA precursors. Each emitted SOA precursor not present in the VBS-GECKO was linked to a VBS-GECKO species. As in the H2O mechanism, the VBS-GECKO parameterization for limonene was used as a surrogate mechanism for ocimene. The VBS-GECKO parameterizations for benzene; toluene; and o-, m-, and p-xylenes were also used as surrogate mechanisms for other emitted mono-aromatic compounds according to their SOA yield and reactivity with OH. The n-dodecane and tetradecane VBS-GECKO species were used to lump emitted alkanes with 10 to 13 atoms of carbon, according to their carbon chain length. The VBS-GECKO mechanism for 1-decene was applied for all emitted C10 alkenes. The lumping scheme between emitted NMVOCs and VBS-GECKO species is given in Table 2. The current VBS-GECKO version does not represent SOA production from the oxidation of isoprene and sesquiterpenes. The H2O parameterizations for isoprene and humulene were therefore left unchanged in CHIMERE to account for this SOA production. For SOA production for SVOC oxidation distributed from POA emissions, the H2O approach was kept unchanged (i.e., distribution of POA emissions into three SVOC species and representation of their SOA production using the H2O mechanism). In CHIMERE, RRR is calculated in each box at each chemical time step following Eq. (1). Activity coefficients for the condensation of the VBS-GECKO species into the aerosol particulate phase are fixed to 1 (i.e., ideality of the organic particulate phase is considered). This implementation of the VBS-GECKO in CHIMERE was selected here as the reference configuration and is denoted ref-VBS-GECKO hereafter. The ref-VBS-GECKO mechanism is presented in Table S2 in the Supplement and evaluated in Sect. 3.
Changes were then applied to this reference configuration to perform sensitivity tests of SOA formation on secondary organic compound properties (solubility, reactivity with OH, NOx∕HO2 condition dependency and volatility) or IVOC emission fluxes from traffic. For a better readability, the details of these modifications are presented for each sensitivity test in Sect. 4 (properties) and Sect. 5 (IVOC emissions).
2.3 Simulation setup and field measurements
The model was run to simulate the concentrations of OA over Europe (from 25∘ W to 45∘ E in longitude and from 30 to 70∘ N in latitude) with a horizontal resolution of during the July–August 2013 period, SOA formation being expected to be important during summertime. Meteorology was obtained from the Integrated Forecasting System (IFS) model of the European Centre for Medium-Range Weather Forecasts (ECMWF). This meteorology has been evaluated in Bessagnet et al. (2016) for the model intercomparison project EURODELTA-III. ECMWF-IFS in the EURODELTA-III project has been shown to be one of the most reliable models to represent meteorological conditions over Europe. Anthropogenic emissions of gases and particles were taken from the European Monitoring and Evaluation Programme (EMEP) inventory (methodology described in Vestreng, 2003) and boundary conditions were generated from the Model for OZone And Related chemical Tracers (MOZART v4.0; Emmons et al., 2010). Wildfire emissions were not considered.
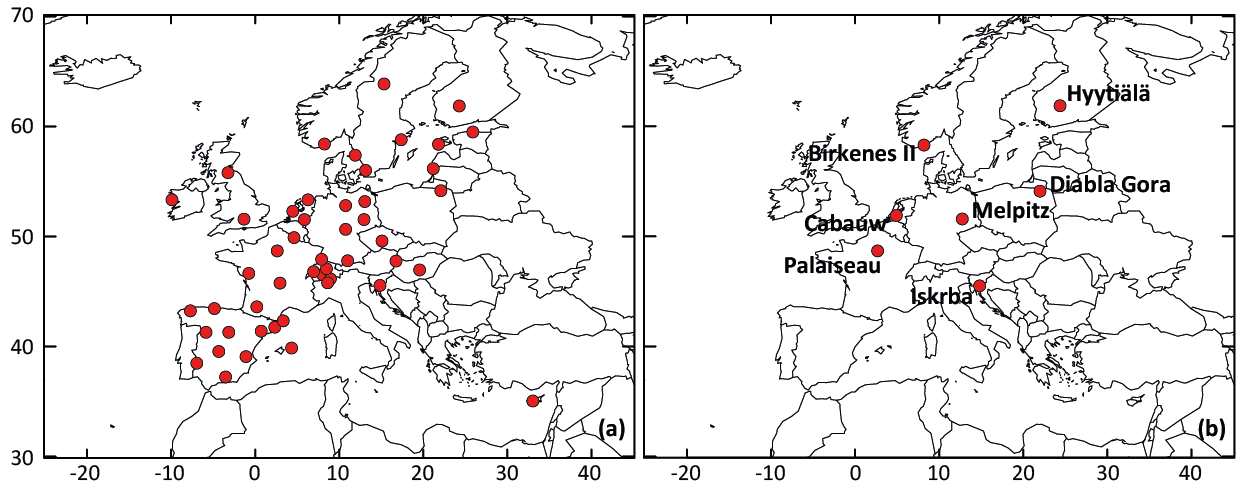
Figure 1Location of rural background stations used for (a) the statistical evaluations and (b) time series comparisons.
The VBS-GECKO mechanism was evaluated by comparing the simulated results to the H2O mechanism and particulate-phase measurements available in the EBAS database (http://ebas.nilu.no/, last access: 20 April 2020). EBAS is a database hosting observation data of atmospheric chemical composition and physical properties in support of a number of national and international programs ranging from monitoring activities to research projects. EBAS is developed and operated by the Norwegian Institute for Air Research (NILU). This database is populated, for example, by the EMEP measurements (Tørseth et al., 2012) or the Aerosols, Clouds and Trace gases Research Infrastructure (ACTRIS; http://www.actris.eu/, last access: 20 April 2020) ones. The 48 rural background stations provide measurements for fine particulate matter and were thus selected here for a statistical evaluation: 36 stations for PM2.5, 13 for OC (organic carbon in PM2.5, obtained by filter calcinations) and 6 for OM (organic matter in PM1, obtained with aerosol chemical speciation monitors (ACSMs)). For the comparisons with OC measurements, the OM : OC ratio of the VBS-GECKO volatility bins were assumed to be equal to 1.8, in agreement with typical observed values given by Canagaratna et al. (2015). The location of the selected stations is shown in Fig. 1a. Among these stations, seven stations were used for time series comparisons:
-
the Cabauw (NL0644R, the Netherlands), Melpitz (DE0044R, Germany) and Palaiseau (FR0020R, SIRTA, France) rural background stations, located in areas dominantly impacted by anthropogenic air masses (see Fig. S1 presenting the mean of the simulated ratios between toluene and α-pinene emission fluxes for the studied period).
-
the Birkenes II (NO0002R, Norway), Diabla Gora (PL0005R, Poland), Hyytiälä (FI0050R, Finland) and Iskrba (SI0008R, Slovenia) rural background stations, located in areas dominantly impacted by biogenic emissions (see Fig. S1).
These seven stations were selected among the 48 background station, because the measurements at the stations provide (1) direct information on the organic fraction of fine particles, i.e., OM and OC measurements, and (2) enough data over the studied period to perform time series comparisons. The location of the seven selected stations is shown in Fig. 1b.
Various statistical indicators were computed to evaluate the VBS-GECKO mechanism, including the root mean square error (RMSE), the correlation coefficient, the mean fractional error (MFE) and the mean fractional bias (MFB). MFB and MFE are calculated as
where and are the simulated and observed, respectively, concentrations of the studied component at the time i and N being the number of available in situ measurement values. Boylan and Russell (2006) defined two criteria to evaluate the performances of a model. The model performance criteria (described as the level of accuracy that is considered to be acceptable for modeling applications) is reached when MFE ≤75 % and %, whereas the performance goal (described as the level of accuracy that is considered to be close to the best values a model can be expected to achieve) is reached when MFE ≤50 % and %. These criteria are currently used to evaluate the reliability of the models (e.g., Ciarelli et al., 2017; Couvidat et al., 2018; Lecœur and Seigneur, 2013; Mircea et al., 2019).
Figure 2a shows the mean OA mass concentrations simulated with the ref-VBS-GECKO version for the July–August 2013 period. The simulated mean OA concentrations range from ∼0 µg m−3 in remote oceanic areas to ∼12 µg m−3 around the Adriatic Sea and in northern Italy, and they are coherent with the expected orders of magnitude and spatial distributions over Europe (Aksoyoglu et al., 2011; Crippa et al., 2014). Figure 2b presents the relative difference between mean OA mass concentrations simulated with ref-VBS-GECKO and with H2O. The ref-VBS-GECKO produces more OA than H2O, with a mean OA mass concentration around 30 % higher on average over Europe. The increase is particularly important over northern Europe, with maximum differences reaching around +60 %.

Figure 2Mean OA mass concentrations simulated with the ref-VBS-GECKO model configuration over Europe for the July–August 2013 period (a) and relative difference of the simulated mean OA mass concentrations between the ref-VBS-GECKO and the H2O configuration (b).
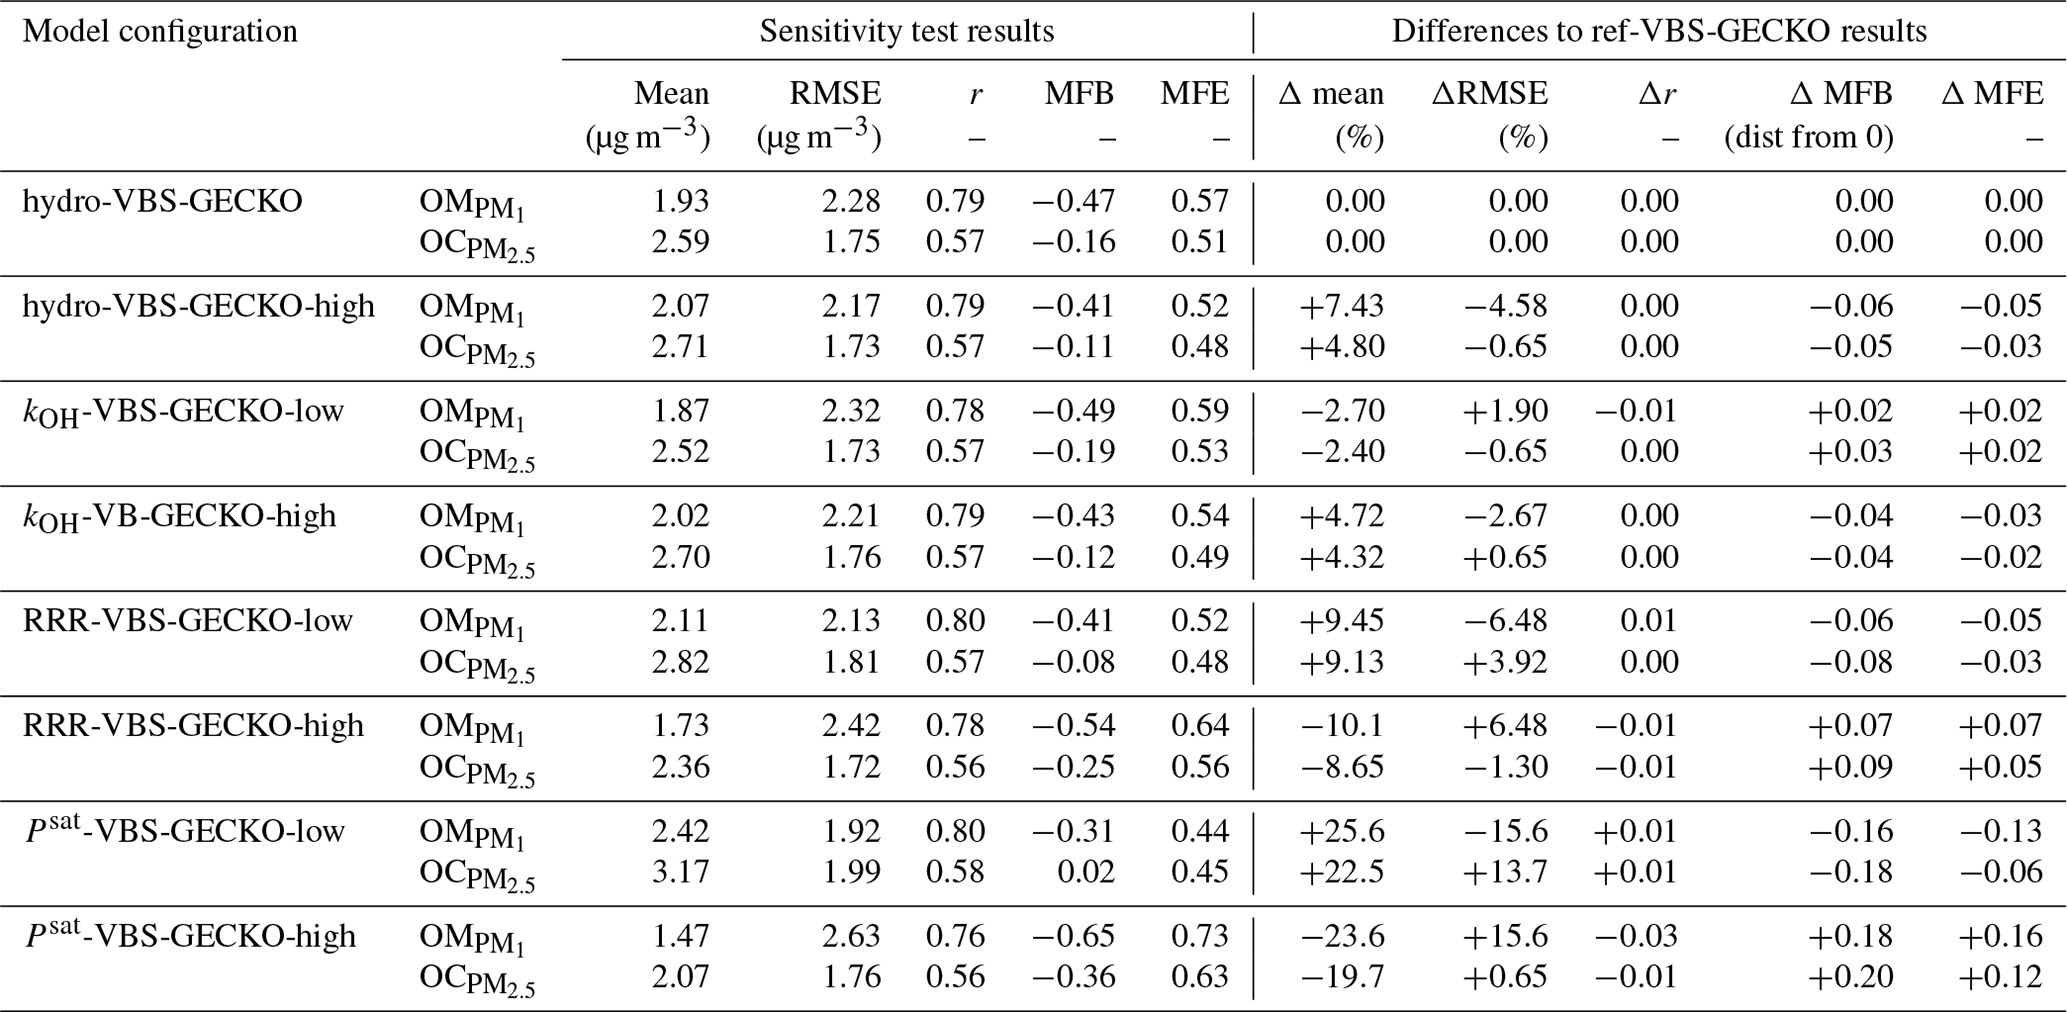
Table 3Statistical results calculated on daily averaged concentrations for the ref-VBS-GECKO simulations and differences between ref-VBS-GECKO and H2O statistical indicators.
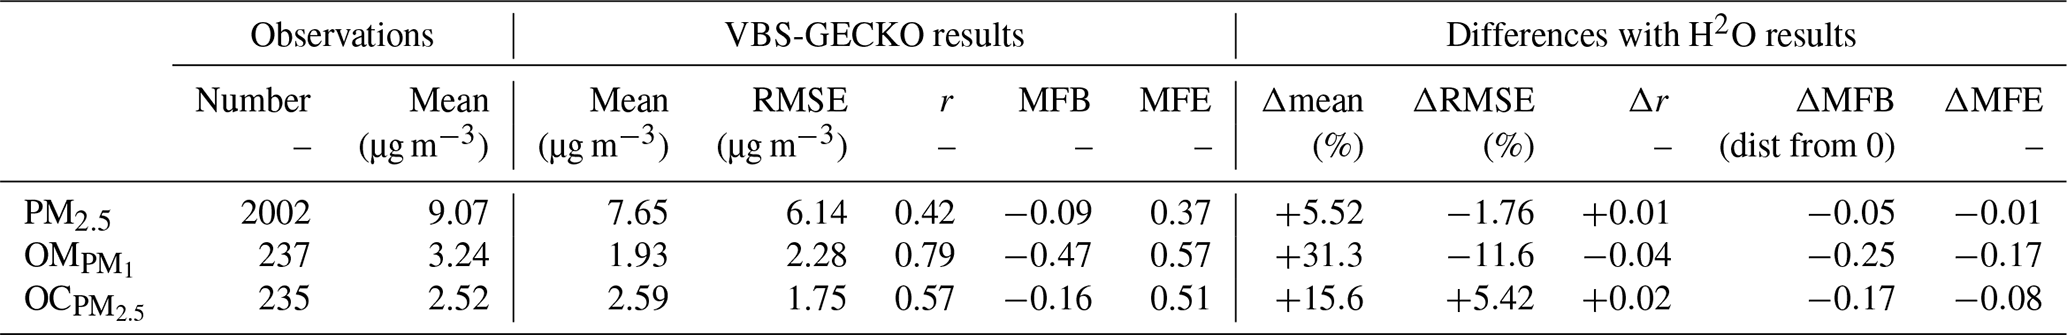
Table 3 gathers the statistical results calculated on daily averaged concentrations for ref-VBS-GECKO at the 48 stations (RMSE, Pearson's r, MFB and MFE), as well as the difference of this statistical indicator between ref-VBS-GECKO and H2O. Statistical indicators show a high spatiotemporal correlation between ref-VBS-GECKO and measurements for daily OM and OC with r>0.5 (0.79 and 0.57, respectively). These r values are in the standard of what has been found in previous modeling studies for Europe (Bergström et al., 2012; Ciarelli et al., 2017) or USA (Ahmadov et al., 2012; Murphy et al., 2017). For daily averaged measurements of PM2.5, the correlation is smaller (0.42). This lower correlation for PM2.5 has already been highlighted in summertime during the EURODELTA-III intercomparison campaign (Bessagnet et al., 2016). MFE and MFB satisfy the performance criteria of Boylan and Russel (2006) for all the measurements. However, daily averaged PM2.5 values, and especially the organic fraction (OM and OC), appear to be systematically underestimated by the ref-VBS-GECKO model.
Comparing ref-VBS-GECKO statistical results with H2O statistical results, the simulated daily averaged PM2.5 concentrations over the 36 stations appear to be weakly sensitive to the SOA formation mechanism used in the model. Only a slight improvement due to an increase in simulated PM2.5 concentrations of about 5.5 % is observed with the ref-VBS-GECKO model configuration. Concerning simulated OC over the 13 measurement stations, the ref-VBS-GECKO parameterization leads to an increase in the simulated concentration (+15.6 %), ultimately leading to a clear improvement of MFE, MFB and correlation coefficient. Nevertheless, using the ref-VBS-GECKO configuration instead of the H2O configuration increases RMSE (+5 %), owing to a substantial overestimation of OA. The main differences between the two organic aerosol modules are reached for OM with simulated ref-VBS-GECKO concentrations higher than H2O by 31.5 %. As simulated OM concentrations were highly underestimated using the former H2O configuration compared to observations (six stations), the ref-VBS-GECKO configuration improves RMSE, MFB and MFE.

Figure 3Measured (black) and simulated (with H2O in blue and ref-VBS-GECKO in red) temporal evolution of daily averaged OM concentrations (a, b, d, e) OC concentrations (c, f, h) and PM2.5 concentrations (g). Top panels are for stations influenced by anthropogenic sources in France (Palaiseau station, a), Germany (Melpitz station, b), and the Netherlands (Cabauw station, c); middle panels are stations in remote areas in Finland (Hyytiälä station, d), Norway (Birkenes II station, e), and Poland (Diabla Gora station, f); and bottom panels are for a station located in a remote area in Slovenia (Iskrba, g, h).
Figure 3 shows comparisons between the measured and the simulated daily averaged temporal evolutions of OM, OC and/or PM2.5 concentrations at the seven selected stations. Figure 4 shows the measured and simulated mean diurnal profiles at the four stations providing OM. Simulations capture qualitatively the observed feature of the daily averaged time series for PM2.5, OC and OM, as well as the mean diurnal profiles for OM. At stations dominantly impacted by biogenic sources, OA concentrations simulated with ref-VBS-GECKO are higher than those simulated with H2O, leading to a better agreement with measurements (see Figs. 3d to h and 4c and d). However, day–night variations of OM seem to be overestimated. At stations influenced by anthropogenic air masses, OA concentrations are weakly influenced by the organic aerosol module (see Figs. 3a to c and 4a and b). OA concentrations simulated with ref-VBS-GECKO are substantially underestimated: differences exceeding −50 % for OM concentrations at the Palaiseau and Melpitz stations as well as for OC concentrations at the Cabauw station.
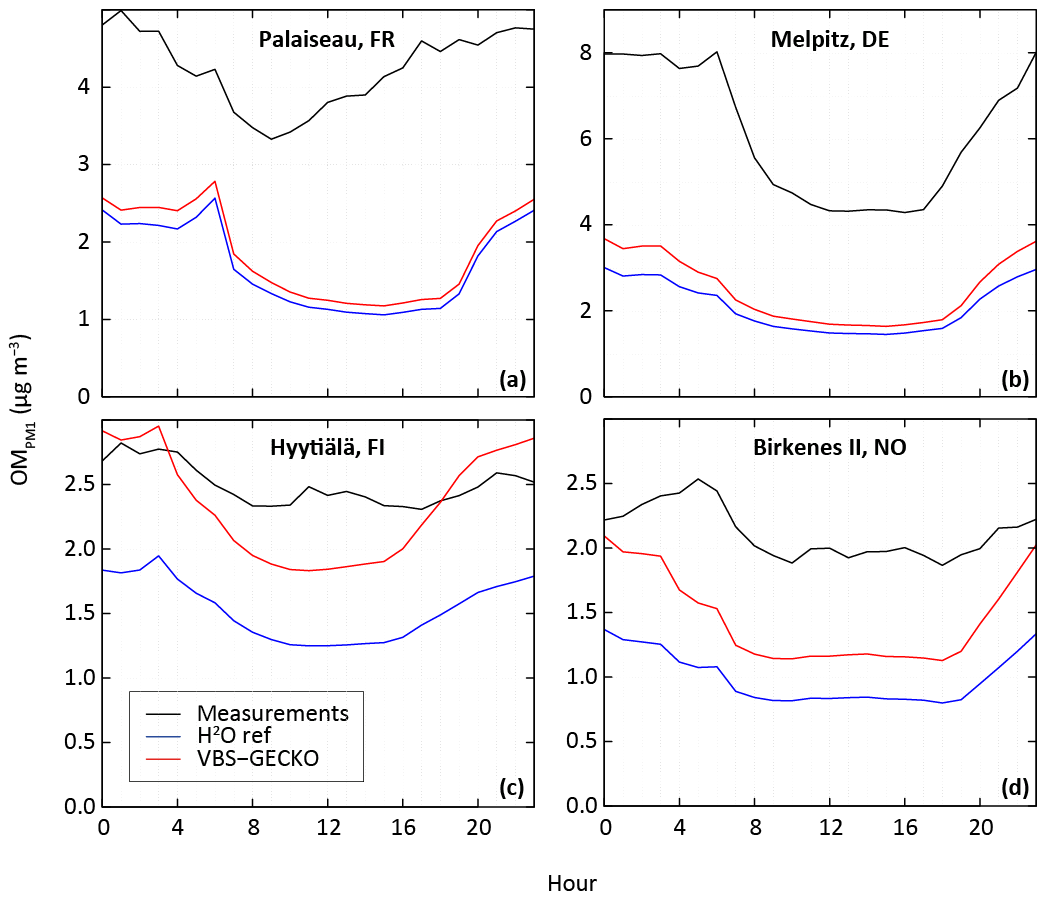
Figure 4Measured (black) and simulated mean diurnal profile (in UTC) with the H2O model configuration (blue) and the ref-VBS-GECKO model configuration (red) for OM concentration at stations influenced dominantly by anthropogenic sources (Palaiseau (a) and Melpitz (b)) and by biogenic sources (Hyytiälä (c) and Birkenes II (d)).
Sensitivity tests were performed to assess the VBS-GECKO parameterization, evaluate the consistency of the modeling results and examine some hypotheses that may explain the gaps between measurement and simulated values. Sensitivities to hydro-solubility, gaseous aging, NOx regimes and volatility were studied comparing results to the nonmodified ref-VBS-GECKO version.
4.1 Sensitivity tests to hydro-solubility and Heff
SOA formation from the gas–particle partitioning of hydro-soluble organic compounds into an aqueous phase is now well recognized (e.g., Bregonzio-Rozier et al., 2016; Carlton et al., 2009; Knote et al., 2014). The effective Henry's law constant (Heff) is the key parameter which controls this hydrophilic partitioning. Hydro-soluble organic compounds can also be lost at the surface by dry deposition. In CHIMERE, and according to the deposition scheme of Wesely (1989), the stomatal resistance of organic compounds depends on Heff. To analyze the sensitivity of the simulated OA to hydrophilic partitioning and values of Heff, the following two simulations were run:
-
Hydro-VBS-GECKO. In this model configuration, VBk,i can condense both on organic and aqueous phases of particles. Aqueous-phase partitioning is computed according to Henry's law, assuming the particle phase behaves as an ideal well-mixed homogeneous aqueous phase. Deposition of VBk,i was already taken into account in the reference model configuration and was kept unchanged.
-
Hydro-VBS-GECKO-high. This model configuration is identical to the hydro-VBS-GECKO configuration above, except that the original Heff values of each VBk,i are multiplied by 100. The new Heff values correspond to the upper values of the Heff distribution of secondary organic compounds contributing to a given volatility bin (see Lannuque et al., 2018a).
The relative difference in the simulated mean OA concentrations between Hydro-VBS-GECKO (respectively Hydro-VBS-GECKO-high) and ref-VBS-GECKO is given in Fig. 5a (respectively Fig. 5b) for the 2-month period. Figure 5a shows that considering aqueous-phase partitioning of the VBS-GECKO species leads to variations in the simulated mean OA concentrations below ±0.5 %. Table 4 shows no significant modification in the statistical results for this simulation. The values of Heff set to each volatility bin increase when the volatility decreases (see Table 1), meaning that the less volatile species are also more prone to condense into the aqueous phase. Adding a hydrophilic partitioning does therefore not increase substantially the concentrations of organic species in the condensed phases.
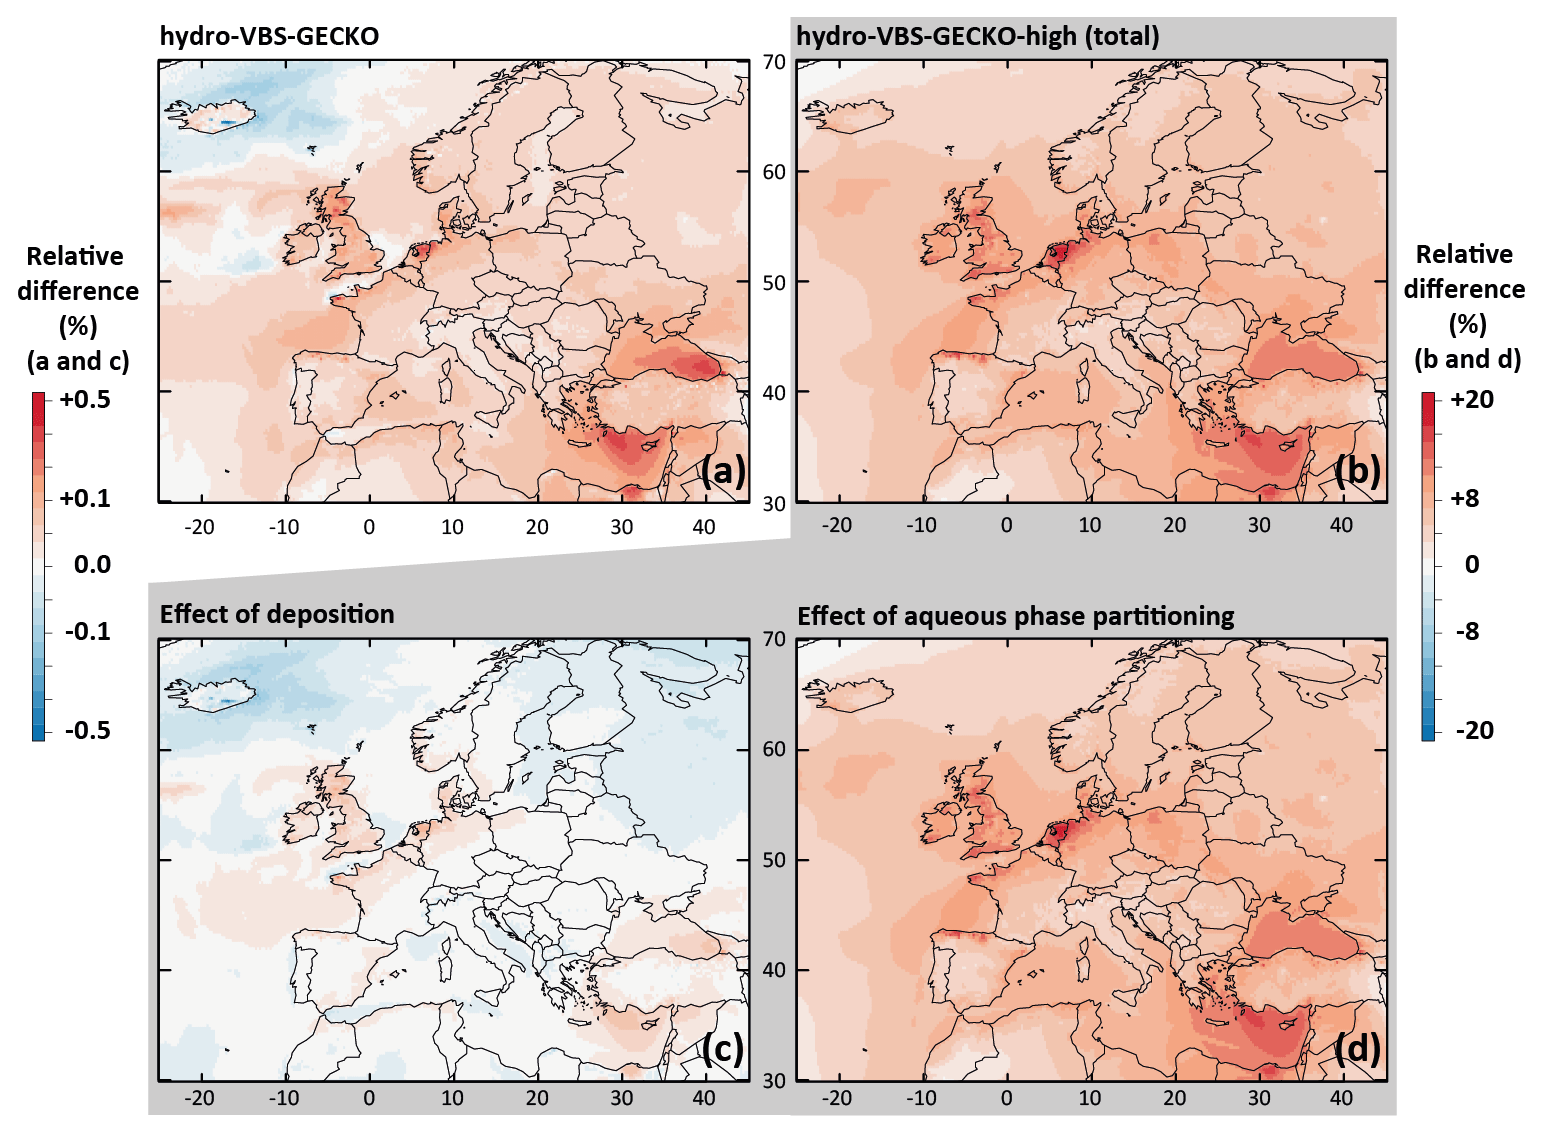
Figure 5Relative differences on the simulated mean OA concentrations between (a) the Hydro-VBS-GECKO and the ref-VBS-GECKO and (b) the Hydro-VBS-GECKO-high and the ref-VBS-GECKO model configurations for the 2-month period. Bottom panels represent relative differences on the simulated mean OA concentrations between the Hydro-VBS-GECKO-high and the ref-VBS-GECKO due to variation in deposition (c) or partitioning (d).
Table 4Statistical results calculated on daily averaged concentrations simulated with the various model configurations and differences with the ref-VBS-GECKO configuration statistical indicators given Table 3.
The Hydro-VBS-GECKO-high configuration increases the mean simulated OA concentrations by ∼10 %, with a maximal increase reached over the Belgium–the-Netherlands–Luxembourg area (called Benelux hereafter, around +20 %; see Fig. 5b). The contribution of the deposition and the partitioning processes are shown in Fig. 5c and d, respectively. Changes due to deposition appear negligible (below ±0.2 %) compared to the changes due to the aqueous partitioning ( %). According to the Wesely (1989) parameterization used for deposition, water solubility contributes to the surface resistance only. Knote et al. (2014) have shown that deposition is not limited by the surface resistance for Heff greater than 108 mol L−1 atm−1. In ref-VBS-GECKO, this threshold corresponds to the VBk,(3–7) nominal Heff values, i.e., to the volatility bins partitioning mainly to OA. OA concentrations are therefore not sensitive to an increase in the Heff values. The increase in Heff by a factor of 100 makes possible hydrophilic partitioning of the most volatile bins that would not have condensed otherwise, and it leads to an increase in simulated OA concentrations. The maximum relative changes simulated over Benelux are mainly linked to the high relative humidity encountered in this area and the low simulated OA concentrations (see Fig. 2a). This model configuration improves slightly the RMSE, MFB and MFE calculated on OM (−4.58 %, −0.06 and −0.05, respectively) and OC (−0.65 %, −0.05 and −0.03, respectively) mass concentrations (see Table 4). According to these tests, SOA production due to the hydrophilic partitioning of the various VBk,i of the VBS-GECKO parameterization is expected to be a minor process.
4.2 Sensitivity test to gaseous aging rates and OH radical concentrations
In the VBS-GECKO parameterization, the same rate constant is set for the VBk,i reactions with OH ( cm3 molec.−1 s−1). The timescale for gaseous aging is therefore driven by the OH concentrations simulated by the CTM. Simulated OH concentrations depend on the gas-phase chemical mechanisms used in the CTM, with differences in OH concentrations reaching up to 45 % between mechanisms (Sarwar et al., 2013). Two simulations were run with modified kOH to examine the sensitivity of SOA production to the rate of chemical aging:
-
kOH-VBS-GECKO-low. In this model configuration, the VBOH rate constants are divided by a factor 2, i.e., cm3 molec.−1 s−1.
-
kOH-VBS-GECKO-high. In this model configuration, the VBOH rate constants are multiplied by a factor 2, i.e., cm3 molec.−1 s−1.
The relative difference in the simulated mean OA concentrations between kOH-VBS-GECKO-low (respectively kOH-VBS-GECKO-high) and ref-VBS-GECKO is given Fig. 6a (respectively Fig. 6b). A slight variation of simulated OA concentrations is found (lower than ±10 %), with simulated OA concentrations decreasing with the decrease in aging rates and vice versa. This result highlights that the gas-phase aging of volatility bins in the VBS-GECKO parameterization promotes functionalization (formation of less volatile bins) rather than fragmentation (formation of more volatile bins), as already shown with tests conducted in a box model (Lannuque et al., 2018a). The highest relative differences are located over the Mediterranean Sea and northern Africa, i.e., areas showing high OH and low OA concentrations (below 4 µg m−3; see Fig. 2a). The kOH-VBS-GECKO-high configuration improves statistics, due to an overall increase in the simulated OA concentrations (and contrariwise for the kOH-VBS-GECKO-low configuration) (see Table 4). However, the sensitivity of SOA to the gas-phase aging of the VBS-GECKO volatility bins remains weak, and aging rates are likely not a major source of uncertainty.
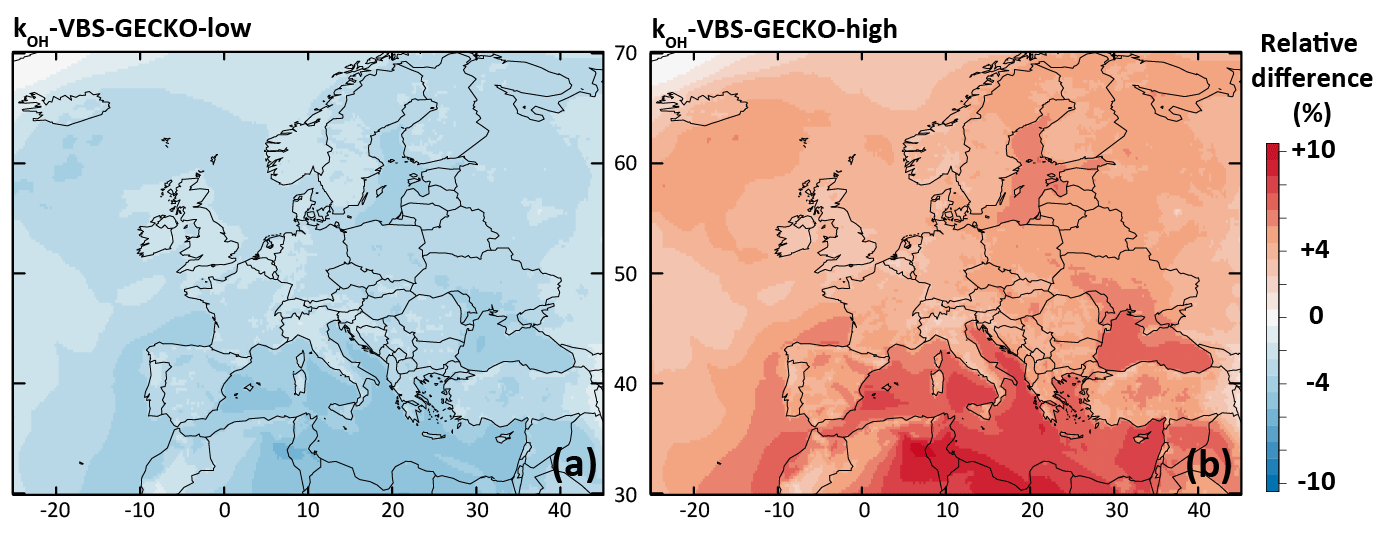
Figure 6Relative differences on the simulated mean OA concentrations between (a) the kOH-VBS-GECKO-low and the ref-VBS-GECKO model configurations and (b) the kOH-VBS-GECKO-high and the ref-VBS-GECKO model configurations for the 2-month period.
4.3 Sensitivity test to the NOx regime
Similar to the OH discussion above, simulated HO2 and NO concentrations in CTMs are linked to the gas-phase chemical mechanism used. The concentrations of these two species determine the value of the RRR ratio and therefore drive the aging of the various VBk,i (Lannuque et al., 2018a). A sensitivity test was performed to examine the sensitivity of the simulated OA to the chemical regime. HO2 or NO concentrations can hardly be modified without changing all the simulation conditions. Here, two simulations were run modifying the value used to calculate the RRR.
-
RRR-VBS-GECKO-low. In this model configuration, RRR ratio is calculated with multiplied by 2, i.e., cm3 molec.−1 s−1.
-
RRR-VBS-GECKO-high. In this model configuration, RRR ratio is calculated with divided by 2, i.e., cm3 molec.−1 s−1.
Figure 7 presents the mean RRR ratio during the 2-month period for both RRR-VBS-GECKO-low (Fig. 7a) and RRR-VBS-GECKO-high model configurations (Fig. 7b). The entire range of RRR ratio (from remote NOx conditions to high NOx conditions) is covered over Europe with the both model configuration. As expected, the urban, industrial and intense shipping transport areas such as Paris, the Channel, Benelux, northern Italy or Moscow are systematically in the high NOx regime (RRR close to 1), whereas remote areas over the seas (away from shipping tracks) are systematically in the remote NOx regime (RRR close to 0). Between these two extremes, the RRR ratio depends on the environmental and meteorological conditions at the location and, in this sensitivity study, on the model configuration for the RRR calculation. Current parameterizations for SOA formation only consider two extreme regimes corresponding to a high-NOx and a low-NOx condition. Criteria used to define high and low NOx differ from a study to another one but the parameterizations are usually optimized at NOx values typical of rural conditions for low NOx (corresponding to a RRR ratio of ∼0.6) and typical of urban conditions for high NOx (corresponding to a RRR ratio of ∼1) (e.g., Hodzic et al., 2014; Lane et al., 2008). The range of RRR between 0.0 and 0.6 is therefore not considered in most of the parameterizations, although substantial changes in SOA formation were found within this range of RRR (Lannuque et al., 2018a).

Figure 7Mean RRR over Europe during the 2-month period for (a) the RRR-VBS-GECKO-low and (b) the RRR-VBS-GECKO-high model configurations.
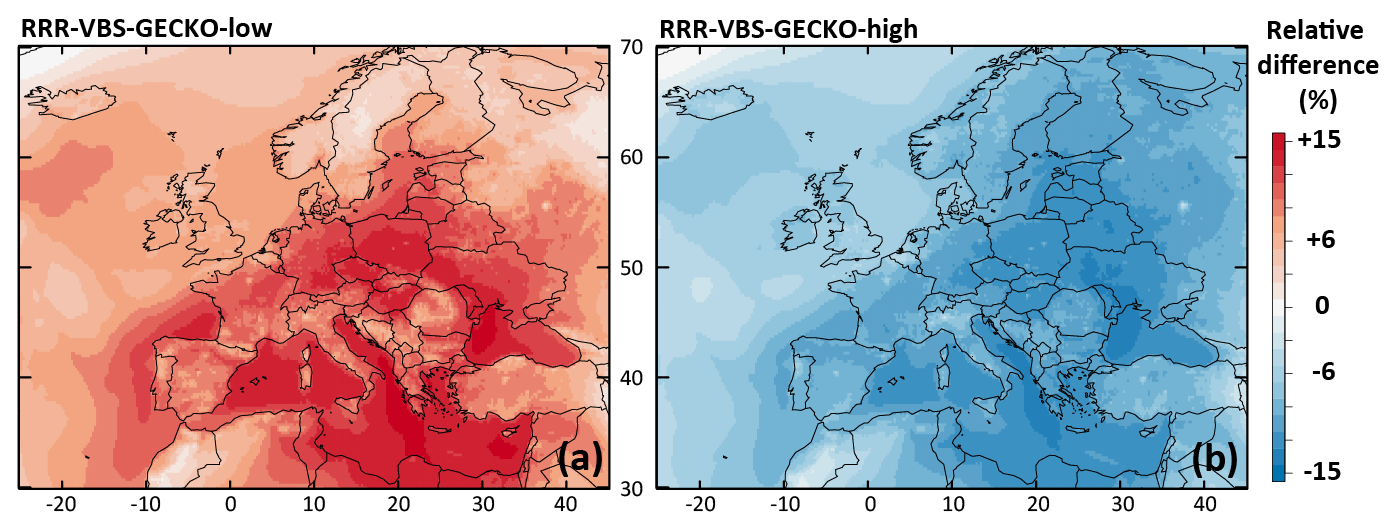
Figure 8Relative differences on the simulated mean OA concentrations between (a) the RRR-VBS-GECKO-low and the ref-VBS-GECKO model configurations and (b) between the RRR-VBS-GECKO-high and the ref-VBS-GECKO model configurations for the 2-month period.
The relative difference in the simulated mean OA concentrations between RRR-VBS-GECKO-low (respectively RRR-VBS-GECKO-high) and ref-VBS-GECKO is given Fig. 8a (respectively Fig. 8b). Results show variations in simulated mean OA concentrations smaller than ∼15 %. In agreement with previous studies, an increase (decrease) of RRR ratio leads to a decrease (increase) of the simulated OA concentrations (e.g., Donahue et al., 2005; Lannuque et al., 2018a; Ng et al., 2007). As expected, the variation is weaker over areas having either an RRR ratio close to 0 or 1, the NOx regime remaining unchanged among the model configurations. The highest relative differences on OA are found over continental rural areas, i.e., areas showing the largest variation in RRR among the model configurations. Large relative differences are also found over the Mediterranean Sea, owing in part to the low simulated OA concentrations. Similar to the kOH sensitivity tests, the RRR-VBS-GECKO-low configuration increases the overall OA concentrations and improves statistical indicators, and contrariwise for the RRR-VBS-GECKO-high configuration. Sensitivity on RRR values appears weak enough to likely not be a major source of uncertainty for the VBS-GECKO parameterization.
4.4 Sensitivity test to volatility and Psat
In the explicit GECKO-A simulations used for the VBS-GECKO optimization, the saturation vapor pressure, Psat, of secondary organic compounds was estimated using structure activity relationships (SAR) (see Lannuque et al., 2018a). Estimated Psat can typically vary within 1 order of magnitude according to the SAR used (e.g., Valorso et al., 2011). Two simulations were run to examine the sensitivity of SOA to the uncertainties in Psat:
-
Psat-VBS-GECKO-low. In this model configuration, the nominal Psat values of VBk,i are divided by 10.
-
Psat-VBS-GECKO-high. In this model configuration, the nominal Psat values of VBk,i are multiplied by 10.
As OA concentration directly contributes to the partitioning, these two simulations can also be considered a sensitivity test to the simulated OA concentrations.

Figure 9Relative difference in the simulated mean OA concentrations between (a) the Psat-VBS-GECKO-low and the ref-VBS-GECKO model configurations and (b) between the Psat-VBS-GECKO-high and the ref-VBS-GECKO model configurations for the 2-month period.
The relative difference in the simulated mean OA concentrations between Psat-VBS-GECKO-low (respectively Psat-VBS-GECKO-high) and ref-VBS-GECKO is given Fig. 9a (respectively Fig. 9b). Shifting the volatility of the VBk,i by 1 order of magnitude leads to an overall change in the simulated mean OA concentrations of about −25 % (+25 %) when Psat is increased (decreased). A weaker sensitivity is observed over urban areas, such as Paris or Moscow. This behavior is mainly linked to the simulated volatility of OA in the ref-VBS-GECKO simulations. Figure 10 shows the mean volatility of OA over Europe for the reference configuration. Simulated OA contributors are mainly low-volatility species (with mean between 10−10 and 10−14 atm), with the highest values being found over urban areas (less aged OA) and the lowest values found over areas close to the boundaries of the domain (linked to a boundary effect in the model). A shift in volatilities over these two types of site has a lower impact on OA concentrations, as OA mean volatilities being either too high (mean atm, upon urban areas) or too low (mean atm, upon boundary areas) for a change in Psat to substantially impact the partitioning. The largest effect is typically observed over central Europe where OA contributors show intermediate mean volatilities (mean atm).
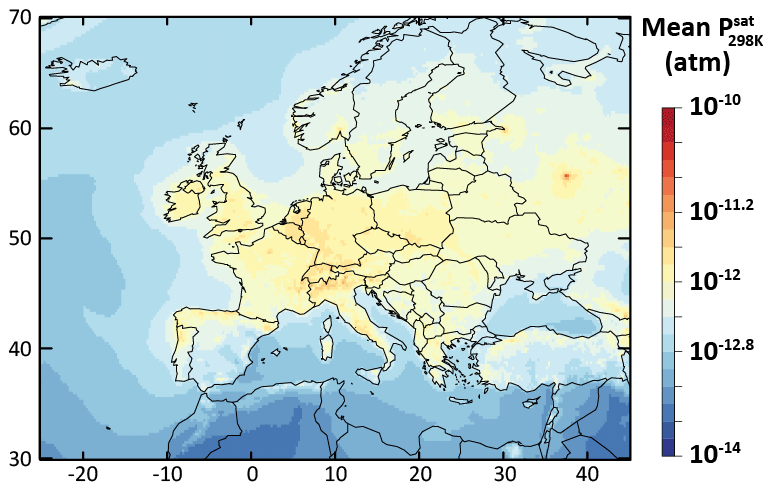
Figure 10Simulated average volatility of OA in term of upon Europe during the July–August 2013 period for the ref-VBS-GECKO model configuration.
Statistically, the Psat-VBS-GECKO-low configuration is the only configuration matching the performance goal for all the simulated OA concentrations (OC and OM) (see Table 4). For OC, RMSE is, however, higher than in the reference configuration. Simulated OA concentrations appear to be sensitive to uncertainties in the estimated saturation vapor pressures of the numerous OA contributors considered during the development of the VBS-GECKO parameterization.
IVOCs have been shown to be a substantial source of SOA in the plume of megacities (e.g., Hodzic et al., 2010; Tsimpidi et al., 2010). Even if several recent studies have been performed to identify the IVOC speciation of different individual emission sources (e.g., Akherati et al., 2019; Grieshop et al., 2009; Hatch et al., 2018; Jathar et al., 2017; Louvaris et al., 2017; Lu et al., 2018; May et al., 2013a, b, c; Woody et al., 2016), a comprehensive inventory is still not available to represent IVOC emissions by activity sector (gathering several individual emission sources). A large fraction of these IVOCs is thus still not considered in emission inventories. In this section, only IVOC emissions from traffic and transportation sources are treated. Robinson et al. (2007) assumed that IVOC emissions for small off-road diesel engines were equal to 150 % of POA emissions, consistent with the Schauer et al. (1999) emission data for 1995 medium-duty diesel vehicles. Recent studies have measured IVOC emissions from (i) exhausts of light-duty gasoline vehicles and (ii) exhausts of both heavy-duty and medium-duty diesel vehicles (Zhao et al., 2015, 2016). Experiments on gasoline exhausts were processed on 42 vehicles and experiments on diesel vehicles on 6 vehicles, with the selected vehicles being representative of the transportation fleet in North America. In both cases, Zhao et al. (2015, 2016) have shown that a stronger correlation can be found between IVOC and NMVOC emissions (R2 equal to 0.92 and 0.98 for gasoline and diesel exhausts, respectively) than between IVOC and POA emissions (R2 equal to 0.76 and 0.61 for gasoline and diesel exhausts, respectively). Zhao et al. (2015, 2016) have estimated that IVOC emissions represent about 4 % of NMVOC emissions in cold-start cycle to about 16 % in hot-start cycle for light-duty gasoline vehicles and about 60±10 % of NMVOC emissions for heavy-duty and medium-duty diesel vehicles.
In this study, the VBS-GECKO parameterization was used to examine the sensitivity of SOA to IVOC emissions from road traffic (SNAP 7) and other mobile sources and machinery (SNAP 8). The following five model configurations, based on different IVOC emission fluxes, were designed for that purpose.
-
IVOC150POA: in this model configuration, IVOC emissions are set to 150 % of the semivolatile POA emissions, based on Robinson et al. (2007).
-
IVOC4VOC: in this configuration, IVOC emissions are set to 4 % of NMVOC emissions, based on Zhao et al. (2016) for gasoline vehicles in cold-start cycle.
-
IVOC16VOC: in this configuration, IVOC emissions are set to 16 % of NMVOC emissions, based on Zhao et al. (2016) for gasoline vehicles in hot-start cycle.
-
IVOC30VOC: in this configuration, emissions are set to 30 % of NMVOC emissions, assuming a mixing of diesel and gasoline vehicle fleets.
-
IVOC65VOC: in this configuration, IVOC emissions are set to 65 % of NMVOC emissions, based on Zhao et al. (2015) for diesel vehicles.
As in the reference model configuration, POA species are considered SVOC in these sensitivity tests for traffic and transport emissions. Primary SVOCs and IVOCs (S/IVOCs) constitute a complex mixture of linear, branched, and cyclic alkanes; alkenes; and aromatics (Fraser et al., 1997; Gentner et al., 2012; Lu et al., 2018; Schauer et al., 1999, 2002). The molecular composition of S/IVOCs emitted in the atmosphere by fossil fuel combustion is, however, still poorly documented. S/IVOCs at emission were thus considered to be distributed into the nine volatility bins given by Robinson et al. (2007), with the provided fraction of primary SVOCs in each SVOC volatility bin, and of estimated primary IVOCs in each IVOC volatility bin. The VBS-GECKO parameterizations for C14, C18, C22 and C26 1-alkenes and n-alkanes were used as surrogate mechanisms for S/IVOCs (C14 and C18 for IVOCs and C18, C22 and C26 for SVOCs). The C14 to C26 VBS-GECKO's n-alkanes and 1-alkenes were distributed according to their volatility into the nine volatility bins of Robinson et al. (2007). Correspondences are shown in Fig. 11 for the example of the IVOC150POA model configuration. The distribution of alkanes and alkenes was estimated based on (i) the EMEP guidebook (https://www.eea.europa.eu/publications/emep-eea-guidebook-2016, last access: 20 April 2020), providing speciation data for emissions for various types of vehicles, and (ii) the COPERT4 software (Ntziachristos et al., 2009) providing data for a vehicle fleet. Data are only available for light compounds and are here extrapolated to the heavy ones for the needs of the study. Thus, 75 % of the primary S/IVOCs are here assumed to be alkanes and 25 % alkenes. The primary SVOC total emissions and distributions over volatility bins are unchanged between each simulation. The distribution of IVOCs among volatility bins is also unchanged but the total IVOC emissions are modulated according to the five IVOC emission scenarios described before (i.e., IVOC150POA, IVOC4VOC, IVOC16VOC, IVOC30VOC and IVOC65VOC). Table 5 gives the speciation of VBS-GECKO species for the various model configurations and the VBS-GECKO mechanism for S/IVOCs presented in Table S3.
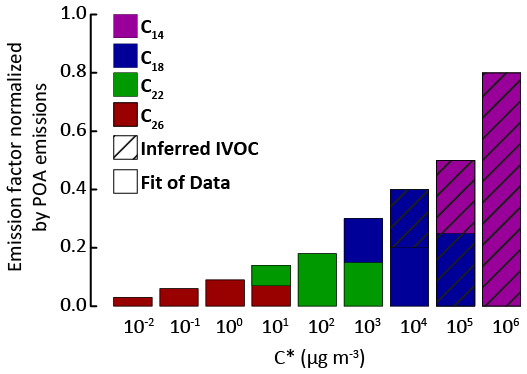
Figure 11Distribution of the VBS-GECKO species into the S/IVOC volatility bins by Robinson et al. (2007). Normalized emission factors by POA emissions for IVOCs are used for the IVOC150POA model configuration.
Table 5Distribution of the VBS-GECKO surrogate species for IVOC emission in the various model configurations.
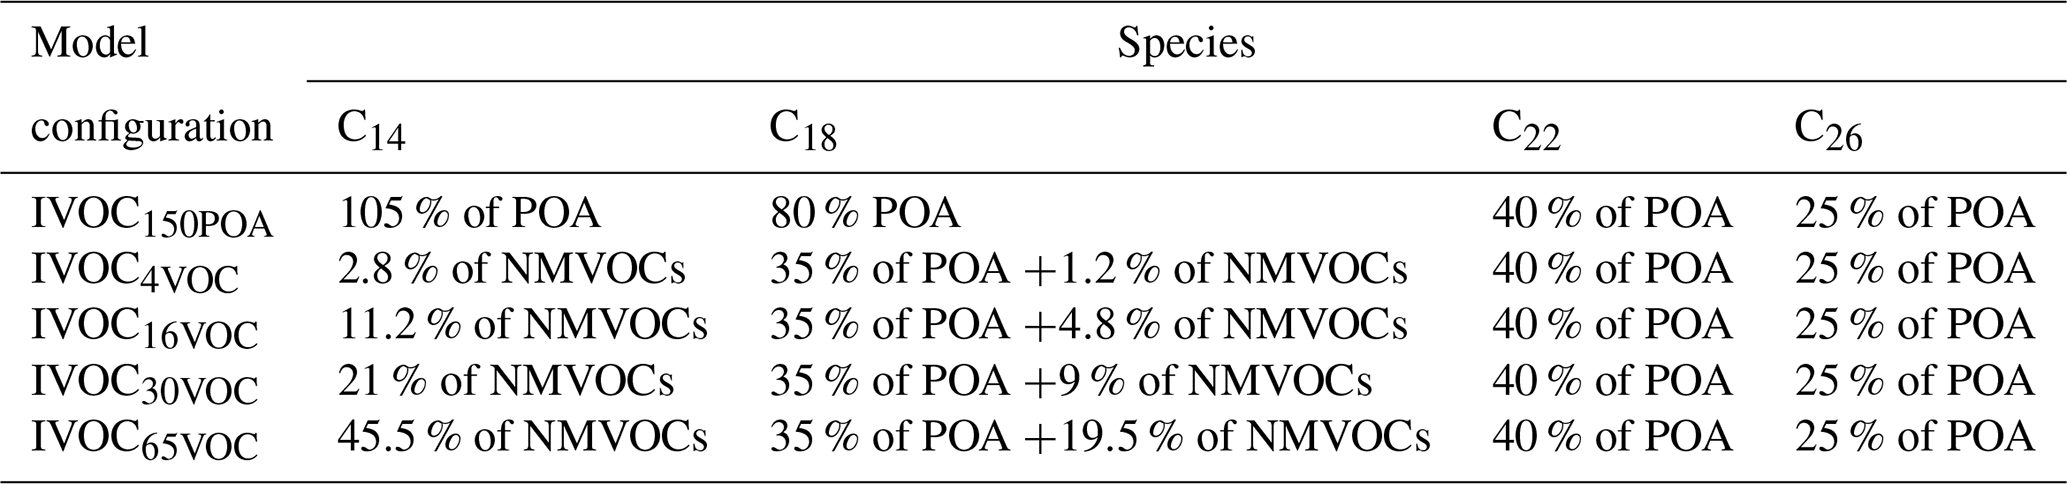
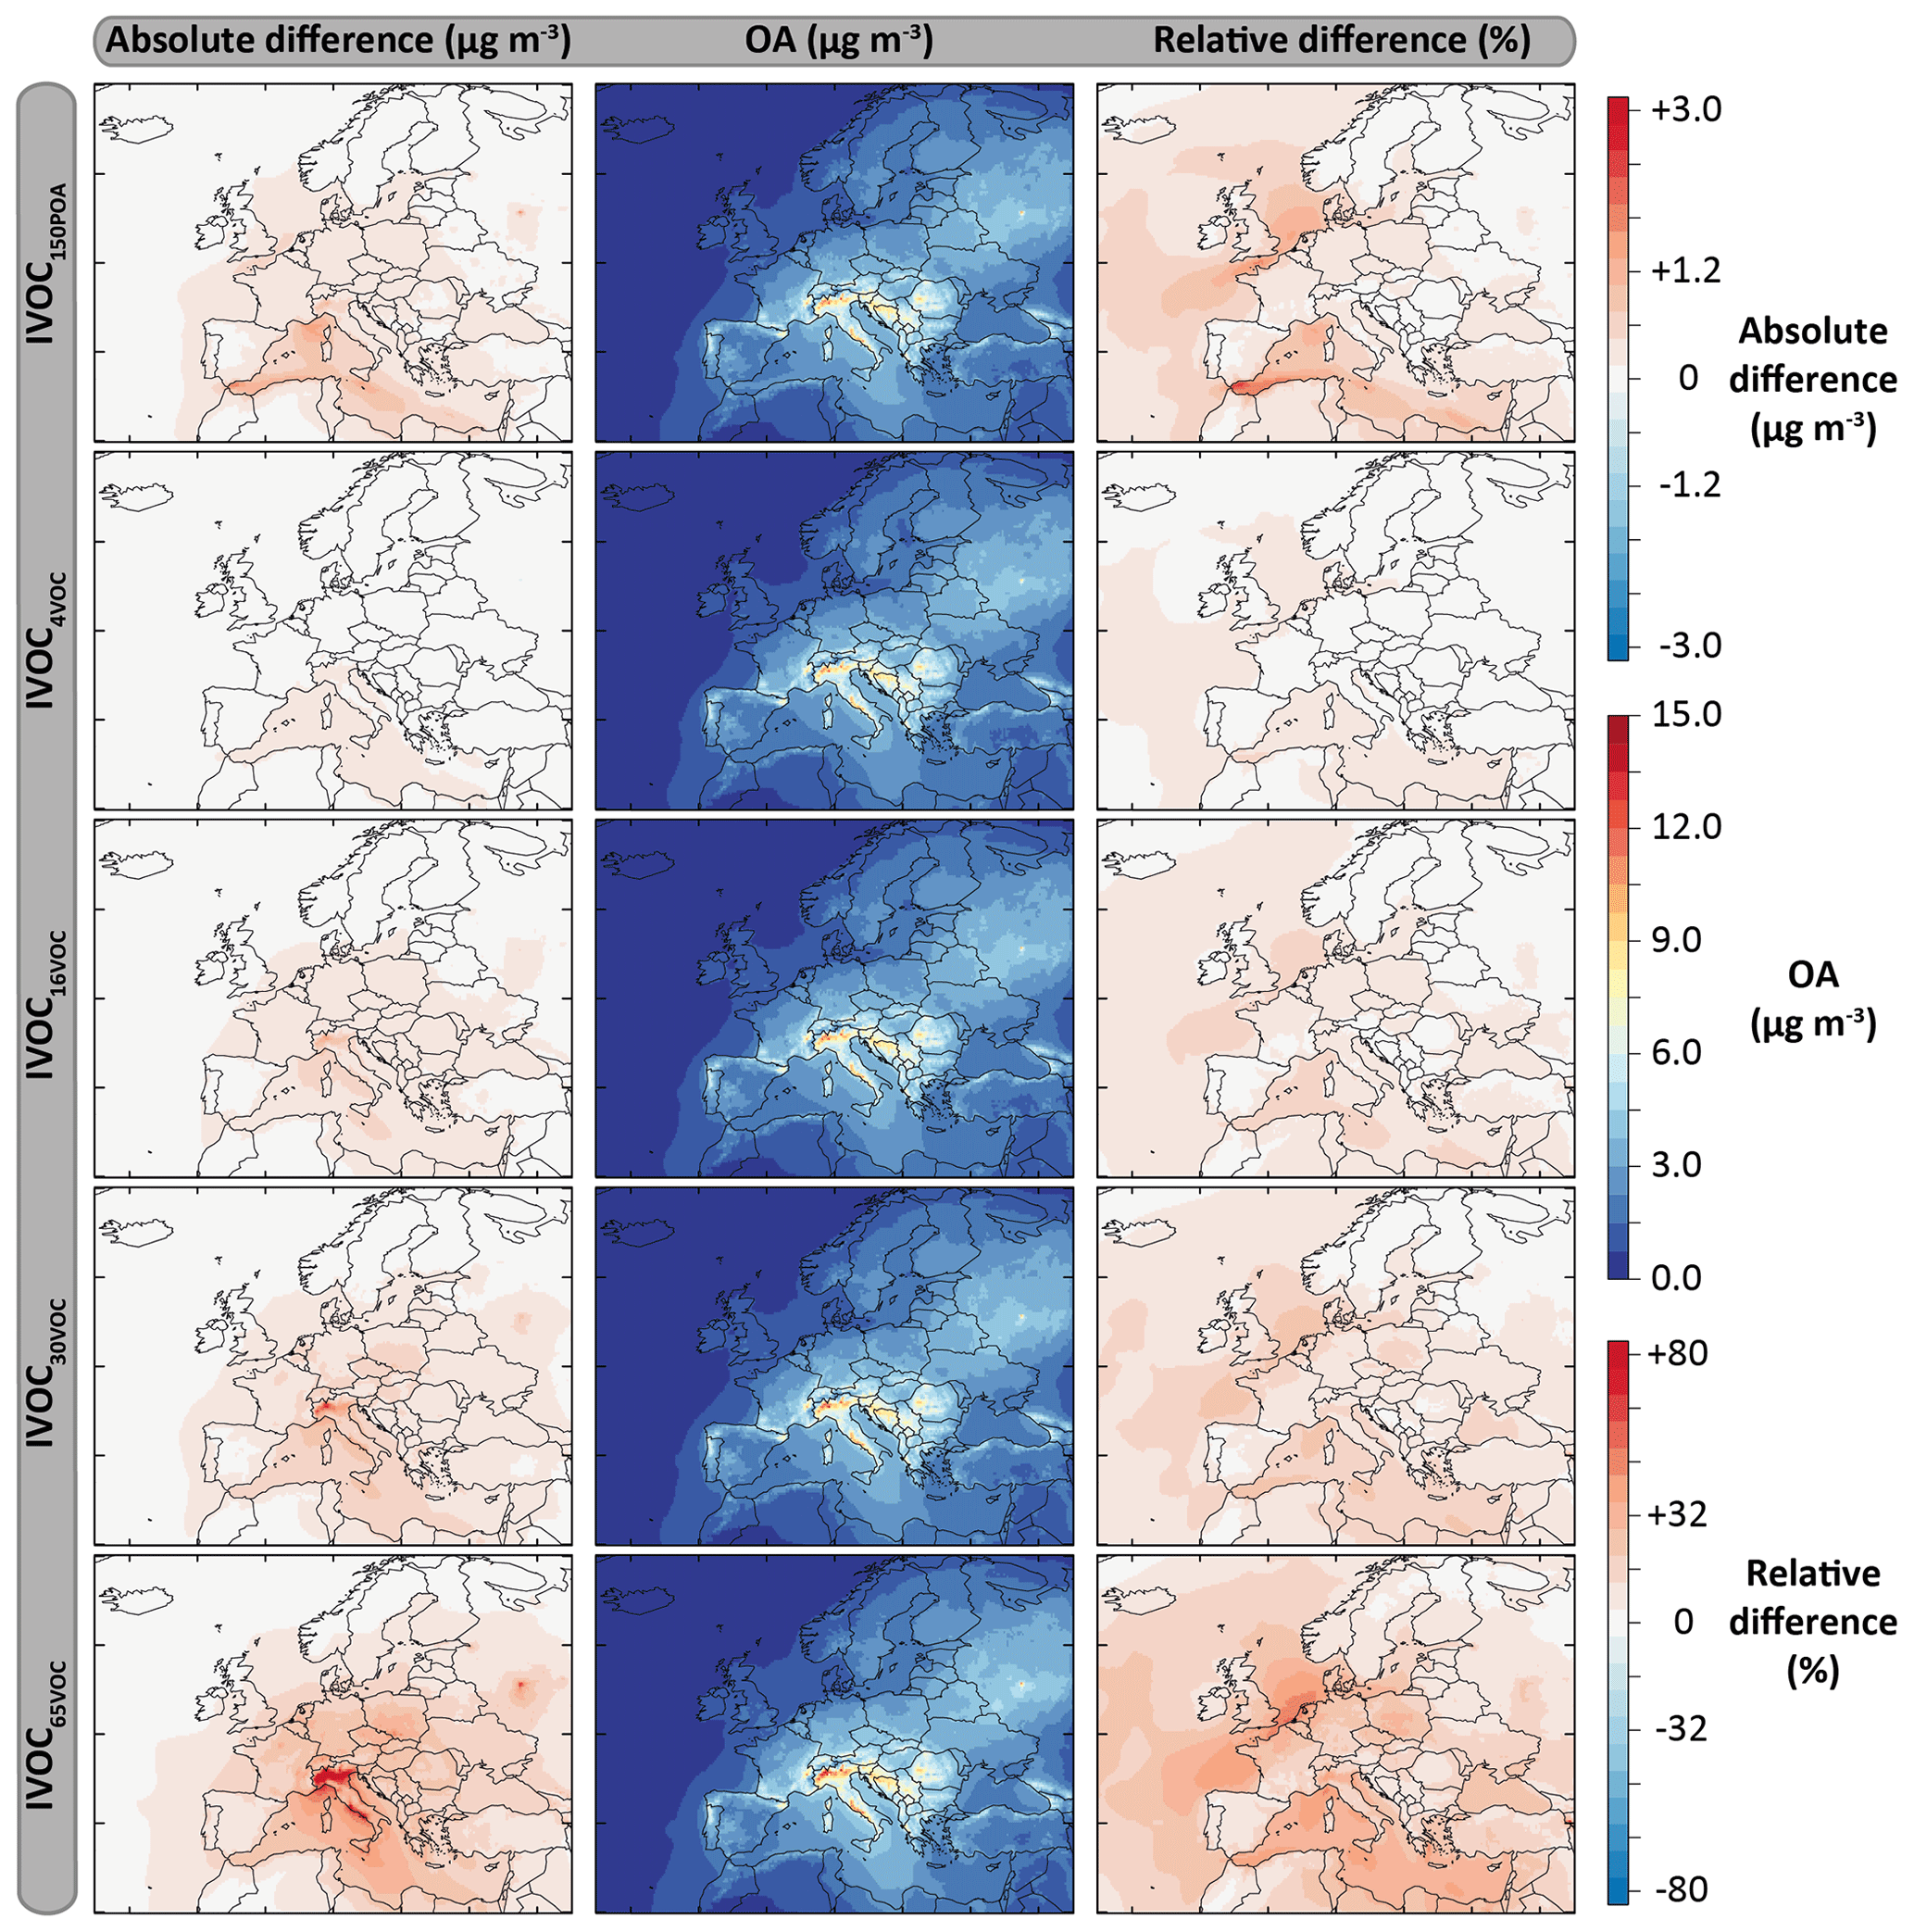
Figure 12Mean OA mass concentrations simulated with the model configurations including the IVOC emissions for the July–August 2013 period over Europe (second column), and absolute and relative differences with the ref-VBS-GECKO model configurations (left and right columns, respectively). Results are given for the following model configurations: IVOC150POA (first row), IVOC4VOC (second row), IVOC16VOC (third row), IVOC30VOC (fourth row) and IVOC65VOC (fifth row).
Table 6Statistical results calculated on daily averaged concentrations simulated with VBS-GECKO considering IVOC emissions and differences with those of the ref-VBS-GECKO (without IVOCs) from Table 3.
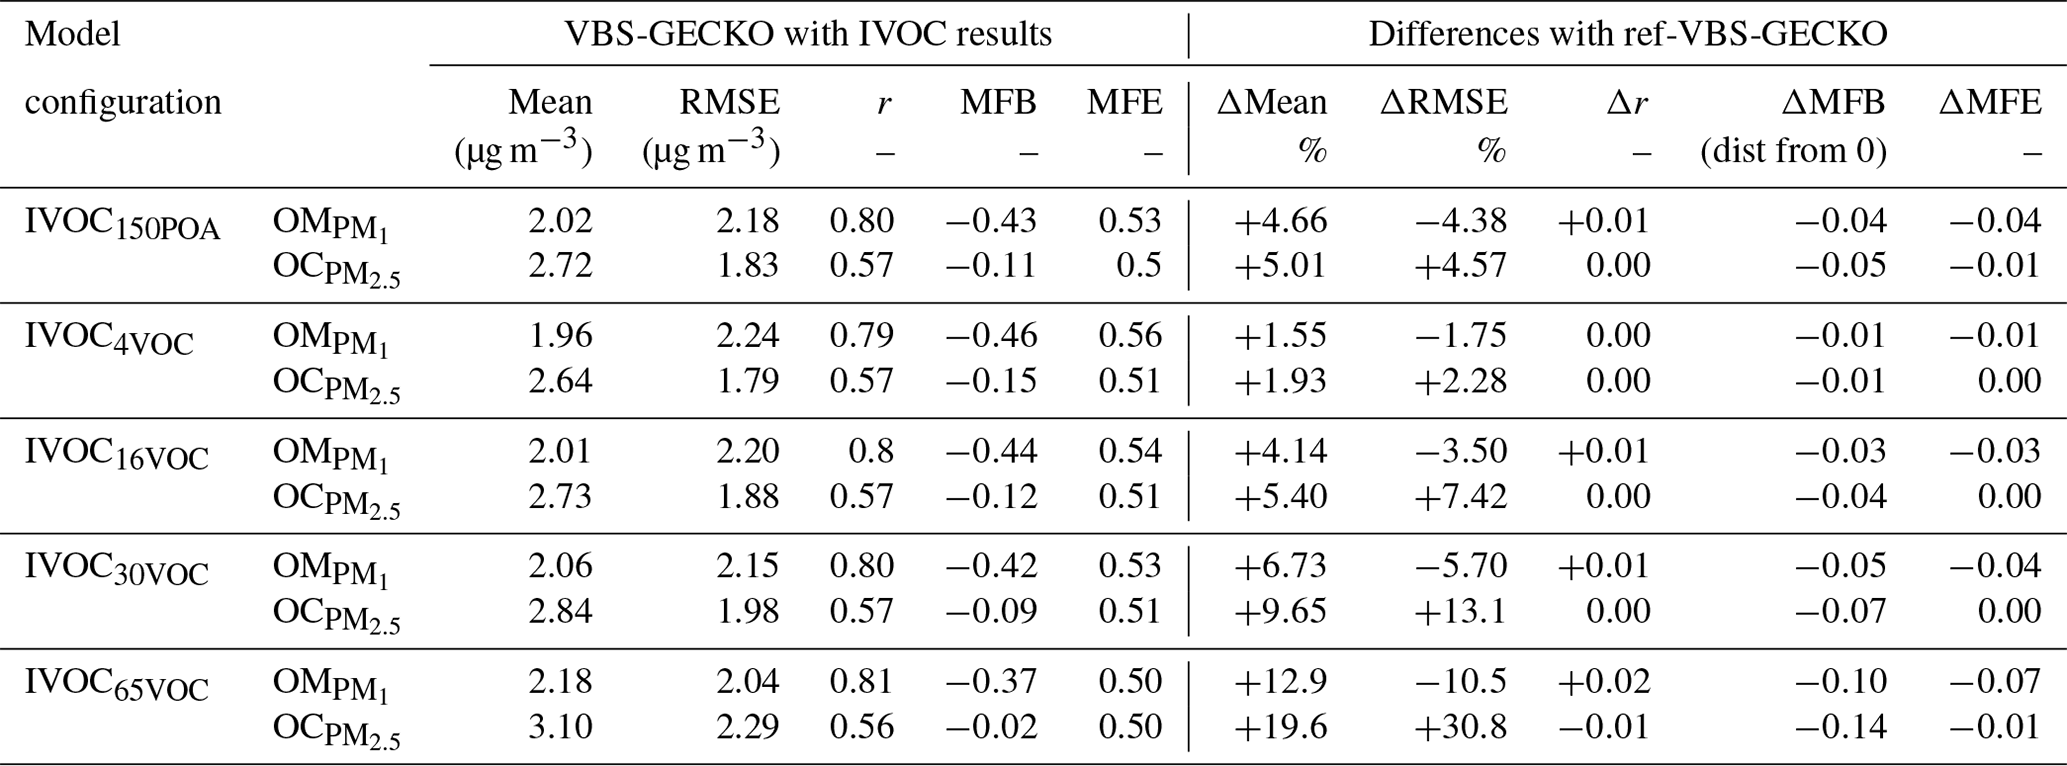
Figure 12 shows the mean OA mass concentrations simulated for the five IVOC emission configurations and the absolute and relative differences with the ref-VBS-GECKO simulation without IVOC emissions. Table 6 presents the statistical results calculated on daily averaged concentrations (RMSE, Pearson's correlation coefficient, MFE and MFB) for the different IVOC emission configurations and their difference with those of the ref-VBS-GECKO configuration. As discussed previously, the highest concentrations are simulated over northern Italy (see Fig. 2). For this area, accounting for IVOC emissions increases the simulated concentrations of OA up to 3 µg m−3 with the IVOC65VOC model configuration. As expected, OA concentration increases when IVOC emissions over Europe are taken into account during the simulated period, with an overall mean increase of about 12 %, 2 %, 5 %, 10 % and 20 % for the IVOC150POA, IVOC4VOC, IVOC16VOC, IVOC30VOC and IVOC65VOC configurations, respectively. The relative differences show large increases of OA concentrations (reaching +40 %) over a wide area including the North Sea and Benelux for the IVOC65VOC configuration, owing to the low simulated OA concentrations with the ref-VBS-GECKO configuration. The IVOC150POA configuration leads to mean OA mass concentrations lying between the IVOC16VOC and the IVOC30VOC configurations. Areas showing substantial changes in simulated OA are, however, different between these model configurations. In the IVOC150POA configuration, the largest OA concentration increase is simulated over the Channel and Gibraltar's Detroit (up to +80 %). These results were expected for this model configuration based on POA emissions. Indeed, ships are one of the most important sources of POA but emit a relatively small amount of NMVOCs. For example, the EMEP inventory for 2013 estimates an average NMVOC∕POA emission ratio of ∼4 for road traffic in Europe and ∼0.4 for shipping in the studied domain.
Taking into account SOA formation from IVOC precursors improves the statistical indicators for the simulated concentrations of OM. As discussed previously, the ref-VBS-GECKO configuration underestimates OM Including IVOC emission increases the mean OM concentrations at the stations of about 5 %, 2 %, 5 %, 7 % or 13 % for the IVOC150POA, IVOC4VOC, IVOC16VOC, IVOC30VOC or IVOC65VOC configuration, respectively. Increasing IVOC emissions provide better statistical indicators for OM, with MFE and MFB significantly closer to the performance goal (MFE decreases by 0.06 and decreases by 0.09 between IVOC4VOC and IVOC65VOC configurations; see Table 6). For OC, however, the opposite trend is observed with a degradation of the statistical indicators (Table 6). The ref-VBS-GECKO configuration leads to a slight overestimation of OC concentrations over some stations (e.g., Iskrba; see Fig. 3) and adding the SOA source from IVOCs strengthens the deviation (up to about +30 % of RMSE for the IVOC65VOC configuration), even if the correlation is not significantly modified.
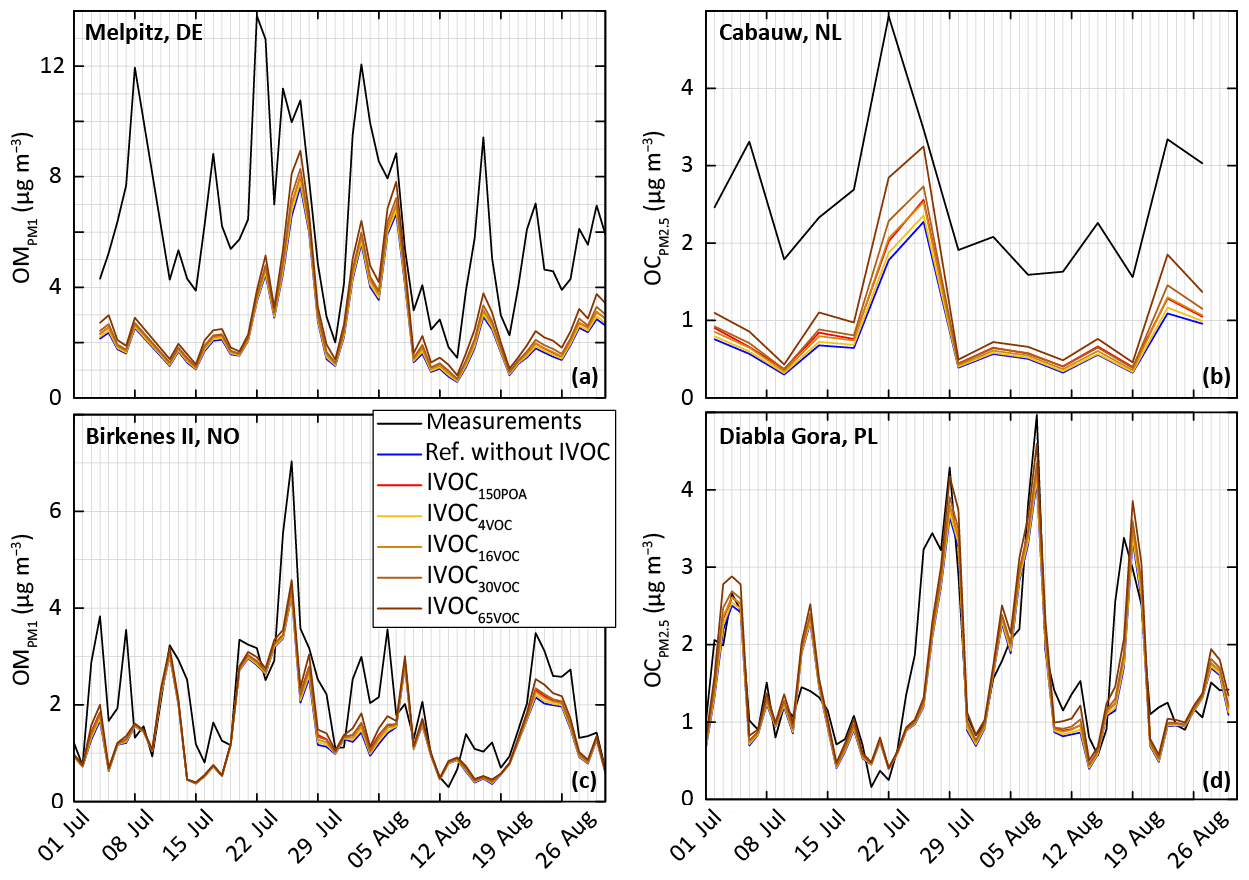
Figure 13Measured and simulated (for the ref-VBS-GECKO configuration without IVOC and the different model configuration considering IVOC emissions) temporal evolution of daily averaged OM concentrations (a, c) and OC concentrations (b, d). Top panels are for stations close to anthropogenic sources in Germany (Melpitz station, a) and the Netherlands (Cabauw station, b) and bottom panels for stations in remote areas in Norway (Birkenes II station, c) and Poland (Diabla Gora station, d).
IVOC oxidation appears to be a significant SOA source at some locations (e.g., the Cabauw station), especially in the IVOC30VOC and IVOC65VOC configuration. However, the resulting OA increase remains too weak to fill in the gaps between observations and simulated data (maximum increase around +40 %). For example, time series presented in Fig. 13 show that adding IVOC emission increases systematically the simulated OA concentrations, but it is not enough to explain the OA peaks recorded at the anthropogenic stations (see Fig. 13b). Moreover, accounting for IVOC emission strengthens the disagreement of the simulated concentrations with observations over other areas (e.g., at Iskrba station).
The various IVOC emission configurations are aimed to answer the following question: with constant POA and NMVOC emissions for the traffic, do IVOC emissions typical of diesel vehicles (upper limit) or gasoline vehicles (lower limit) significantly change OA concentrations in Europe, and in particular in anthropogenic areas? At a local scale where anthropogenic sources are dominant, IVOC emissions from traffic and transportation sources appear to be a significant source of OA and simulated OA concentrations are dependent to the IVOC emission configuration ( µg m−3 in northern Italy for IVOC65VOC against IVOC4VOC). At a continental scale outside anthropogenic areas, the low variations observed on simulated OA concentrations between the different IVOC emission configurations suggest that IVOCs from traffic and transportation sources are likely not a major source of SOA.
Apportionment of OA sources is investigated in this section. The study takes into account OA formation from IVOC oxidation and is based on the IVOC30VOC model configuration. Figure 14 shows the contribution of the various OA sources to the simulated OA concentrations during the July–August 2013 period and the mean daily profiles at two stations located in areas dominantly impacted by anthropogenic air masses (Cabauw and Palaiseau) and two stations located in areas dominantly impacted by biogenic air masses (Birkenes II and Iskrba). SOA constitutes the main fraction of OA whatever the environment. This secondary fraction typically grows from anthropogenically impacted areas (about 70 % at Palaiseau station) to remote areas (about 95 % at Iskrba station). This trend is in agreement with what is usually observed or simulated for summertime periods (e.g., Aksoyoglu et al., 2011; Belis et al., 2013). For the remote stations Birkenes II and Iskrba, respectively 82 % and 67 % of the simulated OA concentrations come from a biogenic source. Contrariwise, anthropogenic sources are the major OA contributors at anthropogenically impacted stations (65 % and 60 % of OA at the Cabauw and Palaiseau stations, respectively).
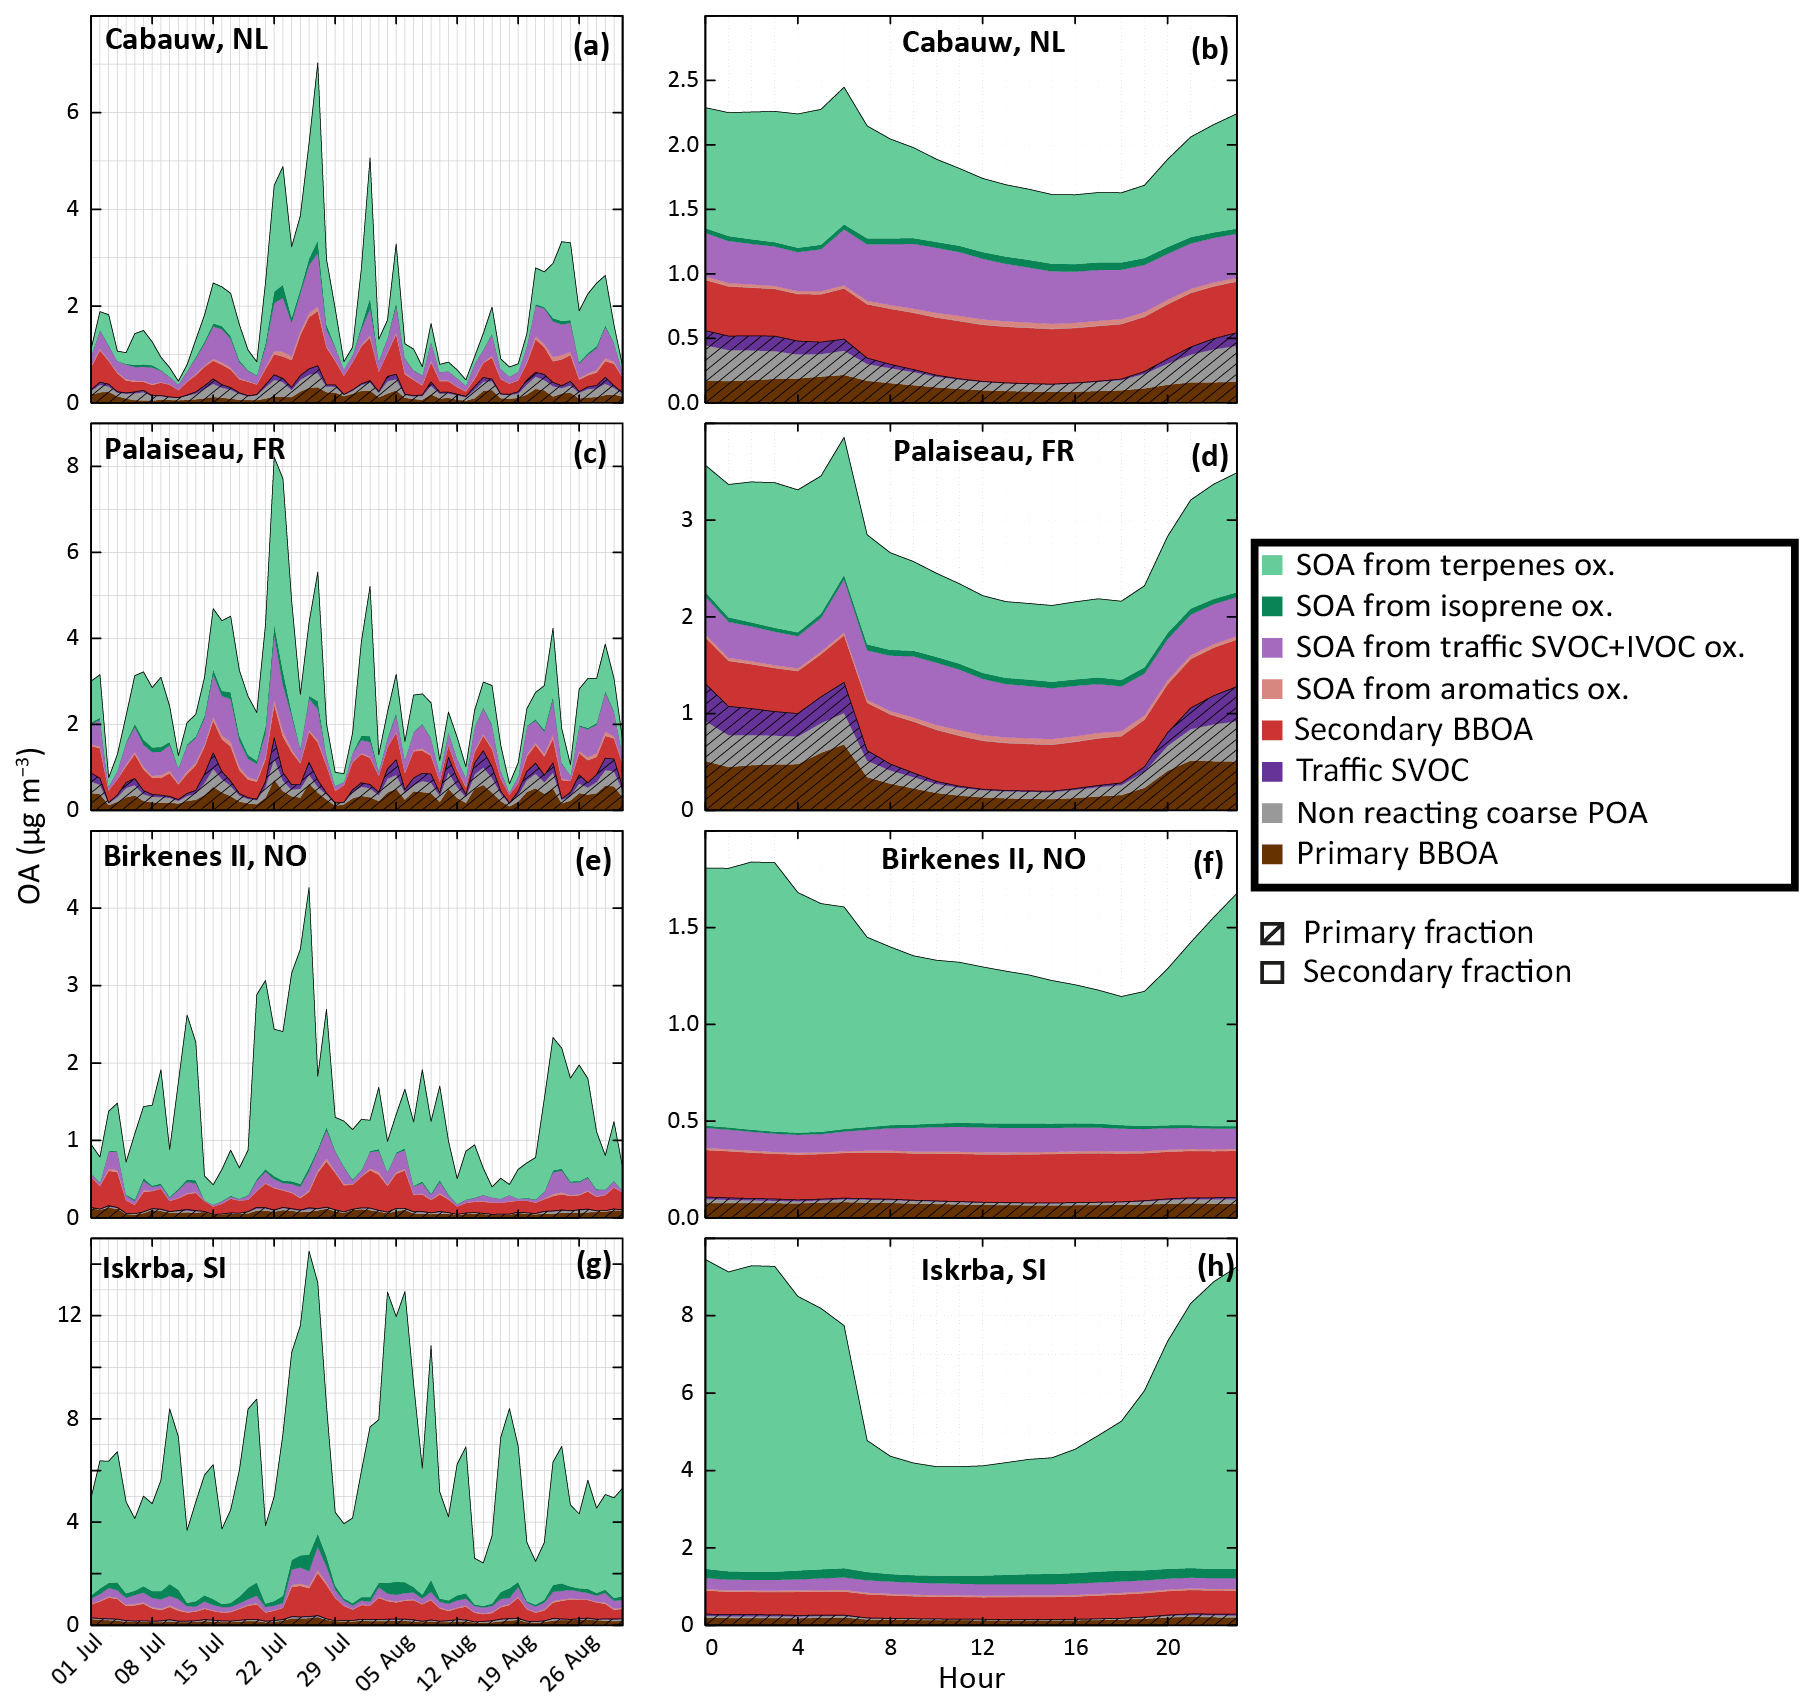
Figure 14Evolution of simulated OA concentrations and distribution function of sources with the IVOC30VOC model configuration. Panels (a), (c), (e) and (g) present evolutions of daily averaged concentrations during the July–August 2013. Panels (b), (d), (f) and (h) present mean daily profiles. Results are shown at two stations influenced by anthropogenic sources in the Netherlands (Cabauw, a, b) and in France (Palaiseau, c, d) and at two stations influenced by biogenic sources in Norway (Birkenes II, e, f) and Slovenia (Iskrba, g, h). Primary and secondary BBOA include compounds from biomass burning. Traffic SVOC includes C14 to C26 VBS-GECKO alkanes and alkenes and SOA from traffic SVOC+IVOC oxidation includes their oxidation products. SOA from terpenes includes all species produced by α-pinene, β-pinene, limonene, ocimene and humulene oxidation.
Among OA biogenic sources, terpene oxidation is clearly found as the major contributor of OA during the summer period, contributing from 35 % (at anthropogenic impacted stations) to 80 % (at remote stations) of the total OA mass. The 60 % increase in OA mass concentration observed in northern Europe between H2O and VBS-GECKO parameterizations (see Fig. 2) is also mainly related to SOA formation from terpene, especially ocimene and limonene. In our simulation, SOA produced by isoprene oxidation does not represent a substantial fraction of OA at the selected measurement stations. The major contribution of isoprene SOA to OA reaches about 5 % (see Fig. 14h) and is observed at the Iskrba station during diurnal conditions.
The anthropogenic fraction of OA is found to be dominated by residential biomass burning OA sources (BBOA). Indeed, according to the temporal factors used in CHIMERE (based on GENEMIS; Ebel et al., 1997; Friedrich, 2000), 4 % of annual emissions of residential BBOA occurs during July–August, leading to a non-negligible amount of residential BBOA during summer. This result remains, however, subject to caution, owing to the large uncertainties in the temporalization of biomass burning emissions in the model. The primary organic fraction (i.e., condensed primary SVOCs) from traffic emissions is found to be substantial in the OA budget only at night in urban areas. On the other hand, the secondary organic fraction produced by traffic emissions can represent about 50 % of diurnal anthropogenic OA at stations near urban areas (i.e., Palaiseau and Cabauw). OA formed by the oxidation of mono-aromatic species is found to be negligible over Europe (less than 0.025 µg m−3 on average over the studied domain). Figure 15 shows the contribution of traffic emission to the simulated OA concentrations for the July–August 2013 period for three categories of precursors: SVOCs, IVOCs and mono-aromatic compounds. As mentioned above, the OA concentrations from mono-aromatic compound oxidation are negligible compared to concentrations from traffic S/IVOC oxidation. Globally, in our study over Europe, OA concentrations produced from traffic S/IVOC oxidation are of the same order of magnitude. OA from primary SVOCs is locally more important close to sources (i.e., northern Italy, Moscow, Paris, Gibraltar, etc.). OA from IVOC is globally higher far away from the sources, with a higher dispersion over Europe (Fig. 15). This higher dispersion is expected owing to the larger timescale required to produce low-volatility species via multistep oxidation processes in the plumes of high emission areas.
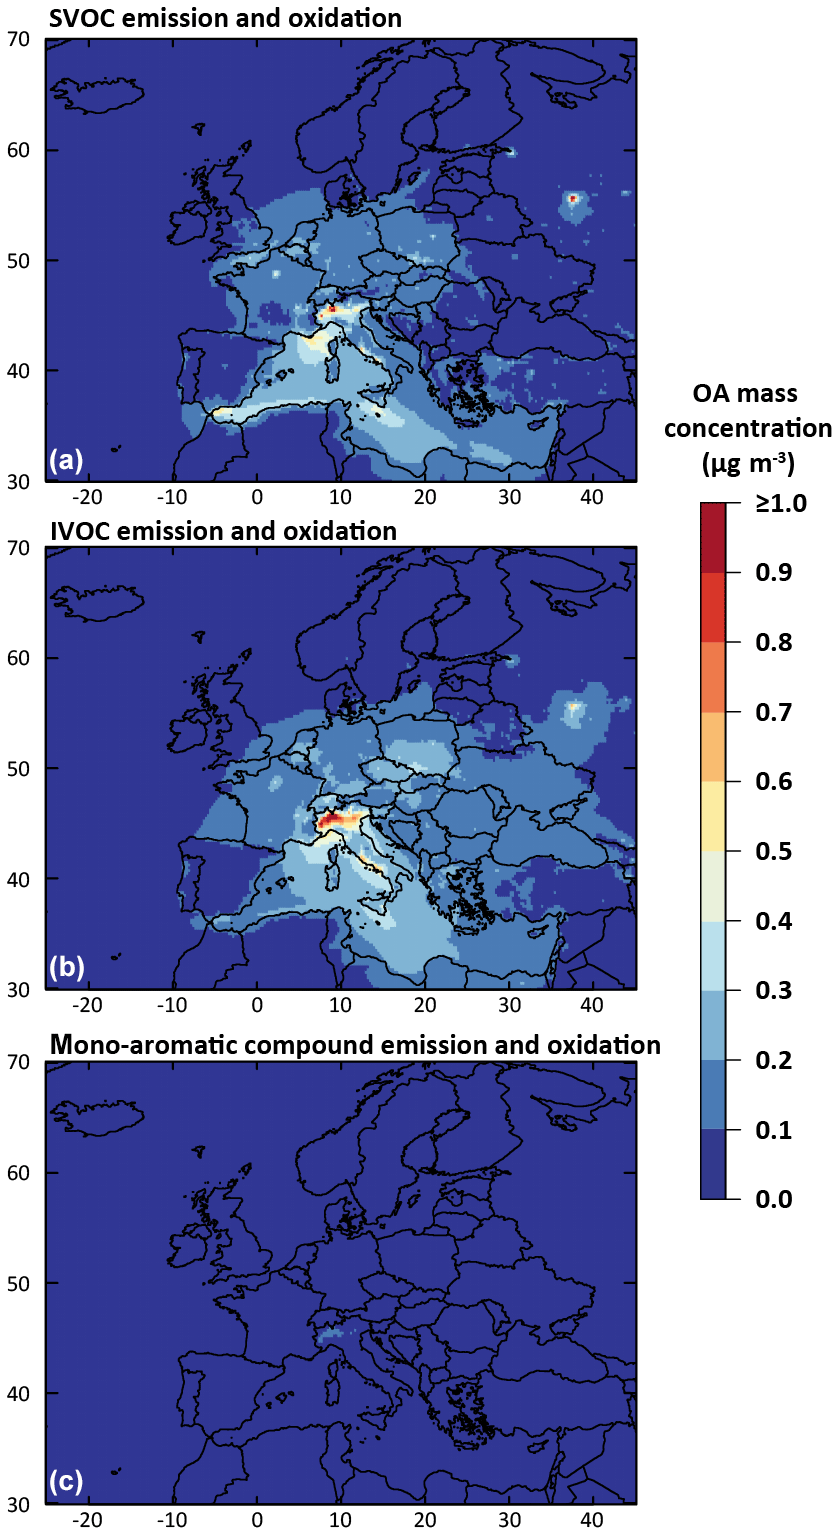
Figure 15Mean simulated anthropogenic OA mass concentration formed by the partitioning of species produced from the oxidation of emitted traffic SVOCs (a), traffic IVOCs (b) and mono-aromatic compound (c) for July–August 2013 over Europe (data from IVOC30VOC simulation).
The distributions of OA within the volatility bins (given in Fig. S2) show similar features from one station to another. The results suggest that OA over Europe has relatively low volatility during summertime. Indeed, the VBS-GECKO contributors to OA have very low volatility: ∼80 % of the OA contributors from VBS-GECKO are volatility bins 7 to 5 (VBk,7, VBk,6 and VBk,5 species), i.e., having saturation vapor pressure at 298 K of 10−14, 10−12 and 10−11 atm, respectively.
The VBS-GECKO parameterization for SOA production was developed based on explicit mechanisms generated with the GECKO-A tool. The VBS-GECKO parameterization was fitted using box modeling results for a selected set of parent compounds including terpenes, mono-aromatic compounds, linear alkanes and alkenes and for various environmental conditions, including different NOx regimes, temperatures, and OA loads (Lannuque et al., 2018a). In this study, the VBS-GECKO parameterization was evaluated in the CHIMERE β 2017 CTM over Europe during summertime.
The VBS-GECKO parameterization shows good performances to simulate OA concentrations over Europe in the summer. Calculated mean fractional biases and mean fractional errors on PM2.5, OC and OM satisfy the performance criteria of Boylan and Russel (2006). The model configuration including the VBS-GECKO parameterization yields to higher OA concentrations compared to the former reference configuration including the H2O parameterization. The deviations between the two configurations are especially marked over northern Europe, with an increase factor of ∼60 %. Outside this area, the OA increases obtained with the VBS-GECKO configuration are slight. Statistically, the use of the VBS-GECKO improves the overall MFB, MFE and RMSE and does not modify significantly correlation coefficients. Tests performed to examine the sensitivity of simulated OA concentrations to hydro-solubility, volatility, aging rates and NOx regimes have shown that the VBS-GECKO parameterization provides consistent results that are not subject to large deviations induced by parameters provided by the gas-phase mechanism included in the CTM (e.g., HOx or NOx concentrations). However, the OA concentrations remain underestimated with the VBS-GECKO model configuration, especially in areas with a significant contribution of anthropogenic sources (e.g., reaching a factor of 2.5 for OC at the NL0644R station in the Netherlands). None of the conducted sensitivity tests leads to OA variations large enough to fill the gaps between measurements and simulated concentrations at the anthropogenic stations.
The analysis of simulated OA shows that, during summertime, the main fraction is made of secondary matter which represents ∼85 % of the total mean OA concentration. A large fraction of the simulated OA comes from biogenic sources (between 30 % and 85 % of the total OA), especially from terpene oxidation which represents ∼95 % of these biogenic sources. For the conditions examined in this study, OA formed by the oxidation of mono-aromatic compounds appears to be negligible with maximum mean concentrations of 0.025 µg m−3 over the North Sea and Benelux. Note that ignoring SOA production from these precursors in the model would substantially reduce the number of VBk,i species currently considered in the VBS-GECKO parameterization. The simulated OA was found to be made of species having low and extremely low volatilities in remote areas but also of SVOCs closer to major anthropogenic sources.
Finally, IVOC oxidation was added to examine the contribution of this additional source to the SOA budget. Five model configurations with distinct IVOC emissions from traffic were tested and compared using the VBS-GECKO parameterization in CHIMERE. As expected, considering the emission of IVOCs by traffic and transport sources was found to globally increase background OA concentrations. Although SOA production from traffic IVOC oxidation can locally be significant (up to 3 µg m−3 in northern Italy, assuming IVOC emissions represents 65 % of NMVOC emissions), this additional OA source remains too small to explain the gap between simulated and measured values at stations where anthropogenic sources are dominant. This first application of this new VBS-GECKO parameterization has been shown to provide consistent results. This outcome creates motivation to extend the exploration to wintertime conditions and to expand the list of parent compounds considered, in particular to include SOA formation from oxidation of isoprene, sesquiterpenes or organics species emitted by residential biomass burning, a prerequisite to extend the evaluation and analysis to wintertime when this source is dominant. This is the subject of ongoing studies. The VBS-GECKO is a heavy parameterization in term of species number. Calculation time is multiplied by 2 using the complete VBS-GECKO scheme with IVOCs compared to H2O. This study has shown that the number of species can be optimized. For example, because of the low influence on OA concentrations, the representation of the SOA formed by the oxidation of mono-aromatic species can be highly simplified and C10 precursors even removed.
Daily averages and mean day profiles for the 17 model configurations presented in this article have been made available on Zenodo: https://doi.org/10.5281/zenodo.1654297 (Lannuque et al., 2018b).
The supplement related to this article is available online at: https://doi.org/10.5194/acp-20-4905-2020-supplement.
VL implemented the parameterization in the air quality model, conducted the simulations and the sensitivity tests, and wrote the article. FC conducted the reference simulation. VL, FC, MC, BA and BB contributed to design the research, develop the parameterization, interpret the data and revise the article.
The authors declare that they have no conflict of interest.
The authors gratefully acknowledge Wenche Aas, Olivier Favez, Liine Heikkinen and Laurent Poulain for providing ACSM data realized in the framework of ACTRIS. Simulations were performed using the TGCC-CCRT supercomputers.
This research has been supported by the French Environment and Energy Management Agency (ADEME), INERIS and the French Ministry of Ecology.
This paper was edited by Gordon McFiggans and reviewed by two anonymous referees.
Ahmadov, R., McKeen, S. A., Robinson, A. L., Bahreini, R., Middlebrook, A. M., de Gouw, J. A., Meagher, J., Hsie, E.-Y., Edgerton, E., Shaw, S., and Trainer, M.: A volatility basis set model for summertime secondary organic aerosols over the eastern United States in 2006, J. Geophys. Res.-Atmos., 117, D06301, https://doi.org/10.1029/2011jd016831, 2012.
Akherati, A., Cappa, C. D., Kleeman, M. J., Docherty, K. S., Jimenez, J. L., Griffith, S. M., Dusanter, S., Stevens, P. S., and Jathar, S. H.: Simulating secondary organic aerosol in a regional air quality model using the statistical oxidation model – Part 3: Assessing the influence of semi-volatile and intermediate-volatility organic compounds and NOx, Atmos. Chem. Phys., 19, 4561–4594, https://doi.org/10.5194/acp-19-4561-2019, 2019.
Aksoyoglu, S., Keller, J., Barmpadimos, I., Oderbolz, D., Lanz, V. A., Prévôt, A. S. H., and Baltensperger, U.: Aerosol modelling in Europe with a focus on Switzerland during summer and winter episodes, Atmos. Chem. Phys., 11, 7355–7373, https://doi.org/10.5194/acp-11-7355-2011, 2011.
Aumont, B., Szopa, S., and Madronich, S.: Modelling the evolution of organic carbon during its gas-phase tropospheric oxidation: development of an explicit model based on a self generating approach, Atmos. Chem. Phys., 5, 2497–2517, https://doi.org/10.5194/acp-5-2497-2005, 2005.
Belis, C. A., Karagulian, F., Larsen, B. R., and Hopke, P. K.: Critical review and meta-analysis of ambient particulate matter source apportionment using receptor models in Europe, Atmos. Environ., 69, 94–108, https://doi.org/10.1016/j.atmosenv.2012.11.009, 2013.
Bergström, R., Denier van der Gon, H. A. C., Prévôt, A. S. H., Yttri, K. E., and Simpson, D.: Modelling of organic aerosols over Europe (2002–2007) using a volatility basis set (VBS) framework: application of different assumptions regarding the formation of secondary organic aerosol, Atmos. Chem. Phys., 12, 8499–8527, https://doi.org/10.5194/acp-12-8499-2012, 2012.
Bessagnet, B., Hodzic, A., Vautard, R., Beekmann, M., Cheinet, S., Honoré, C., Liousse, C., and Rouil, L.: Aerosol modeling with CHIMERE – Preliminary evaluation at the continental scale, Atmos. Environ., 38, 2803–2817, https://doi.org/10.1016/j.atmosenv.2004.02.034, 2004.
Bessagnet, B., Menut, L., Curci, G., Hodzic, A., Guillaume, B., Liousse, C., Moukhtar, S., Pun, B., Seigneur, C., and Schulz, M.: Regional modeling of carbonaceous aerosols over Europe—focus on secondary organic aerosols, J. Atmos. Chem., 61, 175–202, https://doi.org/10.1007/s10874-009-9129-2, 2009.
Bessagnet, B., Seigneur, C., and Menut, L.: Impact of dry deposition of semi-volatile organic compounds on secondary organic aerosols, Atmos. Environ., 44, 1781–1787, https://doi.org/10.1016/j.atmosenv.2010.01.027, 2010.
Bessagnet, B., Pirovano, G., Mircea, M., Cuvelier, C., Aulinger, A., Calori, G., Ciarelli, G., Manders, A., Stern, R., Tsyro, S., García Vivanco, M., Thunis, P., Pay, M.-T., Colette, A., Couvidat, F., Meleux, F., Rouïl, L., Ung, A., Aksoyoglu, S., Baldasano, J. M., Bieser, J., Briganti, G., Cappelletti, A., D'Isidoro, M., Finardi, S., Kranenburg, R., Silibello, C., Carnevale, C., Aas, W., Dupont, J.-C., Fagerli, H., Gonzalez, L., Menut, L., Prévôt, A. S. H., Roberts, P., and White, L.: Presentation of the EURODELTA III intercomparison exercise – evaluation of the chemistry transport models' performance on criteria pollutants and joint analysis with meteorology, Atmos. Chem. Phys., 16, 12667–12701, https://doi.org/10.5194/acp-16-12667-2016, 2016.
Boucher, O., Randall, D., Artaxo, P., Bretherton, C., Feingold, G., Forster, P., Kerminen, V.-M., Kondo, Y., Liao, H., Lohmann, U., Rasch, P., Satheesh, S. K., Sherwood, S., Stevens, B., and Zhang, X. Y.: Clouds and Aerosols, in Climate Change 2013 – The Physical Science Basis. Contribution of Working Group I to the Fifth Assessment Report of the Intergovernmental Panel on Climate Change, edited by: Stocker, T. F., Qin, D., Plattner, G.-K., Tignor, M., Allen, S. K., Boschung, J., Nauels, A., Xia, Y., Bex, V., and Midgley, P. M., Cambridge University Press, Cambridge, UK and New York, NY, USA, 571–658, 2013.
Boylan, J. W. and Russell, A. G.: PM and light extinction model performance metrics, goals, and criteria for three-dimensional air quality models, Atmos. Environ., 40, 4946–4959, https://doi.org/10.1016/j.atmosenv.2005.09.087, 2006.
Brégonzio-Rozier, L., Giorio, C., Siekmann, F., Pangui, E., Morales, S. B., Temime-Roussel, B., Gratien, A., Michoud, V., Cazaunau, M., DeWitt, H. L., Tapparo, A., Monod, A., and Doussin, J.-F.: Secondary organic aerosol formation from isoprene photooxidation during cloud condensation–evaporation cycles, Atmos. Chem. Phys., 16, 1747–1760, https://doi.org/10.5194/acp-16-1747-2016, 2016.
Camredon, M., Aumont, B., Lee-Taylor, J., and Madronich, S.: The SOA/VOC/NOx system: an explicit model of secondary organic aerosol formation, Atmos. Chem. Phys., 7, 5599–5610, https://doi.org/10.5194/acp-7-5599-2007, 2007.
Canagaratna, M. R., Jimenez, J. L., Kroll, J. H., Chen, Q., Kessler, S. H., Massoli, P., Hildebrandt Ruiz, L., Fortner, E., Williams, L. R., Wilson, K. R., Surratt, J. D., Donahue, N. M., Jayne, J. T., and Worsnop, D. R.: Elemental ratio measurements of organic compounds using aerosol mass spectrometry: characterization, improved calibration, and implications, Atmos. Chem. Phys., 15, 253–272, https://doi.org/10.5194/acp-15-253-2015, 2015.
Cappa, C. D. and Wilson, K. R.: Multi-generation gas-phase oxidation, equilibrium partitioning, and the formation and evolution of secondary organic aerosol, Atmos. Chem. Phys., 12, 9505–9528, https://doi.org/10.5194/acp-12-9505-2012, 2012.
Cappa, C. D., Jathar, S. H., Kleeman, M. J., Docherty, K. S., Jimenez, J. L., Seinfeld, J. H., and Wexler, A. S.: Simulating secondary organic aerosol in a regional air quality model using the statistical oxidation model – Part 2: Assessing the influence of vapor wall losses, Atmos. Chem. Phys., 16, 3041–3059, https://doi.org/10.5194/acp-16-3041-2016, 2016.
Carlton, A. G., Wiedinmyer, C., and Kroll, J. H.: A review of Secondary Organic Aerosol (SOA) formation from isoprene, Atmos. Chem. Phys., 9, 4987–5005, https://doi.org/10.5194/acp-9-4987-2009, 2009.
Carter, W. P. L.: A detailed mechanism for the gas-phase atmospheric reactions of organic compounds, Atmos. Environ., 24, 481–518, https://doi.org/10.1016/0960-1686(90)90005-8, 1990.
Chrit, M., Sartelet, K., Sciare, J., Pey, J., Marchand, N., Couvidat, F., Sellegri, K., and Beekmann, M.: Modelling organic aerosol concentrations and properties during ChArMEx summer campaigns of 2012 and 2013 in the western Mediterranean region, Atmos. Chem. Phys., 17, 12509–12531, https://doi.org/10.5194/acp-17-12509-2017, 2017.
Ciarelli, G., Aksoyoglu, S., Crippa, M., Jimenez, J.-L., Nemitz, E., Sellegri, K., Äijälä, M., Carbone, S., Mohr, C., O'Dowd, C., Poulain, L., Baltensperger, U., and Prévôt, A. S. H.: Evaluation of European air quality modelled by CAMx including the volatility basis set scheme, Atmos. Chem. Phys., 16, 10313–10332, https://doi.org/10.5194/acp-16-10313-2016, 2016.
Ciarelli, G., Aksoyoglu, S., El Haddad, I., Bruns, E. A., Crippa, M., Poulain, L., Äijälä, M., Carbone, S., Freney, E., O'Dowd, C., Baltensperger, U., and Prévôt, A. S. H.: Modelling winter organic aerosol at the European scale with CAMx: evaluation and source apportionment with a VBS parameterization based on novel wood burning smog chamber experiments, Atmos. Chem. Phys., 17, 7653–7669, https://doi.org/10.5194/acp-17-7653-2017, 2017.
Couvidat, F. and Sartelet, K.: The Secondary Organic Aerosol Processor (SOAP v1.0) model: a unified model with different ranges of complexity based on the molecular surrogate approach, Geosci. Model Dev., 8, 1111–1138, https://doi.org/10.5194/gmd-8-1111-2015, 2015.
Couvidat, F. and Seigneur, C.: Modeling secondary organic aerosol formation from isoprene oxidation under dry and humid conditions, Atmos. Chem. Phys., 11, 893–909, https://doi.org/10.5194/acp-11-893-2011, 2011.
Couvidat, F., Debry, É., Sartelet, K., and Seigneur, C.: A hydrophilic/hydrophobic organic (H2O) aerosol model: Development, evaluation and sensitivity analysis, J. Geophys. Res., 117, D10304, https://doi.org/10.1029/2011JD017214, 2012.
Couvidat, F., Kim, Y., Sartelet, K., Seigneur, C., Marchand, N., and Sciare, J.: Modeling secondary organic aerosol in an urban area: application to Paris, France, Atmos. Chem. Phys., 13, 983–996, https://doi.org/10.5194/acp-13-983-2013, 2013.
Couvidat, F., Bessagnet, B., Garcia-Vivanco, M., Real, E., Menut, L., and Colette, A.: Development of an inorganic and organic aerosol model (CHIMERE 2017 β v1.0): seasonal and spatial evaluation over Europe, Geosci. Model Dev., 11, 165–194, https://doi.org/10.5194/gmd-11-165-2018, 2018.
Crippa, M., Canonaco, F., Lanz, V. A., Äijälä, M., Allan, J. D., Carbone, S., Capes, G., Ceburnis, D., Dall'Osto, M., Day, D. A., DeCarlo, P. F., Ehn, M., Eriksson, A., Freney, E., Hildebrandt Ruiz, L., Hillamo, R., Jimenez, J. L., Junninen, H., Kiendler-Scharr, A., Kortelainen, A.-M., Kulmala, M., Laaksonen, A., Mensah, A. A., Mohr, C., Nemitz, E., O'Dowd, C., Ovadnevaite, J., Pandis, S. N., Petäjä, T., Poulain, L., Saarikoski, S., Sellegri, K., Swietlicki, E., Tiitta, P., Worsnop, D. R., Baltensperger, U., and Prévôt, A. S. H.: Organic aerosol components derived from 25 AMS data sets across Europe using a consistent ME-2 based source apportionment approach, Atmos. Chem. Phys., 14, 6159–6176, https://doi.org/10.5194/acp-14-6159-2014, 2014.
Crounse, J. D., Nielsen, L. B., Jørgensen, S., Kjaergaard, H. G., and Wennberg, P. O.: Autoxidation of organic compounds in the atmosphere, J. Phys. Chem. Lett., 4, 3513–3520, https://doi.org/10.1021/jz4019207, 2013.
Debry, E., Fahey, K., Sartelet, K., Sportisse, B., and Tombette, M.: Technical Note: A new SIze REsolved Aerosol Model (SIREAM), Atmos. Chem. Phys., 7, 1537–1547, https://doi.org/10.5194/acp-7-1537-2007, 2007.
Denier van der Gon, H. A. C., Bergström, R., Fountoukis, C., Johansson, C., Pandis, S. N., Simpson, D., and Visschedijk, A. J. H.: Particulate emissions from residential wood combustion in Europe – revised estimates and an evaluation, Atmos. Chem. Phys., 15, 6503–6519, https://doi.org/10.5194/acp-15-6503-2015, 2015.
Denjean, C., Formenti, P., Picquet-Varrault, B., Camredon, M., Pangui, E., Zapf, P., Katrib, Y., Giorio, C., Tapparo, A., Temime-Roussel, B., Monod, A., Aumont, B., and Doussin, J. F.: Aging of secondary organic aerosol generated from the ozonolysis of α-pinene: effects of ozone, light and temperature, Atmos. Chem. Phys., 15, 883–897, https://doi.org/10.5194/acp-15-883-2015, 2015.
Denkenberger, K. A., Moffet, R. C., Holecek, J. C., Rebotier, T. P., and Prather, K. A.: Real-time, single-particle measurements of oligomers in aged ambient aerosol particles, Environ. Sci. Technol., 41, 5439–5446, https://doi.org/10.1021/es070329l, 2007.
Dommen, J., Metzger, A., Duplissy, J., Kalberer, M., Alfarra, M. R., Gascho, A., Weingartner, E., Prevot, A. S. H., Verheggen, B., and Baltensperger, U.: Laboratory observation of oligomers in the aerosol from isoprene/NOx photooxidation, Geophys. Res. Lett., 33, 1–5, https://doi.org/10.1029/2006GL026523, 2006.
Donahue, N. M., Huff Hartz, K. E., Chuong, B., Presto, A. A., Stanier, C. O., Rosenhorn, T., Robinson, A. L., and Pandis, S. N.: Critical factors determining the variation in SOA yields from terpene ozonolysis: A combined experimental and computational study, Faraday Discuss., 130, 295–309, https://doi.org/10.1039/b417369d, 2005.
Donahue, N. M., Robinson, A. L., Stanier, C. O., and Pandis, S. N.: Coupled partitioning, dilution, and chemical aging of semivolatile organics, Environ. Sci. Technol., 40, 2635–2643, https://doi.org/10.1021/es052297c, 2006.
Donahue, N. M., Kroll, J. H., Pandis, S. N., and Robinson, A. L.: A two-dimensional volatility basis set – Part 2: Diagnostics of organic-aerosol evolution, Atmos. Chem. Phys., 12, 615–634, https://doi.org/10.5194/acp-12-615-2012, 2012.
Ebel, A., Friedrich, R., and Rodhe, H.: GENEMIS: Assessment, Improvement, and Temporal and Spatial Disaggregation of European Emission Data, in Tropospheric Modelling and Emission Estimation, Springer Berlin Heidelberg, Berlin, Heidelberg, Germany, 181–214, 1997.
Ehn, M., Thornton, J. A., Kleist, E., Sipila, M., Junninen, H., Pullinen, I., Springer, M., Rubach, F., Tillmann, R., Lee, B., Lopez-Hilfiker, F., Andres, S., Acir, I. H., Rissanen, M., Jokinen, T., Schobesberger, S., Kangasluoma, J., Kontkanen, J., Nieminen, T., Kurten, T., Nielsen, L. B., Jorgensen, S., Kjaergaard, H. G., Canagaratna, M., Dal Maso, M., Berndt, T., Petaja, T., Wahner, A., Kerminen, V. M., Kulmala, M., Worsnop, D. R., Wildt, J., and Mentel, T. F.: A large source of low-volatility secondary organic aerosol, Nature, 506, 476–479, https://doi.org/10.1038/Nature13032, 2014.
Emmons, L. K., Walters, S., Hess, P. G., Lamarque, J.-F., Pfister, G. G., Fillmore, D., Granier, C., Guenther, A., Kinnison, D., Laepple, T., Orlando, J., Tie, X., Tyndall, G., Wiedinmyer, C., Baughcum, S. L., and Kloster, S.: Description and evaluation of the Model for Ozone and Related chemical Tracers, version 4 (MOZART-4), Geosci. Model Dev., 3, 43–67, https://doi.org/10.5194/gmd-3-43-2010, 2010.
Fountoukis, C. and Nenes, A.: ISORROPIA II: a computationally efficient thermodynamic equilibrium model for K+–Ca2+–Mg2+––Na+–––Cl−–H2O aerosols, Atmos. Chem. Phys., 7, 4639–4659, https://doi.org/10.5194/acp-7-4639-2007, 2007.
Fraser, M., Cass, G., Simoneit, B., and Rasmussen, R.: Air quality model evaluation data for organics .4. C2–C36 non-aromatic hydrocarbons, Environ. Sci. Technol., 31, 2356–2367, https://doi.org/10.1021/es960980g, 1997.
Fredenslund, A., Jones, R. L., and Prausnitz, J. M.: Group-contribution estimation of activity coefficients in nonideal liquid mixtures, AIChE J., 21, 1086–1099, https://doi.org/10.1002/aic.690210607, 1975.
Friedrich, R.: GENEMIS: Generation of European Emission Data for Episodes, in Transport and Chemical Transformation of Pollutants in the Troposphere, Springer Berlin Heidelberg, Berlin, Heidelberg, Germany, 375–386, 2000.
Gelencsér, A., May, B., Simpson, D., Sánchez-Ochoa, A., Kasper-Giebl, A., Puxbaum, H., Caseiro, A., Pio, C., and Legrand, M.: Source apportionment of PM2.5 organic aerosol over Europe: Primary/secondary, natural/anthropogenic, and fossil/biogenic origin, J. Geophys. Res., 112, D23S04, https://doi.org/10.1029/2006JD008094, 2007.
Gentner, D. R., Isaacman, G., Worton, D. R., Chan, A. W. H., Dallmann, T. R., Davis, L., Liu, S., Day, D. A., Russell, L. M., Wilson, K. R., Weber, R., Guha, A., Harley, R. A., and Goldstein, A. H.: Elucidating secondary organic aerosol from diesel and gasoline vehicles through detailed characterization of organic carbon emissions, P. Natl. Acad. Sci. USA, 109, 18318–18323, https://doi.org/10.1073/pnas.1212272109, 2012.
Grieshop, A. P., Logue, J. M., Donahue, N. M., and Robinson, A. L.: Laboratory investigation of photochemical oxidation of organic aerosol from wood fires 1: measurement and simulation of organic aerosol evolution, Atmos. Chem. Phys., 9, 1263–1277, https://doi.org/10.5194/acp-9-1263-2009, 2009.
Guenther, A. B., Jiang, X., Heald, C. L., Sakulyanontvittaya, T., Duhl, T., Emmons, L. K., and Wang, X.: The Model of Emissions of Gases and Aerosols from Nature version 2.1 (MEGAN2.1): an extended and updated framework for modeling biogenic emissions, Geosci. Model Dev., 5, 1471–1492, https://doi.org/10.5194/gmd-5-1471-2012, 2012.
Han, S., Bian, H., Zhang, Y., Wu, J., Wang, Y., Tie, X., Li, Y., Li, X., and Yao, Q.: Effect of Aerosols on Visibility and Radiation in Spring 2009 in Tianjin, China, Aerosol Air Qual. Res., 12, 211–217, https://doi.org/10.4209/aaqr.2011.05.0073, 2012.
Hatch, L. E., Rivas-Ubach, A., Jen, C. N., Lipton, M., Goldstein, A. H., and Barsanti, K. C.: Measurements of I/SVOCs in biomass-burning smoke using solid-phase extraction disks and two-dimensional gas chromatography, Atmos. Chem. Phys., 18, 17801–17817, https://doi.org/10.5194/acp-18-17801-2018, 2018.
Heald, C. L., Jacob, D. J., Park, R. J., Russell, L. M., Huebert, B. J., Seinfeld, J. H., Liao, H., and Weber, R. J.: A large organic aerosol source in the free troposphere missing from current models, Geophys. Res. Lett., 32, L18809, https://doi.org/10.1029/2005GL023831, 2005.
Hodzic, A., Jimenez, J. L., Madronich, S., Canagaratna, M. R., DeCarlo, P. F., Kleinman, L., and Fast, J.: Modeling organic aerosols in a megacity: potential contribution of semi-volatile and intermediate volatility primary organic compounds to secondary organic aerosol formation, Atmos. Chem. Phys., 10, 5491–5514, https://doi.org/10.5194/acp-10-5491-2010, 2010.
Hodzic, A., Aumont, B., Knote, C., Lee-Taylor, J., Madronich, S., and Tyndall, G.: Volatility dependence of Henry's law constants of condensable organics: Application to estimate depositional loss of secondary organic aerosols, Geophys. Res. Lett., 41, 4795–4804, https://doi.org/10.1002/2014GL060649, 2014.
Im, U., Bianconi, R., Solazzo, E., Kioutsioukis, I., Badia, A., Balzarini, A., Baró, R., Bellasio, R., Brunner, D., Chemel, C., Curci, G., Flemming, J., Forkel, R., Giordano, L., Jiménez-Guerrero, P., Hirtl, M., Hodzic, A., Honzak, L., Jorba, O., Knote, C., Kuenen, J. J. P., Makar, P. A., Manders-Groot, A., Neal, L., Pérez, J. L., Pirovano, G., Pouliot, G., San Jose, R., Savage, N., Schroder, W., Sokhi, R. S., Syrakov, D., Torian, A., Tuccella, P., Werhahn, J., Wolke, R., Yahya, K., Zabkar, R., Zhang, Y., Zhang, J., Hogrefe, C., and Galmarini, S.: Evaluation of operational on-line-coupled regional air quality models over Europe and North America in the context of AQMEII phase 2. Part I: Ozone, Atmos. Environ., 115, 404–420, https://doi.org/10.1016/j.atmosenv.2014.09.042, 2015.
Jacobson, M. Z., Turco, R. P., Jensen, E. J., and Toon, O. B.: Modeling coagulation among particles of different composition and size, Atmos. Environ., 28, 1327–1338, https://doi.org/10.1016/1352-2310(94)90280-1, 1994.
Jathar, S. H., Cappa, C. D., Wexler, A. S., Seinfeld, J. H., and Kleeman, M. J.: Multi-generational oxidation model to simulate secondary organic aerosol in a 3-D air quality model, Geosci. Model Dev., 8, 2553–2567, https://doi.org/10.5194/gmd-8-2553-2015, 2015.
Jathar, S. H., Woody, M., Pye, H. O. T., Baker, K. R., and Robinson, A. L.: Chemical transport model simulations of organic aerosol in southern California: model evaluation and gasoline and diesel source contributions, Atmos. Chem. Phys., 17, 4305–4318, https://doi.org/10.5194/acp-17-4305-2017, 2017.
Jimenez, J. L., Canagaratna, M. R., Donahue, N. M., Prevot, A. S. H., Zhang, Q., Kroll, J. H., DeCarlo, P. F., Allan, J. D., Coe, H., Ng, N. L., Aiken, A. C., Docherty, K. S., Ulbrich, I. M., Grieshop, A. P., Robinson, A. L., Duplissy, J., Smith, J. D., Wilson, K. R., Lanz, V. A., Hueglin, C., Sun, Y. L., Tian, J., Laaksonen, A., Raatikainen, T., Rautiainen, J., Vaattovaara, P., Ehn, M., Kulmala, M., Tomlinson, J. M., Collins, D. R., Cubison, M. J., Dunlea, E. J., Huffman, J. A., Onasch, T. B., Alfarra, M. R., Williams, P. I., Bower, K., Kondo, Y., Schneider, J., Drewnick, F., Borrmann, S., Weimer, S., Demerjian, K., Salcedo, D., Cottrell, L., Griffin, R., Takami, A., Miyoshi, T., Hatakeyama, S., Shimono, A., Sun, J. Y., Zhang, Y. M., Dzepina, K., Kimmel, J. R., Sueper, D., Jayne, J. T., Herndon, S. C., Trimborn, A. M., Williams, L. R., Wood, E. C., Middlebrook, A. M., Kolb, C. E., Baltensperger, U., and Worsnop, D. R.: Evolution of organic aerosols in the atmosphere., Science, 326, 1525–9, https://doi.org/10.1126/science.1180353, 2009.
Kalberer, M., Sax, M., and Samburova, V.: Molecular size evolution of oligomers in organic aerosols collected in urban atmospheres and generated in a smog chamber, Environ. Sci. Technol., 40, 5917–5922, https://doi.org/10.1021/es0525760, 2006.
Knote, C., Hodzic, A., Jimenez, J. L., Volkamer, R., Orlando, J. J., Baidar, S., Brioude, J., Fast, J., Gentner, D. R., Goldstein, A. H., Hayes, P. L., Knighton, W. B., Oetjen, H., Setyan, A., Stark, H., Thalman, R., Tyndall, G., Washenfelder, R., Waxman, E., and Zhang, Q.: Simulation of semi-explicit mechanisms of SOA formation from glyoxal in aerosol in a 3-D model, Atmos. Chem. Phys., 14, 6213–6239, https://doi.org/10.5194/acp-14-6213-2014, 2014.
Kroll, J. H. and Seinfeld, J. H.: Chemistry of secondary organic aerosol: Formation and evolution of low-volatility organics in the atmosphere, Atmos. Environ., 42, 3593–3624, https://doi.org/10.1016/j.atmosenv.2008.01.003, 2008.
Kulmala, M., Laaksonen, A., and Pirjola, L.: Parameterizations for sulfuric acid/water nucleation rates, J. Geophys. Res.-Atmos., 103, 8301–8307, https://doi.org/10.1029/97JD03718, 1998.
La, Y. S., Camredon, M., Ziemann, P. J., Valorso, R., Matsunaga, A., Lannuque, V., Lee-Taylor, J., Hodzic, A., Madronich, S., and Aumont, B.: Impact of chamber wall loss of gaseous organic compounds on secondary organic aerosol formation: explicit modeling of SOA formation from alkane and alkene oxidation, Atmos. Chem. Phys., 16, 1417–1431, https://doi.org/10.5194/acp-16-1417-2016, 2016.
Lane, T. E., Donahue, N. M., and Pandis, S. N.: Effect of NOx on secondary organic aerosol concentrations, Environ. Sci. Technol., 42, 6022–6027, https://doi.org/10.1021/es703225a, 2008.
Lannuque, V., Camredon, M., Couvidat, F., Hodzic, A., Valorso, R., Madronich, S., Bessagnet, B., and Aumont, B.: Exploration of the influence of environmental conditions on secondary organic aerosol formation and organic species properties using explicit simulations: development of the VBS-GECKO parameterization, Atmos. Chem. Phys., 18, 13411–13428, https://doi.org/10.5194/acp-18-13411-2018, 2018a.
Lannuque, V., Couvidat, F., Camredon, M., Aumont, B., and Bessagnet, B.: Modeling organic aerosol over Europe in summer conditions with the VBS-GECKO parameterization: sensitivity to secondary organic compound properties and IVOC emissions [Dataset], Zenodo, https://doi.org/10.5281/zenodo.1654297, 2018b.
Lecœur, È. and Seigneur, C.: Dynamic evaluation of a multi-year model simulation of particulate matter concentrations over Europe, Atmos. Chem. Phys., 13, 4319–4337, https://doi.org/10.5194/acp-13-4319-2013, 2013.
Lemaire, V., Coll, I., Couvidat, F., Mouchel-Vallon, C., Seigneur, C., and Siour, G.: Oligomer formation in the troposphere: from experimental knowledge to 3-D modeling, Geosci. Model Dev., 9, 1361–1382, https://doi.org/10.5194/gmd-9-1361-2016, 2016.
Lim, S. S., Vos, T., Flaxman, A. D., Danaei, G., Shibuya, K., Adair-Rohani, H., AlMazroa, M. A., Amann, M., Anderson, H. R., Andrews, K. G., Aryee, M., Atkinson, C., Bacchus, L. J., Bahalim, A. N., Balakrishnan, K., Balmes, J., Barker-Collo, S., Baxter, A., Bell, M. L., Blore, J. D., Blyth, F., Bonner, C., Borges, G., Bourne, R., Boussinesq, M., Brauer, M., Brooks, P., Bruce, N. G., Brunekreef, B., Bryan-Hancock, C., Bucello, C., Buchbinder, R., Bull, F., Burnett, R. T., Byers, T. E., Calabria, B., Carapetis, J., Carnahan, E., Chafe, Z., Charlson, F., Chen, H., Chen, J. S., Cheng, A. T.-A., Child, J. C., Cohen, A., Colson, K. E., Cowie, B. C., Darby, S., Darling, S., Davis, A., Degenhardt, L., Dentener, F., Des Jarlais, D. C., Devries, K., Dherani, M., Ding, E. L., Dorsey, E. R., Driscoll, T., Edmond, K., Ali, S. E., Engell, R. E., Erwin, P. J., Fahimi, S., Falder, G., Farzadfar, F., Ferrari, A., Finucane, M. M., Flaxman, S., Fowkes, F. G. R., Freedman, G., Freeman, M. K., Gakidou, E., Ghosh, S., Giovannucci, E., Gmel, G., Graham, K., Grainger, R., Grant, B., Gunnell, D., Gutierrez, H. R., Hall, W., Hoek, H. W., Hogan, A., Hosgood, H. D., Hoy, D., Hu, H., Hubbell, B. J., Hutchings, S. J., Ibeanusi, S. E., Jacklyn, G. L., Jasrasaria, R., Jonas, J. B., Kan, H., Kanis, J. A., Kassebaum, N., Kawakami, N., Khang, Y.-H., Khatibzadeh, S., Khoo, J.-P., Kok, C., Laden, F., Lalloo, R., Lan, Q., Lathlean, T., Leasher, J. L., Leigh, J., Li, Y., Lin, J. K., Lipshultz, S. E., London, S., Lozano, R., Lu, Y., Mak, J., Malekzadeh, R., Mallinger, L., Marcenes, W., March, L., Marks, R., Martin, R., McGale, P., McGrath, J., Mehta, S., Memish, Z. A., Mensah, G. A., Merriman, T. R., Micha, R., Michaud, C., Mishra, V., Hanafiah, K. M., Mokdad, A. A., Morawska, L., Mozaffarian, D., Murphy, T., Naghavi, M., Neal, B., Nelson, P. K., Nolla, J. M., Norman, R., Olives, C., Omer, S. B., Orchard, J., Osborne, R., Ostro, B., Page, A., Pandey, K. D., Parry, C. D. H., Passmore, E., Patra, J., Pearce, N., Pelizzari, P. M., Petzold, M., Phillips, M. R., Pope, D., Pope, C. A., Powles, J., Rao, M., Razavi, H., Rehfuess, E. A., Rehm, J. T., Ritz, B., Rivara, F. P., Roberts, T., Robinson, C., Rodriguez-Portales, J. A., Romieu, I., Room, R., Rosenfeld, L. C., Roy, A., Rushton, L., Salomon, J. A., Sampson, U., Sanchez-Riera, L., Sanman, E., Sapkota, A., Seedat, S., Shi, P., Shield, K., Shivakoti, R., Singh, G. M., Sleet, D. A., Smith, E., Smith, K. R., Stapelberg, N. J. C., Steenland, K., Stöckl, H., Stovner, L. J., Straif, K., Straney, L., Thurston, G. D., Tran, J. H., Van Dingenen, R., van Donkelaar, A., Veerman, J. L., Vijayakumar, L., Weintraub, R., Weissman, M. M., White, R. A., Whiteford, H., Wiersma, S. T., Wilkinson, J. D., Williams, H. C., Williams, W., Wilson, N., Woolf, A. D., Yip, P., Zielinski, J. M., Lopez, A. D., Murray, C. J. L., and Ezzati, M.: A comparative risk assessment of burden of disease and injury attributable to 67 risk factors and risk factor clusters in 21 regions, 1990–2010: a systematic analysis for the Global Burden of Disease Study 2010, Lancet, 380, 2224–2260, https://doi.org/10.1016/S0140-6736(12)61766-8, 2012.
Louvaris, E. E., Karnezi, E., Kostenidou, E., Kaltsonoudis, C., and Pandis, S. N.: Estimation of the volatility distribution of organic aerosol combining thermodenuder and isothermal dilution measurements, Atmos. Meas. Tech., 10, 3909–3918, https://doi.org/10.5194/amt-10-3909-2017, 2017.
Lu, Q., Zhao, Y., and Robinson, A. L.: Comprehensive organic emission profiles for gasoline, diesel, and gas-turbine engines including intermediate and semi-volatile organic compound emissions, Atmos. Chem. Phys., 18, 17637–17654, https://doi.org/10.5194/acp-18-17637-2018, 2018.
Mailler, S., Menut, L., Khvorostyanov, D., Valari, M., Couvidat, F., Siour, G., Turquety, S., Briant, R., Tuccella, P., Bessagnet, B., Colette, A., Létinois, L., Markakis, K., and Meleux, F.: CHIMERE-2017: from urban to hemispheric chemistry-transport modeling, Geosci. Model Dev., 10, 2397–2423, https://doi.org/10.5194/gmd-10-2397-2017, 2017.
Matsunaga, A. and Ziemann, P. J.: Aerosol Science and Technology Gas-Wall Partitioning of Organic Compounds in a Teflon Film Chamber and Potential Effects on Reaction Product and Aerosol Yield Measurements Gas-Wall Partitioning of Organic Compounds in a Teflon Film Chamber and Potential E, Aerosol Sci. Tech., 44, 881–892, https://doi.org/10.1080/02786826.2010.501044, 2010.
May, A. A., Presto, A. A., Hennigan, C. J., Nguyen, N. T., Gordon, T. D., and Robinson, A. L.: Gas-particle partitioning of primary organic aerosol emissions: (1) Gasoline vehicle exhaust, Atmos. Environ., 77, 128–139, https://doi.org/10.1016/j.atmosenv.2013.04.060, 2013a.
May, A. A., Presto, A. A., Hennigan, C. J., Nguyen, N. T., Gordon, T. D., and Robinson, A. L.: Gas-particle partitioning of primary organic aerosol emissions: (2) diesel vehicles, Environ. Sci. Technol., 47, 8288–8296, https://doi.org/10.1021/es400782j, 2013b.
May, A. A., Levin, E. J. T., Hennigan, C. J., Riipinen, I., Lee, T., Collett, J. L., Jimenez, J. L., Kreidenweis, S. M., and Robinson, A. L.: Gas-particle partitioning of primary organic aerosol emissions: 3. Biomass burning, J. Geophys. Res.-Atmos., 118, 11327–11338, https://doi.org/10.1002/jgrd.50828, 2013c.
McMurry, P. H. and Grosjean, D.: Gas and aerosol wall losses in Teflon film smog chambers, Environ. Sci. Technol., 19, 1176–1182, https://doi.org/10.1021/es00142a006, 1985.
McVay, R. C., Zhang, X., Aumont, B., Valorso, R., Camredon, M., La, Y. S., Wennberg, P. O., and Seinfeld, J. H.: SOA formation from the photooxidation of α-pinene: systematic exploration of the simulation of chamber data, Atmos. Chem. Phys., 16, 2785–2802, https://doi.org/10.5194/acp-16-2785-2016, 2016.
Menut, L., Bessagnet, B., Khvorostyanov, D., Beekmann, M., Blond, N., Colette, A., Coll, I., Curci, G., Foret, G., Hodzic, A., Mailler, S., Meleux, F., Monge, J.-L., Pison, I., Siour, G., Turquety, S., Valari, M., Vautard, R., and Vivanco, M. G.: CHIMERE 2013: a model for regional atmospheric composition modelling, Geosci. Model Dev., 6, 981–1028, https://doi.org/10.5194/gmd-6-981-2013, 2013.
Mircea, M., Bessagnet, B., D'Isidoro, M., Pirovano, G., Aksoyoglu, S., Ciarelli, G., Tsyro, S., Manders, A., Bieser, J., Stern, R., Vivanco, M. G., Cuvelier, C., Aas, W., Prévôt, A. S. H., Aulinger, A., Briganti, G., Calori, G., Cappelletti, A., Colette, A., Couvidat, F., Fagerli, H., Finardi, S., Kranenburg, R., Rouïl, L., Silibello, C., Spindler, G., Poulain, L., Herrmann, H., Jimenez, J. L., Day, D. A., Tiitta, P., and Carbone, S.: EURODELTA III exercise: An evaluation of air quality models' capacity to reproduce the carbonaceous aerosol, Atmos. Environ., 2, 100018, https://doi.org/10.1016/j.aeaoa.2019.100018, 2019.
Molteni, U., Bianchi, F., Klein, F., El Haddad, I., Frege, C., Rossi, M. J., Dommen, J., and Baltensperger, U.: Formation of highly oxygenated organic molecules from aromatic compounds, Atmos. Chem. Phys., 18, 1909–1921, https://doi.org/10.5194/acp-18-1909-2018, 2018.
Murphy, B. N., Woody, M. C., Jimenez, J. L., Carlton, A. M. G., Hayes, P. L., Liu, S., Ng, N. L., Russell, L. M., Setyan, A., Xu, L., Young, J., Zaveri, R. A., Zhang, Q., and Pye, H. O. T.: Semivolatile POA and parameterized total combustion SOA in CMAQv5.2: impacts on source strength and partitioning, Atmos. Chem. Phys., 17, 11107–11133, https://doi.org/10.5194/acp-17-11107-2017, 2017.
Ng, N. L., Chhabra, P. S., Chan, A. W. H., Surratt, J. D., Kroll, J. H., Kwan, A. J., McCabe, D. C., Wennberg, P. O., Sorooshian, A., Murphy, S. M., Dalleska, N. F., Flagan, R. C., and Seinfeld, J. H.: Effect of NOx level on secondary organic aerosol (SOA) formation from the photooxidation of terpenes, Atmos. Chem. Phys., 7, 5159–5174, https://doi.org/10.5194/acp-7-5159-2007, 2007.
Ntziachristos, L., Gkatzoflias, D., Kouridis, C., and Samaras, Z.: COPERT: A European Road Transport Emission Inventory Model, edited by: Athanasiadis, I. N., Rizzoli, A. E., Mitkas, P. A., and Gómez, J. M., Springer, Berlin, Heidelberg, Germany, 491–504, 2009.
Odum, J. R., Hoffmann, T., Bowman, F., Collins, D., Flagan, R. C., and Seinfeld, J. H.: Gas particle partitioning and secondary organic aerosol yields, Environ. Sci. Technol., 30, 2580–2585, https://doi.org/10.1021/es950943+, 1996.
Ots, R., Young, D. E., Vieno, M., Xu, L., Dunmore, R. E., Allan, J. D., Coe, H., Williams, L. R., Herndon, S. C., Ng, N. L., Hamilton, J. F., Bergström, R., Di Marco, C., Nemitz, E., Mackenzie, I. A., Kuenen, J. J. P., Green, D. C., Reis, S., and Heal, M. R.: Simulating secondary organic aerosol from missing diesel-related intermediate-volatility organic compound emissions during the Clean Air for London (ClearfLo) campaign, Atmos. Chem. Phys., 16, 6453–6473, https://doi.org/10.5194/acp-16-6453-2016, 2016.
Pandis, S. N., Wexler, A. S., and Seinfeld, J. H.: Secondary organic aerosol formation and transport – II. Predicting the ambient secondary organic aerosol size distribution, Atmos. Environ., 27, 2403–2416, https://doi.org/10.1016/0960-1686(93)90408-Q, 1993.
Passant, N. R.: Speciation of UK emissions of non-methane volatile organic compounds, AEA Technology Report ENV-0545, Culham, Abingdon, UK, 2002.
Paulot, F., Crounse, J. D., Kjaergaard, H. G., Kurten, A., St. Clair, J. M., Seinfeld, J. H., and Wennberg, P. O.: Unexpected Epoxide Formation in the Gas-Phase Photooxidation of Isoprene, Science, 325, 730–733, https://doi.org/10.1126/science.1172910, 2009.
Petetin, H., Beekmann, M., Sciare, J., Bressi, M., Rosso, A., Sanchez, O., and Ghersi, V.: A novel model evaluation approach focusing on local and advected contributions to urban PM2.5 levels – application to Paris, France, Geosci. Model Dev., 7, 1483–1505, https://doi.org/10.5194/gmd-7-1483-2014, 2014.
Pun, B. K., Griffin, R. J., Seigneur, C., and Seinfeld, J. H.: Secondary organic aerosol 2. Thermodynamic model for gas/particle partitioning of molecular constituents, J. Geophys. Res.-Atmos., 107, AAC4/1–AAC4/15, https://doi.org/10.1029/2001JD000542, 2002.
Pun, B. K., Wu, S. Y., Seigneur, C., Seinfeld, J. H., Griffin, R. J., and Pandis, S. N.: Uncertainties in modeling secondary organic aerosols: Three-dimensional modeling studies in Nashville/Western Tennessee, Environ. Sci. Technol., 37, 3647–3661, https://doi.org/10.1021/es0341541, 2003.
Pun, B. K., Seigneur, C., Vijayaraghavan, K., Wu, S. Y., Chen, S. Y., Knipping, E. M., and Kumar, N.: Modeling regional haze in the BRAVO study using CMAQ-MADRID: 1. Model evaluation, J. Geophys. Res.-Atmos., 111, 1–25, https://doi.org/10.1029/2004JD005608, 2006a.
Pun, B. K., Seigneur, C., and Lohman, K.: Modeling secondary organic aerosol formation via multiphase partitioning with molecular data, Environ. Sci. Technol., 40, 4722–4731, https://doi.org/10.1021/es0522736, 2006b.
Pye, H. O. T., Zuend, A., Fry, J. L., Isaacman-VanWertz, G., Capps, S. L., Appel, K. W., Foroutan, H., Xu, L., Ng, N. L., and Goldstein, A. H.: Coupling of organic and inorganic aerosol systems and the effect on gas–particle partitioning in the southeastern US, Atmos. Chem. Phys., 18, 357–370, https://doi.org/10.5194/acp-18-357-2018, 2018.
Rissanen, M. P., Kurtén, T., Sipilä, M., Thornton, J. A., Kausiala, O., Garmash, O., Kjaergaard, H. G., Petäjä, T., Worsnop, D. R., Ehn, M., and Kulmala, M.: Effects of chemical complexity on the autoxidation mechanisms of endocyclic alkene ozonolysis products: From methylcyclohexenes toward understanding? α-pinene, J. Phys. Chem. A, 119, 4633–4650, https://doi.org/10.1021/jp510966g, 2015.
Robinson, A. L., Donahue, N. M., Shrivastava, M. K., Weitkamp, E. A., Sage, A. M., Grieshop, A. P., Lane, T. E., Pierce, J. R., and Pandis, S. N.: Rethinking Organic Aerosols: Semivolatile Emissions and Photochemical Aging, Science, 315, 1259–1262, https://doi.org/10.1126/science.1133061, 2007.
Rudich, Y., Donahue, N. M., and Mentel, T. F.: Aging of Organic Aerosol: Bridging the Gap Between Laboratory and Field Studies, Annu. Rev. Phys. Chem., 58, 321–352, https://doi.org/10.1146/annurev.physchem.58.032806.104432, 2007.
Sarwar, G., Godowitch, J., Henderson, B. H., Fahey, K., Pouliot, G., Hutzell, W. T., Mathur, R., Kang, D., Goliff, W. S., and Stockwell, W. R.: A comparison of atmospheric composition using the Carbon Bond and Regional Atmospheric Chemistry Mechanisms, Atmos. Chem. Phys., 13, 9695–9712, https://doi.org/10.5194/acp-13-9695-2013, 2013.
Schauer, J. J., Kleeman, M. J., Cass, G. R., and Simoneit, B. R. T.: Measurement of emissions from air pollution sources. 2. C1 through C30 organic compounds from medium duty diesel trucks, Environ. Sci. Technol., 33, 1578–1587, https://doi.org/10.1021/es980081n, 1999.
Schauer, J. J., Kleeman, M. J., Cass, G. R., and Simoneit, B. R. T.: Measurement of emissions from air pollution sources. 5. C1–C32 organic compounds from gasoline-powered motor vehicles, Environ. Sci. Technol., 36, 1169–1180, https://doi.org/10.1021/es0108077, 2002.
Schell, B., Ackermann, I. J., Hass, H., Binkowski, F. S., and Ebel, A.: Modeling the formation of secondary organic aerosol within a comprehensive air quality model system, J. Geophys. Res.-Atmos., 106, 28275–28293, https://doi.org/10.1029/2001JD000384, 2001.
Schmidt, H., Derognat, C., Vautard, R., and Beekmann, M.: A comparison of simulated and observed ozone mixing ratios for the summer of 1998 in Western Europe, Atmos. Environ., 35, 6277–6297, https://doi.org/10.1016/S1352-2310(01)00451-4, 2001.
Shiraiwa, M., Zuend, A., Bertram, A. K., and Seinfeld, J. H.: Gas–particle partitioning of atmospheric aerosols: interplay of physical state, non-ideal mixing and morphology, Phys. Chem. Chem. Phys., 15, 11441, https://doi.org/10.1039/c3cp51595h, 2013.
Solazzo, E., Bianconi, R., Pirovano, G., Matthias, V., Vautard, R., Moran, M. D., Wyat Appel, K., Bessagnet, B., Brandt, J., Christensen, J. H., Chemel, C., Coll, I., Ferreira, J., Forkel, R., Francis, X. V, Grell, G., Grossi, P., Hansen, A. B., Miranda, A. I., Nopmongcol, U., Prank, M., Sartelet, K. N., Schaap, M., Silver, J. D., Sokhi, R. S., Vira, J., Werhahn, J., Wolke, R., Yarwood, G., Zhang, J., Rao, S. T., and Galmarini, S.: Operational model evaluation for particulate matter in Europe and North America in the context of AQMEII, Atmos. Environ., 53, 75–92, https://doi.org/10.1016/j.atmosenv.2012.02.045, 2012.
Surratt, J. D., Chan, A. W. H., Eddingsaas, N. C., Chan, M., Loza, C. L., Kwan, A. J., Hersey, S. P., Flagan, R. C., Wennberg, P. O., and Seinfeld, J. H.: Reactive intermediates revealed in secondary organic aerosol formation from isoprene, P. Natl. Acad. Sci. USA, 107, 6640–6645, https://doi.org/10.1073/pnas.0911114107, 2010.
Tørseth, K., Aas, W., Breivik, K., Fjæraa, A. M., Fiebig, M., Hjellbrekke, A. G., Lund Myhre, C., Solberg, S., and Yttri, K. E.: Introduction to the European Monitoring and Evaluation Programme (EMEP) and observed atmospheric composition change during 1972–2009, Atmos. Chem. Phys., 12, 5447–5481, https://doi.org/10.5194/acp-12-5447-2012, 2012.
Trump, E. R. and Donahue, N. M.: Oligomer formation within secondary organic aerosols: equilibrium and dynamic considerations, Atmos. Chem. Phys., 14, 3691–3701, https://doi.org/10.5194/acp-14-3691-2014, 2014.
Tsigaridis, K., Daskalakis, N., Kanakidou, M., Adams, P. J., Artaxo, P., Bahadur, R., Balkanski, Y., Bauer, S. E., Bellouin, N., Benedetti, A., Bergman, T., Berntsen, T. K., Beukes, J. P., Bian, H., Carslaw, K. S., Chin, M., Curci, G., Diehl, T., Easter, R. C., Ghan, S. J., Gong, S. L., Hodzic, A., Hoyle, C. R., Iversen, T., Jathar, S., Jimenez, J. L., Kaiser, J. W., Kirkevåg, A., Koch, D., Kokkola, H., Lee, Y. H., Lin, G., Liu, X., Luo, G., Ma, X., Mann, G. W., Mihalopoulos, N., Morcrette, J.-J., Müller, J.-F., Myhre, G., Myriokefalitakis, S., Ng, N. L., O'Donnell, D., Penner, J. E., Pozzoli, L., Pringle, K. J., Russell, L. M., Schulz, M., Sciare, J., Seland, Ø., Shindell, D. T., Sillman, S., Skeie, R. B., Spracklen, D., Stavrakou, T., Steenrod, S. D., Takemura, T., Tiitta, P., Tilmes, S., Tost, H., van Noije, T., van Zyl, P. G., von Salzen, K., Yu, F., Wang, Z., Wang, Z., Zaveri, R. A., Zhang, H., Zhang, K., Zhang, Q., and Zhang, X.: The AeroCom evaluation and intercomparison of organic aerosol in global models, Atmos. Chem. Phys., 14, 10845–10895, https://doi.org/10.5194/acp-14-10845-2014, 2014.
Tsimpidi, A. P., Karydis, V. A., Zavala, M., Lei, W., Molina, L., Ulbrich, I. M., Jimenez, J. L., and Pandis, S. N.: Evaluation of the volatility basis-set approach for the simulation of organic aerosol formation in the Mexico City metropolitan area, Atmos. Chem. Phys., 10, 525–546, https://doi.org/10.5194/acp-10-525-2010, 2010.
Valorso, R., Aumont, B., Camredon, M., Raventos-Duran, T., Mouchel-Vallon, C., Ng, N. L., Seinfeld, J. H., Lee-Taylor, J., and Madronich, S.: Explicit modelling of SOA formation from α-pinene photooxidation: sensitivity to vapour pressure estimation, Atmos. Chem. Phys., 11, 6895–6910, https://doi.org/10.5194/acp-11-6895-2011, 2011.
Vestreng, V.: Review and revision, emission data reported to CLRTAP, MSC-W Status Report 2003, 134, available at: http://tfeip-secretariat.org/assets/Meetings/Documents/Previous-Meetings/Poland-Sept-2003/ReviewandrevisionMSCWStatusReport2003.pdf (last access: 20 April 2020), 2003.
Volkamer, R., Jimenez, J. L., San Martini, F., Dzepina, K., Zhang, Q., Salcedo, D., Molina, L. T., Worsnop, D. R., and Molina, M. J.: Secondary organic aerosol formation from anthropogenic air pollution: Rapid and higher than expected, Geophys. Res. Lett., 33, L17811, https://doi.org/10.1029/2006GL026899, 2006.
Wang, S., Wu, R., Berndt, T., Ehn, M., and Wang, L.: Formation of Highly Oxidized Radicals and Multifunctional Products from the Atmospheric Oxidation of Alkylbenzenes, Environ. Sci. Technol., 51, 8442–8449, https://doi.org/10.1021/acs.est.7b02374, 2017.
Wesely, M. L.: Parameterization of surface resistances to gaseous dry deposition in regional-scale numerical models, Atmos. Environ., 23, 1293–1304, https://doi.org/10.1016/0004-6981(89)90153-4, 1989.
WHO Regional Office for Europe and OECD: Economic cost of the health impact of air pollution in Europe: Clean air, health and wealth, WHO Regional Office for Europe, Copenhagen, Denmark, 2015.
Woody, M. C., West, J. J., Jathar, S. H., Robinson, A. L., and Arunachalam, S.: Estimates of non-traditional secondary organic aerosols from aircraft SVOC and IVOC emissions using CMAQ, Atmos. Chem. Phys., 15, 6929–6942, https://doi.org/10.5194/acp-15-6929-2015, 2015.
Woody, M. C., Baker, K. R., Hayes, P. L., Jimenez, J. L., Koo, B., and Pye, H. O. T.: Understanding sources of organic aerosol during CalNex-2010 using the CMAQ-VBS, Atmos. Chem. Phys., 16, 4081–4100, https://doi.org/10.5194/acp-16-4081-2016, 2016.
Zhao, Y., Nguyen, N. T., Presto, A. A., Hennigan, C. J., May, A. A., and Robinson, A. L.: Intermediate Volatility Organic Compound Emissions from On-Road Diesel Vehicles: Chemical Composition, Emission Factors, and Estimated Secondary Organic Aerosol Production, Environ. Sci. Technol., 49, 11516–11526, https://doi.org/10.1021/acs.est.5b02841, 2015.
Zhao, Y., Nguyen, N. T., Presto, A. A., Hennigan, C. J., May, A. A., and Robinson, A. L.: Intermediate Volatility Organic Compound Emissions from On-Road Gasoline Vehicles and Small Off-Road Gasoline Engines, Environ. Sci. Technol., 50, 4554–4563, https://doi.org/10.1021/acs.est.5b06247, 2016.
Zhu, S., Sartelet, K. N., Healy, R. M., and Wenger, J. C.: Simulation of particle diversity and mixing state over Greater Paris: a model–measurement inter-comparison, Faraday Discuss., 189, 547–566, https://doi.org/10.1039/C5FD00175G, 2016a.
Zhu, S., Sartelet, K., Zhang, Y., and Nenes, A.: Three-dimensional modeling of the mixing state of particles over Greater Paris, J. Geophys. Res.-Atmos., 121, 5930–5947, https://doi.org/10.1002/2015JD024241, 2016b.
- Abstract
- Introduction
- Method
- Evaluation of the ref-VBS-GECKO parameterization
- Sensitivity to the parameterization properties
- Sensitivity to IVOC emission fluxes from traffic and transport sources
- Tracking OA sources
- Conclusions
- Data availability
- Author contributions
- Competing interests
- Acknowledgements
- Financial support
- Review statement
- References
- Supplement