the Creative Commons Attribution 4.0 License.
the Creative Commons Attribution 4.0 License.
 | 21 Apr 2020
The combined effect of two westerly jet waveguides on heavy haze in the North China Plain in November and December 2015
Xiadong An
Lifang Sheng
Qian Liu
Chun Li
Jianping Li
Severe haze occurred in the North China Plain (NCP) from November to December 2015, with a wide spatial range and long duration. In this paper, the combined effect of the anomalous stationary Rossby waves within two westerly jet waveguides on this haze event in the NCP is investigated based on observational visibility data and NCEP/NCAR reanalysis data. The results show that circulation anomalies in Eurasia caused by the propagation of anomalous stationary Rossby wave energy along two waveguides within the westerly jet originating from the Mediterranean were responsible for haze formation in the NCP. The Rossby waves propagated eastward along the subtropical westerly jet and the polar front jet, causing an anomalous anticyclone over the Sea of Japan and anticyclonic wind shear at 850 hPa over the NCP, which enhanced the anomalous descent in the middle and lower troposphere and subsequently resulted in a stable lower atmosphere. Furthermore, the anomalous stationary Rossby waves propagating along the polar front jet weakened the East Asia trough and Ural ridge and strengthened the anomalous southerly wind at 850 hPa over the coastal areas of eastern China, decelerating the East Asia winter monsoon. The above meteorological conditions modulated haze accumulation in November and December 2015. Meanwhile, continuous rainfall related to ascending motion due to Rossby wave propagation along the waveguide provided by the subtropical westerly jet occurred in a large area of southern China. The associated latent heat release acted as a heat source, intensifying the ascending motion over southern China so that the descending motion over the NCP was strengthened, favoring the maintenance of severe haze. This study elucidates the formation and maintenance mechanism of large-scale haze in the NCP in late fall and boreal winter.
- Article
(11934 KB) - Full-text XML
- BibTeX
- EndNote


Haze is the phenomenon of reduced visibility caused by the increase in aerosols or the hygroscopic growth of aerosols at a high relative humidity (Ma et al., 2014). Fog is also a phenomenon of reduced visibility caused by condensation of water vapor in the air near the ground (Wu et al., 2013). When fog and haze appear at the same time, it is called haze fog. In December 2015, the air quality was poor in the North China Plain (NCP), especially in the Beijing–Tianjin–Hebei region (Chang et al., 2016; L. Y. Zhang et al., 2016; G. Zhang et al., 2019). Based on the emissions data for December 2015 and the Weather Research and Forecasting-Community Multiscale Air Quality (WRF-CMAQ) regional model, G. Zhang et al. (2019) found that monthly mean PM2.5 concentrations in December 2015 were 30–50 µg m−3 in the NCP. Aside from pollutant emissions, weather conditions and climate change can also play a significant role in modulating haze formation, distribution, maintenance and change (Ding et al., 2009; Tai et al., 2012; Zhang et al., 2013). Yang et al. (2016) found that changes in meteorological parameters contributed 17 (±14) % to the increasing trend in winter PM2.5 concentration over eastern China (105–122.5∘ E, 20–45∘ N) from 1985 to 2005. Dang and Liao (2019) found that severe winter haze days in Beijing–Tianjin–Hebei from 1985 to 2017 showed large interannual variations in frequency and intensity, which were mainly driven by meteorology.
Instances of winter haze fog in northern China in recent years have been related to weak winter circulation (Wu et al., 2015). Some studies have noted that the circulation in remote mid- and high-latitude regions plays an important role in wind variations in northern China (Wang et al., 2016; Li et al., 2017; He et al., 2019). Zhao et al. (2013) and Zhang et al. (2013) showed that the weak East Asian winter monsoon (EAWM) is particularly unfavorable to the outward transport of aerosols in northern China, which results in continuous strong haze in northern China. In addition, the stable weather conditions associated with the Siberian high pressure are also conducive to the accumulation and maintenance of haze (Z. Zhang et al., 2016; Liu et al., 2017). Large-scale teleconnections may also be important for regional meteorology in China affecting instances of haze fog. For example, the Eurasian teleconnection (EU) is one of the major modes of low-frequency variability in the Northern Hemisphere winter circulation (e.g., Wallace and Gutzler, 1981). In the negative EU phase, there is a positive anomaly in geopotential height in Europe and East Asia and a negative anomaly in Siberia at 500 hPa. As a result, the cold air mass from the Arctic is too weak to reach northern China (Ren et al., 2010; Zhai et al., 2016), which is not conducive to the dissipation of haze. Li et al. (2019) found that up to 45 % of the interannual variability in haze-fog occurrence in northern China could be explained by the EU pattern.
According to many studies, the North African-Asian (NAA) jet has an important impact on the Asian climate in winter (Syed et al., 2006; Feldstein and Dayan, 2008; Wen et al., 2009; Ni et al., 2010; Li et al., 2013). On decadal timescales, the strength of the jet can also influence the frequency of cold air temperature extremes in China (Chen et al., 2013). The divergence in the upper troposphere induced by the subtropical westerly jet waveguide is important for large-scale and persistent winter rainfall in southern China (Li and Sun, 2015; Ding and Li, 2017). Based on previous theoretical work, Xu et al. (2019) noted that the British-Baikal Corridor teleconnection on the polar front jet waveguide in Eurasia has an important impact on the climate of East Asia in summer. Y. Zhang et al. (2019) found that in winter the concurrent meridional shift in the East Asian jet streams is related to the eastward propagation of Rossby waves. Huang et al. (2019) further found that concurrent changes in the location of the subtropical and polar front jet in East Asia in winter has an important impact on the climate of East Asia. In addition, previous studies showed that the North Atlantic was a source of teleconnection waves, where anomalies in atmospheric circulation related to sea surface temperatures (SSTs) can significantly influence winter weather in the Northern Hemisphere (Wallace and Gutzler, 1981; Peng et al., 1995; Czaja and Frankignoul, 2002; Li and Bates, 2007) and can influence haze in China (Xiao et al., 2014; Gao and Chen, 2017). Chen et al. (2013) noted that cold air outbreaks were possibly associated with the development of the Siberian high pressure and a wave train from the North Atlantic. Yang et al. (2019) hypothesized that the East Asian wind and temperature anomalies during boreal winter are determined by the combination of the two wave trains propagating along the subtropical jet and the polar front jet. Hence, SST anomalies in the North Atlantic can induce a downstream Rossby wave train, resulting in anomalous circulations over the NCP, which are favorable for haze over central and southern China (Feng et al., 2019; Wang et al., 2019).
In summary, Rossby waves propagating within the East Asian upper tropospheric westerly jet waveguides can have important influences on East Asian climate. Previous research on the meteorological parameters influencing haze in the NCP has focused mainly on local meteorological conditions in the middle and lower troposphere or only the correlation between haze in China and North Atlantic SST or other patterns, while studies about the specific mechanisms behind the influence of large-scale atmospheric circulations in the upper troposphere on haze, especially the combined effect of the Rossby waves within two westerly jet waveguides, are rare. The objective of the present study is therefore to determine whether the effects of the Rossby waves within two westerly jet waveguides on haze were significant in the NCP in November and December 2015 and, if so, to identify the principal mechanism behind their effects on haze.
The structure of this paper is as follows: data and methodology used in this paper are described briefly in Sect. 2. Section 3 presents the haze event and describes major meteorological parameters and atmosphere circulation patterns during haze events. Section 4 demonstrates the influencing mechanisms of the Rossby waves within two westerly jet waveguides on haze events. Further discussions and conclusions of our findings are provided in Sect. 5.
2.1 Data
Visibility data from meteorological stations in the region (15–55∘ N, 105–135∘ E) in November and December 2015 were taken from the China Meteorological Administration (CMA). These data were recorded four times daily (02:00, 08:00, 14:00, and 20:00, local time (LCT)). The data were averaged monthly in this study.
Monthly mean and daily mean reanalysis data were taken from the National Centers for Environmental Prediction-National Center for Atmospheric Research (NCEP/NCAR) NCEP-DOE AMIP-II Reanalysis (R-2) dataset (Kanamitsu et al., 2002). The dataset covers a 39-year period from 1979 to 2017, with a latitude–longitude spatial resolution of , including the geopotential height, wind vector, relative humidity, air temperature, and omega data at each standard level from 10 to 1000 hPa. The daily precipitation data from November to December 2015 were taken from the NASA/Goddard Space Flight Center for the GPM_3IMERGDL_V05 dataset (Huffman et al., 2014).
2.2 Methodology
Haze was defined as a day when the daily mean visibility and relative humidity were less than 10 km and 80 %, respectively, and no rain, snow, sand and dust storms occurred in accordance with the standards set by the CMA (China Meteorological Administration, 2010).
Visibility station data were interpolated to the regular grid of using Cressman objective analysis. Cressman objective analysis adopts the method of successive corrections based on the Cressman interpolation method (Cressman, 1959), which has been widely used in various climate diagnosis analyses and numerical simulation studies. The key of the Cressman objective analysis is the determination of the weight function Wi,j (Feng et al., 2004) (Eqs. 1–2):
where R is the influence radius, is the distance between two interpolation points, and i and j are each interpolation point. Generally, the value of R is 10, 7, 4, 2, and 1 with units of degree (e.g., Feng et al., 2014). In this paper, the value of R is 5, 4, and 3.
where Si,j is the interpolated value at point i, j and is the station data. N is the number of stations.
To analyze the propagation of anomalous Rossby waves, we calculated horizontal stationary wave activity flux based on monthly-mean data to show the propagation of wave energy using the method of Plumb (1985) (Eq. 4):
Here, F is the horizontal stationary wave activity flux (m−2 s−2), p0 is pressure∕(1000 hPa), ψ′ is the perturbation stream function, a is Earth's radius, ∅ is the latitude, and λ is the longitude. The perturbation stream function is calculated using the local geopotential height anomalies relative to the time mean climatological state.
The East Asian winter monsoon composite index defined by He and Wang (2012) was used to characterize the East Asia winter monsoon. The formula is as follows (Eqs. 5–8):
Here, Norm represents standardization and x is a variable. n is the number of non-missing values, and , , and are the mean sea level pressure, 500 hPa geopotential height and 300 hPa zonal wind averaged over the region defined above, respectively.
To describe the EU in this study, a new EU index (EUI) was defined according to the definition of the EUI of Wallace and Gutzler (1981).
Here, hgt500_ano is the mean geopotential height anomaly at 500 hPa in November and December.
All the anomalies calculated in this paper were taken relative to the climatological mean during the 30-year period of 1981–2010.
Heavy haze occurred over the NCP in November and December 2015. The locations where the average monthly visibility was less than 10 km covered northern China and eastern China (Fig. 1). The haze events were characterized by a wide spatial range, strong intensity and long duration, which was consistent with the analysis of Chang et al. (2016), and L. Y. Zhang et al. (2016) and G. Zhang et al. (2019). More than 70 % of days in November and December 2015 (22 d per month) had haze (Fig. 2). In November, the mean monthly visibility over the NCP was 8.33 km with a minimum value of 4.14 km. A regional mean visibility of less than 10 km appeared on 4–16, 18–22 and 27–30 November, with minimal daily values of 5.16, 5.86 and 4.14 km, respectively. Similarly, the mean monthly visibility in December over the NCP was 8.63 km with a minimal daily value of 2.62 km. The dates when the regional mean visibility was less than 10 km were 6–14, 19–24 and 28–31 December, with minimum daily values of 3.87, 2.62 and 6.00 km, respectively.
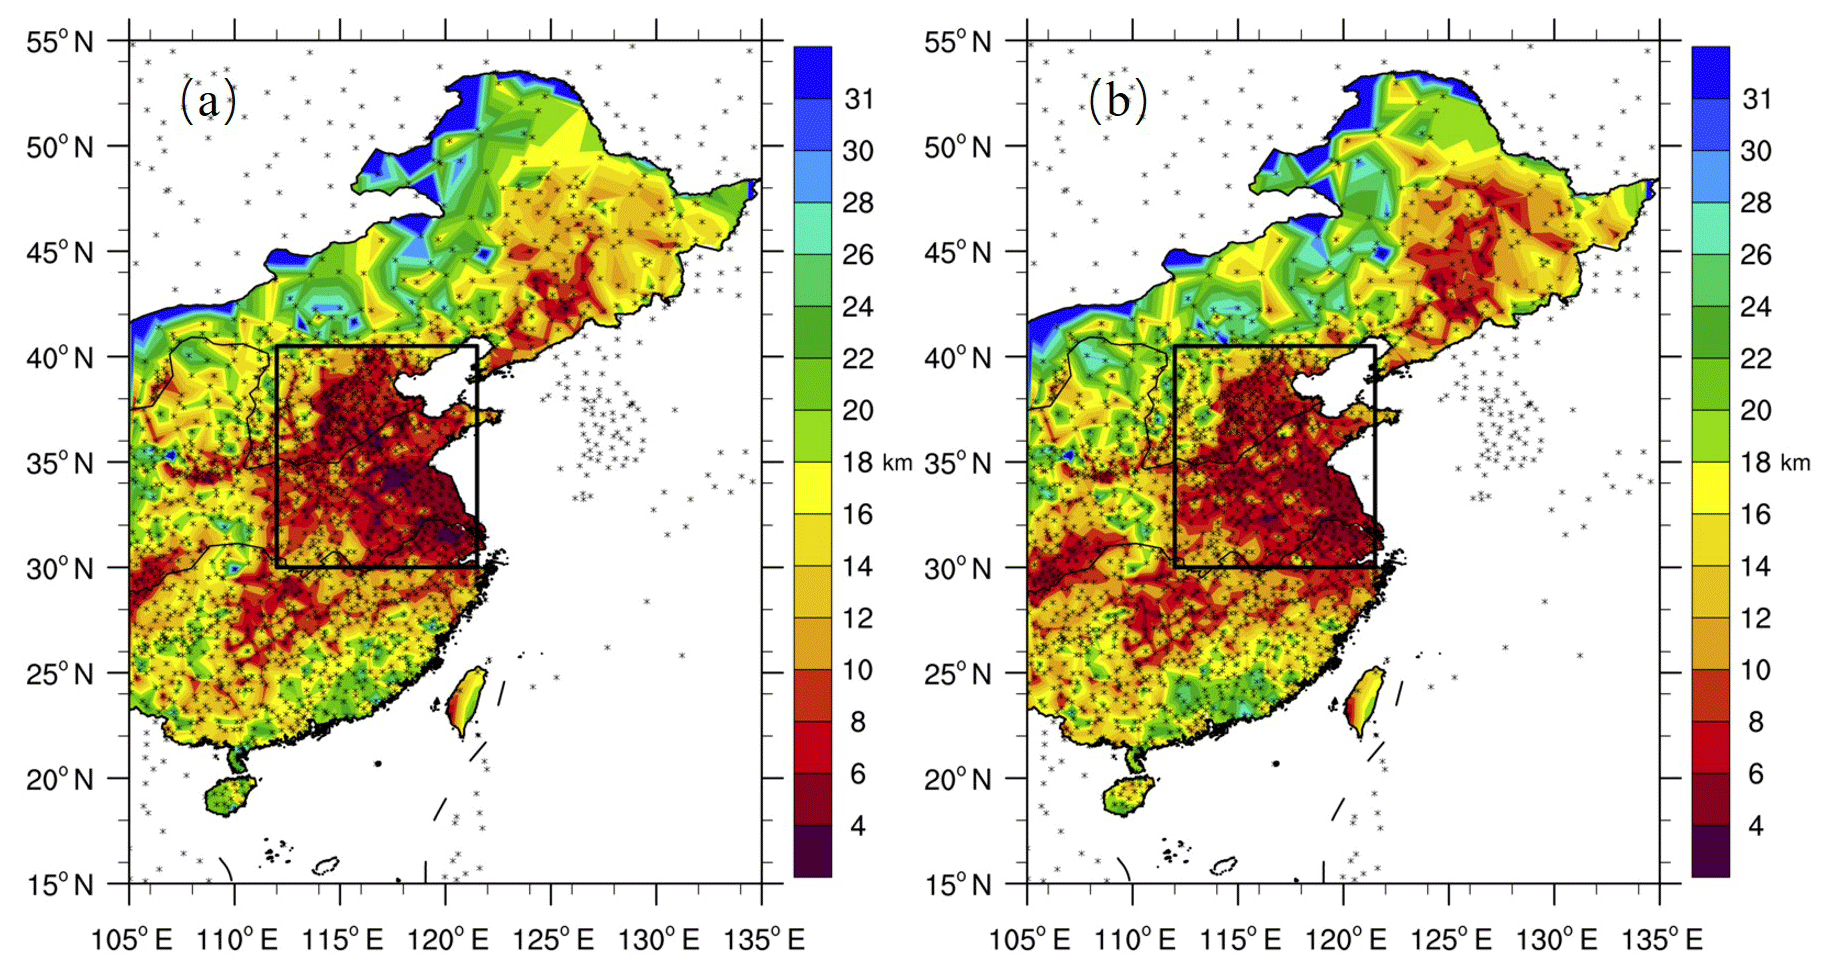
Figure 1Spatial distribution of monthly mean visibility (unit: km, shading) in (a) November and (b) December 2015. The black box indicates the NCP (30–40.5∘ N, 112–121.5∘ E). Shading indicates the value of visibility. The black dots represent the locations of meteorological stations.
To research the stability of the lower atmosphere, the vertical temperature difference (VTD) is expressed by the vertical difference in the temperature between 1000 and 850 hPa (Liu et al., 2017), which is on average 4.5–7.5 ∘C in the NCP. The value of the VTD in November and December 2015 was small, so that the lower troposphere was relatively stable (Fig. 3a). In addition, the vertical profiles of the temperature anomalies between 1000 and 700 hPa show warm anomalies in the middle and lower troposphere and cold anomalies near the surface (Fig. 3e), which further indicates that the atmosphere is relatively stable. When haze occurred, the mean monthly relative humidity (RH) in the NCP was less than 70 % (Fig. 3b), and the regional daily relative humidity was also relatively low (not shown). According to the haze identification conditions issued by the China Meteorological Administration (2010), haze rather than haze fog can be considered the main pollution event in November and December 2015. An RH of approximately 55 %–70 % may promote the liquid-phase reaction of aerosol particles. RH has an important influence on the hygroscopic growth of aerosol particles (Ma et al., 2014), which can promote the photochemical reaction of aerosol particles. Wu et al. (2019) found that the air over the NCP during the haze episode was humid, with an average simulated RH of approximately 71 %.

Figure 2Variations in the regional mean daily visibility (bars; unit: km) are obtained by calculating the average value of all station data in the NCP (30–40.5∘ N, 112–121.5∘ E) and the regional mean daily precipitation (lines; unit: mm d−1) in southern China (20–30∘ N, 100–120∘ E) (a) in November and (b) in December 2015.
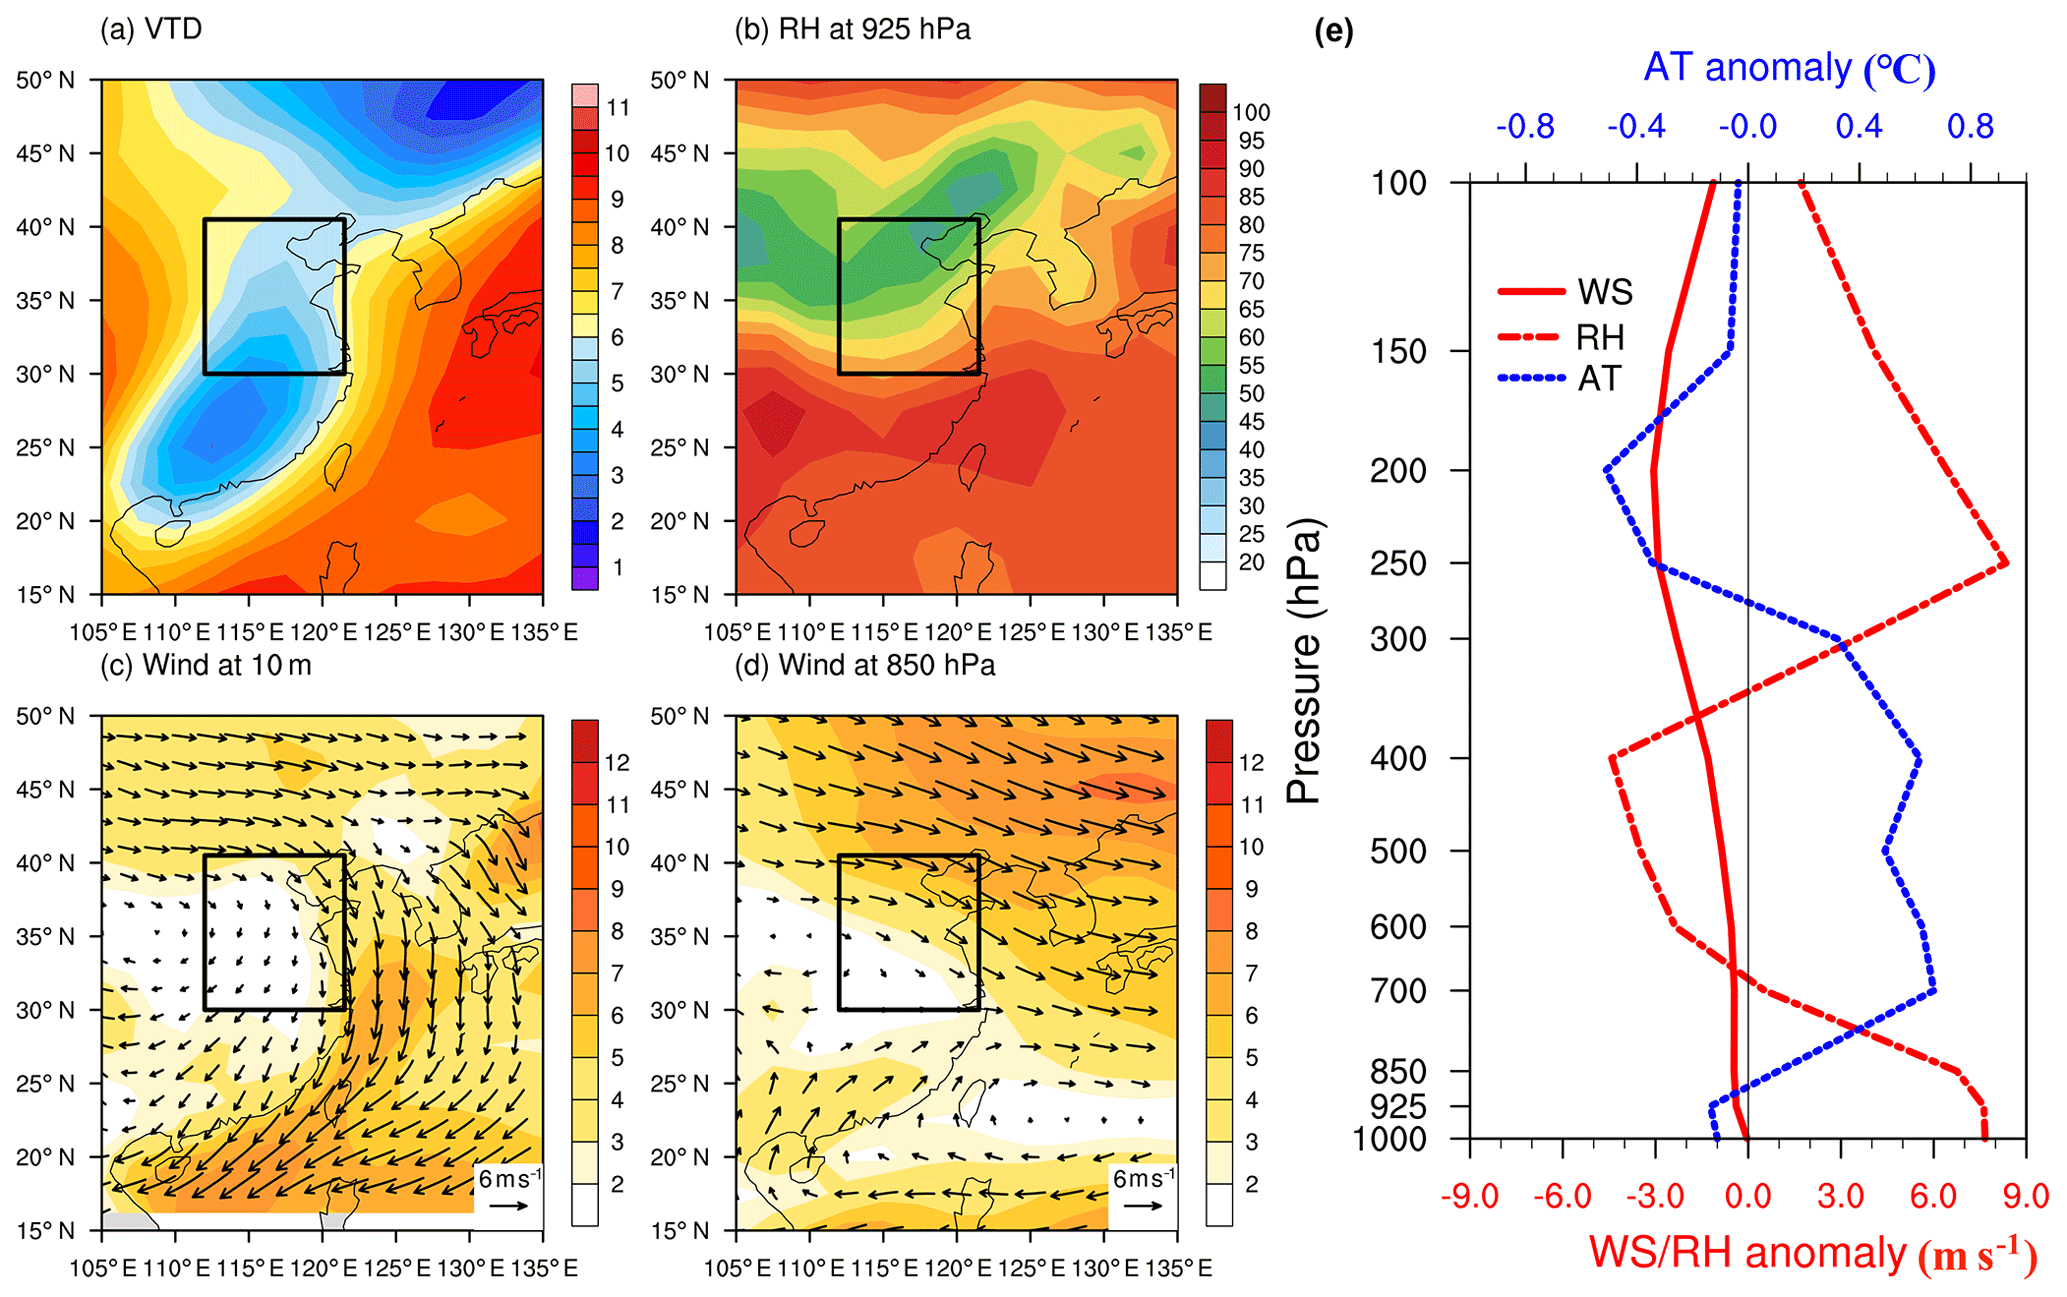
Figure 3Spatial distribution of the average over November and December 2015: the vertical temperature difference between 1000 and 850 hPa (unit: ∘C; a); relative humidity at 925 hPa (unit: %; b); wind vector (unit: m s−1) at 10 m (c) and 850 hPa (d) in the NCP, with shading indicating the wind speed in the appropriate level. Vertical distribution of anomalies averaged over November and December 2015: air temperature (AT) (blue dashed line), horizontal wind speed (WS) (red solid line) and relative humidity (RH) (red dash-dotted line) in NCP (e).
The near-surface meteorological condition was an anticyclone in November and December 2015 according to the ground wind field at 10 m. The NCP was in the center of the anticyclone, and the wind speed was very weak (Fig. 3c). However, in the periphery of the NCP, the wind speed was relatively strong (Fig. 3c). The horizontal wind speed exhibited a negative anomaly from the lower troposphere to the upper troposphere (Fig. 3e). The 850 hPa wind field showed a northeast–southwest wind speed shear (Fig. 3d), which generated negative vorticity anomalies. The atmosphere was mainly composed of descending movement, so the stratification was relatively stable. According to Liu et al. (2017), the frequency of haze occurrence was 24.5 % under low wind speed conditions at the ground and low stability over 1303 non-cold wave days, accounting for the highest proportion of the four conditions, including low wind speed and low stability (20.4 %), high wind speed and low stability (14.4 %), and high wind speed and high stability (14.6 %). Yang et al. (2016) used model simulations to show the most important meteorological parameters for interannual variations in winter haze in northern China were lower tropospheric horizontal wind speed and direction and the boundary layer height. Changes in pollutant emissions were needed to capture the long-term multidecadal trend in winter haze in China. Therefore, wind speed and atmospheric stability play vital roles in haze formation during November and December in the NCP. The 850 hPa wind vectors show that there was an anticyclonic circulation in southern China during November–December 2015 (Fig. 3d). The southerly wind on the northwestern side of the anticyclone circulation prevented the southward dispersion of pollutants over the NCP. At the same time, the anticyclone circulation weakened the EAWM in the NCP. According to the winter monsoon composite index defined in the Methods section (He and Wang, 2012), the EAWM is weak when the EAWM index is negative. The EAWM index in November and December 2015 was −0.29 (not shown). The weak EAWM was beneficial to the occurrence and maintenance of haze.
Figure 4 shows the mean monthly circulation anomalies and the average westerly jet positions in November and December 2015. At 200 hPa (Fig. 4a), there was a clear northerly anomaly in western China and southerly anomaly in eastern China in the meridional wind within the mid- to high-latitude westerly jet. Within the subtropical westerly jet (Fig. 4a, green contour line), there existed a southerly/northerly wind wave train package which is similar to the study of Ding et al. (2017) (Fig. 4a). This wave train was characterized by northerly wind anomalies in the Mediterranean region, southerly wind anomalies in the Arabian Peninsula, northerly wind anomalies in western China, and southerly wind anomalies in the Yellow and Bohai seas of China. Hoskins and Ambrizzi (1993) and Hsu and Lin (1992) found large-scale wave trains in the Northern Hemisphere mid-latitude upper troposphere. This was also similar to the teleconnection of the Northern Hemisphere Silk Road in summer proposed by Lu et al. (2002). There was a strong northerly anomaly over the European continent. The strong northerly wind intruded into the entrance of the subtropical westerly jet over the vicinity of the middle eastern Mediterranean and formed the cold air convergence (Ding and Li, 2017) (Figs. 4a, 5a), named the western disturbance (Syed et al., 2006). Within the subtropical westerly jet, there existed a southerly/northerly wind wave train (Li, 1988; Li and Sun, 2015; Ding and Li, 2017). The centers of the southerly wind anomalies were located over the Arabian Peninsula and East Asia, and the centers of the northerly wind anomaly were located over the European continent and central Asia. The northerly and southerly wind anomalies over the Asian continent resulted in anomalous circulation in southern China, with abnormal ascent on the eastern side of the cyclonic anomaly according to the value of divergence at 850 hPa (Fig. 4c) and 200 hPa (Fig. 4a) and omega at 500 hPa (Fig. 4b). The NCP experienced an anticyclonic anomaly with abnormal descent. Atmospheric motion ascended over southern China and descended over the NCP to form a north–south circulation system from 20 to 50∘ N at 112–120∘ E (Figs. 4a, 6). In addition, the NCP was located in the middle of the cyclonic and anticyclonic anomalies, with strong southerly winds at 850 hPa (Fig. 4c), weakening the EAWM and favoring haze accumulation. Wallace and Gutzler (1981) showed the Eurasian Pattern (EU) is one of the five main large-scale teleconnection patterns in the Northern Hemisphere in winter. The EU positive phase corresponds to the negative, positive and negative geopotential height anomalies at 500 hPa over western Europe, the Ural region and Japan, respectively, and vice versa for negative. In November–December 2015, there was a negative phase of the EU at 500 hPa (Fig. 4b): the negative geopotential height anomaly over Siberia weakened the Ural ridge, and the positive geopotential height anomaly over the Sea of Japan weakened the East Asian trough. According to Li et al. (2019), the direct effect of the EU negative phase is that the Arctic cold air does not easily flow to East Asia, and the EAWM weakens. Thus, a negative EU may have an important impact on haze. Due to the anticyclonic anomaly in the lower troposphere over the Sea of Japan, the descending movement over the NCP stabilizes the atmosphere, creating an environment that is conducive to haze. In southern China, there was mainly ascending motion, with an anomalous southwesterly wind at 850 hPa (Fig. 4c). The convergence of southwesterly airflow was conducive to the occurrence of large-scale continuous precipitation over southern China, as reported by Li and Sun (2015) and Ding and Li (2017). As shown in Fig. 2, strong precipitation occurred in November and December 2015 in southern China (20–30∘ N, 100–120∘ E), i.e., during 6–13, 14–17, and 18–21 November and 2–6, 7–10 and 21–23 December. The north–south circulation systems with barotropically stable structure triggered long duration of the haze events.
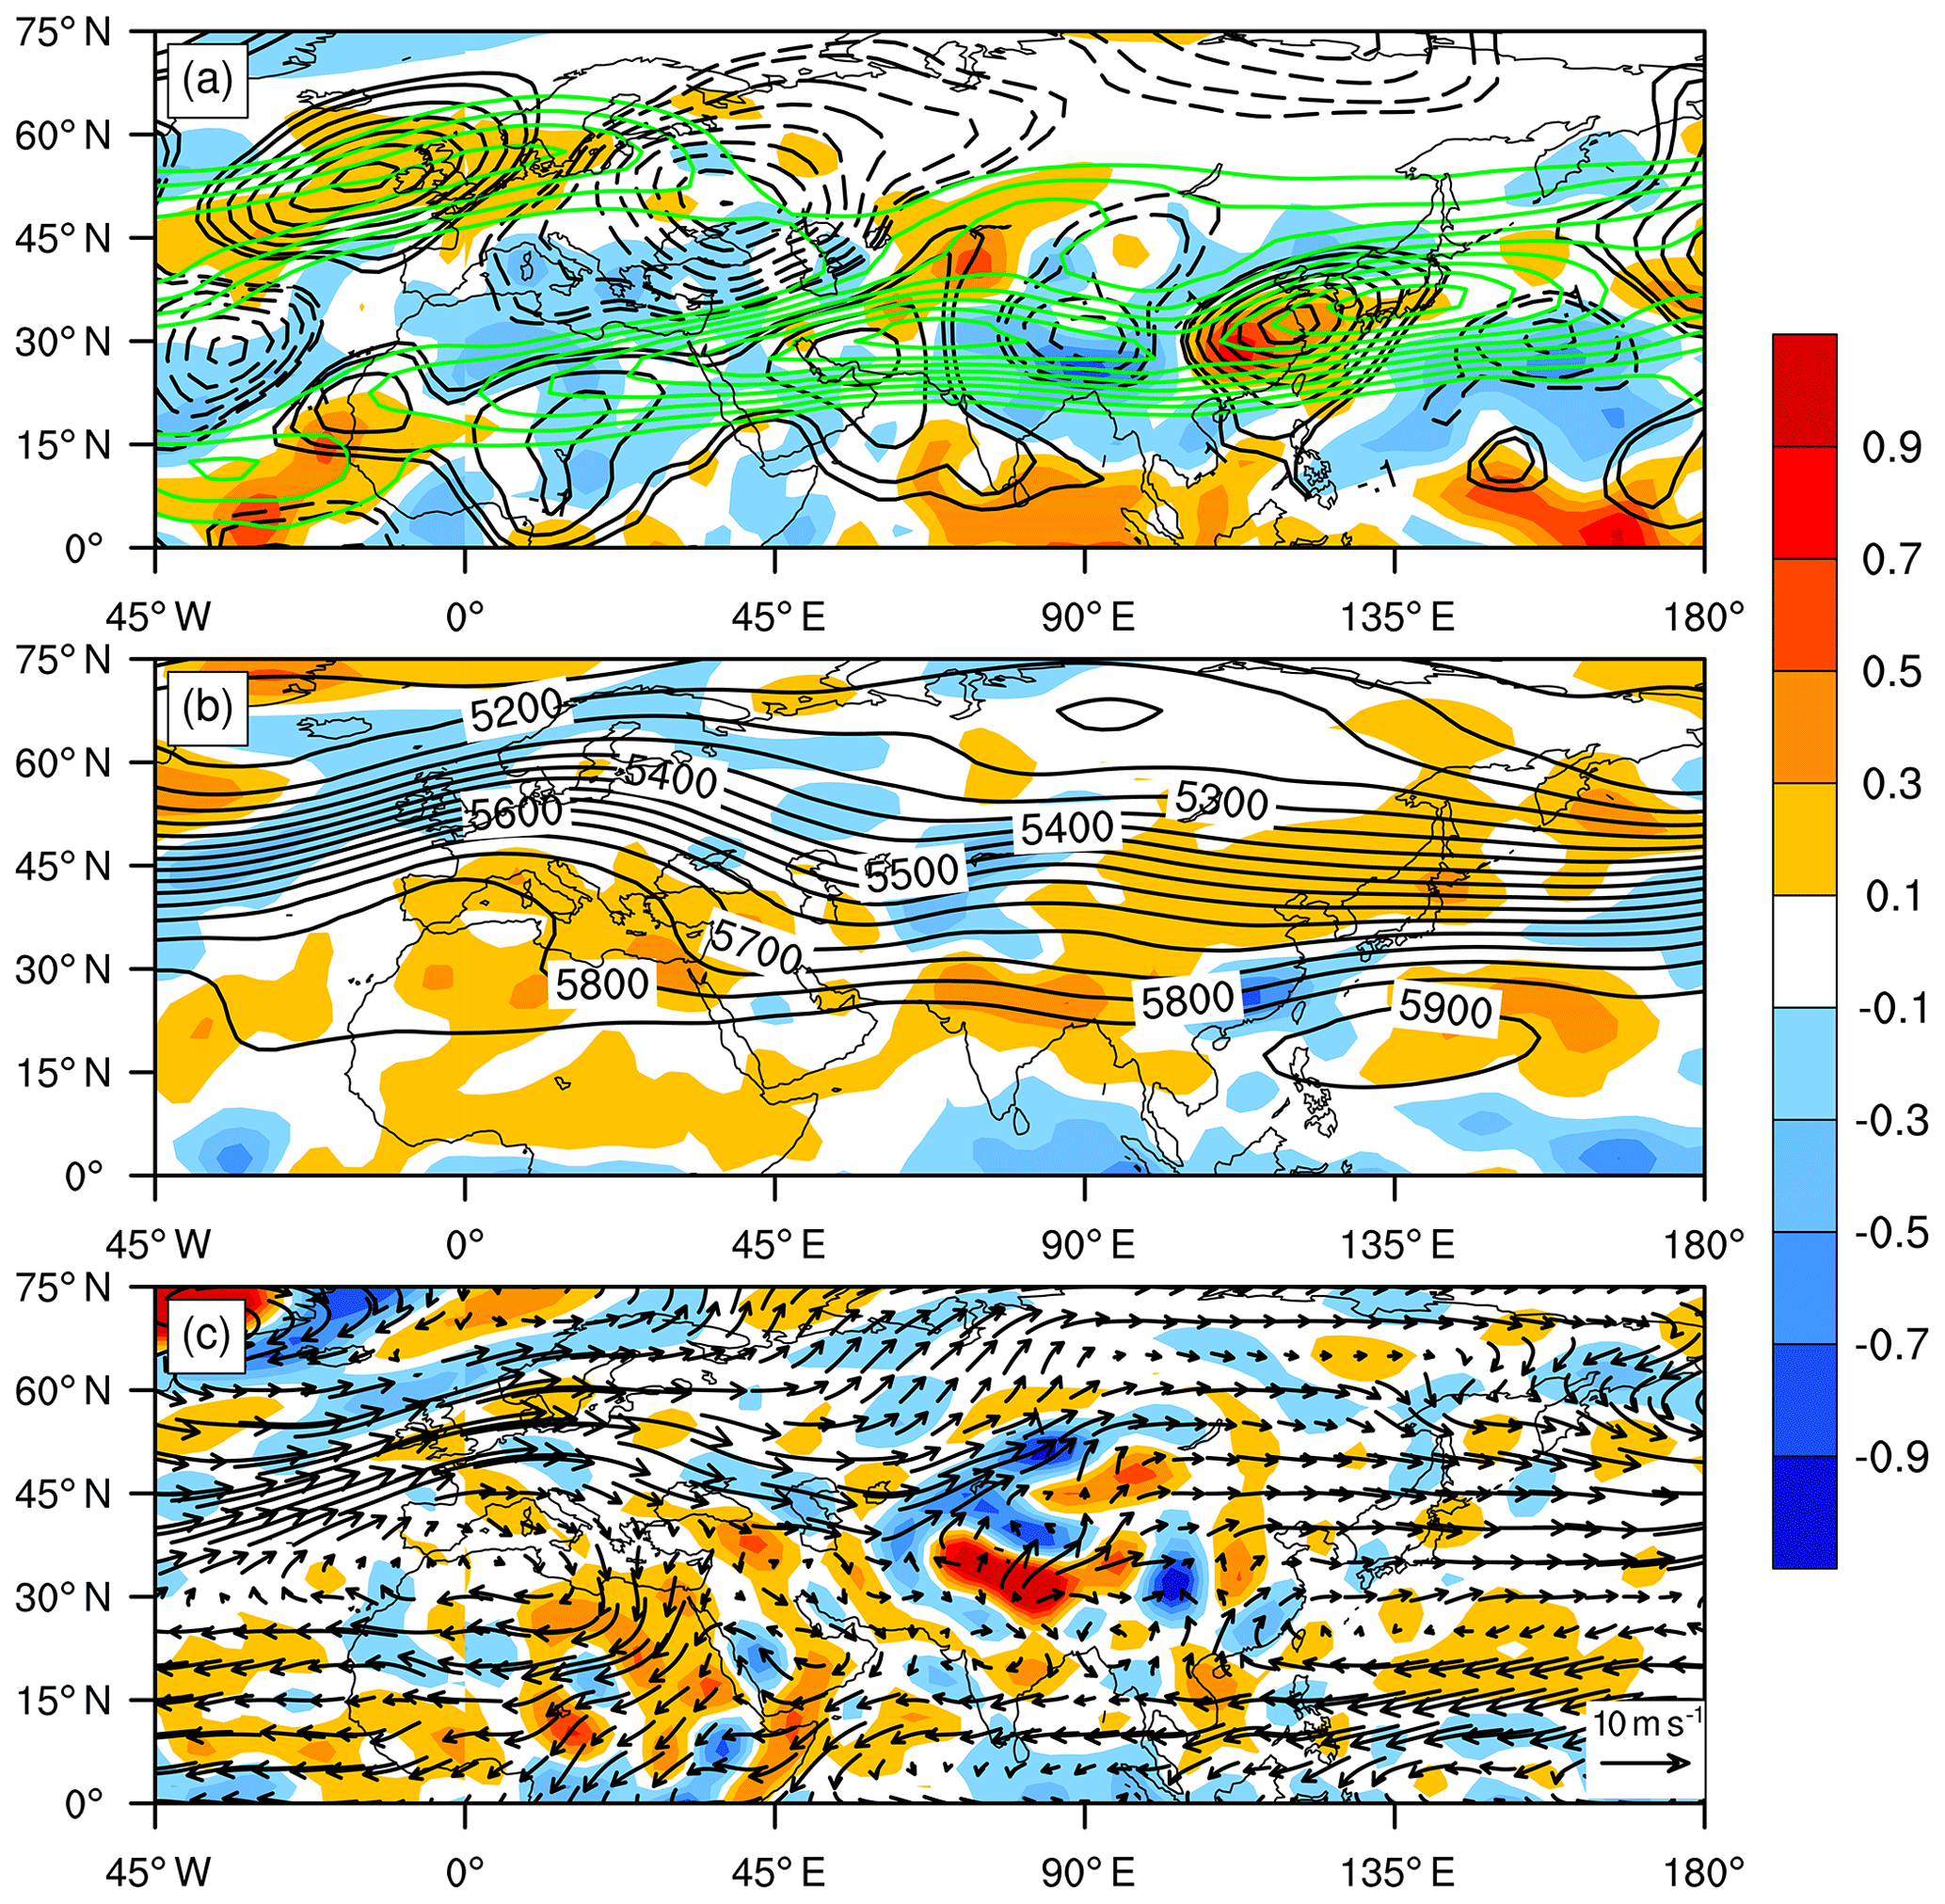
Figure 4November and December 2015 anomalies in (a) meridional wind (black contours, CI (contour interval) =1 m s−1, and solid (dashed) lines represent the southerly (northerly) wind anomaly), divergence (shading, 10−5 s−1) and westerly jet (green line) (zonal mean wind, CI >30 m s−1) at 200 hPa; (b) geopotential height (black contours, CI =10 gpm (geopotential meters), solid (dashed) lines represent positive (negative) geopotential height anomaly) and vertical velocity (shading, 10−2 Pa s−1); negative (positive) values represent ascent (descent) at 500 hPa; (c) geopotential height (red contours, CI =10 gpm), divergence (shading, 1−5 s−1) and wind vector (vector, m s−1) at 850 hPa. The variables shown are anomalies, but the zonal wind is absolute (green line).
To more clearly depict the circulation in detail during the persistent haze events, the circulation field was composited by selecting haze events lasting at least 3 d with a mean daily visibility of less than 8 km (Fig. 5). The periods are 9–15 and 19–21 November and 6–10 and 19–25 December. The results during the severe haze events are generally consistent with those of the monthly average. The locations of the centers of convergence and divergence at 850 and 200 hPa and the anomalous meridional wind at 200 hPa are similar to the monthly averages (Figs. 4a, c and 5a, c), but the intensity of the anomalous meridional wind over the Mediterranean and East Asia seems to be stronger, and the strength of the divergence is enhanced as well. There is a relatively strong trough over the North Atlantic, a weak trough over the Ural Mountains and a trough over the North Pacific at 500 hPa. In addition, there was a weak Southern Branch trough over the southern Qinghai–Tibet Plateau and southern China. The subtropical high over the western Pacific was stronger and located in the west (Fig. 5b). This circulation situation reduced the amount of cold air intruding into China and the winter monsoon also weakened. The Southern Branch trough provided rising conditions for precipitation over southern China. The southerly airflow on the western side of the subtropical high (Fig. 5c; near 115∘ E) carried a large amount of water vapor originating from the South China Sea into southern China. In contrast, convergence of the southerly wind occurred over the NCP, leading to haze formation. Figure 6 shows composed sections of the actual values during the periods of 9–15 and 19–21 November and 6–10 and 19–25 December in 2015. We can find there will be a local circulation in China when there is precipitation in southern China (Fig. 6). This local circulation includes the ascent in southern China and the descent in the NCP.
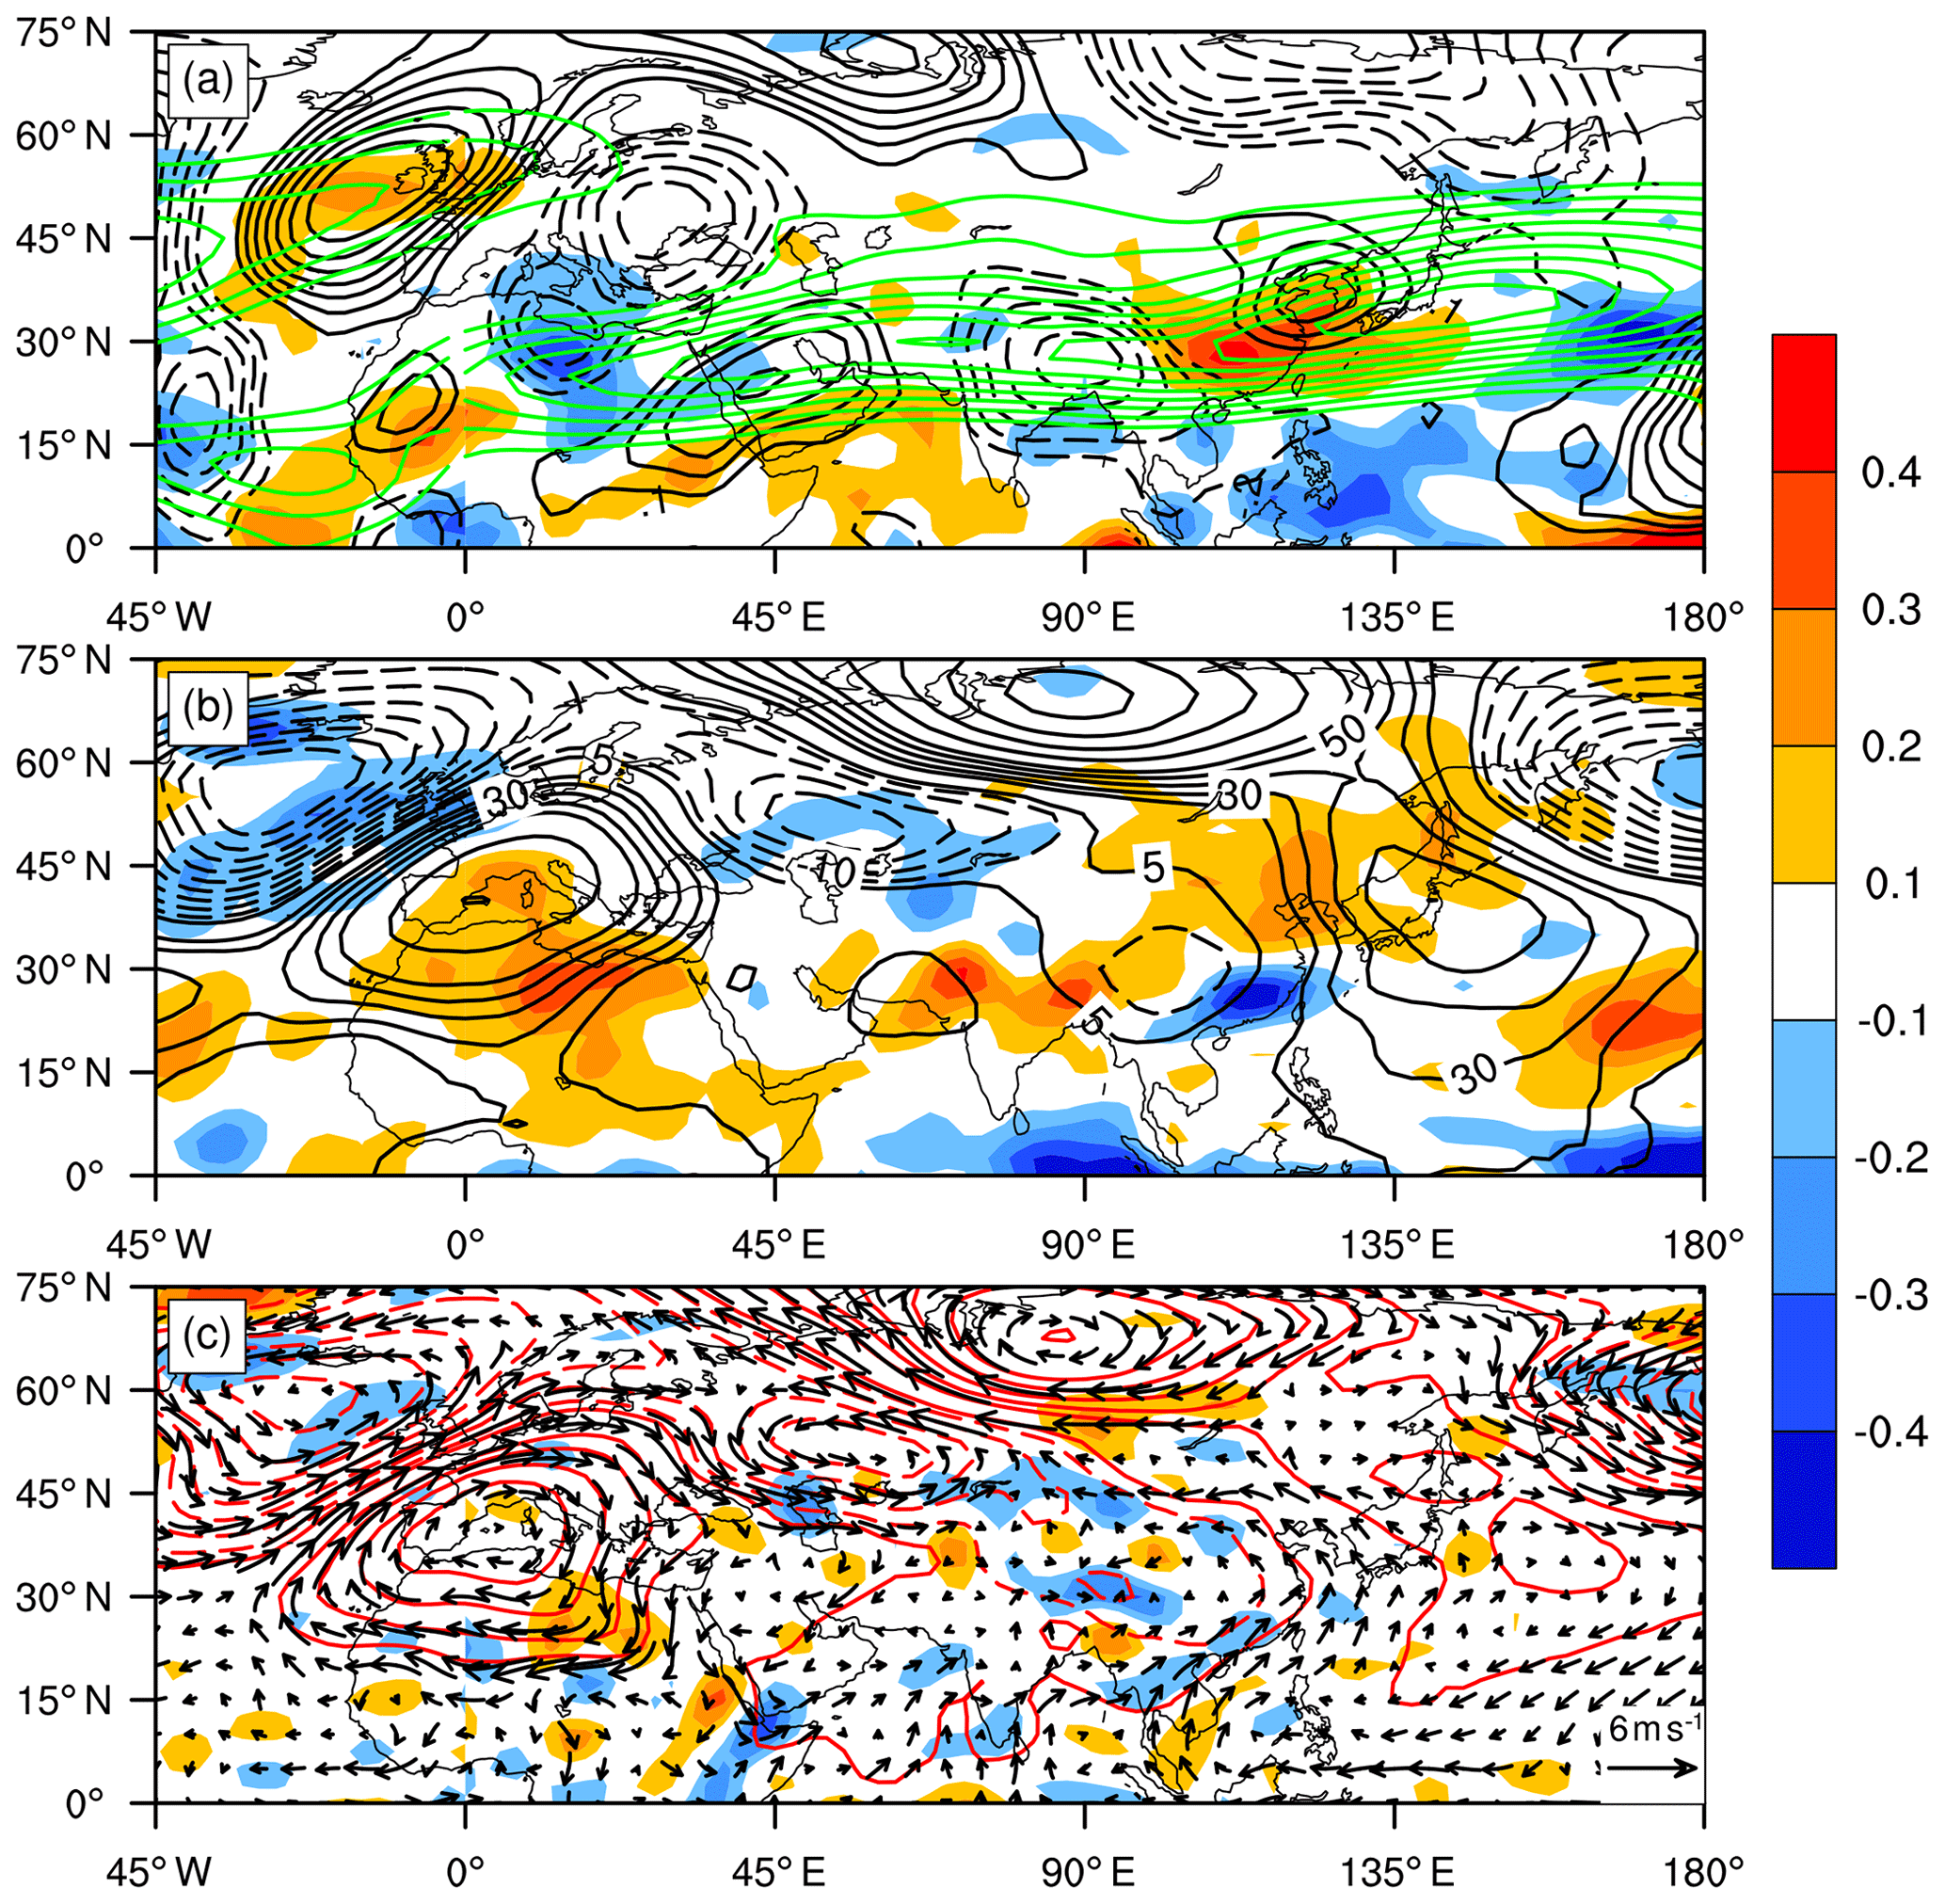
Figure 5The same as Fig. 4 but a composite of absolute values during the periods of 9–15 and 19–21 November and 6–10 and 19–25 December in 2015 of (a) meridional wind (black contours, CI (contour interval) =1 m s−1, and solid (dashed) lines represent southerly (northerly) wind), divergence (shading, 10−5 s−1) and westerly jet (green line) (zonal mean wind, CI >30 m s−1) at 200 hPa; (b) geopotential height (black contours, CI =50 gpm) and vertical velocity (shading, 10−2 Pa s−1); negative(positive) values represent ascent (descent) at 500 hPa; (c) divergence (shading, 10−5 s−1) and wind vector (vector, m s−1) at 850 hPa.
Through the analysis above, we found that the main meteorological factors modulating the large-scale persistent haze in the NCP in November–December 2015 are wind vector and atmospheric stability. The anomalous southerly wind over the eastern coast of China is associated with a weak winter monsoon, and the anticyclonic shear of the wind at 850 hPa in the NCP yields an increase in negative vorticity and the subsequent enhancement of atmospheric descent. In addition, the anomalous anticyclone over the Sea of Japan strengthens the descending air motion and increases atmospheric stability. From the geopotential height anomaly at 200 hPa (not shown), 500 hPa (Fig. 4b), 850 hPa (Fig. 4c) and the tropospheric vertical motion (Fig. 6), it can be seen that the upper and lower levels exhibit barotropic structures. The north–south anomaly of the meridional wind from west to east appears in the upper tropospheric subtropical westerly jet, which is similar to the Silk Road teleconnection proposed by Lu et al. (2002). The anticyclone anomaly over the NCP strengthens the descending motion, and the ascending motion related to upper divergence and lower convergence over southern China is strong. In addition, we find that the ascent in southern China flows northward near 200–250 hPa, and then descends in northern China (Fig. 6a) when there is rainfall in southern China and heavy haze in the NCP at the same period. The north–south circulation system is conducive to the maintenance of haze in the NCP, whereas large-scale precipitation occurred over southern China.
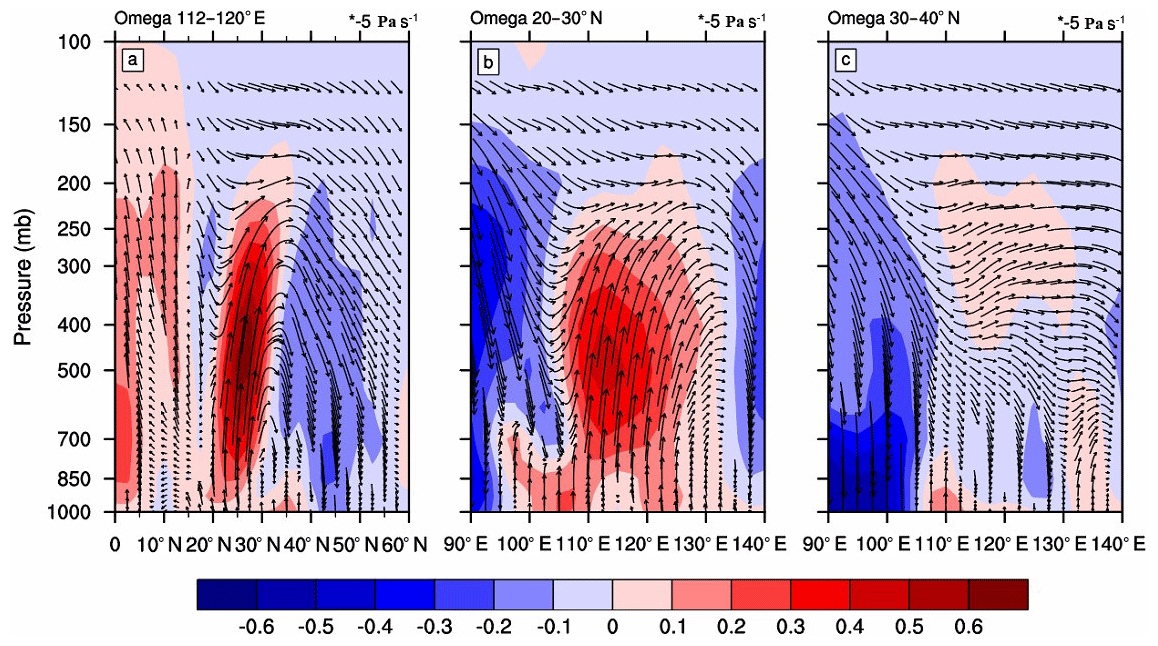
Figure 6Composed sections of absolute values during the periods of 9–15 and 19–21 November and 6–10 and 19–25 December in 2015: latitude–height sections with average longitude in 112–120∘ E of vertical velocity (shading, unit: −5 Pa s−1) and wind vector (u and ω) (a); longitude–height sections with average latitude in 20–30∘ N (b) and in 30–40∘ N (c) of vertical velocity (shading, unit: −5 Pa s−1) and wind vector (u and ω).
To explore the influence on Rossby wave propagation along the subtropical westerly jet and associated influences on haze, the first leading empirical orthogonal function (EOF) of the 200 hPa zonal and meridional winds within the domain 0–75∘ N, 0–160∘ E based on the average fields of November and December from 1979 to 2017 was calculated. The first mode of zonal wind represents the north–south movement of the subtropical jet (Fig. 7a), following Hong and Lu (2016). The variance explained by this mode is 25.3 %. From the principal component time series of the first mode (PC1), it can be seen that the exponent is positive in 2015, meaning that the location of the subtropical jet is anomalously south. The first EOF of the meridional winds is a Rossby wave manifested by the north–south anomaly of the 200 hPa meridional wind, following Li et al. (2017). The variance explained by this mode is 23.4 %. The PC1 shows that the exponent has a negative index in 2015, with strong intensity (Fig. 7c). The northerly wind anomaly appears in the Mediterranean region and the Indian Peninsula region, and the southerly wind anomaly appears in the Arabian Peninsula region, North China and the Yellow Sea.
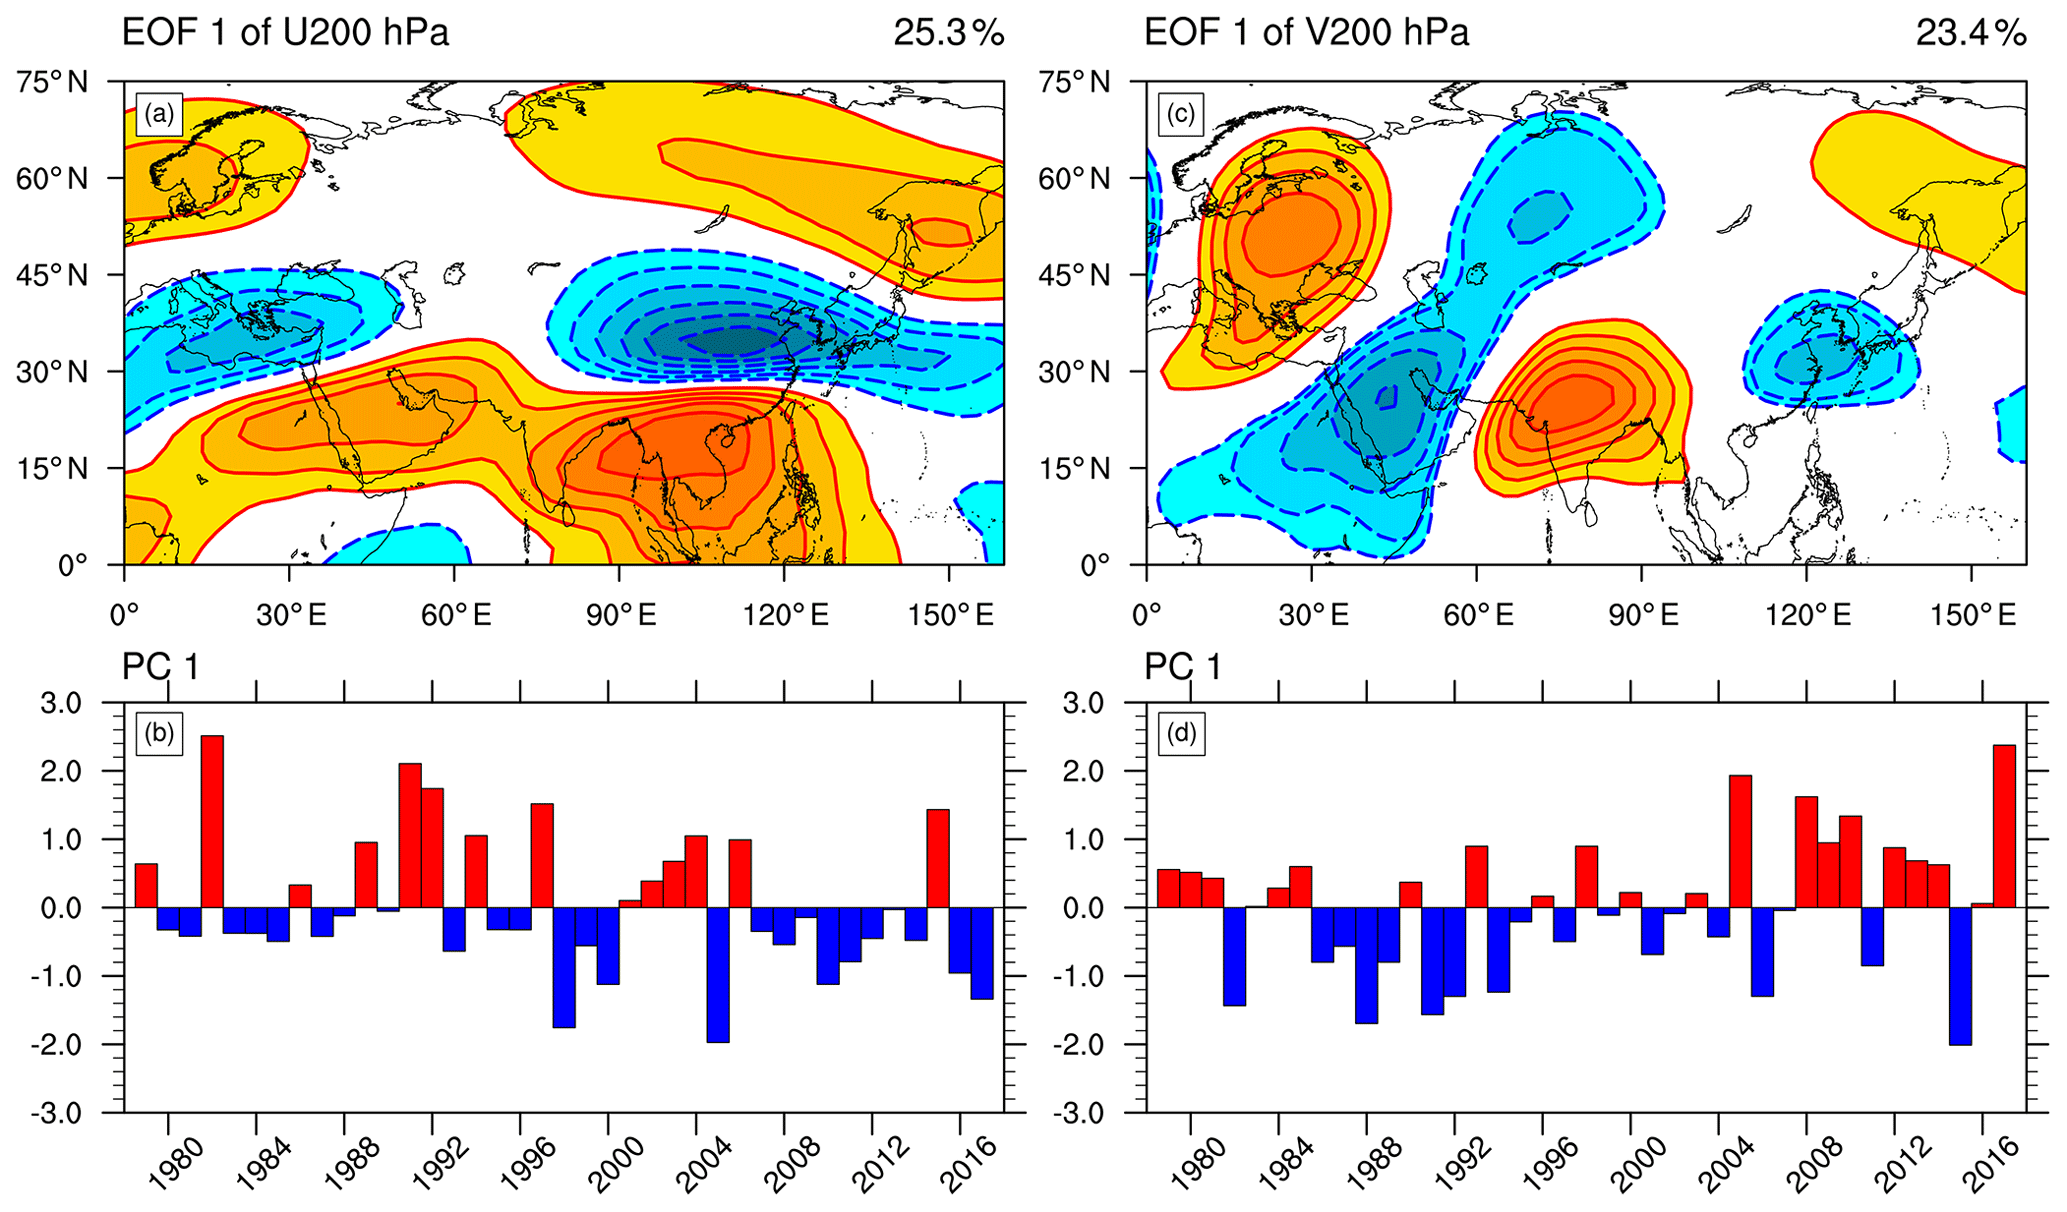
Figure 7The (a) spatial distribution and (b) its principal component (PC) of the leading EOF mode for a 200 hPa zonal wind anomaly within the domain 0–75∘ N, 0–160∘ E in November and December 1979–2017, where the solid (dashed) lines represent westerly (easterly) winds. The contour interval is 0.01 m s−1; (c) and (d) are the same as (a) and (b) but for meridional wind within the domain 0–75∘ N, 0–160∘ E, where solid (dashed) lines represent southerly (northerly) winds. The percentage values in the upper-right corners of (a) and (c) show the percentage variance explained by this mode.
To investigate the relationship between the change in jet position and the Rossby waves, the time series of the 200 hPa vector wind field and meridional wind are regressed onto the PC1 of the first EOF of meridional wind and the first EOF of zonal wind in Fig. 8a and b, respectively. The results of the regression are very similar as shown in Fig. 8a and b. That is, the position movement of the jet and the Rossby waves was closely related in winter, which is consistent with the results of Hong et al. (2016) on the relationship between the Silk Road teleconnection (summer) and the change in jet stream location.

Figure 8The 200 hPa horizontal wind anomalies (vector, m s−1) and meridional wind anomalies (contours, m s−1) regressed onto the standardized −PC1 of the leading EOF mode for 200 hPa meridional wind anomalies (a) and the standardized PC1 of the leading EOF mode for 200 hPa zonal wind anomalies (b). The values of the contours and arrows are the regression coefficients. The solid red (dashed blue) contours indicate the positive (negative) meridional wind anomaly. The thick black line in (a) and (b) delineates the climatological jet axis (the gradient of the zonal wind with the longitude is 0). Only anomalies statistically significant at the 0.05 level based on a two-sided Student's t test are shown in (a) and (b).
To reveal the influence of the Rossby waves within the waveguide on atmospheric circulation in the middle and lower troposphere, 500 hPa geopotential height anomalies and 850 hPa wind field anomalies were regressed onto the PC1 of the first EOF mode of meridional wind (Fig. 9). The EU negative phase appears in the regressed geopotential height field. The two positive centers of the regression coefficients of the geopotential height anomaly are located over the Mediterranean Sea and the Sea of Japan. The positive geopotential height anomaly near the Sea of Japan weakens the East Asian trough, weakening the EAWM. In addition, the anticyclonic anomaly also causes the southerly wind anomaly at 850 hPa over the eastern coast of China, further weakening the EAWM. The center of the negative geopotential height anomaly is located in Siberia, weakening the Ural ridge and weakening the Lower Siberian High and favoring haze formation. The regression coefficient of the wind field anomaly shows that there is a southerly anomaly over the NCP and a southwesterly anomaly in southern China. The southerly anomaly over the NCP tends to weaken the winter wind, while the southwesterly anomaly over southern China carries water vapor from the Bay of Bengal and South China Sea to southern China, providing favorable moisture conditions for precipitation in southern China.

Figure 9Regression of 500 hPa geopotential height anomalies and the 850 hPa wind vector onto the negative standardized PC1 of the leading EOF mode for the 200 hPa meridional wind anomaly. The values of shading (units, gpm) and arrows (units, m s−1) represent regression coefficients. Regions of dotted areas indicate anomalies exceeding the 0.05 confidence level. Only anomalies statistically significant at the 0.05 level based on a Student's t test are given for the wind vector.
To further examine the mechanism behind the propagation of the Rossby waves, two-dimensional wave activity flux was calculated and generated according to the formula for the wave action flux defined by Plumb (1985). According to the definition, the wave activity flux reflects the sustained propagation of quasi-stationary wave energy to the area of East Asia and the western Pacific during this period when the Eurasian Continental trough and ridge is fixed (Plumb, 1985). Figure 10 shows that the European continent is the source of the anomalous Rossby wave activity. Rossby waves propagate into two pathways: a subtropical westerly jet and a polar front jet. The propagation of the Rossby wave activity flux causes the circulation anomaly in the downstream region (Luo, 2005; Li et al., 2015, 2019; Wang et al., 2019). The Rossby wave in the polar front jet was stronger than that in the subtropical westerly jet. Rossby waves in the polar front jet, named the EU, resulted in energy convergence over the Siberian area, leading to a negative geopotential height anomaly in this location, weakening the Ural ridge and preventing cold air advection towards China. The remaining energy from the easterly propagation caused the positive geopotential height anomaly over the Sea of Japan, weakening the East Asian trough and inducing the southerly wind anomaly over the eastern coast of China. The southern branch of the Rossby wave propagated within the subtropical westerly jet that passed over the Arabian Peninsula, India and other places. Almost all of its energy dispersing from the upstream was converged within southern China, resulting in anomalous circulation, conducive to a large amount of heavy rainfall. Ding et al. (2017) also found dispersion of Rossby wave energy enhanced anomalous low pressure over the Indo-China Peninsula and high pressure over eastern China, and maintenance of the strong Rossby waveguide caused the large spatial persistent heavy rainfall. Wang et al. (2019) found that the enhanced significant rainfall heating may greatly intensify the ascending motion over the western North Pacific sector and the adjacent region, resulting in subsidence over the Beijing–Tianjin–Hebei region and northeastern Asia via an anomalous local meridional circulation cell. We further hypothesize that the latent heat released by precipitation as a heat source strengthened the anomalous ascent in southern China, which intensified the anticyclonic anomaly in the NCP. The wave action flux was obviously enhanced in the Sea of Japan area, which may be due to the concurrent effect of two waves superposing in this area. Thus, the energy from the southern branch of the Rossby wave was very weak over the Sea of Japan, but the anticyclonic anomaly over the Sea of Japan was still very strong.

Figure 10Anomalous geopotential height (shading, 10 gpm) at 500 hPa in November and December 2015 and its stationary wave activity flux (vector, m−2 s−2).
Based on the analysis above, a diagram of the Rossby waves within the waveguide of the westerly jet affecting haze events in the NCP in November–December 2015 is drawn (Figs. 11, 12). The Rossby wave originated from the Mediterranean region (Li and Sun, 2015) and propagated eastward along the westerly jet, resulting in an anomalous anticyclone over the Sea of Japan and strengthening descending air motion over the NCP. In addition, there was a southerly wind anomaly at 850 hPa over the eastern coastal areas of China, which weakened the winter monsoon (Fig. 12). Both of these features are conducive to haze accumulation. In addition, the Rossby waves also caused a strong abnormal upward movement over southern China, which combined with the rich water vapor carried by the southwesterly airflow resulted in large-scale continuous rainfall (Figs. 11, 12). The latent heat released by precipitation as a heat source strengthened the abnormal ascending motion over southern China, which further helped to maintain the sinking motion in the NCP. A local circulation in the southern and northern parts of China was formed (Fig. 12): the air rises in the south and subsides in the north, facilitating the intensification of the descending air motion in the NCP and the persistence of haze.
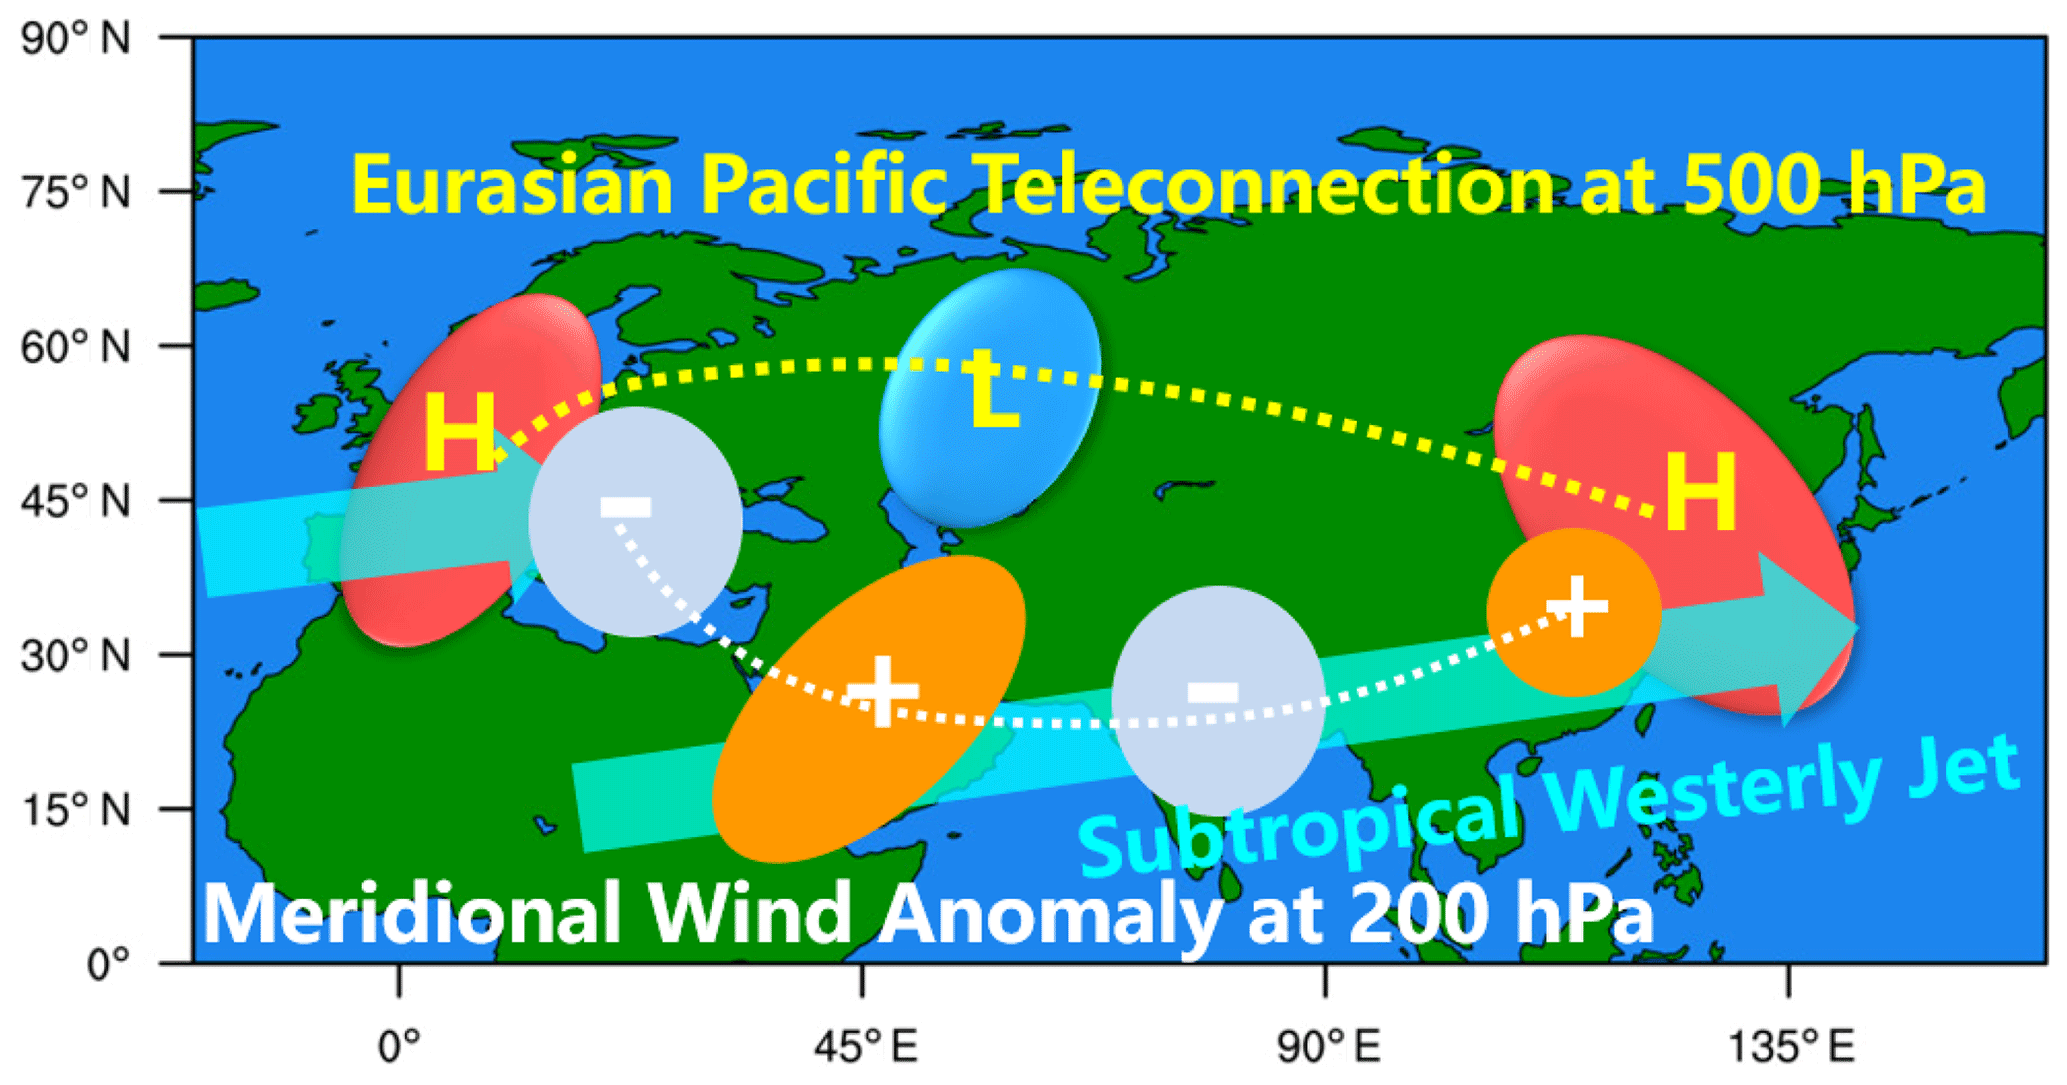
Figure 11A schematic diagram of the negative EU in the 200 hPa geopotential height field and meridional wind anomaly at 500 hPa in November and December 2015. H (L) denotes positive (negative) geopotential height anomalies; the plus and minus represent positive (southerly) and negative (northerly) meridional wind anomalies, respectively, and the shaded belt of arrows represents the subtropical westerly jet.
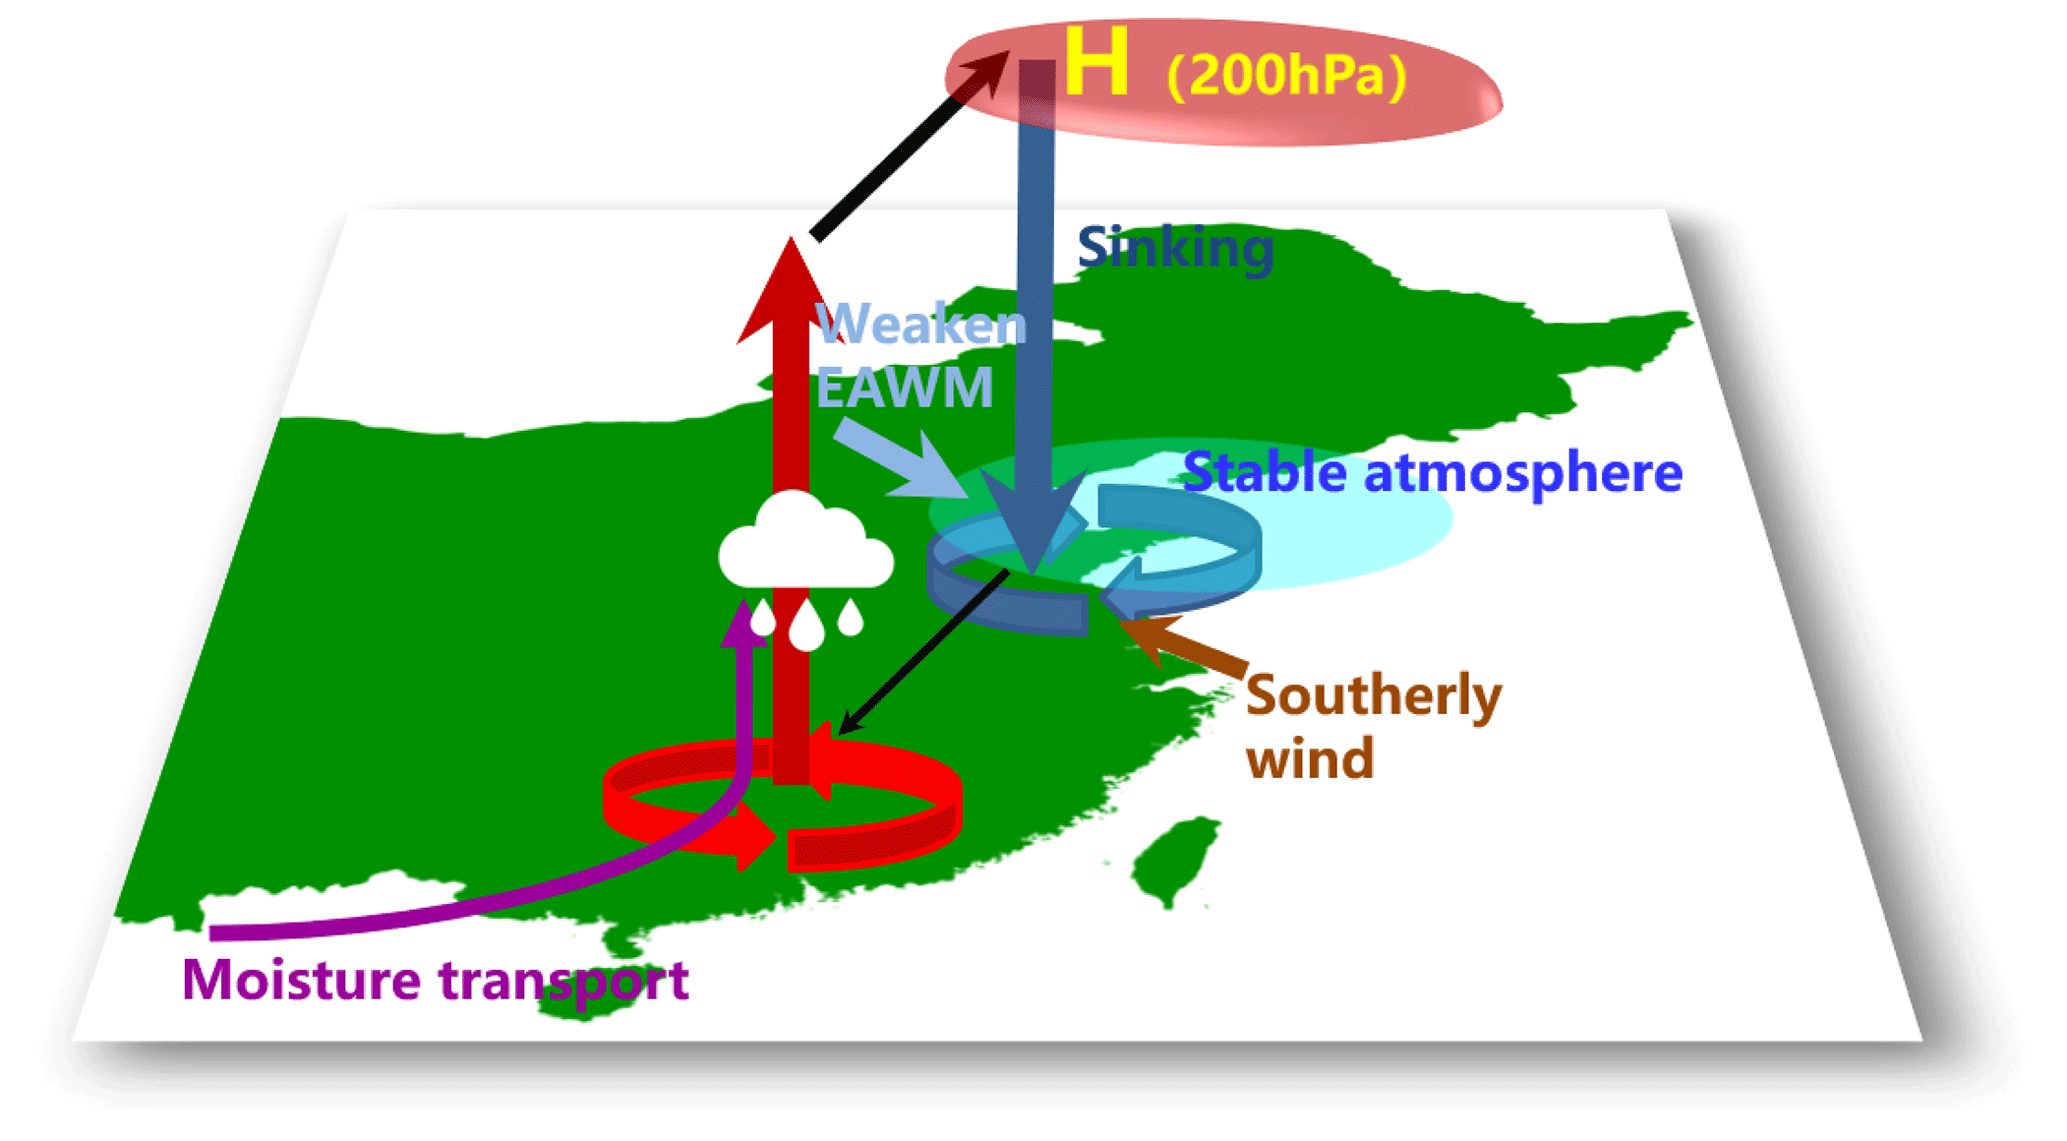
Figure 12Schematic illustration showing a circulation system affecting the haze events in November and December 2015. The red (blue) circular arrow represents convergence (divergence); the red (blue) translucent arrow represents ascending (descending) air; the brown translucent arrow represents the southerly wind anomaly; the purple solid arrow represents the water vapor transported by southwesterly airflow from the Bay of Bengal and South China Sea; the thick (thin) black arrow represents northward (southward) movement in the atmosphere; H denotes positive geopotential height anomaly; the white weather symbol represents precipitation.
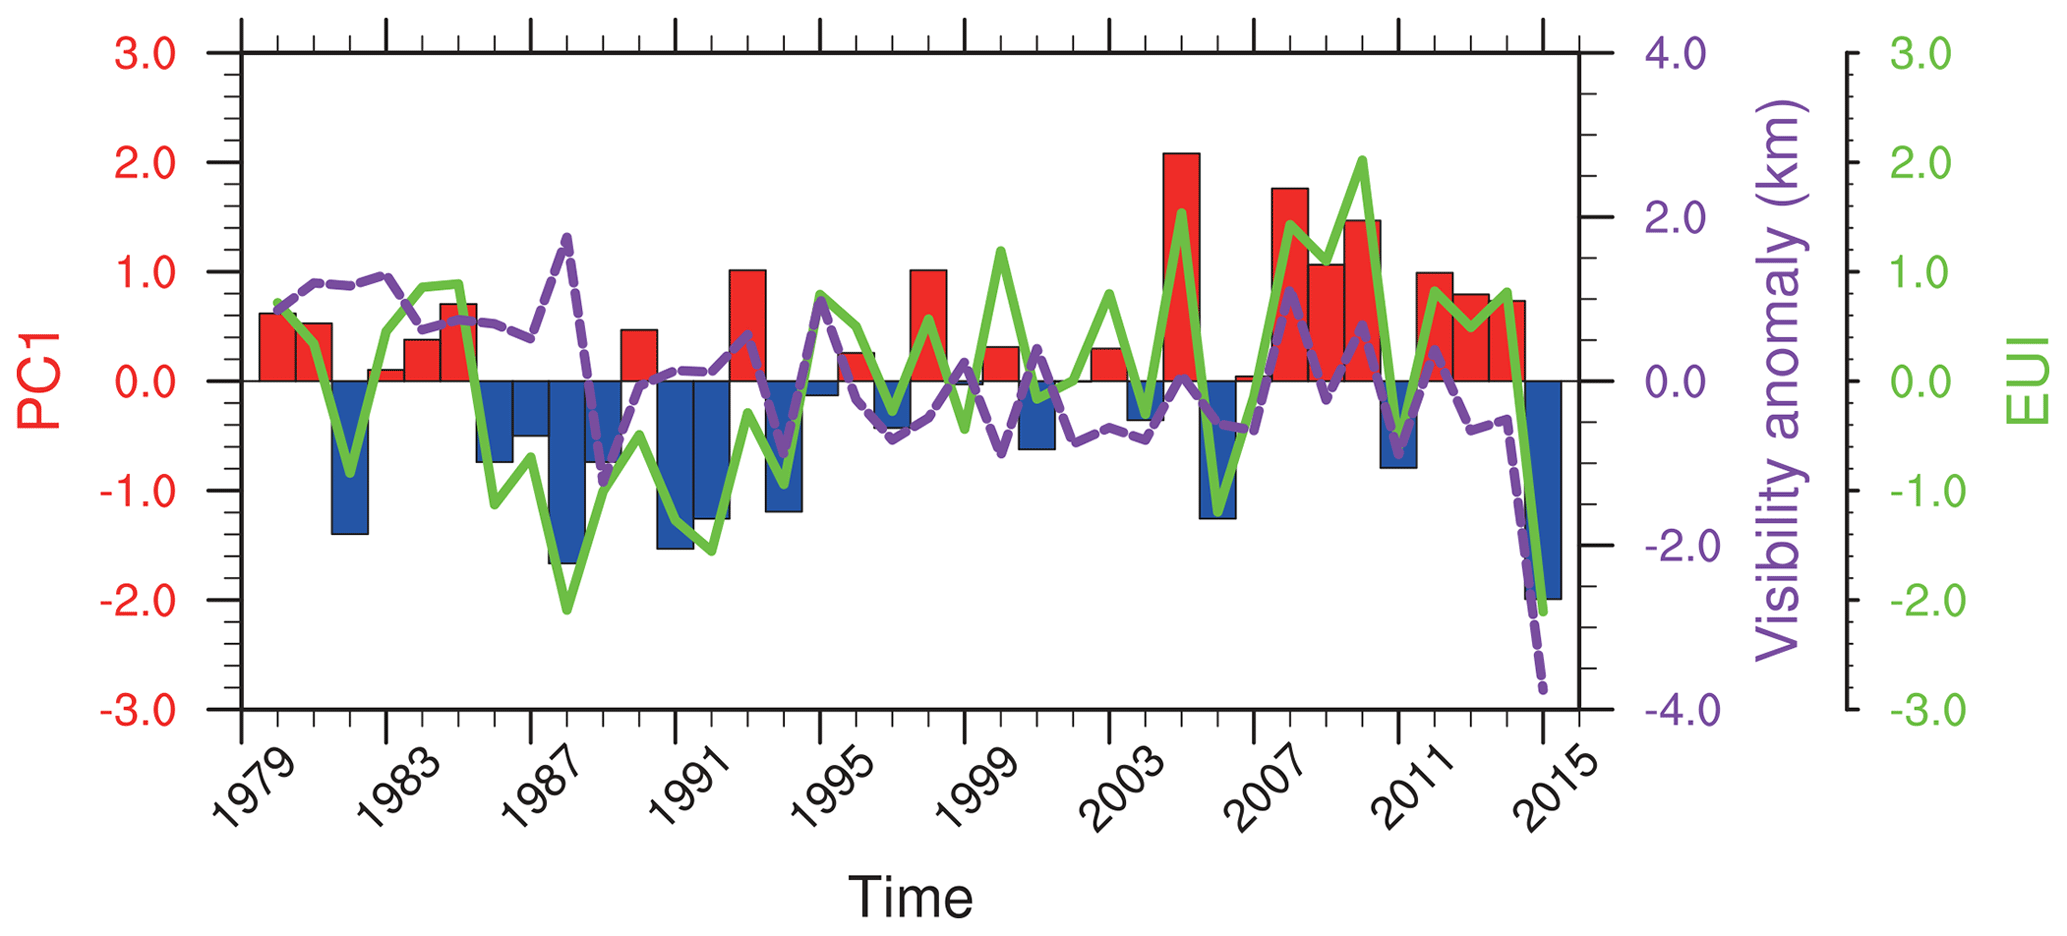
Figure 13The mean visibility anomaly (dashed line, purple) in November and December in the NCP, the EUI (solid line, green), and PC1 (bars, red and blue) of the leading EOF mode for the 200 hPa meridional wind anomaly from 1980 to 2015. The linear regression coefficient of the mean visibility onto PC1 is approximately 0.38 km, which is statistically significant at the 95 % confidence level.
A period of severe haze pollution occurred in the North China Plain (NCP) in November and December 2015. Pollutant emissions are vital for haze, and meteorological conditions also have an important impact on a haze event. The meteorological factors and mechanisms affecting haze were elucidated in this study. Haze was mainly modulated by the weakening of the East Asian Winter Monsoon (EAWM) and the strengthening of descending air in the NCP. The Rossby waves within two westerly jet waveguides originating from the Mediterranean region were the main mode fostering the atmospheric circulation patterns tightly associated with haze formation in the NCP.
The Rossby waves propagated eastward primarily along two pathways. The northern path yields positive geopotential height anomalies in the troposphere over the Sea of Japan and the NCP, strengthening the descending air movement over the NCP. In addition, it weakened the East Asia trough and Ural ridge, resulting in the southerly wind anomaly at 850 hPa over the eastern coast of China, weakening the winter monsoon, and leading to subsequent haze accumulation. Due to the influence of the southern path of the Rossby wave, there was anomalous ascent over southern China, which combined with a large amount of water vapor carried by the lower tropospheric anticyclonic circulation over southern China provided favorable conditions for continuous rainfall in southern China. As a heat source, the latent heat of condensation released by precipitation further strengthened the ascent over southern China; this is favorable for the subsidence and haze formation in the NCP.
The Rossby waves within two westerly jet waveguides may be the main mechanism leading to the occurrence and maintenance of large-scale haze in the NCP in November and December 2015. The linear regression coefficient of PC1 (bar) of the leading EOF mode for the 200 hPa meridional wind anomaly within the domain 0–75∘ N, 0–160∘ E onto the mean visibility anomaly in November and December is approximately 0.38 km per standard deviation from 1980 to 2015 (Fig. 13). The location of the EU mentioned above is slightly different from that of the EU defined by predecessors. The linear correlation coefficient of the PC1 of the leading EOF mode for the 200 hPa meridional wind anomaly (along southern path) and EUI (along northern path) is approximately 0.92, which further shows that the combined effect of the Rossby waves within two westerly jet waveguides may have an important influence on heavy haze in the NCP. The Rossby waves within two westerly jet waveguides were also strong in 1982, 1986, 1988, 1991, and 1992, and the visibility anomaly in the NCP was positive (Fig. 13). In addition, compared to the waves in 2015, the Rossby waves were weak or out of phase in 2000, 2002, 2003, 2007, 2013, and 2014, while the visibility anomaly in the NCP was negative. This means that under pollutant emission conditions (Figure 13), other large-scale circulation conditions may also cause air pollution. This paper focused on the haze in November and December 2015; therefore, the robustness of the mechanism may be further verified if other haze events can be evaluated in future studies. We can understand the complexity behind the climatic causes of severe air pollution from some existing studies. For example, the combined effects of the negative North Atlantic Oscillation (NAO) and El Niño worsened air conditions over central and southern China in the winters of 2000 and 2003 (Feng et al., 2019). The autumnal increased number of haze days in 2013 and 2014 was closely associated with simultaneous sea surface warming in the western North Pacific sector and the North Atlantic subtropical sector (Wang et al., 2019).
The visibility observational data are available at the China Meteorological Administration (http://data.cma.cn/, CAM, 2017). The reanalysis dataset is available at NCEP/NCAR (https://www.esrl.noaa.gov/psd/data/gridded/, NCEP/NCAR, 2019). The precipitation data are available at NASA (https://pmm.nasa.gov/data-access/downloads/gpm, NASA, 2019).
XA, LS, CL and JL designed the study. LS and YG acquired the funding. LS obtained observation data. XA and QL dealt with the visibility observational data. XA downloaded and analyzed the reanalysis data and prepared all the figures. XA led the writing with the help of LS, QL and YG. All the authors discussed the results and commented on the paper.
The authors declare that they have no conflict of interest.
This study was supported by the National Natural Science Foundation of China (grant no. 41675146) and Fundamental Research Funds for the Central Universities (grant no. 201941006). All the authors would like to express their great thanks to the China Meteorological Administration (http://data.cma.cn/, last access: 12 November 2017), NCEP/NCAR (https://www.esrl.noaa.gov/psd/data/gridded/, last access: 11 March 2019), and NASA (https://pmm.nasa.gov/data-access/downloads/gpm, last access: 10 June 2019) for supplying the research data. They are also very grateful for anonymous reviewers for their kind efforts that improved the quality of this manuscript significantly.
This research has been supported by the National Natural Science Foundation of China (grant no. 41675146) and the Fundamental Research Funds for the Central Universities (grant no. 201941006).
This paper was edited by Amanda Maycock and reviewed by two anonymous referees.
Chang, L. Y., Xu, J. M., Tie, X. X., and Wu, J. B.: Impact of the 2015 El Nino event on winter air quality in China, Sci. Rep., 6, 34275, https://doi.org/10.1038/srep34275, 2016.
Chen, H. S., Liu, L., and Zhu, Y. J.: Possible linkage between winter extreme low temperature events over China and synoptic-scale transient wave activity, Sci. China Ser., 56, 1266–1280, https://doi.org/10.1007/s11430-012-4442-z, 2013.
China Meteorological Administration: QXT 113-2010 Observation and forecasting levels of haze, China Meteorol. Press, Beijing, China, 2010 (in Chinese).
CMA: China ground observation data sets, available at: http://data.cma.cn/, last access: 12 November 2017 (in Chinese).
Cressman, G. P.: An operational objective analysis system, Mon. Weather Rev., 87, 367–374, 1959.
Czaja, A. and Frankignoul, C.: Observed Impact of Atlantic SST Anomalies on the North Atlantic Oscillation, J. Climate, 15, 606–623, https://doi.org/10.1175/1520-0442(2002)015<0606:OIOASA>2.0.CO;2, 2002.
Dang, R. and Liao, H.: Severe winter haze days in the Beijing–Tianjin–Hebei region from 1985 to 2017 and the roles of anthropogenic emissions and meteorology, Atmos. Chem. Phys., 19, 10801–10816, https://doi.org/10.5194/acp-19-10801-2019, 2019.
Ding, F. and Li, C.: Subtropical westerly jet waveguide and winter persistent heavy rainfall in south China, J. Geophys. Res.-Atmos., 122, 7385–7400, https://doi.org/10.1002/2017JD026530, 2017.
Ding, Y. H., Li, Q. P., Liu, Y. J., Zhang, L., Song, Y. F., and Zhang, J.: Atmospheric Aerosols, Air Pollution and Climate Change, Meteorological Monthly, 35, 3–15, 2009 (in Chinese).
Feldstein, S. B. and Dayan, U.: Circumglobal teleconnections and wave packets associated with Israeli winter precipitation, Q. J. Roy. Meteor. Soc., 134, 455–467, https://doi.org/10.1002/qj.225, 2008.
Feng, J., Li, J., Liao, H., and Zhu, J.: Simulated coordinated impacts of the previous autumn North Atlantic Oscillation (NAO) and winter El Niño on winter aerosol concentrations over eastern China, Atmos. Chem. Phys., 19, 10787–10800, https://doi.org/10.5194/acp-19-10787-2019, 2019.
Feng, J. M., Zhao, T. B., and Zhang, Y. J.: Intercomparison of Spatial Interpolation Based on Observed Precipitation Data, Climatic Environ. Res., 2, 261–277, https://doi.org/10.1117/12.528072, 2004 (in Chinese).
Gao, Y. and Chen, D.: A dark October in Beijing 2016, Atmos. Ocean. Sci. Lett., 10, 206–213, https://doi.org/10.1080/16742834.2017.1293473, 2017.
He, C., Liu, R., Wang, X. M., Liu, S. C., Zhou, T. J., and Liao, W. H.: How does El Niño-Southern Oscillation modulate the interannual variability of winter haze days over eastern China?, Sci. Total Environ., 651, 1892–1902, https://doi.org/10.1016/j.scitotenv.2018.10.100, 2019.
He, S. P. and Wang, H. J.: An integrated East Asian winter monsoon index and its inter-annual variability, Chinese Journal of Atmospheric Sciences, 36, 523–538, https://doi.org/10.3878/j.issn.1006-9895.2011.11083, 2012 (in Chinese).
Hong, X. and Lu, R.: The meridional displacement of the summer Asian jet, Silk Road Pattern, and tropical SST anomalies, J. Climate, 29, 3753–3766, https://doi.org/10.1175/JCLI-D-15-0541.1, 2016.
Hoskins, B. J. and Ambrizzi, T.: Rossby wave propagation on a realistic longitudinally varying flow, J. Atmos. Sci. 50, 1661–1671, https://doi.org/10.1175/1520-0469(1993)050<1661:RWPOAR>2.0.CO;2, 1993.
Hsu, H. H. and Lin, S. H.: Global teleconnections in the 250-mb streamfunction field during the in the geopotential height field during the Northern Hemisphere winter, Mon. Weather Rev., 120, 1169–1190, https://doi.org/10.1175/1520-0493(1992)120<1169:GTITMS>2.0.CO;2, 1992.
Huang, D., Dai, A., Yang, B., Yan, P., Zhu, J., and Zhang, Y.: Contributions of Different Combinations of the IPO and AMO to Recent Changes in Winter East Asian Jets, J. Climate, 32, 1607–626, https://doi.org/10.1175/JCLI-D-18-0218.1, 2019.
Huffman, G., Bolvin, D., Braithwaite, D., Hsu, K., Joyce, R., and Xie, P.: Integrated Multi-satellite Retrievals for GPM (IMERG), version 4.4, NASA's Precipitation Processing Center, 2014.
Kanamitsu, M., Ebisuzaki, W., Woollen, J., Yang, S.-K., Hnilo, J. J., Fiorino, M., and Potter, G. L.: NCEP-DOE AMIP-II Reanalysis (R-2), B. Am. Meteorol. Soc., 83, 1631–1643, 2002.
Li, C. and Sun, J. L.: Role of the subtropical westerly jet waveguide in a southern China heavy rainstorm in December 2013, Adv. Atmos. Sci., 32, 601–612, https://doi.org/10.1007/s00376-014-4099-y, 2015.
Li, C. F., Chen, W., Hong, X. W., and Lu, R. Y.: Why was the strengthening of rainfall in summer over the Yangtze River valley in 2016 less pronounced than that in 1998 under similar preceding El Nino events? Role of midlatitude circulation in August, Adv. Atmos. Sci., 34, 1290–1300, https://doi.org/10.1007/s00376-017-7003-8, 2017.
Li, C. Y.: Frequent activity of East Asian trough and El Nino onset, Sci. China Ser. B, 31, 667–674, 1988 (in Chinese).
Li, J., Sun, C., and Jin, F. F.: NAO implicated as a predictor of Northern Hemisphere mean temperature multi-decadal variability, Geophys. Res. Lett., 40, 5497–5502, https://doi.org/10.1002/2013GL057877, 2013.
Li, S., Han, Z., and Chen. H.: A comparison of the effects of inter-annual Arctic sea ice loss and ENSO on winter haze days: observational analyses and AGCM simulations, J. Meteorol. Res., 31, 820–833, https://doi.org/10.1007/s13351-017-7017-2, 2017.
Li, S. L. and Bates, G.: Influence of the Atlantic Multidecadal Oscillation (AMO) on the winter climate of East China, Adv. Atmos. Sci., 24, 126–135, https://doi.org/10.1007/s00376-007-0126-6, 2007.
Li, Y., Sheng, L. F., Li, C., and Wang, Y. H.: Impact of the Eurasian Teleconnection on the Interannual Variability of Haze-Fog in Northern China in January, Atmosphere, 10, 113, https://doi.org/10.3390/atmos10030113, 2019.
Liu, Q., Sheng, L., Cao, Z., Diao, Y., Wang, W., and Zhou, Y.: Dual effects of the winter monsoon on haze-fog variations in eastern China, J. Geophys. Res.-Atmos., 122, 5857–5869, https://doi.org/10.1002/2016JD026296, 2017.
Lu, R. Y., Jai, H. O., and Baek, J. K.: A teleconnection pattern in upperlevel meridional wind over the North African and Eurasian continent in summer, Tellus A, 54, 44–55, https://doi.org/10.3402/tellusa.v54i1.12122, 2002.
Luo, D.: A barotropic envelope Rossby soliton model for block-eddy interaction. Part II: Role of westward-traveling planetary waves, J. Atmos. Sci., 62, 22–40, doi.org/10.1175/3347.1, 2005.
Ma, N., Zhao, C. S., Chen, J., Xu, W. Y., Yan, P., and Zhou, X. J.: A novel method for distinguishing fog and haze based on PM2.5, visibility, and relative humidity, Sci. China Earth Sci., 57, 2156–2164, https://doi.org/10.1007/s11430-014-4885-5, 2014.
NASA: NASA GPM_3IMERGDL_V05 dataset, available at: https://pmm.nasa.gov/data-access/downloads/gpm, last access: 10 June 2019.
NCEP/NCAR: NCEP/NCAR Reanalysis data sets, available at: http://www.esrl.noaa.gov/psd/data/gridded/data.ncep.reanalysis.html, last access: 11 March 2019.
Ni, D.-H., Sun, Z.-B., Li, Z.-X., Zeng, G., and Deng, W.-T.: Relation of Middle East jet stream and China climate anomaly in winter, Scientia Meteor. Sinica, 30, 301–307, https://doi.org/10.1175/1520-0442(1995)008<0137:TDBEAM>2.0.CO;2, 2010 (in Chinese).
Peng, S., Mysak, L. A., Derome, J., Ritchie, H., and Dugas, B.: The Differences between Early and Midwinter Atmospheric Responses to Sea Surface Temperature Anomalies in the Northwest Atlantic, J. Climate, 8, 137–157, 1995.
Plumb, R. A.: On the three-dimensional propagation of stationary waves, J. Atmos. Sci., 42, 217–229, https://doi.org/10.1175/1520-0469(1985)042<0217:OTTDPO>2.0.CO;2, 1985.
Ren, X. J., Yang, X. Q., Zhou, T. J., and Fang, J. B.: Diagnostic comparison of the East Asian subtropical jet and polar-front jet: Large-scale characteristics and transient eddy activities, Acta Meteorol. Sin., 68, 1–11, https://doi.org/10.1007/s13351-011-0002-2, 2010.
Syed, F. S., Giorgi, F., Pal, J. S., and King, M. P.: Effect of remote forcings on the winter precipitation of central southwest Asia Part 1: Observations, Theor. Appl. Climatol., 86, 147–160, https://doi.org/10.1007/s00704-005-0217-1, 2006.
Tai, A. P. K., Mickley, L. J., Jacob, D. J., Leibensperger, E. M., Zhang, L., Fisher, J. A., and Pye, H. O. T.: Meteorological modes of variability for fine particulate matter (PM2.5) air quality in the United States: implications for PM2.5 sensitivity to climate change, Atmos. Chem. Phys., 12, 3131–3145, https://doi.org/10.5194/acp-12-3131-2012, 2012.
Wallace, J. M. and Gutzler, D. S.: Teleconnections in the geopotential height field during the Northern Hemisphere winter, Mon. Weather Rev., 109, 784–812, https://doi.org/10.1175/1520-0493(1981)109<0784:TITGHF>2.0.CO;2, 1981.
Wang, H.-J. and Chen, H.-P.: Understanding the recent trend of haze pollution in eastern China: roles of climate change, Atmos. Chem. Phys., 16, 4205–4211, https://doi.org/10.5194/acp-16-4205-2016, 2016.
Wang, J., Zhu, Z., Qi, L., Zhao, Q., He, J., and Wang, J. X. L.: Two pathways of how remote SST anomalies drive the interannual variability of autumnal haze days in the Beijing–Tianjin–Hebei region, China, Atmos. Chem. Phys., 19, 1521–1535, https://doi.org/10.5194/acp-19-1521-2019, 2019.
Wen, M., Yang, S., Kumar, A., and Zhang, P. Q.: An analysis of the Large-Scale climate anomalies associated with the snowstorms affecting China in January 2008, Mon. Weather Rev., 137, 1111–1131, https://doi.org/10.1175/2008MWR2638.1, 2009.
Wu, D., Wu, X. J., Li, F., Tan, H. B., Chen, J., Chen, H. H., Chen, H. Z., Cao, Z. Q., Li, H. Y., and Sun, X.: Long-term variations of fog and mist in mainland China during 1951–2005, J. Trop. Meteor., 19, 181–187, https://doi.org/10.1175/JCLI-D-12-00858.1, 2013.
Wu, G. X., Li, Z. Q., Fu, C. B., Zhang, X. Y., Zhang, R. Y., Zhang, R. H., Zhou, T. J., Li, J. P., Li, J. D., Zhou, D. G., Wu, L., Zhou, L. T., He, B., and Huang, R. H.: Advances in studying interactions between aerosols and monsoon in China, Science China: Earth Sciences, 45, 1609–1627, https://doi.org/10.1007/s11430-015-5198-z, 2015.
Wu, J., Bei, N., Hu, B., Liu, S., Zhou, M., Wang, Q., Li, X., Liu, L., Feng, T., Liu, Z., Wang, Y., Cao, J., Tie, X., Wang, J., Molina, L. T., and Li, G.: Is water vapor a key player of the wintertime haze in North China Plain?, Atmos. Chem. Phys., 19, 8721–8739, https://doi.org/10.5194/acp-19-8721-2019, 2019.
Xiao, D., Li, Y., Fan, S. J., Zhang, R. H., Sun, J. R., and Wang, Y.: Plausible influence of Atlantic Ocean SST anomalies on winter haze in China, Theor. Appl. Climatol., 122, 249–257, https://doi.org/10.1007/s00704-014-1297-6, 2014.
Xu, P., Wang, L., and Chen, W.: The British Baikal Corridor: A Teleconnection Pattern along the Summer time Polar Front Jet over Eurasia, J. Climate, 32, 877–896, https://doi.org/10.1175/JCLI-D-18-0343, 2019.
Yang, J., Wu, R., and Song, L.: Individual and combined impacts of two Eurasian wave trains on intra-seasonal East Asian winter monsoon variability, J. Geophys. Res.-Atmos., 124, 4530–4548, https://doi.org/10.1029/2018JD029953, 2019.
Yang, Y., Liao, H., and Lou, S.: Increase in winter haze over eastern China in recent decades: Roles of variations in meteorological parameters and anthropogenic emissions, J. Geophys. Res.-Atmos., 121, 13050–13065, https://doi.org/10.1002/2016JD025136, 2016.
Zhai, P. M., Yu, R., Guo, Y. J., Li, Q. X., Ren, X. J., Wang, Y. Q., Xu, W. H., Liu, Y. J., and Ding, Y. H.: The strong El Niño of 2015/16 and its dominant impacts on global and China's climate, J. Meteorol. Res., 30, 283–297, https://doi.org/10.1007/s13351-016-6101-3, 2016.
Zhang, G., Gao, Y., Cai, W., Leung, L. R., Wang, S., Zhao, B., Wang, M., Shan, H., Yao, X., and Gao, H.: Seesaw haze pollution in North China modulated by the sub-seasonal variability of atmospheric circulation, Atmos. Chem. Phys., 19, 565–576, https://doi.org/10.5194/acp-19-565-2019, 2019.
Zhang, L. Y., Lu, X. B., Yang, L. L., Ding, F., Zhu, Z. F., and Rui, D. M.: Study on the Effects of the Strong El Nino Event on Air Quality of Eastern China in Winter, The Administration and Technique of Environmental Monitoring, 28, 23–27, 2016.
Zhang, X. Y., Sun, J. Y., Wang, Y. Q., Li, W. J., Zhang, Q., Wang, W. G., Quan, J. N., Cao, G. L., Wang, J. Z., Yang, Y. Q., and Zhang, Y. M.: Factors contributing to haze and fog in China, Chinese Sci. Bull., 58, 1178–1187, https://doi.org/10.1360/972013-150, 2013 (in Chinese).
Zhang, Y., Yan, P., Liao, Z., Huang, D., and Zhang, Y.: The Winter Concurrent Meridional Shift of the East Asian Jet Streams and the Associated Thermal Conditions, J. Climate, 32, 2075–2088, https://doi.org/10.1175/JCLI-D-18-0085.1, 2019.
Zhang, Z., Zhang, X., Gong, D., Kim, S.-J., Mao, R., and Zhao, X.: Possible influence of atmospheric circulations on winter haze pollution in the Beijing–Tianjin–Hebei region, northern China, Atmos. Chem. Phys., 16, 561–571, https://doi.org/10.5194/acp-16-561-2016, 2016.
Zhao, X. J., Zhao, P. S., Xu, J., Meng,, W., Pu, W. W., Dong, F., He, D., and Shi, Q. F.: Analysis of a winter regional haze event and its formation mechanism in the North China Plain, Atmos. Chem. Phys., 13, 5685–5696, https://doi.org/10.5194/acp-13-5685-2013, 2013.
- Abstract
- Introduction
- Data and methodology
- Persistent haze events and associated weather patterns
- Evolution of the Rossby waves within two westerly jet waveguides and principal mechanisms
- Discussions and conclusions
- Data availability
- Author contributions
- Competing interests
- Acknowledgements
- Financial support
- Review statement
- References