the Creative Commons Attribution 4.0 License.
the Creative Commons Attribution 4.0 License.
 | 21 Apr 2020
Characterization of organic aerosol across the global remote troposphere: a comparison of ATom measurements and global chemistry models
Alma Hodzic
Pedro Campuzano-Jost
Huisheng Bian
Mian Chin
Peter R. Colarco
Douglas A. Day
Karl D. Froyd
Bernd Heinold
Duseong S. Jo
Joseph M. Katich
John K. Kodros
Benjamin A. Nault
Jeffrey R. Pierce
Jacob Schacht
Gregory P. Schill
Jason C. Schroder
Joshua P. Schwarz
Donna T. Sueper
Ina Tegen
Simone Tilmes
Kostas Tsigaridis
Pengfei Yu
Jose L. Jimenez
The spatial distribution and properties of submicron organic aerosol (OA) are among the key sources of uncertainty in our understanding of aerosol effects on climate. Uncertainties are particularly large over remote regions of the free troposphere and Southern Ocean, where very few data have been available and where OA predictions from AeroCom Phase II global models span 2 to 3 orders of magnitude, greatly exceeding the model spread over source regions. The (nearly) pole-to-pole vertical distribution of non-refractory aerosols was measured with an aerosol mass spectrometer onboard the NASA DC-8 aircraft as part of the Atmospheric Tomography (ATom) mission during the Northern Hemisphere summer (August 2016) and winter (February 2017). This study presents the first extensive characterization of OA mass concentrations and their level of oxidation in the remote atmosphere. OA and sulfate are the major contributors by mass to submicron aerosols in the remote troposphere, together with sea salt in the marine boundary layer. Sulfate was dominant in the lower stratosphere. OA concentrations have a strong seasonal and zonal variability, with the highest levels measured in the lower troposphere in the summer and over the regions influenced by biomass burning from Africa (up to 10 µg sm−3). Lower concentrations (∼0.1–0.3 µg sm−3) are observed in the northern middle and high latitudes and very low concentrations (<0.1 µg sm−3) in the southern middle and high latitudes. The ATom dataset is used to evaluate predictions of eight current global chemistry models that implement a variety of commonly used representations of OA sources and chemistry, as well as of the AeroCom-II ensemble. The current model ensemble captures the average vertical and spatial distribution of measured OA concentrations, and the spread of the individual models remains within a factor of 5. These results are significantly improved over the AeroCom-II model ensemble, which shows large overestimations over these regions. However, some of the improved agreement with observations occurs for the wrong reasons, as models have the tendency to greatly overestimate the primary OA fraction and underestimate the secondary fraction. Measured OA in the remote free troposphere is highly oxygenated, with organic aerosol to organic carbon (OA ∕ OC) ratios of ∼2.2–2.8, and is 30 %–60 % more oxygenated than in current models, which can lead to significant errors in OA concentrations. The model–measurement comparisons presented here support the concept of a more dynamic OA system as proposed by Hodzic et al. (2016), with enhanced removal of primary OA and a stronger production of secondary OA in global models needed to provide better agreement with observations.
- Article
(5989 KB) - Full-text XML
-
Supplement
(7520 KB) - BibTeX
- EndNote


Organic aerosol (OA) is a complex mixture of directly emitted primary OA (POA) and chemically produced secondary OA (SOA) from anthropogenic and biogenic emission sources. It is associated with adverse health effects (Mauderly and Chow, 2008; Shiraiwa et al., 2017) and contributes radiative forcing to the climate system (Boucher et al., 2013). The currently limited understanding of processes involved in the formation, aging, and removal of organic compounds results in large uncertainties in (i) the predicted global OA burden, (ii) relative contributions of emissions vs. chemistry to OA formation, (iii) spatial distribution, and (iv) impacts on radiation and clouds (Kanakidou et al., 2005; Hallquist et al., 2009; Heald et al., 2011; Spracklen et al., 2011; Tsigaridis et al., 2014; Hodzic et al., 2016; Shrivastava et al., 2017; Tsigaridis and Kanakidou, 2018; Zhu et al., 2019). The uncertainties are particularly large in the estimated global burden of SOA, which ranges from 12 to 450 Tg yr−1 (see Fig. 9 of Hodzic et al., 2016), and in the direct and indirect radiative forcing that ranges from −0.08 to −0.33 and −0.60 to −0.77 W m−2, respectively (Spracklen et al., 2011; Myhre et al., 2013; Scott et al., 2014; Hodzic et al., 2016; Tsigaridis and Kanakidou, 2018). Reducing these uncertainties is becoming more important as OA is on a path to becoming the dominant fraction of submicron anthropogenic aerosol mass globally due to ongoing efforts to reduce SO2 emissions and associated sulfate aerosols.
Model performance has been especially poor in the remote regions of the atmosphere where OA measurements available for model evaluation have been sparse (especially aloft). Using data from 17 aircraft campaigns mostly located in the Northern Hemisphere, Heald et al. (2011) showed that the skill of the global GEOS-Chem model in predicting the vertical distribution of OA was significantly decreased in remote regions compared to polluted near-source regions. The study pointed out the limitations of commonly used SOA formation mechanisms that are based on chamber data; these have the tendency to underpredict OA in source regions and overpredict OA in the remote troposphere. For a subset of nine recent aircraft campaigns, Hodzic et al. (2016) showed that OA is likely a more dynamic system than represented in chemistry–climate models, with both stronger production and stronger removals. These authors suggested that additional removal mechanisms via, e.g., photolytic or heterogeneous reactions of OA particles are needed to explain low OA concentrations observed in the upper troposphere where direct cloud scavenging is less efficient. The recent global multi-model comparison study (Tsigaridis et al., 2014) within the AeroCom Phase II project illustrates the amplitude of model uncertainties simulating OA mass concentrations and the contrast in model performance between near-source and remote regions. The results indicate that model dispersion (the spread between the models with the lowest and highest predicted OA concentrations) increases with altitude from roughly 1 order of magnitude near the surface to 2–3 orders of magnitude in the upper troposphere. Our own analyses of the AeroCom-II models shown in Fig. 1a indicate that model dispersion (quantified as the ratio of the average concentration of the highest model to that of the lowest one in each region) increases not only with altitude but also with distance from the northern midlatitude source (and data-rich) regions. The model spread is a factor of 10–20 in the free troposphere between the Equator and northern midlatitudes and increases to a factor of 200–800 over the Southern Ocean and near the tropopause. It is not surprising that model spread is lower closer to source regions where it is mostly driven by uncertainties in emissions and SOA production yields. Spread is expected to be larger in remote regions where models are also impacted by uncertainties in transport, chemical aging, and removal. The lowest model dispersion also coincides with the regions of the Northern Hemisphere (NH) and the African biomass burning outflow where models have been evaluated the most (Fig. 1b), emphasizing the need for further model–observation comparison studies in remote regions (of the Southern Hemisphere (SH) in particular).
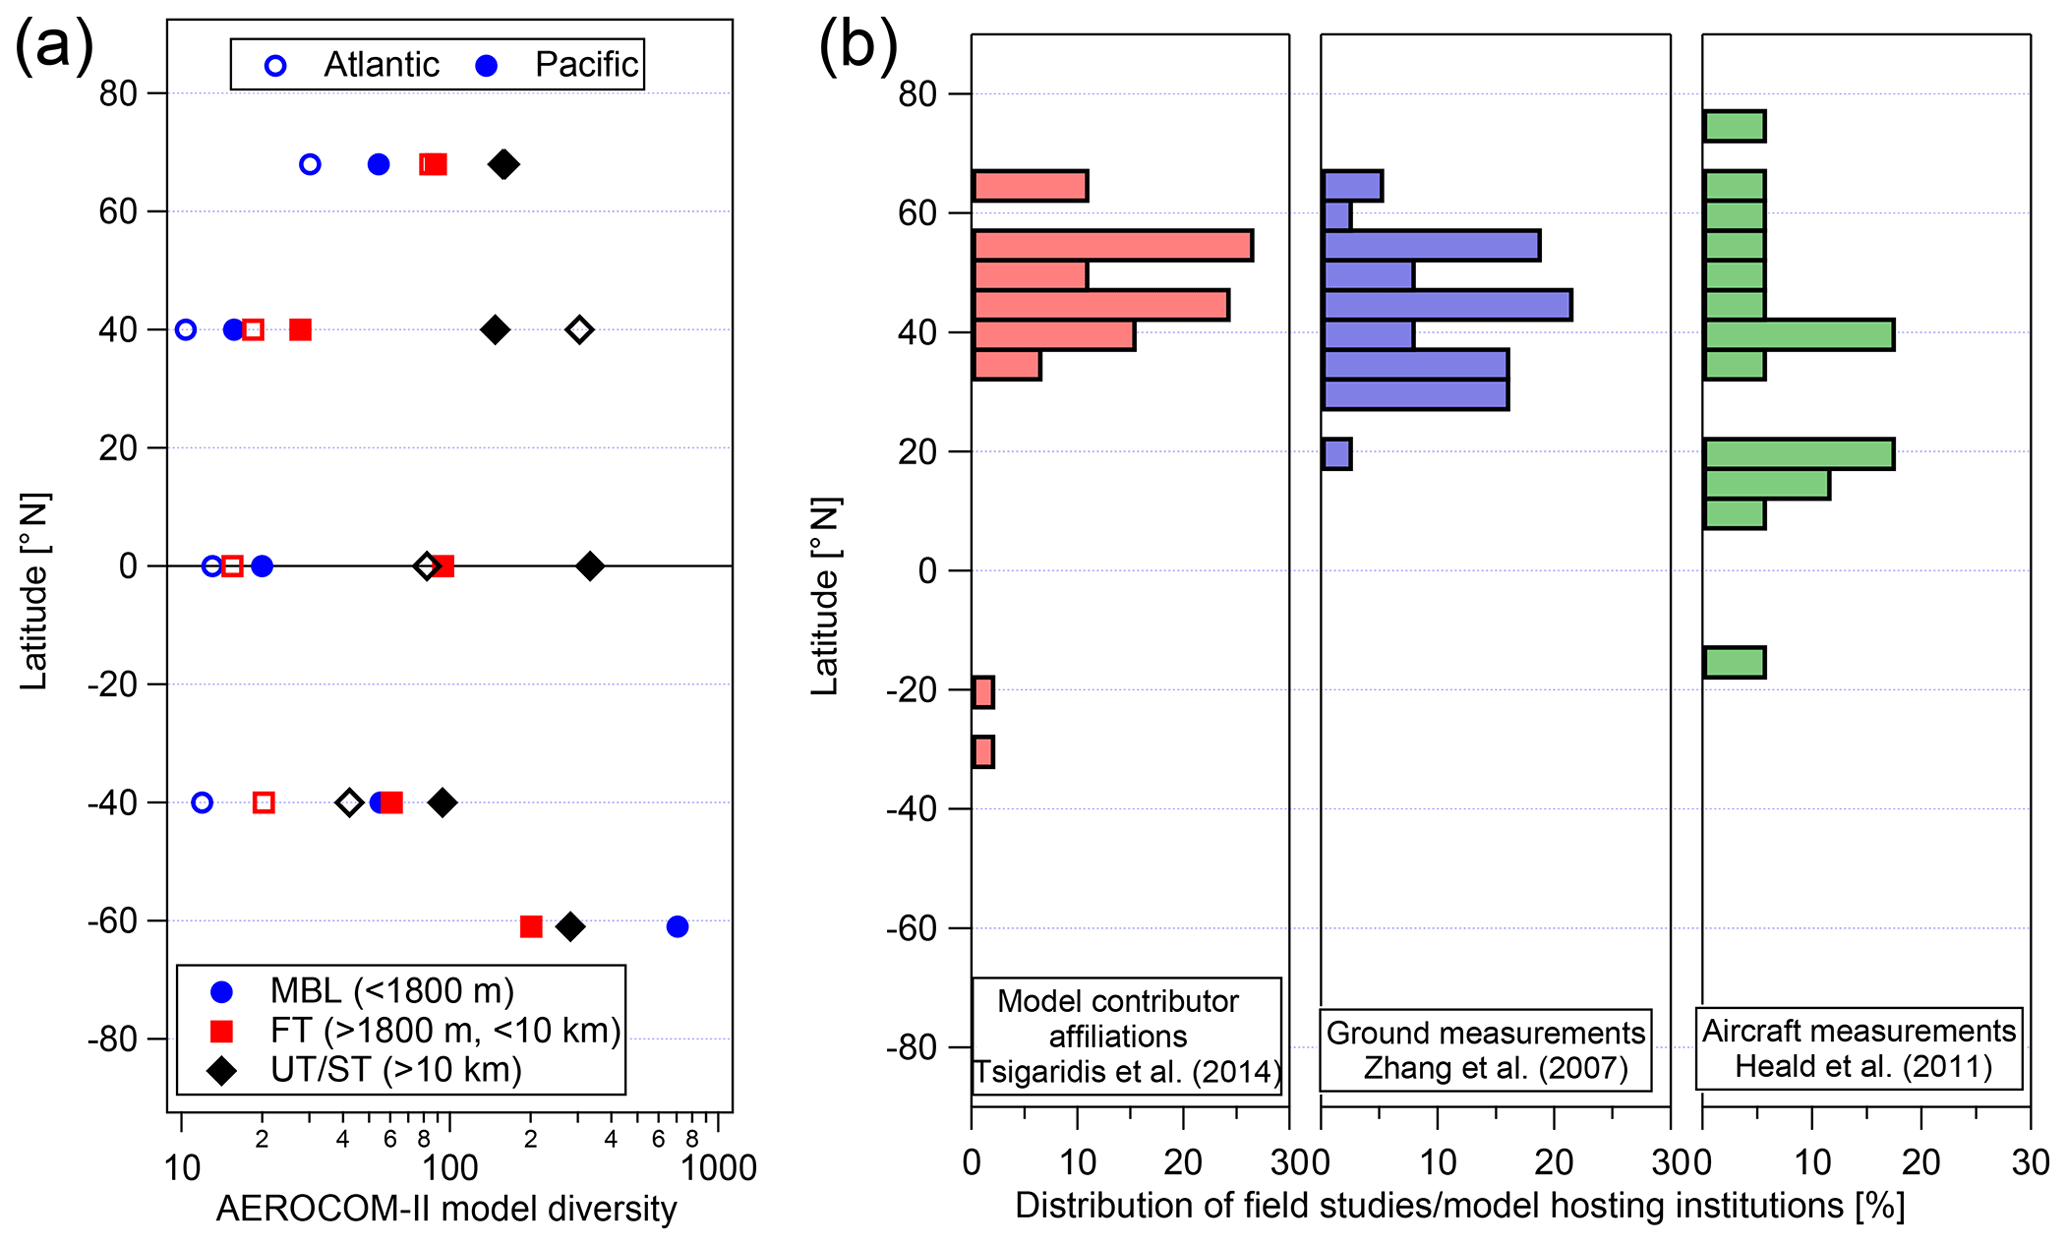
Figure 1(a) The ratio between the average OA concentrations of the highest and the lowest models (for each region) as predicted among 28 global chemistry transport models participating in the AeroCom Phase II intercomparison study (Tsigaridis et al., 2014). (b) Geographical distribution of institutions at which the AeroCom-II models were run and/or developed (based on author affiliations) and of the field measurements included in two major literature overview studies (Zhang et al., 2007; Heald et al., 2011) for the OA ground and aircraft AMS as a function of latitude. For the aircraft campaigns, the average latitude for the full deployment was taken.
Here, we present a unique dataset of airborne aerosol mass spectrometer measurements of OA mass concentrations collected onboard the NASA DC-8 as part of the Atmospheric Tomography (ATom) mission. The aircraft sampled the vertical structure of the atmosphere from the near-surface (0.2 km) to lower stratosphere (LS) regions (12 km of altitude) over both the Pacific and Atlantic basins (to limit the influence of source regions) with a quasi-global spatial coverage from 82∘ N to 67∘ S. This dataset is used to perform the first systematic global-scale multi-model evaluation of the chemistry–climate models focusing on OA in the remote troposphere over the remote oceans. We focus on the NH summer (August 2016, ATom-1) and NH winter (February 2017, ATom-2) deployments. Overall, these ATom missions sampled the marine boundary layer (MBL) for 10 % of the flight tracks 12 % of the time in the remote lower stratosphere and the rest the free troposphere. The model–observation comparisons are aimed at identifying discrepancies in terms of OA mass concentrations and vertical distribution, their fractional contribution to submicron aerosols, and their oxidation level in global models.
The modeling framework is described in Sect. 2. Section 3 describes the ATom dataset and the spatial and vertical distributions of OA over the Atlantic and Pacific regions. Section 4 presents the comparisons of ATom-1 and ATom-2 data to multi-model predictions from both the AeroCom-II models and the ensemble of eight current model simulations of the ATom campaign. Section 5 presents the conclusions of the study and discusses its implications.
2.1 ATom model simulations
ATom measurements were compared with the results of eight global models that simulated the time period of the ATom-1 and ATom-2 campaigns (August 2016 and February 2017) using the emissions and reanalysis meteorology corresponding to this period (and a spin-up time of at least 6 to 12 months). These are referred to hereafter as ATom models and include the NASA global Earth system model GEOS5, the aerosol–climate model ECHAM6-HAM, three versions of the NCAR Community Earth System Model (CESM), and three versions of the global chemistry GEOS-Chem model. Simulations were performed at various horizontal resolutions ranging from relatively high at ∼50 km (GEOS5) and ∼100 km (CESM2 models) to somewhat coarser grids of ∼200 km (CESM1-CARMA, GEOS-Chem) and ∼400 km for GC10-TOMAS. The advantage of using the same host model (in the cases of variants of CESM2 and GEOS-Chem) is that the dynamics and emissions remain comparable. Models differ greatly in their treatment of emissions, gas-phase chemistry, aerosol chemistry and physical processes, and aerosol coupling with radiation and clouds, among others. Table 1 describes the configuration of various models (e.g., meteorology, emissions) and their treatment of OA. In this section we only summarize the main features and parameters directly impacting the OA simulations. Some models do not include SOA chemistry and instead assume that SOA is directly emitted proportional to the emissions of its precursors (ECHAM6-HAM, CESM2-SMP, GEOS5, GC10-TOMAS), while others have more complex treatments of organic compounds, their chemistry, and partitioning into particles (GC12-REF, GC12-DYN, GC10-TOMAS, CESM1-CARMA, CESM2-DYN). It should be noted that models that directly emit SOA assume that SOA is a non-volatile species that remains irreversibly in the particle phase. In all models POA is treated as a non-volatile directly emitted species. In most models (see below) the primary emitted organic aerosol is artificially aged to transition between hydrophobic and hydrophilic POA. There are some commonalities between simulations for the treatment of biogenic emissions, which are based in all models on the Model of Emissions of Gases and Aerosols from Nature (MEGAN; Guenther et al., 2012) to generate meteorology-dependent emissions of volatile organic compounds. None of the models includes the marine production of OA, which is estimated to be ∼3 orders of magnitude smaller than the continental production of OA from both isoprene and monoterpene precursors (Kim et al., 2017) but could be important in the MBL. This contribution could, however, be larger for sea-spray biological material from phytoplankton, with predicted contributions of 0.01 to 0.1 µg m−3 to surface submicron aerosol over remote oceanic regions (Vergara-Temprado et al., 2017; Middlebrook et al., 1998). Below we only provide a brief description of the most important processes that influence OA for each model.
Table 1ATom global model configurations and their treatment of the most important processes affecting organic aerosols.
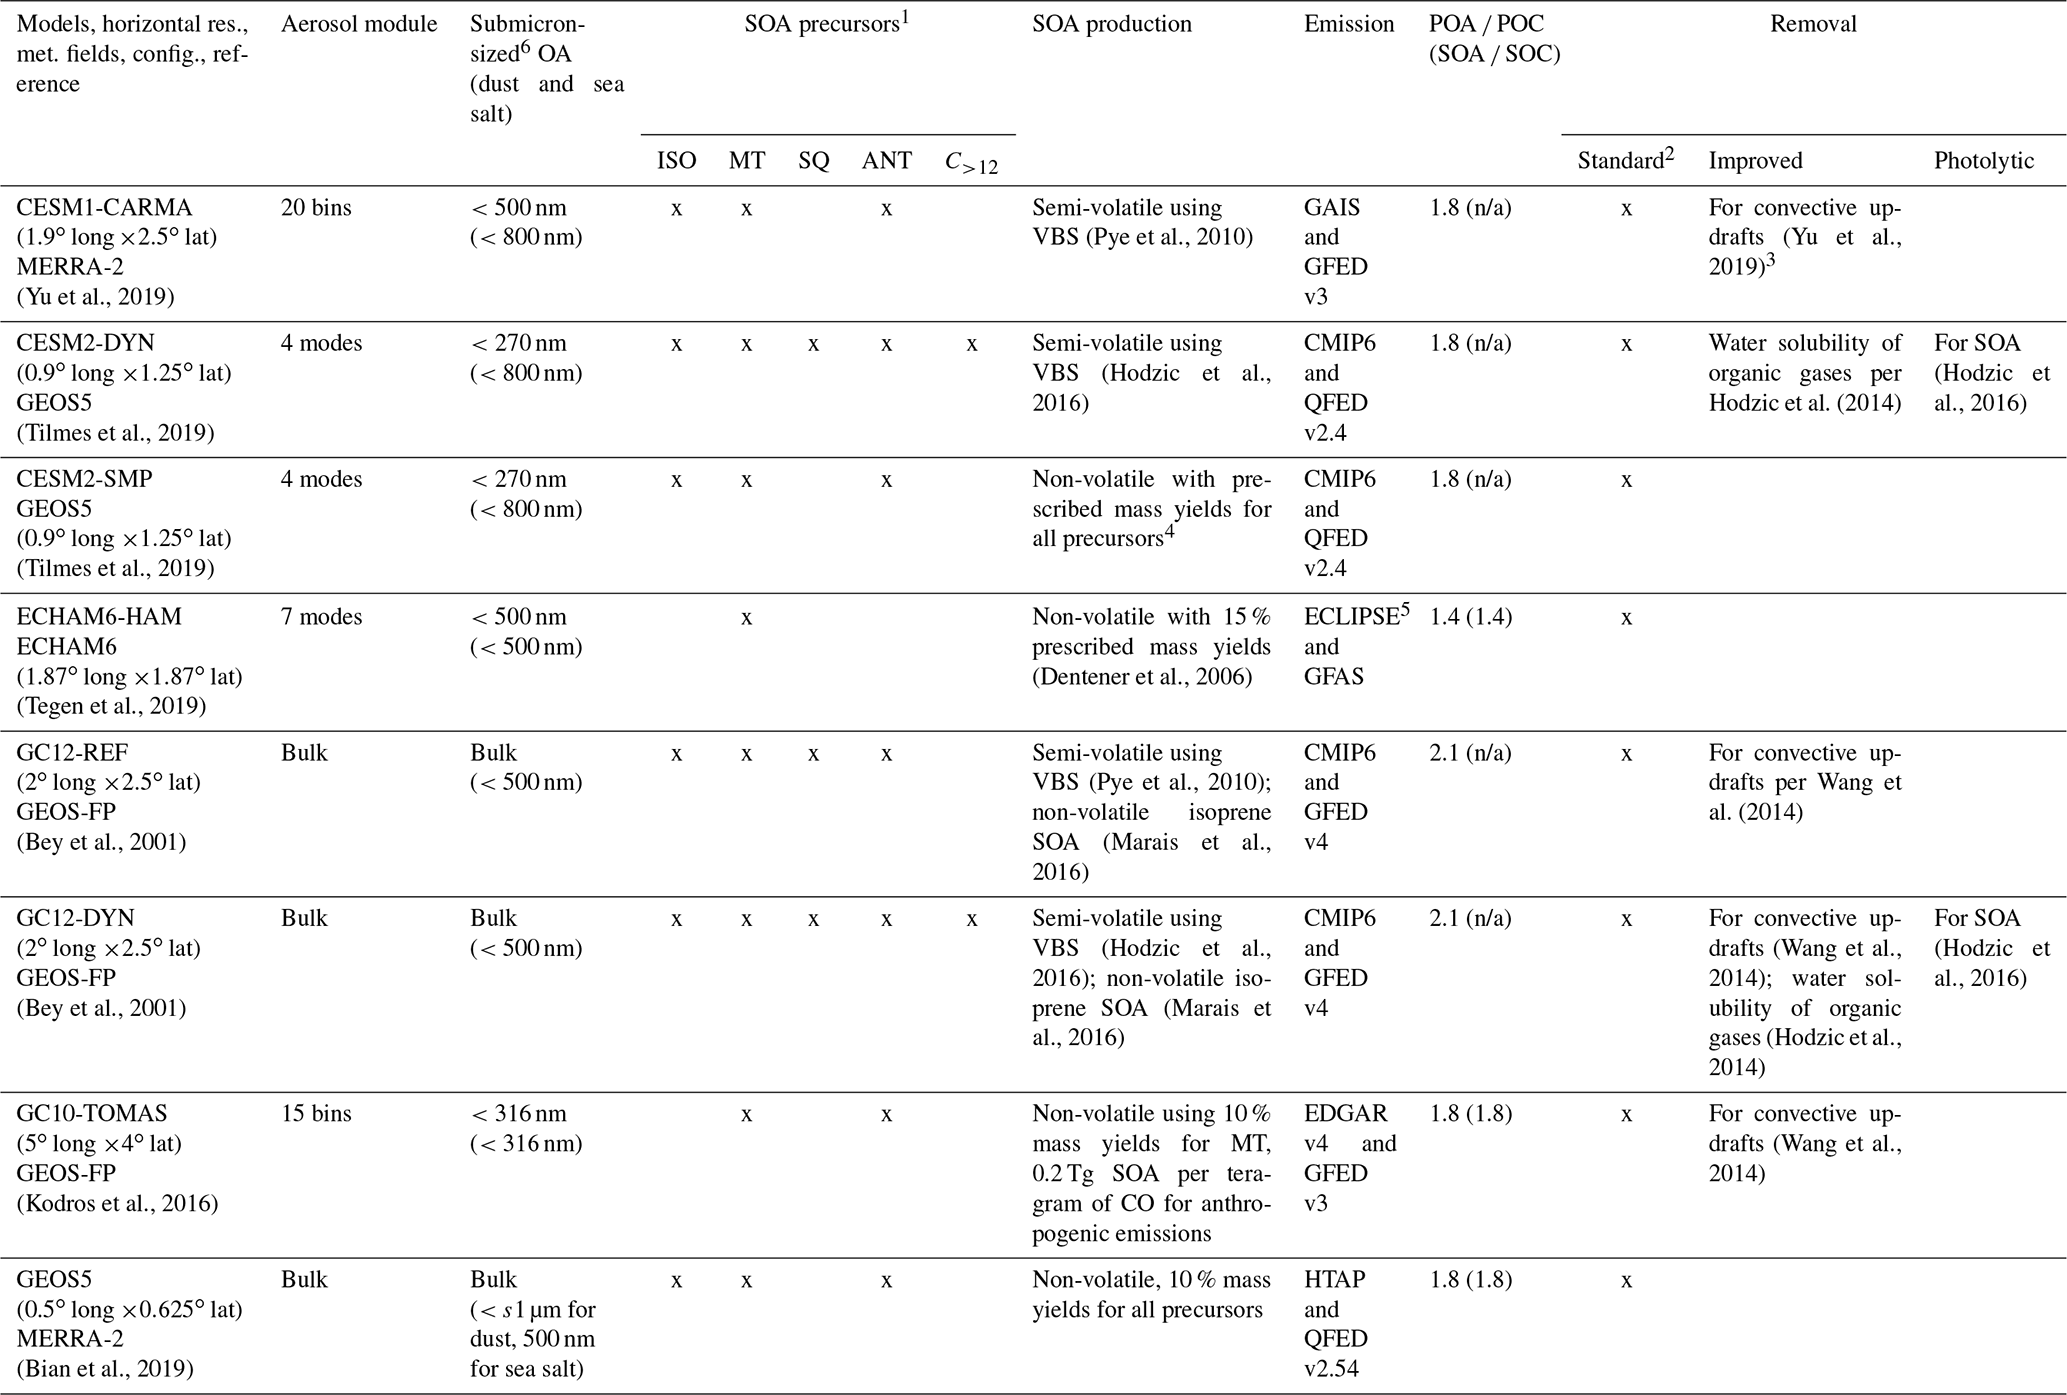
1 SOA precursors include isoprene (ISO), monoterpenes (MT), sesquiterpenes (SQ), and anthropogenics (ANT) including aromatics such as benzene, toluene, and xylene, as well as lumped shorter-chain alkanes and alkenes and higher-molecular-weight n-alkanes and n-alkenes (C>12). 2 Standard removal includes dry deposition and sedimentation, as well as convective and large-scale scavenging of soluble organic gases and aerosols, and below-cloud scavenging of aerosols. 3 A sensitivity simulation is performed with CESM1-CARMA without the improved scavenging in convective updrafts. 4 5 % for lumped C<12 alkanes, 5 % for lumped C<12 alkenes, 15 % for aromatics, 4 % for isoprene, 25 % for monoterpenes. 5 Anthropogenic BC emissions are replaced in Russia with the dataset of Huang et al. (2015). 6 Submicron size range (diameter) used in various models for comparison with the AMS data. n/a – not applicable
GEOS5 was run in a configuration similar to Bian et al. (2019) using the anthropogenic emissions from HTAP v2 (Janssens-Maenhout et al., 2015) and biomass burning emissions from the Quick Fire Emission Dataset (QFED v2.54). Aerosols are simulated within the GOCART bulk aerosol module and include externally mixed particles of black carbon (BC), organic carbon (OC), sulfate, ammonium, nitrate, dust, and sea salt (Colarco et al., 2010; Bian et al., 2017). The formation of SOA is based on a prescribed 10 % formation yield from the monoterpene emissions. The primary emitted OC and SOA are separated into hydrophobic (50 %) and hydrophilic (50 %) species, with a 2.5 d e-folding time conversion from hydrophobic to hydrophilic organic particles. All SOAs from biogenic, anthropogenic, and biomass burning sources are treated as hydrophilic particles. Both types of organic particles are dry-deposited. The hydrophilic OA is removed by large-scale and convective warm clouds, while hydrophobic OA is removed by ice clouds. The hydrophilic particles undergo hygroscopic growth according to the equilibrium parameterization of Gerber (1985).
The ECHAM6.3-HAM2.3 standard version (Tegen et al., 2019) was run using updated anthropogenic emissions (Schacht et al., 2019) combining the ECLIPSE (Klimont et al., 2017) emissions with Russian anthropogenic BC emissions from Huang et al. (2015). For biomass burning the Global Fire Assimilation System (GFAS; Kaiser et al., 2012) emissions are used but without the scaling factor of 3.4 suggested by Kaiser et al. (2012). Aerosol composition and processes are simulated using the Hamburg Aerosol Model (HAM2; Zhang et al., 2012) that considers an aerosol internal mixture of sulfate, BC, OC, sea salt, and mineral dust. The aerosol population and microphysical interactions are simulated using seven lognormal modes, including nucleation, soluble and insoluble Aitken, accumulation, and coarse modes. In the model configuration used in this publication the formation of SOA is based on a prescribed 15 % mass yield from monoterpene emissions only (Dentener et al., 2006). Aerosol particles are removed by dry and wet deposition. The wet deposition includes below-cloud scavenging by rain and in-cloud cloud scavenging for large-scale and convective systems (Croft et al., 2010).
The two simulations with the GEOS-Chem 12.0.1 global chemistry model (Bey et al., 2001) use emissions based on the CMIP6 global inventory (CEDS historical emissions up to 2014 and future emissions based on climate scenarios; Hoesly et al., 2018; Feng et al., 2020) with regional improvements for anthropogenic sources and on GFED v.4 for biomass burning emissions (Giglio et al., 2013). Both simulations use the bulk aerosol representation and differ only in the treatment of SOA formation and removal. The first configuration (called hereafter GC12-REF) includes the default (http://wiki.seas.harvard.edu/geos-chem/index.php/GEOS-Chem_12#12.0.1, last access: January 2020) representation of SOA formation based on Marais et al. (2016) for isoprene-derived SOA and on the volatility basis set (VBS) of Pye et al. (2010) for all other precursors. Note that this GEOS-Chem REF simulation is similar to the version 12 default “complex option”, which includes non-volatile POA and semi-volatile SOA (semi-volatile POA is an optional switch within this version used in Pai et al., 2020). The second configuration (referred to as GC12-DYN) includes a more dynamic representation of the SOA life cycle based on Hodzic et al. (2016), with the exception of the treatment of isoprene SOA that is formed in aqueous aerosols as in Marais et al. (2016). As in Hodzic et al. (2016) the GC12-DYN model version includes an updated VBS SOA parameterization, updated dry and wet removal of organic vapors, and photolytic removal of SOA (except for isoprene SOA that is formed in aqueous aerosols, for which we follow Marais et al., 2016). SOA formation is based on wall-corrected chamber yields (Zhang et al., 2014) for the traditional precursors (isoprene, monoterpenes, sesquiterpenes, benzene, toluene, xylene) and on yields derived from an explicit chemical mechanism for higher-molecular-weight n-alkanes and n-alkene species (Hodzic et al., 2016). The removal of gas-phase oxidized volatile organics uses updated Henry's law solubility coefficients from Hodzic et al. (2014) and photolytic removal of SOA (Hodzic et al., 2015). In addition to OA, the model includes BC and dust, and it simulates the chemistry and gas–particle partitioning of inorganic compounds such as sulfate, ammonium, nitrate, and sea salt using the ISORROPIA II thermodynamic model (Fountoukis and Nenes, 2007). In both GEOS-Chem configurations, BC and primary OC are simulated with a hydrophobic and hydrophilic fraction for each. At the time of emission, 80 % of BC and 50 % of primary OC are considered to be hydrophobic. Hydrophobic aerosols are converted to hydrophilic aerosols with an e-folding lifetime of 1.15 d. An OA ∕ OC ratio of 2.1 is assumed to convert POC to POA, and SOA is simulated as OA mass (i.e., no OA ∕ OC ratio assumption is needed for SOA, except for comparison with OC measurements). Soluble gases and aerosols are removed by both dry and wet deposition. Wet deposition includes scavenging in convective updrafts, as well as in-cloud and below-cloud scavenging from large-scale precipitation (Liu et al., 2001). Hydrophobic aerosols (BC and POA) are scavenged in convective updrafts following Wang et al. (2014).
GC10-TOMAS is based on the GEOS-Chem version 10.01 coupled with the TwO Moment Aerosol Sectional microphysics scheme (TOMAS) and run in a similar configuration to that described in Kodros et al. (2016). The model computes the evolution of sulfate, sea salt, primary and secondary OA, BC, and dust aerosols described by 15 internally mixed size bins (six of which were analyzed for these comparisons; see Table 1). Anthropogenic emissions are based on the EDGAR v4 global inventory with regional improvements, while the biomass burning emissions are from GFED v3. SOA is irreversibly made from the emitted parent precursor, considering a 10 % mass yield from monoterpene emissions and an emission flux of 0.2 Tg of SOA per teragram of CO for the anthropogenic CO emissions. The removal of gases and aerosols is treated similar to the GEOS-Chem 12.0.1 model (GC12-REF; see above).
Simulations based on the CESM2.0 Earth system model use the standard version of the Whole Atmosphere Community Climate Model (WACCM6; Gettelman et al., 2019; Emmons et al., 2020). Details on the specifics of the model configurations are described in detail in Tilmes et al. (2019); i.e., CESM2-SMP and CESM2-DYN correspond to the specified dynamics of the WACCM6-SOAG and WACCM6-VBSext simulations described in that work, respectively. Emissions are based on the CMIP6 global inventory for the year 2014 for anthropogenic sources and on the QFED version 2.4 for the wildfires inventory. Aerosols are represented with the modal aerosol scheme (MAM4, Liu et al., 2012) that includes BC, primary and secondary OA, sulfate, dust, and sea salt. Four modes are considered, including Aitken, accumulation, and coarse modes, and an additional primary carbon mode. Only the accumulation mode was used in this work. The CESM2-SMP and CESM2-DYN simulations differ in their treatment of OA. CESM2-SMP forms OA directly using fixed mass yields from primary emitted precursors (isoprene, monoterpenes, aromatics) without explicitly simulating their oxidation and partitioning. These mass yields are increased by a factor of 1.5 to match the anthropogenic aerosol indirect forcing (Liu et al., 2012). The second configuration (referred to as CESM2-DYN) includes the formation and removal parameterizations of organics of Hodzic et al. (2016), as implemented into CESM2 by Tilmes et al. (2019) for all species based on low-NOx VBS yields only. This is a similar SOA scheme as used in GC12-DYN (with differences in the treatment of isoprene SOA based on Marais et al., 2016, in GC12-DYN and the use of both low- and high-NOx VBS yields in GC12-DYN). Organic gases and aerosols undergo dry and wet deposition as described in Liu et al. (2012). It should be noted that CESM2-SMP does not include the deposition of intermediate organic vapors. Aerosol wet scavenging considers in-cloud scavenging (the removal of cloud-borne particles that were activated at the cloud base) and below-cloud scavenging for both convective and grid-scale clouds.
CESM1-CARMA simulations use the configuration described in Yu et al. (2019), which is based on CESM1 and the sectional Community Aerosol and Radiation Model for Atmospheres (CARMA v3.0). Anthropogenic emissions are those from the Greenhouse gas–Air pollution Interactions and Synergies (GAINS) model, and biomass burning emissions are from the Global Fire Emission Database (GFED v3; van der Werf et al., 2010). In CARMA, 20 size bins are used for both pure sulfate particles (bins from 0.2 nm to 1.3 µm in radius, only used up to 500 nm) and mixed aerosols composed of BC, primary and secondary OC, dust, sea salt, and sea-spray sulfate (bins 0.05–8.7 µm in radius, again only analyzed up to 500 nm). SOA formation is based on the VBS approach from Pye et al. (2010). The removal of OA occurs only by dry and wet deposition. Compared to the CESM2-SMP and CESM2-DYN simulations, the convective removal of aerosols uses the modified scheme described in Yu et al. (2019), which accounts for aerosol secondary activation from the entrained air above the cloud base and the scavenging of activated aerosols in convective updrafts. The default CESM can transport aerosols from the cloud base to the top of the cloud in strong convective updrafts in one time step without scavenging them, while the new scheme allows for a more efficient removal off all aerosols inside convective clouds. A sensitivity simulation is performed for ATom-1 to quantify the effect of this improved removal on OA concentrations (Sect. 4.5).
2.2 AeroCom-II model climatology
The ATom measurements are also compared to the global model OA predictions generated within the Phase II Aerosol Comparisons between Observations and Models (AeroCom-II) project (Schulz et al., 2009). We consider the monthly average results of 28 global models, which is a subset of those presented in Tsigaridis et al. (2014), based on the availability of model results. It should be noted that the meteorological forcing used in these models is mostly based on the year 2006, while the anthropogenic and biomass burning emissions are mostly representative of the year 2000. For comparison purposes, the monthly mean model outputs for the months of August (ATom-1) and February (ATom-2) are interpolated along the flight path (latitude, longitude, and altitude) and averaged the same way as the measurements (see Sect. 3.2).
3.1 Submicron aerosol data
The measurements of non-refractory submicron aerosols were performed onboard the NASA DC-8 aircraft as part of the ATom field study (Wofsy et al., 2018) using the University of Colorado Aerodyne high-resolution time-of-flight aerosol mass spectrometer (AMS in the following; Canagaratna et al., 2007; DeCarlo et al., 2006).
We use measurements from both the NH summer (August 2016, ATom-1) and winter (February 2017, ATom-2) deployments. Figure 2a shows the flight path and the vertical extent of the ATom-1 dataset colored by OA mass concentrations (see Fig. S1 in the Supplement for ATom-2). The aircraft performed systematic vertical sampling with ∼140 vertical profiles per campaign throughout the troposphere from the near surface at ∼0.2 km to the upper troposphere–lower stratosphere region at ∼13 km of altitude. Details on the operation of the CU AMS onboard the DC-8 are reported in Schroder et al. (2018), Nault et al. (2018), and Jimenez et al. (2019b). AMS data were acquired at 1 Hz time resolution and independently processed and reported at both 1 and 60 s time resolutions (Jimenez et al., 2019a). The latter product, with more robust peak fitting at low concentrations, was exclusively used as the primary dataset in this work. Detection limits at different time resolutions and in different geographical bins relevant to this study are discussed in Sect. 3.3. The overall 2σ accuracies of the AMS measurement (38 % for OA, 34 % for sulfate and other inorganics) are discussed in Bahreini et al. (2009) and Jimenez et al. (2019b).
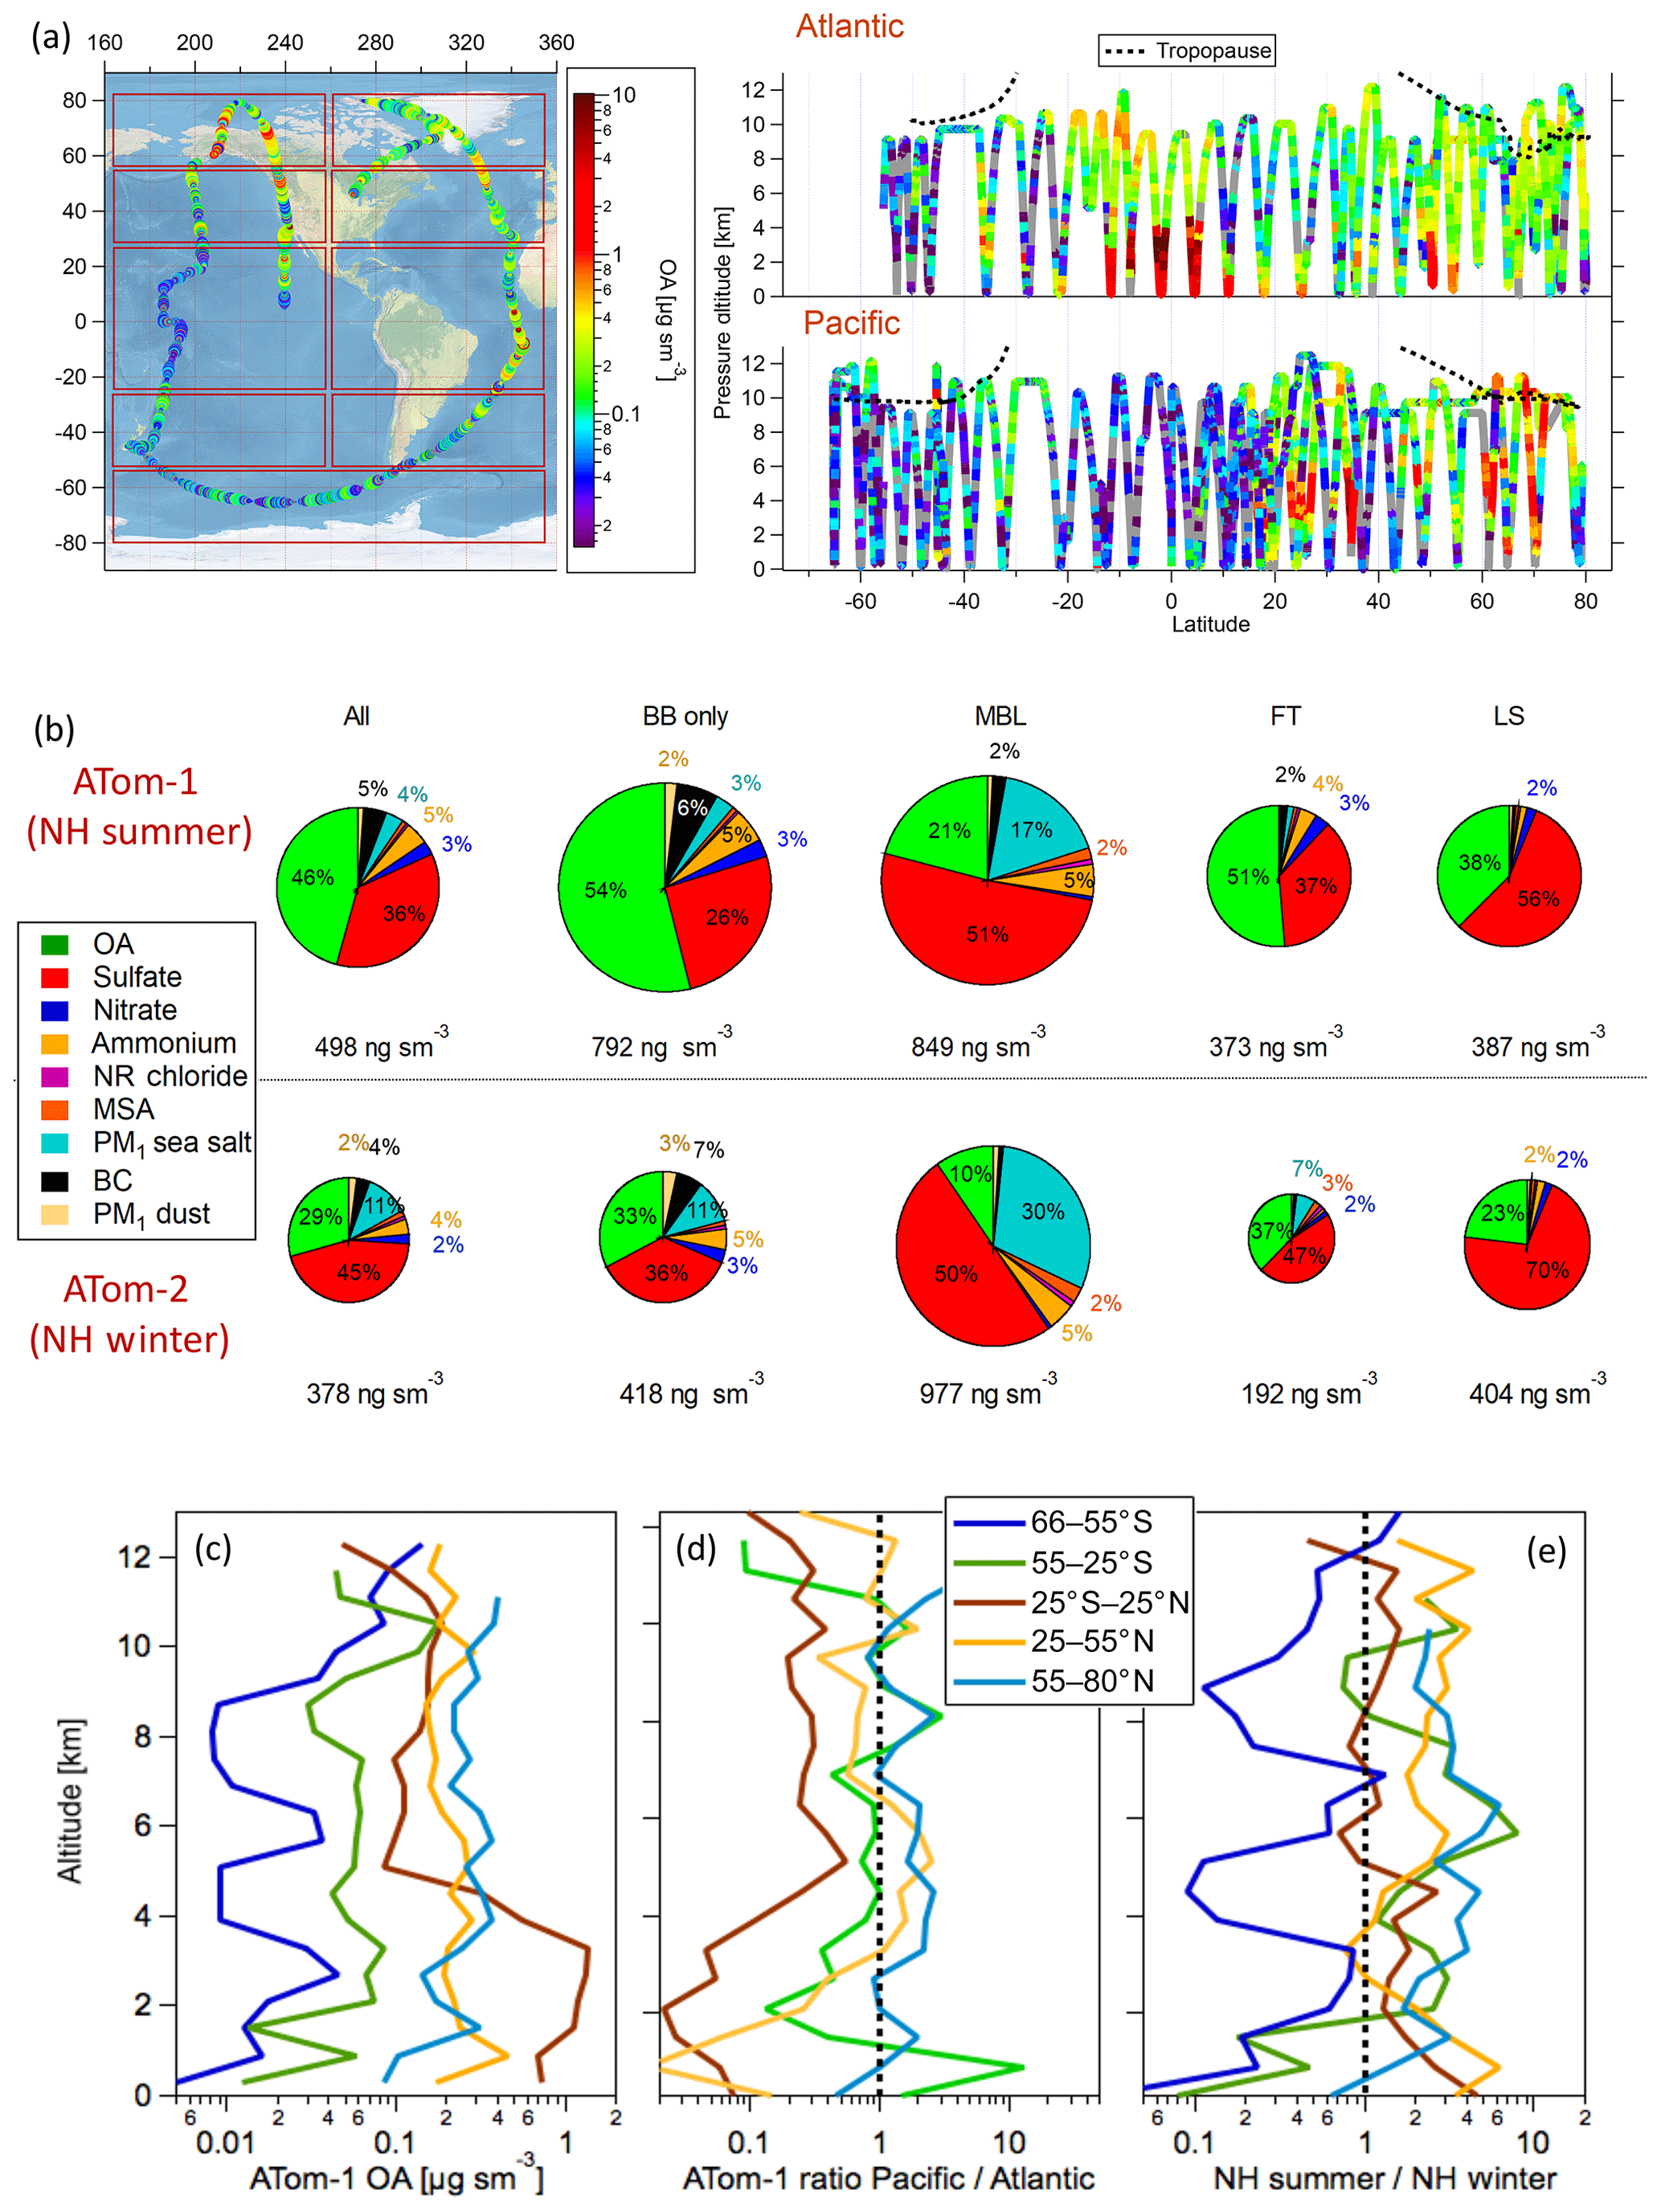
Figure 2(a) ATom-1 DC-8 flights during the August 2016 deployment. Red boxes indicate regions used for the latitude averaging of the model results. (a) Vertical distribution of OA concentrations (µg sm−3) along ATom-1 flight tracks. (b) Average submicron aerosol composition as measured in the biomass-burning-influenced regions (BB only) and the non-BB-influenced regions including the marine boundary layer (MBL), free troposphere (FT), and lower stratosphere (LS) for ATom-1 and ATom-2. The BB-influenced air masses were filtered using the PALMS data (see Sect. 3.1). Contributions below 2 % are shown but not labeled on the pie chart. In ATom-1, “BB only” represents 24 % of the data, clean MBL 8 %, clean FT 57 %, and clean UT 12 %, whereas in ATom-2 “BB only” represents 3 %, clean MBL 8 %, clean FT 74 %, and clean UT 16 %. (c) The average OA vertical profiles are shown for each latitude region as are (d) the ratios between the Pacific and Atlantic Ocean in each region. (e) The seasonal contrast in OA concentrations is calculated as the ratio of OA concentrations between the NH summer (ATom-1) and NH winter (ATom-2) campaigns. The corresponding plots for ATom-2 can be found in Fig. S1.
For ATom, the AMS reported the standard non-refractory aerosol species OA, sulfate, nitrate, ammonium, and chloride, with the response for all the nominally inorganic species characterized by in-field calibrations. In addition, it also reported methanesulfonic acid (MSA; Hodshire et al., 2019a describes the AMS MSA methods and calibrations for ATom) and sea salt for Dgeo<450 nm (based on the method of Ovadnevaite et al., 2012). Both of these species were important to achieve closure with the volume calculated from the onboard sizing instruments in the marine boundary layer (Jimenez et al., 2019b). Another important refractory submicron species not captured by the AMS measurements is BC. This was measured on ATom with the NOAA SP2 instrument (Katich et al., 2018). It should be noted that aircraft measurements of aerosol mass concentrations are given under standard conditions of 1 atm and 273.15 K (µg sm−3).
For ATom the AMS measured particles with geometric diameters (based on the campaign-wide average density of 1640 kg m−3; Jimenez et al., 2019b) between Dgeo∼60 and 295 nm with ∼100 % efficiency (and between 35 and 460 nm with 50 % efficiency). Here we denote the AMS aerosol data as “submicron” mass (based on the more usual definition using the aerodynamic diameter, which is larger than the geometric diameter; DeCarlo et al., 2004), with the assumption that non-refractory aerosol is a small contributor to mass above the AMS size range. As shown in Brock et al. (2019), the accumulation mode for the ATom sampling environment only extended up to 500 nm, and hence, as expected for a background tropospheric environment, this approximation is appropriate. Very good agreement was observed with the integrated volume calculated from the number size distributions for ATom (Brock et al., 2019). A low bias compared to a typical submicron definition can occur in thick biomass burning plumes and in the lower stratosphere at times (Jimenez et al., 2019b). As detailed in Table 1, the accumulation mode for the bulk models discussed in this study overlaps the size range of the AMS, and for the sectional models (CESM1-CARMA, GEOS-Chem-TOMAS, ECHAM6-HAM) only the bins that match the AMS size range were used. As expected based on the previous discussion, however, a comparison of the total OA calculated by these sectional models with the modeled OA inside the AMS size range showed small differences (slopes for ATom-1 linear regressions: CESM1-CARMA: 0.91, GC10-TOMAS: 0.94, ECHAM6-HAM: 1.00), mostly influenced by the high-concentration points in the biomass plumes off Africa that have a large effect on the regression since they are about 10 times larger than the bulk of the dataset.
Refractory and non-refractory aerosol composition was also measured using the NOAA Particle Analysis by Laser Mass Spectrometry (PALMS) instrument. PALMS classifies individual aerosol particles into compositional classes including biomass burning (Hudson et al., 2004), sea salt (Murphy et al., 2019), mineral dust (Froyd et al., 2019), and others. Mass concentrations for these particles types are derived by combining PALMS composition data with aerosol size distribution measurements (Froyd et al., 2019). Good agreement overall was found for OA, sulfate, and sea salt between the two particle mass spectrometers during ATom once the AMS and PALMS instrument transmissions were accounted for (Jimenez et al., 2019b). For all PALMS data used in this work (biomass burning fraction and dust) the AMS transmission function was applied to ensure that both instruments were characterizing approximately the same particle range.
For a particular air mass, the mass fraction of biomass burning (BB) aerosol reported by the PALMS instrument, f(BB)PALMS (Froyd et al., 2019, and references within), was then used to evaluate the degree of BB influence. This parameter correlates quite well with other gas-phase BB tracers (Fig. S20) and is more useful as a particle tracer since its lifetime follows that of the particles. Importantly, it is not impacted by the long lifetimes of the gas-phase tracers (e.g., 9 months for CH3CN) and unrelated removal processes (e.g., ocean uptake for CH3CN and HCN) that result in highly variable backgrounds. Hence, f(BB)PALMS has a much higher contrast ratio and linearity for particle BB impacts compared to the available gas-phase tracers in the ATom dataset. An air mass was classified as non-BB-influenced when f(BB)PALMS was lower than 0.30 (Hudson et al., 2004) as shown in Fig. 2b. For both ATom-1 and 2, about 74 % of measurements were classified as not influenced by biomass burning. f(BB)PALMS was also used to assess the impact of POA on the total OA burden (next section); note that no thresholding was applied in that case.
3.2 Estimation of the POA fraction for the ATom dataset
For model evaluation purposes, it is important to know whether the source of OA is primary or secondary. For ground studies close to sources (e.g., Jimenez et al., 2009), positive matrix factorization of AMS mass spectra (PMF; Ulbrich et al., 2009) can be used to estimate the contribution of primary sources (mostly from transportation, heating, cooking, and biomass burning) to total OA. This approach is not suitable for ATom. To accurately resolve a minor factor such as POA in an AMS dataset, there needs to be a combination of (a) sufficient OA mass concentration so that the signal-to-noise ratio of the spectra is sufficient; (b) enough fractional mass for the factor to be resolved (>5 % in urban areas per Ulbrich et al., 2009; probably a larger fraction at low concentrations such as in ATom); (c) sufficient spatiotemporal variability (“contrast”) in the relative contributions of different factors, since that is part of what PMF uses to extract the factors; (d) sufficient difference in the spectra of the different factors (for the same reason as c); and (e) relatively invariant spectra for each factor across the dataset (as this is a key assumption of the PMF algorithm). As an example of a nearly ideal case, in Hodshire et al. (2019a) we extracted MSA by PMF from the ATom-1 data and were able to match that factor with our independently calibrated MSA species. A very distinct and nearly invariant mass spectrum was measured repeatedly near sources (MBL) (and was mostly absent elsewhere, thus providing strong spatiotemporal contrast) and accounted for about 6 % of the fractional mass and 15 % of the variance in time. Thus, all the conditions were met. For POA, on the other hand, the air sampled in ATom and coming from, e.g., Asia has POA and SOA very well mixed, with little change in their relative mass fractions vs. time (as the aircraft flies through that air mass). POA is very low, as documented later in this paper. Atmospheric aging makes the spectra from all OA sources more and more similar as measured by AMS spectra (Jimenez et al., 2009). Thus, most of the conditions above are not satisfied for extracting POA by PMF analysis of this dataset.
Instead, in this work we have estimated POA based on the fact that it is co-emitted with BC as part of the combustion processes releasing both species in source regions and that BC is not impacted by chemical aging processes over the lifetime of the air mass. Note that BC can physically age but it is not lost in any significant amount to the gas phase due to chemical processes in the atmosphere. We assume non-differential removal (and transport) of the BC fraction relative to the rest of the POA (the two are generally internally mixed; Lee et al., 2015). Table S1 in the Supplement summarizes recent POA ∕ BC and POC ∕ EC emission ratio determinations for urban background sites, which best represent real mixes of pollution sources, and for individual sources of POA (from mobile sources – commonly referred to as HOA – and cooking aerosol – COA). Based on Table S1 data, we assume POA to be co-emitted with BC for anthropogenic fossil fuel and urban region POA (herein called FFratio for simplicity, even though much of it is nonfossil; Zotter et al., 2014; Hayes et al., 2015) at a ratio of 1.5±0.82 (the average ±1σ of all urban ambient air studies that report POA and BC for the best intercomparability to the ATom dataset; including all urban studies results in a very similar number: 1.48±0.65, with a median of 1.41). Measurements where mobile sources are the main contributor in general exhibit lower ratios (POA ∕ OA ratio 0.5–1.5), while COA determination typically ranges from 2 to 3. Hence, the ratio used here is a good estimate for a diverse mix of urban sources as appropriate for ATom. The studies referenced to derive the emission ratio used ambient data in urban air, where all sources mix together and impact the POA ∕ BC ratio, and thus the ratios include the impact of POA sources that may not emit BC. It should be noted that urban model ratios do not include emissions associated with fugitive dust from road, tires, and construction, as those are typically found in particles larger than those studied here (Zhao et al., 2017). For biomass burning sources, we use a value of POA ∕ BC =11.8 (BBratio) based on the average of the recent review by Andreae (2019), which included over 200 previous determinations for a variety of fuels and burning conditions (since Andreae, 2019, used an OA ∕ OC ratio of 1.6 in his work, we have used that value to calculate POA ∕ BC; we note that this is different from the 1.8 OA ∕ OC ratio used for other studies listed in Table S1). We note the measured total OA ∕ BC of ∼3.5 (conservatively assuming that all OA is POA) observed on both ATom missions for the large African-sourced BB plumes over the equatorial Atlantic. We note that using the larger BBratio from Andreae (2019) leads to a POA fraction of ≫100 % in the ATom African plumes. We also perform sensitivity studies with values of both FFratio and BBratio within the literature range.
The PALMS-determined mass fraction of biomass-impacted aerosol (f(BB)PALMS) can then be used to determine a total POA contribution from both types of sources:
Further detail is provided in Table S2, which summarizes the POA ∕ BC ratios used in the emission inventories implemented in current models. Overall, there is reasonable agreement with the measurements in Table S1, with FFratio ranging from ∼0.5 for diesel fuels to >2 for energy production and ∼5 for residential emissions (which include some BB). On the other hand, for biomass burning, the emission inventory ratios range from ∼5 for crop to ∼15 for forest and up to ∼50 for peatland. While generally consistent with the values discussed by Andreae (2019), they are on the lower end of the ranges discussed in that work. The averages and ranges of the measurement and model ratios are similar, and thus no significant model bias on the ratios is apparent.
PALMS detection efficiency increases with size across the accumulation mode, and therefore the f(BB) number fraction is weighted to the larger size end of the accumulation mode. In very clean regions of the upper troposphere (typically <0.15 µg sm−3 submicron mass) particles below the PALMS size range can contribute significantly to aerosol mass (Williamson et al., 2019; Jimenez et al., 2019b). If BB particles are not evenly distributed across the entire accumulation mode (due to preferential removal in convective updrafts of primary aerosol and the preferential condensation of SOA on smaller particles; see Yu et al., 2019, and Sect. 4.5), then the f(BB) reported by PALMS will be an overestimation. For the final analysis these periods were left in the dataset, and therefore for the LS the reported POA is likely overestimated for these regions, although the impact on the mass-weighted campaign average is negligible.
The contribution of POA from sea spray is difficult to constrain. As an order-of-magnitude estimate, marine POA is roughly calculated based on preliminary calibrations of OA on mineral dust particles from the PALMS instrument (Karl Froyd, personal communication, 2019). Using this calibration, the average OA by mass on sea salt was <10 % for the large majority of MBL sampling (>85 %). Since sea salt contributed 4 % (11 %) of mass in the AMS size range for ATom-1 (ATom-2) (Fig. 2), we estimate that marine POA is on the order of ∼1 % of aerosol mass in the AMS size range, possibly much lower. Thus, we think that it is reasonable to neglect the contribution of marine POA to this dataset. Future studies will refine this estimate.
3.3 Data processing for comparisons
For comparisons between the measurements and the various global models, data were averaged both vertically and zonally to minimize the impact of smaller plumes or vertical gradients in aerosol concentrations that might not be captured by coarse-resolution models. For the same reason, all data near airports were removed from the datasets prior to analysis (up to about 3 km on the climb in and out). In order to restrict this analysis to the remote troposphere, the last leg of the ATom-1 mission (over the continental US) was taken out of the dataset as well. Data were binned into five large latitude regions as shown in Fig. 2a, including southern polar (55–80∘ S, “S.Polar”), southern midlatitudes (25–55∘ S, “S.Mid”), equatorial (25∘ S–25∘ N, “Equatorial”), northern midlatitudes (25–55∘ N, “N.Mid”), and northern polar (55–80∘ N, “N.Polar”), and analyzed separately for the Pacific and Atlantic basins. For data in each of these latitude regions, altitude profiles were calculated with a constant 600 m altitude resolution. According to both variability in the cleanest air and statistical analysis of the organic background subtraction (Drewnick et al., 2009), the 1σ precision at low concentrations for 1 min data ranged between 20 and 50 ng sm−3, or a 3σ detection limit between 60 and 150 ng sm−3 for the 1 min data (confirmed by frequent filter blanks). Per standard statistics, the precision of a measurement decreases (i.e., gets better) with the square root of the number of points (or time interval) sampled. In other words, the precision of an average can be approximated by the standard error of the mean (σ∕sqrt(n), where n is the number of measurements averaged), and it is better than the precision of the individual data points (σ). This also applies to the detection limit, since it is just 3 times the precision. Note that a detection limit is not meaningful unless the averaging time is specified. For example, let us assume that the detection limit is 20 ng m−3 (1 s), and the data points over 60 s are all 10 ng m−3. All 1 s measurements are below the 1 s DL. However, the average (10 ng m−3) is now above the DL for 1 min averages, which is 20∕sqrt(60) =2.6 ng m−3. On average, each individual point in the profiles represents the average of about 25 min of ATom flight data. At that time resolution, the OA 1σ precision was about 10 ng sm−3. Hence, with very few exceptions (10 points for both missions combined), the OA concentrations in the averaged profiles reported are well above the instrumental detection limit in those regions. For model–measurement comparisons along flight tracks, model outputs and measurements were considered at 1 min time resolution, which corresponds to ∼0–700 m vertical resolution and ∼0.05–0.15∘ horizontal resolution. Note that a large fraction of the 1 min OA values in the remote free troposphere were below the local 3σ detection limit. The data of periods of zero concentration (sampling ambient air through a particle filter) average to zero. Some negative measurements are present, and this is normal for measurements of very low concentrations in the presence of instrumental noise. Averaging longer periods, as done for the figures in this paper, reduces the detection limit. We therefore caution future data users that the reported data should be averaged as needed, as replacing below-detection-limit (or negative) values by other values introduces biases on averages. For fractional ratio analysis, measurements were averaged to 5 min time resolution to reduce the noise in the ratios due to noise in the denominator. The results are not very sensitive to the 5 min averaging (compared to 1 min) as shown in Fig. S12 for OA to sulfate ratios. The same figure also illustrates that excluding ratios affected by negative concentrations (the non-bracketed case; overall, these are about 15 % of the dataset) does not really affect the fractional distribution, with the variance between the two cases diminishing as the averaging interval increases. To further confirm that there is no inherent bias in the fractional products regardless of the treatment of low concentration values, an additional sensitivity analysis was performed whereby data were filtered by an independent measurement proxy for aerosol mass, the aerosol volume measured in ATom (Brock et al., 2019). Using a range of values that encompasses the regime in which the AMS-calculated volume to aerosol-measured volume exhibited increased noise (Jimenez et al., 2019b), no systematic bias was found (Fig. S13), with variations of about 10 % in fractional volume for different filtering conditions.
Some of the performed analysis required separating the dataset into vertical subsets. In this paper, we define the marine boundary layer (MBL) as the region below 1.5 times the calculated boundary layer height in the NCEP global model reanalysis. The free troposphere (FT) includes all data points between the top of the MBL and the NCEP tropopause height, and the LS region includes all points above the NCEP tropopause height. The tropopause height varied during ATom between 8 and 16.5 km; given the DC-8 ceiling (12.8 km) the stratosphere was only sampled at latitudes higher than 30∘ in both hemispheres. The MBL height varied between up to 1.5 km in the midlatitudes, ∼1 km in the tropics, and sometimes <150 m (lowest DC-8 altitude) for some of the sampling in the polar troposphere.
3.4 Submicron aerosol composition
Figure 2b shows that during both NH summer and winter ATom deployments, OA is one of the three dominant components of the measured submicron aerosol in the remote troposphere, together with sulfate and sea salt. During ATom-1, average submicron aerosol concentrations were close to 0.8 µg sm−3 in the marine boundary layer and biomass burning outflow regions, and they were ∼2 times lower in the free troposphere and lower stratosphere regions. ATom-2 had overall lower average concentrations below 0.4 µg sm−3 (vs. 0.5 µg sm−3 for ATom-1). As expected, sulfate (sulfuric acid in the lower stratosphere) is the dominant constituent in the MBL (∼50 %) and LS (50 %–70 %), while the OA contribution is generally below 10 % and 40 %, respectively, in those regions. A large fraction of sea salt aerosol is found in the MBL, especially during the NH winter deployment (∼30 %, see Murphy et al., 2019).
OA is found to be a major constituent (∼50 %) of submicron aerosol in the clean (non-BB-influenced) free troposphere. The contribution of OA is 1.4 times larger than that of sulfate during the NH summer and 1.2 times lower than that of sulfate during the NH winter, which is likely due to a large contribution of NH sources to SOA production in the NH summer. Biomass burning events increase the OA contribution relative to that of sulfate and lead to a higher contribution of OA to the total during the ATom-1 mission (stronger BB influence).
3.5 Spatial and vertical distribution of OA
Figure 2a (and Fig. S1) shows the spatial and vertical distribution of OA mass concentrations measured during the ATom-1 (and ATom-2) campaigns. Most data were taken over remote oceanic regions (and a few remote continental regions, primarily over the Arctic). The measured OA varies between extremely clean conditions (<0.1 µg sm−3), which are encountered mostly in the Pacific and Southern Ocean regions, and moderately polluted conditions (>2 µg sm−3) in the biomass burning outflow regions. During ATom-1 (August 2016), a strong BB influence is observed in the lower troposphere (below 6 km) over the Atlantic Basin off the African coast and over California with OA concentrations exceeding 10 µg sm−3. OA associated with biomass burning is also present in the upper troposphere over equatorial regions and over Alaska, associated with the deep convective transport of biomass burning aerosols. The biomass burning contribution to carbonaceous aerosols in those regions during ATom-1 was also apparent in the black carbon measurements (Katich et al., 2019). ATom-2 was generally less polluted than ATom-1, likely due to a more limited global influence of biomass burning emissions during that period and also to a less active photochemistry during winter months in the NH.
The measured OA is characterized by a strong latitudinal gradient. Figure 2c shows the average vertical profiles of measured OA over the selected latitudinal bands during August 2016. The cleanest air masses are observed over the remote oceanic regions of the Southern Hemisphere (SH, 25–80∘ S) with OA mass concentrations below 0.06 µg sm−3. These extremely low OA concentrations can be explained by the very low influence from continental emission sources and presumably low marine POA and SOA precursor emissions. This is consistent with low concentrations of gas-phase pollutants (e.g., CO, ethane, propane). An enhancement can be noticed above 10 km in the lower stratosphere. In some cases, this could be related to the long-range transport of biomass burning aerosols from the tropics. By comparison, the Arctic region is more polluted, with OA levels that are an order of magnitude higher compared to its analog in the SH (i.e., OA loadings ranging from 0.1 to 0.5 µg sm−3). These concentrations are comparable to FT levels measured in the extratropical regions (25–55∘ N) of the NH. The equatorial marine regions (25∘ S–25∘ N) display the highest OA concentrations, with a strong gradient between the lower and upper troposphere. In the lower troposphere, OA concentrations are close to 1 µg sm−3 and decrease down to 0.1 µg sm−3 at altitudes above 4 km. The highest OA levels are associated with the African outflow over the southeastern Atlantic Ocean, which results from the transport of the biomass burning smoke from the sub-Saharan regions and increasing urban and industrial air pollution in southern West Africa (Flamant et al., 2018).
Figure 2d shows that the Atlantic Basin is often more polluted than the Pacific Basin, not only because of the African biomass burning influence but also due to the contribution of anthropogenic pollution in the lower troposphere of the NH. It should be noted that Asian pollution was likely an important contributor to the North Pacific basin, especially between 2 and 6 km, in both ATom deployments (see Figs. 2a and S1). Several-fold higher OA concentrations are found near the surface (below 1 km) over the southern Pacific compared to that same location in the southern Atlantic, which could be indicative of the stronger emission of marine OA in the Pacific Basin.
In addition to spatial gradients, a strong summer-to-winter contrast is observed in OA concentrations. Figure 2e shows the ratio between OA vertical profiles measured in the NH summer ATom-1 vs. in the NH winter ATom-2. The NH is more polluted during the NH summer due to the photochemical production of SOA and biomass burning emissions, leading to the tripling of OA concentrations in the extratropical regions (25–80∘ N) on average regardless of altitude. The doubling of OA loading in the lower troposphere at the Equator (25∘ S–25∘ N) in the NH summer (August, ATom-1) is strongly influenced by biomass burning activity in the sub-Saharan African region as already mentioned above. Likewise, OA concentrations are found to be generally higher in the SH during the SH summer. These zonal trends are broadly similar to the ones described in Katich et al. (2018) for BC.
4.1 Evaluation of predicted OA concentrations
Prior to evaluating model performance in simulating OA, we assessed the ATom models' ability to simulate sulfate aerosols. According to the model evaluation shown in Table S3, the predicted sulfate concentrations are generally within 40 % of the measured values, which is comparable to the AMS measurement uncertainties. The only exception is found for the ECHAM6-HAM model, which overestimates sulfate aerosols by a factor of 2. These results imply that most ATom models capture the overall sulfate burden relatively well. However, the large root mean square error (RMSE >0.4 µg sm−3 for ATom-1 and >0.2 µg sm−3 for ATom-2) is indicative of their limited skill in reproducing the observed variability in sulfate concentrations.
For OA, model evaluation metrics for the entire ATom-1 and ATom-2 campaigns are given in Table 2 for the eight ATom models and their ensemble, as well as the AeroCom-II ensemble. The results show that the normalized mean bias is substantially lower for the ATom model ensemble compared to AeroCom-II, decreasing from 74 % to 4 % for ATom-1 and from 137 % to 23 % to ATom-2, which is within the measurement uncertainty range. The mean temporal correlations are substantially improved from 0.31 (0.38) for AeroCom-II to 0.66 (0.48) for the ATom model ensemble during ATom-1 (ATom-2). However, results vary strongly among ATom models. Models using prescribed emissions of non-volatile SOA have the tendency to overestimate the OA concentrations during both NH summer and winter deployments (with ∼35 %–60 % overestimation for CESM2-SMP, ∼70 %–100 % for ECHAM6-HAM, and up to 150 % for GC10-TOMAS during ATom-2), with the exception of the GEOS5 model that in contrast underestimates OA concentrations by 5 %–25 %. During the NH summer (ATom-1), models using the VBS parameterization from Pye et al. (2010) tend to underpredict the OA concentrations by 43 % for GC12-REF and 33 % for CESM1-CARMA during ATom-1, most likely due to the excessive evaporation of the formed SOA in remote regions and low yields for anthropogenic SOA (Schroder et al., 2018; Shah et al., 2019). Models using the VBS parameterization from Hodzic et al. (2016) (CESM2-DYN and GC12-DYN), whereby OA is less volatile and also OA yields are corrected for wall losses, show improved agreement with observations, especially for CESM2-DYN (with NMB of ∼5 %), and to a lesser extent for GC12-DYN (NMB of ∼33 %). During the NH winter (ATom-2) characterized by a lower production of SOA, both VBS approaches lead to an overestimation of the predicted OA. This is likely caused by excessively high levels of primary emitted OA as discussed in Sect. 4.4.
Table 2Comparison of observed and simulated OA concentrations along ATom-1 and ATom-2 flights for eight global model simulations and their ensemble. The results of the model ensemble are also indicated. The statistical indicators are calculated as the normalized mean bias (NMB; %) , normalized mean error (NME; %) , root mean square error (RMSE; µg m−3) , and correlation coefficient (R2) between modeled (Mi) and observed (Oi) data points. The mean of ATom-1 observations is ∼0.23 µg m−3, and for ATom-2 it is 0.11 µg m−3. Figure S4 shows the normalized mean bias for all individual ATom model simulations for various latitudinal regions and for both the Atlantic and Pacific basins.
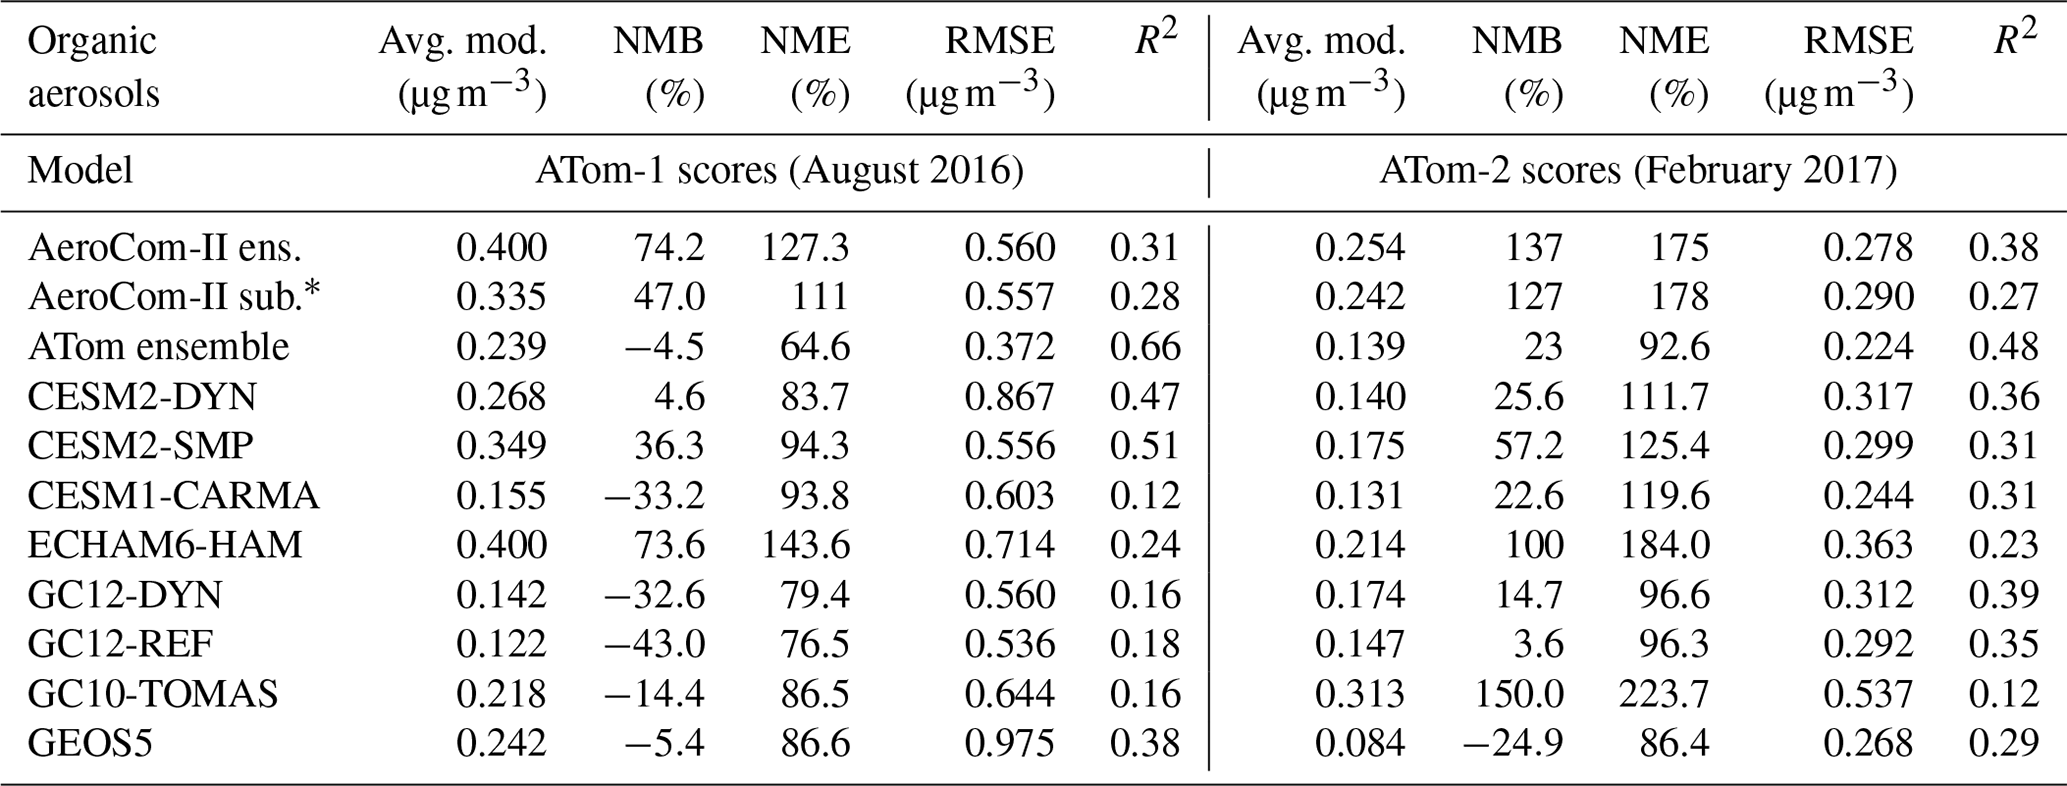
* This is the subset of the AeroCom-II model ensemble that includes only seven models similar to those that are included in the ATom ensemble (either the same model, an older model version, or the same aerosol module). The AeroCom-II subset incudes CAM5-MAM3, CCSM4-Chem, ECHAM5-HAM2, GEOS-Chem-APM 8.2, GEOS-Chem 9, GISS-TOMAS, and GMI (see Tsigaridis et al., 2014, for their description).
Figure 3 compares the average median ratios between modeled and observed OA concentrations for the ATom and AeroCom-II model ensembles for different regions (BB, MBL, FT, LS). The results show that the median ratio for the ATom model ensemble is close to unity in all regions. This is at least a factor of 2 improvement compared to AeroCom-II models, which were almost always biased high for the remote regions sampled in ATom. The model spread has also been reduced by a factor of 2–3 in all regions. This reduction in the ensemble spread may partially be explained by a smaller size of the ATom model ensemble (see Fig. S2), which also includes models with a more up-to-date OA representation. In order to explore this point further, results for a subset of AeroCom-II models (using earlier versions of models in the ATom ensemble) show only a slight reduction (∼10 %) in the model spread but with some regional differences, i.e., improved agreement with observations in the MBL but an increase in the model bias and spread in the LS (Fig. S2). Thus, improvement for the more recent models appears to be the main reason for the reduced spread.
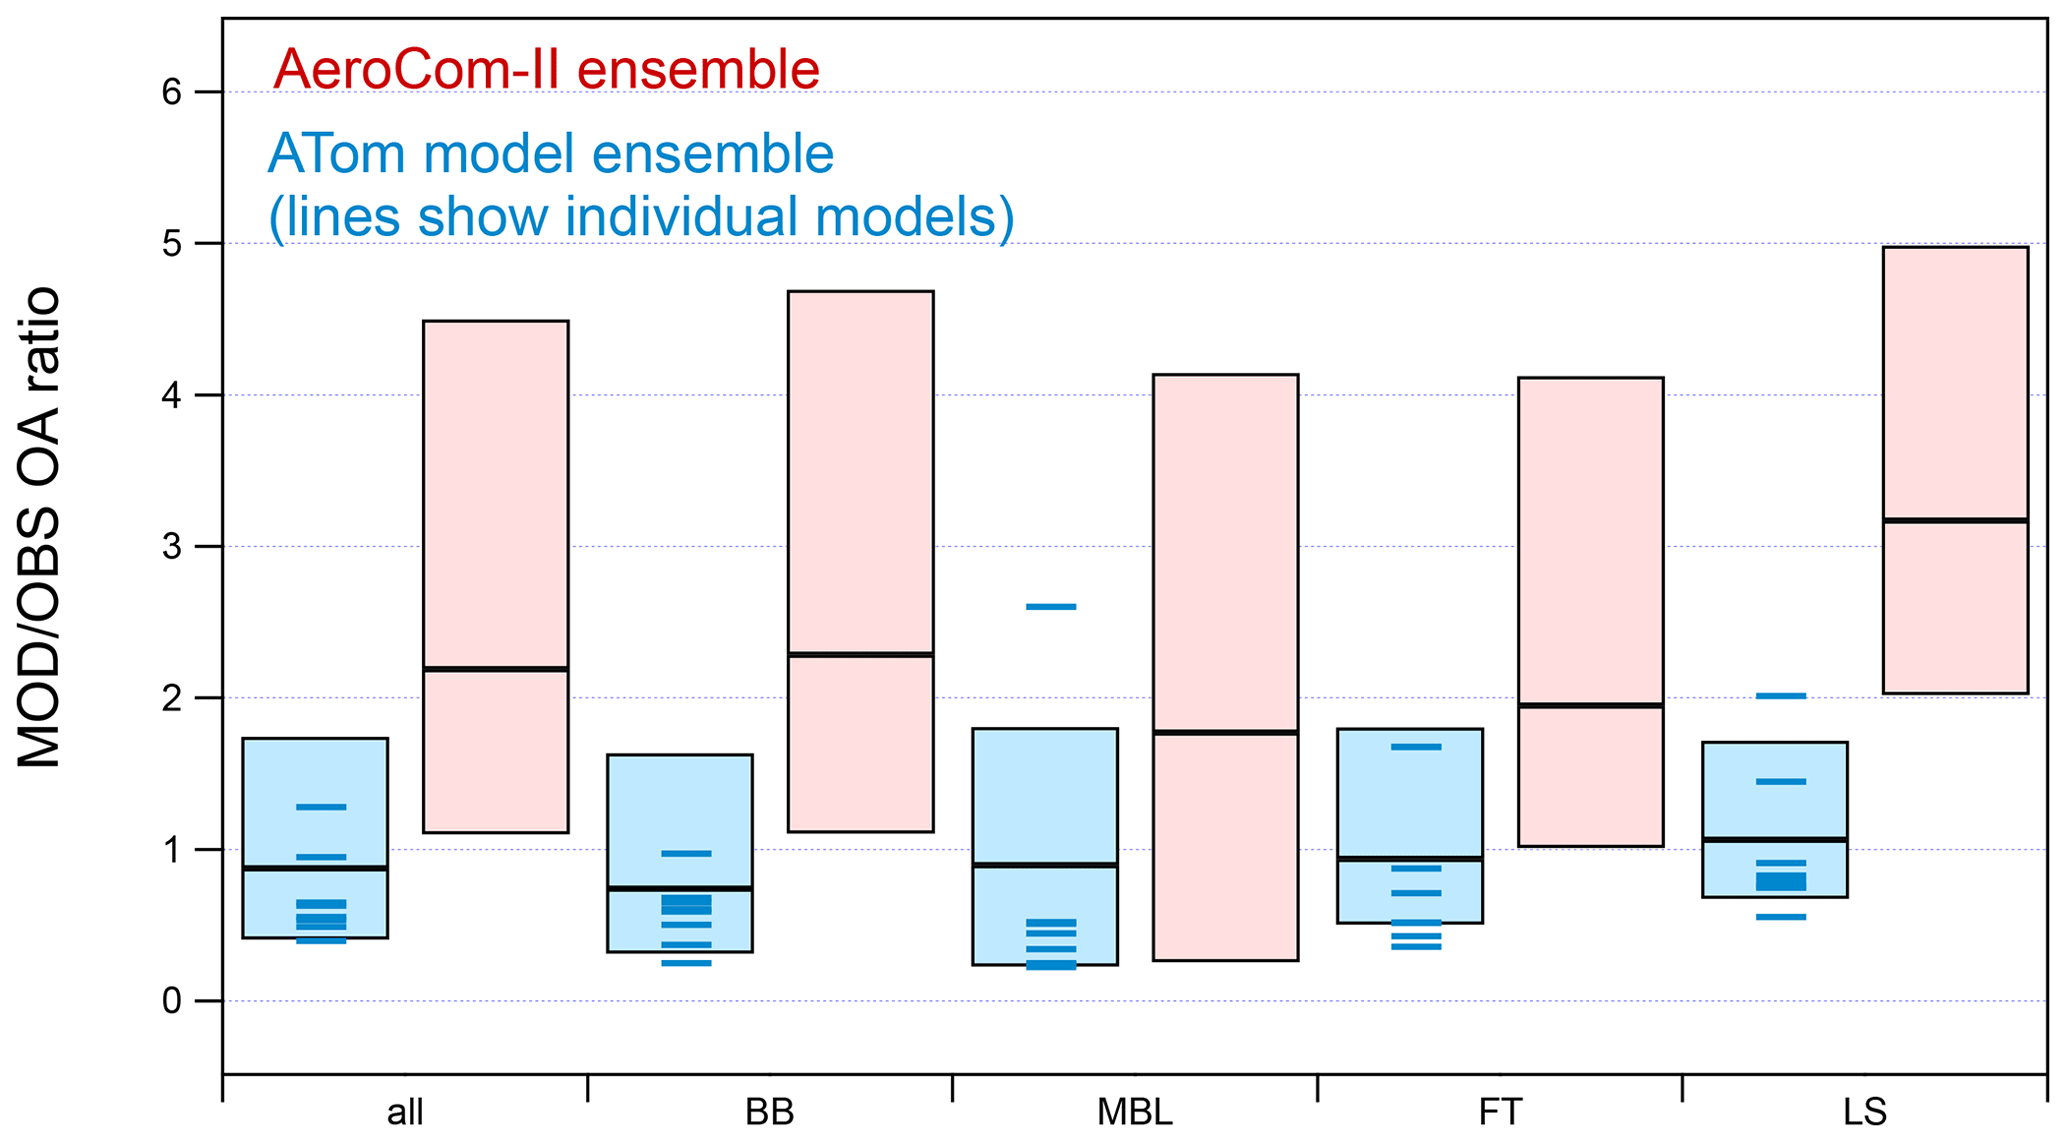
Figure 3Ratios between predicted and observed OA concentrations for all ATom-1 flights as calculated for the ATom and AeroCom-II model ensembles in different regions (BB: biomass-burning-influenced regions; MBL: clean marine boundary layer; FT: clean free troposphere; LS: lower stratosphere). The median of the ensemble ratio is shown as a horizontal line, while the boxes indicate the 25th and 75th percentiles. Medians for the individual models included in the current ATom model ensemble are also shown as blue lines.
4.2 Evaluation of predicted OA vertical distribution
Figure 4 compares the mean vertical profiles of OA measured during ATom-1 and ATom-2 with the predictions of the model ensemble average based on the eight ATom models (Table 1) and 28 AeroCom-II models for the different latitudinal regions of the Pacific and Atlantic basins. Note that the use of a wide logarithmic scale (to be able to span all the observations) may make the observed differences appear small, although they often reach factors of 2–10 and larger (Fig. S5 shows the results on a linear scale). For AeroCom-II, large latitudinal differences exist in the results, with a better performance closer to source regions and large disagreement in the lower stratosphere and remote regions, as already suggested by the mission medians shown in Fig. 3. The best AeroCom-II model performance is found over the Equator in both basins, where the model ensemble captures within a factor of 2 the observed OA concentrations throughout the troposphere in the Pacific Basin and matches the observations remarkably well in the lower troposphere of the Atlantic Basin that is heavily influenced by biomass burning emissions. Reasonable agreement is found for the OA vertical distribution over the NH Atlantic and Pacific oceans, especially in the lower troposphere (<4 km). The largest model discrepancies (1–2 orders of magnitude) are found in the remote regions of the Southern Ocean and SH midlatitudes for both seasons and basins. The model overestimation is also large over the NH midlatitude Pacific Basin in the upper troposphere. A spread of 2–3 orders of magnitude is observed around the ensemble average, indicating a very large variability in individual model predictions. This evaluation of AeroCom-II models in remote regions is an extension of that performed at the surface for urban and remote stations by Tsigaridis et al. (2014) (as in that previous study, the data and model simulations compared are not synchronous in time). The tendency of the model ensemble to overpredict OA concentrations by a factor of 2 on average in the remote regions is consistent with the transition from the large underprediction in OA near the source region to a slight overprediction of OA in remote continental sites, which was reported for most AeroCom-II models (Tsigaridis et al., 2014) and also observed for default parameterizations in other studies (Heald et al., 2011; Hodzic et al., 2016).
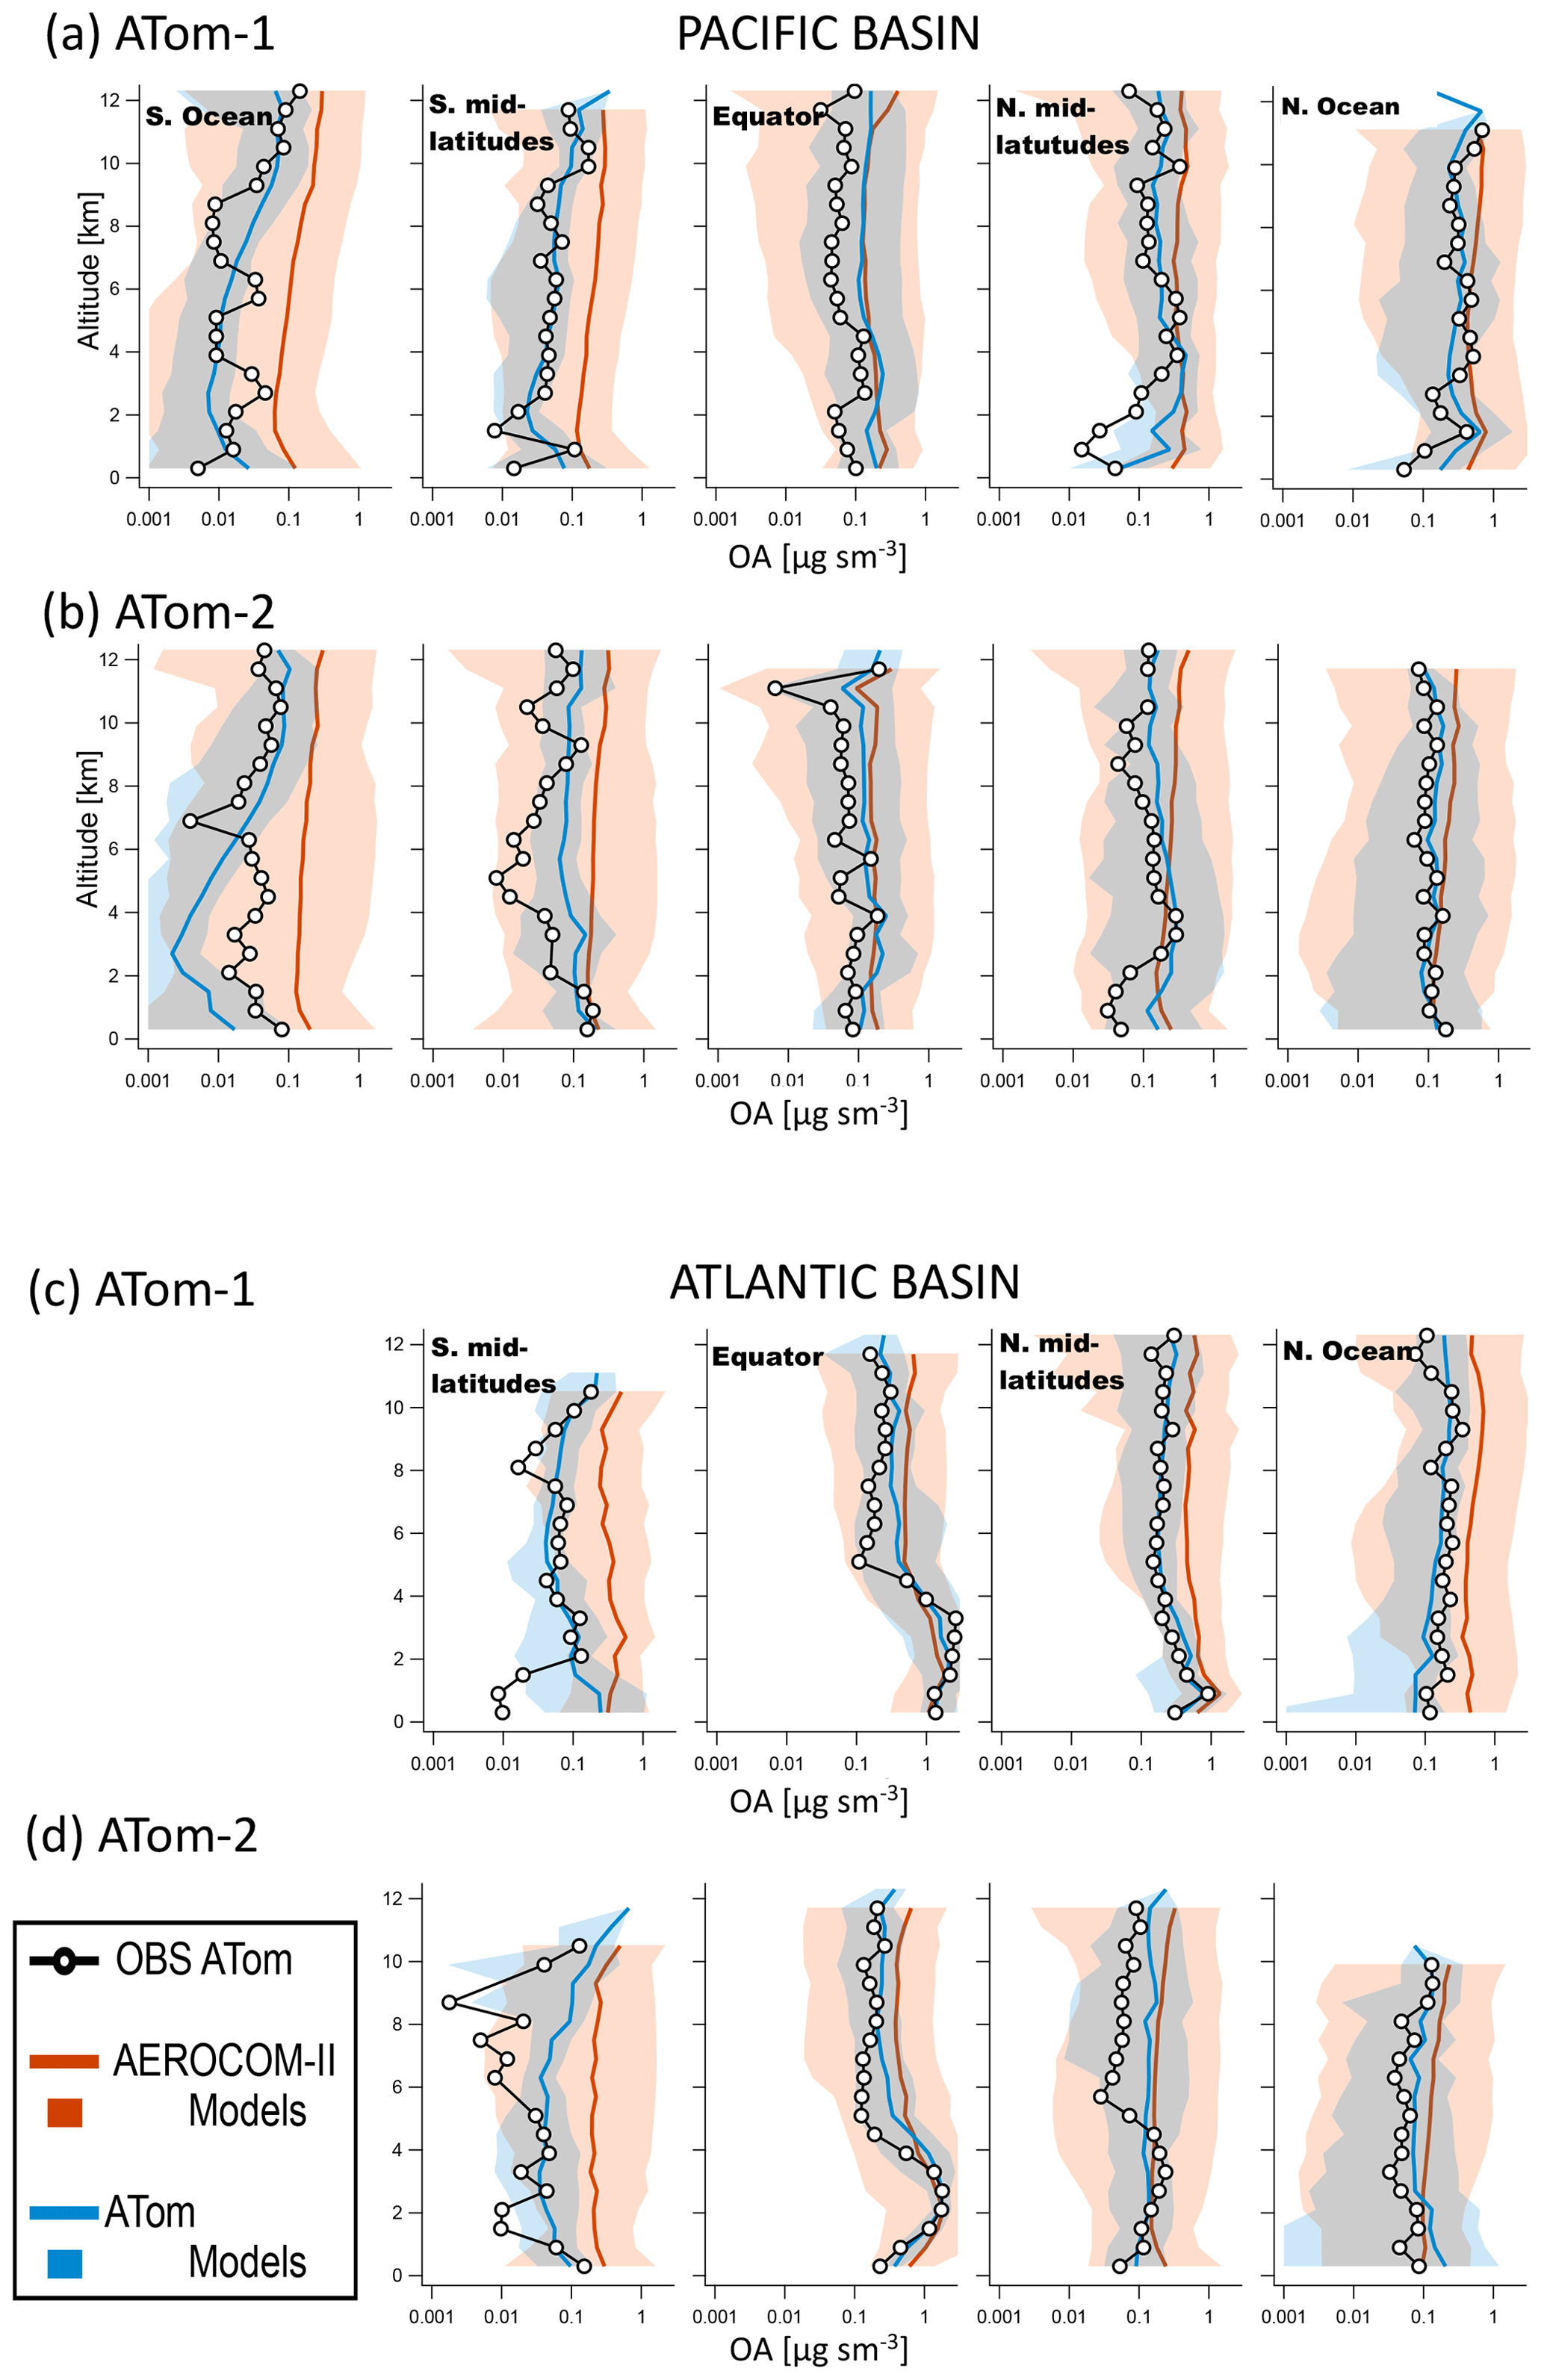
Figure 4Comparison of latitude-averaged predicted OA vertical profiles with ATom-1 and ATom-2 measurements taken over the Pacific (a, b) and Atlantic (c, d) basins. Results of the AeroCom-II model ensemble average are shown in red, while those of the ATom model ensemble are shown in blue. Shaded areas indicate the variability (2 standard deviations) within each model ensemble.
By comparison, the results of the ATom model ensemble show much better agreement with observations. The model spread is still substantial but mostly below a factor of 5. Figures S6 and S7 show OA vertical profiles for individual ATom models and the spread in their results. In most regions, the ATom model ensemble captures both the absolute concentrations and the shape of the vertical profiles reasonably well. In the biomass burning outflow and NH midlatitude regions, the ATom ensemble average better captures the higher OA concentrations in the boundary layer and lower OA concentrations in the lower stratosphere than the AeroCom-II ensemble. We note that using the ensemble median OA profiles instead of ensemble mean OA profiles (as shown in Figs. 5 and S7) results in a slightly lower values of OA but does not change the conclusions of the model–measurement comparisons (Fig. S18).
4.3 Oxidation level of organic aerosols (OA ∕ OC ratios)
In addition to OA mass concentrations, we also evaluate the model's ability to simulate their degree of oxygenation, an indicator of their oxidation and aging (Aiken et al., 2008; Kroll et al., 2011). Ambient measurements of the oxidation level of organic particles are limited (Aiken et al., 2008; Canagaratna et al., 2015), and the ATom dataset provides the first global distribution of O∕C and OA ∕ OC ratios for remote aerosol. The OA ∕ OC ratio is an estimate of the average molecular weight of organic matter per carbon weight, and it mostly depends on the oxygen content (i.e., the O∕C ratio) in the absence of significant concentrations of organonitrates and sulfates. It is needed to compare measurements of organic aerosol mass (from, e.g., AMS) with organic carbon measurements (from, e.g., thermo-optical methods). It is also needed to compare the various types of measurements to model concentrations, which are sometimes carried internally as OA and sometimes as OC. A low OA ∕ OC ratio is indicative of freshly emitted OA from fossil fuel combustion (typically ∼1.4), and its value increases with increased processing of organics in the atmosphere. Figure 5 shows that in remote regions the bulk of measured OA ∕ OC ratios during ATom-1 and ATom-2 range between 2.2 and 2.5 and are larger than the values of 2.1±0.2 found in the polluted US continental outflow regions that were sampled during the SEAC4RS, WINTER, and DC3 field campaigns (Schroder et al., 2018). These values indicate that remote OA is highly oxidized and chemically processed.
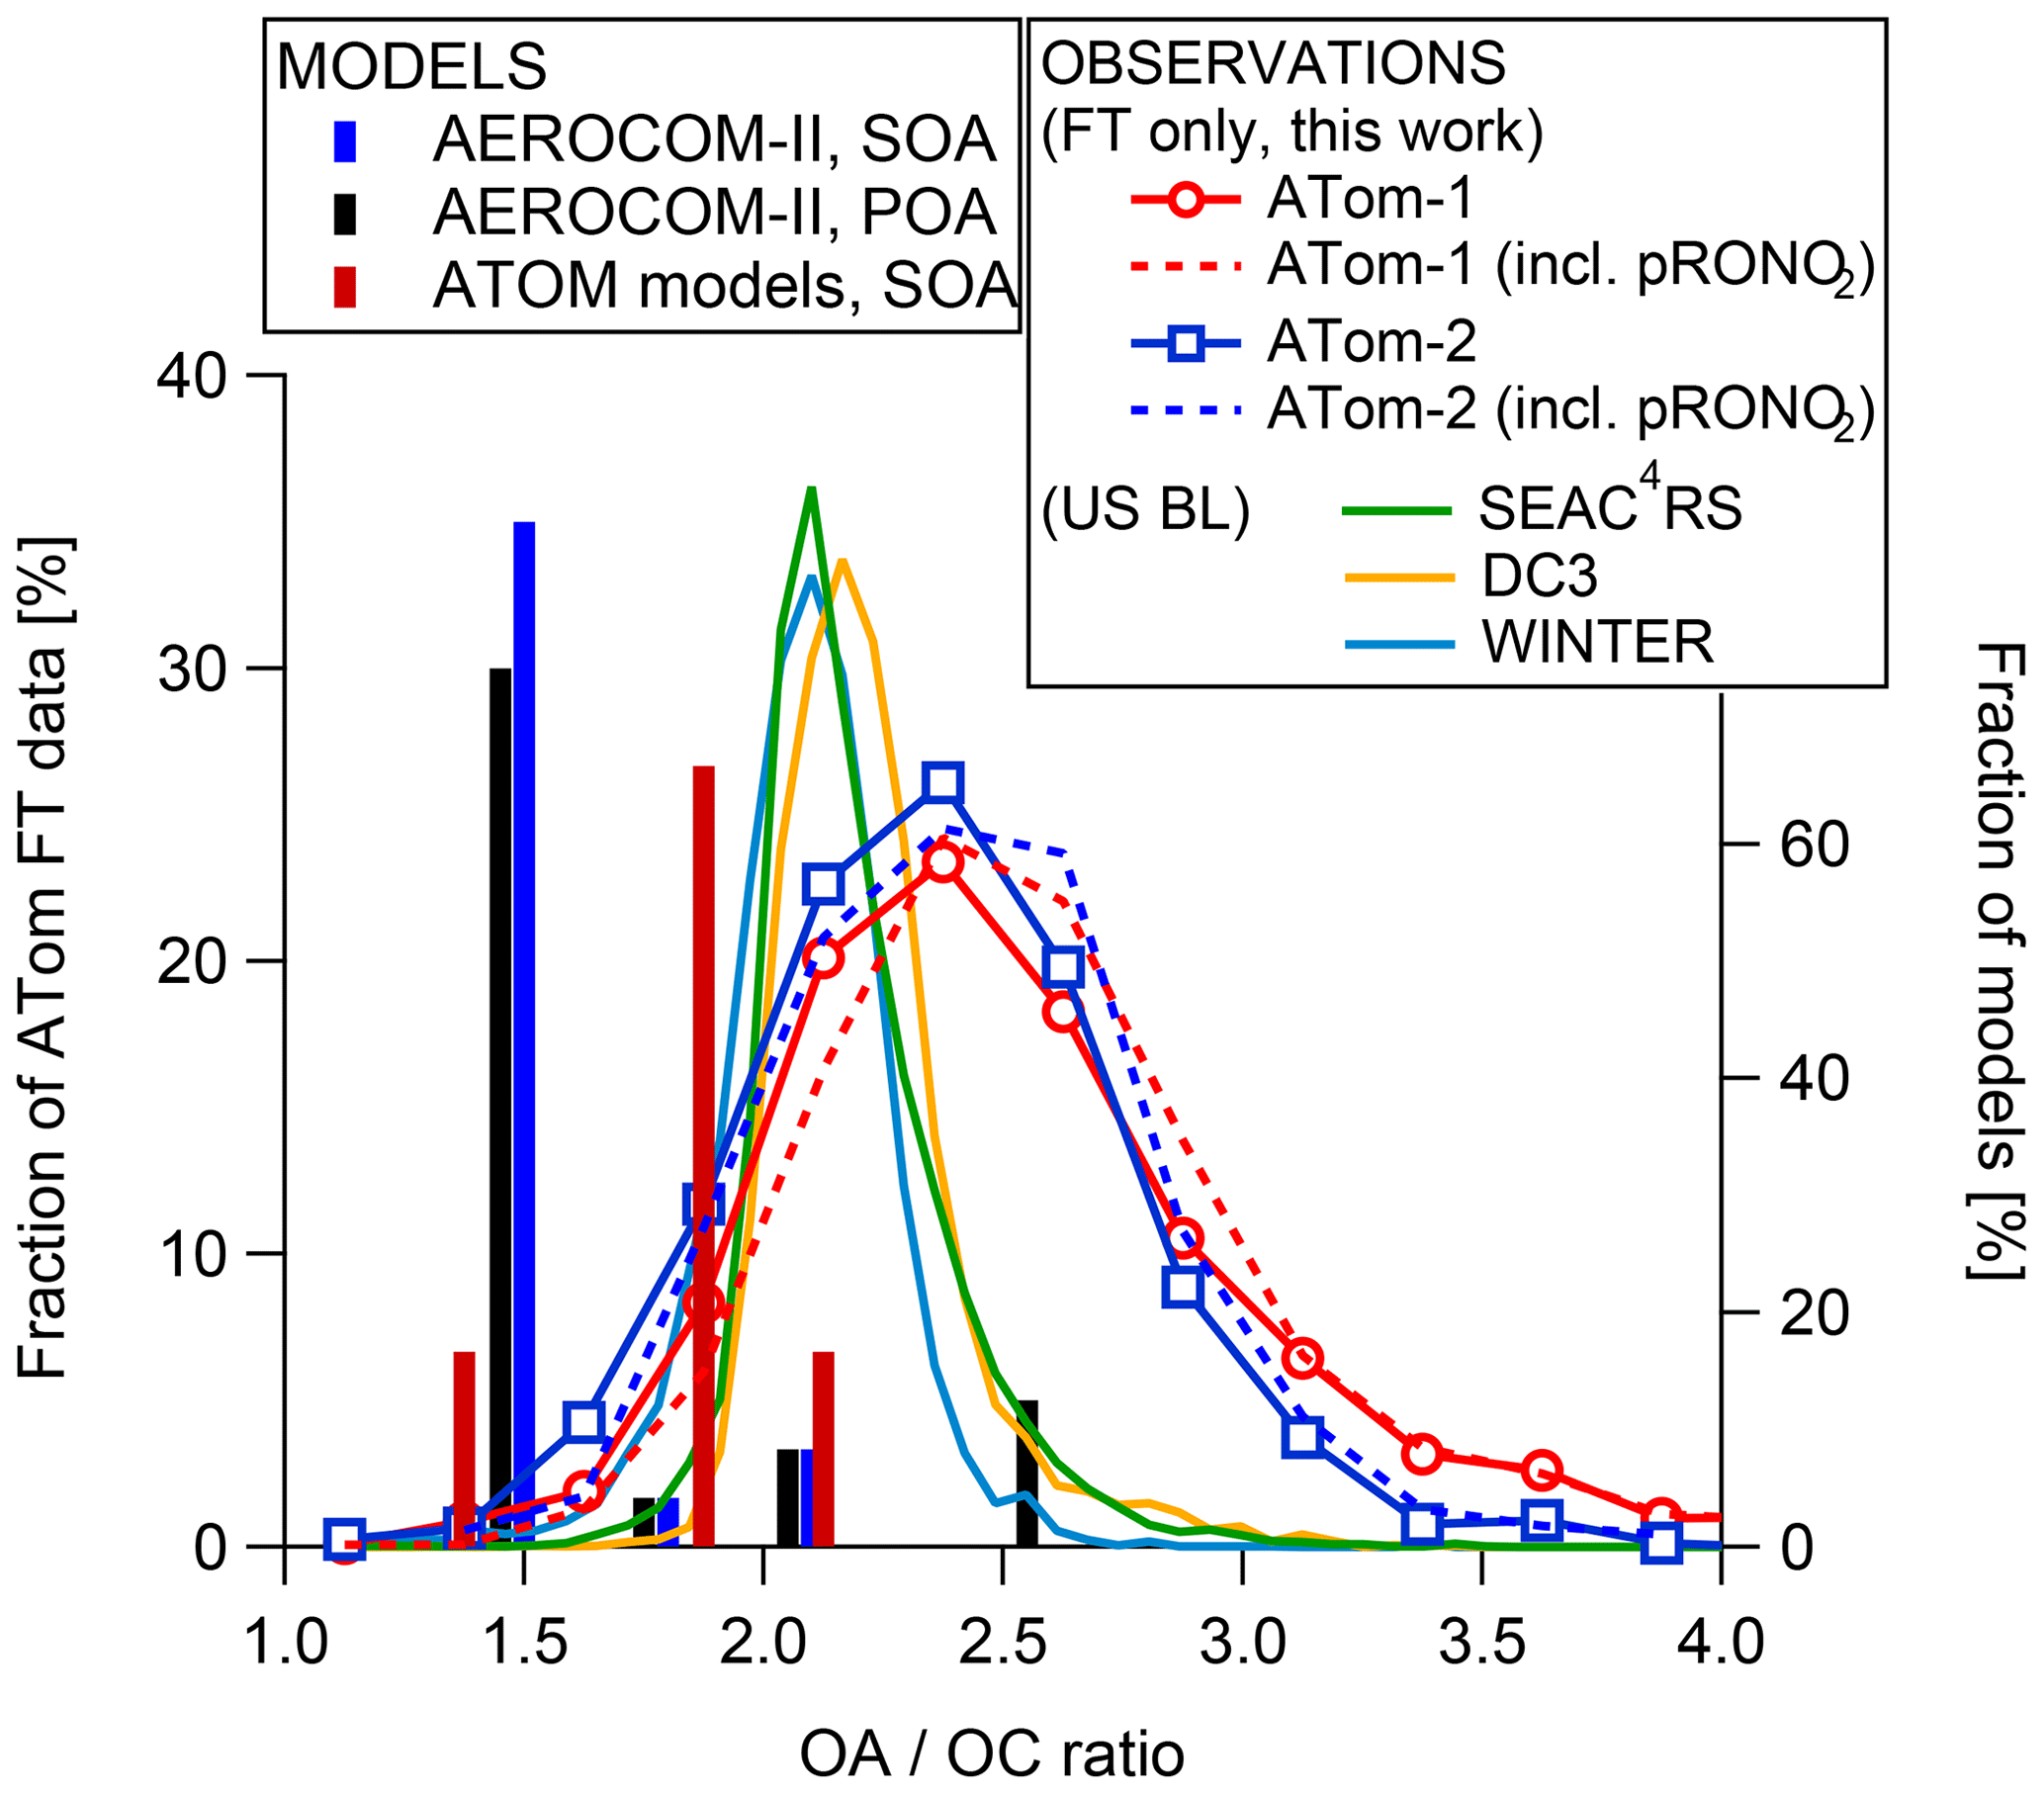
Figure 5Distribution of the OA ∕ OC ratio as measured during ATom-1 and ATom-2. Values for the recent aircraft campaigns (SEAC4RS, DC3, and WINTER) that took place over continental US regions closer to continental source regions are also shown (Schroder et al., 2018). The bars (right axis) show the OA ∕ OC used for SOA and POA by the models included in the AeroCom and ATom ensemble, with OA ∕ OC =1.4 being the modal value for the former and 1.8 for the latter.
Note that for organosulfates (R-O-SO2H, organonitrates, R-O-NO2; pRONO2 in the following) only one oxygen is included in the reported OA ∕ OC, as the fragments of these species are typically the same as for inorganic species in the AMS (Farmer et al., 2010). However, in ATom organosulfates are estimated to account for ∼1 % of the total sulfate (based on PALMS data; see Liao et al., 2015, for the methodology). Since sulfate and OA concentrations are comparable, organosulfates would only increase the OA ∕ OC ratio by ∼1 % on average. Organonitrates are reported from the AMS for ATom. Their impact on OA ∕ OC is not propagated for the default values to maintain consistency with a large set of OA ∕ OC measurements by AMS in the literature and since they would increase OA ∕ OC on average by only 4.5 % (ATom-1) and 2.2 % (ATom-2), which is smaller than the uncertainty of this measurement. However, we show the results with both methods in Fig. 5 to fully document this topic.
Importantly, this ratio is also used to calculate the total OA mass concentration for models that provide their outputs in terms of organic carbon concentrations ([OA]i= [OC]i× OA ∕ OCratio). Most models use a constant OA ∕ OC ratio, but the value used varies substantially. OA ∕ OC of 1.4 is used in ECHAM6-HAM, whereas 1.8 is used in GEOS5 and GC10-TOMAS simulations for both POA and SOA. Other models directly calculate SOA concentrations without applying this conversion (CESM1-CARMA, CESM2-SMP, CESM2-DYN, GC12-REF, and GC12-DYN) but for POA use the ratio of 1.8 (CESM1-CARMA, CESM2-SMP, CESM2-DYN) and 2.1 (GC12-REF and GC12-DYN). Most of the AeroCom-II models use the ratio of 1.4 for all primary and secondary OA (Tsigaridis et al., 2014). The comparison with measurements shows that the measured values are ∼40 % larger than those assumed in some of the ATom models and 60 %–80 % larger than used in AeroCom-II models. The comparison between the observed and predicted OA ∕ OC vertical profiles (Fig. S3) shows that AeroCom-II models tend to generally underpredict this ratio and do not capture its increase in remote regions. As a result, this underestimation of OA ∕ OC ratios and the use of a constant value could substantially impact the comparisons of OA mass concentrations for several models considered in this study (ECHAM6-HAM, GEOS5, CESM1-CARMA, and GC10-TOMAS). If we correct for the underestimated OA ∕ OC ratio using the ATom measured values of 2.2 (to be conservative) and compare to previously discussed biases in Table 2, the overprediction of the ECHAM6-HAM model is increased to ∼110 %–160 % and that of GC10-TOMAS to 180 % during ATom-2 while having ∼15 % bias in ATom-1, whereas GEOS5 results now overestimate up to 30 % during ATom1 and perform much better during ATom-2.
These results demonstrate that current global chemistry–climate models use unrealistically low OA ∕ OC ratios, which results in a large underestimate of the degree of oxidation of OA in remote regions. The inaccurate prediction of OA oxidation as it ages could impact not only the calculations of OA burden, but also its optical properties as the absorption of OA changes with its degree of oxidation (through the formation and destruction of brown carbon; Laskin et al., 2015; Forrister et al., 2015). However, the models used in this study did not include these effects.
4.4 Contribution of primary vs. secondary OA
We further assess whether global models can adequately predict the relative contributions of primary and secondary OA. We strive to quantify these fractions with the most straightforward methods (with the fewest assumptions) for both models and measurements. POA concentrations were estimated from the BC measurements by using an emission ratio appropriate for the air mass origin (biomass burning vs. anthropogenic), as quantified by the f(BB) mass fraction from the PALMS single particle instrument (see Sect. 3.2), with f(BB) =1 taken as BC and OA being of pure BB air mass origin and f(BB) =0 exclusively from a non-biomass burning source. By using the POA ∕ BC ratio at the source regions after most evaporation but before POA chemical degradation evaporation has taken place, we implicitly assume POA to be chemically inert, while in reality it can slowly be lost to the gas phase by heterogeneous chemistry (e.g., George and Abbatt, 2010; Palm et al., 2018). Thus, the observation-based method provides an upper limit to the fraction of POA. The model–measurement comparison is only shown for the CESM and GEOS-Chem model variants, as other participating models do not separate or did not report their POA and SOA fractions. In all simulations, POA was treated as a chemically inert directly emitted primary aerosol species that only undergoes transport, transformation from hydrophobic to hydrophilic state with aging (1–2 d typically), coagulation, and dry and wet deposition. Importantly, the treatment of POA as non-volatile (rather than semi-volatile) in models is fully consistent with the assumptions for POA estimation from the measurements.
Figure 6 compares the vertical profiles of measurement-derived POA during ATom-1 and predicted by the CESM2-DYN model over clean remote regions of the Pacific Basin and northern polar Atlantic that are not influenced by biomass burning. Comparisons for other models are similar (not shown). Observations show that POA is extremely small in remote regions, whereas the model predicts that about half of the OA is made of POA in those areas. Although the model reproduces the measured total OA quite well, it tends to severely overpredict the amount of POA and underpredict that of SOA over clean remote regions (with the two errors canceling each other when it comes to total OA). Over biomass burning regions (not shown here) it can be difficult to directly quantify POA and SOA with this method, as total OA remains about constant, while POA decreases with aging and SOA increases (Cubison et al., 2011; Jolleys et al., 2015; Hodshire et al., 2019b). However, given this evolution the method used here would lead to an overestimate of POA for this reason.
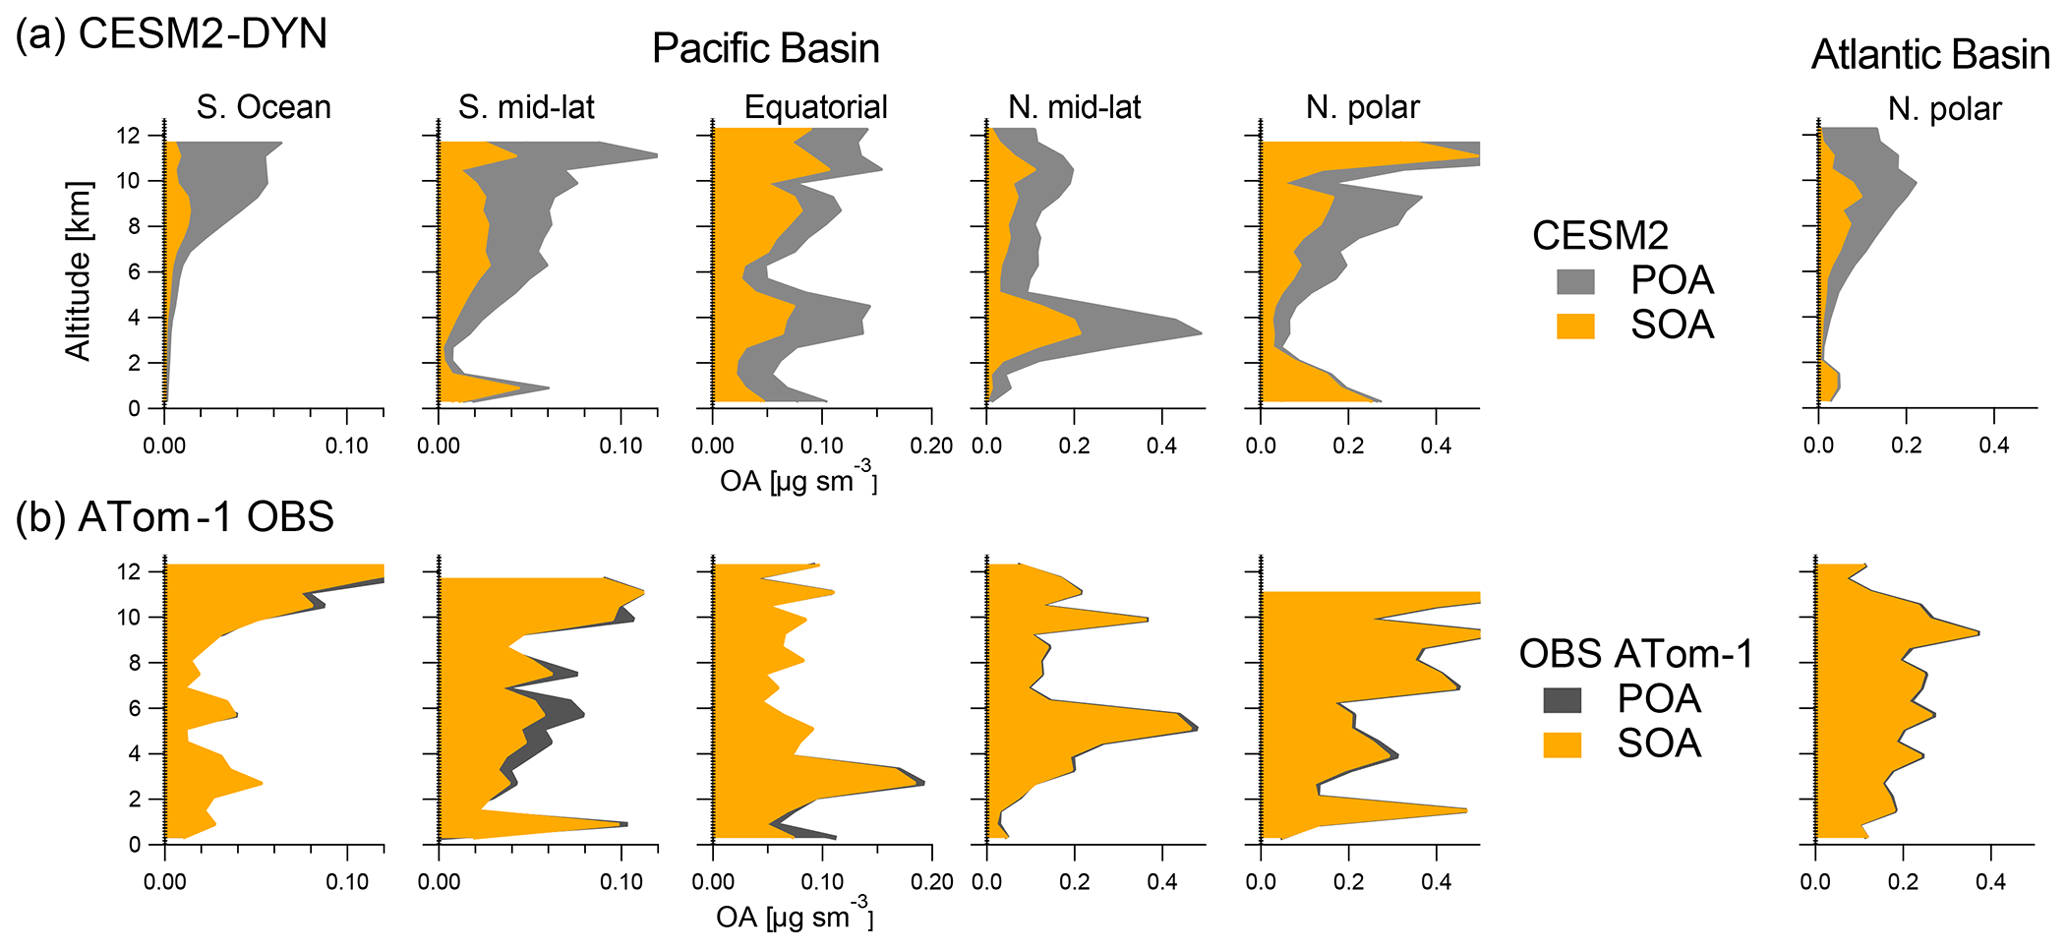
Figure 6Comparison of averaged POA and SOA vertical profiles as observed during ATom and as predicted by the CESM2-DYN model over the non-BB-influenced Pacific and Atlantic basins. The comparison is not shown for the strongly biomass-burning-influenced regions as all the OA is conservatively allocated to POA in those regions.
A more general comparison is made in Fig. 7 using the frequency distributions of the measured and simulated fraction of POA ∕ OA for the free troposphere only (Fig. S8 shows the corresponding cumulative distributions). Observations indicate that most remote FT air masses contain less than 10 % POA, except for biomass burning plumes that are considered mostly primary. A slightly higher proportion of POA is seen in ATom-2, which is consistent with slower photochemical production of SOA during NH winter. These results indicate that remote OA is consistently dominated by SOA regardless of the season and location. The comparison with models reveals a very large discrepancy in the predicted vs. measured POA vs. SOA contributions. Models have a general tendency to severely overpredict the fraction of POA and underpredict that of SOA, displaying a much wider frequency distribution than the measurements (as also shown for POA and SOA vertical profiles for individual models in Figs. S6 and S7). In the GC12-REF, CESM2-DYN, and CESM1-CARMA (without improved in-cloud removal) predictions for ATom-1, more than half of the remote OA is POA, while that is very rarely observed in the free troposphere (possibly only during strong biomass burning events). Most models fail to reproduce the overwhelming dominance of SOA that is inferred from the measurements during ATom-1, while the discrepancies are less severe during NH winter (ATom-2). These seasonal differences suggest that model errors could be partially due to inefficient production of SOA and/or POA emissions that are too high, although removal errors also probably play a major role (see the next section).
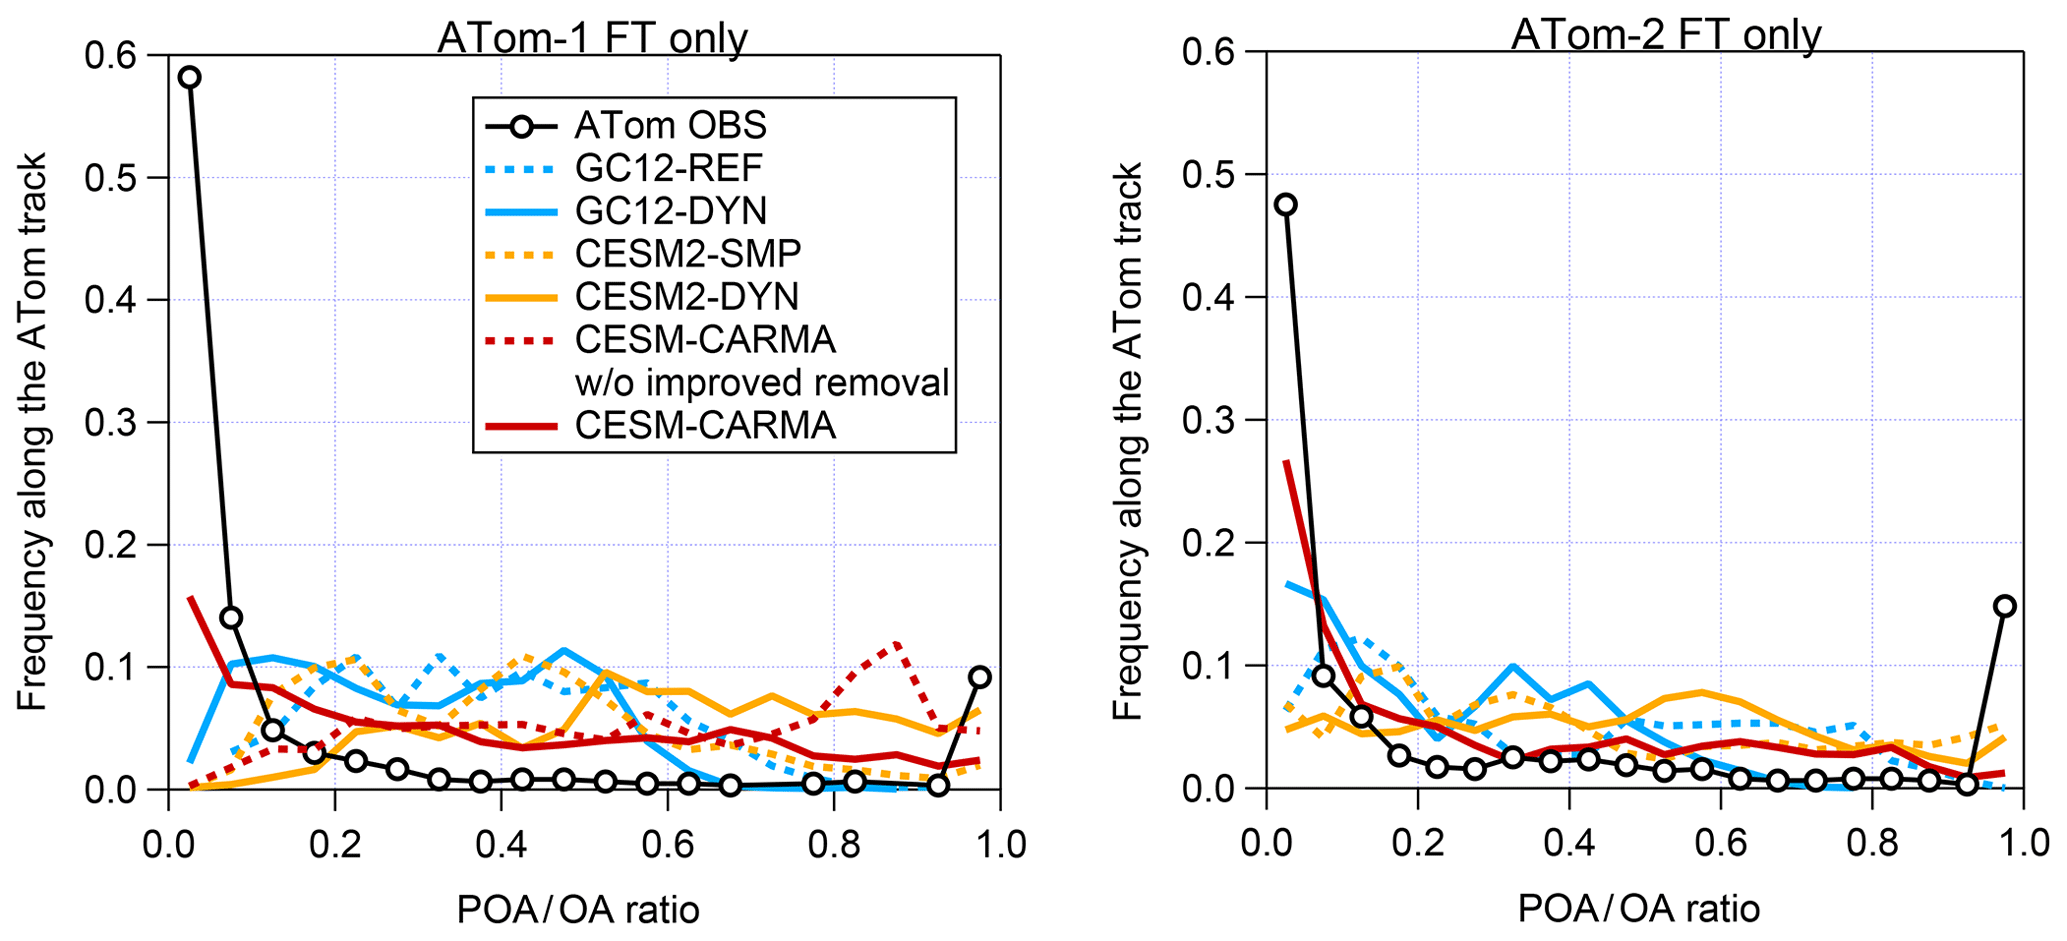
Figure 7Frequency distribution of the observed and simulated ratio of POA to total OA in the free troposphere during ATom-1 and ATom-2 as computed by the GC12, CESM2, and CESM1-CARMA models.
The differences are so large that they are pretty insensitive to the details of the POA estimation method from the measurements, mostly because for the vast majority of the ATom track BC ∕ OA ratios were extremely low, and hence the exact magnitude of the multiplicative factor is secondary to the estimation of POA (Fig. S11). As Fig. S9 illustrates, the choice of FFratio has very little impact on the overall distribution of POA. On the other hand, while the BBratio does impact the overall distribution of POA, it mostly affects the points in the vicinity of large Atlantic plumes. Since the POA ∕ BC ratio in those plumes is fairly low (see Sect. 3.2), using a very large BBratio mostly leads to an increase in the fraction of the points at which POA >100 %. While the large range of published BBratio for different sources precludes a more accurate estimation by our method, for the purposes of the comparison with the model results we emphasize that even when using the largest BBratio, the fraction of SOA is still significantly larger in the ATom dataset than in any of the models.
Additional sensitivity tests were performed to investigate the impact of noisy data and uncertainties of f(BB) on the estimation of POA. Figure S11 clearly shows that the impact of a misattribution of the aerosol type by the stated PALMS uncertainty (Froyd et al., 2019) is completely negligible. Figure S10 details how the choice of averaging interval (with longer averaging times reducing the fraction of OA measurements under the DL and below zero) impacts the distribution of POA. Overall, no large changes are observed for averaging times >5 min, and hence a 5 min averaging interval was used for the analysis in Fig. 7. Figure S10 also illustrates how capping the histogram impacts the POA distribution. To capture the most realistic f(POA) distribution, the data in Fig. 7 were capped at the extremes (so f(POA)<0 is taken as f(POA)=0, and f(POA)>1 is taken as f(POA)=1). As Fig. S10 shows, data with f(POA)<0 are almost exclusively due to very small (and always positive, since BC cannot go negative) POA values being divided by small, negative noise in total OA, and hence treating that fraction of the histogram as essentially fPOA∼0 is justified. On the other end of the distribution, data for which POA is larger than OA is mostly due to our average BBratio being larger than the one encountered in most of the BB plumes in ATom. Choosing a lower BBratio, as Fig. S9b and d illustrate, leads to f(POA)>1 basically trending to zero, confirming our interpretation. This is a limitation of the dataset, and it does not seem appropriate to remove these points, since some fraction is likely dominated by POA. However, it shows that the POA estimation, especially for this part of the distribution, likely overstates the importance of POA.
A comparison between simulations that have the same treatment of POA, and only differ in their chemistry and removal of SOA (e.g., CESM2-SMP vs. CESM2-DYN; GC12-REF vs. GC12-DYN), indicates that a more complex SOA treatment does not always result in a more accurate simulation of the primary–secondary character of OA, a result that was also found in the AeroCom-II multi-model intercomparison (Tsigaridis et al., 2014).
Finally, we have examined whether the non-volatile treatment of POA in models could lead to these unrealistically high POA fractions in remote regions. Figure S16 shows a comparison of POA vertical profiles as predicted by the GC12-REF simulations that use non-volatile POA and a sensitivity simulation, GC12-REF-SVPOA, that uses semi-volatile POA similar to the standard treatment in GEOS-Chem as described in Pai et al. (2020). Note, however, that Pai et al. (2020) included marine POA emissions, used different reanalysis meteorology, and used a different model version (12.1.1 rather than 12.0.1 here), so their resulting comparisons to ATom measurements are somewhat different than found here for GC12-REF-SVPOA. The comparison indicates that the POA concentrations increase substantially in most regions when the semi-volatile POA parameterization is used. These results suggest that the non-volatile treatment of POA is not responsible for the model bias.
4.5 Sensitivity to OA formation and removal
In this section, we further investigate some of the possible reasons for the incorrect model predictions of the relative contributions of POA and SOA in remote regions. Given the tendency of models to underestimate OA close to anthropogenic source regions and overestimate OA downwind in past studies (e.g., Heald et al., 2011; Tsigaridis et al., 2014; Hodzic et al., 2016), in this section we investigate the sensitivity of OA to increasing sources and increasing removals. We have performed two additional model simulations to test the sensitivity of the POA–SOA fractions to uncertainties in the representation of (i) wet scavenging based on the CESM1-CARMA simulations in which we have removed the improvements in the aerosol removal by the convective updrafts (Yu et al., 2019) and of (ii) SOA formation based on the GC12-REF simulations in which we have replaced the SOA formation VBS mechanism (Pye et al., 2010) by an updated VBS mechanism that uses chamber wall-loss-corrected SOA yields (Hodzic et al., 2016; the same formation scheme that is used in GC12-DYN and CESM2-DYN runs, but with removals kept identical to GC12-REF). The results of these two sensitivity simulations are displayed in Fig. 8, which shows measured and predicted mass concentrations of OA, POA, SOA, and sulfate for ATom-1 as a function of the number of days since the air mass was processed through convection. One should keep in mind that this is an averaged plot that includes air masses from various regions and altitudes, and it is not a Lagrangian plot following the same air mass.
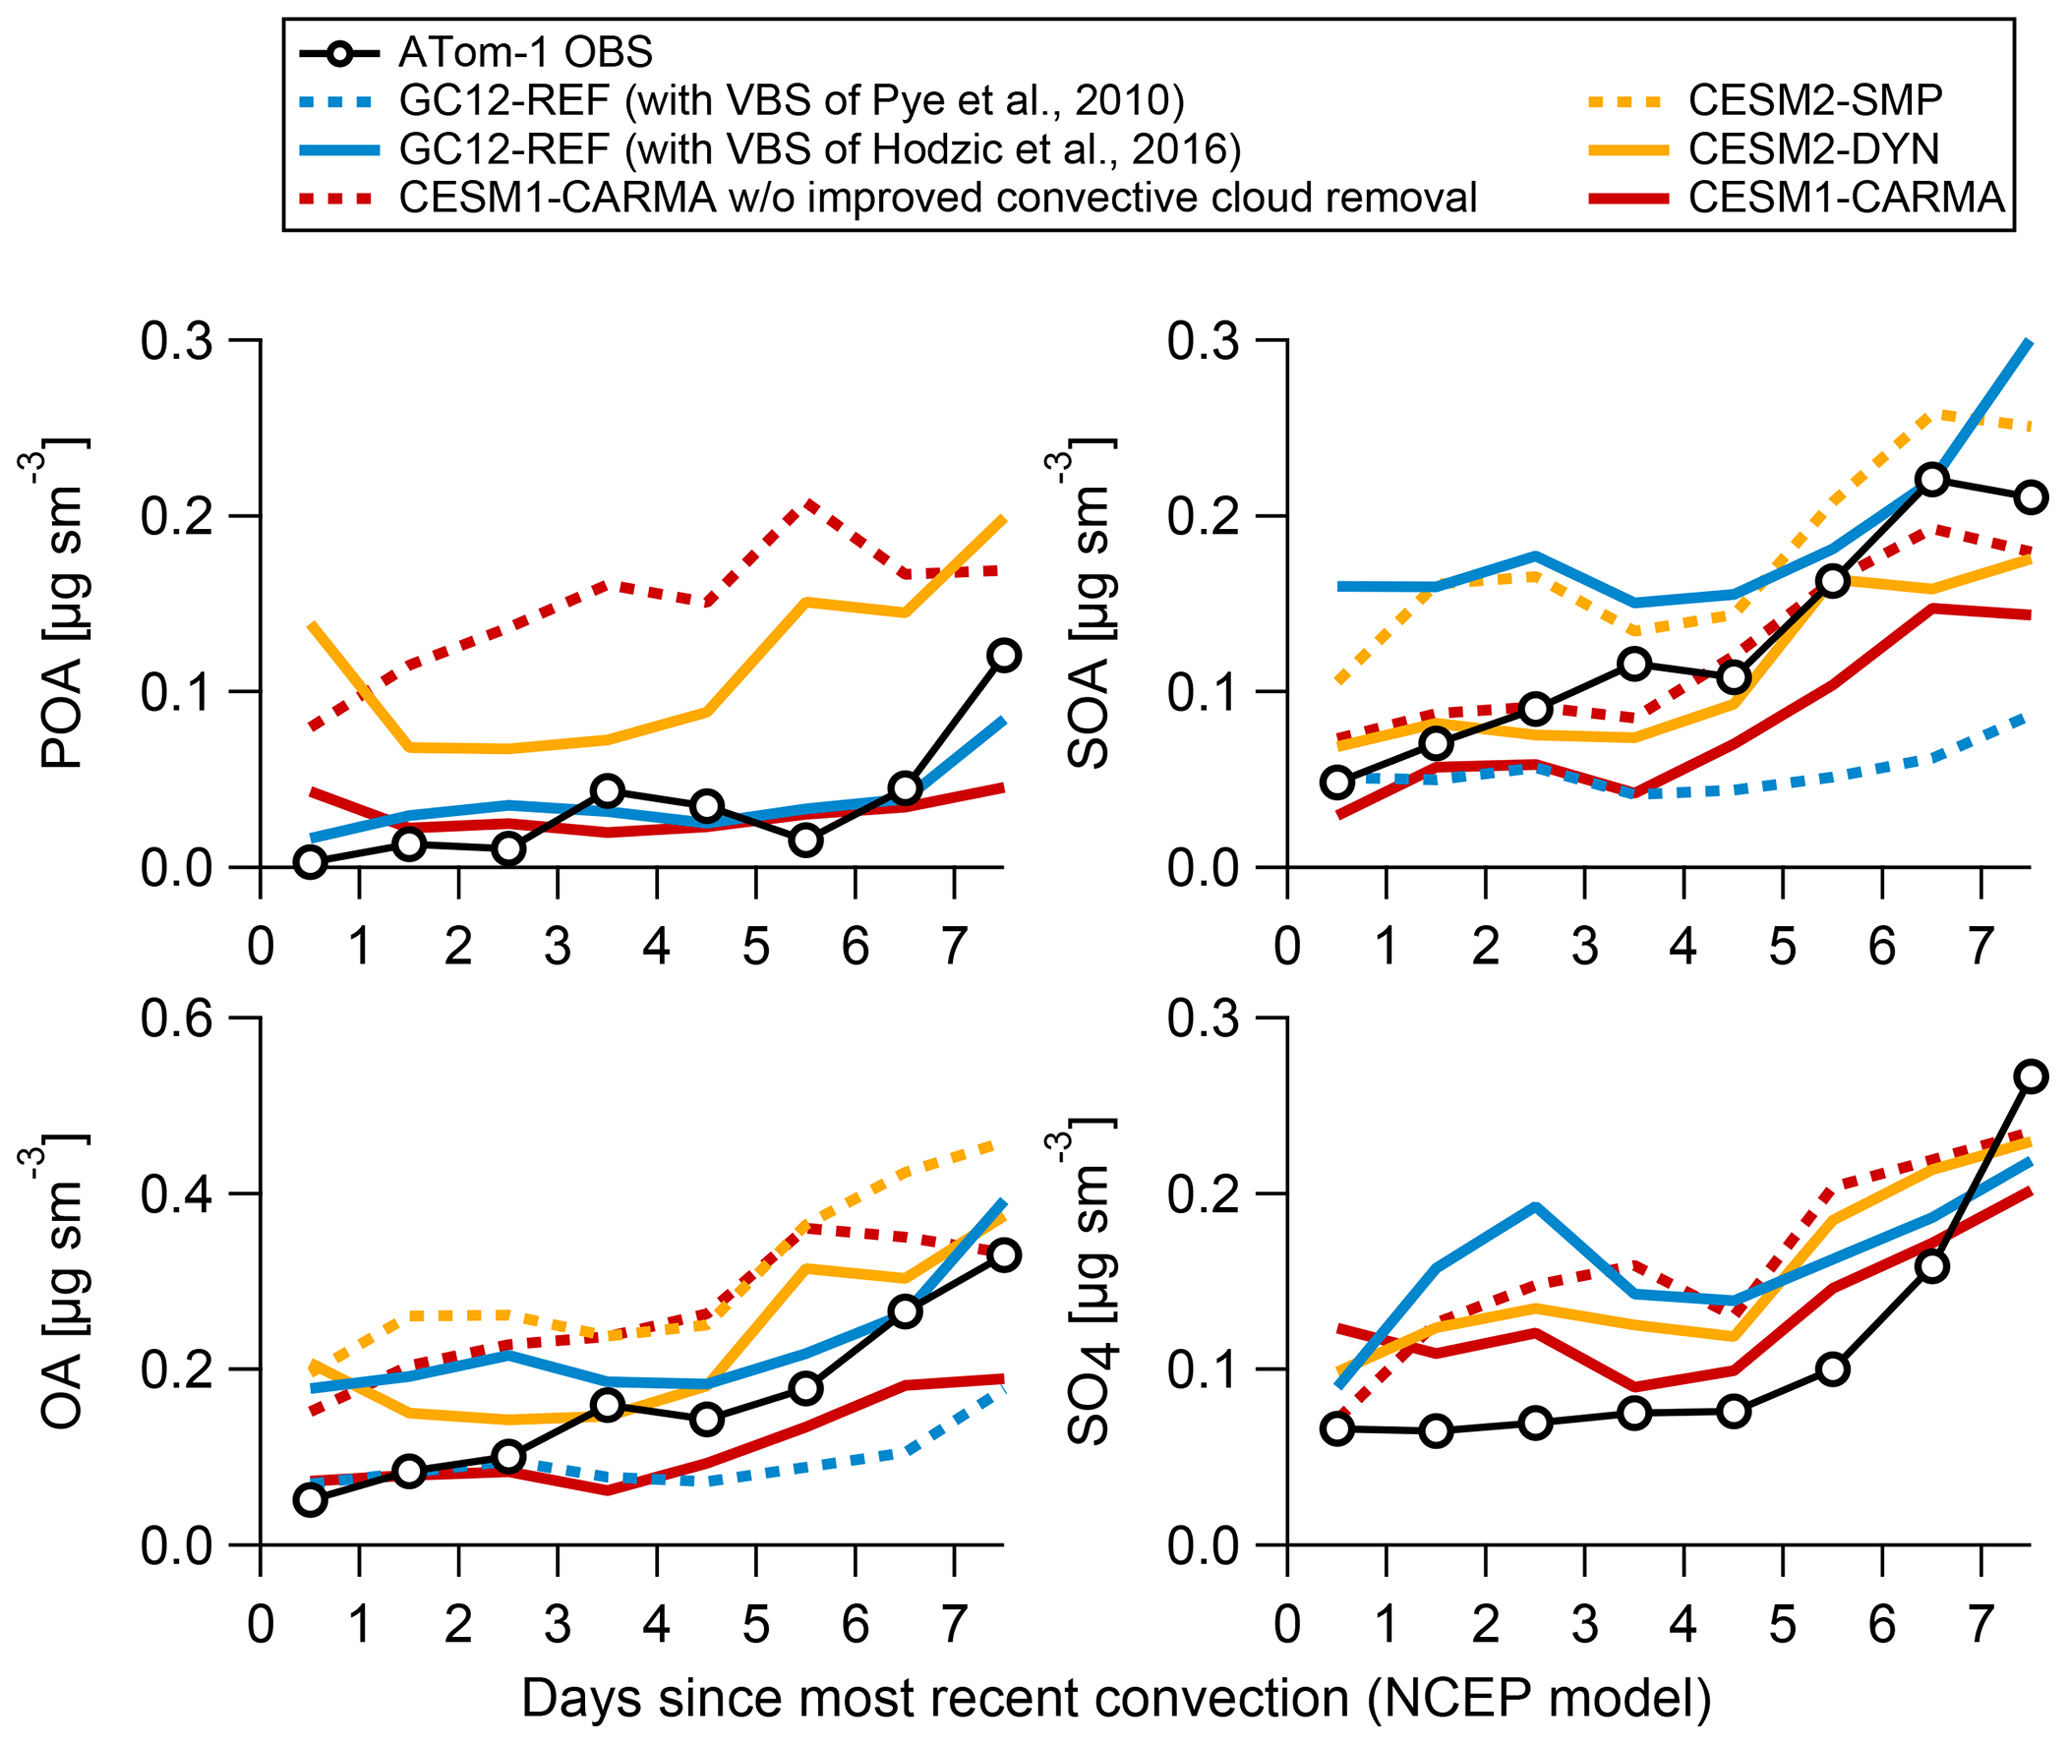
Figure 8Measured and predicted mass concentrations of POA, SOA, OA, and sulfate aerosols during ATom-1 as a function of the number of days since the air mass was processed through convection (based on a trajectory model from Bowman, 1993, and satellite cloud data from NASA Langley; https://clouds.larc.nasa.gov/, last access: January 2020). CESM2-SMP and CESM2-DYN have the same emissions and processing of POA and sulfate and thus similar concentrations. The same is true for the two versions of GC12.
4.5.1 Sensitivity to in-cloud scavenging in convective clouds
Inefficient wet removal of primary OA could contribute to the POA overprediction in global models, especially in the tropics. Previous global model studies have reported overestimation by 2 to 3 orders of magnitude of primary carbonaceous species such as BC in the free troposphere when removal in convective updrafts was not included (e.g., Schwarz et al., 2013; Yu et al., 2019). A strong reduction due to convective removal is also expected for POA concentrations, as POA is a primary species co-emitted with BC at the surface and internally mixed with it (Lee et al., 2015) and that is typically coated by secondary inorganics and organics over short timescales (Petters et al., 2006; Mei et al., 2013; Wang et al., 2010). Figures 7a and 8 compare the simulations of CESM1-CARMA with and without improved convective in-cloud scavenging during ATom-1. The improved in-cloud scavenging scheme considers aerosol activation into cloud droplets from entrained air above the cloud base, which is more realistic and results in a more efficient removal of aerosols in the upper troposphere by convection. For example, a 2-orders-of-magnitude reduction in BC in the upper FT was reported by Yu et al. (2019), resulting in much improved agreement with observations. Similar results were observed for sea salt aerosols in Murphy et al. (2019). Figure 8 shows that all submicron aerosol species simulated in CESM1-CARMA are strongly impacted by in-cloud removal above the cloud base. POA concentrations are reduced by an order of magnitude, while sulfate is reduced by 30 %, leading in both cases to much-improved agreement with observations. SOA is reduced by ∼30 % as well, which leads to an underprediction of measured SOA concentrations. The overall impact on OA concentrations is a significant reduction, which leads to ∼20 % underestimation of OA in aged remote air during ATom-1.
For the CESM2-DYN model that does not have improved in-cloud removal, the reasonable agreement (within 20 %) with the observed OA concentrations thus results from coincidental error compensation between the overpredicted POA and underpredicted SOA. The prescribed SOA formation and the artificial 50 % adjustment of SOA emissions based on Liu et al. (2012) in CESM2-SMP lead to an overestimation of observed SOA in aged remote air masses.
4.5.2 Sensitivity to SOA formation
In addition, we have also tested the sensitivity of the OA composition to the choice of the SOA formation mechanism. Figure 8 compares the results of the GC12-REF model that uses SOA formation yields derived from traditional chamber experiments (Pye et al., 2010) and those corrected for losses of organic vapors onto chamber walls as proposed in Hodzic et al. (2016). Previous studies have reported that chamber wall losses could lead to the underprediction of formed SOA by up to a factor of 4 (Zhang et al., 2014; Krechmer et al., 2016). It should be noted that, in both cases, isoprene SOA is formed in aqueous aerosols following Marais et al. (2016). The comparison shows a factor of 3 increase in SOA concentrations when the updated SOA formation is considered, leading to much better agreement with the observed SOA and the observed total OA. GC12-REF predicts the amount of POA well and somewhat overpredicts the amount of sulfate aerosols, which is expected as it already includes the improved aerosol removal in convective updrafts (Wang et al., 2014). Figure S6 also shows that the POA vertical distribution is well captured in GEOS-Chem in most regions, except over the polar North Pacific. It should be noted that these results are consistent with the POA ∕ OA frequency distribution shown in Fig. 7 (the POA ∕ OA ratio predicted by GC12-REF is larger than the measured ratio, which is consistent with the fact that POA is about the right amount, and OA is underpredicted in Fig. 8).
These sensitivity simulations suggest that a stronger convective removal of POA and a stronger production of SOA might be needed to correctly represent not only the total OA concentrations but also its primary and secondary nature in the remote free troposphere and remote ocean regions. Accurate predictions of the OA concentration, composition, and source contributions for the right reasons are key for accurately predicting their life cycle and radiative impacts. Only when there is confidence that the sources are accurately predicted can we have confidence in OA predictions for preindustrial and future conditions, as well as evaluating PM mitigation strategies.
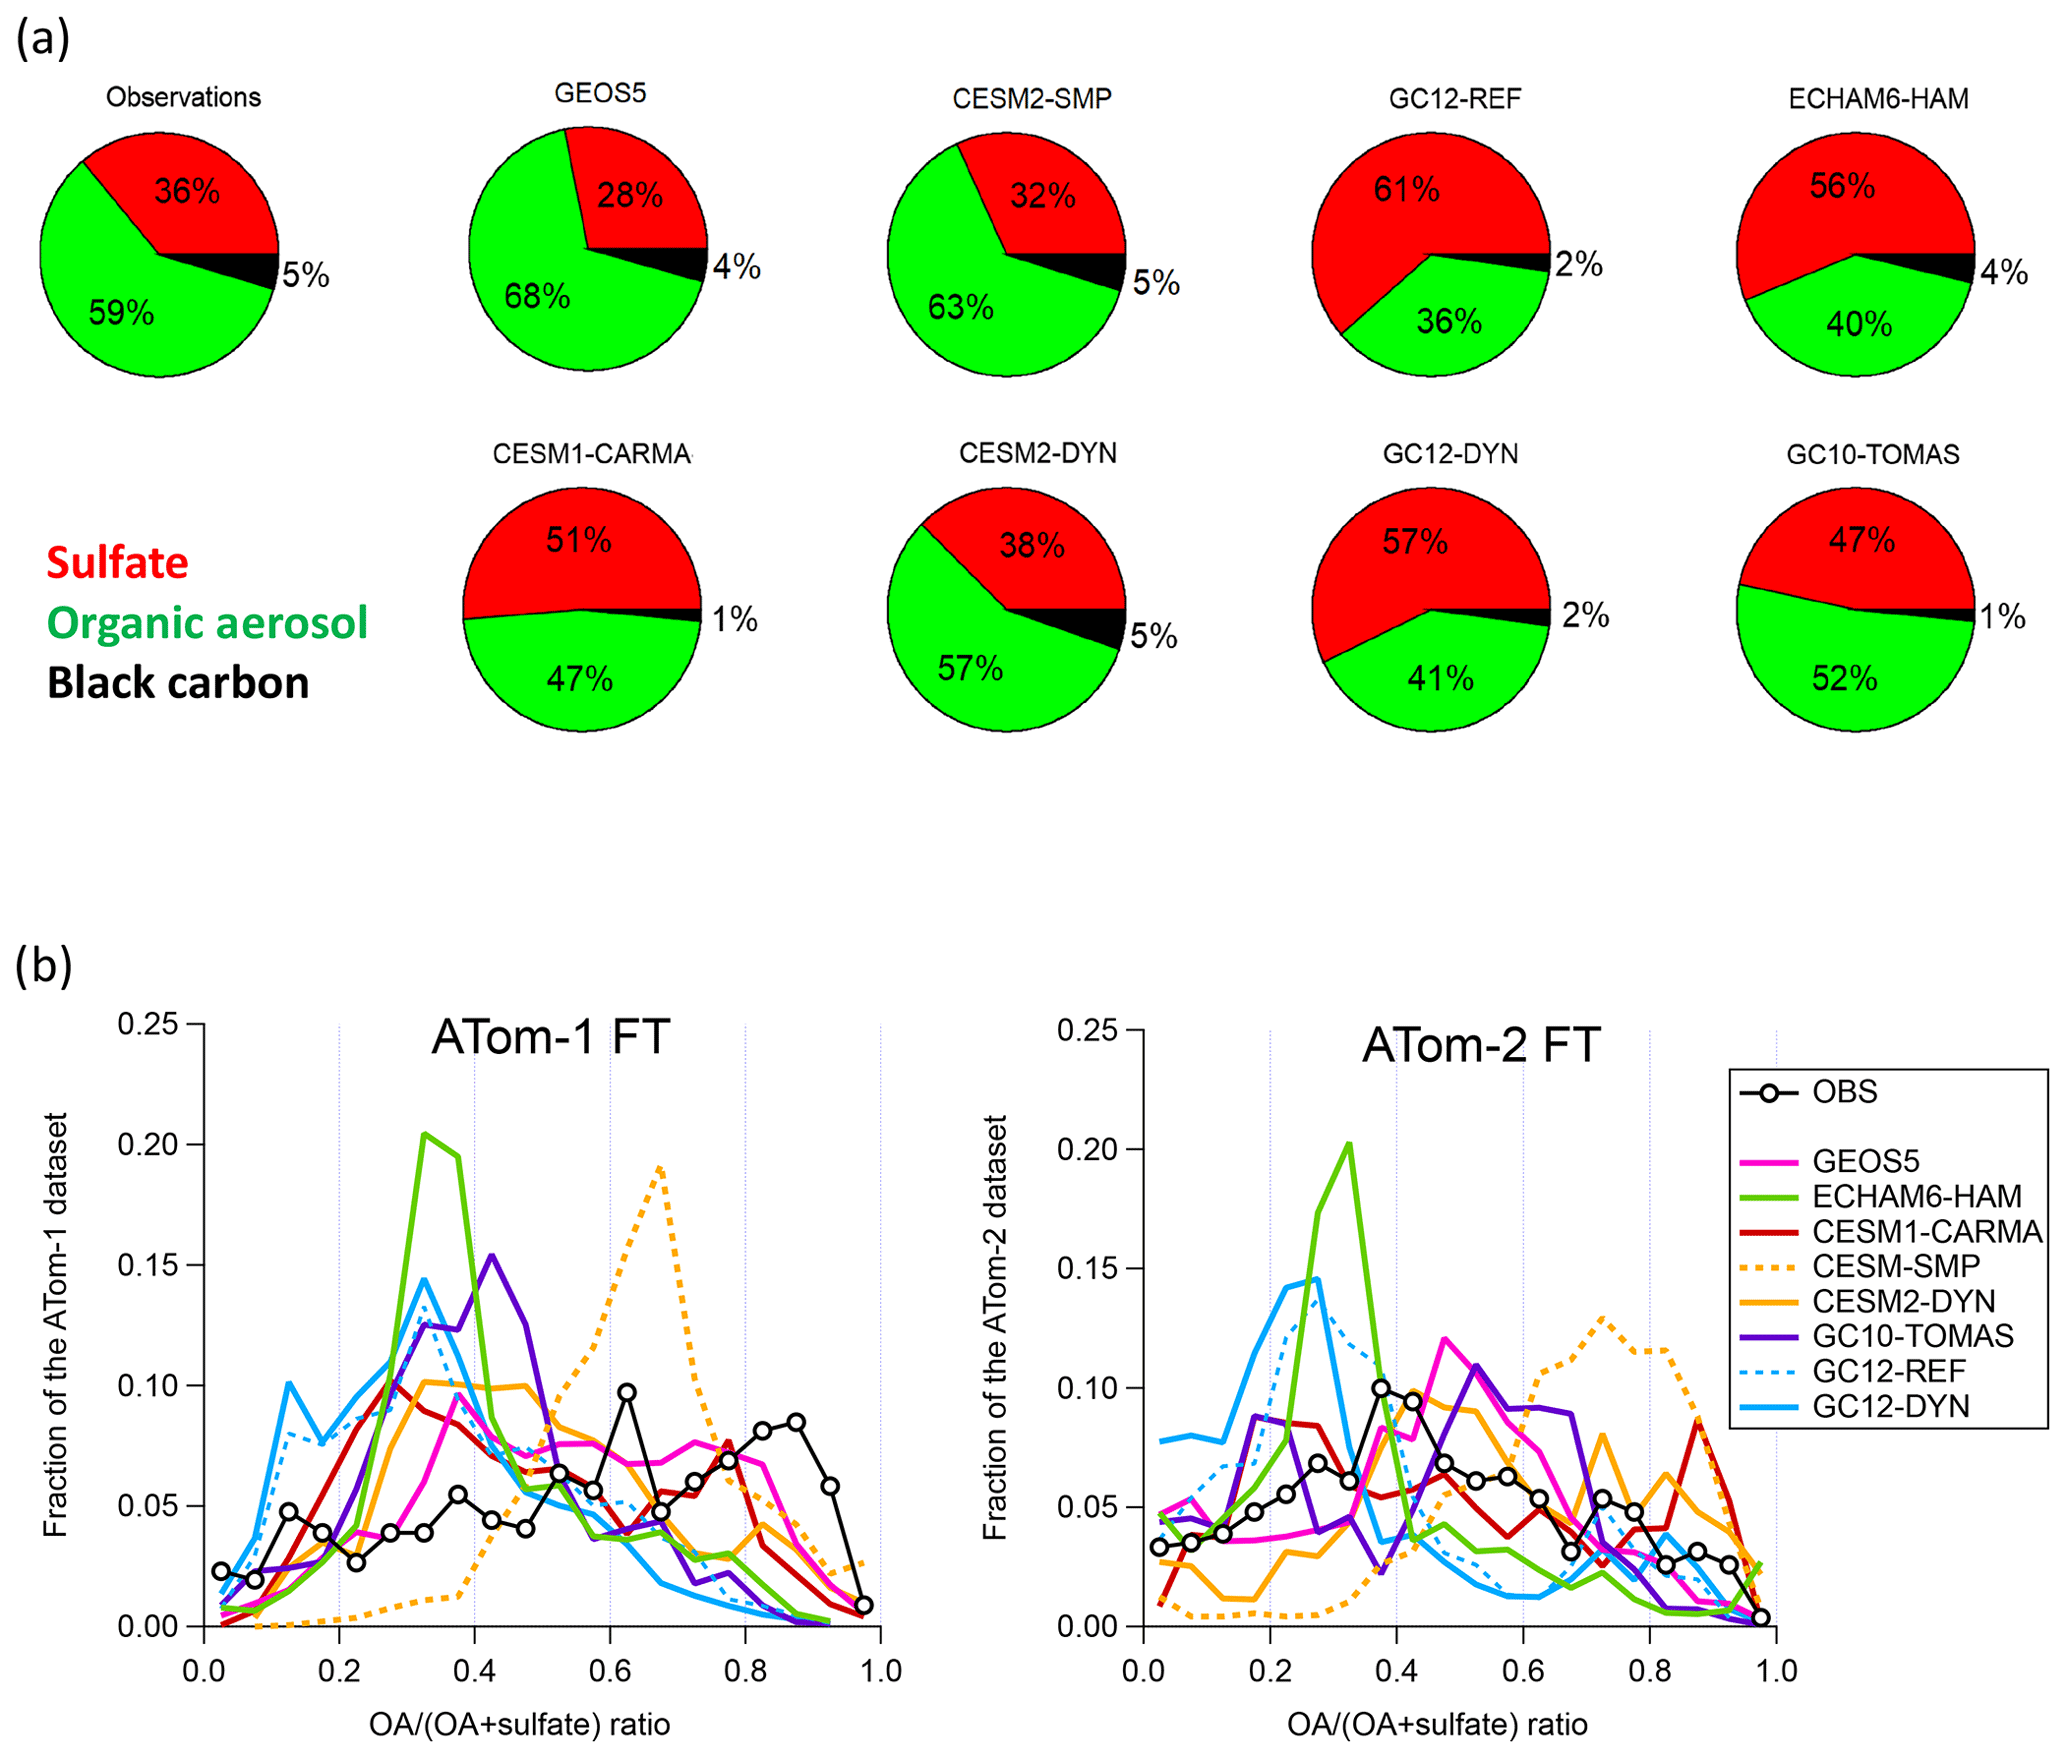
Figure 9(a) Predicted and measured composition of submicron aerosols in the free troposphere as a function of the submicron aerosol mass concentrations during ATom-1. (b) Frequency distribution of the observed and simulated ratio of organic to organic plus sulfate aerosols in the free troposphere during ATom-1 and ATom-2.
4.6 OA and sulfate relative contributions in FT
Finally, we assess the model ability to predict relative amounts of OA and sulfate in the free troposphere where they are the two major constituents of submicron aerosol (Fig. 2b). Accurate predictions of their relative contributions are crucial to determine the hygroscopicity of submicron aerosol and its ability to serve as cloud condensation nuclei (CCN) in the remote free troposphere (Carslaw et al., 2013; Brock et al., 2016).
Figure 9a compares the average measured relative fractions of sulfate (36 %) and carbonaceous aerosols (OA =59 % and BC =5 %) in the FT with those predicted by individual models during ATom-1. The CESM2 models best reproduce the observed relative contributions, with a slight underestimation of OA (57 % instead of 59 %) for CESM2-DYN and a slight overestimation of OA (63 % instead of 59 %) for CESM2-SMP. GEOS5 has 15 % more OA relative to sulfate than observed. All other models underestimate both OA and BC relative fractions. For instance, in GC12-REF and GC12-DYN, both the BC and OA fractions are ∼40 % (relative) lower than observed.
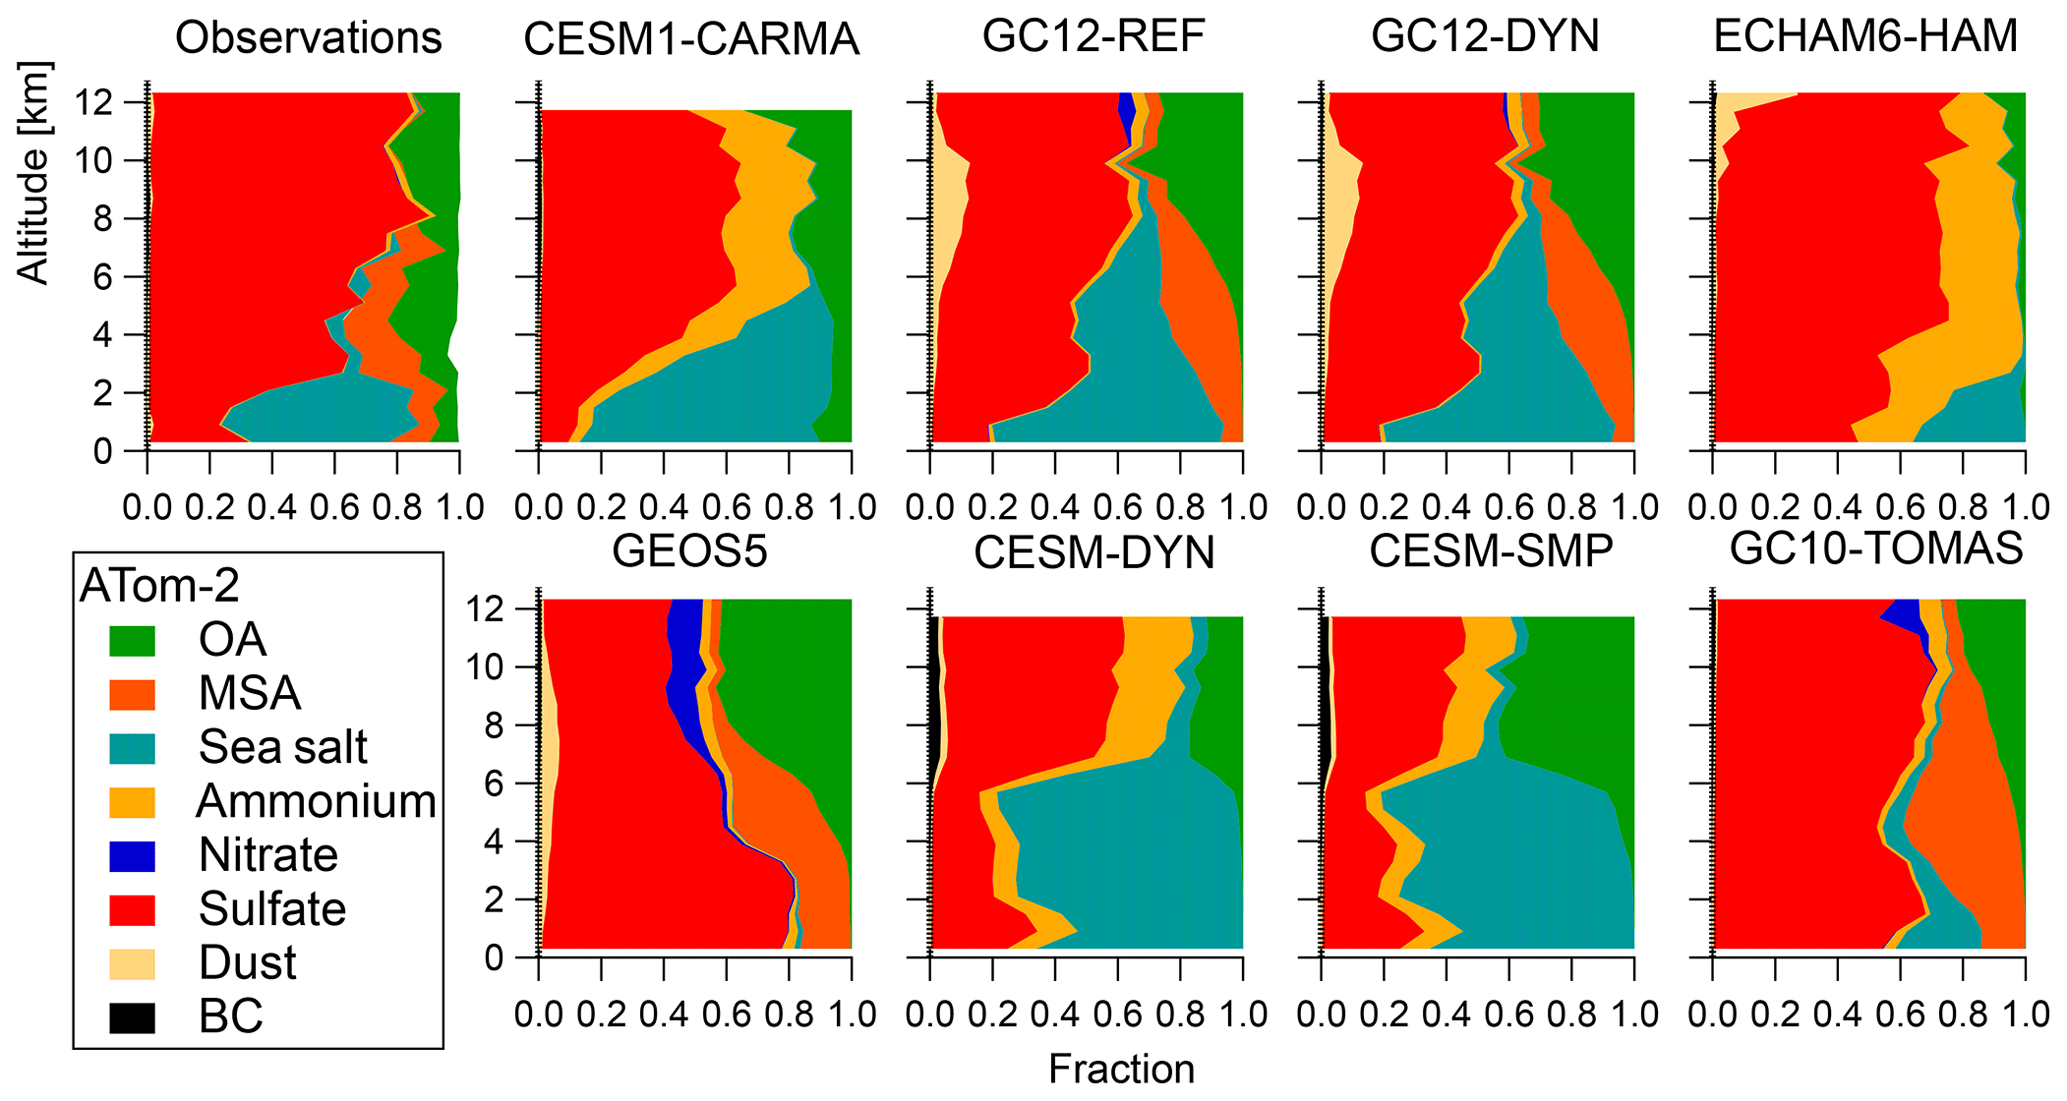
Figure 10Comparison of the measured and predicted composition of submicron aerosols as a function of altitude over the remote Southern Ocean region during NH Winter (ATom-2). For models that do not calculate ammonium in the aerosol (such as CESM1-CARMA, CESM2-SMP, CESM2-DYN, and ECHAM6-HAM), ammonium was estimated from the sulfate mass assuming the formation of ammonium sulfate. Note that while the modeled and measured submicron sea salt size ranges agree fairly well (Table 1), this is not quite the case for dust. Given that the accumulation-mode dust in the models presented contains larger sizes than the AMS range (<500 nm), it is expected that the modeled dust concentration will be larger than measured.
Figure 9b shows the frequency distribution of the observed and predicted fractions of OA relative to sulfate during ATom-1 and ATom-2 in the free troposphere. Most models fail to reproduce the relatively uniform nature of the observed distributions during ATom-1, with typically narrower model shapes around a preferred ratio. The NH summer measurements indicate that OA is greater than sulfate in ∼55 % of the samples (consistent with Fig. 2b), while models generally tend to underestimate the relative OA contribution. In particular, GEOS-Chem and ECHAM6-HAM tend to overestimate the relative contribution of sulfate. Better agreement is found for GEOS5, CESM1-CARMA, and CESM2-DYN, which more closely follow the shape of the observed distribution. The comparisons also suggest that the more complex SOA treatment of SOA formation and removal proposed by Hodzic et al. (2016) in the same host model leads to improved agreement with observations (e.g., CESM2-DYN vs. CESM2-SMP; GC12-DYN vs. GC12-REF). It should be noted that CESM2-SMP uses fixed SOA yields that were increased by 50 % as suggested by Liu et al. (2012), leading to an overestimation of the relative contribution of OA compared to that of sulfate in the free troposphere. During the NH winter (ATom-2), measurements show a somewhat higher proportion of sulfate aerosols (vs. ATom-1), which is consistent with a slower production of SOA in the NH during winter and a reduced influence of biomass burning. Similar conclusions are found for the evaluation of different models. It is worth mentioning that the comparison performed for the whole ATom-1 and ATom-2 dataset (not shown) leads to similar results, with an even slightly stronger overestimation of the sulfate relative contribution compared to OA.
The discrepancies between the observed and predicted composition of submicron aerosol over remote regions can be quite large for other constituents as well. Figure 10 shows the comparison of the measured and predicted composition of submicron aerosol over the Southern Ocean (during the NH winter) where the disagreement in simulated sea salt, nitrates, ammonium, and MSA often exceeds the contribution of OA. While the observations show a more uniform distribution of non-marine aerosol with higher values in the middle and upper troposphere, respectively, most models tend to simulate the highest fractions of OA (and sulfate) towards the tropopause. This may also be explained by the uncertainties in the modeled wet removal of aerosol discussed above. Specific studies have discussed and continue to investigate the ATom measurements and simulations of different components in more detail, including particle number (Williamson et al., 2019), black carbon (Katich et al., 2018; Ditas et al., 2018), MSA (Hodshire et al., 2019a), sulfate–nitrate–ammonium (Nault et al., 2019), and sea salt (Yu et al., 2019; Bian et al., 2019; Murphy et al., 2019).
Our understanding and representation in global models of the life cycle of OA remain highly uncertain, especially in remote regions where constraints from measurements have been very sparse. We have performed a systematic evaluation of the performance of eight global chemistry–climate models and of 28 AeroCom-II models in simulating the latitudinal and vertical distribution of OA and its composition in the remote regions of the Atlantic and Pacific marine boundary layer, free troposphere, and lower stratosphere using the unique measurements from the ATom campaign. Our simulations are conducted for both ATom-1 and ATom-2 deployments that took place in August 2016 and February 2017, respectively. The main conclusions of the comparison are as follows.
The AeroCom-II ensemble average tends to be biased high by a factor of 2–5 in comparison to measured vertical OA profiles in the remote atmosphere during both NH summer and NH winter. The ensemble spread increases from a factor of 40 in the NH source regions to a factor of 1000 in remote regions of the Southern Ocean. The evaluation of AeroCom-II models in remote regions provides an extension of the previous evaluation with continental ground data by Tsigaridis et al. (2014). We note that the data from the AeroCom-II models were based on monthly mean values from a different simulated year than the ATom campaigns; however, the consistent model biases are strong enough that we would not expect our conclusions to change for a different modeled year.
The results of the ATom model ensemble used in this work show much better agreement with the OA observations in all regions and reduced model variability. However, some of the agreement is for the wrong reasons, as most models severely overestimate the contribution of POA and underestimate the contribution of SOA to total OA. Sensitivity simulations indicate that the POA overestimate in CESM could be due to an inadequate representation of primary aerosol removal by convective clouds (additional convective removal per Yu et al., 2019, in CESM1-CARMA led to better agreement with observations). Most models have insufficient production of SOA, and sensitivity studies indicate that a stronger production of SOA is needed to capture the measured concentrations. The photochemical aging of POA, which was not considered here (unlike for SOA), could also contribute to the model overestimation. The non-volatile POA treatment in models is consistent with the assumption of inert POA particles used to estimate POA from measurements and cannot explain the model bias. Indeed, sensitivity simulations with semi-volatile POA lead to a much larger model bias for OA in the upper troposphere and remote regions. The compensation between errors in POA and SOA in remote regions is, however, a recurring issue in OA modeling (de Gouw and Jimenez, 2009). For instance, it was found in urban outflow regions such as Mexico City during the MILAGRO 2006 field campaign (Fast et al., 2009; Hodzic et al., 2009), Paris during MEGAPOLI 2009 (Zhang et al., 2013), the Los Angeles area during CalNex-2010 (Baker et al., 2015; Woody et al., 2016), and the NE US outflow during WINTER 2015 (Schroder et al., 2018; Shah et al., 2019).
Additional errors in simulated OA concentrations can arise from the use of OA ∕ OC ratios that are too low when model results (often calculated as OC) are converted to OA for comparison with measurements. We note that OA is the most atmospherically relevant quantity, while OC is an operational quantity, partially a relic from a period in which only OC could be separately quantified (although also of some use for carbon budget studies). It should also be noted that most emission inventories still use OC as the primary variable, which is why the use of accurate OA ∕ OC ratios is still key for all models. We show that the OA ∕ OC ratio used in most models is too low compared to measured values that range mostly from 2.2 to 2.5, resulting in errors in OA mass of ∼70 % for AeroCom-II models and ∼30 % for current models that use organic carbon to track OA mass. Remote OA is thus highly oxidized and chemically processed. These results demonstrate that current global chemistry–climate models underestimate the degree of oxidation of OA in remote regions and need to consider further chemical aging of OA, which could impact the calculations of its burden and optical and hygroscopic properties.
The results also show that in most models (except CESM2) the predicted OA contribution to the total submicron aerosol is underestimated relative to sulfate in the remote FT where OA and sulfate are the dominant submicron aerosols (important for climate). Accurate predictions of the composition of submicron particles remains challenging in remote regions and should be the topic of future studies.
The key implications of our results are the following: (i) model errors on the relative contribution of POA and SOA to OA reduce our confidence in the ability to simulate radiative forcing over time or OA health impacts; (ii) model errors for the relative contributions of sulfate and organics to the submicron aerosol in the free troposphere could lead to errors in the predicted CCN or radiative forcing of aerosols as inorganics are more hygroscopic than OA; and (iii) the OA system seems to be more dynamic with a need for an enhanced removal of primary OA and a stronger production of secondary OA in global models to provide better agreement with observations.
Data can be obtained from the ATom data repository at the NASA/ORNL DAAC: https://doi.org/10.3334/ORNLDAAC/1581 (Wofsy et al., 2018).
All Global Modeled and HR-AMS Measured OA concentrations and related properties data for ATom used in this publication is archived at ORNL DAAC, Oak Ridge, Tennessee, USA: https://doi.org/10.3334/ORNLDAAC/1795 (Campuzano-Jost et al., 2020).
The supplement related to this article is available online at: https://doi.org/10.5194/acp-20-4607-2020-supplement.
AH, PCJ, and JLJ performed the measurement–model comparisons and wrote and revised the paper. PCJ, DAD, BNN, JCS, DTS, and JLJ performed and analyzed the AMS measurements. KDF and GPS performed and analyzed the PALMS measurements. JPS and JMK performed the BC measurements. HB, MC, PRC, BH, AH, DSJ, JKK, JRP, ER, JS, IT, ST, KT, and PY provided model output. All authors provided comments on the paper.
The authors declare that they have no conflict of interest.
This paper has not been reviewed by the EPA, and no endorsement should be inferred.
The authors want to thank the ATom leadership team and the NASA logistics and flight crew for their contributions to the success of ATom. The authors acknowledge Rebecca Buchholz (NCAR) for providing the emissions used for the CESM2 simulations. We thank Charles Brock (NOAA), Christina Williamson (NOAA), and Agnieszka Kupc (U. of Vienna, Austria) for the aerosol volume data, Paul Wennberg (Caltech) for HCN data, and Eric Apel and Rebecca Hornbrook (NCAR) for the CH3CN data used in Fig. S20. We thank Daniel Murphy (NOAA) for useful discussions. We would like to acknowledge high-performance computing support from Cheyenne provided by NCAR's Computational and Information Systems Laboratory.
This research was supported by the National Center for Atmospheric Research, which is operated by the University Corporation for Atmospheric Research on behalf of the National Science Foundation, NASA (grant nos. NNX15AH33A, NNX15AJ23G, and 80NSSC19K0124), the DOE (grant nos. DE-SC0016559, DE-SC0019000), the ERC (grant no. 819169), and EPA STAR (grant no. 835877010).
This paper was edited by Sergey A. Nizkorodov and reviewed by three anonymous referees.
Aiken, A. C., DeCarlo, P. F., Kroll, J. H., Worsnop, D. R., Huffman, J. A., Docherty, K., Ulbrich, I. M., Mohr, C., Kimmel, J. R., Sueper, D., Zhang, Q., Sun, Y., Trimborn, A., Northway, M., Ziemann, P. J., Canagaratna, M. R., Onasch, T. B., Alfarra, R., Prevot, A. S. H., Dommen, J., Duplissy, J., Metzger, A., Baltensperger, U., and Jimenez, J. L.: O∕C and OM/OC Ratios of Primary, Secondary, and Ambient Organic Aerosols with High Resolution Time-of-Flight Aerosol Mass Spectrometry, Environ. Sci. Technol., 42, 4478–4485, https://doi.org/10.1021/es703009q, 2008.
Andreae, M. O.: Emission of trace gases and aerosols from biomass burning – an updated assessment, Atmos. Chem. Phys., 19, 8523–8546, https://doi.org/10.5194/acp-19-8523-2019, 2019.
Bahreini, R., Ervens, B., Middlebrook, A. M., Warneke, C., de Gouw, J. A., DeCarlo, P. F., Jimenez, J. L., Brock, C. A., Neuman, J. A., Ryerson, T. B., Stark, H., Atlas, E., Brioude, J., Fried, A., Holloway, J. S., Peischl, J., Richter, D., Walega, J., Weibring, P., Wollny, A. G., and Fehsenfeld, F. C.: Organic aerosol formation in urban and industrial plumes near Houston and Dallas, Texas, J. Geophys. Res., 114, D00F16, https://doi.org/10.1029/2008JD011493, 2009.
Baker, K. R., Carlton, A. G., Kleindienst, T. E., Offenberg, J. H., Beaver, M. R., Gentner, D. R., Goldstein, A. H., Hayes, P. L., Jimenez, J. L., Gilman, J. B., de Gouw, J. A., Woody, M. C., Pye, H. O. T., Kelly, J. T., Lewandowski, M., Jaoui, M., Stevens, P. S., Brune, W. H., Lin, Y.-H., Rubitschun, C. L., and Surratt, J. D.: Gas and aerosol carbon in California: comparison of measurements and model predictions in Pasadena and Bakersfield, Atmos. Chem. Phys., 15, 5243–5258, https://doi.org/10.5194/acp-15-5243-2015, 2015.
Bey I., Jacob, D. J., Yantosca, R. M., Logan, J. A., Field, D. B., Fiore, A. M., Li, Q. B., Liu, H. G. Y., Mickley, L. J., and Schultz, M. G.: : Global modeling of tropospheric chemistry with assimilated meteorology: model description and evaluation, J. Geophys. Res., 106, 23073–23095, https://doi.org/10.1029/2001jd000807, 2001.
Bian, H., Chin, M., Hauglustaine, D. A., Schulz, M., Myhre, G., Bauer, S. E., Lund, M. T., Karydis, V. A., Kucsera, T. L., Pan, X., Pozzer, A., Skeie, R. B., Steenrod, S. D., Sudo, K., Tsigaridis, K., Tsimpidi, A. P., and Tsyro, S. G.: Investigation of global particulate nitrate from the AeroCom phase III experiment, Atmos. Chem. Phys., 17, 12911–12940, https://doi.org/10.5194/acp-17-12911-2017, 2017.
Bian, H., Froyd, K., Murphy, D. M., Dibb, J., Darmenov, A., Chin, M., Colarco, P. R., da Silva, A., Kucsera, T. L., Schill, G., Yu, H., Bui, P., Dollner, M., Weinzierl, B., and Smirnov, A.: Observationally constrained analysis of sea salt aerosol in the marine atmosphere, Atmos. Chem. Phys., 19, 10773–10785, https://doi.org/10.5194/acp-19-10773-2019, 2019.
Boucher, O., Randall, D., Artaxo, P., Bretherton, C., Feingold, G., Forster, P., Kerminen, V.-M., Kondo, Y., Liao, H., Lohmann, U., Rasch, P., Satheesh, S. K., Sherwood, S., Stevens, B., and Zhang, X. Y.: Clouds and Aerosols, in: Climate Change 2013: The Physical Science Basis. Contribution of Working Group I to the Fifth Assessment Report of the Intergovernmental Panel on Climate Change, edited by: Stocker, T. F., Qin, D., Plattner, G.-K., Tignor, M., Allen, S. K., Boschung, J., Nauels, A., Xia, Y., Bex, V., and Midgley, P. M., Cambridge University Press, Cambridge, United Kingdom and New York, NY, USA, 2013.
Bowman, K. P.: Large-scale isentropic mixing properties of the Antarctic polar vortex from analyzed winds, J. Geophys. Res., 98, 23013–23027, 1993.
Brock, C. A., Wagner, N. L., Anderson, B. E., Attwood, A. R., Beyersdorf, A., Campuzano-Jost, P., Carlton, A. G., Day, D. A., Diskin, G. S., Gordon, T. D., Jimenez, J. L., Lack, D. A., Liao, J., Markovic, M. Z., Middlebrook, A. M., Ng, N. L., Perring, A. E., Richardson, M. S., Schwarz, J. P., Washenfelder, R. A., Welti, A., Xu, L., Ziemba, L. D., and Murphy, D. M.: Aerosol optical properties in the southeastern United States in summer – Part 1: Hygroscopic growth, Atmos. Chem. Phys., 16, 4987–5007, https://doi.org/10.5194/acp-16-4987-2016, 2016.
Brock, C. A., Williamson, C., Kupc, A., Froyd, K. D., Erdesz, F., Wagner, N., Richardson, M., Schwarz, J. P., Gao, R.-S., Katich, J. M., Campuzano-Jost, P., Nault, B. A., Schroder, J. C., Jimenez, J. L., Weinzierl, B., Dollner, M., Bui, T., and Murphy, D. M.: Aerosol size distributions during the Atmospheric Tomography Mission (ATom): methods, uncertainties, and data products, Atmos. Meas. Tech., 12, 3081–3099, https://doi.org/10.5194/amt-12-3081-2019, 2019.
Canagaratna, M. R., Jayne, J. T., Jimenez, J. L., Allan, J. D., Alfarra, M. R., Zhang, Q., Onasch, T. B., Drewnick, F., Coe, H., Middlebrook, A. M., Delia, A., Williams, L. R., Trimborn, A. M., Northway, M. J., DeCarlo, P. F., Kolb, C. E., Davidovits, P., and Worsnop, D. R.: Chemical and microphysical characterization of ambient aerosols with the Aerodyne Aerosol Mass Spectrometer, Mass Spectrom. Rev., 26, 185–222, https://doi.org/10.1002/mas.20115, 2007.
Canagaratna, M. R., Jimenez, J. L., Kroll, J. H., Chen, Q., Kessler, S. H., Massoli, P., Hildebrandt Ruiz, L., Fortner, E., Williams, L. R., Wilson, K. R., Surratt, J. D., Donahue, N. M., Jayne, J. T., and Worsnop, D. R.: Elemental ratio measurements of organic compounds using aerosol mass spectrometry: characterization, improved calibration, and implications, Atmos. Chem. Phys., 15, 253–272, https://doi.org/10.5194/acp-15-253-2015, 2015.
Campuzano-Jost, P., Hodzic, A., Huisheng, B., Chin, M., Colarco, P., Day, D. A., Froyd, K. D., Heinold, B., Jo, D. S., Katich, J. M., Kodros, J. K., Nault, B. A., Pierce, J. R., Ray, E. A., Schacht, J., Schill, G., Schroder, J. C., Schwarz, J. P., Tegen, I., Tilmes, S., Tsigaridis, K., Yu, P., and Jimenez, J. L.: ATom: Global Modeled and HR-AMS Measured OA concentrations and related properties, ORNL DAAC, Oak Ridge, Tennessee, USA, https://doi.org/10.3334/ORNLDAAC/1795, 2020.
Carslaw, K. S., Lee, L. a, Reddington, C. L., Pringle, K. J., Rap, A., Forster, P. M., Mann, G. W., Spracklen, D. V, Woodhouse, M. T., Regayre, L., and Pierce, J. R.: Large contribution of natural aerosols to uncertainty in indirect forcing, Nature, 503, 67–71, https://doi.org/10.1038/nature12674, 2013.
Colarco, P., da Silva, A., Chin, M., and Diehl, T.: Online simulations of global aerosol distributions in the NASA GEOS-4 model and comparisons to satellite and ground based aerosol optical depth, J. Geophys. Res., 115, D14207, https://doi.org/10.1029/2009JD012820, 2010.
Croft, B., Lohmann, U., Martin, R. V., Stier, P., Wurzler, S., Feichter, J., Hoose, C., Heikkilä, U., van Donkelaar, A., and Ferrachat, S.: Influences of in-cloud aerosol scavenging parameterizations on aerosol concentrations and wet deposition in ECHAM5-HAM, Atmos. Chem. Phys., 10, 1511–1543, https://doi.org/10.5194/acp-10-1511-2010, 2010.
Cubison, M. J., Ortega, A. M., Hayes, P. L., Farmer, D. K., Day, D., Lechner, M. J., Brune, W. H., Apel, E., Diskin, G. S., Fisher, J. A., Fuelberg, H. E., Hecobian, A., Knapp, D. J., Mikoviny, T., Riemer, D., Sachse, G. W., Sessions, W., Weber, R. J., Weinheimer, A. J., Wisthaler, A., and Jimenez, J. L.: Effects of aging on organic aerosol from open biomass burning smoke in aircraft and laboratory studies, Atmos. Chem. Phys., 11, 12049–12064, https://doi.org/10.5194/acp-11-12049-2011, 2011.
DeCarlo, P., Slowik, J., Worsnop, D., Davidovits, P., Jimenez, J., Stainken, K., Williams, L., Jayne, J., Kolb, C., and Rudich, Y.: Particle Morphology and Density Characterization by Combined Mobility and Aerodynamic Diameter Measurements. Part 1: Theory, Aerosol Sci. Tech., 38, 1185–1205, https://doi.org/10.1080/027868290903907, 2004.
DeCarlo, P. F., Kimmel, J. R., Trimborn, A., Northway, M. J., Jayne, J. T., Aiken, A. C., Gonin, M., Fuhrer, K., Horvath, T., Docherty, K. S., Worsnop, D. R., and Jimenez, J. L.: Field-Deployable, High-Resolution, Time-of-Flight Aerosol Mass Spectrometer, Anal. Chem., 78, 8281–8289, https://doi.org/10.1021/ac061249n, 2006.
de Gouw, J. and Jimenez, J. L.: Organic Aerosols in the Earth's Atmosphere, Environ. Sci. Technol., 43, 7614–7618, https://doi.org/10.1021/es9006004, 2009.
Dentener, F., Kinne, S., Bond, T., Boucher, O., Cofala, J., Generoso, S., Ginoux, P., Gong, S., Hoelzemann, J. J., Ito, A., Marelli, L., Penner, J. E., Putaud, J.-P., Textor, C., Schulz, M., van der Werf, G. R., and Wilson, J.: Emissions of primary aerosol and precursor gases in the years 2000 and 1750 prescribed data-sets for AeroCom, Atmos. Chem. Phys., 6, 4321–4344, https://doi.org/10.5194/acp-6-4321-2006, 2006.
Ditas, J., Ma, N., Zhang, Y., Assmann, D., Neumaier, M., Riede, H., Karu, E., Williams, J., Scharffe, D., Wang, Q., Saturno, J., Schwarz, J. P., Katich, J. M., McMeeking, G. R., Zahn, A., Hermann, M., Brenninkmeijer, C. A. M., Andreae, M. O., Pöschl, U., Su, H.. and Cheng, Y.: Strong impact of wildfires on the abundance and aging of black carbon in the lowermost stratosphere, P. Natl. Acad. Sci. USA, 115, E11595–E11603, https://doi.org/10.1073/pnas.1806868115, 2018.
Drewnick, F., Hings, S. S., Alfarra, M. R., Prevot, A. S. H., and Borrmann, S.: Aerosol quantification with the Aerodyne Aerosol Mass Spectrometer: detection limits and ionizer background effects, Atmos. Meas. Tech., 2, 33–46, https://doi.org/10.5194/amt-2-33-2009, 2009.
Emmons, L. K., Schwantes, R. H., Orlando, J. J., Tyndall, G., Kinnison, D. E., Lamarque, J.-F., Marsh, D. R., Mills, M. J., Tilmes, S., Bardeen, C., Buchholz, R. R., Conley, A., Gettelan, A, Garcia, R., Simpson, I., Blake, D. R., Meinard, S., Petron, G.: The Chemistry Mechanism in the Community Earth System Model version 2 (CESM2), J. Adv. Model. Earth Sy., https://doi.org/10.1029/2019MS001882, accepted, 2020.
Farmer, D. K., A. Matsunaga, K.S. Docherty, J.D. Surratt, J.H. Seinfeld, P. J. Ziemann, and Jimenez, J. L.: Response of an Aerosol Mass Spectrometer to Organonitrates and Organosulfates and implications for Atmospheric Chemistry, P. Natl. Acad. Sci. USA, 107, 6670–6675, https://doi.org/10.1073/pnas.0912340107, 2010.
Fast, J., Aiken, A. C., Allan, J., Alexander, L., Campos, T., Canagaratna, M. R., Chapman, E., DeCarlo, P. F., de Foy, B., Gaffney, J., de Gouw, J., Doran, J. C., Emmons, L., Hodzic, A., Herndon, S. C., Huey, G., Jayne, J. T., Jimenez, J. L., Kleinman, L., Kuster, W., Marley, N., Russell, L., Ochoa, C., Onasch, T. B., Pekour, M., Song, C., Ulbrich, I. M., Warneke, C., Welsh-Bon, D., Wiedinmyer, C., Worsnop, D. R., Yu, X.-Y., and Zaveri, R.: Evaluating simulated primary anthropogenic and biomass burning organic aerosols during MILAGRO: implications for assessing treatments of secondary organic aerosols, Atmos. Chem. Phys., 9, 6191–6215, https://doi.org/10.5194/acp-9-6191-2009, 2009.
Feng, L., Smith, S. J., Braun, C., Crippa, M., Gidden, M. J., Hoesly, R., Klimont, Z., van Marle, M., van den Berg, M., and van der Werf, G. R.: The generation of gridded emissions data for CMIP6, Geosci. Model Dev., 13, 461–482, https://doi.org/10.5194/gmd-13-461-2020, 2020.
Flamant, C., Knippertz, P., Fink, A. H., Akpo, A., Brooks, B., Chiu, C. J., Coe, H., Danuor, S., Evans, M., Jegede, O., Kalthoff, N., Konareì, A., Liousse, C., Lohou, F., Mari, C., Schlager, H., Schwarzenboeck, A., Adler, B., Amekudzi, L., Aryee, J., Ayoola, M., Batenburg, A. M., Bessardon, G., Borrmann, S., Brito, J., Bower, K., Burnet, F., Catoire, V., Colomb, A., Den- jean, C., Fosu-Amankwah, K., Hill, P. G., Lee, J., Lothon, M., Maranan, M., Marsham, J., Meynadier, R., Ngamini, J.-B., Rosenberg, P., Sauer, D., Smith, V., Stratmann, G., Taylor, J. W., Voigt, C., and Yoboueì, V.: The Dynamics-Aerosol-Chemistry- Cloud Interactions in West Africa field campaign: Overview and research highlights, B. Am. Meteorol. Soc., 99, 83–104, https://doi.org/10.1175/BAMS-D-16-0256.1, 2018.
Forrister, H., Liu, J., Scheuer, E., Dibb, J., Ziemba, L., Thornhill, K. L., Anderson, B., Diskin, G., Perring, A. E., Schwarz, J. P., Campuzano-Jost, P., Day, D. A., Palm, B. B., Jimenez, J. L., Nenes, A., and Weber, R. J.: Evolution of brown carbon in wildfire plumes, Geophys. Res. Lett., 42, 4623–4630, https://doi.org/10.1002/2015GL063897, 2015.
Fountoukis, C. and Nenes, A.: ISORROPIA II: a computationally efficient thermodynamic equilibrium model for K+–Ca2+–Mg2+––Na+–––Cl−–H2O aerosols, Atmos. Chem. Phys., 7, 4639–4659, https://doi.org/10.5194/acp-7-4639-2007, 2007.
Froyd, K. D., Murphy, D. M., Brock, C. A., Campuzano-Jost, P., Dibb, J. E., Jimenez, J.-L., Kupc, A., Middlebrook, A. M., Schill, G. P., Thornhill, K. L., Williamson, C. J., Wilson, J. C., and Ziemba, L. D.: A new method to quantify mineral dust and other aerosol species from aircraft platforms using single-particle mass spectrometry, Atmos. Meas. Tech., 12, 6209–6239, https://doi.org/10.5194/amt-12-6209-2019, 2019.
George, I. J. and Abbatt, J. P. D.: Heterogeneous oxidation of atmospheric aerosol particles by gas-phase radicals, Nat. Chem., 2, 713–722, 2010.
Gerber, H. E.: Relative-humidity parameterization of the Navy Aerosol Model (NAM), Tech. Rep. NRL Report 8956, Naval Research Laboratory, 1985.
Gettelman, A., Mills, M. J., Kinnison, D. E., Garcia, R. R., Smith, A. K., Marsh, D. R., Tilmes, S., Vitt, F., Bardeen, C. G., McInerny, J., Liu, H.-L., Solomon, S. C., Polvani, L. M., Emmons, L. K., Lamarque, J.-F., Richter, J. H., Glanville, A. S., Bacmeister, J. T., Phillips, A. S., Neale, R. B., Simpson, I. R., DuVivier, A. K., Hodzic, A., and Randel, W. J.: The Whole Atmosphere Community Climate Model Version 6 (WACCM6), J. Geophys. Res., 124, 12380–12403, https://doi.org/doi.org.10.1029/2019JD030943, 2019.
Giglio, L., Randerson, J. T., and Werf, G. R.: Analysis of daily, monthly, and annual burned area using the fourth-generation global fire emissions database (GFED4), J. Geophys. Res.-Biogeo., 118, 317–328, 2013.
Guenther, A. B., Jiang, X., Heald, C. L., Sakulyanontvittaya, T., Duhl, T., Emmons, L. K., and Wang, X.: The Model of Emissions of Gases and Aerosols from Nature version 2.1 (MEGAN2.1): an extended and updated framework for modeling biogenic emissions, Geosci. Model Dev., 5, 1471–1492, https://doi.org/10.5194/gmd-5-1471-2012, 2012.
Hallquist, M., Wenger, J. C., Baltensperger, U., Rudich, Y., Simpson, D., Claeys, M., Dommen, J., Donahue, N. M., George, C., Goldstein, A. H., Hamilton, J. F., Herrmann, H., Hoffmann, T., Iinuma, Y., Jang, M., Jenkin, M. E., Jimenez, J. L., Kiendler-Scharr, A., Maenhaut, W., McFiggans, G., Mentel, Th. F., Monod, A., Prévôt, A. S. H., Seinfeld, J. H., Surratt, J. D., Szmigielski, R., and Wildt, J.: The formation, properties and impact of secondary organic aerosol: current and emerging issues, Atmos. Chem. Phys., 9, 5155–5236, https://doi.org/10.5194/acp-9-5155-2009, 2009.
Hayes, P. L., Carlton, A. G., Baker, K. R., Ahmadov, R., Washenfelder, R. A., Alvarez, S., Rappenglück, B., Gilman, J. B., Kuster, W. C., de Gouw, J. A., Zotter, P., Prévôt, A. S. H., Szidat, S., Kleindienst, T. E., Offenberg, J. H., Ma, P. K., and Jimenez, J. L.: Modeling the formation and aging of secondary organic aerosols in Los Angeles during CalNex 2010, Atmos. Chem. Phys., 15, 5773–5801, https://doi.org/10.5194/acp-15-5773-2015, 2015.
Heald, C. L., Coe, H., Jimenez, J. L., Weber, R. J., Bahreini, R., Middlebrook, A. M., Russell, L. M., Jolleys, M., Fu, T.-M., Allan, J. D., Bower, K. N., Capes, G., Crosier, J., Morgan, W. T., Robinson, N. H., Williams, P. I., Cubison, M. J., DeCarlo, P. F., and Dunlea, E. J.: Exploring the vertical profile of atmospheric organic aerosol: comparing 17 aircraft field campaigns with a global model, Atmos. Chem. Phys., 11, 12673–12696, https://doi.org/10.5194/acp-11-12673-2011, 2011.
Hodshire, A., Campuzano-Jost, P., Kodros, J. K., Croft, B., Nault, B. A., Schroder, J. C., Jimenez, J. L., and Pierce, J. R.: The potential role of methanesulfonic acid (MSA) in aerosol formation and growth and the associated radiative forcings, Atmos. Chem. Phys., 19, 3137–3160, https://doi.org/10.5194/acp-19-3137-2019, 2019a.
Hodshire, A., Akherati, A., Alvarado, M., Brown-Steiner, B., Jathar, S., Jimenez, J. L., Kreidenweis, S., Lonsdale, C., Onasch, T., Ortega, A., and Pierce, J.: Aging Effects on Biomass Burning Aerosol Mass and Composition: A Critical Review of Field and Laboratory Studies, Environ. Sci. Technol., 53, 10007–10022, https://doi.org/10.1021/acs.est.9b02588, 2019b.
Hodzic, A., Jimenez, J. L., Madronich, S., Aiken, A. C., Bessagnet, B., Curci, G., Fast, J., Lamarque, J.-F., Onasch, T. B., Roux, G., Schauer, J. J., Stone, E. A., and Ulbrich, I. M.: Modeling organic aerosols during MILAGRO: importance of biogenic secondary organic aerosols, Atmos. Chem. Phys., 9, 6949-6981, https://doi.org/10.5194/acp-9-6949-2009, 2009.
Hodzic, A., Aumont, B., Knote, C., Lee-Taylor, J., Madronich, S., and Tyndall, G.: Volatility dependence of Henry's law constants of condensable organics: Application to estimate depositional loss of secondary organic aerosols, Geophys. Res. Lett., 41, 4795–4804, https://doi.org/10.1002/2014GL060649, 2014.
Hodzic, A., Madronich, S., Kasibhatla, P. S., Tyndall, G., Aumont, B., Jimenez, J. L., Lee-Taylor, J., and Orlando, J.: Organic photolysis reactions in tropospheric aerosols: effect on secondary organic aerosol formation and lifetime, Atmos. Chem. Phys., 15, 9253–9269, https://doi.org/10.5194/acp-15-9253-2015, 2015.
Hodzic, A., Kasibhatla, P. S., Jo, D. S., Cappa, C. D., Jimenez, J. L., Madronich, S., and Park, R. J.: Rethinking the global secondary organic aerosol (SOA) budget: stronger production, faster removal, shorter lifetime, Atmos. Chem. Phys., 16, 7917–7941, https://doi.org/10.5194/acp-16-7917-2016, 2016.
Hoesly, R. M., Smith, S. J., Feng, L., Klimont, Z., Janssens-Maenhout, G., Pitkanen, T., Seibert, J. J., Vu, L., Andres, R. J., Bolt, R. M., Bond, T. C., Dawidowski, L., Kholod, N., Kurokawa, J.-I., Li, M., Liu, L., Lu, Z., Moura, M. C. P., O'Rourke, P. R., and Zhang, Q.: Historical (1750–2014) anthropogenic emissions of reactive gases and aerosols from the Community Emissions Data System (CEDS), Geosci. Model Dev., 11, 369–408, https://doi.org/10.5194/gmd-11-369-2018, 2018.
Huang, K., Fu, J. S., Prikhodko, V. Y., Storey, J. M., Romanov, A., Hodson, E. L., Cresko, J., Morozova, I., Ignatieva, Y., and Cabaniss, J.: Russian anthropogenic black carbon: Emission reconstruction and Arctic black carbon simulation, J. Geophys. Res.-Atmos., 120, 11306–11333, https://doi.org/10.1002/2015JD023358, 2015.
Hudson, P. K., Murphy, D. M., Cziczo, D. J., Thomson, D. S., de Gouw, J. A., Warneke, C., Holloway, J., Jost, H. J., and Hübler, G.: Biomass-burning particle measurements: Characteristics composition and chemical processing, J. Geophys. Res.-Atmos., 109, 1–11, https://doi.org/10.1029/2003JD004398, 2004.
Janssens-Maenhout, G., Crippa, M., Guizzardi, D., Dentener, F., Muntean, M., Pouliot, G., Keating, T., Zhang, Q., Kurokawa, J., Wankmüller, R., Denier van der Gon, H., Kuenen, J. J. P., Klimont, Z., Frost, G., Darras, S., Koffi, B., and Li, M.: HTAP_v2.2: a mosaic of regional and global emission grid maps for 2008 and 2010 to study hemispheric transport of air pollution, Atmos. Chem. Phys., 15, 11411–11432, https://doi.org/10.5194/acp-15-11411-2015, 2015.
Jimenez, J. L., Canagaratna, M. R., Donahue, N. M., Prevot, A. S. H., Zhang, Q., Kroll, J. H., DeCarlo, P. F., Allan, J. D., Coe, H., Ng, N. L., Aiken, A. C., Docherty, K. S., Ulbrich, I. M., Grieshop, A. P., Robinson, A. L., Duplissy, J., Smith, J. D., Wilson, K. R., Lanz, V. A., Hueglin, C., Sun, Y. L., Tian, J., Laaksonen, A., Raatikainen, T., Rautiainen, J., Vaattovaara, P., Ehn, M., Kulmala, M., Tomlinson, J. M., Collins, D. R., Cubison, M. J., Dunlea, J., Huffman, J. A., Onasch, T. B., Alfarra, M. R., Williams, P. I., Bower, K., Kondo, Y., Schneider, J., Drewnick, F., Borrmann, S., Weimer, S., Demerjian, K., Salcedo, D., Cottrell, L., Griffin, R., Takami, A., Miyoshi, T., Hatakeyama, S., Shimono, A., Sun, J. Y., Zhang, Y. M., Dzepina, K., Kimmel, J. R., Sueper, D., Jayne, J. T., Herndon, S. C., Trimborn, A. M., Williams, L. R., Wood, E. C., Middlebrook, A. M., Kolb, C. E., Baltensperger, U., and Worsnop, D. R.: Evolution of Organic Aerosols in the Atmosphere, Science, 80, 1525–1529, https://doi.org/10.1126/science.1180353, 2009.
Jimenez, J. L., Campuzano-Jost, P., Day, D. A., Nault, B. A., Price, D. J., and Schroder, J. C.: ATom: L2 Measurements from CU High-Resolution Aerosol Mass Spectrometer (HR-AMS), ORNL DAAC, Oak Ridge, Tennessee, USA, https://doi.org/10.3334/ORNLDAAC/1716, 2019a.
Jimenez, J. L., Guo, H., Campuzano-Jost, P., Nault, B. A., Day, D. A., Williamson, C. M., Kupc, A., Brock, C. A., Schill, G. P., Froyd, K.D., Murphy, D. M., Scheuer, E., Dibb, J. E., and Katich, J. M.: Evaluating the Consistency of All Submicron Aerosol Mass Measurements (Total and Speciated) in the Atmospheric Tomography Mission (ATom), Abstract A31A-08, 2019 Fall Meeting, AGU, San Francisco, CA, 9–13 December, 2019b.
Jolleys, M. D., Coe, H., McFiggans, G., Taylor, J. W., O'Shea, S. J., Le Breton, M., Bauguitte, S. J.-B., Moller, S., Di Carlo, P., Aruffo, E., Palmer, P. I., Lee, J. D., Percival, C. J., and Gallagher, M. W.: Properties and evolution of biomass burning organic aerosol from Canadian boreal forest fires, Atmos. Chem. Phys., 15, 3077–3095, https://doi.org/10.5194/acp-15-3077-2015, 2015.
Kaiser, J. W., Heil, A., Andreae, M. O., Benedetti, A., Chubarova, N., Jones, L., Morcrette, J.-J., Razinger, M., Schultz, M. G., Suttie, M., and van der Werf, G. R.: Biomass burning emissions estimated with a global fire assimilation system based on observed fire radiative power, Biogeosciences, 9, 527–554, https://doi.org/10.5194/bg-9-527-2012, 2012.
Kanakidou, M., Seinfeld, J. H., Pandis, S. N., Barnes, I., Dentener, F. J., Facchini, M. C., Van Dingenen, R., Ervens, B., Nenes, A., Nielsen, C. J., Swietlicki, E., Putaud, J. P., Balkanski, Y., Fuzzi, S., Horth, J., Moortgat, G. K., Winterhalter, R., Myhre, C. E. L., Tsigaridis, K., Vignati, E., Stephanou, E. G., and Wilson, J.: Organic aerosol and global climate modelling: a review, Atmos. Chem. Phys., 5, 1053–1123, https://doi.org/10.5194/acp-5-1053-2005, 2005.
Katich, J. M., Samset, B. H., Paul Bui, T., Dollner, M., Froyd, K. D., Campuzano-Jost, P., Nault, B. A., Schroder, J. C., Weinzierl, B., and Schwarz, J. P.: Strong Contrast in Remote Black Carbon Aerosol Loadings Between the Atlantic and Pacific Basins, J. Geophys. Res.-Atmos., 123, 13386–13395, https://doi.org/10.1029/2018JD029206, 2018.
Kim, M. J., Novak, G. A., Zoerb, M. C., Yang, M., Blomquist, B. W., Huebert, B. J., Cappa, C. D., and Bertram, T. H.: Air-Sea exchange of biogenic volatile organic compounds and the impact on aerosol particle size distributions, Geophys. Res. Lett., 44, 3887–3896, https://doi.org/10.1002/2017GL072975, 2017.
Klimont, Z., Kupiainen, K., Heyes, C., Purohit, P., Cofala, J., Rafaj, P., Borken-Kleefeld, J., and Schöpp, W.: Global anthropogenic emissions of particulate matter including black carbon, Atmos. Chem. Phys., 17, 8681–8723, https://doi.org/10.5194/acp-17-8681-2017, 2017.
Kodros, J. K., Cucinotta, R., Ridley, D. A., Wiedinmyer, C., and Pierce, J. R.: The aerosol radiative effects of uncontrolled combustion of domestic waste, Atmos. Chem. Phys., 16, 6771–6784, https://doi.org/10.5194/acp-16-6771-2016, 2016.
Krechmer, J. E., Pagonis, D., Ziemann, P. J., and Jimenez, J. L.: Quantification of gas-wall partitioning in Teflon environmental chambers using rapid bursts of low-volatility oxidized species generated in-situ, Environ. Sci. Technol., 50, 5757–5765, https://doi.org/10.1021/acs.est.6b00606, 2016.
Kroll, J. H., Donahue, N. M., Jimenez, J. L., Kessler, S. H., Canagaratna, M. R., Wilson, K. R., Altieri, K. E., Mazzoleni, L. R., Wozniak, A. S., Bluhm, H., Mysak, E. R., Smith, J. D., Kolb, C. E., and Worsnop, D. R.: Carbon oxidation state as a metric for describing the chemistry of atmospheric organic aerosol., Nat. Chem., 3, 133–139, https://doi.org/10.1038/nchem.948, 2011.
Laskin, A., Laskin, J., and Nizkorodov, S.: Chemistry of Atmospheric Brown Carbon, Chem. Rev., 115, 4335–4382, 2015.
Lee, A. K. Y., Willis, M. D., Healy, R. M., Onasch, T. B., and Abbatt, J. P. D.: Mixing state of carbonaceous aerosol in an urban environment: single particle characterization using the soot particle aerosol mass spectrometer (SP-AMS), Atmos. Chem. Phys., 15, 1823–1841, https://doi.org/10.5194/acp-15-1823-2015, 2015.
Liao, J., Froyd, K. D., Murphy, D. M., Keutsch, F. N., Yu, G., Wennberg, P.O., Clair, J. St., Crounse, J. D., Wisthaler, A., Mikoviny, T., Ryerson, T. B., Pollack, I. B., Peischl, J., Jimenez, J. L., Campuzano Jost, P., Day, D. A., Anderson, B. E., Ziemba, L. D., Blake, D. R., Meinardi, S., and Diskin, G.: Airborne organosulfates measurements over the continental US, J. Geophys. Res.-Atmos., 120, 2990–3005, https://doi.org/10.1002/2014JD022378, 2015.
Liu, H. Y., Jacob, D. J., Bey, I., and Yantosca, R. M.: Constraints from Pb-210 and Be-7 on wet deposition and transport in a global three-dimensional chemical tracer model driven by assimilated meteorological fields, J. Geophys. Res., 106, 12109–12128, 2001.
Liu, X., Easter, R. C., Ghan, S. J., Zaveri, R., Rasch, P., Shi, X., Lamarque, J.-F., Gettelman, A., Morrison, H., Vitt, F., Conley, A., Park, S., Neale, R., Hannay, C., Ekman, A. M. L., Hess, P., Mahowald, N., Collins, W., Iacono, M. J., Bretherton, C. S., Flanner, M. G., and Mitchell, D.: Toward a minimal representation of aerosols in climate models: description and evaluation in the Community Atmosphere Model CAM5, Geosci. Model Dev., 5, 709–739, https://doi.org/10.5194/gmd-5-709-2012, 2012.
Marais, E. A., Jacob, D. J., Jimenez, J. L., Campuzano-Jost, P., Day, D. A., Hu, W., Krechmer, J., Zhu, L., Kim, P. S., Miller, C. C., Fisher, J. A., Travis, K., Yu, K., Hanisco, T. F., Wolfe, G. M., Arkinson, H. L., Pye, H. O. T., Froyd, K. D., Liao, J., and McNeill, V. F.: Aqueous-phase mechanism for secondary organic aerosol formation from isoprene: application to the southeast United States and co-benefit of SO2 emission controls, Atmos. Chem. Phys., 16, 1603–1618, https://doi.org/10.5194/acp-16-1603-2016, 2016.
Mauderly, J. L. and Chow, J. C: Health Effects of Organic Aerosols, Inhal. Toxicol., 20, 257–288, https://doi.org/10.1080/08958370701866008, 2008.
Mei, F., Hayes, P. L., Ortega, A., Taylor, J. W., Allan, J. D., Gilman, J., Kuster, W., de Gouw, J., Jimenez, J. L., and Wang, J. : Droplet activation properties of organic aerosols observed at an urban site during CalNex-LA, J. Geophys. Res.-Atmos., 118, 2903–2917, https://doi.org/10.1002/jgrd.50285, 2013.
Middlebrook, A. M., Murphy, D. M., and Thomson, D. S.: Observations of organic material in individual marine particles at Cape Grim during the First Aerosol Characterization Experiment (ACE 1), J. Geophys. Res.-Atmos., 103, 16475–16483, https://doi.org/10.1029/97JD03719, 1998.
Murphy, D. M., Froyd, K. D., Bian, H., Brock, C. A., Dibb, J. E., DiGangi, J. P., Diskin, G., Dollner, M., Kupc, A., Scheuer, E. M., Schill, G. P., Weinzierl, B., Williamson, C. J., and Yu, P.: The distribution of sea-salt aerosol in the global troposphere, Atmos. Chem. Phys., 19, 4093–4104, https://doi.org/10.5194/acp-19-4093-2019, 2019.
Myhre, G., Samset, B. H., Schulz, M., Balkanski, Y., Bauer, S., Berntsen, T. K., Bian, H., Bellouin, N., Chin, M., Diehl, T., Easter, R. C., Feichter, J., Ghan, S. J., Hauglustaine, D., Iversen, T., Kinne, S., Kirkevåg, A., Lamarque, J.-F., Lin, G., Liu, X., Lund, M. T., Luo, G., Ma, X., van Noije, T., Penner, J. E., Rasch, P. J., Ruiz, A., Seland, Ø., Skeie, R. B., Stier, P., Takemura, T., Tsigaridis, K., Wang, P., Wang, Z., Xu, L., Yu, H., Yu, F., Yoon, J.-H., Zhang, K., Zhang, H., and Zhou, C.: Radiative forcing of the direct aerosol effect from AeroCom Phase II simulations, Atmos. Chem. Phys., 13, 1853–1877, https://doi.org/10.5194/acp-13-1853-2013, 2013.
Nault, B. A., Campuzano-Jost, P., Day, D. A., Schroder, J. C., Anderson, B., Beyersdorf, A. J., Blake, D. R., Brune, W. H., Choi, Y., Corr, C. A., de Gouw, J. A., Dibb, J., DiGangi, J. P., Diskin, G. S., Fried, A., Huey, L. G., Kim, M. J., Knote, C. J., Lamb, K. D., Lee, T., Park, T., Pusede, S. E., Scheuer, E., Thornhill, K. L., Woo, J.-H., and Jimenez, J. L.: Secondary organic aerosol production from local emissions dominates the organic aerosol budget over Seoul, South Korea, during KORUS-AQ, Atmos. Chem. Phys., 18, 17769–17800, https://doi.org/10.5194/acp-18-17769-2018, 2018.
Nault, B. A., Campuzano-Jost, P., Day, D. A., Jo, D., Schroder, J. C., Bahreini, R., Bian, H., Chin, M., Clegg, S. L., Coloraco, P. R., Crounse, J. D., Dibb, J. E., Kim, M. J., Kodros, J., Lopez-Hilfiker, F., Marais, E. A., Middlebrook, A. M., Neuman, J. A., Nowak, J. B., Paulot, F., Pierce, J. R., Scheuer, E. M., Thornton, J. A., Tsigaridis, K., Wennberg, P. O., Jimenez, J. L.: Global Observations of Ammonium Balance and pH Indicate More Acidic Conditions and More Liquid Aerosols than Current Models Predict, Abstract A52C-08, 2019 Fall Meeting, AGU, San Francisco, CA, 9-=13 December 2019.
Ovadnevaite, J., Ceburnis, D., Canagaratna, M., Berresheim, H., Bialek, J., Martucci, G., Worsnop, D. R., and O'Dowd, C.: On the effect of wind speed on submicron sea salt mass concentrations and source fluxes, J. Geophys. Res.-Atmos., 117, 1–11, https://doi.org/10.1029/2011JD017379, 2012.
Pai, S. J., Heald, C. L., Pierce, J. R., Farina, S. C., Marais, E. A., Jimenez, J. L., Campuzano-Jost, P., Nault, B. A., Middlebrook, A. M., Coe, H., Shilling, J. E., Bahreini, R., Dingle, J. H., and Vu, K.: An evaluation of global organic aerosol schemes using airborne observations, Atmos. Chem. Phys., 20, 2637–2665, https://doi.org/10.5194/acp-20-2637-2020, 2020.
Palm, B. B., de Sá, S. S., Day, D. A., Campuzano-Jost, P., Hu, W., Seco, R., Sjostedt, S. J., Park, J.-H., Guenther, A. B., Kim, S., Brito, J., Wurm, F., Artaxo, P., Thalman, R., Wang, J., Yee, L. D., Wernis, R., Isaacman-VanWertz, G., Goldstein, A. H., Liu, Y., Springston, S. R., Souza, R., Newburn, M. K., Alexander, M. L., Martin, S. T., and Jimenez, J. L.: Secondary organic aerosol formation from ambient air in an oxidation flow reactor in central Amazonia, Atmos. Chem. Phys., 18, 467–493, https://doi.org/10.5194/acp-18-467-2018, 2018.
Petters, M. D., Prenni, A. J., Kreidenweis, S. M., DeMott, P. J., Matsunaga, A., Lim, Y. B., and Ziemann, P. J. Chemical aging and the hydrophobic-to-hydrophilic conversion of carbonaceous aerosol, Geophys. Res. Lett., 33, L24806, https://doi.org/10.1029/2006GL027249, 2006.
Pye, H. O. T., Chan, A. W. H., Barkley, M. P., and Seinfeld, J. H.: Global modeling of organic aerosol: the importance of reactive nitrogen (NOx and NO3), Atmos. Chem. Phys., 10, 11261–11276, https://doi.org/10.5194/acp-10-11261-2010, 2010.
Schroder, J. C., Campuzano-Jost, P., Day, D. A., Shah, V., Larson, K., Sommers, J. M., Sullivan, A. P., Campos, T., Reeves, J. M., Hills, A., Hornbrook, R. S., Blake, N. J., Scheuer, E., Guo, H., Fibiger, D. L., McDuffie, E. E., Hayes, P. L., Weber, R. J., Dibb, J. E., Apel, E. C., Jaeglé, L., Brown, S. S., Thornton, J. A., and Jimenez, J. L.: Sources and Secondary Production of Organic Aerosols in the Northeastern United States during WINTER, J. Geophys. Res.-Atmos., 123, 7771–7796, https://doi.org/10.1029/2018JD028475, 2018.
Schacht, J., Heinold, B., Quaas, J., Backman, J., Cherian, R., Ehrlich, A., Herber, A., Huang, W. T. K., Kondo, Y., Massling, A., Sinha, P. R., Weinzierl, B., Zanatta, M., and Tegen, I.: The importance of the representation of air pollution emissions for the modeled distribution and radiative effects of black carbon in the Arctic, Atmos. Chem. Phys., 19, 11159–11183, https://doi.org/10.5194/acp-19-11159-2019, 2019.
Schulz, M., Chin, M., and Kinne, S.: The aerosol model comparison project, AeroCom, phase II: clearing up diversity, IGAC Newsletter, 41, 2–11, 2009.
Schwarz, J. P., Samset, B. H., Perring, A. E., Spackman, J. R., Gao, R. S., Stier, P., Schulz, M., Moore, F. L., Ray, E. A., and Fahey, D. W.: Global-scale seasonally resolved black carbon vertical profiles over the Pacific, Geophys. Res. Lett., 40, 5542–5547, https://doi.org/10.1002/2013GL057775, 2013.
Scott, C. E., Rap, A., Spracklen, D. V., Forster, P. M., Carslaw, K. S., Mann, G. W., Pringle, K. J., Kivekäs, N., Kulmala, M., Lihavainen, H., and Tunved, P.: The direct and indirect radiative effects of biogenic secondary organic aerosol, Atmos. Chem. Phys., 14, 447–470, https://doi.org/10.5194/acp-14-447-2014, 2014.
Shah, V., Jaeglé, L., Jimenez, J. L., Schroder, J. C., Campuzano‐Jost, P., Campos, T. L., Reeves, J. M., Stell, M., Brown, S. S., Lee, B. H., Lopez-Hilfiker, F. D., and Thornton, J. A.: Widespread pollution from secondary sources of organic aerosols during winter in the Northeastern United States, Geophys. Res. Lett., 46, 2974–2983, https://doi.org/10.1029/2018GL081530, 2019.
Shiraiwa, M., Ueda, K., Pozzer, A., Lammel, G., and Kampf, C. J.: Aerosol Health Effects from Molecular to Global Scales, Environ. Sci. Technol., 51, 13545–13567, 2017.
Shrivastava, M., Cappa, C. D., Fan, J., Goldstein, A. H., Guenther, A. B., Jimenez, J. L., Kuang, C., Laskin, A., Martin, S. T., Ng, N. L., Petaja, T., Pierce, J. R., Rasch, P. J., Roldin, P., Seinfeld, J. H., Shilling, J., Smith, J. N., Thornton, J. A., Volkamer, R., Wang, J., Worsnop, D. R., Zaveri, R. A., Zelenyuk, A., and Zhang, Q.: Recent advances in understanding secondary organic aerosol: Implications for global climate forcing, Rev. Geophys., 55, 509–559, https://doi.org/10.1002/2016RG000540, 2017.
Spracklen, D. V., Jimenez, J. L., Carslaw, K. S., Worsnop, D. R., Evans, M. J., Mann, G. W., Zhang, Q., Canagaratna, M. R., Allan, J., Coe, H., McFiggans, G., Rap, A., and Forster, P.: Aerosol mass spectrometer constraint on the global secondary organic aerosol budget, Atmos. Chem. Phys., 11, 12109–12136, https://doi.org/10.5194/acp-11-12109-2011, 2011.
Tegen, I., Neubauer, D., Ferrachat, S., Siegenthaler-Le Drian, C., Bey, I., Schutgens, N., Stier, P., Watson-Parris, D., Stanelle, T., Schmidt, H., Rast, S., Kokkola, H., Schultz, M., Schroeder, S., Daskalakis, N., Barthel, S., Heinold, B., and Lohmann, U.: The global aerosol–climate model ECHAM6.3–HAM2.3 – Part 1: Aerosol evaluation, Geosci. Model Dev., 12, 1643–1677, https://doi.org/10.5194/gmd-12-1643-2019, 2019.
Tilmes, S., Hodzic, A., Emmons, L. K.,Mills, M. J., Gettelman, A.,Kinnison, D. E., Park, M., Lamarque, J.-F., Vitt, F., Shrivastava, M., Campuzano-Jost, P., Jimenez, J. L., and Liu, X.: Climate forcing and trends of organic aerosols in the Community Earth System Model (CESM2), J. Adv. Model. Earth Sy., 11, 4323–4351, https://doi.org/10.1029/2019MS001827, 2019.
Tsigaridis, K. and Kanakidou, M.: The Present and Future of Secondary Organic Aerosol Direct Forcing on Climate, Current Climate Change Reports, 4, 84–98, 2018.
Tsigaridis, K., Daskalakis, N., Kanakidou, M., Adams, P. J., Artaxo, P., Bahadur, R., Balkanski, Y., Bauer, S. E., Bellouin, N., Benedetti, A., Bergman, T., Berntsen, T. K., Beukes, J. P., Bian, H., Carslaw, K. S., Chin, M., Curci, G., Diehl, T., Easter, R. C., Ghan, S. J., Gong, S. L., Hodzic, A., Hoyle, C. R., Iversen, T., Jathar, S., Jimenez, J. L., Kaiser, J. W., Kirkevåg, A., Koch, D., Kokkola, H., Lee, Y. H., Lin, G., Liu, X., Luo, G., Ma, X., Mann, G. W., Mihalopoulos, N., Morcrette, J.-J., Müller, J.-F., Myhre, G., Myriokefalitakis, S., Ng, N. L., O'Donnell, D., Penner, J. E., Pozzoli, L., Pringle, K. J., Russell, L. M., Schulz, M., Sciare, J., Seland, Ø., Shindell, D. T., Sillman, S., Skeie, R. B., Spracklen, D., Stavrakou, T., Steenrod, S. D., Takemura, T., Tiitta, P., Tilmes, S., Tost, H., van Noije, T., van Zyl, P. G., von Salzen, K., Yu, F., Wang, Z., Wang, Z., Zaveri, R. A., Zhang, H., Zhang, K., Zhang, Q., and Zhang, X.: The AeroCom evaluation and intercomparison of organic aerosol in global models, Atmos. Chem. Phys., 14, 10845–10895, https://doi.org/10.5194/acp-14-10845-2014, 2014.
Ulbrich, I. M., Canagaratna, M. R., Zhang, Q., Worsnop, D. R., and Jimenez, J. L.: Interpretation of organic components from Positive Matrix Factorization of aerosol mass spectrometric data, Atmos. Chem. Phys., 9, 2891–2918, https://doi.org/10.5194/acp-9-2891-2009, 2009.
van der Werf, G. R., Randerson, J. T., Giglio, L., Collatz, G. J., Mu, M., Kasibhatla, P. S., Morton, D. C., DeFries, R. S., Jin, Y., and van Leeuwen, T. T.: Global fire emissions and the contribution of deforestation, savanna, forest, agricultural, and peat fires (1997–2009), Atmos. Chem. Phys., 10, 11707–11735, https://doi.org/10.5194/acp-10-11707-2010, 2010.
Vergara-Temprado, J., Murray, B. J., Wilson, T. W., O'Sullivan, D., Browse, J., Pringle, K. J., Ardon-Dryer, K., Bertram, A. K., Burrows, S. M., Ceburnis, D., DeMott, P. J., Mason, R. H., O'Dowd, C. D., Rinaldi, M., and Carslaw, K. S.: Contribution of feldspar and marine organic aerosols to global ice nucleating particle concentrations, Atmos. Chem. Phys., 17, 3637–3658, https://doi.org/10.5194/acp-17-3637-2017, 2017.
Wang, J., Cubison, M. J., Aiken, A. C., Jimenez, J. L., and Collins, D. R.: The importance of aerosol mixing state and size-resolved composition on CCN concentration and the variation of the importance with atmospheric aging of aerosols, Atmos. Chem. Phys., 10, 7267–7283, https://doi.org/10.5194/acp-10-7267-2010, 2010.
Wang, Q., Jacob, D. J., Spackman, J. R., Perring, A. E., Schwarz, J. P., Moteki, N., Marais, E. A., Ge, C., Wang, J., and Barrett, S. R. H.: Global budget and radiative forcing of black carbon aerosol: Constraints from pole-to-pole (HIPPO) observations across the Pacific, J. Geophys. Res.-Atmos., 119, 195–206, https://doi.org/10.1002/2013JD020824, 2014.
Williamson, C. J., Kupc, A., Axisa, D., Bilsback, K. R., Bui, T., Campuzano-Jost, P., Dollner, M., Froyd, K., Hodshire, A. L., Jimenez, J. L., Kodros, J. K., Luo, G., Murphy, D. M., Nault, B. A., Ray, E. A., Weinzierl, B. B., Wilson, J. C., Yu, F., Yu, P., Pierce, J. F., and Brock C. A.: A Large Source of Cloud Condensation Nuclei from New Particle Formation in the Tropics, Nature, 574, 399–403, https://doi.org/10.1038/s41586-019-1638-9, 2019.
Wofsy, S. C., Afshar, S., Allen, H. M., Apel, E., Asher, E. C., Barletta, B., Bent, J., Bian, H., Biggs, B. C., Blake, D. R., Blake, N., Bourgeois, I., Brock, C. A., Brune, W. H., Budney, J. W., Bui, T. P., Butler, A., Campuzano-Jost, P., Chang, C. S., Chin, M., Commane, R., Correa, G., Crounse, J. D., Cullis, P. D., Daube, B. C., Day, D. A., Dean-Day, J. M., Dibb, J. E., DiGangi, J. P., Diskin, G. S., Dollner, M., Elkins, J. W., Erdesz, F., Fiore, A. M., Flynn, C. M., Froyd, K., Gesler, D. W., Hall, S. R., Hanisco, T. F., Hannun, R. A., Hills, A. J., Hintsa, E. J., Hoffman, A., Hornbrook, R. S., Huey, L. G., Hughes, S., Jimenez, J. L., Johnson, B. J., Katich, J. M., Keeling, R. F., Kim, M. J., Kupc, A., Lait, L. R., Lamarque, J.-F., Liu, J., McKain, K., Mclaughlin, R. J., Meinardi, S., Miller, D. O., Montzka, S. A., Moore, F. L., Morgan, E. J., Murphy, D. M., Murray, L. T., Nault, B. A., Neuman, J. A., Newman, P. A., Nicely, J. M., Pan, X., Paplawsky, W., Peischl, J., Prather, M. J., Price, D. J., Ray, E., Reeves, J. M., Richardson, M., Rollins, A. W., Rosenlof, K. H., Ryerson, T. B., Scheuer, E., Schill, G. P., Schroder, J. C., Schwarz, J. P., St. Clair, J. M., Steenrod, S. D., Stephens, B. B., Strode, S. A., Sweeney, C., Tanner, D., Teng, A. P., Thames, A. B., Thompson, C. R., Ullmann, K., Veres, P. R., Vieznor, N., Wagner, N. L., Watt, A., Weber, R., Weinzierl, B., Wennberg, P., Williamson, C. J., Wilson, J. C., Wolfe, G. M., Woods, C. T., and Zeng, L. H.: ATom: Merged Atmospheric Chemistry, Trace Gases, and Aerosols, ORNL DAAC, Oak Ridge, Tennessee, USA, https://doi.org/10.3334/ORNLDAAC/1581, 2018.
Woody, M. C., Baker, K. R., Hayes, P. L., Jimenez, J. L., Koo, B., and Pye, H. O. T.: Understanding sources of organic aerosol during CalNex-2010 using the CMAQ-VBS, Atmos. Chem. Phys., 16, 4081–4100, https://doi.org/10.5194/acp-16-4081-2016, 2016.
Yu, P., Froyd, K. D., Portmann, R. W., Toon, O. B., Freitas, S. R., Bardeen, C. G., Brock, C., Fan, T., Gao, R.-S., Katich, J. M., Kupc, A., Liu, S., Maloney, C., Murphy, D. M., Rosenlof, K. H., Schill, G., Schwarz, J. P., and Williamson, C.: Efficient in-cloud removal of aerosols by deep convection, Geophys. Res. Lett., 46, 1061–1069, https://doi.org/10.1029/2018GL080544, 2019.
Zhang, K., O'Donnell, D., Kazil, J., Stier, P., Kinne, S., Lohmann, U., Ferrachat, S., Croft, B., Quaas, J., Wan, H., Rast, S., and Feichter, J.: The global aerosol-climate model ECHAM-HAM, version 2: sensitivity to improvements in process representations, Atmos. Chem. Phys., 12, 8911–8949, https://doi.org/10.5194/acp-12-8911-2012, 2012.
Zhang, Q., Jimenez, J. L., Canagaratna, M. R., Allan, J. D., Coe, H., Ulbrich, I., Alfarra, M. R., Takami, A., Middlebrook, A. M., Sun, Y. L., Dzepina, K., Dunlea, E., Docherty, K., DeCarlo, P. F., Salcedo, D., Onasch, T., Jayne, J. T., Miyoshi, T., Shimono, A., Hatakeyama, S., Takegawa, N., Kondo, Y., Schneider, J., Drewnick, F., Borrmann, S., Weimer, S., Demerjian, K., Williams, P., Bower, K., Bahreini, R., Cottrell, L., Griffin, R. J., Rautiainen, J., Sun, J. Y., Zhang, Y. M., and Worsnop, D. R.: Ubiquity and dominance of oxygenated species in organic aerosols in anthropogenically-influenced Northern Hemisphere midlatitudes, Geophys. Res. Lett., 34, L13801, https://doi.org/10.1029/2007GL029979, 2007.
Zhang, Q. J., Beekmann, M., Drewnick, F., Freutel, F., Schneider, J., Crippa, M., Prevot, A. S. H., Baltensperger, U., Poulain, L., Wiedensohler, A., Sciare, J., Gros, V., Borbon, A., Colomb, A., Michoud, V., Doussin, J.-F., Denier van der Gon, H. A. C., Haeffelin, M., Dupont, J.-C., Siour, G., Petetin, H., Bessagnet, B., Pandis, S. N., Hodzic, A., Sanchez, O., Honoré, C., and Perrussel, O.: Formation of organic aerosol in the Paris region during the MEGAPOLI summer campaign: evaluation of the volatility-basis-set approach within the CHIMERE model, Atmos. Chem. Phys., 13, 5767–5790, https://doi.org/10.5194/acp-13-5767-2013, 2013.
Zhang, X., Cappa, C. D., Jathar, S. H., McVay, R. C., Ensberg, J. J., Kleeman, M. J., and Seinfeld, J. H.: Influence of vapor wall loss in laboratory chambers on yields of secondary organic aerosol, P. Natl. Acad. Sci. USA, 111, 5802–5807, 2014.
Zhao, G., Chen, Y., Hopke, P. K., Holsen, T. M., and Dhaniyala, S.: Characteristics of traffic-induced fugitive dust from unpaved roads, Aerosol Sci. Tech., 51, 1324–1331, https://doi.org/10.1080/02786826.2017.1347251, 2017.
Zhu, J., Penner, J. E., Yu, F., Sillman, S., Andreae, M., and Coe, H.: Organic aerosol nucleation, climate and land use change: Decrease in radiative forcing, Nat. Commun., 10, 423, https://doi.org/10.1038/s41467-019-08407-7, 2019.
Zotter, P., El-Haddad, I., Zhang, Y., Hayes, P. L., Zhang, X., Lin, Y. H., Wacker, L., Schnelle-Kreis, J., Abbaszade, G., Zimmermann, R., Surratt, J. D., Weber, R., Jimenez, J. L., Szidat, S., Baltensperger, U., and Prévôt, A. S. H.: Diurnal cycle of fossil and non-fossil carbon using radiocarbon analyses during CalNex, J. Geophys. Res.-Atmos., 119, 6818–6835, https://doi.org/10.1002/2013JD021114, 2014.