the Creative Commons Attribution 4.0 License.
the Creative Commons Attribution 4.0 License.
 | 13 Jan 2020
Long-range and local air pollution: what can we learn from chemical speciation of particulate matter at paired sites?
Marco Pandolfi
Dennis Mooibroek
Philip Hopke
Dominik van Pinxteren
Xavier Querol
Hartmut Herrmann
Andrés Alastuey
Olivier Favez
Christoph Hüglin
Esperanza Perdrix
Véronique Riffault
Stéphane Sauvage
Eric van der Swaluw
Oksana Tarasova
Augustin Colette
Here we report results of a detailed analysis of the urban and non-urban contributions to particulate matter (PM) concentrations and source contributions in five European cities, namely Schiedam (the Netherlands, NL), Lens (France, FR), Leipzig (Germany, DE), Zurich (Switzerland, CH) and Barcelona (Spain, ES). PM chemically speciated data from 12 European paired monitoring sites (one traffic, five urban, five regional and one continental background) were analysed by positive matrix factorisation (PMF) and Lenschow's approach to assign measured PM and source contributions to the different spatial levels. Five common sources were obtained at the 12 sites: sulfate-rich (SSA) and nitrate-rich (NSA) aerosols, road traffic (RT), mineral matter (MM), and aged sea salt (SS). These sources explained from 55 % to 88 % of PM mass at urban low-traffic-impact sites (UB) depending on the country. Three additional common sources were identified at a subset of sites/countries, namely biomass burning (BB) (FR, CH and DE), explaining an additional 9 %–13 % of PM mass, and residual oil combustion (V–Ni) and primary industrial (IND) (NL and ES), together explaining an additional 11 %–15 % of PM mass. In all countries, the majority of PM measured at UB sites was of a regional+continental (R+C) nature (64 %–74 %). The R+C PM increments due to anthropogenic emissions in DE, NL, CH, ES and FR represented around 66 %, 62 %, 52 %, 32 % and 23 %, respectively, of UB PM mass. Overall, the R+C PM increments due to natural and anthropogenic sources showed opposite seasonal profiles with the former increasing in summer and the latter increasing in winter, even if exceptions were observed. In ES, the anthropogenic R+C PM increment was higher in summer due to high contributions from regional SSA and V–Ni sources, both being mostly related to maritime shipping emissions at the Spanish sites. Conversely, in the other countries, higher anthropogenic R+C PM increments in winter were mostly due to high contributions from NSA and BB regional sources during the cold season. On annual average, the sources showing higher R+C increments were SSA (77 %–91 % of SSA source contribution at the urban level), NSA (51 %–94 %), MM (58 %–80 %), BB (42 %–78 %) and IND (91 % in NL). Other sources showing high R+C increments were photochemistry and coal combustion (97 %–99 %; identified only in DE). The highest regional SSA increment was observed in ES, especially in summer, and was related to ship emissions, enhanced photochemistry and peculiar meteorological patterns of the Western Mediterranean. The highest R+C and urban NSA increments were observed in NL and associated with high availability of precursors such as NOx and NH3. Conversely, on average, the sources showing higher local increments were RT (62 %–90 % at all sites) and V–Ni (65 %–80 % in ES and NL). The relationship between SSA and V–Ni indicated that the contribution of ship emissions to the local sulfate concentrations in NL has strongly decreased since 2007 thanks to the shift from high-sulfur- to low-sulfur-content fuel used by ships. An improvement of air quality in the five cities included here could be achieved by further reducing local (urban) emissions of PM, NOx and NH3 (from both traffic and non-traffic sources) but also SO2 and PM (from maritime ships and ports) and giving high relevance to non-urban contributions by further reducing emissions of SO2 (maritime shipping) and NH3 (agriculture) and those from industry, regional BB sources and coal combustion.
- Article
(9568 KB) - Full-text XML
-
Supplement
(571 KB) - BibTeX
- EndNote


In the last scientific assessment report from the Convention on Long-Range Transboundary Air Pollution (CLRTAP) “Toward Cleaner Air”, it is stated that because non-urban sources (i.e. regional+continental sources) are often major contributors to urban pollution, many cities will be unable to meet WHO guideline levels for air pollutants through local action alone. Consequently, it is very important to estimate how much the local and regional+continental (R+C) sources (both natural and anthropogenic) contribute to urban pollution in order to design global strategies to reduce the levels of pollutants in European cities.
There are various modelling approaches to disentangle the local/remote contribution to urban air pollution. But it is also relevant to investigate how in situ measurements can be used for that purpose. The Task Force on Measurements and Modeling (TFMM-CLRTAP) therefore initiated an assessment of the added value of paired urban and regional–remote sites in Europe. Experimental data from paired sites were used to allocate urban pollution to the different spatial scale sources. The paired sites selected for this study provided chemically speciated PM10 or PM2.5 data simultaneously measured at urban–traffic and regional–remote sites. In some cases, (e.g. Spain, ES) these measurements were continuously performed over long periods, whereas in other cases the measurements were performed for a limited time period. The periods presented here were comparable in Switzerland (CH, 2008–2009) and the Netherlands (NL, 2007–2008), whereas more recent data were used for Spain (ES, 2010–2014), Germany (DE, 2013–2014) and France (FR, 2013–2014).
The approach proposed and described in this paper aimed at identifying the urban and non-urban (R+C) contributions (or a mix of both) to the particulate matter (PM) mass measured at the urban level and at calculating the urban increments that correspond to the concentration difference between the city and the regional locations (Lenschow's approach; Lenschow et al., 2001). This method, detailed in Sect. 2.2 and developed by Lenschow et al. (2001), is based on measurements of atmospheric pollutants at sites of different typologies (i.e. rural and urban background) and has been widely used to discriminate the local and non-local increments (e.g. Pope et al., 2018; Petetin et al., 2014; Gianini et al., 2012, among others).
The uniqueness of the present work is that we were able to allocate urban and non-urban pollution to major primary sources by activity sector or to main secondary aerosol fractions thanks to the application of positive matrix factorisation (PMF) (described in Sect. 2.1) that quantitatively groups species emitted from the same source. The PMF is a widely used receptor model to perform PM source apportionment studies, identifying main sources of pollution and estimating their contributions to PM concentrations in ambient air (e.g. Hopke, 2016; Liao et al., 2015; Amato et al., 2009; Kim and Hopke, 2007; Kim et al., 2003, among others). This information is useful for devising opportune abatement/mitigation strategies to tackle air pollution.
Chemistry transport models (CTMs) are regularly used to design air pollution mitigation strategies and a recurring question regards the identification of the main activity sectors and geographical areas that produce the pollutants. The performances of CTMs in this identification must therefore be compared to measurements. A first step consists in comparing the chemical composition of PM between models and observations. Such comparison has been performed before for specific areas or overall for Europe (Bessagnet et al., 2016), but the synthesis presented in the present paper will be particularly relevant to identify the main characteristics of the diversity of sites in terms of both chemical composition and urban–regional gradients. In a second step, a comparison with the models that provide a direct quantification of activity sectors is also relevant. Whereas CTMs focus essentially on chemical composition, some models (e.g. the TNO LOTOS-EURO; Kranenburg et al., 2013) include tagging or source apportionment information (also referred to as source-oriented models). However, we can also include integrated assessment models such as GAINS (Amann et al., 2011; Kiesewetter et al., 2015) or SHERPA (Pisoni et al., 2017) or even the Copernicus Atmosphere Monitoring Service (CAMS) policy service (http://policy.atmosphere.copernicus.eu, last access: 13 July 2019). In various ways, these tools propose a quantification of the priority activity sectors and scale for actions that must be targeted when designing air quality policies, although these models are challenging to compare with observations.
The scientific questions we are tackling here are distributed over two topics. The first one relates to the relative importance of local and remote air pollution sources. This aspect is of course the most directly connected to the policy expectations, but is also raises a number of scientific challenges that we address in an innovative manner by differentiating primary and secondary particulate matter of different types. The second one is more related to methodological developments. The approach we use here has already been explored for a given city/region. However, for the first time we intend to compare very different European regions, also with different monitoring strategies, which induce specific scientific questions in terms of consistency that are addressed throughout this work.
The proposed methodology consists in the application of Lenschow's approach (Lenschow et al., 2001) to the source contributions calculated by means of PMF at appropriately paired sites to assess the increments of air pollution.
2.1 PMF model
PMF (EPA PMFv5.0) was applied to the collected daily PM speciated data for source identification and apportionment. PMF was applied to the PM chemically speciated data from ES, CH, and FR. For NL and DE, we used the PMF analysis already presented in Mooibroek et al. (2011) and van Pinxteren et al. (2016), respectively, and then apply the Lenschow approach to the PMF outputs.
Detailed information about PMF can be found in the literature (e.g. Paatero and Tapper, 1994; Paatero, 1999; Paatero and Hopke, 2003, 2008; Hopke, 2016). PMF is a factor analytical tool that reduces the dimension of the input matrix (i.e. the daily chemically speciated data) to a limited number of factors (or sources). It is based on the weighted least-squares method and uses the uncertainties of the input data to solve the chemical mass balance equations. In the present study, individual uncertainties and detection limits were calculated in different ways, depending on the available information about analytical uncertainties.
One approach (applied to the Spanish database) was based on the use of both the analytical uncertainties and the standard deviations of species concentrations in the blank filters for uncertainty calculations. This approach was described in Escrig et al. (2009) and Amato et al. (2009). For the French sites, the uncertainty calculations for the trace elements were performed using the expanded relative uncertainties for each species, and the total uncertainties were calculated by multiplying these relative uncertainties by the concentration of each species (Waked et al., 2014, and references herein). These relative uncertainties included variability from contamination, sampling volume, repeatability and accuracy (through the digestion recovery rate determinations). For the Swiss and Dutch sites, the uncertainties were estimated using information about the minimum detection limit (MDL) of the techniques used for chemical analysis. In this approach, data below the MDL were replaced by half the MDL and the corresponding uncertainty was set to 5/6 times the MDL (Polissar et al., 1998; Kim et al., 2003; Kim and Hopke, 2008). For the German sites, the uncertainty matrix was constructed from three components: (i) uncertainty of the instrumental limit of detection (LOD), defined as 5/6 of the LOD; (ii) analytical uncertainty, obtained from relative standard deviations of signal intensities from repeated standard measurements; and (iii) uncertainty of the mean field blank concentration, defined as 3 times the standard deviation of the field blank. Total uncertainty was calculated from these components applying Gaussian error propagation (details in van Pinxteren et al., 2016). For elemental carbon (EC) and organic carbon (OC), expanded relative uncertainties were calculated to take into account for the uncertainty in the split point position of the thermo-optical technique used to determine the concentrations of OC and EC. For the French, Spanish and Swiss databases 10 %–15 % for OC and EC (Cavalli et al., 2010) were added (e.g. Waked et al., 2014). Moreover, a 15 % uncertainty was added for monosaccharide sugars (French database) such as levoglucosan, arabitol, sorbitol and mannitol (e.g. Piot et al., 2012; Waked et al., 2014).
The different schemes used here for uncertainty calculation were tested by data providers and their robustness has been demonstrated in previous publications. Thus, despite the different methodologies, the presented final PMF results were stable, and their robustness was estimated using bootstrapping resampling and studying the distribution of the scaled residuals for each variable (e.g. Paatero et al., 2002).
The signal-to-noise ratio (S∕N) was estimated starting from the calculated uncertainties and used as a criterion for selecting the species used within the PMF model. In order to avoid any bias in the PMF results, the data matrix was uncensored (Paatero, 2004). The PMF was run in robust mode (Paatero, 1997). The optimal number of sources was selected by inspecting the variation in the objective function Q (defined as the ratio between residuals and errors in each data value) with a varying number of sources (e.g. Paatero et al., 2002).
Multisite PMF
In this work, we used the chemically speciated data from 24 h samples collected at the paired sites available in a country combining the datasets from the available site pairs (multisite PMF) as the PMF input. Thus, the hypothesis is that the chemical profiles of the sources are similar at the paired sites. If this hypothesis is not satisfied, then the multisite PMF could lead to undesired uncertainties in the estimation of the source contributions. In the following sections, we demonstrate the feasibility of the multisite PMF for each country. However, it is important to consider that we can only apply the Lenschow approach to exactly the same variables (same pollutant sources in this case) that can only be obtained through the application of the multisite PMF.
To demonstrate the feasibility of the multisite PMF, we compared the source profiles from the multisite PMF with the source profiles from the individual single-site PMF results (Sofowote et al., 2015). This procedure was applied to the PMF outputs obtained for ES, FR and CH. For NL and DE, as stated before, the multisite PMF was already published. Thus, we did not perform the sensitivity study for Dutch and German databases.
The feasibility of the multisite PMF depends on the degree of similarity of the source profiles among the PMF runs. For the comparison, we calculated the ratio between specific tracers in each chemical profile for each PMF run and then we calculated the coefficient of variation (CV) of the obtained ratios. As an example, for the sulfate-rich source we compared the ratios. Sofowote et al. (2015) suggested that if CV of the ratios for each chemical profile is lower than 20 %–25 %, multisite PMF is applicable. If this condition is satisfied, we can assume that the chemical profiles of the obtained sources are similar at the paired sites. For this sensitivity test, the number and types of sources from each PMF run (single and multisite) should be the same.
The robustness of the identified sources in each PMF run can be estimated using some of the tools available in the EPA PMF version 5.0 such as the bootstrapping resampling and the displacement of factor elements or both (Paatero et al., 2014; Brown et al., 2015). Bootstrapping resampling results for ES, FR and CH are reported in Table S1 in the Supplement.
The main advantage of the multisite PMF is that a larger dataset is used in the PMF model compared to the separate single-site PMFs. Thus, multisite PMF is more likely to include low contribution (edge point) values and produce more robust results. Moreover, by combining the datasets, the analysis will provide insight into the sources affecting both receptor sites and will most likely tend to focus on the general phenomena instead of the unique local variations (Escrig et al., 2009).
Additionally, pooling the concentrations of PM constituents collected at the paired sites into one dataset allows the application of the Lenschow's approach detailed below. To obtain the net local source impacts, the source contributions estimated at the regional station are subtracted from the source contributions estimated at the urban station. Thus, it is necessary that the sources identified at the paired sites are exactly the same and for this reason multisite PMF was performed.
2.2 The Lenschow approach
Lenschow's approach (Lenschow et al., 2001) is a simple technique that aims at assessing the contribution of pollutants from different spatial scales (i.e. local, regional, continental) to the urban concentration.
Depending on the country, different paired sites were available for this analysis (traffic–urban–regional–remote). The descriptions of the sites are given in the next section. Lenschow's approach implies some important assumptions to assess the increments at various sites in terms of actual contributions.
-
The differences of source contributions between a traffic station (TS) and an urban low-traffic-impact site (UB) can be attributed to the very local influence of traffic (and other very local sources) on the adjacent street/district. This difference is called traffic increment.
-
The differences between an UB station and a rural background (RB) station can be attributed to the sources of the agglomeration such as building heating or the dispersed traffic increment. This difference is called urban increment.
If a remote (i.e. mountaintop station/continental background (CB) station) is also available, then we assume the following.
-
The differences of the source contributions between the RB and CB stations can be attributed to the regional sources with little contribution from the urban agglomeration. This difference is called regional increment.
-
The source contributions at the CB station can be attributed to continental sources. This contribution is called continental increment.
If only the RB station is available we cannot separate the regional and continental contributions; therefore we assume that
-
the source contributions at the RB station can be attributed to both regional and continental sources (without the possibility of separating the two contributions) with little contribution from the urban agglomeration.
The important hypothesis behind Lenschow's approach is that the emissions from the city should not directly affect the regional–remote site, otherwise this approach will lead to an underestimation of the urban increment. The city contribution to the measured RB levels (called “city spread” in Thunis et al., 2018) also depends on the distance between the city and the RB station. The larger the distance between the UB and RB sites, the lower the city impacts should be. Moreover, as suggested by Thunis et al. (2018), the size of the city is also a parameter that can affect the city effect. Another consideration is that (a) specific meteorological conditions favouring the transport of the city emissions to the RB site can also contribute to the city spread, and (b) even if the city emissions do not influence the RB site, nearby rural emissions might increase RB levels of PM. This issue is made even more complex when considering the different lifetime of chemical species. Whereas the dispersion of primary species will be primarily constrained by the geometry of the sources, the topography of the areas and the meteorological dispersion patterns, for secondary species the chemical formation process introduces a substantial complexity.
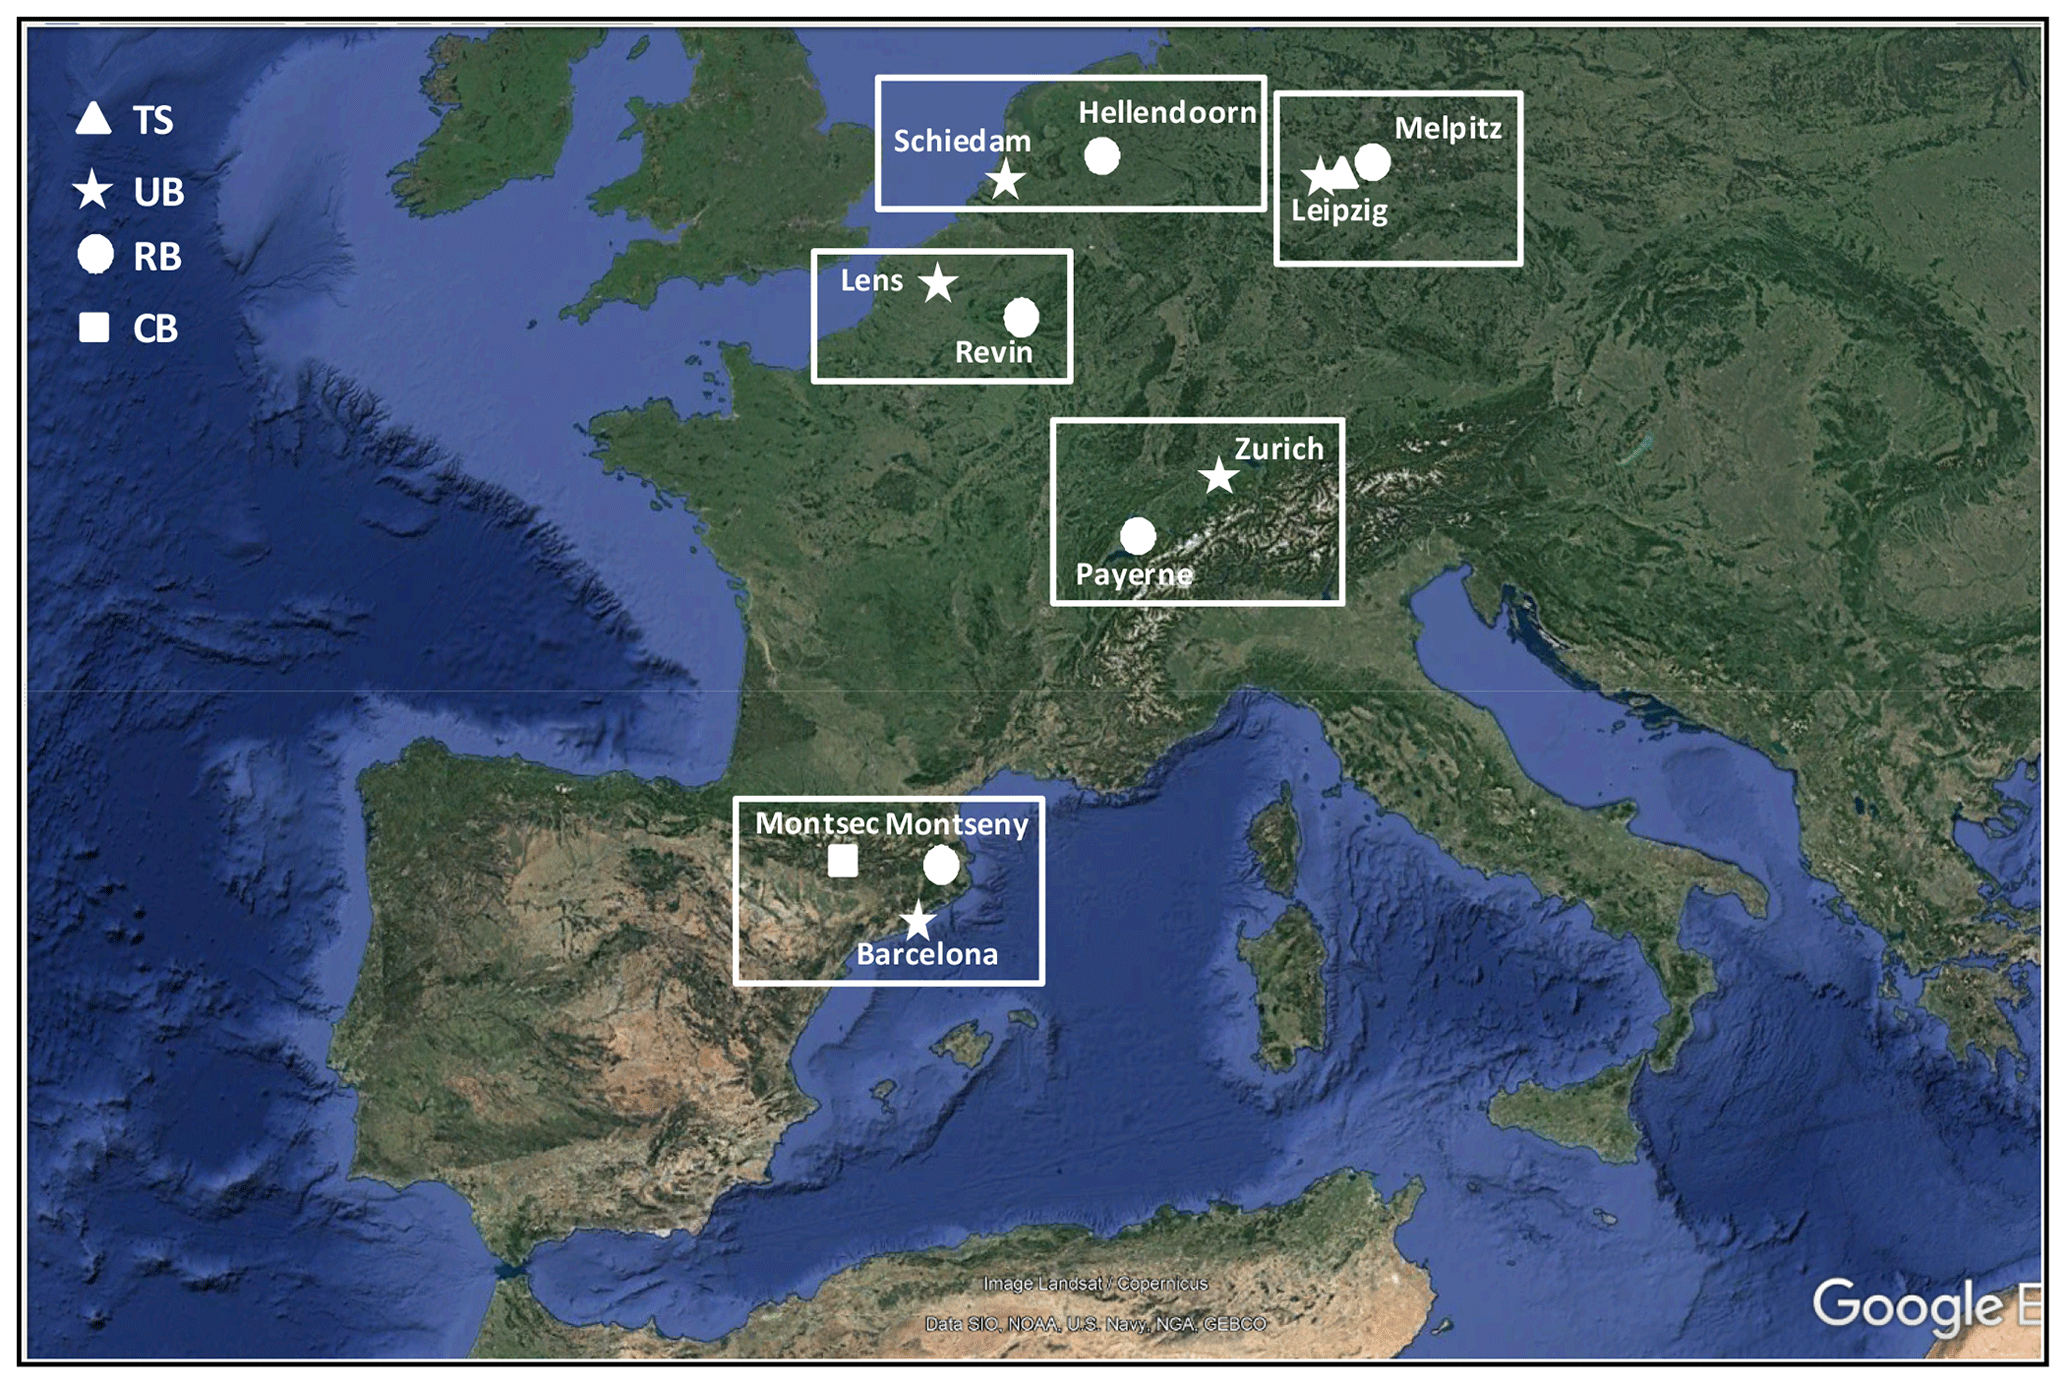
Figure 1Paired sites included in this work. TS: traffic station (DE). UB: urban background (NL, DE, FR, CH, ES). RB: regional background (NL, DE, FR, CH, ES). CB: continental background (ES). © Google Maps.
2.3 Paired sites and measurements
In the following, we provide a brief description of the paired sites included in this analysis and the PM chemically speciated data available in each country. Figure 1 shows the location of the paired sites, whereas the main statistics of the chemical species used in the PMF model are provided in Tables S2–S5.
2.3.1 Spain (ES)
Three sites were available in ES, namely the Barcelona UB station (BCN; 41∘23′24.01′′ N, 02∘6′58.06′′ E, 64 m a.s.l.), the Montseny RB station (MSY; 41∘46′45.63′′ N, 02∘21′28.92′′ E, 720 m a.s.l.) located about 50 km to the NNE of BCN and the Montsec CB (MSA; 42∘3′ N, 0∘44′ E, 1570 m a.s.l.) located 140 km southeast of BCN. These stations are run by the EGAR Group of the Institute of Environmental Assessment and Water Research (IDAEA-CSIC) in Barcelona. Detailed descriptions of the measuring sites can be found in Querol et al. (2008), Amato et al. (2009) and Pandolfi et al. (2014a) for BCN, Pérez et al. (2008), Pey et al. (2010) and Pandolfi et al. (2011a, 2014a) for MSY, and Ripoll et al. (2014) and Pandolfi et al. (2014b) for MSA. Both MSY and MSA stations are part of the ACTRIS (Aerosol, Clouds, and Trace gases Research Infrastructure, http://www.actris.net, last access: 2 September 2019) and GAW (Global Atmosphere Watch Programme, https://www.wmo.int/gaw, last access: 2 September 2019) networks and of the measuring network of the government of Catalonia.
Measurements of PM10 chemically speciated data from the three Spanish sites used here covered the period 2010–2014. Details on the analytical methods used can be found for example in Querol et al. (2007) and Pandolfi et al. (2016). A total of 2115 samples were used in the PMF model. Table S2 reports the chemical species included in PMF analysis and the main statistics (mean, median, SD) for each species for the three Spanish sites.
2.3.2 Switzerland (CH)
Two measuring sites were available in CH: a UB station in Zurich (Zurich-Kaserne, ZUE; 47∘22′36.42′′ N, 8∘31′44.70′′ E, 410 m a.s.l.) and the RB station of Payerne (PAY; 46∘49′12′′ N, 06∘57′ E, 491 m a.s.l.) located about 130 km west of ZUE. A detailed description of ZUE (which is part of the Swiss National Air Pollution Monitoring Network – NABEL) and PAY stations (part of the EMEP and GAW networks) was provided by Gehrig and Buchmann (2003), Gianini et al. (2012), Hueglin et al. (2005), Szidat et al. (2006), Bukowiecki et al. (2010), and Lanz et al. (2008).
Measurements of PM10 chemically speciated data were available at the two sites during the period August 2008–July 2009 (Gianini et al., 2012). A total of 178 samples (89 collected at ZUE and 89 collected at PAY) and 31 species (listed in Table S3) were used in the PMF analysis. Table S3 reports the summary statistics for these chemical species.
2.3.3 The Netherlands (NL)
The measuring sites and the PM2.5 chemically speciated data available in NL were presented by Mooibroek et al. (2011) where data from five stations (one TS, one UB and three RB sites) were simultaneously used in the PMF model in order to document the variability of the PM2.5 source contributions in NL. Among the five stations presented in Mooibroek et al. (2011), we only used data from Schiedam (SCH, UB) and Hellendoorn (HEL, RB) located around 150 km from SCH.
Measurements of PM2.5 chemically speciated data were available at the two sites during the period September 2007–August 2008. A total of 479 samples were used in Mooibroek et al. (2011) for PMF analysis using data from five sites. A total of 87 and 82 samples were collected at UB and RB, respectively. Table S4 reports the mean concentrations of PM2.5 chemical species at these two sites.
2.3.4 Germany (DE)
The PM chemically speciated data and the PMF source apportionments used here were published by van Pinxteren et al. (2016). Data from four stations (Leipzig-Mitte (LMI, TS), Leipzig Eisenbahnstrasse (EIB, TS), Leipzig TROPOS (TRO, UB) and Melpitz (MEL, RB)) were collected during summer 2013 and winter 2013/14 and 2014/15. A total of 172 samples were used in the PMF model by van Pinxteren et al. (2016). In order to apply the PMF+Lenschow approach, we excluded the TS (Leipzig-Eisenbahnstrasse) located in a residential area, approximately 2 km east of LMI. The three measuring sites used in this work, LMI, TRO and MEL, are located approximately 50 km northeast of TRO and described in van Pinxteren et al. (2016).
2.3.5 France (FR)
Two sites were used: a UB site in Lens (LEN; 50∘26′13′′ N, 2∘49′37′′ E, 47 m a.s.l.) and the RB station of Revin (REV; 49∘54′ 28.008′′ N, 4∘37′48′′ E, 395 m a.s.l.). The distance between Lens and Revin is around 140 km. A description of the French measuring sites can be found in Waked et al. (2014).
Measurements of PM10 chemically speciated data were available at the two sites during the period January 2013–May 2014. A total of 335 samples (167 from LEN and 168 from REV) were analysed with PMF. The number of 24 h samples simultaneously collected at the two sites and used for Lenschow's approach was 104. Table S5 reports the statistics of the chemical species measured at the French paired sites.
This section is organised as follows: Sect. 3.1 presents the PMF sources calculated for each group of paired sites. Some of these sources were common for all the sites included in this work, whereas other sources were obtained only for a subset of paired sites. The chemical profiles of the sources calculated for ES, CH and FR are reported in the Supplement (Figs. S1, S2 and S3 in the Supplement, respectively). The source chemical profiles for NL and DE can be found in Mooibroek et al. (2011) and van Pinxteren et al. (2016), respectively. In Sect. 3.2, we present a sensitivity study that aimed at demonstrating the feasibility of the multisite PMF analyses. In Sect. 3.3, we present the PMF source contributions, and in Sect. 3.4 we present and discuss the results of the Lenschow approach applied to PM concentrations and PMF source contributions.
3.1 PMF sources
3.1.1 Sources identified at all paired sites
The secondary inorganic aerosol (SIA) source was traced mostly by inorganic species ammonium (), sulfate () and nitrate (). At all sites included here, with the exception of DE, the contribution of SIA was separated between sulfate-rich aerosols (SSAs) and nitrate-rich aerosols (NSAs). The origin of SSA and NSA is, respectively, the atmospheric oxidation of SO2 (mostly from combustion of sulfur-containing fuels) and NOx (from combustion processes such as traffic, power generation, industry and the domestic sector). At all sites the SSA and to a lesser extent NSA source profiles (and consequently the SIA source profile in DE) showed enrichments in organic carbon (OC), which was attributed to both the condensation of semi-volatile compounds on the high specific surface area of ammonium sulfate and nitrate (Amato et al., 2009) and photochemistry causing similar temporal variation in these constituents of atmospheric PM (Kim et al., 2003; Kim and Hopke, 2004; Petit et al., 2019).
The mineral source (MM) was traced by typical crustal elements such as Al, Ca, Fe, and Mg and accounted for a large mass fraction of crustal trace elements such as Ti, Rb, Sr, Y, La, Ce and Nd. This factor also included a variable fraction of OC, an indication of mixing of inorganic and organic matter during ageing or by entrainment of soils including their associated organic matter (Kuhn, 2007). At the German sites, this source (named urban dust in van Pinxteren et al., 2016) consisted of and WSOC (water-soluble organic carbon) with high mass contributions of Ca and Fe indicating a mixture of mineral dust with urban pollution. A MM factor (enriched in Si, Al, Ti, Ca and Fe) was also found by Mooibroek et al. (2011) in PM2.5 at the Dutch sites.
The primary road traffic (RT) source included both exhaust and non-exhaust primary traffic emissions and was traced by EC and OC and a range of metals such as Fe, Cu, Ba, Mo and Sb from brakes and tire abrasion (i.e. Amato et al., 2009). Only for DE was it possible to separate the contributions from exhaust and non-exhaust traffic emissions (van Pinxteren et al., 2016), whereas in the other cases the two sources were jointly apportioned. In van Pinxteren et al. (2016), the vehicle exhaust emissions were identified by high mass contributions of WISC (water-insoluble carbon, i.e. EC + hydrophobic organics), as well as contributions of hopanes with increasing species contributions toward either lower-chain-length (< C25) n-alkanes (for ultrafine particles) or larger-chain-length (≥C25) n-alkanes with a predominance of even C compounds (coarse particles). The contributions from exhaust and non-exhaust traffic sources in DE were summed to obtain the RT source contribution.
The aged sea salt (SS) source was traced mostly by Na+, Cl− and Mg2+ with variable contributions from and suggesting some ageing of the marine aerosol. In CH, this source contributed to high fractions of Na+ and Mg2+ and did not show a clear annual cycle with elevated values during winter, thus suggesting a low contribution from the de-icing road salt. In Gianini et al. (2012), this source was named the Na–Mg-rich factor and it was related to the transport of sea spray aerosol particles in Zurich. In DE, the calculated SS factor consisted mainly of and Na+ with no mass contribution of Cl−, indicating efficient Cl− depletion during transport over the continent. In FR, two SS sources were calculated: a fresh SS source (traced by Na+ and Cl−) and an aged SS source with lack of Cl− and presence of Na+ and .
3.1.2 Sources identified only at a subset of paired sites
-
The biomass burning (BB) source, mostly traced by K+ and levoglucosan together with EC and OC, was resolved for three paired sites (in FR, DE and CH).
-
The residual oil combustion source (V–Ni) was identified at two paired sites (in ES and NL). This source contained significant fractions of the measured V and Ni concentrations together with EC, OC and that are the tracers for residual oil combustion sources such as ocean shipping, municipal district heating power plants and industrial power plants using residual oil.
-
The primary industrial (IND) source was also resolved only in ES and NL. In ES, it was identified by Pb and Zn along with As and Mn mostly from metallurgical operations (e.g. Amato et al., 2009). In NL, different trace metals appeared indicating a mixture of many different sources, including waste incineration, (coal) combustion, metallic industrial activities and fertiliser production. Mooibroek et al. (2011) summarised the profile as industrial activities and incineration.
3.1.3 Sources identified at only one set of paired sites
-
Two sources were identified only in FR, namely a marine biogenic source identified by methanesulfonic acid, a product of DMS oxidation, and a land (or primary) biogenic source, traced by alcohols (arabitol and mannitol).
-
Six additional sources were resolved only in DE, namely sea salt/road salt (SSRS, an SS source with influence of road salt for de-icing), coal combustion and local coal combustion (the latter contributing mostly at the EIB site, which was removed from this analysis), photochemistry (with high mass contributions of and and WSOC), cooking, and fungal spores. As reported in van Pinxteren et al. (2016), photochemistry factor concentrations (Figs. 4 and S11 in van Pinxteren et al., 2016) tended to be higher in summer and showed no clear site-dependent trend. In contrast to the general secondary aerosol, the photochemistry factor thus seems to be more related to radiation-driven formation processes. A detailed description of these additional sources can be found in van Pinxteren et al. (2016).
3.2 Feasibility of the multisite PMF
The results of the sensitivity test performed to demonstrate the feasibility of the multisite PMF were reported in Table S6. Table S6 shows the main features of the sources from both the single-site PMF and the multisite PMF for ES, CH and FR reporting for each source and country: (1) the explained variation (EV) in the main markers of the source for each PMF run (i.e. how much each source explains in percent the concentration of a given tracer), (2) the ratio values (K) between specific tracers in each source for each PMF run and (3) the coefficient of variation (CV) of the ratios for each source (calculated as the ratio between the standard deviation and the mean of the K values obtained from the single-site PMF). This sensitivity test was not performed for NL and DE because the multisite PMF was not applied here but directly taken from Mooibroek et al. (2011) and van Pinxteren et al. (2016), respectively. Given the encouraging results shown below for ES, CH and FR, it seems valid to assume that the multisite PMF results for DE and NL can be used, even without the single-site validation. As reported in Table S6, the calculated CVs are below 20 %–25 % for the majority of the sources (see Sect. 2.1.1).
The exceptions were IND in ES (CV =48.8 %), SS in ES (CV 9), marine biogenic in FR (CV =31.9 %) and RT in CH (CV =31.1 %). As shown below, the contribution of the IND source to the measured PM10 in BCN was very low and consequently the uncertainty associated with the high CV for this source was minimal. The high CV for the SS source in ES is due to the progressive depletion of Cl− when moving from UB to RB and to CB. In fact, as reported in Table S6, the ratio correspondingly increased when moving from the UB site to the CB site. However, the SS source and the marine biogenic source were considered natural sources without separating the urban and regional increments. Thus, the contribution from these two sources can be totally attributed to regional natural sources. On the other hand, the RT source in CH was, as shown below, mostly local. For all other sources, the CVs are quite low, indicating the similarity in the chemical profiles at the three sites, thereby allowing the application of the multisite PMF.
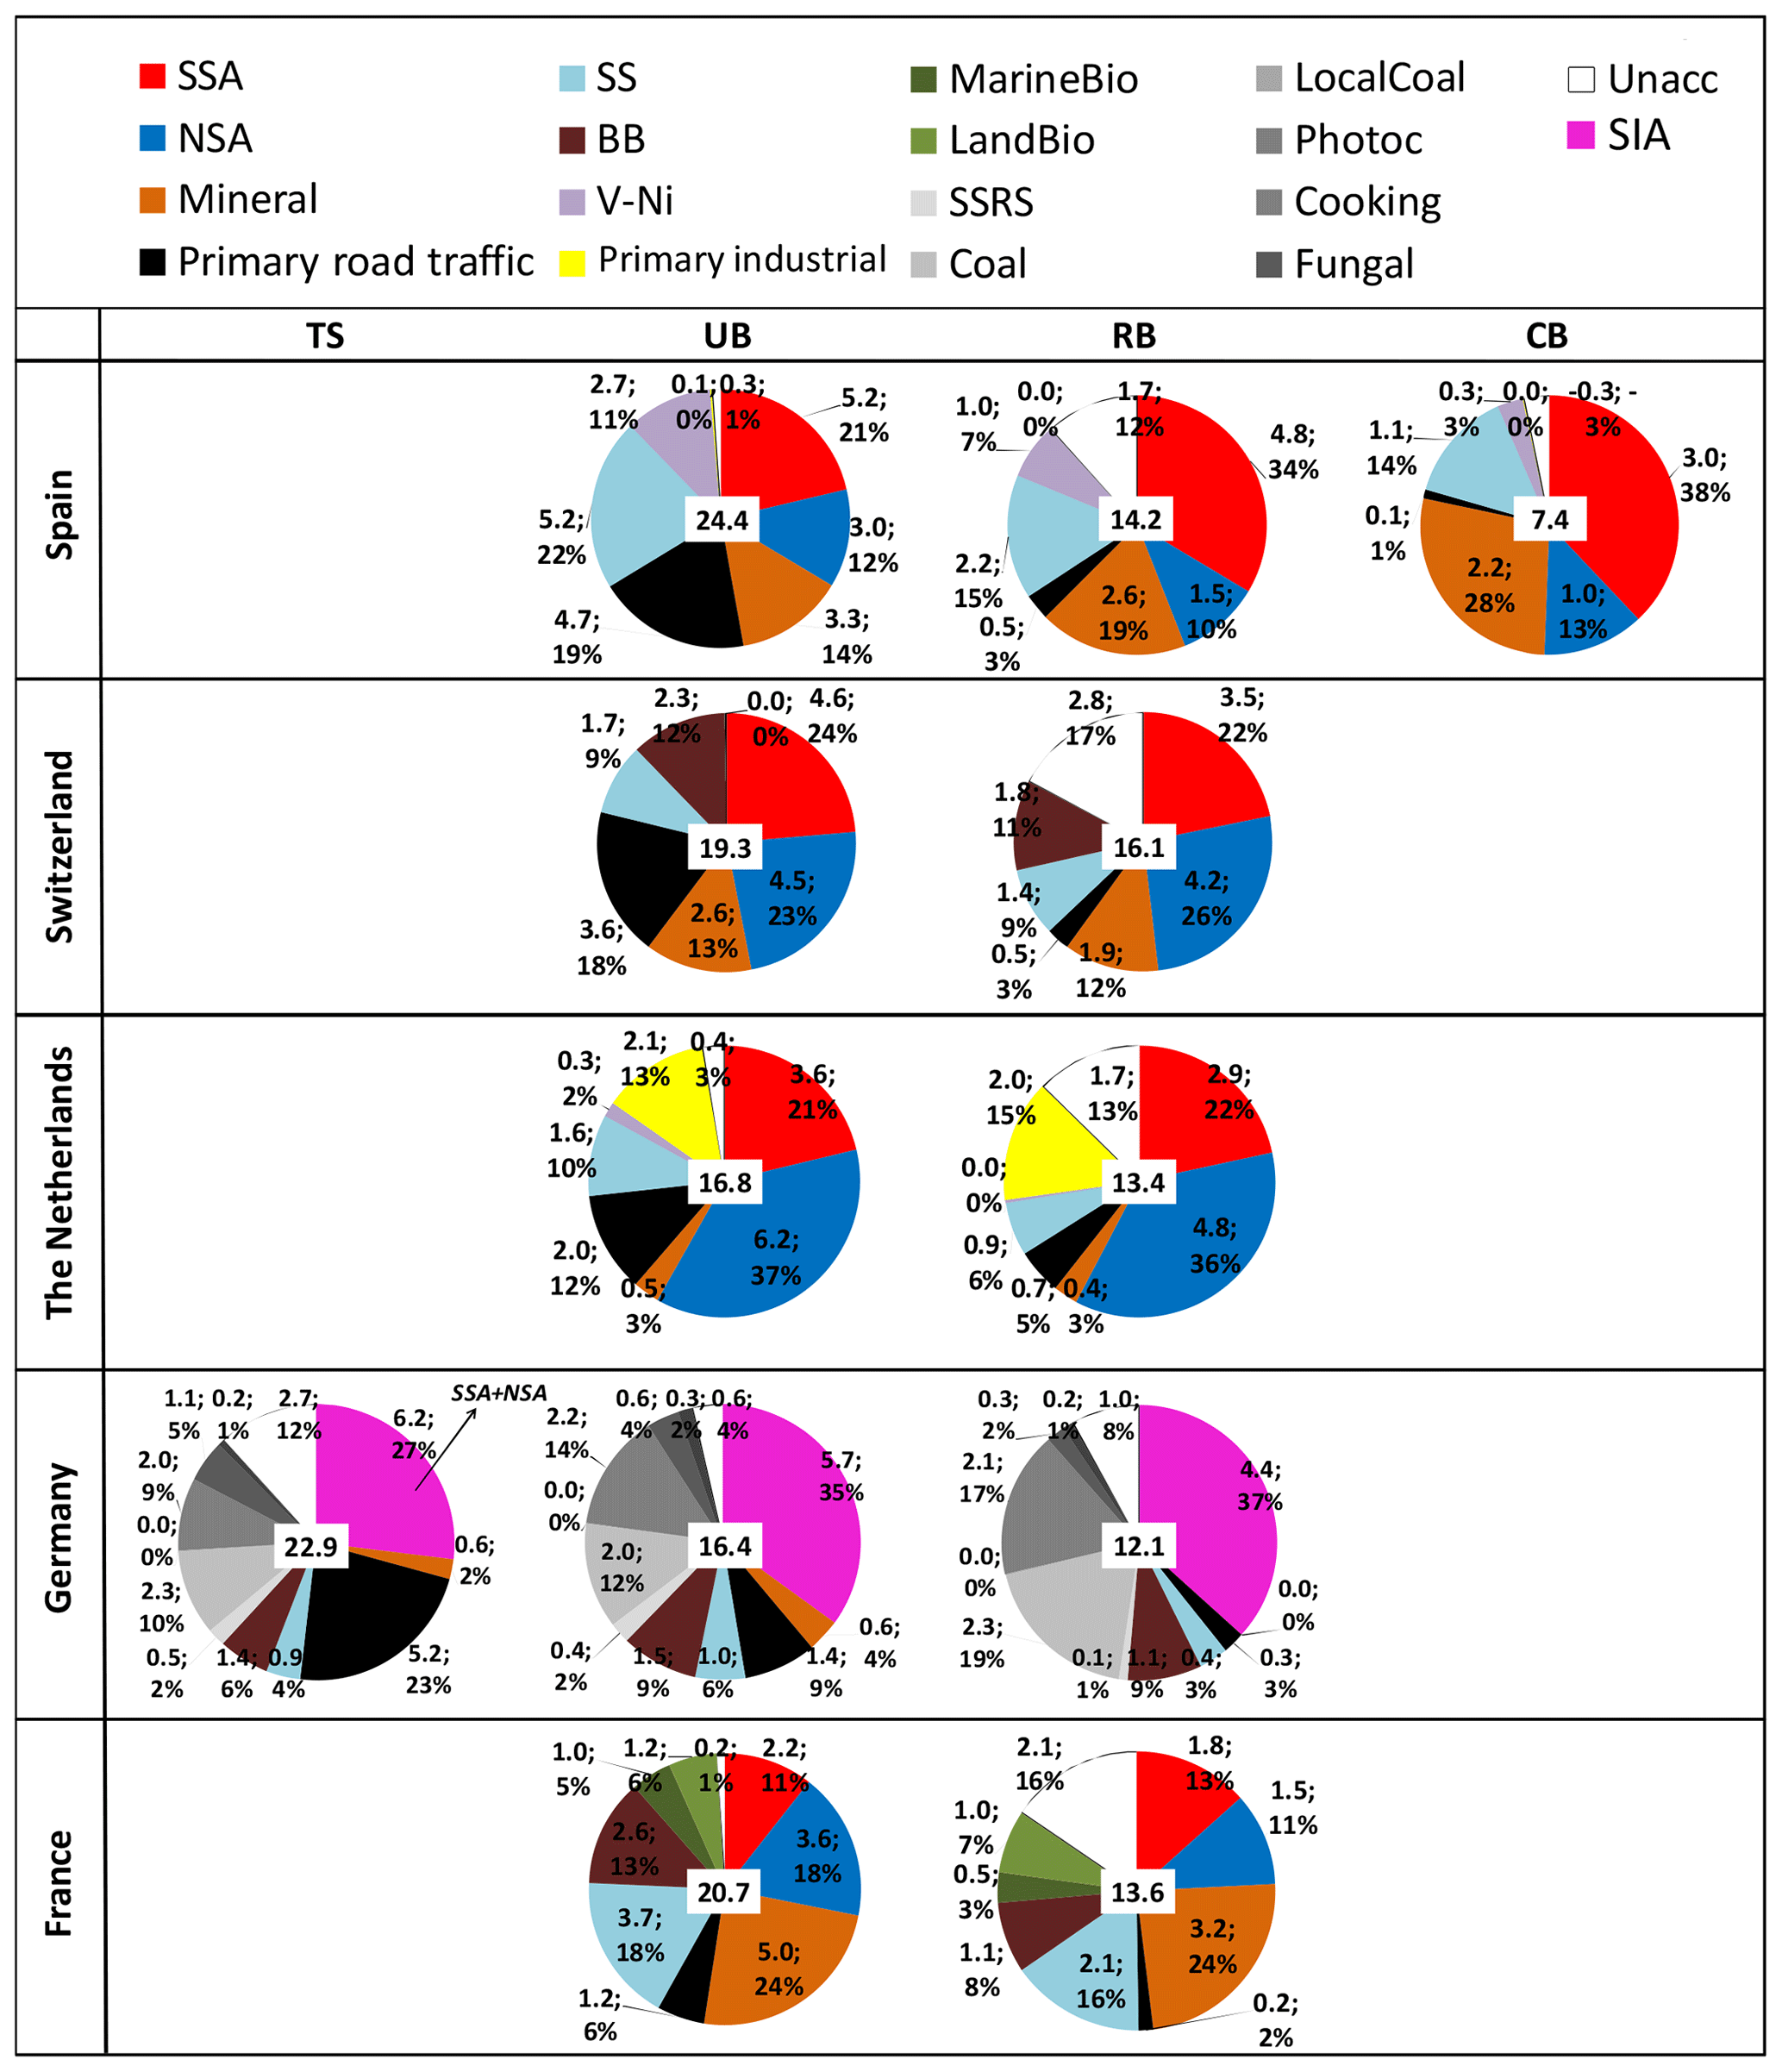
Figure 2Mean annual source contributions to PM10 (PM2.5 for NL) from the multisite PMF for each country. The number in the white box at the centre of the pie chart is the measured mass of PM (µg m−3). TS: traffic site; UB: urban background; RB: regional background; CB: continental background.
3.3 PMF source contributions and seasonal patterns
Figure 2 shows the mean annual PMF source contributions calculated for the considered paired sites. The mean winter (DJF) and summer (JJA) source contributions are presented in Figs. S4 and S5, respectively. Figure S6 reports the same information as in Fig. 2 but using box-and-whisker plots to show the data variability.
At all stations, the secondary inorganic aerosol (SIA = SSA + NSA) was among the most abundant components of PM. At UB sites the SIA contribution ranged between 5.7 and 5.8 µg m−3 (29 %–35 %) in DE and FR, where the sampling periods were similar, to around 8.2–9.8 µg m−3 (33 %–58 %) in ES, CH and NL, where the sampling periods were also similar. A decreasing gradient was observed for SIA concentrations when moving from UB (or TS) sites to RB (or CB) sites.
This gradient was mostly driven by NSA contributions, which showed higher decreasing gradients compared to SSA suggesting a regional character of this latter source. The spatial gradients will be discussed in more detail in the next section.
The contribution from the MM source to PM10 at UB sites ranged from 5.0 µg m−3 (24 %) in FR to 0.6 µg m−3 (4 %) in DE. Low MM contribution was observed at the UB station in NL (0.5 µg m−3; 3 %) where PM2.5 was measured. These regional differences could be related to the intensity and regional impact of Saharan dust outbreaks which can be very different from one year to the other, thus also contributing to explain the observed regional variation in the MM source contributions (Alastuey et al., 2016). The high MM source contribution in FR was mostly due to the period March–April 2014 (not shown), when the MM contribution reached daily means of more than 40 µg m−3. Low dust concentration in DE compared to other European countries was also reported by Alastuey et al. (2016). Moreover, van Pinxteren et al. (2016) reported that the contribution from the MM source at the German sites is much lower in winter compared to summer. For the German sites, we used data collected during one summer and two winters, thus also explaining the low annual average contribution from this source reported here. A clear decreasing gradient from UB/TR to RB/CB was also observed for the MM source contributions.
The mean annual contribution from the RT source at UB stations ranged from 4.7 (19 % of PM10 mass) in ES to 1.2 µg m−3 (6 % of PM10 mass) in FR. The highest contribution from this source was observed at the TS in DE (5.2 µg m−3; 23 %). The absolute contributions at the RB sites were similar in all countries at around 0.2–0.7 µg m−3 (2 %–5 %). Thus, the RT source showed a clear gradient indicating that this source was local at all TS/UB sites.
The contributions from the SS source were highest at the paired sites close to the sea such as in ES and FR where the mean annual contributions were around 5.2 (22 %) and 3.7 µg m−3 (18 %), respectively, at the UB stations. In both countries, the mean annual contribution calculated at RB stations was lower compared to the contribution at UB stations because of the larger distance of RB stations to the sea compared to the UB stations. At UB sites in NL, CH and DE the SS source contributed 1.6 (10 %), 1.7 (9 %) and 1.0 µg m−3 (6 %), respectively. The low SS contribution in NL was due to the coarse-mode prevalence of SS whereas PM2.5 was sampled in NL. In the following, we will not apply Lenschow's approach to the SS source contributions and we will consider this source to be totally natural and R+C in origin.
The contribution from the BB source was identified only in FR (2.6 µg m−3; 13 % at the UB site), DE (1.5 µg m−3; 9 %) and CH (2.3 µg m−3; 12 %). A previous study in Barcelona using aerosol mass spectrometer data reported a small BB contribution to organic aerosol (OA) and PM (around 11 % and 4 %, respectively) in winter in BCN (Mohr et al., 2012). Therefore, it was not possible to identify the BB source in BCN based on the PM10 chemical speciated data used here. The BB source contributions reported here for the LEN site were very similar to the values reported by Waked et al. (2014) for LEN despite the differences in periods studied. A slight gradient is observed moving from TS/UB to RB stations, indicating the presence of both local and R+C increments for this source.
The contribution from the IND source at UB stations in NE and ES was 2 (13 % of PM2.5 mass) and 0.1 µg m−3, respectively. The low IND source contribution in ES was probably due to the implementation of the IPPC Directive (Integrated Pollution Prevention and Control) in 2008 in ES (Querol et al., 2007). As reported in Fig. 2, a very small gradient was observed when moving from the UB to RB station, suggesting a regional character for this source.
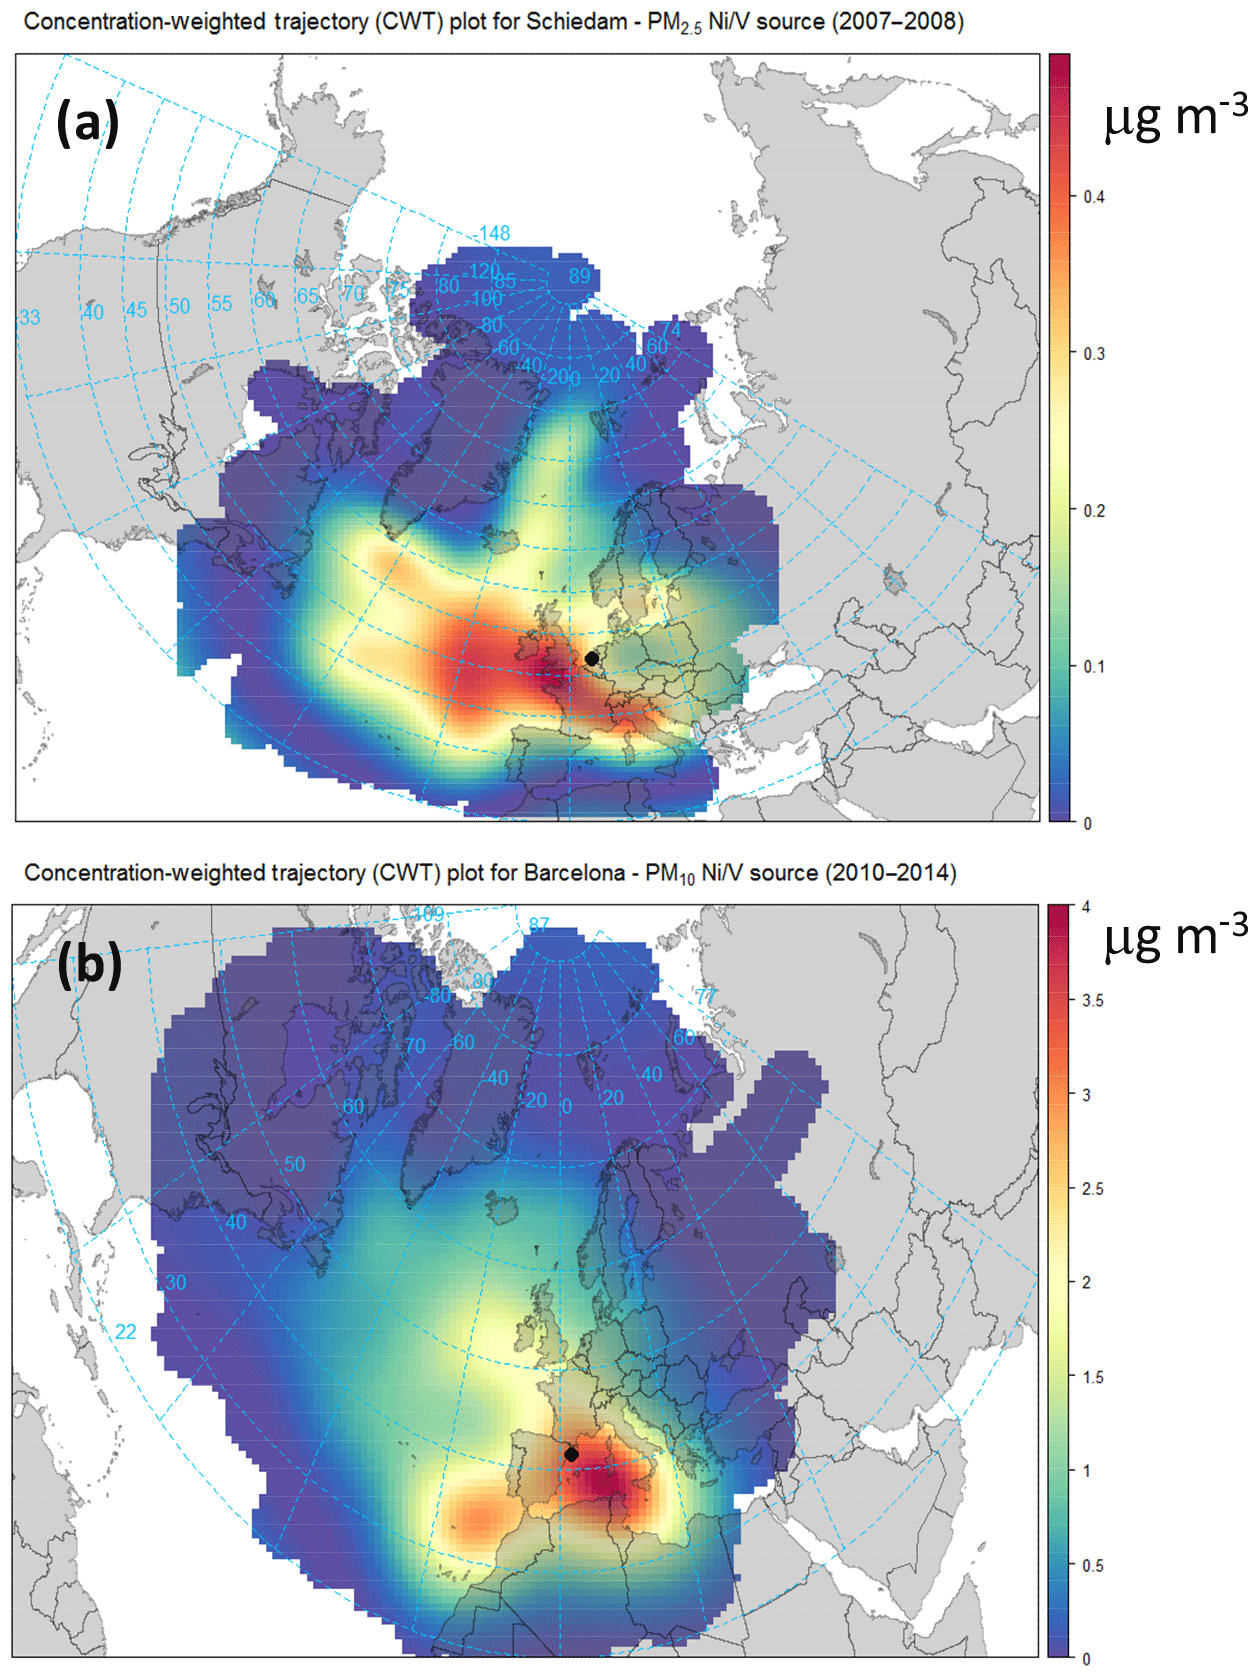
Figure 3Concentration-weighted trajectory (CWT) plots of the V–Ni source contributions for (a) Schiedam (NL; PM2.5; 2007–2008) and (b) Barcelona (ES; PM10; 2010–2014).
The V–Ni source contributions were higher in ES (2.7 µg m−3, 11 % at the UB site) compared to NL (0.3 µg m−3, 2 % at the UB site). This factor was not apportioned in the other countries: in FR the measurements of V and Ni were not available; in DE only the measurements of Ni were available (whereas V, as an important tracer of residual oil combustion, was not available); in CH, despite the fact that the measurements of V were available, the V–Ni source was not resolved likely because the distance of Swiss sites from important residual oil combustion sources. The contribution from this source in ES showed a clear gradient when moving from the UB to CB station. The high V–Ni source contribution at UB in ES was related to ship emissions from both the intense vessel traffic from the Mediterranean Sea and the port of Barcelona. Figure 3 shows the concentration-weighted trajectory (CWT) plots for the V–Ni source contributions in Barcelona (2010–2014) and Schiedam (2007–2008). The use of computed concentration fields to identify source areas of pollutants, referred to as CWT, was first proposed by Seibert et al. (1994). Here, we used the CWT function available in the openair package (Carslaw and Ropkins, 2012; Carslaw, 2012). In Fig. 3, contributions higher than the 90th percentile were used to look at the origin of high contributions from the V–Ni source. As shown in Fig. 3, the V–Ni source in ES and NL was mostly linked to maritime shipping emissions.
Figure 4 shows the G-space plots of the V–Ni and SSA source contributions for BCN (PM10; 2007–2008 and 2010–2014) (Fig. 4c and d, respectively) and SCH (PM2.5; 2007–2008; Fig. 4a). Data from Rotterdam (PM2.5; 2007–2008; Fig. 4b) were also used for the V–Ni vs. SSA comparison. Figure 4 also shows the analogous plots for four additional sites in NL, Belgium and FR for a more recent period (2013–2014), namely Wijk aan Zee and Amsterdam in NL (Fig. 4e, f), Antwerp (Belgium, Fig. 4g), and Lille (FR, Fig. 4h). Details on the measurements performed at these four additional sites, the PM10 chemically speciated data and PMF analyses can be found in Mooibroek et al. (2016).
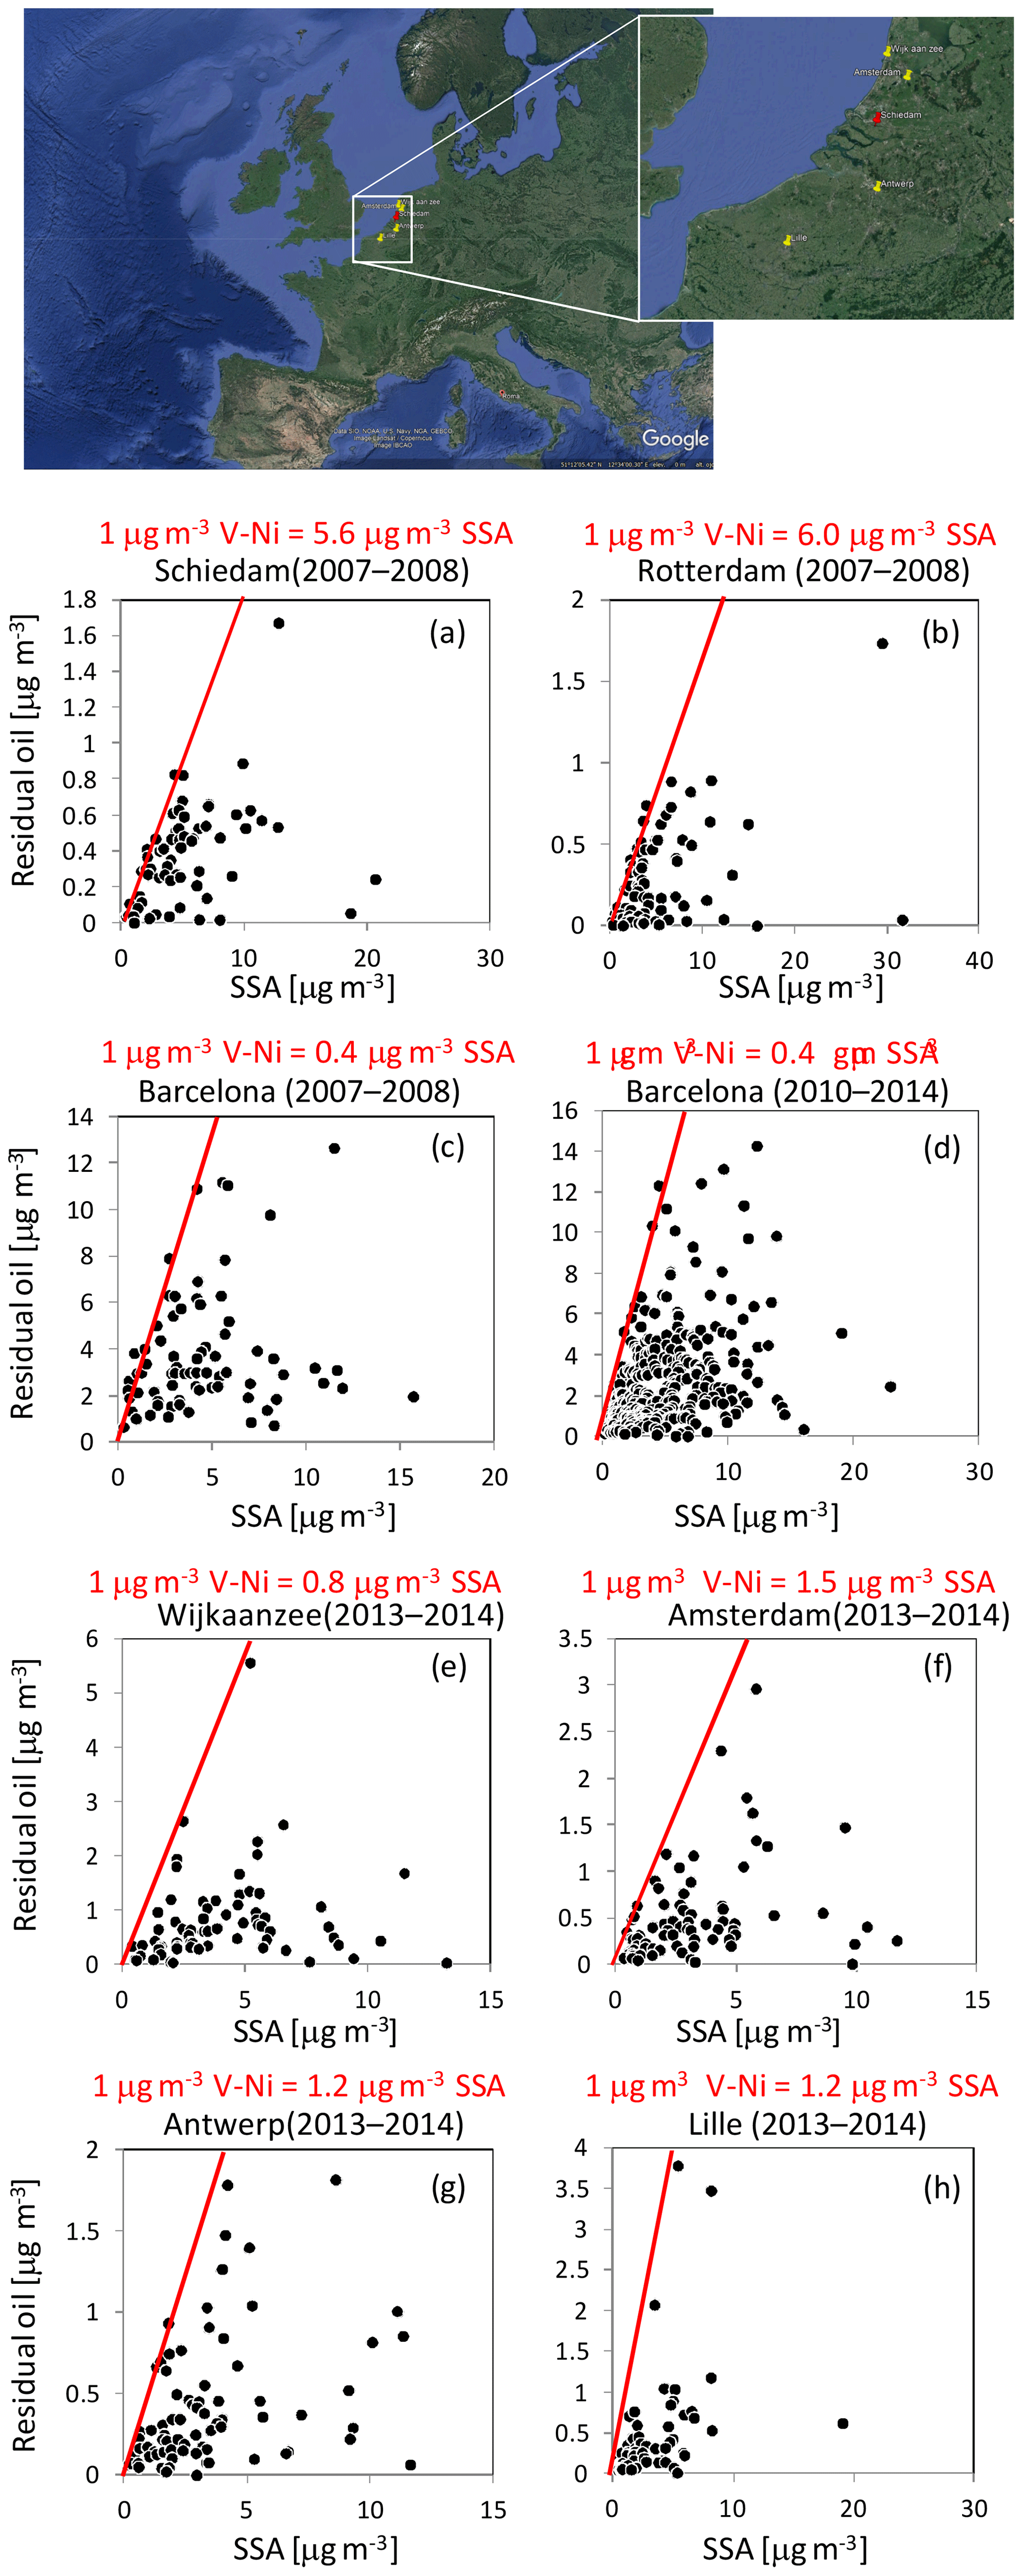
Figure 4Contributions (µg m−3) of the V- or Ni-bearing particles from shipping and SSA particles to PM at Schiedam (a), Rotterdam (b), Wijk aan Zee (e) and Amsterdam (f) in the Netherlands and Barcelona (c and d, Spain), Antwerp (g, Belgium) and Lille (h, France). The red lines represent the edges of the scatter plots. © Google Maps.
In all of the G-space plots in Fig. 4, an edge was observed (highlighted with red) that can be used to estimate the amount of SSA produced for every 1 µg m−3 of residual oil burned by ships (e.g. Kim and Hopke, 2008; Pandolfi et al., 2011b). This sulfate represents direct SO3 emissions from the ship that appear as particulate sulfate at the sampling sites (e.g. Agrawal et al., 2008, 2010).
Ship diesels typically burn high-sulfur-content residual oil (Bunker C), and thus primary sulfate emissions can be anticipated (Kim and Hopke, 2008). In BCN we found that around 0.4 µg m−3 of SSA was produced for every 1 µg m−3 of V–Ni PM10 contribution (during both 2007–2008 and 2010–2014), whereas in SCH and Rotterdam the amount of SSA was much higher, around 5.6–6.0 µg m−3, suggesting the use of a residual oil with a high sulfur content during 2007–2008. Kim and Hopke (2008) and Pandolfi et al. (2011b) reported that around 0.8 µg m−3 of SSA was produced for every 1 µg m−3 of V–Ni PM2.5 in Seattle (US) and of V–Ni PM10 in the Bay of Gibraltar (ES). The difference between BCN and SCH and Rotterdam was high during the same period (2007–2008). However, recent data (2013–2014) from the four additional sites showed lower primary SSA produced (around 0.8–1.5 µg m−3) for every 1 µg m−3 of residual oil, indicating a reduction of sulfur content in fuels (see Fig. 4). Indeed, Fig. S7 shows the strong reduction of SO2 emitted from maritime shipping in Rotterdam from 2007 to 2014 despite the rather constant number of ships registered in port (Environmental Data Compendium, Government of the Netherlands, https://www.clo.nl/en, last access: 16 March 2019). A similar result was reported by Zhang et al. (2019). In their study, Zhang et al. (2019) showed the significant reduction in ambient SO2, EC, V and Ni concentrations at both port sites and urban sites in Shanghai after the implementation of the Chinese DECA (Domestic Emission Control Areas) despite increasing ship traffic activity. Moreover, a report of the Netherlands Research Program on Particulate Matter (Denier van der Gon and Hulskotte, 2010) showed that in the port of Rotterdam in 2003 the dominant energy source for ships in berth was high-sulfur-content heavy fuel oil (HFO). The use of HFO in berth was a surprising result, as it is often thought that ships use distilled fuels while in berth (Denier van der Gon and Hulskotte, 2010). The observed reduction in primary SSA from ships in NL from 2007–2008 to 2013–2014 could also be due to the change of fuel used by ships in berth, from HFO to low-sulfur-content marine diesel oil. The type of fuel used by ships while in berth could also explain the difference observed between BCN and SCH during 2007–2008.
The marine biogenic and land biogenic sources, assessed only in FR, contributed around 1.0 and 1.2 µg m−3, respectively, at the UB station. These two sources were not identified in the other countries mostly because the measurements of methanesulfonic acid and traced alcohols (arabitol and mannitol) were not available. Analogously to the SS source, Lenschow's approach was not applied to the contributions from these two sources that were considered to be totally R+C and natural.
Finally, in DE, the contributions from the six sources assessed only in this country summed to mean values of 5.6 µg m−3 (34 %) at the UB site. Among these six sources, the contribution from coal combustion was the highest in winter (suggesting the influence of building heating), explaining around 60 %–70 % of the total contributions from these six sources. In summer, photochemistry was the source contributing mostly to the total from the six sources (50 %–80 %). Among these six sources, only the contribution from the fungal spore source was considered to be totally R+C and natural.
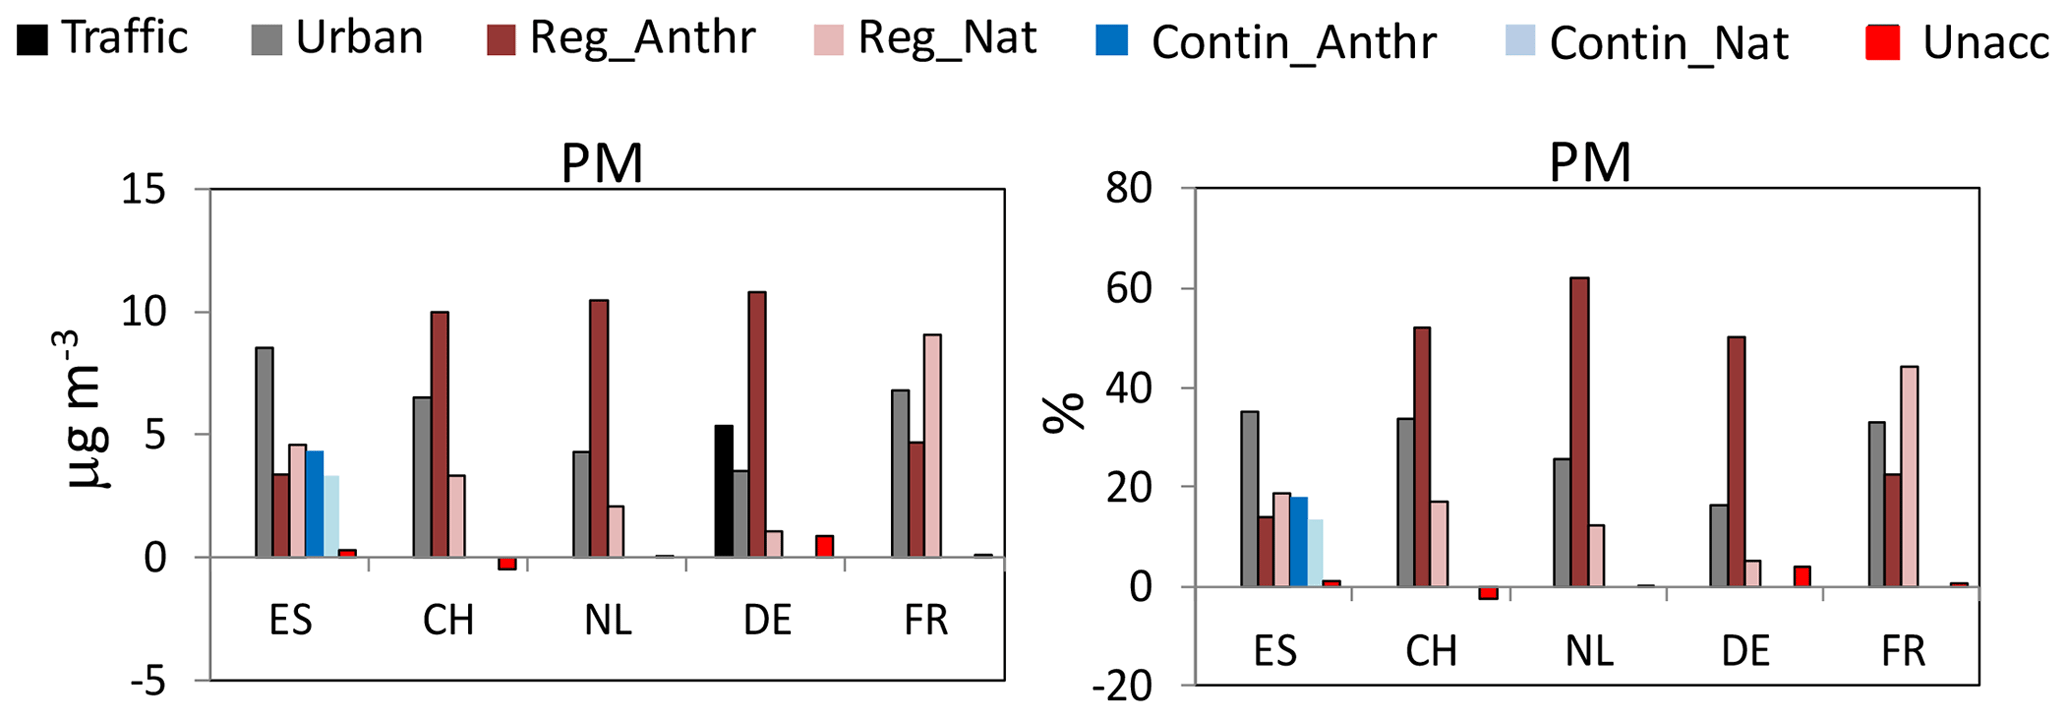
Figure 5Lenschow's approach applied to the concentrations of PM10 in the different countries (PM2.5 in the Netherlands). Annual means are reported. ES: Spain; CH: Switzerland; NL: the Netherlands; DE: Germany; FR: France. In all countries with the exception of Spain, Reg_Anthr and Reg_Nat are the sum of the regional and continental increments.
3.4 Spatial increments: Lenschow's approach results
The results of Lenschow's approach applied to the PM mass concentrations and to the PMF source contributions for each country are presented in Fig. 5 and Table S7 and Fig. 6 and Table S8, respectively. Figures 5 and 6 show the annual average values. Allocation of PM concentrations and source contributions for winter (DJF) and summer (JJA) are presented in Figs. S8 and S9 and Table S7 for PM concentrations and in Figs. S10 and S11 and Tables S9 and S10 for the PMF source contributions.
An attempt was made to separate the natural and anthropogenic R+C increments, whereas the urban increment was considered to be totally anthropogenic. We considered some sources such as aged sea salt, fresh sea salt, marine biogenic and land biogenic as totally natural without allocating their contributions to the different spatial levels. Thus, for example, we assumed that there were no local (traffic/urban) sources of fresh sea salt. For the aged sea salt source the presence of SIA in the chemical profile suggests that this source was not entirely natural. However, we cannot estimate the relative natural and anthropogenic contributions to this source using data available here. The urban MM increment was associated with resuspended dust from passing vehicles and local demolition/construction activities. Consequently, it was considered anthropogenic in origin. Conversely, the R+C MM increment was considered to be of natural origin from both windblown dust and Saharan dust episodes, the latter being most important in the Mediterranean region and especially in summer compared to other European countries (Pey et al., 2013; Alastuey et al., 2016). Nevertheless, regional suspended soil could be the result of anthropogenic activities such as farming. However, it is impossible based on the available information to estimate the relative contributions of natural and anthropogenic sources to the R+C MM increments. Other sources such as SSA and NSA, RT, IND, V–Ni and BB were considered anthropogenic in origin. Finally, the gradients of PM concentrations reported in Fig. 5 and Table S7 were calculated by summing the increments calculated from the different source contributions, and not as the difference between the gravimetric measurements performed at the paired sites.
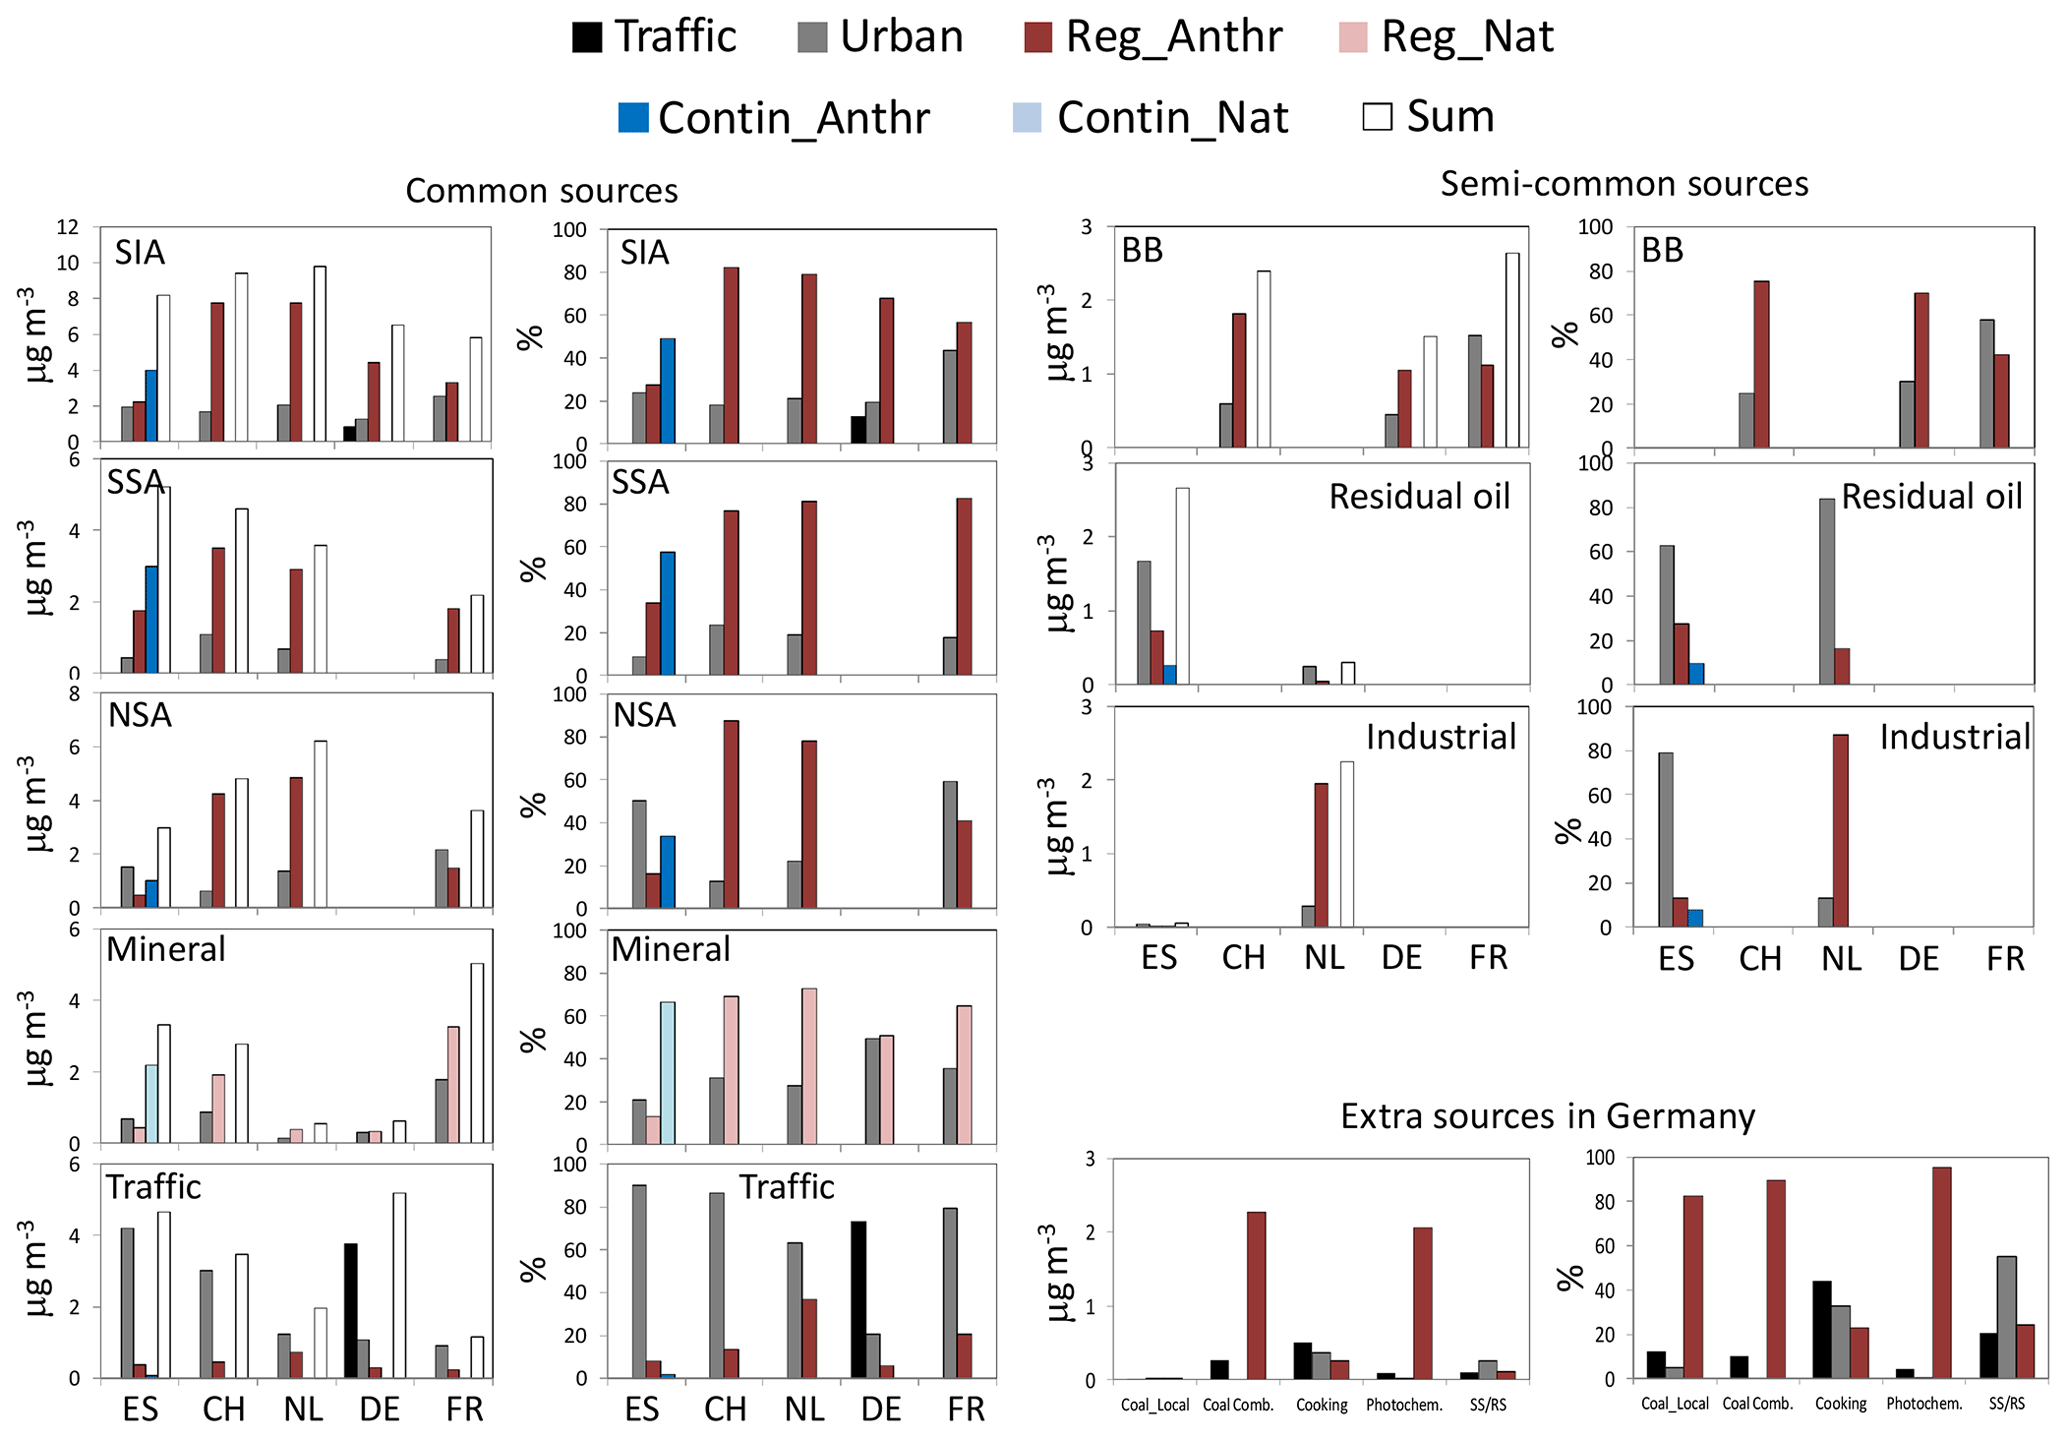
Figure 6Lenschow's approach applied to the PM10 (PM2.5 in the Netherlands) PMF source contributions. Annual means are reported. ES: Spain; CH: Switzerland; NL: the Netherlands; DE: Germany; FR: France. In all countries, with the exception of Spain, Reg_Anthr and Reg_Nat are the sum of the regional and continental increments. Lenschow's approach applied to the PM10 (PM2.5 in the Netherlands) PMF source contributions. Annual means are reported. ES: Spain; CH: Switzerland; NL: the Netherlands; DE: Germany; FR: France. In all countries, with the exception of Spain, Reg_Anthr and Reg_Nat are the sum of the regional and continental increments.
3.4.1 Urban and regional–continental PM allocation
As reported in Fig. 5, the sum of the annual natural and anthropogenic R+C PM increments in all countries was higher compared to the urban increments, therefore confirming the statement of the 2016 LRTAP Assessment Report about the importance of long-range air pollution, even in urban areas. On an annual basis, the relative R+C PM10 increments were similar in all countries and ranged between around 64 % in ES and 74 % in DE (see Table S7). For this comparison, the R+C PM increment in ES was calculated as the sum of regional and continental increments, and in DE it was calculated as relative to the PM10 concentration measured at the UB site (not at the LMI traffic site). If the relative R+C PM10 increment in DE is calculated with respect to the PM10 mass measured at the LMI traffic site, then the R+C increment can be estimated to be around 55 % in close agreement with the R+C PM10 increment reported by van Pinxteren et al. (2016). For NL, the relative R+C PM2.5 increment was around 74 %, whereas in CH and FR the relative R+C PM10 increments were around 67 %–69 %.
In terms of absolute values, the lowest PM urban and R+C (anthropogenic and natural) increments were observed in DE (3.5 and 11.9 µg m−3 of PM10 mass measured at the UB TRO site) where the PM10 concentrations were also lower compared to the other cities included in this work. The highest urban and R+C PM increments were instead observed in ES (8.5 and 15.6 µg m−3 of PM10 mass measured in BCN) where the PM10 concentrations were higher. For DE, the local PM increment measured at the traffic site (LMI) was 5.4 µg m−3 (see Table S7) and contributed around 25 % to the PM mass measured at LMI.
Overall (annual means; see Table S7 and Figs. 5, S8 and S9), the R+C PM increments due to anthropogenic activities in CH, NL and DE were higher compared to the R+C PM increment due to natural sources. In these countries, the R+C anthropogenic PM increments were very similar (10–10.8 µg m−3) and explained around 52 %, 62 % and 66 % of the PM mass measured at the UB stations. Conversely, in these three countries, the R+C PM increments due to natural sources varied more (1.1–3.3 µg m−3) and explained around 17 %, 12 % and 7 % of the UB PM mass. In ES, the anthropogenic and natural R+C PM increments were similar (around 8 µg m−3) and both explained around 32 %–33 % of the PM mass measured at BCN. Conversely, in FR, the R+C natural PM increment was the highest (around 9.1 µg m−3) and explained around 44 % of the PM mass measured in LEN, whereas the R+C anthropogenic PM increment was around 4.6 µg m−3 (23 %). As shown later, the high R+C natural PM increment observed in FR and ES was mostly related to regional emissions from SS and MM sources. Moreover, in FR, marine biogenic and land biogenic source emissions also contributed to the high R+C natural PM increment.
In all countries, with the exception of DE, the absolute and relative PM urban increments were higher in winter compared to summer (see Table S7). This result suggested that in winter, the typical atmospheric conditions in these countries of lower wind speeds and lower mixed-layer heights favoured the accumulation of locally emitted pollutants compared to summer. The winter-to-summer PM urban increment ratios ranged between 1.5 in CH and 3.5 in FR. The lack of a clear seasonal profile for the PM urban increment at TRO (DE) could be due to the overall effect that the two main air mass inflows have on pollutant concentrations at the German sites during both seasons (van Pinxteren et al., 2016). As shown in van Pinxteren et al. (2016), the source contributions to PM at the German sites differed considerably depending on the sources, seasons and air mass inflows.
The natural and anthropogenic R+C PM increments showed different seasonal patterns. Those due to natural sources were higher in summer at all sites with the exception of NL where the R+C natural PM increment was higher in winter. As shown later, the observed higher summer R+C PM natural increments were due to MM and SS source emissions that were higher on average during the warm season. Conversely, as also shown in Waked et al. (2014), the high R+C PM natural increment in NL in winter was due to SS emissions that were higher during the cold season (see Tables S8 and S9).
The R+C PM increments due to anthropogenic sources showed an opposite seasonal profile compared to the R+C natural PM increments. In fact, the anthropogenic R+C PM increments were lower in summer compared to winter in all countries, with the exception of ES where they were higher in summer compared to winter. As shown later, the higher anthropogenic R+C PM increment in summer in ES was mostly driven by high contributions from regional SSA sources, mostly related to ship emissions at the Spanish sites, and the peculiar meteorological patterns in the Western Mediterranean inducing vertical recirculation of air masses (i.e. Millán et al., 1997). The relatively lower anthropogenic R+C PM increment observed in the other countries in summer compared to winter was mostly related to high winter contributions from NSA and BB regional sources.
3.4.2 Allocation of PMF source contribution
Sources identified at all paired sites
SIA source (anthropogenic). In all countries, the majority of SIA calculated from PMF was of R+C origin (Fig. 6). On annual average, the lowest relative R+C SIA increment was around 57 % in FR (where 43 % of SIA was of local origin). In the other countries, the relative R+C SIA increment was similar and ranged between around 76 % and 85 % in ES and CH, respectively. In absolute values, the highest R+C SIA increment (around 7.7 µg m−3; see Table S8) was observed in CH and NL, followed by ES (6.2 µg m−3), DE (4.4 µg m−3) and FR (3.3 µg m−3). The relative R+C SIA increments were similar in winter and summer in all countries with the exception of ES where in summer the relative R+C SIA increment (around 88 %; see Fig. S11 and Table S10) was much higher compared to winter (51 %; see Fig. S10 and Table S9). In summer, the Western Mediterranean Basin is characterised by regional recirculation episodes driven by strong insolation and the orography of the area. These conditions in summer favour the formation of cells on the mesoscale to regional scale (i.e. Millan et al., 1997; 2000), and air masses recirculate over the region, causing dispersion and ageing of pollutants. Furthermore, the high summer insolation favours a faster oxidation of SO2 and, accordingly, higher concentrations (i.e. Querol et al., 1999). During these summer conditions, the SIA concentrations were similar at the three Spanish sites, thus leading to high relative R+C SIA contributions in summer compared to winter in ES (see Figs. S4 and S5).
In absolute values, the R+C SIA increments were higher in winter compared to summer in all countries, with the exception of ES. The winter-to-summer R+C SIA increment ratios (using absolute values) ranged between 1.5 in FR and around 5 in DE. In ES the ratio was 0.7. As shown later, the difference observed between ES and the other countries was due to the different effects that SSA and NSA have on the seasonal SIA profile. In ES, the higher relative and absolute R+C SIA increments in summer compared to winter were due to the increase in the R+C SSA increment during the warm season. In the other European countries, the higher winter R+C SIA increment compared to summer was due mostly to the strong increase in the NSA regional increment during the cold season. The very high winter-to-summer R+C SIA increment ratio observed in DE was likely related to the air mass transport at the German sites. As reported by van Pinxteren et al. (2016), in DE during both summer and winter two air mass origins prevail: western and eastern inflow. Particle mass concentrations in Leipzig were typically higher during eastern than western inflow and especially during the winter period, thus explaining the high winter-to-summer ratio of the R+C SIA increment in DE. This trend has been commonly observed in the area of Leipzig and can be explained with a more continental character of eastern air masses (western air masses typically spend considerable time above the Atlantic Ocean) and higher PM pollution in eastern European countries (e.g. Pokorná et al., 2013, 2015).
SSA source (anthropogenic). As expected, the majority of SSA measured in the selected cities was of R+C origin. On an annual basis, the highest R+C SSA increment was observed in ES (4.8 µg m−3, 91 % of SSA source contribution in BCN). Thus, in BCN the local SSA increment was low (0.5 µg m−3; 9 %). The high R+C SSA increment in ES was likely due to shipping emissions in the Mediterranean Sea, whereas the very local SSA increment could be linked to the emissions of primary sulfate from ships in the port of Barcelona. Recently, Van Damme et al. (2018) identified Catalonia (NE Spain) as one of the major hotspots in terms of NH3 emissions. In all other countries, the annual R+C SSA increment was lower and ranged between 3.5 µg m−3 (77 % of SSA source contribution) in CH and 1.8 µg m−3 (83 %) in FR where the lowest absolute R+C SSA increment was observed. The R+C SSA increment in NL, where the NH3 emissions are high (Van Damme et al., 2018), was estimated to be around 2.9 µg m−3 (81 % of SSA) and is the remaining SSA associated with primary emissions from ships. The relatively high annual urban SSA increment observed at ZUE (CH; 1.1 µg m−3; 24 % of SSA contribution in ZUE; see Fig. 6 and Table S8) could be related to local road traffic and wood combustion emissions which in addition contribute to NSA and SSA through emissions of gaseous precursors of SIA (Gianini et al., 2012). In the other cities included in this analysis, the local SSA increment ranged between 0.4 (LEN, FR) and 0.7 (SCH, NL) µg m−3 (0 %–18 %).
In absolute values, the R+C SSA increment in summer was higher compared to winter in all countries with the exception of NL where a higher R+C SSA increment was observed in winter (4.0 µg m−3) compared to summer (2.6 µg m−3). Mooibroek et al. (2011) reported a flat seasonal pattern of the SSA source contributions in NL that resembled the long-term average of . Moreover, the low SSA summer-to-winter ratio in the Netherlands could also be associated with emissions of primary sulfate from ships, which, as shown before, were high in SCH during the period considered. In ES, the R+C SSA increment in summer (see Table S10) was related to long-range transport of SSA, which accumulated over the region due to the summer regional recirculation described above, and the photochemistry which enhances the SO2 oxidation.
Finally, in all countries the SSA absolute local increments did not show clear seasonal cycles likely resembling the effect of local sources on SSA.
NSA source (anthropogenic). On annual average, high and similar R+C NSA increments were observed in CH (annual mean: 4.2 µg m−3; 94 % of NSA contribution in ZUE) and NL (4.8 µg m−3; 78 % of NSA contribution in SCH). Conversely, lower R+C NSA increments were observed in ES (1.5 µg m−3; 50 % of NSA contribution in BCN) and FR (1.5 µg m−3; 41 % of NSA contribution in LEN). In BCN (ES), the high local NSA increment (around 50 % or 1.5 µg m−3 of NSA source contribution in BCN) was explained by the NOx emissions from traffic and the availability of NH3 in the city of Barcelona (e.g. Reche at al., 2012; Pandolfi et al., 2012). High NOx emissions originating from road traffic could also be responsible for the high local NSA increment in LEN (FR; 2.1 µg m−3; 59 % of NSA contribution to PM10 in LEN). Agricultural emissions of NH3 and NOx from road and maritime traffic and industry were the likely cause of the high R+C NSA increment observed in particular in NL and CH.
In all countries, as a consequence of the thermal instability of ammonium nitrate, both local and R+C NSA increments were higher in winter compared to summer (Figs. S10 and S11 and Tables S8 and S9). In both winter and summer, the highest local and R+C NSA increments were observed in NL. As reported in Mooibroek et al. (2011), the concentration of ammonia in the Dutch atmosphere is such that when sulfate is fully neutralised, a considerable amount is left to stabilise the ammonium nitrate even in summer. In this country, the mean R+C NSA increments were 10 and 2.5 µg m−3 in winter and summer, respectively. The high summer R+C NSA increment in NL (much higher compared to the other countries where it was around 0–0.8 µg m−3) was due to the high concentration of NH3 in the Dutch atmosphere and NOx emissions. NH3 concentration is such that when SSA is fully neutralised, a considerable amount is left to stabilise the ammonium nitrate in summer as well (Mooibroek et al., 2011).
Mineral (local anthropogenic; regional+continental natural). On an annual basis, the R+C MM increments were higher compared to the local increments at all sites with the exception of DE where the urban and R+C increments were similar. As reported in van Pinxteren et al. (2016), the MM factor identified in DE was characterised by a high nitrate fraction and anthropogenic n-alkane signature indicating a mixture of soil with urban pollution, thus likely explaining the lower R+C increment compared to the other sites. Moreover, the seasonal and site dependencies of concentrations presented in van Pinxteren et al. (2016) suggested an urban background MM source without direct association with traffic. This could be the reason for the null traffic MM increment reported here for the German traffic site (Fig. 6 and Table S8). The highest urban and R+C MM increments were observed in FR (1.8 and 3.2 µg m−3, respectively) followed by ES (0.7 and 2.6 µg m−3, respectively) and CH (0.9 and 1.9 µg m−3, respectively), whereas these values were much lower in NL (where PM2.5 was sampled) and DE. For LEN (FR), Waked et al. (2014) showed a very similar trend for the MM factor and for primary traffic emissions in Lens, suggesting a major influence of road transport for particle resuspension. Alastuey et al. (2016) have shown that in the north of FR, the average mineral dust concentration and its relative contribution to PM10 were higher compared to DE and mostly in summer.
As shown in Fig. 6, the majority of the R+C MM increments in ES were of continental origin (2.2 µg m−3 continental and 0.4 µg m−3 regional; see Table S8) and especially in summer (3.2 µg m−3 continental and 0.1 µg m−3 regional), whereas in winter the regional and continental contributions were lower and similar (0.4 µg m−3 continental and 0.5 µg m−3 regional). The seasonality of the MM increments observed in ES was also due to the long-range transport of mineral dust from the Sahara during Saharan dust outbreaks (Querol et al., 2009; Pey et al., 2013). As shown in Alastuey et al. (2016), the contribution from desert dust to PM is expected to be higher in the Mediterranean region compared to central/northern Europe. The higher R+C MM increments in summer compared to winter, also observed in the other countries, were linked to the enhanced regional resuspension of dust during the dry season together with Saharan dust outbreaks which are more sporadic in central and northern Europe (i.e. Gianini et al., 2102).
Road traffic (anthropogenic). As expected, the majority of the RT source emissions were of local origin in all cities included in this analysis. The relative urban RT increments ranged between 62 % in SCH (NL) and 90 % in BCN. The relatively high R+C RT increment observed in NL (36 % compared to 6 %–20 % in the other countries) was in agreement with the value reported by Mooibroek et al. (2011). In winter, the local RT increments were higher than in summer in BCN (ES) and SCH (NL) by factors of 2 and 4, respectively. Conversely, similar winter and summer local RT increments were observed in ZUE (CH), LMI (DE) and LEN (FR). For DE, van Pinxteren et al. (2016) have shown that for coarse particles urban background and traffic increments were broadly similar in year-round averages. It is important to note that the identification of a clear RT source at the regional level in the selected countries and, consequently, the possibility to resolve a regional RT increment, even if low, were due to the application of the multisite PMF.
Sources identified only at a subset of paired sites
Biomass burning (anthropogenic). On an annual basis the R+C BB increments were rather similar in CH (1.8 µg m−3; 78 % of BB contribution in ZUE), DE (1.1 µg m−3; 77 % of BB contribution in LMI/TRO) and FR (1.1 µg m−3; 42 % of BB contribution in LEN). A notable difference was the relatively higher urban BB increment observed in LEN (1.5 µg m−3; 58 %) compared to LMI/TRO (0.3 µg m−3; 23 %) and ZUE (0.6 µg m−3; 22 %). Both the urban and R+C BB increments were much higher in winter compared to summer at the three paired sites where the BB source was found. In CH, the R+C BB increment in winter reached around 3.9 µg m−3 (73 % of winter BB contribution in ZUE), whereas it was around 1.7–1.9 µg m−3 in DE and FR. In winter, the highest urban increment was observed in LEN (FR; 2.7 µg m−3; 59 %).
Residual oil combustion (V–Ni) and industrial (anthropogenic). In both ES and NL (see Figs. 6, S10 and S11 and Tables S7, S8 and S9), the local V–Ni increments were higher compared to the R+C V–Ni increments likely because of the influence of emissions from the port of Barcelona and Schiedam. Both the urban and R+C V–Ni increments were much higher in ES (1.7 µg m−3 urban and 1.0 µg m−3 R+C) than in NL (0.2 µg m−3 urban and 0.1 µg m−3 R+C), especially in summer when the urban and R+C increments in ES reached around 1.9 µg m−3 (56 %) and 1.5 µg m−3 (44 %), respectively. Thus, the V–Ni and the SSA local/R+C increments strongly contributed to the observed seasonal profile of PM measured in Barcelona.
On annual average, the urban and R+C IND increments were almost negligible in ES (0.04 and 0.01 µg m−3, respectively) compared to NL (0.3 and 2.0 µg m−3, respectively). The R+C IND increments in NL were higher in summer (2.3 µg m−3; 96 %) compared to winter (1.7 µg m−3; 95 %). Mooibroek et al. (2011) showed that the IND source profile had slightly higher contributions during summer compared to the other seasons. Due to the lack of a pronounced seasonal pattern and the similar contribution at all Dutch receptor sites, Mooibroek et al. (2011) assumed the IND source was a common source representing negligible local contributions.
Sources identified only at one paired site
As already shown, two additional natural sources were identified in FR; marine biogenic and land biogenic sources. These sources can be considered totally natural. Thus, Lenschow's approach was not applied.
In DE, six extra sources were resolved and among these sources the fungal spore source was considered totally regional–natural. For the other five sources, the Lenschow approach was applied, and the results are shown in Fig. 6 and Table S8. Among these five sources, the contributions from coal combustion and photochemistry sources were the highest. Both sources showed strong seasonal characters and were mostly of R+C origin. The R+C coal combustion increment was much higher in winter (3.9 µg m−3; 90 % of coal combustion source contribution to LMI) compared to summer (0.01 µg m−3; 33 %), whereas the R+C photochemistry increment was slightly higher in summer (2.2 µg m−3; 83 %) compared to winter (1.9 µg m−3; 97 %). As reported in van Pinxteren et al. (2016), coal combustion was a significant source only during easterly air mass inflow in winter and showed very similar concentrations at all sites included in van Pinxteren et al. (2016), highlighting the importance of transboundary air pollution transport in the study area. This, together with increased regional concentrations of biomass combustion (e.g. Hovorka et al., 2015) and secondary material, emphasises the importance of transboundary pollution transport for regional air quality in the area of Leipzig.
This investigation aimed at discriminating local and R+C contributions from different sources to the concentrations of PM measured in five European cities. To accomplish this objective, we selected five paired sites in Europe (traffic–urban and regional–continental) providing PM chemically speciated data and applied the PMF model (EPA PMF v5.0). The obtained PM source contributions were then used to estimate the urban and non-urban (regional+continental; R+C) PM and source contribution increments through the application of Lenschow's approach. Urban increments were computed by withdrawing the rural source contributions to the local (urban) source contributions. In turn, regional increments were computed by withdrawing remote contributions (when available, i.e. in ES) to the regional contributions. For those countries where a remote site was not available, we did not separate the regional contributions from the continental contributions and the sum of the two (R+C) was calculated.
The results presented here provided a robust and feasible source allocation and estimation of the R+C increments to urban pollution. With the approach presented (multisite PMF + Lenschow's approach), we were able to allocate urban pollution to major primary sources by activity sector or to main secondary aerosol fractions thanks to the application of the positive matrix factorisation (PMF) model that gathers together species emitted from the same source. Regarding source allocation for secondary aerosols, it is important to note that the sources such as shipping, agricultural activities, road transport, power generation, industry and the domestic sector are important contributors of gaseous precursors and consequently of secondary aerosols. However, these separated contributions cannot be easily identified using PMF that tends to group (e.g. NSA) secondary nitrates formed from different sources in the same source. However, the PMF allocation for secondary aerosols presented here is extremely useful for models that can simulate, for example, NSA particles starting from emissions from different sectors. Moreover, this approach turns out to be useful in air quality management to assess both the sources and the relevance of local and regional emissions.
We have shown that we can use paired sites to estimate the relative contributions of local and R+C sources of PM. Sources of primary PM such as traffic dominate at the local scale while secondary PM like sulfate is mostly R+C in origin. However, NSA has a local component because of its rapid formation rates and the availability of NH3 in urban settings. Other potentially important local sources of PM are emissions from ships, ports and industry, especially in cities with harbours. We have shown that the amount of primary SSA emitted by ships depends on the amount of sulfur content in residual oil burned and that it was much higher in NL compared to ES during 2007–2008. We have also shown that the primary SSA emitted by ships in NL was much lower in 2013–2014 compared to 2007–2008 due to change of fuel used by ships in berth and, in general, to the shift from high-sulfur- to low-sulfur-content fuels. Finally, potentially important regional sources are biomass burning and coal combustion.
The last EMEP report on air pollution trends in the EMEP region (Colette et al., 2016) detailed the significant negative trends observed at 38 % (for PM10) and 55 % (for PM2.5) of the sites during the period 2002–2012, with a relative change over the decade of −29 % ([−29,−19]) and −31 % ([−35,−25]) for PM10 and PM2.5, respectively. The observed reductions were mostly driven by the decrease in , and particles because of the reduction of the concentrations of gaseous precursors such as SO2, NO2 and NH3. SO2 and sulfate particles showed the strongest decreasing trends with median relative changes over the period 2002–2012 of −48 % [−53,−38] and −39 % [−42,−27], respectively. These decreases were even stronger during the period 1990–2001 with median relative changes of −80 % [−82,−72] and −52 % [−56,−46], respectively. NO2 and particulate nitrate, cumulated with gaseous nitric acid (), showed lower decreasing trends of −17 % [−20,18] and −7.1 % [−12,18], respectively, during 2002–2012 and −28 % [−34,−19] and −24 % [−39,−9.8], respectively, during 1990–2001. Particulate cumulated with gaseous NH3 () showed a decreasing trend of −14 % [−15,23] and −40 % [−47,−19] during the period 2002–2012 and 1990–2001, respectively. Recently, Pandolfi et al. (2016) reported total reductions of around 50 % for both PM10 and PM2.5 in Barcelona (UB; NE ES) during the period 2004–2014 and around 8 % and 21 %, for PM10 and PM2.5, respectively, at the regional level in the NE of Spain (RB Montseny station). The sources that mostly contributed to the observed PM reductions were secondary , secondary and residual oil combustion. The contributions from these sources decreased exponentially over the decade, with the sharpest decrease observed for secondary in Barcelona mostly, but not only, because of the ban of heavy oils and petroleum coke for power generation around Barcelona from 2007 and the European Commission Large Combustion Plant Directive, which resulted in the application of flue gas desulfurisation (FGD) systems in a number of large facilities spread regionally. The fact that the trend of the secondary source contribution in NE Spain was exponential suggested the attainment of a lower limit and indicated a limited scope for further reduction of SO2 emissions in the NE of Spain. In fact, it has been estimated that the maximum in the EU will be a further 20 % SO2 reduction through measures in industry, residential and commercial heating, maritime shipping, and reduced agricultural waste burning (UNECE, 2016). Conversely, in eastern European countries the scope for reduction is much greater and around 60 % (UNECE, 2016).
For the present work, we used data collected over variable periods depending on the country and covering the period 2007–2014. Based on the analysis presented here, an improvement of air quality in the five cities included in this study could be achieved by further reducing local (urban) emissions of PM, NOx and NH3 (from both traffic and non-traffic sources) but also of PM and SO2 from maritime ships and ports. Moreover, improvements can be achieved by reducing non-urban emissions of NH3 (agriculture), SO2 (regional maritime shipping), and PM and gaseous precursors from regional BB sources, power generation, coal combustion and industries.
The possibility of identifying pollutant sources is related to the PM chemical speciation available. We have shown here that BB emissions can be important contributors to PM; however, a clear determination of its contribution depends on the availability of specific BB tracers such as levoglucosan, or other specific polysaccharides, together with K+. For the determination of residual oil combustion sources such as ships, whose emissions are projected to increase significantly if mitigation measures are not put in place swiftly, the determination of specific tracers such as V and Ni is necessary. Emissions from coal combustion, which we have seen to be important in central Europe, can be traced by using polycyclic aromatic hydrocarbons (PAHs), As and Se, as important tracers of this source.
The PMF model version 5.0 used in this study is available at https://www.epa.gov/air-research/positive-matrix-factorization-model-environmental-data-analyses (Norris et al., 2019).
The chemically speciated PM data used in this study are available from the corresponding authors upon request.
The supplement related to this article is available online at: https://doi.org/10.5194/acp-20-409-2020-supplement.
AC, OT and MP developed the idea behind this study. MP performed the analysis, created the figures and wrote the paper. DM and EvdS applied the multisite PMF to the Dutch database. DvP and HH applied the multisite PMF to the German database. MP, DM and PH provided the analysis on primary sulfate emissions from ships in Spain and the Netherlands. XQ, AA, OF, CH, EP, VR and SS provided guidance. All authors read and approved the final paper.
The authors declare that they have no conflict of interest.
Measurements at Spanish sites (Montseny, Montsec and Barcelona) were supported by the Spanish Ministry of Economy, Industry and Competitiveness and FEDER funds under the project HOUSE (CGL2016-78594-R) and by the Generalitat de Catalunya (AGAUR 2014 SGR33, AGAUR 2017 SGR41 and the DGQA). Marco Pandolfi is funded by a Ramón y Cajal Fellowship (RYC-2013-14036) awarded by the Spanish Ministry of Economy and Competitiveness. The authors thank Cristina Reche, Noemi Pérez and Anna Ripoll (IDAEA-CSIC) for providing chemically speciated PM data for Barcelona, Montseny and Montsec stations (Spain). Measurements at French sites (Lens, Revin) were notably funded by the French Ministry of Environment (“Bureau de l'Air du Ministère de l'Ecologie, du Développement durable, et de l'Energie”) and included in the CARA air quality monitoring and research project coordinated by the French reference laboratory for air quality monitoring (LCSQA), with technical support provided by the air quality monitoring networks Atmo Hauts-de-France and Atmo Grand-Est. IMT Lille Douai acknowledges financial support from the CaPPA project, which is funded by the French National Research Agency (ANR) through the PIA (Programme d'Investissement d'Avenir) under contract ANR-11-LABX-0005-01, and the CLIMIBIO project, both financed by the Regional Council “Hauts-de-France” and the European Regional Development Fund (ERDF). For the measurements at the German sites, financial support from the Saxon State Office for Environment, Agriculture and Geology (LfULG) is acknowledged. Gathering of in situ data supporting this analysis was organised through the EMEP Task Force on Measurement and Modelling. The authors wish to thank David C. Carslaw and Karl Ropkins for providing the openair software used in this paper.
Measurements were funded by the Spanish Ministry of Economy, Industry and Competitiveness and FEDER funds under the project HOUSE (CGL2016-78594-R) and by the Generalitat de Catalunya (AGAUR 2014 SGR33, AGAUR 2017 SGR41 and the DGQA), by the French Ministry of Environment (Bureau de l'Air du Ministère de l'Ecologie, du Développement durable, et de l’Energie), by the French National Research Agency (ANR) and by the Regional Council “Hauts-de-France” and the European Regional Development Fund (ERDF), and by the Saxon State Office for Environment, Agriculture and Geology (LfULG).
This paper was edited by John Liggio and reviewed by two anonymous referees.
Alastuey, A., Querol, X., Aas, W., Lucarelli, F., Pérez, N., Moreno, T., Cavalli, F., Areskoug, H., Balan, V., Catrambone, M., Ceburnis, D., Cerro, J. C., Conil, S., Gevorgyan, L., Hueglin, C., Imre, K., Jaffrezo, J.-L., Leeson, S. R., Mihalopoulos, N., Mitosinkova, M., O'Dowd, C. D., Pey, J., Putaud, J.-P., Riffault, V., Ripoll, A., Sciare, J., Sellegri, K., Spindler, G., and Yttri, K. E.: Geochemistry of PM10 over Europe during the EMEP intensive measurement periods in summer 2012 and winter 2013, Atmos. Chem. Phys., 16, 6107–6129, https://doi.org/10.5194/acp-16-6107-2016, 2016.
Amann, M., Bertok, I., Borken-Kleefeld, J., Cofala, J., Heyes, C., Höglund-Isaksson, L., Klimont, Z., Nguyen, B., Posch, M., Rafaj, P., Sander, R., Schöpp, W., Wagner, F., and Winiwarter, W.: Cost-effective control of air quality and greenhouse gases in Europe: modeling and policy applications, Environ. Modell. Softw., 26, 1489–1501, https://doi.org/10.1016/j.envsoft.2011.07.012, 2011.
Amato, F., Pandolfi, M., Escrig, A., Querol, X., Alastuey, A., Pey, J., Perez, N., and Hopke, P. K.: Quantifying road dust resuspension in urban environment by Multilinear Engine: A comparison with PMF2, Atmos. Environ., 43, 2770–2780, 2009.
Agrawal, H., Welch, W. A., Miller, J. W., and Cocker III, D. R.: Emission Measurements from a Crude Oil Tanker at Sea, Environ. Sci. Technol., 42, 7098–7103, https://doi.org/10.1021/es703102y, 2008.
Agrawal, H., Welch, W. A., Henningsen, S., Miller, J. W., and Cocker III, D. R.: Emissions from main propulsion engine on container ship at sea, J. Geophys. Res., 115, D23205, https://doi.org/10.1029/2009JD013346, 2010.
Bessagnet, B., Pirovano, G., Mircea, M., Cuvelier, C., Aulinger, A., Calori, G., Ciarelli, G., Manders, A., Stern, R., Tsyro, S., García Vivanco, M., Thunis, P., Pay, M.-T., Colette, A., Couvidat, F., Meleux, F., Rouïl, L., Ung, A., Aksoyoglu, S., Baldasano, J. M., Bieser, J., Briganti, G., Cappelletti, A., D'Isidoro, M., Finardi, S., Kranenburg, R., Silibello, C., Carnevale, C., Aas, W., Dupont, J.-C., Fagerli, H., Gonzalez, L., Menut, L., Prévôt, A. S. H., Roberts, P., and White, L.: Presentation of the EURODELTA III intercomparison exercise – evaluation of the chemistry transport models' performance on criteria pollutants and joint analysis with meteorology, Atmos. Chem. Phys., 16, 12667–12701, https://doi.org/10.5194/acp-16-12667-2016, 2016.
Brown, S. G., Eberly, S., Paatero, P., and Norris, G. A.: Methods for estimating uncertainty in PMF solutions: Examples with ambient air and water quality data and guidance on reporting PMF results, Sci. Total Environ., 518–519, 626–635, https://doi.org/10.1016/j.scitotenv.2015.01.022, 2015.
Bukowiecki, N., Lienemann, P., Hill, M., Furger, M., Richard, A., Amato, F., Prévôt, A. S. H., Baltensperger, U., Buchmann, B., and Gehrig, R.: PM10 emission factors for non-exhaust particles generated by road traffic in an urban street canyon and along a freeway in Switzerland, Atmos. Environ., 44, 2330–2340, 2010.
Carslaw, D. C.: The openair manual – open-source tools for analysing air pollution data, Manual for version 0.7-0, King's College, London, 2012.
Carslaw, D. C. and Ropkins, K.: openair – an R package for air quality data analysis, Environ. Modell. Softw., 27–28, 52–61, 2012.
Cavalli, F., Viana, M., Yttri, K. E., Genberg, J., and Putaud, J.-P.: Toward a standardised thermal-optical protocol for measuring atmospheric organic and elemental carbon: the EUSAAR protocol, Atmos. Meas. Tech., 3, 79–89, https://doi.org/10.5194/amt-3-79-2010, 2010.
Colette, A., Aas, W., Banin, L., Braban, C.F., Ferm, M., González Ortiz, A., Ilyin, I., Mar, K., Pandolfi, M., Putaud, J.-P., Shatalov, V., Solberg, S., Spindler, G., Tarasova, O., Vana, M., Adani, M., Almodovar, P., Berton, E., Bessagnet, B., Bohlin-Nizzetto, P., Boruvkova, J., Breivik, K., Briganti, G., Cappelletti, A., Cuvelier, K., Derwent, R., D'Isidoro, M., Fagerli, H., Funk, C., Garcia Vivanco, M., González Ortiz, A., Haeuber, R., Hueglin, C., Jenkins, S., Kerr, J., de Leeuw, F., Lynch, J., Manders, A., Mircea, M., Pay, M.T., Pritula, D., Putaud, J.-P., Querol, X., Raffort,V., Reiss, I., Roustan, Y., Sauvage, S., Scavo, K., Simpson, D., Smith, R.I., Tang, Y.S., Theobald, M., Tørseth, K., Tsyro, S., van Pul, A., Vidic, S., Wallasch, M., and Wind, P.: Air pollution trends in the EMEP region between 1990 and 2012, Joint Report of the EMEP Task Force on Measurements and Modelling (TFMM), Chemical Co-ordinating Centre (CCC), Meteorological Synthesizing Centre-East (MSC-E), Meteorological Synthesizing Centre-West (MSC-W), EMEP/CCC-Report 1/2016, 2016.
Escrig, A., Monfort, E., Celades, I., Querol, X., Amato, F., Minguillon, M. C., and Hopke, P. K.: Application of optimally scaled target factor analysis for assessing source contribution of ambient PM10, J. Air Waste Manage., 59, 1296–1307, 2009.
Gehrig, R. and Buchmann, B.: Characterising seasonal variations and spatial distribution of ambient PM10 and PM2.5 concentrations based on long-term Swiss monitoring data, Atmos. Environ., 37, 2571–2580, https://doi.org/10.1016/S1352-2310(03)00221-8, 2003.
Gianini, M. F. D., Fischer, A., Gehrig, R., Ulrich, A., Wichser, A., Piot, C., Besombes, J.-L., and Hueglin, C.: Comparative source apportionment of PM10 in Switzerland for 2008/2009 and 1998/1999 by Positive Matrix Factorisation, Atmos. Environ., 54, 149–158, 2012.
Hopke, P. K.: Review of receptor modeling methods for source apportionment, J. Air Waste Manage., 66, 237–259, https://doi.org/10.1080/10962247.2016.1140693, 2016.
Hovorka, J., Pokorná, P., Hopke, P. K., Křůmal, K., Mikuška, P., and Píšová, M.: Wood combustion, a dominant source of winter aerosol in residential district in proximity to a large automobile factory in Central Europe, Atmos. Environ., 113, 98–107, 2015.
Hueglin, C., Gehrig, R., Baltensperger, U., Gysel, M., Monn, C., and Vonmont, H.: Chemical characterisation of PM2.5, PM10 and coarse particles at urban, near city and rural sites in Switzerland, Atmos. Environ., 39, 637–651, 2005.
Kiesewetter, G., Borken-Kleefeld, J., Schöpp, W., Heyes, C., Thunis, P., Bessagnet, B., Terrenoire, E., Fagerli, H., Nyiri, A., and Amann, M.: Modelling street level PM10 concentrations across Europe: source apportionment and possible futures, Atmos. Chem. Phys., 15, 1539–1553, https://doi.org/10.5194/acp-15-1539-2015, 2015.
Kim, E. and Hopke, P. K.: Improving source identification of fine particles in a rural northeastern U.S. area utilizing temperature-resolved carbon fractions, J. Geophys. Res., 109, D09204, https://doi.org/10.1029/2003JD004199, 2004.
Kim, E. and Hopke, P. K.: Comparison between sample-species specific uncertainties and estimated uncertainties for the source apportionment of the speciation trends network data, Atmos. Environ., 41, 567–575, https://doi.org/10.1016/j.atmosenv.2006.08.023, 2007.
Kim, E. and Hopke, P. K.: Source characterization of ambient fine particles at multiple sites in the Seattle area, Atmos. Environ., 42, 6047–6056, 2008.
Kim, E., Hopke, P. K., and Edgerton, E. S.: Source identification of Atlanta aerosol by positive matrix factorization, J. Air Waste Manage., 53, 731–739, 2003.
Kranenburg, R., Segers, A. J., Hendriks, C., and Schaap, M.: Source apportionment using LOTOS-EUROS: module description and evaluation, Geosci. Model Dev., 6, 721–733, https://doi.org/10.5194/gmd-6-721-2013, 2013.
Kuhn, N. J.: Erodibility of soil and organic matter: Independence of organic matter resistance to interrill erosion, Earth Surfa. Proc. Land., 32, 794–802, https://doi.org/10.1002/esp.1486, 2007.
Lanz, V. A., Alfarra, M. R., Baltensperger, U., Buchmann, B., Hueglin, C., Szidat, S., Wehrli, M. N., Wacker, L., Weimer, S., Caseiro, A., Puxbaum, H., and Prevot, A. S. H.: Source attribution of submicron organic aerosols during wintertime inversions by advanced factor analysis of aerosol mass spectra, Environ. Sci. Technol., 42, 214–220, 2008.
Lenschow, P., Abraham, H.-J., Kutzner, K., Lutz, M., Preu, J.-D., and Reichenbacher, W.: Some ideas about the sources of PM10, Atmos. Environ., 35, 23–33, 2001.
Liao, H.-T., Chou, C. C.-K., Chow, J. C., Watson, J. G., Hopke, P. K., and Wu C.-F.: Source and risk apportionment of selected VOCs and PM2.5 species using partially constrained receptor models with multiple time resolution data, Environ. Pollut., 205, 121–30, https://doi.org/10.1016/j.envpol.2015.05.035, 2015.
Millán, M. M., Salvador, R., Mantilla, E., and Kallos, G.: Photo-oxidant dynamics in the Mediterranean Basin in Summer: Results from European Research Projects, J. Geophys. Res., 102, 8811–8823, 1997.
Millán, M. M., Mantilla, E., Salvador, R., Carratalá, A., Sanz, M. J., Alonso, L., Gangoiti, G., and Navazo, M.: Ozone cycles in the Western Mediterranean Basin: Interpretation of Monitoring Data in Complex Coastal Terrain, J. Appl. Meteorol., 39, 487–508, 2000.
Mohr, C., DeCarlo, P. F., Heringa, M. F., Chirico, R., Slowik, J. G., Richter, R., Reche, C., Alastuey, A., Querol, X., Seco, R., Peñuelas, J., Jiménez, J. L., Crippa, M., Zimmermann, R., Baltensperger, U., and Prévôt, A. S. H.: Identification and quantification of organic aerosol from cooking and other sources in Barcelona using aerosol mass spectrometer data, Atmos. Chem. Phys., 12, 1649–1665, https://doi.org/10.5194/acp-12-1649-2012, 2012.
Mooibroek, D., Schaap, M., Weijers, E. P., and Hoogerbrugge, R.: Source apportionment and spatial variability of PM2.5 using measurements at five sites in the Netherlands, Atmos. Environ., 45, 4180–4191, 2011.
Mooibroek, D., Staelens, J., Cordell, R., Panteliadis, P., Delaunay, T., Weijers, E., Vercauteren, J., Hoogerbrugge, R., Dijkema, M., Monks, P. A., and Roekens, E.: PM10 source apportionment in Five North Western European Cities – Outcome of the Joaquin Project, in Issues in Environmental Science and Technology No 42, Airborne Particulate Matter: Sources, Atmospheric Processes and Health, edited by: Hester, R. E., Harrison, R. M., and Querol, X., The Royal Society of Chemistry, ISNN 1350–7583, 2016.
Norris, G., Duvall, R., Brown, S., and Bai, S.: EPA Positive Matrix Factorization (PMF) 5.0 Fundamentals and User Guide, U.S. Environmental Protection Agency, Washington, DC, EPA/600/R-14/108 (NTIS PB2015-105147), 2014, available at: https://www.epa.gov/air-research/positive-matrix-factorization-model-environmental-data-analyses, last acces: 10 October 2019.
Paatero, P.: Least squares formulation of robust non-negative factor analysis, Chemometr. Intell. Lab., 37, 23–35, 1997.
Paatero, P.: The multilinear engine – a table-driven least squares program for solving multilinear problems, including the n-way parallel factor analysis model, J. Comput. Graph. Stat., 8, 854–888, 1999.
Paatero, P.: User's guide for positive matrix factorization programs PMF2 and PMF3, Part 1: tutorial, University of Helsinki, Helsinki, Finland, 2004.
Paatero, P. and Tapper, U.: Positive matrix factorization: A nonnegative factor model with optimal utilization of error estimates of data values, Environmetrics, 5, 111–126, 1994.
Paatero, P. and Hopke, P. K.: Discarding or downweighting high noise variables in factor analytic models, Anal. Chim. Acta, 490, 277–289, 2003.
Paatero, P. and Hopke, P. K.: Rotational tools for factor analytic models implemented by using the multilinear engine, Chemometrics, 23, 91–100, 2008.
Paatero, P., Hopke, P. K., Song, X., and Ramadan, Z.: Understanding and controlling rotations in factor analytic models, Chemometr. Intell. Lab., 60, 253–264, 2002.
Paatero, P., Eberly, S., Brown, S. G., and Norris, G. A.: Methods for estimating uncertainty in factor analytic solutions, Atmos. Meas. Tech., 7, 781–797, https://doi.org/10.5194/amt-7-781-2014, 2014.
Pandolfi, M., Cusack, M., Alastuey, A., and Querol, X.: Variability of aerosol optical properties in the Western Mediterranean Basin, Atmos. Chem. Phys., 11, 8189–8203, https://doi.org/10.5194/acp-11-8189-2011, 2011a.
Pandolfi, M., Gonzalez-Castanedo, Y., Alastuey, A., de la Rosa, J., Mantilla, E., Sanchez de la Campa, A., Querol, X., Pey, J., Amato, F., and Moreno, T.: Source apportionment of PM10 and PM2.5 at multiple sites in the strait of Gibraltar by PMF: impact of shipping emissions, Environ. Sci. Pollut. Res., 18, 260–269, https://doi.org/10.1007/s11356-010-0373-4, 2011b.
Pandolfi, M., Amato, F., Reche, C., Alastuey, A., Otjes, R. P., Blom, M. J., and Querol, X.: Summer ammonia measurements in a densely populated Mediterranean city, Atmos. Chem. Phys., 12, 7557–7575, https://doi.org/10.5194/acp-12-7557-2012, 2012.
Pandolfi, M., Querol, X., Alastuey, A., Jimenez, J. L., Jorba, O., Day, D., Ortega, A., Cubison, M. J., Comerón, A., Sicard, M., Mohr, C., Prévôt, A. S. H., Minguillón, M. C., Pey, J., Baldasano, J. M., Burkhart, J. F., Seco, R., Peñuelas, J., van Drooge, B. L., Artiñano, B., Di Marco, C., Nemitz, E., Schallhart, S., Metzger, A., Hansel, A., Lorente, J., Ng, S., Jayne, J., and Szidat, S.: Effects of sources and meteorology on particulate matter in the Western Mediterranean Basin: An overview of the DAURE campaign, J. Geophys. Res.-Atmos., 119, 4978–5010, https://doi.org/10.1002/2013JD021079, 2014a.
Pandolfi, M., Ripoll, A., Querol, X., and Alastuey, A.: Climatology of aerosol optical properties and black carbon mass absorption cross section at a remote high-altitude site in the western Mediterranean Basin, Atmos. Chem. Phys., 14, 6443–6460, https://doi.org/10.5194/acp-14-6443-2014, 2014b.
Pandolfi, M., Alastuey, A., Pérez, N., Reche, C., Castro, I., Shatalov, V., and Querol, X.: Trends analysis of PM source contributions and chemical tracers in NE Spain during 2004–2014: a multi-exponential approach, Atmos. Chem. Phys., 16, 11787–11805, https://doi.org/10.5194/acp-16-11787-2016, 2016.
Pérez, N., Pey, J., Castillo, S., Viana, M., Alastuey, A., and Querol, X.: Interpretation of the variability of levels of regional background aerosols in the Western Mediterranean, Sci. Total Environ., 407, 527–540, 2008.
Petetin, H., Beekmann, M., Sciare, J., Bressi, M., Rosso, A., Sanchez, O., and Ghersi, V.: A novel model evaluation approach focusing on local and advected contributions to urban PM2.5 levels – application to Paris, France, Geosci. Model Dev., 7, 1483–1505, https://doi.org/10.5194/gmd-7-1483-2014, 2014.
Petit, J.-E., Pallarès, C., Favez, O., Alleman, L.Y., Bonnaire, N., Rivière, E.: Sources and Geographical Origins of PM10 in Metz (France) Using Oxalate as a Marker of Secondary Organic Aerosols by Positive Matrix Factorization Analysis, Atmosphere, 10, 1–17, https://doi.org/10.3390/atmos10070370, 2019.
Pey, J., Pérez, N., Querol, X., Alastuey, A., Cusack, M., and Reche, C.: Intense winter atmospheric pollution episodes affecting the Western Mediterranean, Sci. Total Environ., 408, 1951–1959, 2010.
Pey, J., Querol, X., Alastuey, A., Forastiere, F., and Stafoggia, M.: African dust outbreaks over the Mediterranean Basin during 2001–2011: PM10 concentrations, phenomenology and trends, and its relation with synoptic and mesoscale meteorology, Atmos. Chem. Phys., 13, 1395–1410, https://doi.org/10.5194/acp-13-1395-2013, 2013.
Pisoni, E., Clappier, A., Degraeuwe, B., and Thunis, P.: Adding spatial flexibility to source-receptor relationships for air quality modeling, Environ. Modell. Softw., 90, 68–77, https://doi.org/10.1016/j.envsoft.2017.01.001, 2017.
Piot, C., Jaffrezo, J.-L., Cozic, J., Pissot, N., El Haddad, I., Marchand, N., and Besombes, J.-L.: Quantification of levoglucosan and its isomers by High Performance Liquid Chromatography – Electrospray Ionization tandem Mass Spectrometry and its applications to atmospheric and soil samples, Atmos. Meas. Tech., 5, 141–148, https://doi.org/10.5194/amt-5-141-2012, 2012.
Pokorná, P., Hovorka, J., Hopke, P. K., and Kroužek, J.: PM1-10 source apportionment in a village situated in industrial region of Central Europe, J. Air Waste Manage., 63, 1412–1421, 2013.
Pokorná, P., Hovorka, J., Klán, M., and Hopke, P. K.: Source apportionment of size resolved particulate matter at a European air pollution hot spot, Sci. Total Environ., 502, 172–183, 2015.
Polissar, A. V., Hopke, P. K., Paatero, P., Malm, W. C., and Sisler, J. F.: Atmospheric aerosol over Alaska 2. Elemental composition and sources, J. Geophys. Res.-Atmos., 103, 19045–19057, 1998.
Pope, F. D., Gatari, M., Ng'ang'a, D., Poynter, A., and Blake, R.: Airborne particulate matter monitoring in Kenya using calibrated low-cost sensors, Atmos. Chem. Phys., 18, 15403–15418, https://doi.org/10.5194/acp-18-15403-2018, 2018.
Querol, X., Alastuey, A., Lopez-Soler, A., Plana, F., Puicercus, J. A., Mantilla, E., and Palau, J. L.: Daily evolution of sulphate aerosols in a rural area, northeastern Spain-elucidation of an atmospheric reservoir effect, Environ. Pollut., 105, 397–407, 1999.
Querol, X., Viana, M., Alastuey, A., Amato, F., Moreno, T., Castillo, S., Pey, J., de la Rosa, J., Artíñano, B., Salvador, P., García Dos Santos, S., Fernández-Patier, R., Moreno-Grau, S., Negral, L., Minguillón, M. C., Monfort, E., Gil, J. I., Inza, A., Ortega, L. A., Santamaría, J. M., and Zabalza, J.: Source origin of trace elements in PM from regional background, urban and industrial sites of Spain, Atmos. Environ., 41, 7219–7231, 2007.
Querol, X., Alastuey, A., Moreno, T., Viana, M.M., Castillo, S., Pey, J., Rodríguez, S., Artiñano, B., Salvador, P., Sánchez, M., Garcia Dos Santos, S., Herce Garraleta, M. D., Fernandez-Patier, R., Moreno-Grau, S., Negral, L., Minguillón, M. C., Monfort, E., Sanz, M. J., Palomo-Marín, R., Pinilla-Gil, E., Cuevas, E., de la Rosa, J., and Sánchez de la Campa, A.: Spatial and temporal variations inairborne particulate matter (PM10 and PM2.5) across Spain 1999–2005, Atmos. Environ., 42, 3694–3979, 2008.
Querol, X., Pey, J., Pandolfi, M., Alastuey, A., Cusack, M., Pérez, N., Moreno, T., Viana, M., Mihalopoulos, N., Kallos, G., and Kleanthous, S.: African dust contributions to mean ambient PM10 mass-levels across the Mediterranean Basin, Atmos. Environ., 43, 4266–4277, 2009.
Reche, C., Viana, M., Pandolfi, M., Alastuey, A., Moreno, T., Amato, F., Ripoll, A., and Querol, X.: Urban NH3 levels and sources in a Mediterranean environment, Atmos. Environ., 57, 153–164, 2012.
Ripoll, A., Pey, J., Minguillón, M. C., Pérez, N., Pandolfi, M., Querol, X., and Alastuey, A.: Three years of aerosol mass, black carbon and particle number concentrations at Montsec (southern Pyrenees, 1570 m a.s.l.), Atmos. Chem. Phys., 14, 4279–4295, https://doi.org/10.5194/acp-14-4279-2014, 2014.
Sanz, M. J., Palomo-Marín, R., Pinilla-Gil, E., Cuevas, E., de la Rosa, J., and Sánchez de la Campa, A.: Spatial and temporal variations inairborne particulate matter (PM10 and PM2.5) across Spain 1999–2005, Atmos. Environ., 42, 3694–3979, 2008.
Seibert, P., Kromp-Kolb, H., Baltensperger, U., Jost, D. T., and Schwikowski, M.: Trajectory Analysis of High-Alpine Air Pollution Data, in: Air Pollution Modeling and Its Application X. NATO Challenges of Modern Society, edited by: Gryning, S. E. and Millán, M. M., vol 18, Springer, Boston, MA, 1994.
Sofowote, U. M., Su, Y., Dabek-Zlotorzynska, E., Rastogi, A. K., Brook, J., and Hopke, P. K.: Sources and temporal variations of constrained PMF factors obtained from multiple-year receptor modeling of ambient PM2.5 data from five speciation sites in Ontario, Canada, Atmos. Environ., 108, 140–150, 2015.
Szidat, S., Jenk, T. M., Synal, H. A., Kalberer, M., Wacker, L., Hajdas, I., Kasper-Giebl, A., and Baltensperger, U.: Contributions of fossil fuel, biomass-burning, and biogenic emissions to carbonaceous aerosols in Zurich as traced by C-14, J. Geophys. Res.-Atmos., 111, D07206, https://doi.org/10.1029/2005JD006590, 2006.
Thunis, P.: On the validity of the incremental approach to estimate the impact of cities on air quality, Atmos. Environ., 173, 210–222, 2018.
UNECE: Towards Cleaner Air. Scientific Assessment Report. EMEP Steering Body and Working Group on Effects of the Convention on Long-Range Transboundary Air Pollution, Oslo, 50 pp., edited by: Maas, R. and Grennfelt, P., available at: http://www.unece.org/environmental-policy/conventions/envlrtapwelcome/publications.html (last access: 16 April 2019), 2016.
Van Damme, M., Clarisse, L., Whitburn, S., Hadji-Lazaro, J., Hurtmans, D., Clerbaux, C., and Coheur, P. F.: Industrial and agricultural ammonia point sources exposed, Nature, 564, 99–103, 2018.
Van der Gon, H. D. and Hulskotte, J.: Methodologies for estimating shipping emissions in the Netherlands, A documentation of currently used emission factors and related activity data, BOP report 500099012, ISSN 1875–2322, ISSN 1875–2314, 2010.
van Pinxteren, D., Fomba, K. W., Spindler, G., Mueller, K., Poulain, L., Iinuma, Y., Loschau, G., Hausmann A., and Herrmann, H.: Regional air quality in Leipzig, Germany: detailed source apportionment of size resolved aerosol particles and comparison with the year 2000, Faraday Discuss., 189, 291–315, 2016.
Waked, A., Favez, O., Alleman, L. Y., Piot, C., Petit, J.-E., Delaunay, T., Verlinden, E., Golly, B., Besombes, J.-L., Jaffrezo, J.-L., and Leoz-Garziandia, E.: Source apportionment of PM10 in a north-western Europe regional urban background site (Lens, France) using positive matrix factorization and including primary biogenic emissions, Atmos. Chem. Phys., 14, 3325–3346, https://doi.org/10.5194/acp-14-3325-2014, 2014.
Zhang, X., Zhang, Y., Liu, Y., Zhao, J., Zhou, Y., Wang, X., Yang, X., Zou, Z., Zhang, C., Fu, Q., Xu, J., Gao, W., Li, N., and Chen, J.: Changes in the SO2 level and PM2.5 components in Shanghai driven by implementing the ship emission control policy, Environ. Sci. Technol., 53, 11580–11587, https://doi.org/10.1021/acs.est.9b03315, 2019.