the Creative Commons Attribution 4.0 License.
the Creative Commons Attribution 4.0 License.
 | 26 Mar 2020
Characterising mass-resolved mixing state of black carbon in Beijing using a morphology-independent measurement method
Kurtis Broda
Rutambhara Joshi
Jason Olfert
Pingqing Fu
James D. Allan
Refractory black carbon (rBC) in the atmosphere is known for its significant impacts on climate. The relationship between the microphysical and optical properties of rBC remains poorly understood and is influenced by its size and mixing state. Mixing state also influences its cloud scavenging potential and thus atmospheric lifetime. This study presents a coupling of a centrifugal particle mass analyser (CPMA) and a single-particle soot photometer (SP2) for the morphology-independent quantification of the mixing state of rBC-containing particles, used in the urban site of Beijing as part of the Air Pollution and Human Health–Beijing (APHH-Beijing) project during winter (10 November–10 December 2016) and summer (18 May–25 June 2017). This represents a highly dynamic polluted environment with a wide variety of conditions that could be considered representative of megacity area sources in Asia. An inversion method (used for the first time on atmospheric aerosols) is applied to the measurements to present two-variable distributions of both rBC mass and total mass of rBC-containing particles and calculate the mass-resolved mixing state of rBC-containing particles, using previously published metrics. The mass ratio between non-rBC material and rBC material (MR) is calculated to determine the thickness of a hypothetical coating if the rBC and other material followed a concentric sphere model (the equivalent coating thickness). The bulk MR (MRbulk) was found to vary between 2 and 12 in winter and between 2 and 3 in summer. This mass-resolved mixing state is used to derive the mass-weighted mixing state index for the rBC-containing particles (χrBC). χrBC quantifies how uniformly the non-rBC material is distributed across the rBC-containing-particle population, with 100 % representing uniform mixing. The χrBC in Beijing varied between 55 % and 70 % in winter depending on the dominant air masses, and χrBC was highly correlated with increased MRbulk and PM1 mass concentration in winter, whereas χrBC in summer varied significantly (ranging 60 %–75 %) within the narrowly distributed MRbulk and was found to be independent of air mass sources. In some model treatments, it is assumed that more atmospheric ageing causes the BC to tend towards a more homogeneous mixture, but this leads to the conclusion that the MRbulk may only act as a predictor of χrBC in winter. The particle morphology-independent and mass-based information on BC mixing used in this and future studies can be applied to mixing-state-aware models investigating atmospheric rBC ageing.
- Article
(3225 KB) - Full-text XML
-
Supplement
(668 KB) - BibTeX
- EndNote


Black carbon (BC) is an important light-absorbing carbonaceous component of the atmospheric particulate matter and is regarded as dominant amongst absorbing aerosols in the atmosphere (Bond and Bergstrom, 2006). Atmospheric BC particles have both a direct positive impact and semidirect impact on Earth's radiative balance (Jacobson, 2000; Bond et al., 2013; IPCC, 2013). However, the climate impact of atmospheric BC particles contains large uncertainties (Ramanathan and Carmichael, 2008; Bond et al., 2013; Riemer et al., 2019). It is known that when BC is coated with other compounds the absorption will be enhanced due to the so-called “lensing effect” compared to the bare BC (Jacobson, 2001; Lack and Cappa, 2010), and the magnitude of coating thickness has a significant impact on the absorption properties of BC-containing particles (Moffet and Prather, 2009). However, the optical properties of BC-containing particles vary with BC mixing state, morphology and chemical compounds, which induces large uncertainties in the calculation of the BC absorption enhancement (Cappa et al., 2012; Liu et al., 2017). A number of observations (Cappa et al., 2012; Peng et al., 2016; Liu et al., 2017; Zhang et al., 2018b) and model studies (Wu et al., 2018; Zhang et al., 2018a) suggest that the absorption enhancement ranges from 1.0 up to 3.5. Though a number of different proposed model treatments give different predictions of BC mixing state (Jacobson, 2001; Murphy et al., 2006; Péré et al., 2009), none of these give perfect agreement with atmospheric observations, either in situ or remote (Fierce et al., 2016). As the coated BC particles may act as cloud condensation nuclei (CCN) in the atmosphere, the coating thickness information of BC-containing particles can also influence the wet removal rate and thus its atmospheric lifetime and overall climate forcing potential (Kuwata et al., 2007; Schroder et al., 2015; Motos et al., 2019). Taylor et al. (2014) shows that the size distribution of BC-containing particles is important for the simulation of BC lifetime, vertical profile and transportation. The results from Liu et al. (2015) also show that the coating thickness of BC particles can largely influence their scavenging efficiency and lifetime in the clouds. The BC mixing state is especially important for polluted environments, where a combination of active sources, mixing and secondary aerosol formation mean that the BC mixing state is highly dynamic (Riemer et al., 2009). The mixing state of BC in most models remains unconstrained due to lack of measurement data, so this study aims to address this need by applying a new measurement technique to the atmosphere and offering new insight into the behaviour of BC in an important megacity.
To clearly quantify how well the BC particles are mixed in the atmosphere, the parameter “mixing state index” is applied for BC-containing particles in this study. Inspired by ecology studies (Whittaker, 1960, 1965), Riemer and West (2013) introduced a mathematical framework to quantify the aerosol mixing state. In this framework, the mixing state index (χ) is defined as the ratio between the average single-particle species diversity (D∝) and the bulk particle species diversity (Dγ), and the mixing state index (χ) varies from 0 % (full external mixing; i.e. all particles consist of only one species which may be different for each particle) to 100 % (full internal mixing; i.e. all particles are equally composed of all species). A number of measurement studies have generated this statistic by reporting a mass fraction of different compositions through various measurement techniques. Healy et al. (2014) reported that the variation of the bulk aerosols mixing state index in Paris winter is more related to the dominated air mass source by applying the single-particle aerosol mass spectrometer. Dickau et al. (2016) introduces a size and mass selection method to quantify the volatile mixing state of soot. As well as online measurements, offline microscopy techniques are also being used to retrieve species mass fractions. Bondy et al. (2018) performed a microscopy study on air samples collected from the south-eastern United States, and they found that most of the accumulation mode particles are internally mixed when the secondary organic aerosol concentration is high, and most of them are externally mixed during dust events. In this study, the mass-weighted mixing state index for rBC-containing particles (χrBC) is derived to investigate the distribution of non-rBC material across the rBC-containing-particle population in Beijing. As one of the large megacities in China, Beijing has suffered from heavy air pollution (Yang et al., 2005) and is likely to have many factors affecting BC mixing state, which in turn has implications for both air quality and climate (Ching and Kajino, 2018). These aerosols can have a global reach (Liu et al., 2015), and as their effects may be influenced by dynamic effects near the point of emission where concentrations are highest, a polluted urban environment represents a good location to investigate these behaviours and properties.
In this study, a coupled combination of a centrifugal particle mass analyser (CPMA, Cambustion Ltd., Cambridge, UK) and a single-particle soot photometer (SP2, DMT, Boulder, CO, USA) with a new inversion algorithm was applied in the field for the first time to characterise the mixing state of rBC-containing particles in Beijing. In this context, the BC is referred to as “refractory black carbon” or rBC as an operational definition, consistent with Petzold et al. (2013). Liu et al. (2017) first introduced this morphology-independent instrument configuration to measure the mass ratio between non-rBC material and rBC material. Compared to the traditional SP2-only measurement, the significant improvement of the CPMA–SP2 method is that it can measure the non-rBC material mass directly, which means no assumption is needed for non-rBC material density or its optical scattering behaviour. To clearly characterise the distribution of both rBC material and non-rBC material as part of a continuous scan (as opposed to discrete masses used previously by Liu et al., 2017), the CPMA–SP2 results are presented in a two-variable distribution by applying a novel inversion method presented by Broda et al. (2018). The concentric sphere equivalent coating thickness of rBC-containing particles and the non-rBC material distribution information across the rBC-containing-particle population is derived from the measurement results, and the implication of these results is discussed.
2.1 APHH field campaign
With the aim of identifying the mixing states of rBC in a complex urban environment, an experiment was devised as part of the Air Pollution and Human Health–Beijing (APHH-Beijing) programme. The details of the wider campaign are described in Shi et al. (2019). The measurements were conducted during the APHH winter (10 November–10 December 2016) and summer (18 May–25 June 2017) intensive observation periods at the Institute of Atmospheric Physics (IAP) tower site. The site (39∘58′28′′ N, 116∘22′16′′ E) is located in between the 3rd Ring Road and 4th Ring Road in the urban area of Beijing to the north of the city centre. As part of the AIRPRO and AIRPOLL joint campaign, these measurements also contribute to the better understanding of the critical pollutants and the pollution process in urban Beijing.
2.2 Centrifugal particle mass analyser (CPMA)
The CPMA sorts particles by their mass-to-charge ratio. The details of the CPMA have been described elsewhere (Olfert and Collings, 2005; Olfert et al., 2006). Briefly, two rotating coaxial cylindrical electrodes rotate at different angular velocities inside the CPMA. Particles of a narrow range of mass-to-charge ratio will exit the classifier based on a balance between electrostatic and centrifugal forces depending on the voltage difference between the electrodes and their rotational speed. The average mass of the particles (m) exiting the CPMA is
where e is the electronic charge (), ϕ is number of charges carried by each particle, V is the voltage difference, ro is the outer cylinder radius, ri is the inner cylinder radius and ωc is the rotation speed of the gas at the centre of the gap between the cylinders rc (). The charging in this instance was provided by a bipolar electrical neutraliser (MSP Corp., Shoreview, USA) that gives an equivalent charging profile to a traditional radioactive neutraliser for particles larger than 10 nm. An additional bypass flow of 1 L min−1 was provided in addition to the 0.1 L min−1 sample flow of the SP2 to minimise diffusional losses through the neutraliser and tubing.
2.3 Single-particle soot photometer (SP2)
The SP2 is widely used in atmospheric rBC studies (Stephens et al., 2003). It consists of four optical detectors and one Nd:YAG crystal laser with a Gaussian intensity distribution (Schwarz et al., 2010). The SP2 can detect particles with an rBC component equivalent to a spherical diameter of 70–850 nm (Liu et al., 2010; Adachi et al., 2016). The details of the SP2 algorithm in Manchester are described in Liu et al. (2010) and McMeeking et al. (2010). The Manchester SP2 incandescence signal was calibrated using Aquadag black carbon particle standards (Aqueous Deflocculated Acheson Graphite, manufactured by Acheson Inc., USA) before the measurement, and the correction factor of 0.75 for ambient rBC measurement was applied (Laborde et al., 2012).
2.4 Manchester CPMA–SP2 system
A novel coupling measurement method, CPMA–SP2, has been applied to measure the non-rBC material mass among the population of rBC without morphology dependence (Liu et al., 2017). To set up the CPMA–SP2 system, the CPMA is placed upstream of the SP2 to classify particles of a nominal mass and sequentially pass these monodisperse particles to the SP2 for analysis of the mass of rBC from the individually classified particles. When sampling with the CPMA–SP2 system, the CPMA was set to select particles from 0.3 up to ∼15 fg. The CPMA performed one scan every 30 min, and it took ∼20 min to complete one scan. For the remaining time, the CPMA rotation and voltage were disabled, meaning the SP2 was measuring the polydisperse aerosol measurement. A comparison between this and a bypassed configuration demonstrated that this introduced minimal losses. The CPMA–SP2 setup with mono-mass and polydispersed scan sequence is shown in Fig. S1 in the Supplement.

Figure 1Classification of air mass sources (modified from Liu et al., 2019).
2.5 NR-PM1 (non-refractory particulate matter with aerodynamic diameter < 1 µm) measurement and back-trajectory model
A high-resolution time-of-flight aerosol mass spectrometer (HR-ToF-AMS, Aerodyne Research Inc., USA) was used to measure the bulk aerosol non-refractory chemical compositions. The details of HR-ToF-AMS are described by DeCarlo et al. (2006). The mass concentration of the NR-PM1 (non-refractory particulate matter with aerodynamic diameter < 1 µm) particle is calculated from the sum of organics, sulfate, nitrate, ammonium and chloride.
The HYSPLIT back-trajectory model (Draxler and Hess, 1998) was run with the horizontal and vertical wind fields provided by the GDAS1 reanalysis meteorology data. The HYSPLIT model analysis was used to classify the sources of air mass that influenced the measurement site, and this method is described by Liu et al. (2018). As shown in Fig. 1, the continental air mass sources are classified into five regions: Northern Plateau, Southern Plateau, Western North China Plain (NCP) and Eastern NCP.
3.1 CPMA–SP2 inversion
To quantify the rBC mixing state in Beijing, the CPMA–SP2 results have been applied to a new inversion method introduced by Broda et al. (2018), according to the calculations described in the Supplement. The multiply charged particles are removed through the inversion process, and a two-variable distribution function is used to describe the distribution of the non-rBC material on the rBC particles:
where mp is the total mass of an individual rBC-containing particle, and mrBC is the mass of an individual rBC particle. NrBC represents the number concentration of rBC-containing particles with their total particle mass between mp and mp+dmp and rBC particle mass between mrBC and mrBC+dmrBC. This two-variable distribution can also be integrated to single-variable number distributions ( and ) that are normally used in aerosol studies. An example of the original inverted two-dimensional distribution graph retrieved from the measurement is presented in Fig. S2.
3.2 Mixing state index of rBC-containing-particle calculation
Riemer and West (2013) introduced the so-called “diversity parameters” to describe the particle mixing state. These parameters are based on the calculation of Shannon information entropy, which is often used to quantify uncertainties and is different from the thermodynamic entropy used in other areas (Shannon, 2001). The calculation process is described in Riemer and West (2013), and the necessary calculation process for the CPMA–SP2 results is described in the Supplement. In this study, each rBC-containing particle is considered to contain two types of material: rBC material and non-rBC material. The mass fractions of rBC material and non-rBC material for each single rBC-containing particle and the bulk rBC-containing-particle population that are used for the calculation are derived from the measured mass parameters. Briefly, the mixing state index for rBC-containing particles (χrBC) term can be given from
where D∝ and Dγ represent the single-particle diversity and the bulk population diversity respectively and are used to describe the effective number of species in the single particle and the population of particles. The mass-weighted parameter χrBC enables the precise quantification of the distribution of rBC material and non-rBC material mass fractions across the rBC-containing-particle population. For a well-mixed situation (all the rBC-containing particles contain the same mass fraction of rBC material and non-rBC material), , and the mixing state index χrBC=100 %. For a fully externally mixed situation (all the rBC-containing particles only contain the rBC material), , and the mixing state index χrBC will be undefined.
In this study, a high value of χrBC means that all the rBC-containing particles have the very similar rBC and non-rBC material mass fractions and is referred to as “even mixture”, while a low value of χrBC means the distribution of rBC and non-rBC material mass fractions is uneven across the rBC-containing-particle population and is referred to as “uneven mixture”.
3.3 CPMA–SP2 two-variable distribution extrapolation
As introduced in the previous section, the CPMA–SP2 system measurement range set for this measurement campaign is up to mp=15 fg, which is roughly between 0.25 and 0.28 µm in equivalent volume diameter for typical urban rBC-containing particles, based on studies in other cities. However, during certain periods throughout the winter campaign, the distribution unexpectedly extended to larger sizes outside of this range, meaning the overall rBC population was not completely captured by the measurement data. Some other studies regarding to the rBC-containing-particle size distribution in China (Gong et al., 2016; Wu et al., 2017; Zhang et al., 2018b) are in agreement that the volume diameter of rBC-containing particles is larger than the largest CPMA-selected size set in this study. To better quantify the bulk rBC mixing states and overcome the measurement range limitation, the number concentration of rBC-containing particles is extrapolated beyond the measurement range. From the previous CPMA–SP2 results by Liu et al. (2017), the number of distributions can be assumed as log-normal. Hence, the inversion results are extrapolated up to mp around 300 fg, which is about 0.8 µm in equivalent volume diameter, by fitting the measured results with the simulated distribution function, generated from the superposition of two log-normal distributions. Further details of the extrapolation process are presented in the Supplement. Briefly, the number distribution for mp () is extrapolated based on the fitted distribution function. Two methods were then attempted to extrapolate the two-dimensional distribution and critically compared with a view to determining the optimal method. One was based on fitting the two-variable distribution as a function of mrBC (fit mrBC method), and the other was based on fitting the two-variable distribution as a function of the mass ratio between the mp and mrBC (fit ratio method):
while represents the number concentration of the two-variable distribution at mp bin i and mrBC bin j; Ri is the ratio between the rBC-containing-particle number concentration at the extrapolated mp bin i and the number concentration at the measured largest mp bin (the bin with mp=15 fg); a1, b1, c1, a2, b2 and c2 are all the parameters for the distribution function.
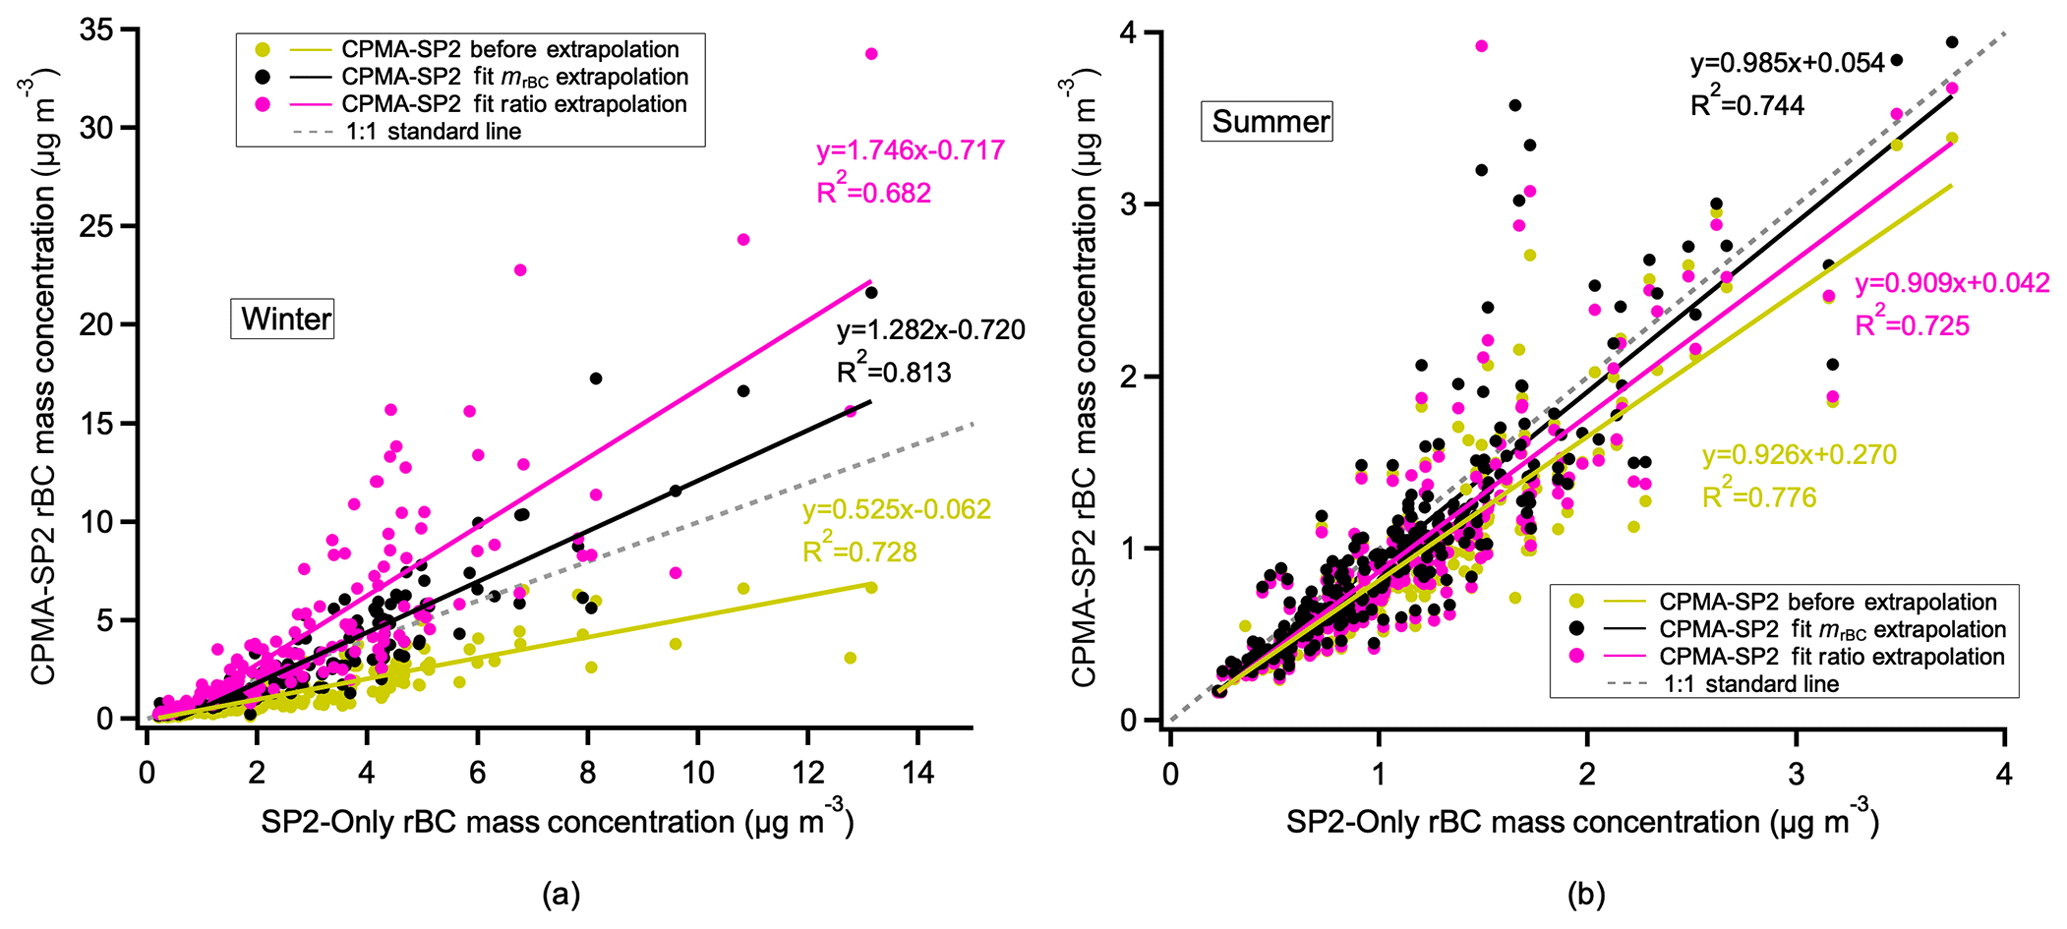
Figure 2The rBC mass concentration comparison between the SP2-only measurement and two different CPMA–SP2 extrapolation methods in winter (a) and summer (b).
To validate the reliability of the extrapolation, the total rBC mass concentration from the CPMA–SP2 extrapolations is compared with the SP2 data obtained during polydisperse sampling (shown in Fig. 2). For the polluted periods where large rBC-containing particles exist, the fit ratio method may overestimate the extrapolated rBC material size, and as a result, the extrapolated rBC mass is significantly higher than the SP2-only results for the polluted periods. The comparison of the fit ratio and fit mrBC extrapolation methods shown in Fig. 2a illustrates that the fit mrBC method is closer to the rBC mass concentration measured by the SP2-only method. For the summer results shown in Fig. 2b, the extrapolation results for the two methods are similar because the rBC-containing particles were smaller and therefore the extrapolation was less necessary.
In general, the fit mrBC method was found to better approximate the total rBC mass compared to the fit ratio method. Therefore, the results in this study are extrapolated by the fit mrBC method.
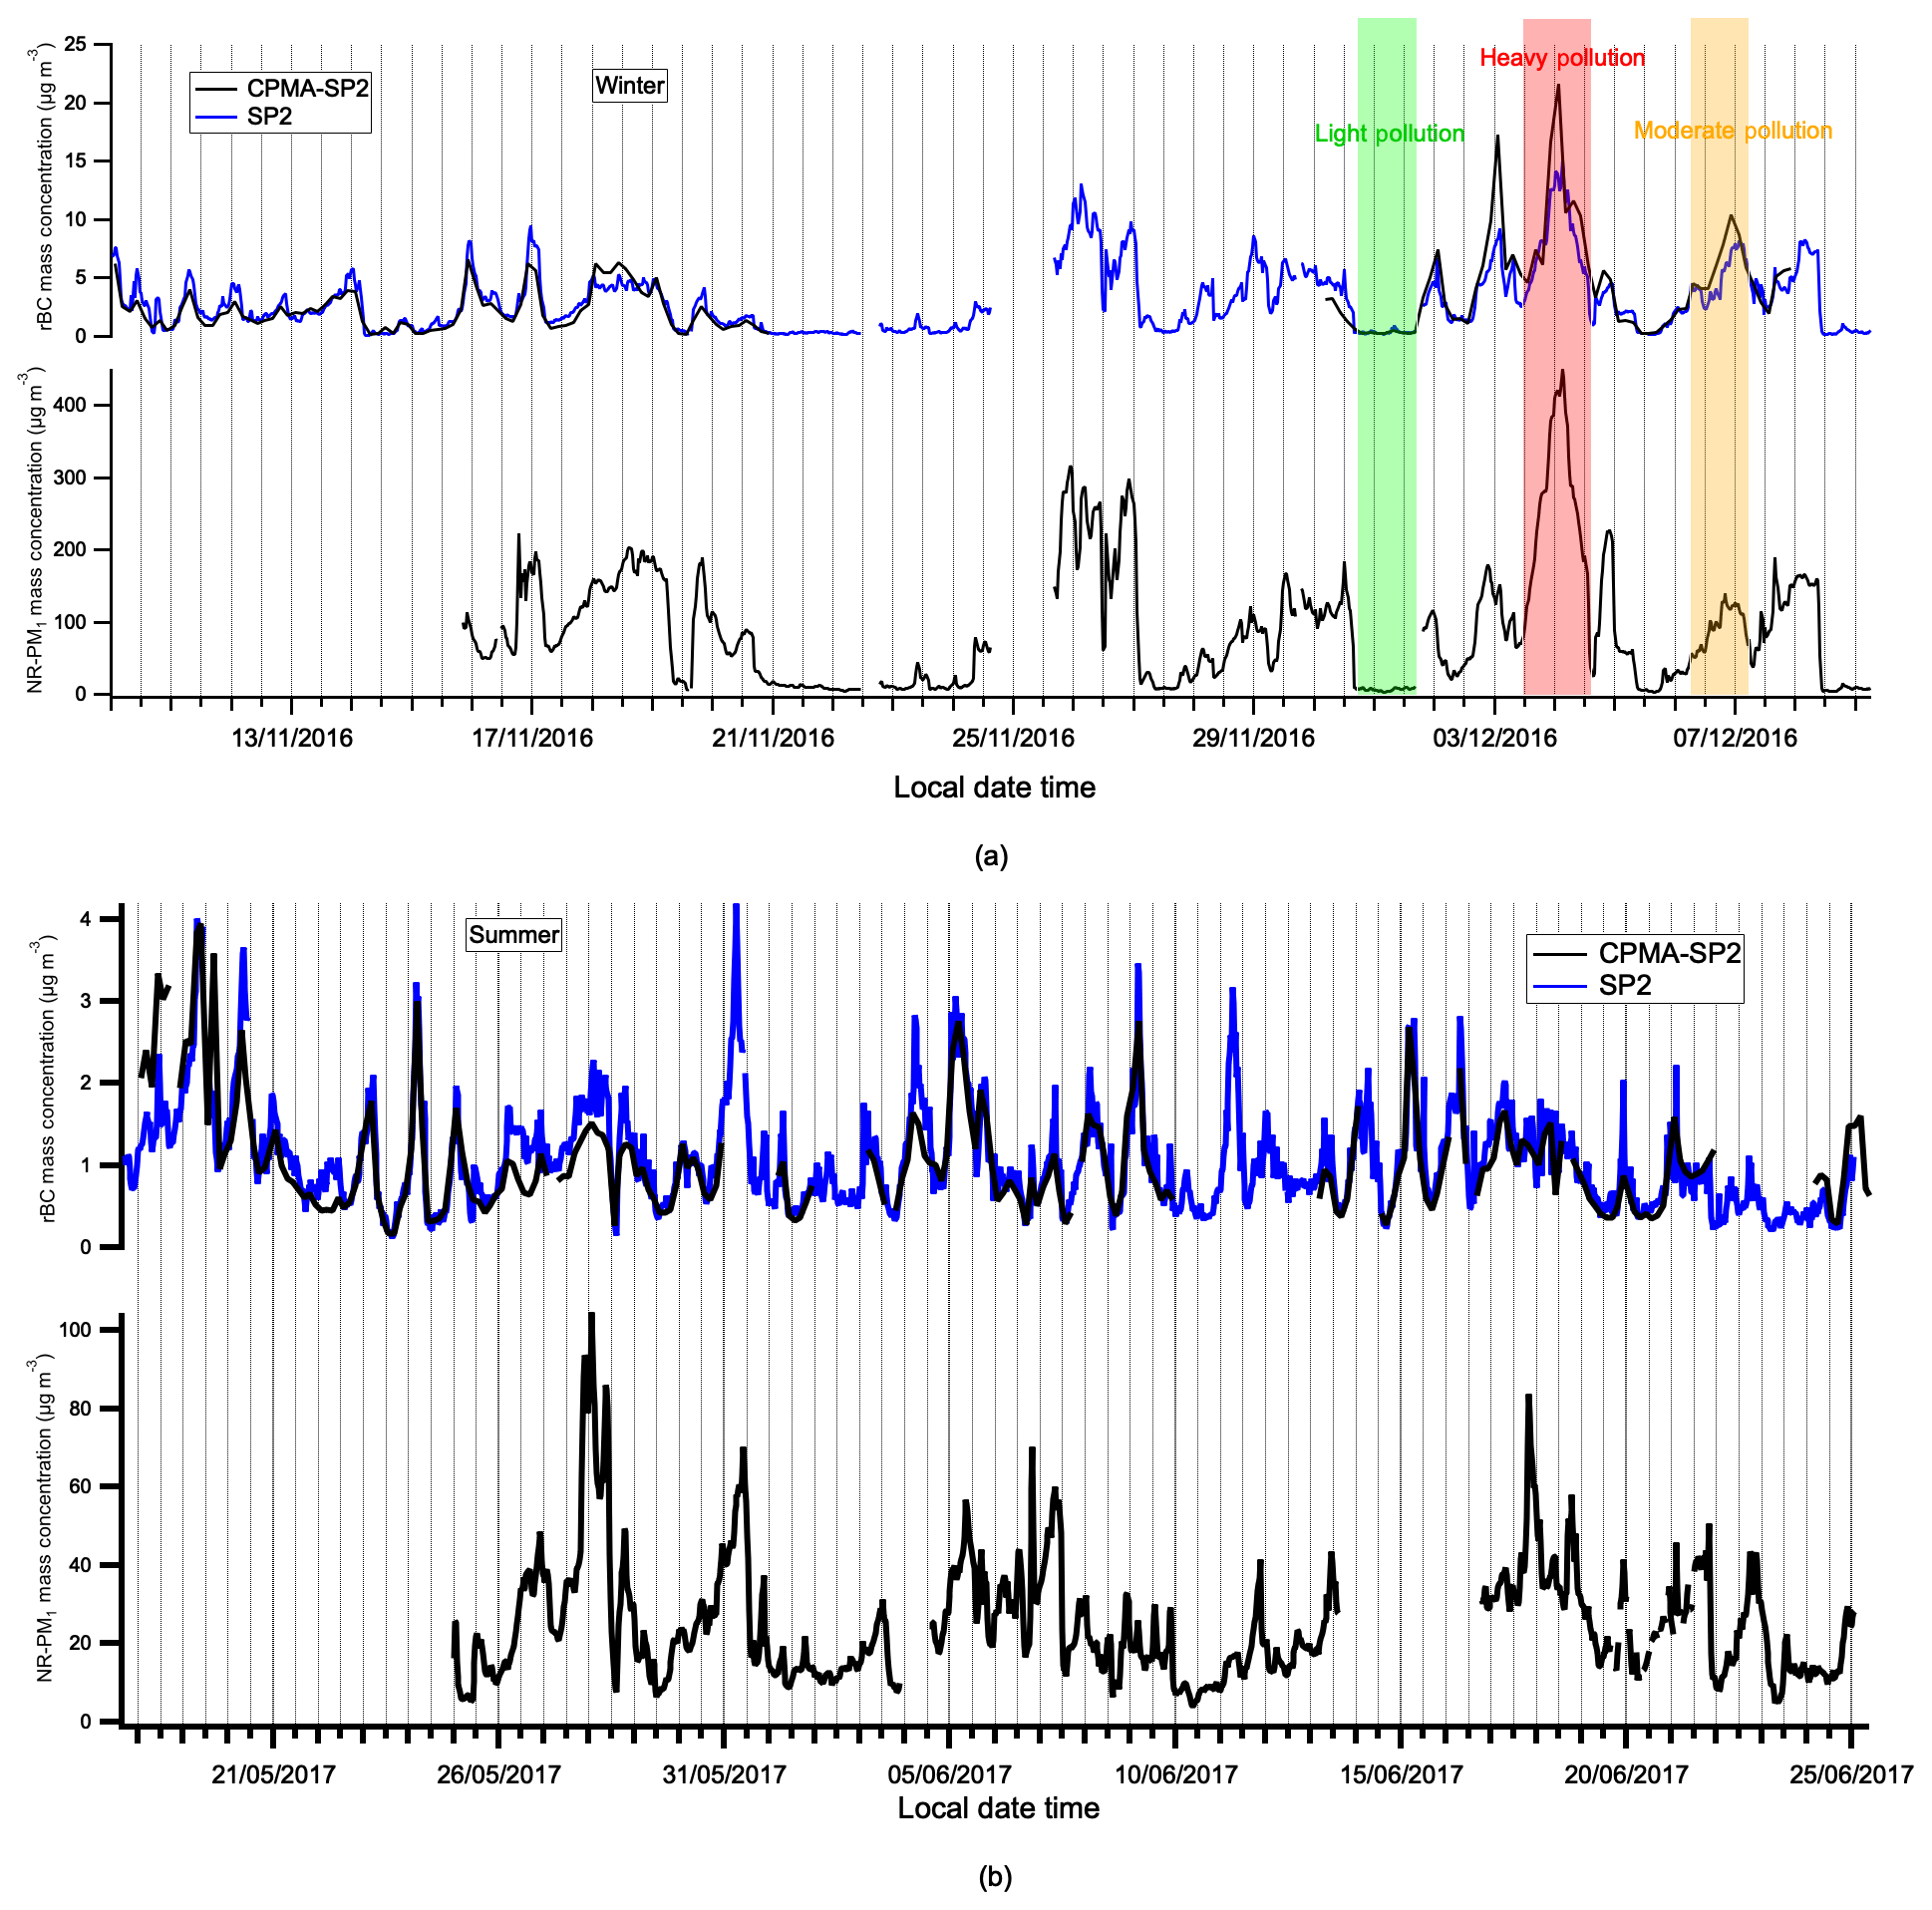
Figure 3Time series of rBC mass concentration and NR-PM1 concentration for the winter (a) and summer (b) campaign.
4.1 APHH campaign overview and CPMA–SP2 two-variable distributions
Figure 3 presents an overview of rBC and NR-PM1 mass concentration for the whole winter and summer campaign. The rBC and NR-PM1 mass concentration varied significantly in winter, and the rBC mass concentration increased to beyond 10 µg m−3, while the NR-PM1 mass concentration increased above 300 µg m−3 during the polluted periods. In contrast, the rBC and NR-PM1 mass concentration reduced significantly during the light-pollution periods. Compared to the winter periods, the rBC mass concentration varied less significantly in summer, and the peak of rBC mass concentration and NR-PM1 mass concentration is lower. The rBC mass concentration reached a peak of around 4 µg m−3, while the NR-PM1 mass concentration reached a peak of around 100 µg m−3.
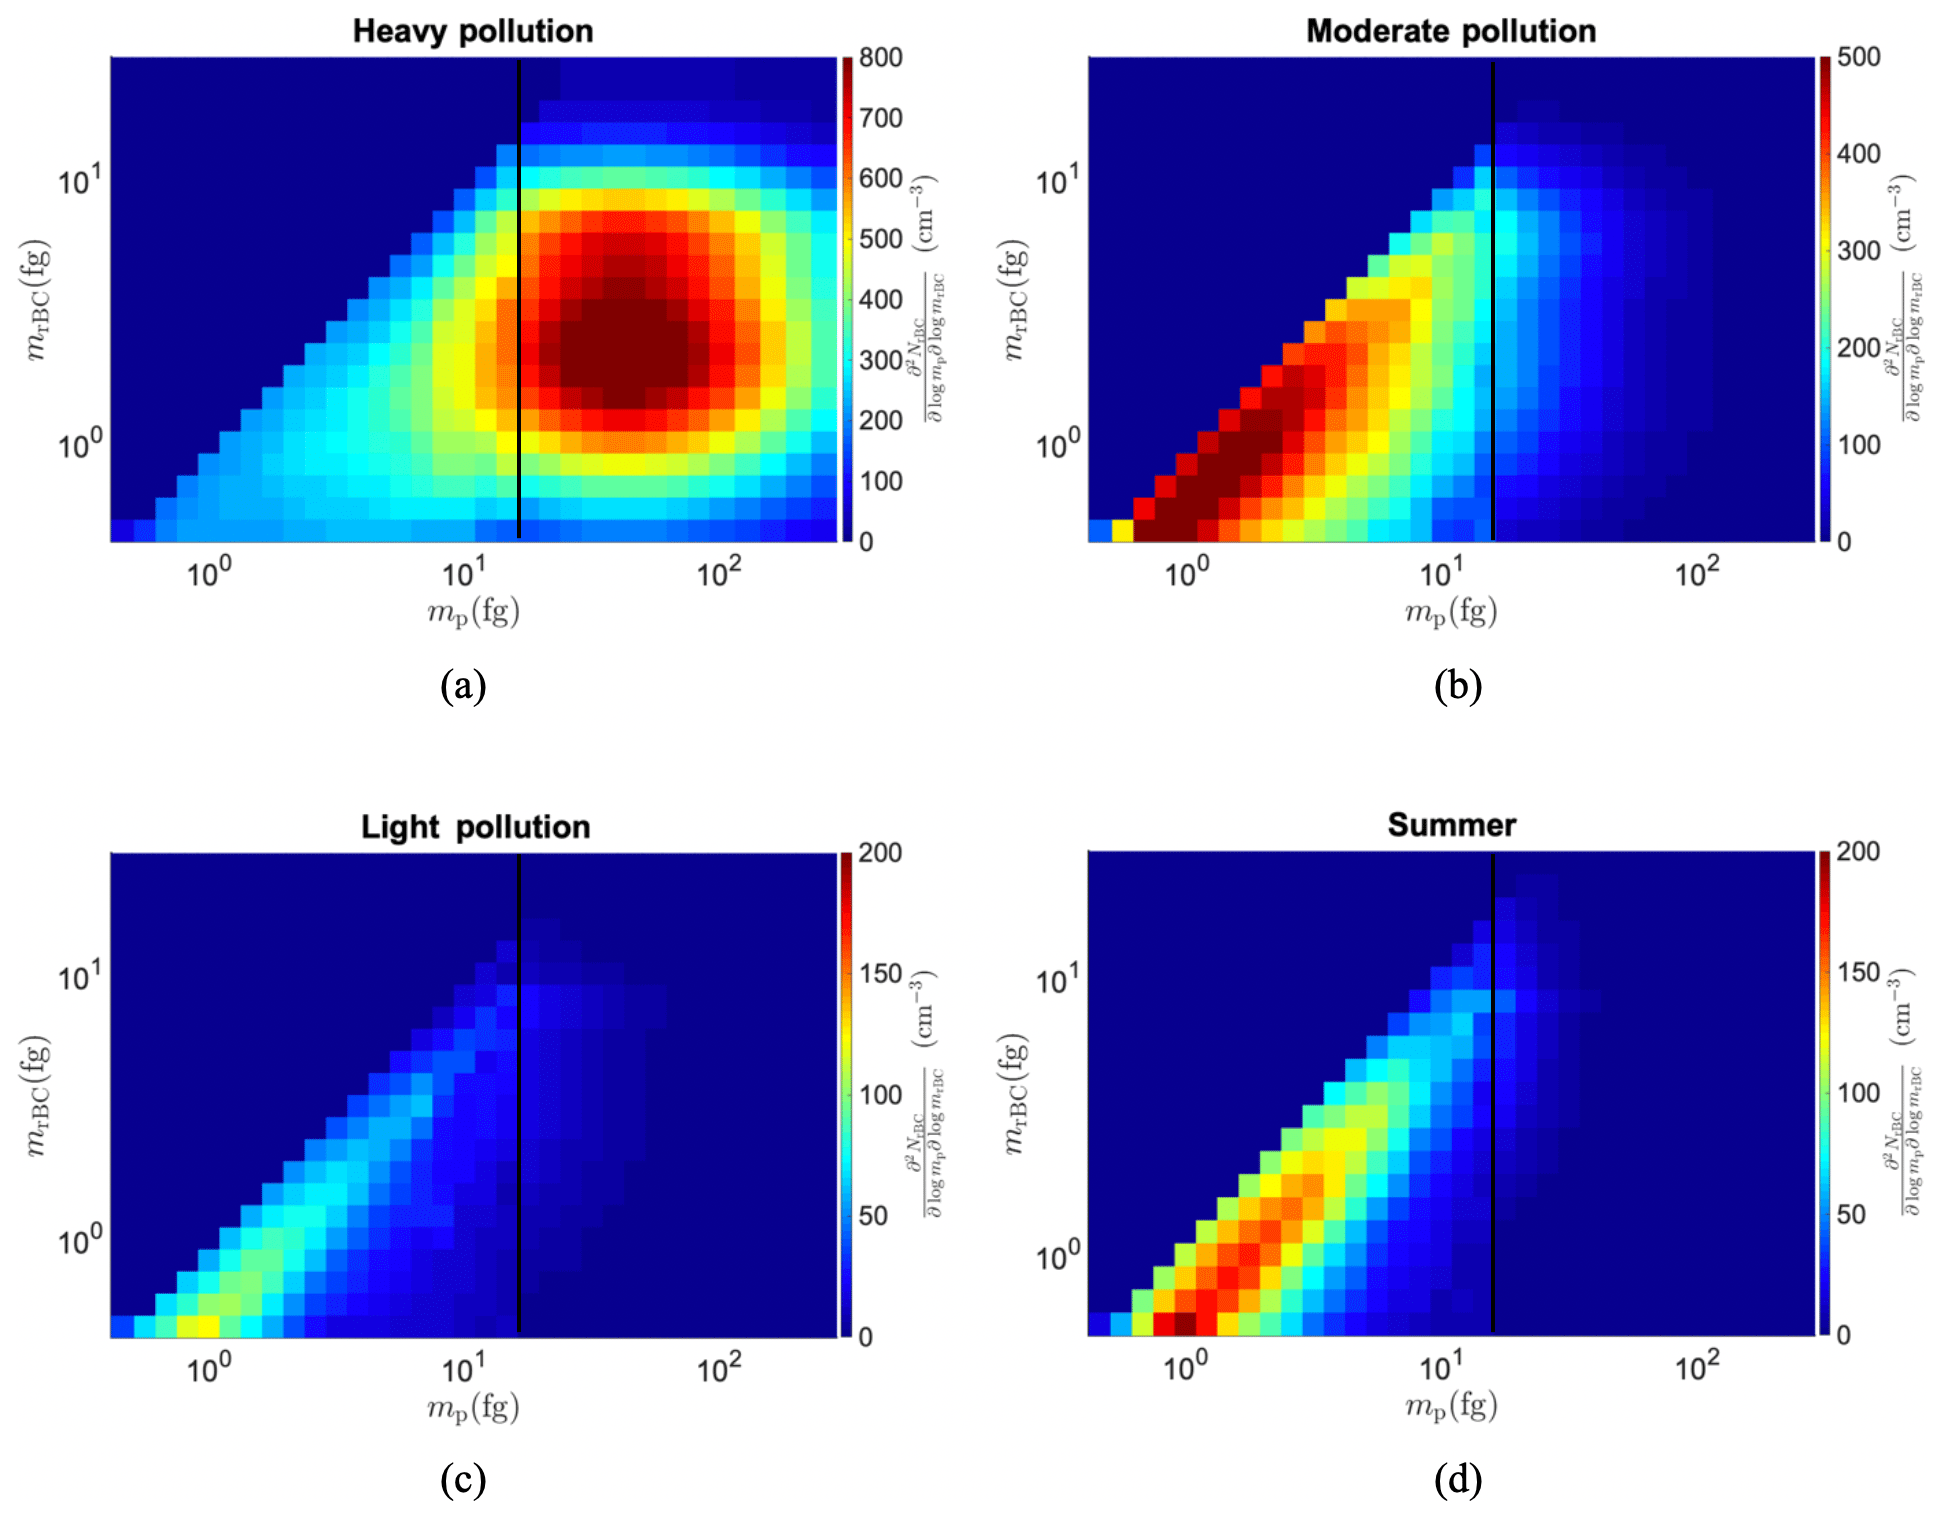
Figure 4CPMA–SP2 inversion matrix examples under different pollution conditions in winter (a, b, c), and the example in the summer period (d); the x axis, mp, represents the mass of the whole rBC-containing particle, while the y axis, mrBC, represents the mass of the rBC material. The colour bar represents the magnitude of the two-variable distribution with a number concentration unit of cubit centimetres (cm−3). All the bins with mrBC larger than mp are zero since such a particle does not exist in reality, and therefore the two-dimensional function distribution graph has a triangle shape. The black solid line shows where the extrapolation starts.
Figure 4 shows the two-dimensional distribution graph which presents the measured BC mixing state. To improve the signal-to-noise ratio of the data, the measured CPMA–SP2 data have been averaged over 3 h periods. According to the measurement results from winter campaign period, three types of mixing state distribution under three different pollution levels were observed, and these three types of pollution are heavy pollution (NR-PM1 greater than 200 µg m−3), moderate pollution (NR-PM1 between 100 and 200 µg m−3) and light pollution (NR-PM1 less than 100 µg m−3). These representative distributions under different pollution levels are shown in Fig. 4a–c. Figure 4a shows high concentrations of rBC-containing particles with both large rBC material and non-rBC material were observed under heavy haze (fog) pollution conditions in the morning of 4 December. During that day, a surface low pressure persisted in Beijing and its surrounding area, so air pollution accumulated to high concentrations. For the moderate-pollution period shown in Fig. 4b, a large number of rBC-containing particles with smaller amounts of rBC material and non-rBC material were observed. The period of light pollution shown in Fig. 4c has the smallest number concentration of rBC-containing particles among all the three pollution types, but the shape of the two-variable distribution is similar to the moderate-pollution period in that most of the rBC-containing particles were smaller than 10 fg and rBC particles with a relatively large non-rBC material fraction were rare. As no highly polluted events comparable to winter were observed in summer, the distribution in summer does not show as much variation during the whole campaign period – one example is shown in Fig. 4d. It appears that the distribution in summer is similar to the distribution for moderate- or light-pollution periods in winter.
The single-variable size distribution results from the integration of are displayed in Fig. 5. The volume equivalent diameter for rBC-containing particles (Dp) and the rBC material (Dc) is also calculated by assuming a density of 1.2 g cm−3 for rBC-containing particles and a density of 1.8 g cm−3 for rBC material for better comparison with other studies based on aerodynamic diameter. For the mp number concentration size distribution () shown in Fig. 5a, the mode particle size is between 2 and 10 fg for the light-pollution and moderate-pollution periods, while for the heavy-pollution period there is a large increase in the number concentration for rBC-containing particles larger than 5 fg. The number concentration size distribution for the mrBC () shown in Fig. 5b indicates that there is an increase in the number concentration for the rBC-containing particles with relatively large rBC material (with mrBC larger than 1 fg) during the heavy-pollution period in winter.

Figure 5CPMA–SP2 mp number distribution (a) and mrBC number distribution (b) under different pollution conditions.
4.2 Mass ratio between non-rBC material and rBC material
The concentric sphere equivalent coating thickness information is presented through the mass ratio (MR) parameter which is derived from the CPMA–SP2 inversion results. The MR parameter defined here follows the definition of Liu et al. (2017), which is given by
where MRi is the mass ratio for rBC-containing particle i, mnon−rBC is the non-rBC material within rBC-containing particle i, and mp,i and mrBC,i are the mass of the rBC-containing particle i and the mass of the rBC material for rBC-containing particle i respectively. The traditional SP2-only method calculates MR by applying measured optical properties through the leading edge only (LEO) technique, and assumptions regarding the refractive indices and morphology are needed to determine the bulk concentric sphere equivalent coating thickness (Gao et al., 2007; Liu et al., 2014; Broda et al., 2018). The CPMA–SP2 method, however, is able to quantify the mass parameters more directly and without LEO fitting or a scattering inversion; therefore, the MR measured by CPMA–SP2 can be considered to be much more accurate. The bulk MR (MRbulk) measured by CPMA–SP2 is calculated as follows:
where Mp and MrBC are the total mass concentration for rBC-containing particles and rBC particles respectively. The comparison between MRbulk from the CPMA–SP2 method and the SP2-only method is shown in Fig. 6. The MRbulk from the SP2-only method is derived by applying the SP2 LEO fitting method to rBC-containing particles with Dp in the range of 0.08–0.8 µm and Dc in the range of 0.08–0.55 µm. The MRbulk from the CPMA–SP2 method shows a good correlation with the SP2-only method during the summer period and the winter period. Despite a slight lower MRbulk observed from the SP2-only method, the MRbulk results from the two methods are generally close.
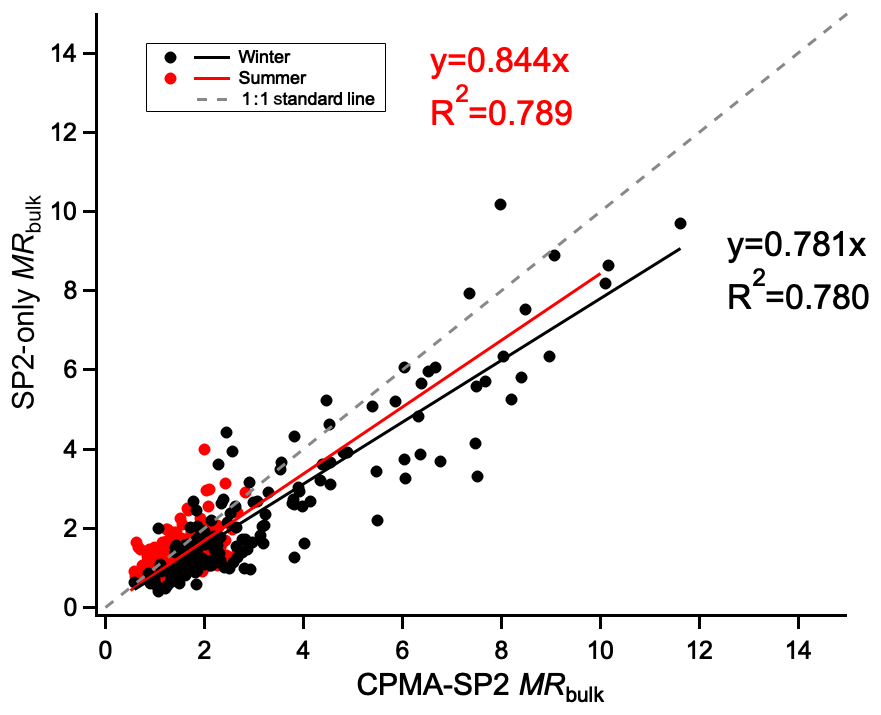
Figure 6The comparison between bulk mass ratio (MRbulk) from the CPMA–SP2 method and from the SP2-only method.
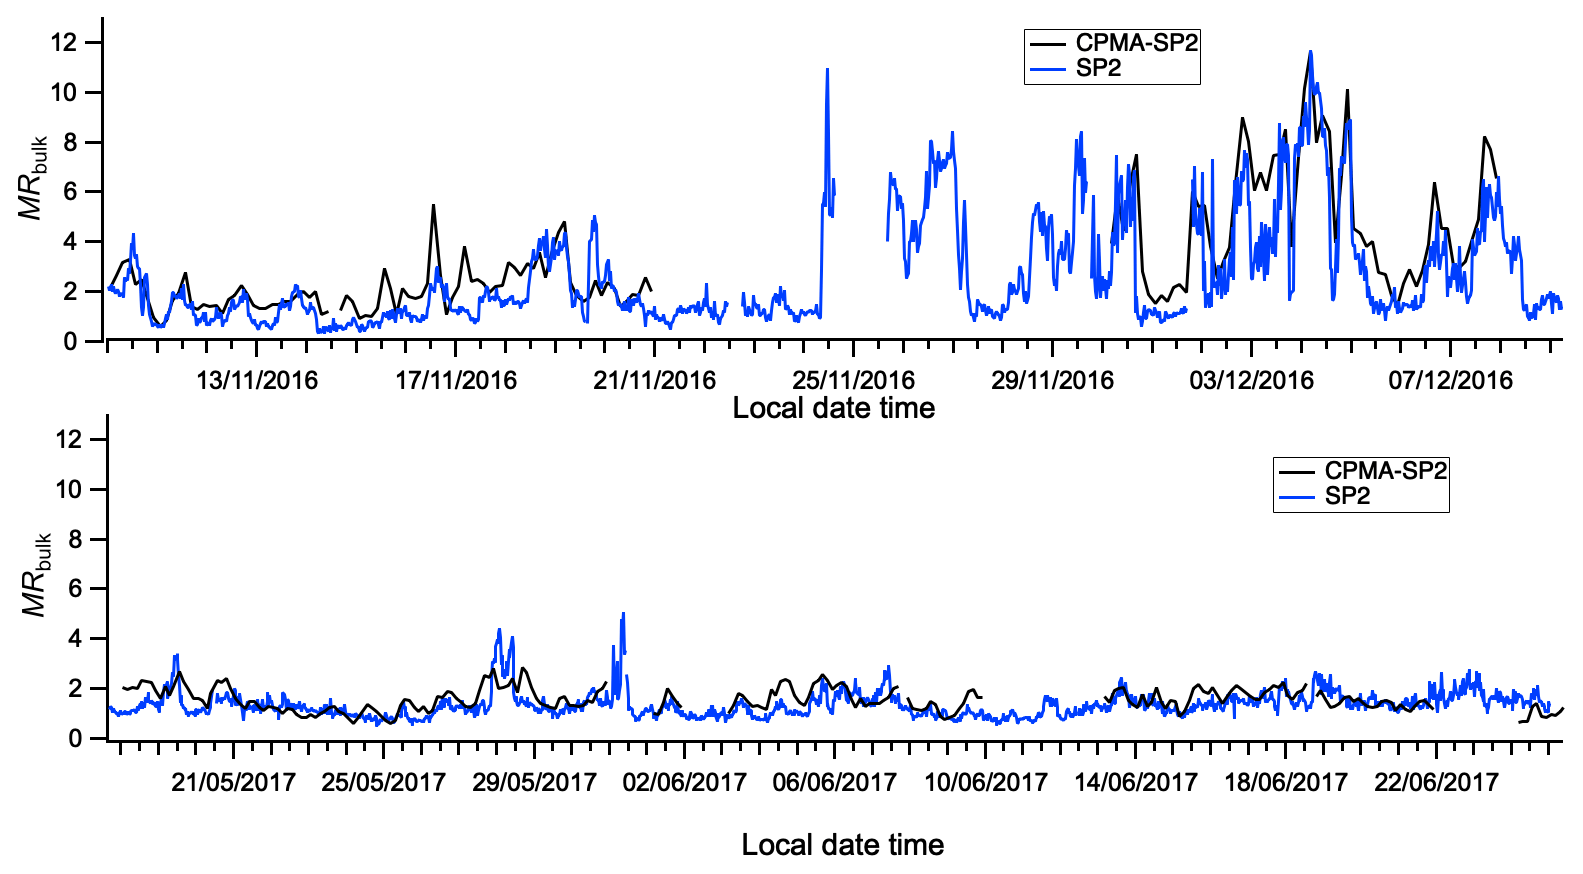
The CPMA–SP2 MRbulk time series for winter and summer are presented in Fig. 7. A significant increase was observed during the winter heavy-pollution period, and the MRbulk reached a maximum of 10 on 4 December. During low pollution periods the rBC particles had a lower MRbulk around 2. According to the source apportionment work during the same study by Liu et al. (2019) and Wang et al. (2019), around 64 % of organic components within the rBC-containing particles were from primary sources in winter. These sources may also emit non-rBC material externally mixed with rBC. During the heavy-pollution period in winter, a significant enhancement of secondary organic aerosol was observed (Wang et al., 2019). Figure 4 showed that, during the highly polluted period, there were large numbers of rBC-containing particles with mrBC between 1 and 10 fg. These rBC-containing particles with large mrBC mostly originated from the Southern Plateau based on the back-trajectory analysis in Fig. 10a, and Liu et al. (2019) suggested that they may be from coal burning. High pollution tends to introduce increased concentrations of gas precursors promoting the condensation of secondary material, and the higher overall particulate concentration promotes coagulation, particularly at the top of the boundary layer where the high humidity causes particles to grow further. Both condensation and coagulation will lead to more efficient mixing of rBC and increased MRbulk. In contrast, during the lightly polluted periods, the fractions of non-rBC material within the rBC-containing-particle population were much lower. The relatively cleaner air masses from the Northern Plateau dominated most of the light-pollution periods (Liu et al., 2019). With the absence of high absolute non-rBC material concentrations, the rBC-containing particles were externally mixed or had a lower fraction of non-rBC material.
Figure 7 shows that the MRbulk in summer varied between 1 and 2.7 with several moderate MRbulk values (MRbulk > 2), which was generally lower than in winter. Compared to the winter periods, the source apportionment shows that secondary material contributed more to the total organic aerosol species within the rBC-containing particles (Xie et al., 2019; Wang et al., 2019).
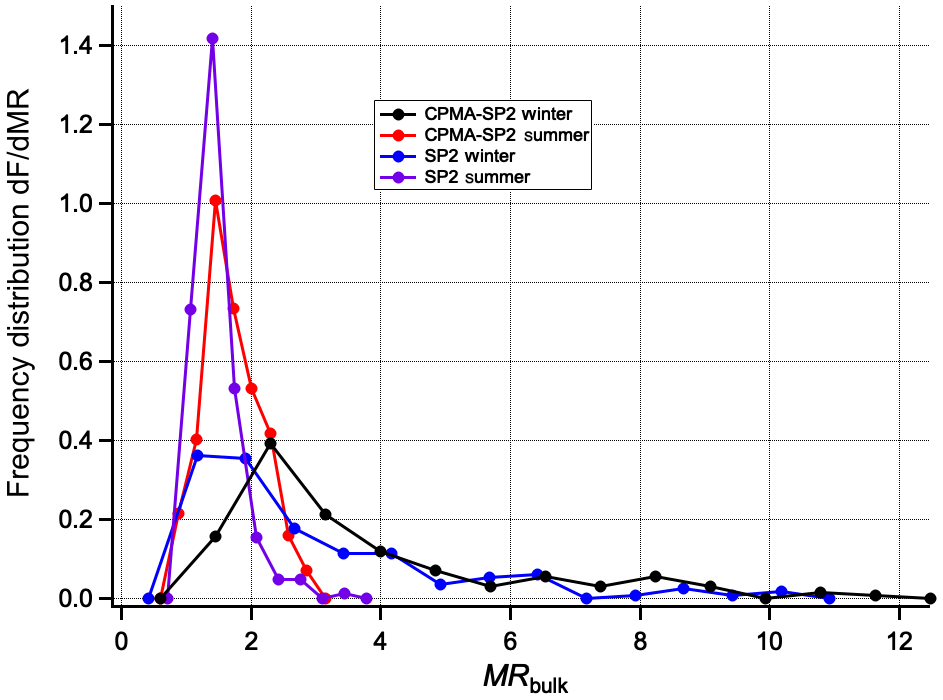
The MRbulk frequency distribution is presented in Fig. 8. Most of the rBC-containing particles contained a small fraction of non-rBC material with the MRbulk less than 2 in both winter and summer. The range of MRbulk values was also much broader in winter compared to the summer period. Some rBC-containing particles containing a large fraction of non-rBC material (MRbulk > 3) were observed in winter, while no such particles were found during the summer period. In general, the MRbulk frequency distribution from the CPMA–SP2 and SP2-only methods is similar.
A CPMA–SP2 two-variable distribution is able to present detailed single rBC-containing-particle concentric sphere equivalent coating thickness information. The MRi can be derived to quantify the concentric sphere equivalent coating thickness on each rBC-containing particle. Liu et al. (2017) stated that rBC-containing particles with MRi lower than 1.5 are typical for traffic emissions, while an MR greater than 3 is typical for biomass burning emissions. The rBC mass fraction under different MRi level classifications is presented in Fig. 9. Comparing the summer results with the winter results, the fraction of rBC-containing particles with a tiny fraction of non-rBC material (MRi ∼0) and rBC-containing particles with a moderate fraction of non-rBC material (1.5≤MRi < 3) is similar. The mass fraction varied slightly around 20 % for uncoated rBC-containing particles at both summer and winter campaign periods. The rBC-containing particles with a large fraction of non-rBC material (MRi≥3) accounted for a higher fraction in winter, especially for the heavy-haze periods between 3 and 5 December. The significant enhancement of the fraction of rBC-containing particles with MRi≥3 was more likely related to the increase in the fraction of secondary components during the heavily polluted period in winter (Wang et al., 2019). The rBC-containing particles with a small fraction of non-rBC material (0 < MRi < 1.5) accounted for a large portion (around 60 %) during the light-pollution periods in winter and occurred most of the time in summer. These rBC-containing particles with much lower MRi were likely to be generated from the consumption of fossil fuels (Liu et al., 2017, 2019).
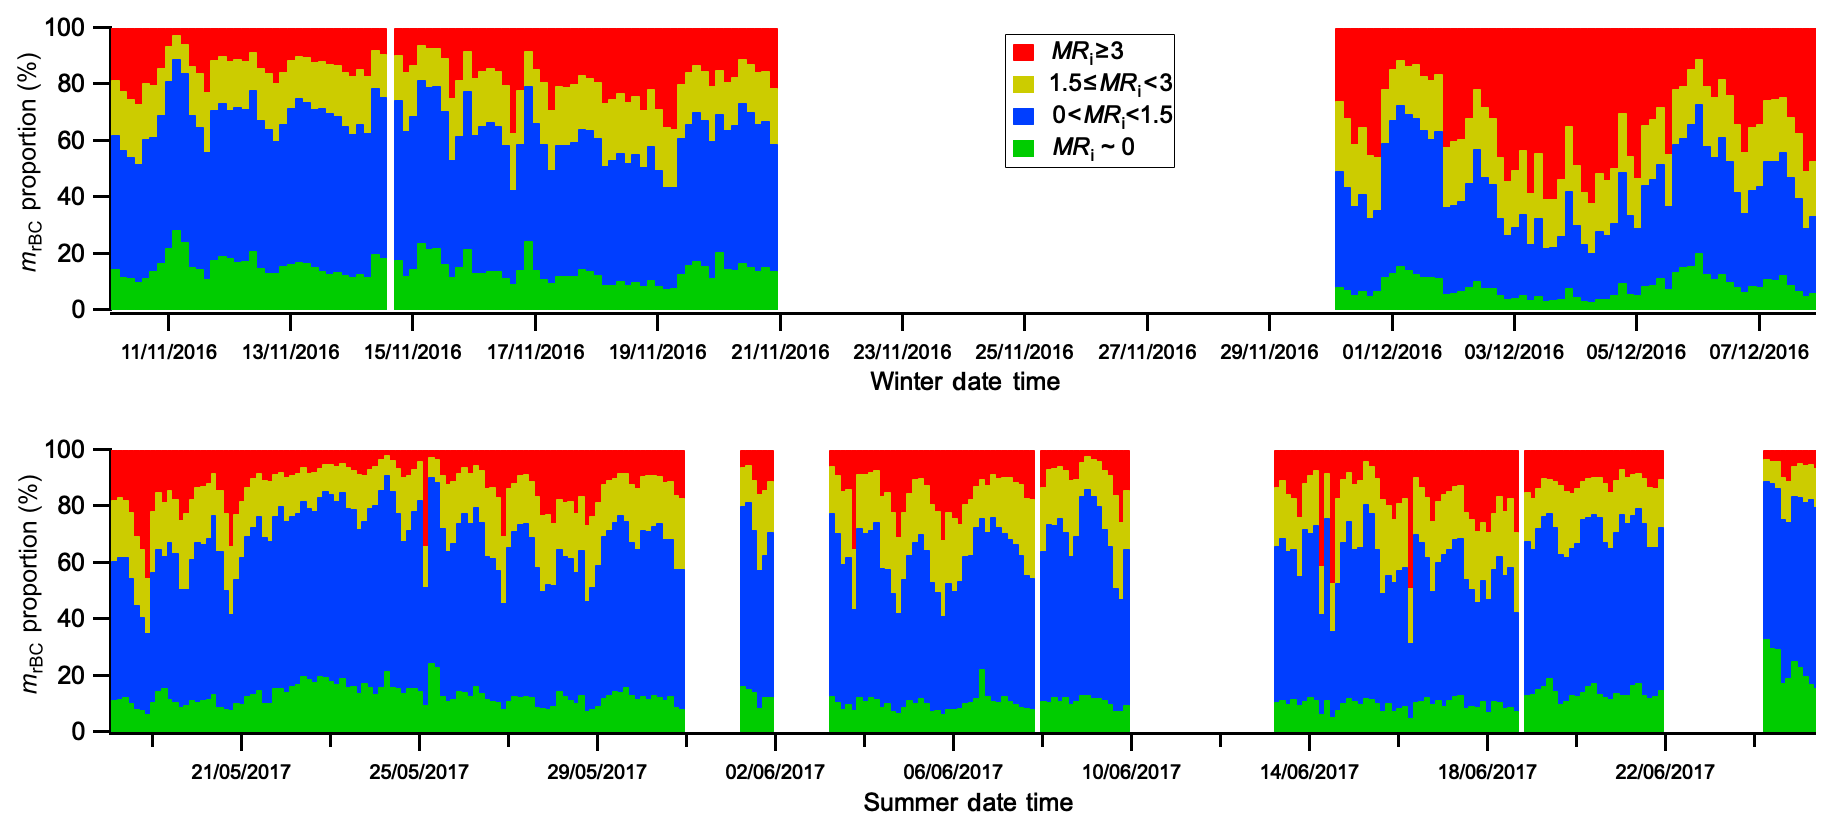
Figure 9The evolution of rBC material mass fraction at a different single-particle MR (MRi) level for winter and summer.
4.3 Entropy parameters and rBC mixing state
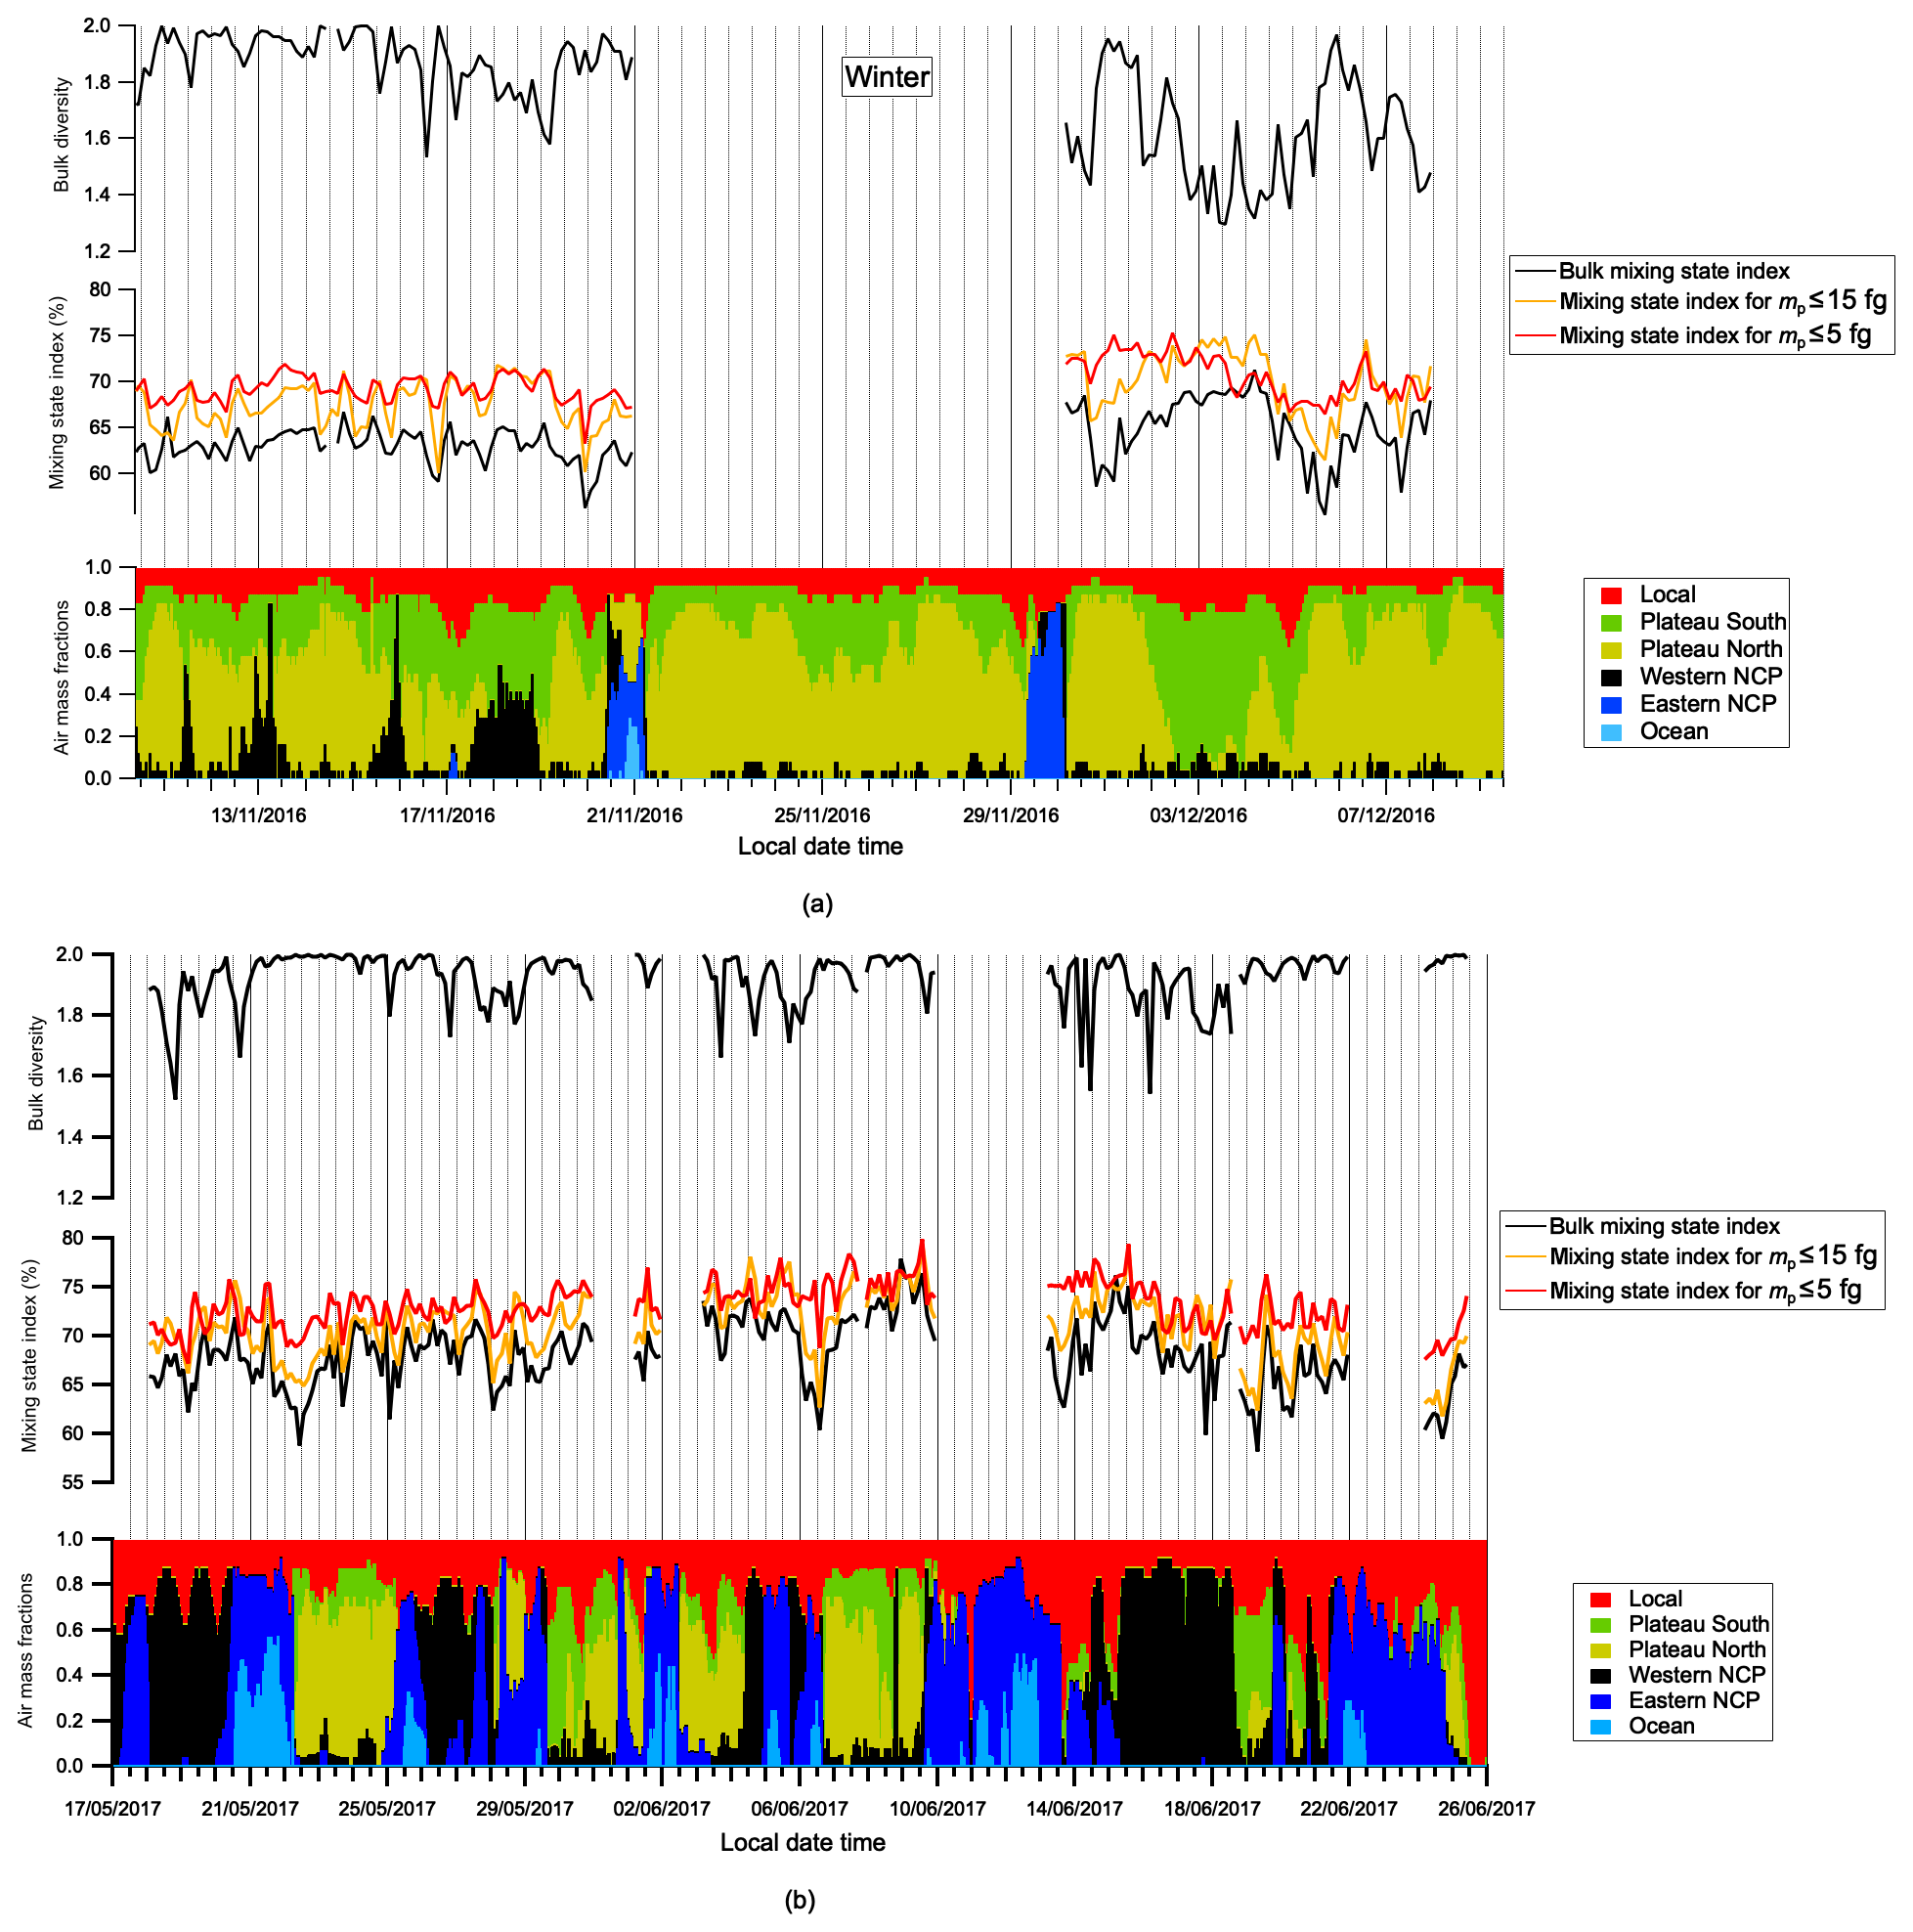
Derived from the CPMA–SP2 inversions, the bulk diversity (Dγ) and the mixing state index for rBC-containing particles (χrBC) results shown in Fig. 10 illustrate the variation of BC mixing state for the whole APHH campaign period. As the CPMA–SP2 system only detects the rBC-containing particles, the number of species set here is two: the rBC and non-rBC material. To reiterate, this metric should be taken as the level of homogeneity of rBC mixing state amongst the rBC-containing particles.
χrBC varied around 62 % between 10 and 21 November. A decrease in χrBC was observed between 19 and 20 December, which indicates a period of more externally mixed rBC. Apart from some minor χrBC spikes, the mixing state of rBC-containing particles remained unchanged between 10 and 21 November, whereas for the results between 1 and 6 December, χrBC and Dγ varied dramatically. After the polluted period on 30 November, a light-pollution period occurred on 1 December and χrBC decreased rapidly to below 60 %. When the haze formed between 2 and 4 December, χrBC increased gradually. In contrast, Dγ decreased significantly during this heavy-pollution period which was mainly caused by the thick non-rBC material on the rBC material, leading to a reduction of rBC material mass fraction percentage. The haze subsided after χrBC reached the peak of around 70 % on 4 December, another light-pollution period appeared, and χrBC and Dγ resumed to the value before the haze. For the moderate-pollution period between 6 and 7 December, χrBC reached another peak of around 68 %, and the increase in MRbulk led Dγ to decrease to around 1.5.
To investigate the mixing state of smaller rBC-containing particles, the mixing state index at smaller mp is also calculated, shown in Fig. 10. The χrBC at mp≤15 and mp≤5 fg is shown to be higher than the bulk χrBC, indicating that the rBC material was more evenly distributed among rBC-containing particles at smaller sizes. For most of the winter period, the trend of χrBC at mp≤15 and mp≤5 fg was similar to the trend of bulk χrBC. However, during the heavy-pollution period between 3 and 4 December, the χrBC at mp≤5 fg decreased slightly, suggesting that there was a relatively uneven distribution of rBC material and non-rBC material mass fractions for the smaller rBC-containing particles. During summer, the χrBC at mp≤15 fg and mp≤5 fg was closer to the bulk χrBC because of rBC-containing particles in summer being smaller and most of the rBC-containing particles having smaller MRi.
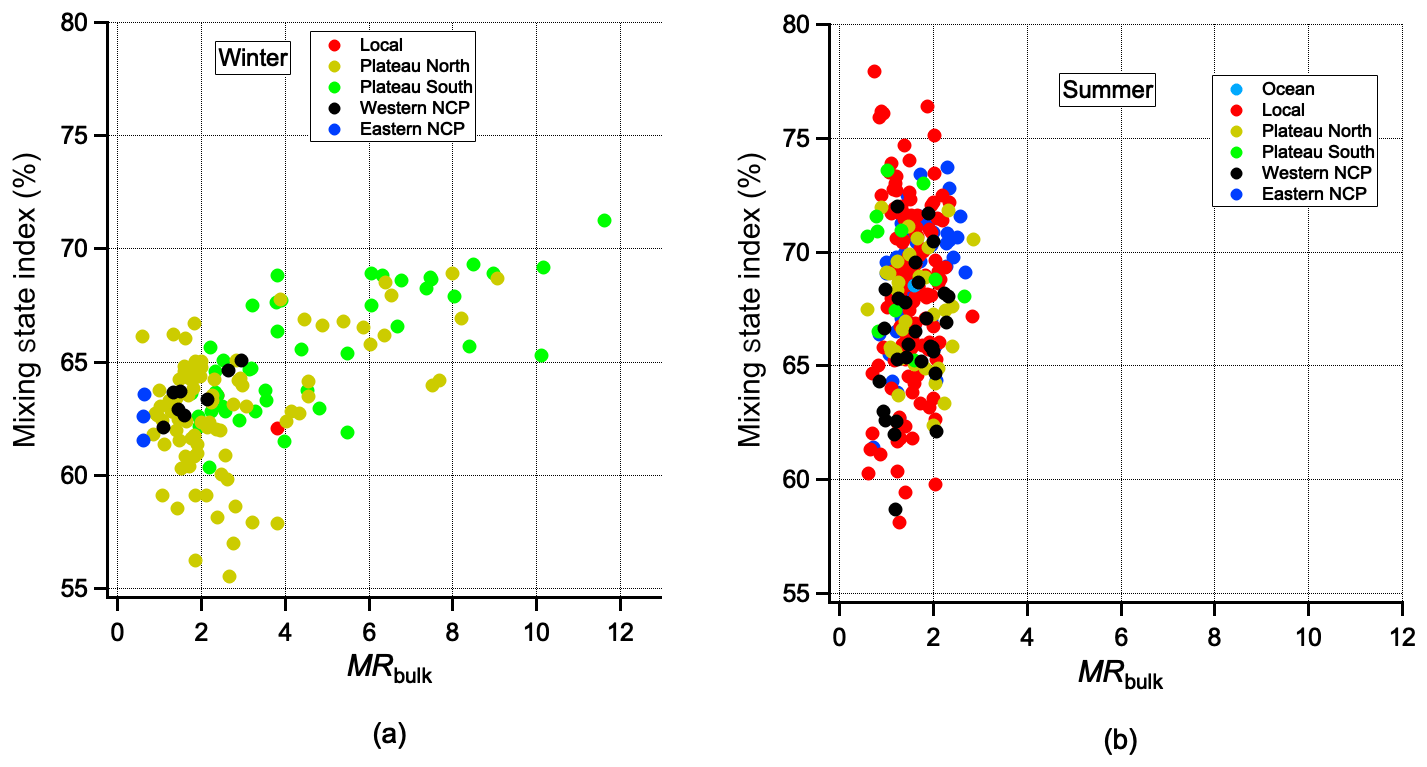
Figure 11Air mass sources contribute to the MR and mixing state index for summer (a) and winter (b).
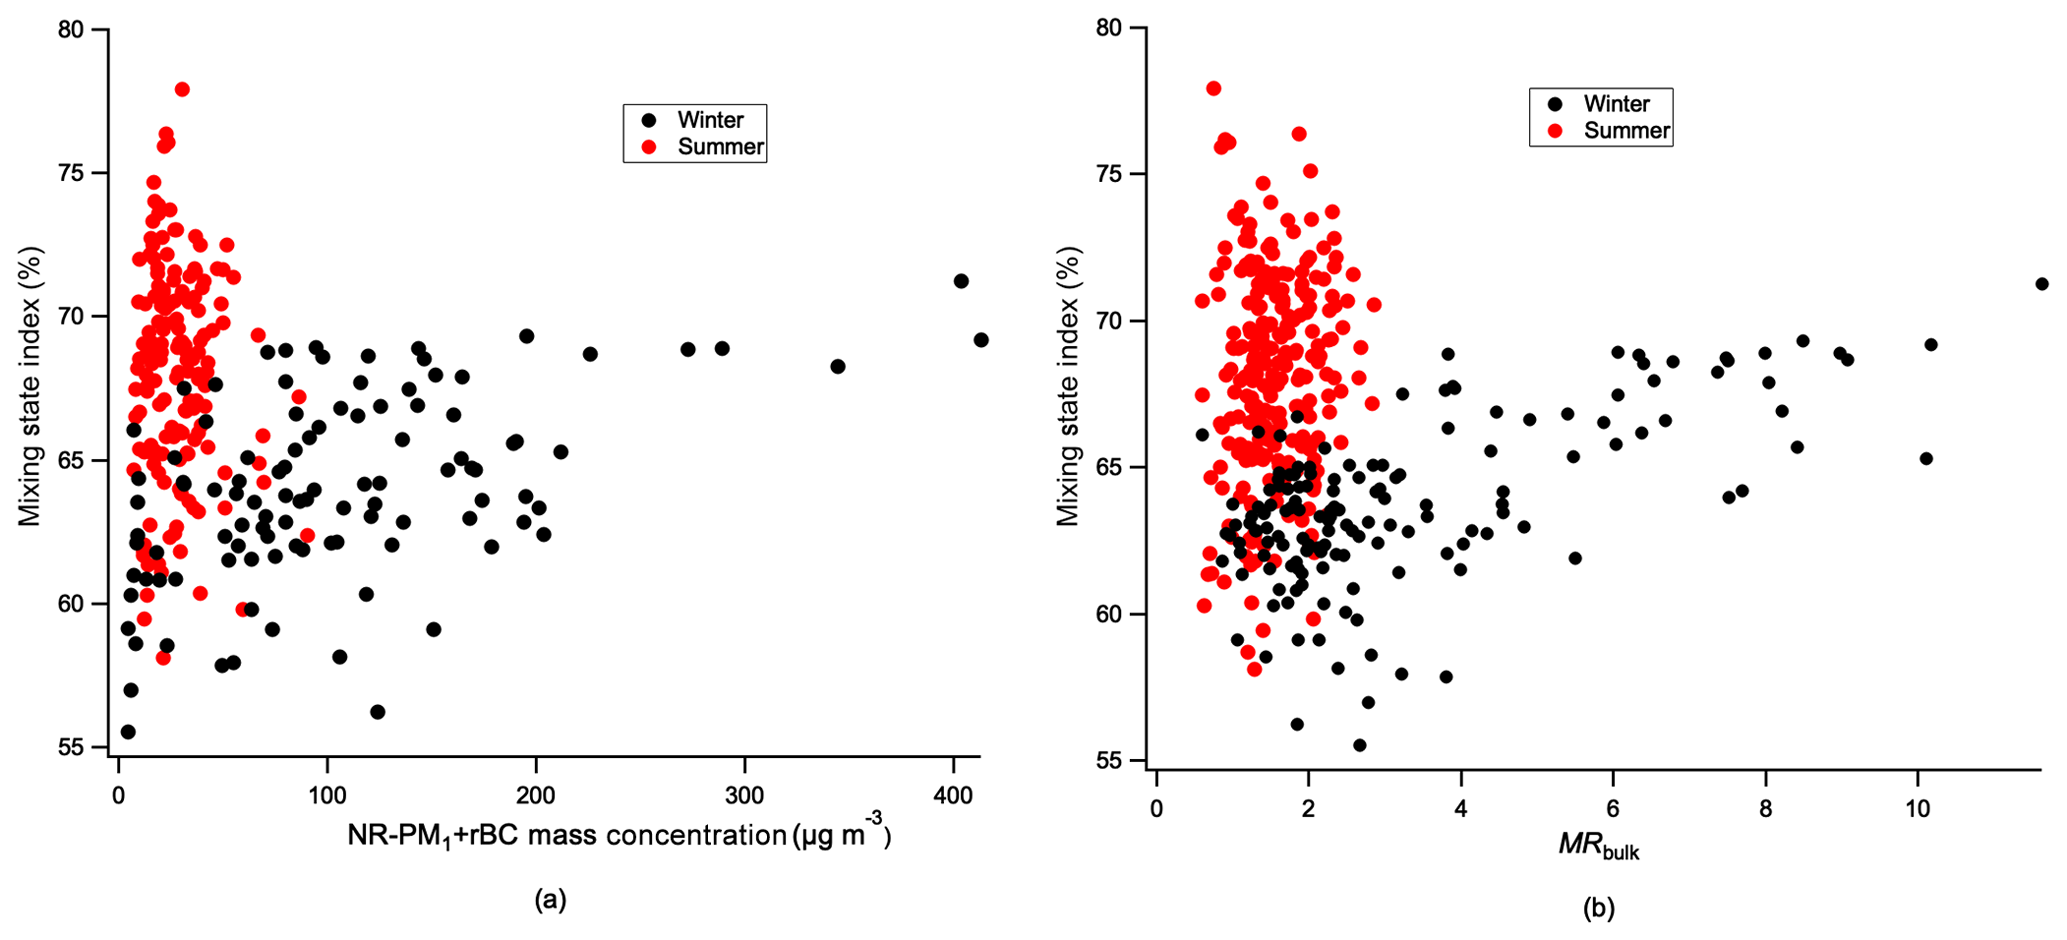
Figure 12(a) The relationship between NR-PM1 and rBC mass concentration and the mixing state index. (b) The relationship between MRbulk and the mixing state index.
The mixing state of rBC-containing particles can be also associated with the air mass sources, and the relationship between the major air mass source, MR and rBC mixing state is further explored further in Fig. 11. The winter characterisation result is shown in Figs. 10a and 11a. Among all the air mass sources, Plateau South and Western NCP were considered to represent the polluted air masses from which aged rBC-containing particles with larger MRi were transported during this period. When higher χrBC (between 60 % and 75 %) and MRbulk values (between 2 and 12) were observed the Plateau South air mass periods dominated. When local air mass and Plateau North air mass accounted for more fractions, the presences of rBC-containing particles with smaller MRi contributed to the significant increase in Dγ values and rapid decrease in χrBC and MRbulk values. For example, the reduction of rBC-containing-particle internal mixture on 30 November and 5 December can be associated with a relative clean Plateau North air mass. This evolution during the winter period agrees with the findings from Paris of Healy et al. (2014), who found that when considering the mixing state of bulk aerosol mass (which considered multiple non-rBC species) there was a trend towards more homogenous mixing when polluted air masses dominate compared to the local and clean marine air mass periods.
For the summer period shown in Fig. 10b, χrBC varied between 60 % and 75 %. As the MRbulk was lower in summer, the mass fraction of rBC material and the mass fraction of non-rBC material was closer within the bulk population, hence a slightly higher Dγ was observed in summer. Though the MRbulk and the rBC mass concentration was not as high as that in winter, sharp decreases in Dγ together with the increase in χrBC still occurred occasionally in summer, which indicate that some rBC-containing particles with moderate non-rBC material were observed. Unlike the winter campaign period, the back-trajectory results in summer shown in Fig. 11b do not show a significant association between mixing state parameters and air mass origin.
4.4 Discussion
In order to investigate which other parameters may act as a predictor for mixing state, Fig. 12 shows the variation of χrBC in both summer and winter against (a) NR-PM1 and rBC mass concentration and (b) MRbulk. There was a positive correlation between the variation of χrBC and the variation of MRbulk in winter as rBC-containing particles with larger non-rBC material (larger MRbulk) tended to exhibit a more even mixture during the winter campaign period. For the summer period, no such positive correlation was found. Although the rBC-containing particles did not contain a large fraction of non-rBC material in summer, and the pollution level was lower, there was significant variation of χrBC, which indicates that the distribution of rBC and non-rBC material mass fractions among the rBC-containing particles varies in a narrow range of lower MRbulk. This indicates that higher MRbulk can be related to increased levels of a more even mixture of rBC-containing particles in winter, while the MRbulk metric cannot be used to predict the variation of χrBC in summer.
Comparing the two seasons, there was more diversity in the distribution of rBC mixing state in summer than in winter under similar MRbulk or similar NR-PM1 and rBC mass concentrations. About 30 % of the experimental period in summer had χrBC over 70 %; however, this fraction was almost absent in winter. This means that although the pollution was low in summer, a more homogenous distribution of non-rBC material was present.
As χrBC is a mass-weighted parameter, it is dominated by the larger rBC-containing particles. During the heavy-pollution period in winter, there was generally more particulate matter, so the non-rBC materials have a higher probability of coagulating with or condensing on primary rBC, resulting in the relatively higher amount of non-rBC material detected in winter. The rBC particles with a higher MRi contributed most to the rBC mass concentration during the heavy-pollution periods (shown in Fig. 9), and the fraction of the secondary non-rBC material within rBC-containing particles increased with pollution level (Wang et al., 2019). These large rBC-containing particles with a large fraction of non-rBC material dominated the total rBC-containing-particle mass and showed a higher χrBC value. This increasing trend of χrBC was shown to correspond to the MRbulk and NR-PM1 level, and this means the higher pollution will be associated with enhanced non-rBC material and a similar mixing state for most rBC-containing particles in winter.
During the lighter-pollution periods, most of the rBC-containing particles had a lower MRi, and a lower MRbulk was present. A lower χrBC was present when MRbulk or the pollution level was lower in winter. One reason is that although the MRbulk is lower, there were still some relatively large rBC-containing particles with a large or moderate MRi, which were not sufficient to dominate the overall rBC-containing-particle mass concentration or overall χrBC during the light-pollution periods. A significant difference was thus observed between the χrBC for small rBC-containing particles (at mp≤5 fg) and the bulk χrBC. The other reason for the uneven distribution of non-rBC material and rBC material mass fractions may be that the appearance of non-rBC material in rBC-containing particles is being limited. There were more rBC-containing particles with little non-rBC material during this period, compared to the moderate- or heavy-pollution periods in winter. Therefore, the non-rBC material and rBC material mass fractions tended to be unevenly distributed among rBC-containing particles, and the χrBC shows a lower value.
As there were fewer large rBC-containing particles in summer, the bulk χrBC result is close to the χrBC result of smaller rBC-containing particles, and the bulk χrBC is generally higher than the winter period for most of the time. This could be through a lower diversity of sources during certain periods and/or a difference in atmospheric processes that leads to a uniform condensation of secondary material without significantly raising MRbulk. In summer, the concentrations of primary aerosols are lower compared to winter, and secondary organic aerosols (SOAs) contribute a larger fraction to the total organic aerosols (OAs) in Beijing (Sun et al., 2018; Hu et al., 2016). Previous studies show that an internal mixture would be expected for BC associated with a larger secondary fraction (Krasowsky et al., 2018; Bondy et al., 2018), but the lower overall pollution levels in summer limited the formation of large rBC-containing particles. This may cause the large variation of χrBC in summer.
Results comparing both seasons suggest that the increase in non-rBC material with MRbulk above four could lead to a more even distribution of rBC and non-rBC material (χrBC > 60 %), as indicated by the winter results. In contrast, during summer the χrBC had a larger variation, and an even mixture for rBC-containing particles was still possible when MRbulk and the overall pollution level was lower.
The CPMA–SP2 together with a new inversion method are capable of exploring ambient BC mixing state in a way not previously possible. The detailed two-variable distribution is able to retrieve the mixing state information on a single-particle level. For future studies, the detailed two-variable distribution results from the CPMA–SP2 can be directly compared with mixing-state-aware models such as GLOMAP (Mann et al., 2010) and the particle-resolved model PartMC-MOSAIC (Riemer et al., 2009) when simulating the behaviour of BC in polluted plumes. Some modelling studies have suggested that large uncertainties of BC atmospheric lifetime result from uncertainties in the scavenging efficiency (e.g. Myhre and Samset, 2015). The processes of activation and impaction scavenging are partly dictated by the overall size and soluble fraction of the rBC-containing particles, which would manifest in the data presented here. However, while some models carry this information (e.g. hydrophobic vs. hydrophilic BC in GLOMAP) this is poorly constrained partly because of the lack of observations that can resolve this (Taylor et al., 2014). In general, more detailed non-rBC material information (MR results) and single-particle level mixing state information presented in our study can contribute to future studies concerning BC lifetime and transportation to help to constrain the simulations (Bond et al., 2013; Fierce et al., 2017).
In this study, the combination of a centrifugal particle mass analyser (CPMA) and a single-particle soot photometer (SP2) has been applied to the investigation of the mixing state of refractory black carbon (rBC)-containing particles in urban Beijing. A novel CPMA–SP2 inversion algorithm is able to present the detailed two-variable number distribution as a function of rBC mass and total rBC-containing-particle mass. As the CPMA–SP2 system directly measures the particle mass, more accurate mass ratio (MR) results for the rBC-containing particles are reported. With the detailed inversion metric results, the mixing state index (χrBC) is derived to quantify the distribution rBC and non-rBC material mass fractions within the population of rBC-containing particles. The measurement results show that the measured bulk MR (MRbulk) during the winter campaign period varied significantly from around 2 to 12, while the χrBC value varied between 55 % and 70 %. The highest MRbulk values were associated with the haze-polluted periods in winter, and the χrBC value reached higher values under these conditions (over 65 %), which illustrated there was a more even distribution of rBC and non-rBC material mass fractions during this period. This result shows that higher pollution levels will increase the non-rBC material in rBC-containing particles and promote a more homogenous distribution of non-rBC material and rBC material in winter. These results further imply that the MRbulk may be a good predictor of χrBC in this season. Meanwhile, the back-trajectory analysis indicates that polluted air from the Southern Plateau dominated the aged rBC-containing particles in Beijing during winter. For the summer campaign period, the MRbulk varied between 2 and 3. The χrBC varied between 60 % and 75 % but was found to be independent of MRbulk. The slightly higher χrBC in summer indicates a more even distribution of rBC and non-rBC material mass fractions, which may be caused by higher availability of secondary material. However, a large fraction of non-rBC material within the rBC-containing-particle population (large MRbulk) was not favoured, due to the lack of heavily polluted events in summer, and further no apparent relationship was found between the rBC-containing-particle mixing state and air mass sources. The observations presented here have implications for detailed models of BC, its optical properties and its atmospheric life cycle, which are necessary to assess its local and global impacts. For models that consider mixing state, the methods and results discussed here can better describe the BC mixing state, which may offer new insights and contribute to improvements in the accuracy of simulations.
Processed SP2 data are available through the APHH project archive at the Centre for Environmental Data Analysis (http://data.ceda.ac.uk/badc/aphh/data/beijing/, Yu et al., 2017). Raw data are archived at the University of Manchester and are available on request.
The supplement related to this article is available online at: https://doi.org/10.5194/acp-20-3645-2020-supplement.
DL, JDA and JO designed the research; CY, DL, JDA, R.J., HC, YS and PF performed experiments; KB and JO provided the initial inversion code; CY adapted the inversion code and performed the CPMA–SP2 data analysis; DL performed the initial SP2 data processing and HYSPLIT runs; YS analysed the NR-PM1 data; CY, DL and JDA wrote the paper.
The authors declare that they have no conflict of interest.
This article is part of the special issue “In-depth study of air pollution sources and processes within Beijing and its surrounding region (APHH-Beijing) (ACP/AMT inter-journal SI)”. It is not associated with a conference.
This research has been supported by the UK Natural Environment Research (grant nos. NE/N007123/1 and NE/N00695X/1) and the National Natural Science Foundation of China (grant nos. 41571130024, 41571130034 and 21777073.).
This paper was edited by Mei Zheng and reviewed by three anonymous referees.
Adachi, K., Moteki, N., Kondo, Y., and Igarashi, Y.: Mixing states of light-absorbing particles measured using a transmission electron microscope and a single-particle soot photometer in Tokyo, Japan, J. Geophys. Res.-Atmos., 121, 9153–9164, https://doi.org/10.1002/2016jd025153, 2016.
Bond, T. C. and Bergstrom, R. W.: Light Absorption by Carbonaceous Particles: An Investigative Review, Aerosol Sci. Tech., 40, 27–67, https://doi.org/10.1080/02786820500421521, 2006.
Bond, T. C., Doherty, S. J., Fahey, D. W., Forster, P. M., Berntsen, T., DeAngelo, B. J., Flanner, M. G., Ghan, S., Kärcher, B., Koch, D., Kinne, S., Kondo, Y., Quinn, P. K., Sarofim, M. C., Schultz, M. G., Schulz, M., Venkataraman, C., Zhang, H., Zhang, S., Bellouin, N., Guttikunda, S. K., Hopke, P. K., Jacobson, M. Z., Kaiser, J. W., Klimont, Z., Lohmann, U., Schwarz, J. P., Shindell, D., Storelvmo, T., Warren, S. G., and Zender, C. S.: Bounding the role of black carbon in the climate system: A scientific assessment, J. Geophys. Res.-Atmos., 118, 5380–5552, https://doi.org/10.1002/jgrd.50171, 2013.
Bondy, A. L., Bonanno, D., Moffet, R. C., Wang, B., Laskin, A., and Ault, A. P.: The diverse chemical mixing state of aerosol particles in the southeastern United States, Atmos. Chem. Phys., 18, 12595–12612, https://doi.org/10.5194/acp-18-12595-2018, 2018.
Broda, K. N., Olfert, J. S., Irwin, M., Schill, G. P., McMeeking, G. R., Schnitzler, E. G., and Jäger, W.: A novel inversion method to determine the mass distribution of non-refractory coatings on refractory black carbon using a centrifugal particle mass analyzer and single particle soot photometer, Aerosol Sci. Tech., 52, 567–578, https://doi.org/10.1080/02786826.2018.1433812, 2018.
Cappa, C. D., Onasch, T. B., Massoli, P., Worsnop, D. R., Bates, T. S., Cross, E. S., Davidovits, P., Hakala, J., Hayden, K. L., and Jobson, B. T.: Radiative absorption enhancements due to the mixing state of atmospheric black carbon, Science, 337, 1078–1081, 2012.
Ching, J. and Kajino, M.: Aerosol mixing state matters for particles deposition in human respiratory system, Sci. Rep.-UK, 8, 8864, https://doi.org/10.1038/s41598-018-27156-z, 2018.
DeCarlo, P. F., Kimmel, J. R., Trimborn, A., Northway, M. J., Jayne, J. T., Aiken, A. C., Gonin, M., Fuhrer, K., Horvath, T., Docherty, K. S., Worsnop, D. R., and Jimenez, J. L.: Field-Deployable, High-Resolution, Time-of-Flight Aerosol Mass Spectrometer, Anal. Chem., 78, 8281–8289, https://doi.org/10.1021/ac061249n, 2006.
Dickau, M., Olfert, J., Stettler, M. E. J., Boies, A., Momenimovahed, A., Thomson, K., Smallwood, G., and Johnson, M.: Methodology for quantifying the volatile mixing state of an aerosol, Aerosol Sci. Tech., 50, 759–772, https://doi.org/10.1080/02786826.2016.1185509, 2016.
Draxler, R. R. and Hess, G. D.: An overview of the HYSPLIT_ 4 modelling system for trajectories, Aust. Meteorol. Mag., 47, 295–308, 1998.
Fierce, L., Bond, T. C., Bauer, S. E., Mena, F., and Riemer, N.: Black carbon absorption at the global scale is affected by particle-scale diversity in composition, Nat. Commun., 7, 12361, https://doi.org/10.1038/ncomms12361, 2016.
Fierce, L., Riemer, N., and Bond, T. C.: Toward Reduced Representation of Mixing State for Simulating Aerosol Effects on Climate, B. Am. Meteorol. Soc., 98, 971–980, 10.1175/bams-d-16-0028.1, 2017.
Gao, R. S., Schwarz, J. P., Kelly, K. K., Fahey, D. W., Watts, L. A., Thompson, T. L., Spackman, J. R., Slowik, J. G., Cross, E. S., Han, J. H., Davidovits, P., Onasch, T. B., and Worsnop, D. R.: A Novel Method for Estimating Light-Scattering Properties of Soot Aerosols Using a Modified Single-Particle Soot Photometer, Aerosol Sci. Tech., 41, 125–135, https://doi.org/10.1080/02786820601118398, 2007.
Gong, X., Zhang, C., Chen, H., Nizkorodov, S. A., Chen, J., and Yang, X.: Size distribution and mixing state of black carbon particles during a heavy air pollution episode in Shanghai, Atmos. Chem. Phys., 16, 5399–5411, https://doi.org/10.5194/acp-16-5399-2016, 2016.
Healy, R. M., Riemer, N., Wenger, J. C., Murphy, M., West, M., Poulain, L., Wiedensohler, A., O'Connor, I. P., McGillicuddy, E., Sodeau, J. R., and Evans, G. J.: Single particle diversity and mixing state measurements, Atmos. Chem. Phys., 14, 6289–6299, https://doi.org/10.5194/acp-14-6289-2014, 2014.
Hu, W., Hu, M., Hu, W., Jimenez, J. L., Yuan, B., Chen, W., Wang, M., Wu, Y., Chen, C., Wang, Z., Peng, J., Zeng, L., and Shao, M.: Chemical composition, sources, and aging process of submicron aerosols in Beijing: Contrast between summer and winter, J. Geophys. Res.-Atmos., 121, 1955–1977, https://doi.org/10.1002/2015jd024020, 2016.
IPCC: Annex I: Atlas of Global and Regional Climate Projections in: Climate Change 2013: The Physical Science Basis. Contribution of Working Group I to the Fifth Assessment Report of the Intergovernmental Panel on Climate Change, edited by: Stocker, T. F., Qin, D., Plattner, G.-K., Tignor, M., Allen, S. K., Boschung, J., Nauels, A., Xia, Y., Bex, V., and Midgley, P. M., Cambridge University Press, Cambridge, United Kingdom and New York, NY, USA, 1311–1394, 2013.
Jacobson, M. Z.: A physically-based treatment of elemental carbon optics: Implications for global direct forcing of aerosols, Geophys. Res. Lett., 27, 217–220, https://doi.org/10.1029/1999gl010968, 2000.
Jacobson, M. Z.: Strong radiative heating due to the mixing state of black carbon in atmospheric aerosols, Nature, 409, 695–697, https://doi.org/10.1038/35055518, 2001.
Krasowsky, T. S., McMeeking, G. R., Sioutas, C., and Ban-Weiss, G.: Characterizing the evolution of physical properties and mixing state of black carbon particles: from near a major highway to the broader urban plume in Los Angeles, Atmos. Chem. Phys., 18, 11991–12010, https://doi.org/10.5194/acp-18-11991-2018, 2018.
Kuwata, M., Kondo, Y., Mochida, M., Takegawa, N., and Kawamura, K.: Dependence of CCN activity of less volatile particles on the amount of coating observed in Tokyo, J. Geophys. Res., 112, D11207, https://doi.org/10.1029/2006jd007758, 2007.
Laborde, M., Mertes, P., Zieger, P., Dommen, J., Baltensperger, U., and Gysel, M.: Sensitivity of the Single Particle Soot Photometer to different black carbon types, Atmos. Meas. Tech., 5, 1031–1043, https://doi.org/10.5194/amt-5-1031-2012, 2012
Lack, D. A. and Cappa, C. D.: Impact of brown and clear carbon on light absorption enhancement, single scatter albedo and absorption wavelength dependence of black carbon, Atmos. Chem. Phys., 10, 4207–4220, https://doi.org/10.5194/acp-10-4207-2010, 2010.
Liu, D., Flynn, M., Gysel, M., Targino, A., Crawford, I., Bower, K., Choularton, T., Jurányi, Z., Steinbacher, M., Hüglin, C., Curtius, J., Kampus, M., Petzold, A., Weingartner, E., Baltensperger, U., and Coe, H.: Single particle characterization of black carbon aerosols at a tropospheric alpine site in Switzerland, Atmos. Chem. Phys., 10, 7389–7407, https://doi.org/10.5194/acp-10-7389-2010, 2010.
Liu, D., Allan, J. D., Young, D. E., Coe, H., Beddows, D., Fleming, Z. L., Flynn, M. J., Gallagher, M. W., Harrison, R. M., Lee, J., Prevot, A. S. H., Taylor, J. W., Yin, J., Williams, P. I., and Zotter, P.: Size distribution, mixing state and source apportionment of black carbon aerosol in London during wintertime, Atmos. Chem. Phys., 14, 10061–10084, https://doi.org/10.5194/acp-14-10061-2014, 2014.
Liu, D., Quennehen, B., Darbyshire, E., Allan, J. D., Williams, P. I., Taylor, J. W., Bauguitte, S. J.-B., Flynn, M. J., Lowe, D., Gallagher, M. W., Bower, K. N., Choularton, T. W., and Coe, H.: The importance of Asia as a source of black carbon to the European Arctic during springtime 2013, Atmos. Chem. Phys., 15, 11537–11555, https://doi.org/10.5194/acp-15-11537-2015, 2015.
Liu, D., Whitehead, J., Alfarra, M. R., Reyes-Villegas, E., Spracklen, Dominick V., Reddington, C. L., Kong, S., Williams, P. I., Ting, Y.-C., Haslett, S., Taylor, J. W., Flynn, M. J., Morgan, W. T., McFiggans, G., Coe, H., and Allan, J. D.: Black-carbon absorption enhancement in the atmosphere determined by particle mixing state, Nat. Geosci., 10, 184–188, https://doi.org/10.1038/ngeo2901, 2017.
Liu, D., Taylor, J. W., Crosier, J., Marsden, N., Bower, K. N., Lloyd, G., Ryder, C. L., Brooke, J. K., Cotton, R., Marenco, F., Blyth, A., Cui, Z., Estelles, V., Gallagher, M., Coe, H., and Choularton, T. W.: Aircraft and ground measurements of dust aerosols over the west African coast in summer 2015 during ICE-D and AER-D, Atmos. Chem. Phys., 18, 3817–3838, https://doi.org/10.5194/acp-18-3817-2018, 2018.
Liu, D., Joshi, R., Wang, J., Yu, C., Allan, J. D., Coe, H., Flynn, M. J., Xie, C., Lee, J., Squires, F., Kotthaus, S., Grimmond, S., Ge, X., Sun, Y., and Fu, P.: Contrasting physical properties of black carbon in urban Beijing between winter and summer, Atmos. Chem. Phys., 19, 6749–6769, https://doi.org/10.5194/acp-19-6749-2019, 2019.
Mann, G. W., Carslaw, K. S., Spracklen, D. V., Ridley, D. A., Manktelow, P. T., Chipperfield, M. P., Pickering, S. J., and Johnson, C. E.: Description and evaluation of GLOMAP-mode: a modal global aerosol microphysics model for the UKCA composition-climate model, Geosci. Model Dev., 3, 519–551, https://doi.org/10.5194/gmd-3-519-2010, 2010.
McMeeking, G. R., Hamburger, T., Liu, D., Flynn, M., Morgan, W. T., Northway, M., Highwood, E. J., Krejci, R., Allan, J. D., Minikin, A., and Coe, H.: Black carbon measurements in the boundary layer over western and northern Europe, Atmos. Chem. Phys., 10, 9393–9414, https://doi.org/10.5194/acp-10-9393-2010, 2010.
Moffet, R. C. and Prather, K. A.: In-situ measurements of the mixing state and optical properties of soot with implications for radiative forcing estimates, P. Natl. Acad. Sci. USA, 106, 11872–11877, 2009.
Motos, G., Schmale, J., Corbin, J. C., Zanatta, M., Baltensperger, U., and Gysel-Beer, M.: Droplet activation behaviour of atmospheric black carbon particles in fog as a function of their size and mixing state, Atmos. Chem. Phys., 19, 2183–2207, https://doi.org/10.5194/acp-19-2183-2019, 2019.
Murphy, D. M., Cziczo, D. J., Froyd, K. D., Hudson, P. K., Matthew, B. M., Middlebrook, A. M., Peltier, R. E., Sullivan, A., Thomson, D. S., and Weber, R. J.: Single-particle mass spectrometry of tropospheric aerosol particles, J. Geophys. Res.-Atmos., 111, D23S32, https://doi.org/10.1029/2006jd007340, 2006.
Myhre, G. and Samset, B. H.: Standard climate models radiation codes underestimate black carbon radiative forcing, Atmos. Chem. Phys., 15, 2883–2888, https://doi.org/10.5194/acp-15-2883-2015, 2015.
Olfert, J. S. and Collings, N.: New method for particle mass classification–the Couette centrifugal particle mass analyzer, J. Aerosol Sci., 36, 1338–1352, https://doi.org/10.1016/j.jaerosci.2005.03.006, 2005.
Olfert, J. S., Reavell, K. S., Rushton, M. G., and Collings, N.: The experimental transfer function of the Couette centrifugal particle mass analyzer, J. Aerosol Sci., 37, 1840–1852, https://doi.org/10.1016/j.jaerosci.2006.07.007, 2006.
Peng, J., Hu, M., Guo, S., Du, Z., Zheng, J., Shang, D., Levy Zamora, M., Zeng, L., Shao, M., Wu, Y.-S., Zheng, J., Wang, Y., Glen, C. R., Collins, D. R., Molina, M. J., and Zhang, R.: Markedly enhanced absorption and direct radiative forcing of black carbon under polluted urban environments, P. Natl. Acad. Sci. USA, 113, 4266–4271, 2016.
Péré, J. C., Mallet, M., Bessagnet, B., and Pont, V.: Evidence of the aerosol core-shell mixing state over Europe during the heat wave of summer 2003 by using CHIMERE simulations and AERONET inversions, Geophys. Res. Lett., 36, L09807, https://doi.org/10.1029/2009gl037334, 2009.
Petzold, A., Ogren, J. A., Fiebig, M., Laj, P., Li, S.-M., Baltensperger, U., Holzer-Popp, T., Kinne, S., Pappalardo, G., Sugimoto, N., Wehrli, C., Wiedensohler, A., and Zhang, X.-Y.: Recommendations for reporting “black carbon” measurements, Atmos. Chem. Phys., 13, 8365–8379, https://doi.org/10.5194/acp-13-8365-2013, 2013.
Ramanathan, V. and Carmichael, G.: Global and regional climate changes due to black carbon, Nat. Geosci., 1, 221–227, https://doi.org/10.1038/ngeo156, 2008.
Riemer, N. and West, M.: Quantifying aerosol mixing state with entropy and diversity measures, Atmos. Chem. Phys., 13, 11423–11439, https://doi.org/10.5194/acp-13-11423-2013, 2013.
Riemer, N., West, M., Zaveri, R. A., and Easter, R. C.: Simulating the evolution of soot mixing state with a particle-resolved aerosol model, J. Geophys. Res., 114, https://doi.org/10.1029/2008jd011073, 2009.
Riemer, N., Ault, A. P., West, M., Craig, R. L., and Curtis, J. H.: Aerosol Mixing State: Measurements, Modeling, and Impacts, Rev. Geophys., 57, 187–249, https://doi.org/10.1029/2018RG000615, 2019.
Schroder, J. C., Hanna, S. J., Modini, R. L., Corrigan, A. L., Kreidenwies, S. M., Macdonald, A. M., Noone, K. J., Russell, L. M., Leaitch, W. R., and Bertram, A. K.: Size-resolved observations of refractory black carbon particles in cloud droplets at a marine boundary layer site, Atmos. Chem. Phys., 15, 1367–1383, https://doi.org/10.5194/acp-15-1367-2015, 2015.
Schwarz, J. P., Spackman, J. R., Gao, R. S., Perring, A. E., Cross, E., Onasch, T. B., Ahern, A., Wrobel, W., Davidovits, P., Olfert, J., Dubey, M. K., Mazzoleni, C., and Fahey, D. W.: The Detection Efficiency of the Single Particle Soot Photometer, Aerosol Sci. Tech., 44, 612–628, https://doi.org/10.1080/02786826.2010.481298, 2010.
Shannon, C. E.: A mathematical theory of communication, SIGMOBILE Mob. Comput. Commun. Rev., 5, 3–55, https://doi.org/10.1145/584091.584093, 2001.
Shi, Z., Vu, T., Kotthaus, S., Harrison, R. M., Grimmond, S., Yue, S., Zhu, T., Lee, J., Han, Y., Demuzere, M., Dunmore, R. E., Ren, L., Liu, D., Wang, Y., Wild, O., Allan, J., Acton, W. J., Barlow, J., Barratt, B., Beddows, D., Bloss, W. J., Calzolai, G., Carruthers, D., Carslaw, D. C., Chan, Q., Chatzidiakou, L., Chen, Y., Crilley, L., Coe, H., Dai, T., Doherty, R., Duan, F., Fu, P., Ge, B., Ge, M., Guan, D., Hamilton, J. F., He, K., Heal, M., Heard, D., Hewitt, C. N., Hollaway, M., Hu, M., Ji, D., Jiang, X., Jones, R., Kalberer, M., Kelly, F. J., Kramer, L., Langford, B., Lin, C., Lewis, A. C., Li, J., Li, W., Liu, H., Liu, J., Loh, M., Lu, K., Lucarelli, F., Mann, G., McFiggans, G., Miller, M. R., Mills, G., Monk, P., Nemitz, E., O'Connor, F., Ouyang, B., Palmer, P. I., Percival, C., Popoola, O., Reeves, C., Rickard, A. R., Shao, L., Shi, G., Spracklen, D., Stevenson, D., Sun, Y., Sun, Z., Tao, S., Tong, S., Wang, Q., Wang, W., Wang, X., Wang, X., Wang, Z., Wei, L., Whalley, L., Wu, X., Wu, Z., Xie, P., Yang, F., Zhang, Q., Zhang, Y., Zhang, Y., and Zheng, M.: Introduction to the special issue “In-depth study of air pollution sources and processes within Beijing and its surrounding region (APHH-Beijing)”, Atmos. Chem. Phys., 19, 7519–7546, https://doi.org/10.5194/acp-19-7519-2019, 2019.
Stephens, M., Turner, N., and Sandberg, J.: Particle identification by laser-induced incandescence in a solid-state laser cavity, Appl. Optics, 42, 3726–3736, https://doi.org/10.1364/AO.42.003726, 2003.
Sun, Y., Xu, W., Zhang, Q., Jiang, Q., Canonaco, F., Prévôt, A. S. H., Fu, P., Li, J., Jayne, J., Worsnop, D. R., and Wang, Z.: Source apportionment of organic aerosol from 2-year highly time-resolved measurements by an aerosol chemical speciation monitor in Beijing, China, Atmos. Chem. Phys., 18, 8469–8489, https://doi.org/10.5194/acp-18-8469-2018, 2018.
Taylor, J. W., Allan, J. D., Allen, G., Coe, H., Williams, P. I., Flynn, M. J., Le Breton, M., Muller, J. B. A., Percival, C. J., Oram, D., Forster, G., Lee, J. D., Rickard, A. R., Parrington, M., and Palmer, P. I.: Size-dependent wet removal of black carbon in Canadian biomass burning plumes, Atmos. Chem. Phys., 14, 13755–13771, https://doi.org/10.5194/acp-14-13755-2014, 2014.
Wang, J., Liu, D., Ge, X., Wu, Y., Shen, F., Chen, M., Zhao, J., Xie, C., Wang, Q., Xu, W., Zhang, J., Hu, J., Allan, J., Joshi, R., Fu, P., Coe, H., and Sun, Y.: Characterization of black carbon-containing fine particles in Beijing during wintertime, Atmos. Chem. Phys., 19, 447–458, https://doi.org/10.5194/acp-19-447-2019, 2019.
Whittaker, R. H.: Vegetation of the Siskiyou Mountains, Oregon and California, Ecol. Monogr., 30, 279–338, https://doi.org/10.2307/1943563, 1960.
Whittaker, R. H.: Dominance and Diversity in Land Plant Communities, Science, 147, 250–260, 1965.
Wu, Y., Wang, X., Tao, J., Huang, R., Tian, P., Cao, J., Zhang, L., Ho, K.-F., Han, Z., and Zhang, R.: Size distribution and source of black carbon aerosol in urban Beijing during winter haze episodes, Atmos. Chem. Phys., 17, 7965–7975, https://doi.org/10.5194/acp-17-7965-2017, 2017.
Wu, Y., Cheng, T., Liu, D., Allan, J. D., Zheng, L., and Chen, H.: Light Absorption Enhancement of Black Carbon Aerosol Constrained by Particle Morphology, Environ. Sci. Technol., 52, 6912–6919, https://doi.org/10.1021/acs.est.8b00636, 2018.
Xie, C., Xu, W., Wang, J., Liu, D., Ge, X., Zhang, Q., Wang, Q., Du, W., Zhao, J., Zhou, W., Li, J., Fu, P., Wang, Z., Worsnop, D., and Sun, Y.: Light absorption enhancement of black carbon in urban Beijing in summer, Atmos. Environ., 213, 499–504, https://doi.org/10.1016/j.atmosenv.2019.06.041, 2019.
Yang, J., McBride, J., Zhou, J., and Sun, Z.: The urban forest in Beijing and its role in air pollution reduction, Urban For. Urban Green., 3, 65–78, https://doi.org/10.1016/j.ufug.2004.09.001, 2005.
Yu, C., Liu, D., and Allan, J.: APHH: Atmospheric measurements and model results for the Atmospheric Pollution & Human Health in a Chinese Megacity, available at: http://data.ceda.ac.uk/badc/aphh/data/beijing/, last access: 18 October 2017.
Zhang, X., Mao, M., Yin, Y., and Wang, B.: Numerical Investigation on Absorption Enhancement of Black Carbon Aerosols Partially Coated With Nonabsorbing Organics, J. Geophys. Res.-Atmos., 123, 1297–1308, https://doi.org/10.1002/2017JD027833, 2018a.
Zhang, Y., Zhang, Q., Cheng, Y., Su, H., Li, H., Li, M., Zhang, X., Ding, A., and He, K.: Amplification of light absorption of black carbon associated with air pollution, Atmos. Chem. Phys., 18, 9879–9896, https://doi.org/10.5194/acp-18-9879-2018, 2018b.