the Creative Commons Attribution 4.0 License.
the Creative Commons Attribution 4.0 License.
 | 25 Mar 2020
Tritium as a hydrological tracer in Mediterranean precipitation events
Jürgen Sültenfuß
Katja Trachte
Frédéric Huneau
Emilie Garel
Sébastien Santoni
Johannes A. C. Barth
Robert van Geldern
Climate models are in need of improved constraints for water vapor transport in the atmosphere, and tritium can serve as a powerful tracer in the hydrological cycle. Although the general principles of tritium distribution and transfer processes within and between the various hydrological compartments are known, variation on short timescales and aspects of altitude dependence are still under debate. To address questions regarding tritium sources, sinks, and transfer processes, the sampling of individual precipitation events in Corte on the island of Corsica in the Mediterranean Sea was performed between April 2017 and April 2018. Tritium concentrations of 46 event samples were compared to their moisture origin and corresponding air mass history. Air mass back-trajectories were generated from the novel high-resolution ERA5 dataset from the ECMWF (European Centre for Medium-Range Weather Forecasts). Geographical source regions with similar tritium concentrations were predefined using generally known tritium distribution patterns, such as the “continental effect”, and from data records derived at long-term measurement stations of tritium in precipitation across the working area. Our model-derived source region tritium concentrations agreed well with annual mean station values. Moisture that originated from continental Europe and the Atlantic Ocean was most distinct regarding tritium concentrations with values up to 8.8 TU (tritium units) and near 0 TU, respectively. The seasonality of tritium values ranged from 1.6 TU in January to 10.1 TU in May, and they exhibited well-known elevated concentrations in spring and early summer due to increased stratosphere–troposphere exchange. However, this pattern was interrupted by extreme events. The average altitude of trajectories was correlated with the tritium concentrations in precipitation, especially in spring and early summer and if outlier values of extreme tritium concentrations were excluded. However, in combination with the trajectory information, these outlier values proved to be valuable for improving the comprehension of tritium movement in the atmosphere. Our work shows how event-based tritium research can advance the understanding of its distribution in the atmosphere.
- Article
(7392 KB) - Full-text XML
- BibTeX
- EndNote


The hydrologic cycle is one of the key components in today's climate models that predict the evolution of climate parameters in the face of climate change. An improved constraint of model input parameters, such as atmospheric moisture transport, has gained increased scientific interest (Flato et al., 2013). For instance, cloud formation (Seinfeld et al., 2016) and planetary boundary layer (PBL) representation (Teixeira et al., 2008) are considered to be some of the main sources of error in model scenarios. In addition to computational advances, measurements of hydrochemical parameters can serve to better constrain moisture transport patterns. Thus, ideal parameters for this task should directly trace the movement of the water molecule itself.
One widely used tracer for this is tritium (3H or T) that enters the hydrological cycle mostly in the form of tritiated water (HTO). Tritium is a radiogenic isotope of hydrogen with a half-life of 12.32 (±0.02) years (Lucas and Unterweger, 2000), which has natural and anthropogenic sources to the environment.
Natural tritium is produced by cosmic radiation that interacts with nitrogen in the upper atmosphere (Craig and Lal, 1961). As the natural production of tritium as well as its decay is constant over time, there is a constant global inventory of natural tritium. The average concentration without anthropogenic influence is about 5 TU (1 TU is equal to a 3H∕1H ratio of 10−18) in precipitation for northern Europe (Roether, 1967). In addition to this natural background, fusion bomb tests, conducted until the early 1960s, added high concentrations of tritium to the environment. This resulted in peak concentrations of tritium in the hydrosphere in 1963 (GNIP station in Vienna; IAEA/WMO, 2019). This tritium bomb-peak has been used in various studies as a method to trace and date groundwater (Von Buttlar and Wendt, 1958; Allison and Holmes, 1973), to quantify recharge (Vogel et al., 1974; Allison and Hughes, 1975), or to investigate ocean circulation (Jenkins and Rhines, 1980; Fine et al., 1981). The generally observed decline of the tritium concentration in precipitation since peak times in the 1960s is the result of multiple processes. Due to radioactive decay, elevated concentrations decrease over time. Additionally, the intermediate storage of tritium in groundwater, absorption by plants, and long-term storage in deep ocean water lowers the tritium amount in the more active part of the hydrologic cycle. The current anthropogenic release of tritium into the environment is a byproduct of nuclear facilities, such as nuclear power and reprocessing plants. Emissions from these sources are several magnitudes lower than historical bomb-derived tritium concentrations. In the past, natural variations of tritium in meteoric waters were masked by the input of bomb-generated tritium (Palcsu et al., 2018). The latter has now decayed to concentrations near natural levels, which allows investigations into the natural tritium cycle. Natural levels are expected to be reached during the next decade (Eastoe et al., 2012). Thus, a thorough assessment of these variations is necessary for a better understanding of the tritium distribution in recent and future studies to map natural tritium distributions and delineate sources and sinks in the hydrologic cycle (Cauquoin et al., 2015, 2016).
A conceptual model of tritium with an exclusively natural origin would have the upper atmosphere as the only source of tritium. Through rainout, tritium would reach the groundwater where it is stored and eventually discharged to streams and the ocean. In the ocean, any continental runoff or direct precipitation becomes diluted in the much larger volume of ocean water. The larger timescales of ocean circulation prevent a buildup of the decaying tritium. Thus, the tritium concentrations of ocean water and its evaporated vapor are expected to be near zero. During air mass transport, the direct uptake of high-tritium vapor from the upper atmosphere and reevaporation control the distribution of tritium in precipitation that is collected on land. Comparable to the stable isotope ratios of oxygen and hydrogen in the water molecule, several “effects” may impact the distribution of tritium in precipitation. The “latitude effect” shows increasing tritium concentrations with increasing latitude (Schell et al., 1974), the “seasonal effect” exhibits increasing tritium concentrations during spring and early summer (Libby, 1963), and the “continental effect” describes rising tritium concentrations in precipitation with increasing distance from coasts (Schell et al., 1970). Additionally, stratospheric moisture contains tritium contents that are one (Ehhalt, 1971) to several magnitudes (Ehhalt et al., 2002) higher than moisture near ground level. Even small amounts of this moisture can substantially increase the tritium concentrations of resulting precipitation (Aggarwal et al., 2016). As the exchange between the stratosphere and troposphere varies geographically and over time (Jordan et al., 2003), the dynamics of the stratospheric tritium contribution remains a partly open question (Cauquoin et al., 2015).
All of these effects have been observed in monthly integrated samples of precipitation (Mook et al., 2001) and predicted by models (Cauquoin et al., 2015; Visser et al., 2018); however, they currently lack a thorough investigation on a single precipitation event basis. To better understand short-term tritium variations in precipitation, air mass back-trajectory modeling was applied in this study to identify the sources of water vapor for individual precipitation events and in order to compare the resulting tritium concentrations with their expected origin. In particular, we aimed to compare spatial tritium distribution patterns from the Global Network of Isotopes in Precipitation (GNIP; IAEA/WMO, 2019) with moisture source regions of discreetly sampled events. This comparison also aimed to assess the influence of sampling on different timescales. Additionally, we examined correlations between tritium concentrations and the altitude history of air masses to outline the contributions of upper atmosphere tritium to single precipitation events. The improved resolution of available meteorological grid datasets in the form of the new ERA5 dataset (Copernicus Climate Change Service (C3S), 2017) from the European Centre for Medium-Range Weather Forecasts (ECMWF) was an important prerequisite for our high-resolution study. Another important aspect of this work is the location of sample collection in Corsica in the Mediterranean. In the Mediterranean, multiple air mass origins are observed throughout the year (Thiébault and Moatti, 2016). Precipitation samples with varying moisture origins are crucial for an in-depth comparison of multiple source regions. Our results will enhance the understanding of natural tritium dynamics and moisture movement in the atmosphere.
Precipitation samples were collected between April 2017 and April 2018 in the city of Corte on the Mediterranean island of Corsica, France (42.300570∘ N, 9.148592∘ E; 415 m a.s.l.; Fig. 1). The sampling location is located in central Corsica, on the eastern part of the island's main mountain ridge that reaches an elevation of up to 2706 m a.s.l. A mountain range (named Castagniccia) is situated east of Corte and reaches an elevation of up to 1767 m a.s.l. Corte lies on the west wind lee side of the main mountain ridge; because it is not directly situated at the sea, a more diverse moisture origin for precipitation events is expected.
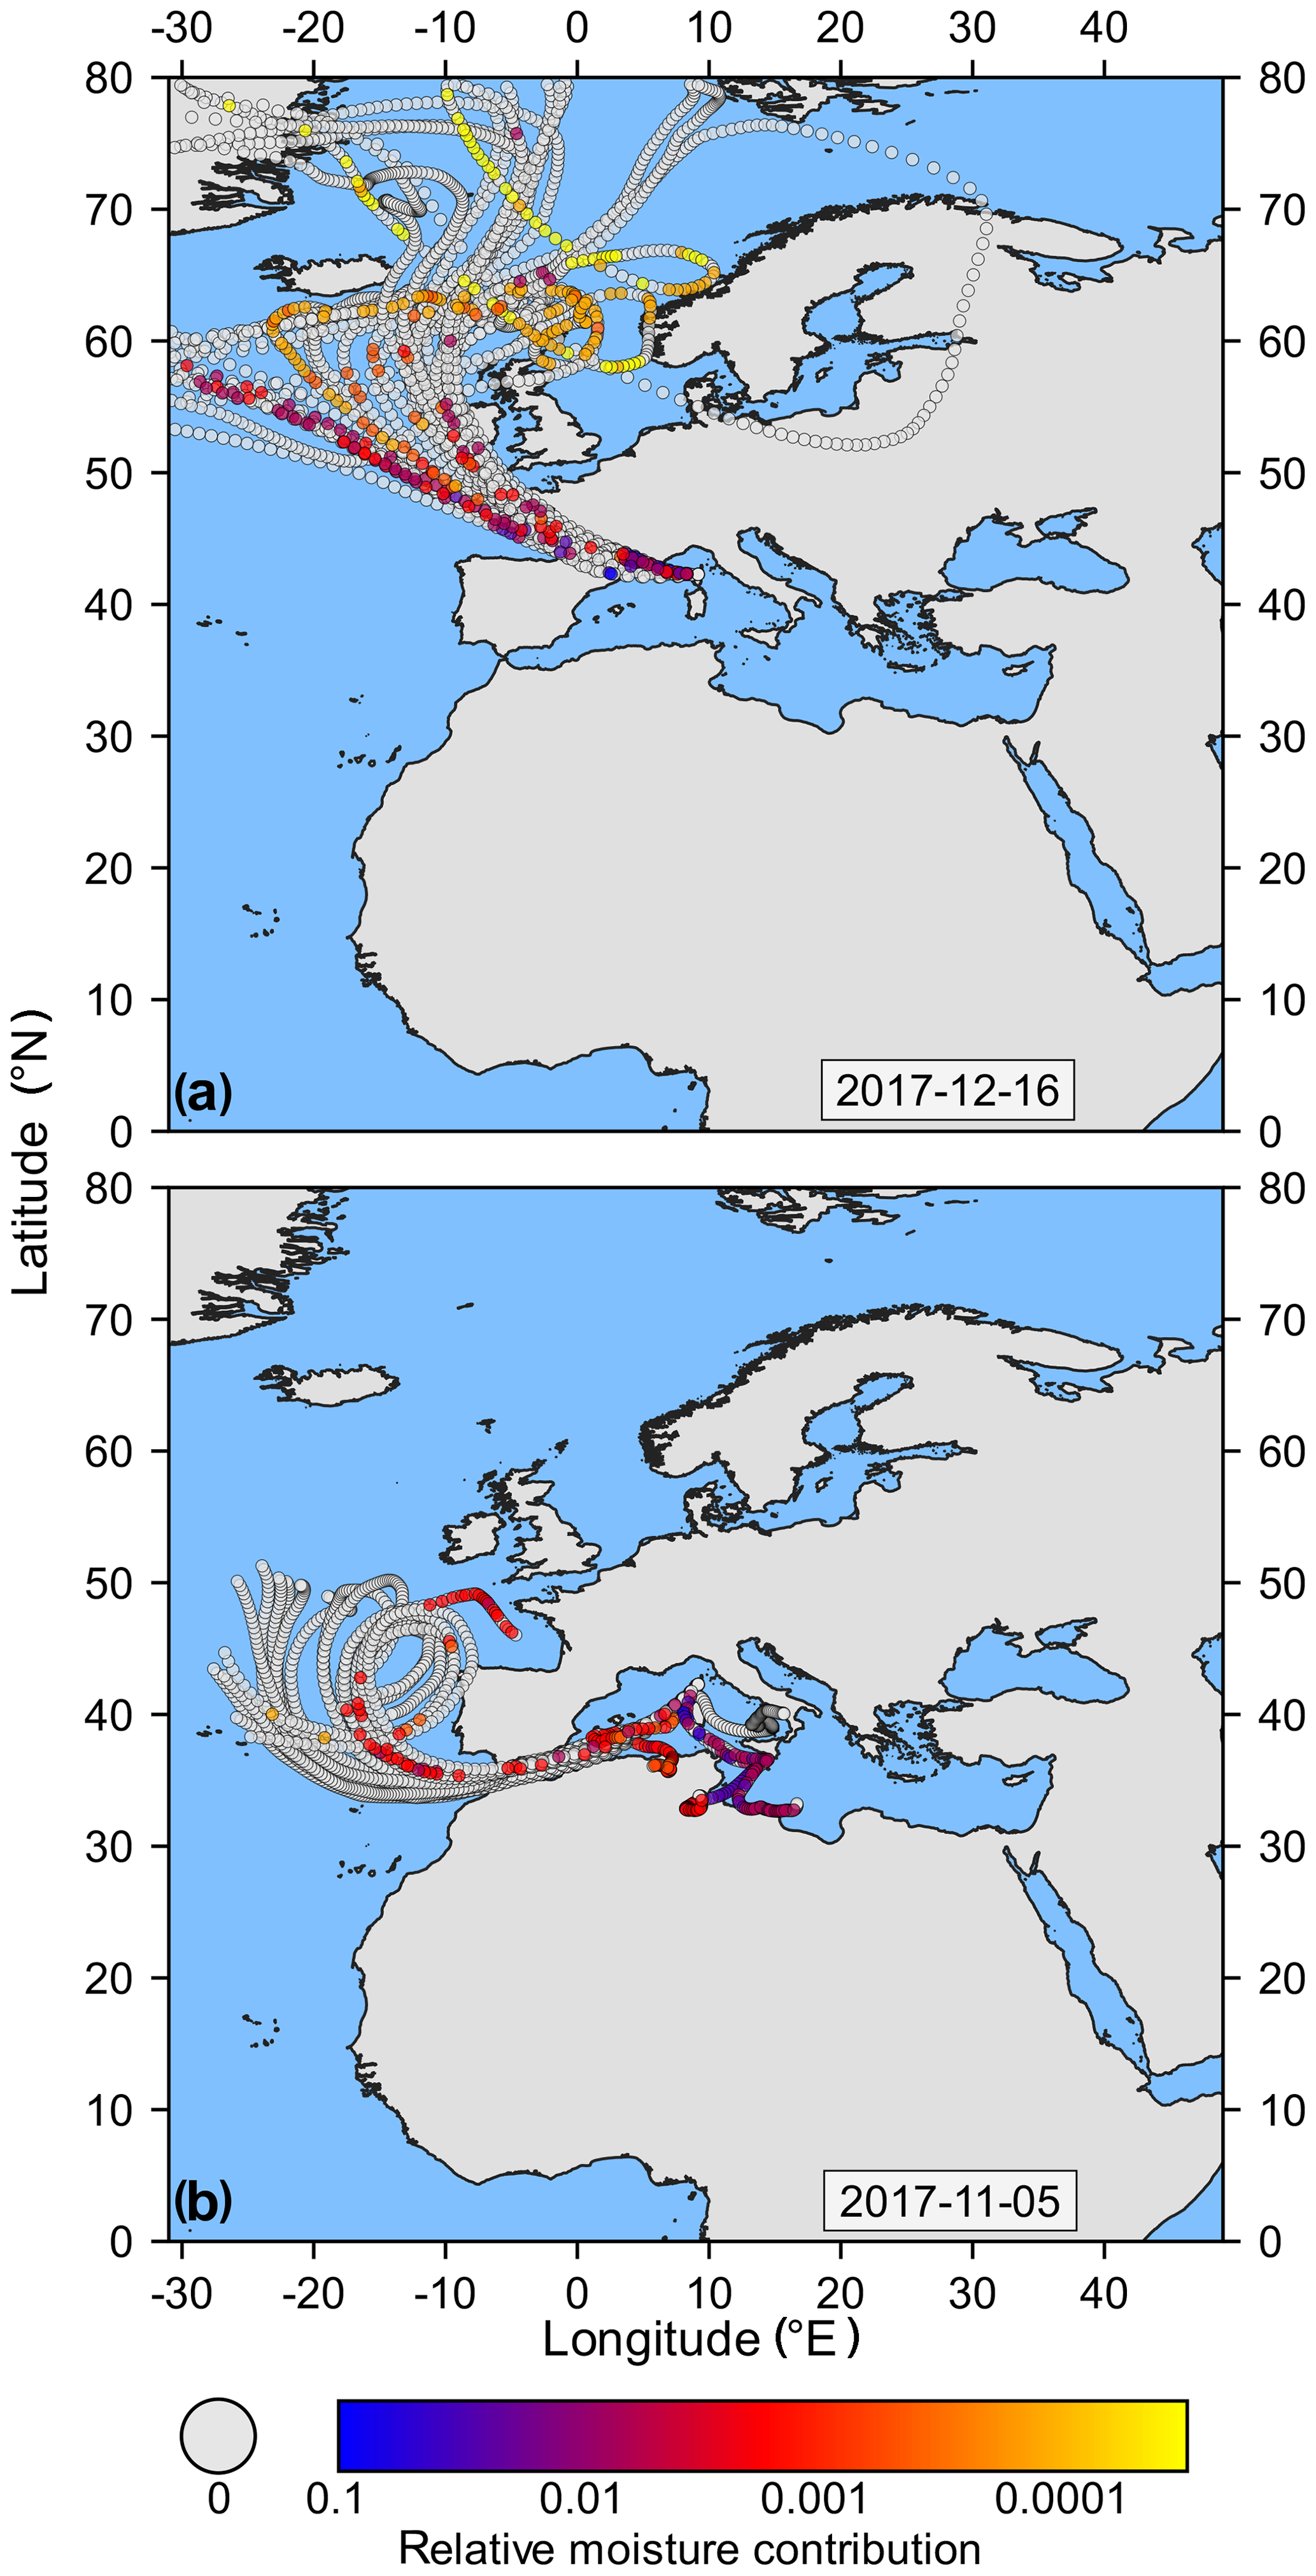
Figure 1Example of HYSPLIT backward trajectories for two events: 16 December 2017 (a) and 5 November 2017 (b). The relative amount of moisture uptake of the air mass during their movement to the final location is color coded and sums to one. For more details to the air mass movement, the reader is referred to the text.
The transport of water vapor in the western Mediterranean is mainly controlled by atmospheric weather systems, which cause a strong seasonality in its occurrence and origin. During the boreal winter season, Corsica is generally affected by the large-scale circulation patterns related to the Northern Atlantic Oscillation (NAO) as well as the Arctic Oscillation (AO) and the accompanying dominant westerly wind regimes (Dünkeloh and Jacobeit, 2003). Particularly the windward side of the island, i.e., the western slopes, experiences air masses that originate over the Atlantic Ocean, whereas the eastern slopes are mostly on the leeward side. Thus, precipitation mainly occurs from September until April when extratropical cyclones pass the island. The atmospheric forcings change in the summer season to weak synoptic conditions. This enables the development of local breeze-systems in the diurnal cycle, e.g., sea-slope breezes, which induce modifications in the vapor transport along altitudinal gradients towards the inland of Corsica (Burlando et al., 2008). The result is the formation of rather local precipitation events in the highlands. In coastal areas, the descending branch of the local circulation cell from the slope breezes tends to suppress convective activities and induce dry conditions – this generally occurs from May until August.
For tritium analyses, 1 L samples of precipitation were collected for 42 events. This number is a subset of all of precipitation events and is expected to be representative of the total rainfall during the study period. In order to achieve this sample volume from small precipitation events, a canvas tarp was laid out for the collection of rooftop water. Samples were transferred from the collector bucket into 1 L bottles directly after the rain event. The sample bottles were then shipped to the Department of Oceanography of the Institute of Environmental Physics (IUP) at the University of Bremen for analyses. Tritium concentrations were analyzed using the 3He-ingrowth method (Clarke et al., 1976). Samples were divided into two aliquots of 500 mL, degassed, and stored in dedicated helium-free glass bulbs for the accumulation of the tritium decay product 3He. After a period of 2–3 months, the 3He content was analyzed by noble gas spectrometry. Details regarding the instrument setup can be found in Sültenfuß et al. (2009). All tritium concentration laboratory results were corrected for radioactive decay back to the time of the precipitation event. Concentration values are reported in tritium units (TU), where 1 TU equals a radioactivity concentration of 0.118 Bq L−1. This analytical setup allows for a precision of ±3 % and a detection limit of 0.02 TU.
In total, 46 samples were analyzed that represent 42 single rain events on different days. The discrepancy between the sample and event count is due to a chronological division of three precipitation events into multiple subsamples in order to identify possible moisture origin changes during longer rain events.
2.1 HYSPLIT trajectory model
The Hybrid Single-Particle Lagrangian Integrated Trajectory model (HYSPLIT) of the National Oceanic and Atmospheric Administration (NOAA) Air Resources Laboratory (Rolph et al., 2017; Stein et al., 2015) was used to identify the origin of air masses at the precipitation sampling site during sampled rain events. With the model's meteorological information, it is possible to identify locations where air masses gained and lost moisture along their travel paths to the study site.
The HYSPLIT model requires input in the form of meteorological grid data. We used the newly available ERA5 grids (Copernicus Climate Change Service (C3S), 2017) from the European Centre for Medium-Range Weather Forecasts. This dataset originally has a horizontal resolution of 31 km on a global scale, a vertical resolution of 37 interpolated pressure levels, and a temporal resolution of 1 h. As input for this HYSPLIT analysis, a data subset was extracted with the following specifications: the horizontal and temporal resolutions were left at 31 km and 1 h; the spatial extent of our model area was clipped to an area of about 40∘ latitudinal and longitudinal distance from our sampling location (0–80∘ N, 31∘ W–49∘ E); the upper 6 pressure levels were omitted, leaving 31 pressure levels from 1000 to 20 hPa; and the model run was cropped in HYSPLIT to an elevation limit of 10000 m a.s.l. HYSPLIT tracks air parcels from a given four-dimensional coordinate (start time, start location, and start altitude) backwards in time. The result is a trajectory of spatial points at hourly time intervals. Additional meteorological parameters, such as specific humidity (SH) are attached to each point. The runtime of the model determines the length of each trajectory.
The location that served as input corresponds to the coordinates of our sampling site (see above). To track the specific air mass that results in cloud formation at the sampling site, the model input for elevation should ideally correspond to the cloud altitude at the sampling site. The cloud altitude at the sampling site was not measured; therefore, we performed 12 model runs for elevations from 0 to 6000 m above ground level in 500 m steps. To cover the time period of a rain event, we started the model on each full hour during a rain event. The runtime was set to 10 d backward from the time of the precipitation event. Trajectories that leave the spatial domain specified by the meteorological input data (see above) were truncated, as the accuracy of trajectories after long distances and especially on long timescales (> 10 d) were assumed to be too low to allow for satisfactory interpretation. Thus, an example rain event with a 4 h duration results in 48 trajectories (four start times with 12 start elevations) with 240 hourly spaced points each, assuming that they stay within the model boundaries. In order to test for the influence of the trajectory backward runtime on the comparison with tritium concentrations, we repeated the moisture source calculation for shorter durations of 3, 5, and 7 d. For consistency, all figures display the maximum 10 d trajectory results. Differences between different trajectory runtimes (if significant) are discussed in the text where appropriate.
2.2 Moisture source identification
In order to identify moisture sources for the sampled rain events, meteorological parameters from the calculated HYSPLIT trajectories were applied. The basic idea is that changes in specific humidity, which is one of the output parameters of the HYSPLIT model run, show locations where the air parcel took up or released moisture from/to its surroundings. This general concept has already been widely used with some small modifications to the calculation procedure (Juhlke et al., 2019; Pfahl and Wernli, 2008, 2009; Sodemann et al., 2008).
In this study, we used the approach of Visser et al. (2018) with minor adjustments to locate source areas of moisture uptake for the sampled rain events. For each point of all trajectories, three numerical values (weights) are calculated, and the product of those three weights represents the relative moisture contribution of that time and point to the precipitation event moisture. The first weight wr is used to determine which hours of the precipitation event have more influence on the rain sample composition. Therefore, all points of all trajectories that start at the same hour receive the same weight wr. It is calculated as the proportion of the precipitation rate at the trajectory start hour to the total precipitation amount of the corresponding event. The second weight wz is used to disentangle the contribution of the different trajectory start altitudes to the event. All points of a single trajectory receive the same weight wz. The assumption is that the difference in water content between the last two points of a trajectory leading up to its termination at the sampling site is representative of this trajectory altitude's relative moisture contribution. The first step to construct wz is calculating the difference in specific humidity (SH) between the last and second to last trajectory points. If this difference is positive (increase in humidity during the last step), it is set to zero. Then this decrease in moisture is divided by the sum of the SH decrease during the last hour of all trajectories with the same start time, which equals wz. The third weight wincr reflects the water uptake along a trajectory, resulting in different values for each trajectory point. The calculation procedure for this weight uses a stepwise summation of SH differences from the oldest to newest point of a trajectory. Thus, an increase in the SH from one trajectory point to the next denotes moisture uptake and is assigned to this trajectory point. A decrease in the SH between two points corresponds to a loss from the present total amount of moisture. Therefore, the weights of all of the previous contributing trajectory points (moisture sources) are proportionally reduced, because the lost moisture is assumed to represent the well-mixed pool of previous moisture sources. At the end of this stepwise calculation procedure, all weights are divided by the SH value of the final trajectory point in order to give the proportional contribution. Thus, the sum of these final wincr values along one trajectory sum to one. The combined weight ws after which moisture sources are evaluated is calculated by the multiplication of the three previous weights wr, wz, and wincr for each trajectory point. All values of ws for a single precipitation event sum to one; therefore, each one denotes the fraction of moisture that originates from a single trajectory point. For a more detailed explanation of these calculation procedures, including figures and equations, we refer to the Methods section of Visser et al. (2018).
Two examples of trajectories calculated for a precipitation event are shown in Fig. 1. Example (a) from mid-December 2017 shows an air mass origin from the North Atlantic and Polar regions, with the main moisture uptake above the northeastern Atlantic Ocean and the northeastern Mediterranean Sea. Example (b) from the beginning of November 2017 shows air masses that took a different route, via the Strait of Gibraltar, and other air masses that arrive from the southern Mediterranean. Here, the main moisture source is the southern and western Mediterranean Sea.
2.3 Tritium in moisture source regions
In order to investigate the tritium content of air masses with different origins, trajectory points were assigned to one of five different geographical regions (Fig. 2). These five regions were delineated based on an expected similarity in tritium values stemming from the currently known tritium formation and distribution processes. This region classification was verified by the annual tritium average of GNIP stations (Fig. 2). Western Europe shows lower values than more eastern, continental regions. Further, the assumption of low values in marine moisture makes it plausible to delineate the Atlantic Ocean and the Mediterranean Sea from land masses. Africa was singled out as a rare, continental source area of moisture for the trajectories investigated. This is plausible because the predominant wind directions during the investigation are expected to be from the west and north (Thiébault and Moatti, 2016).
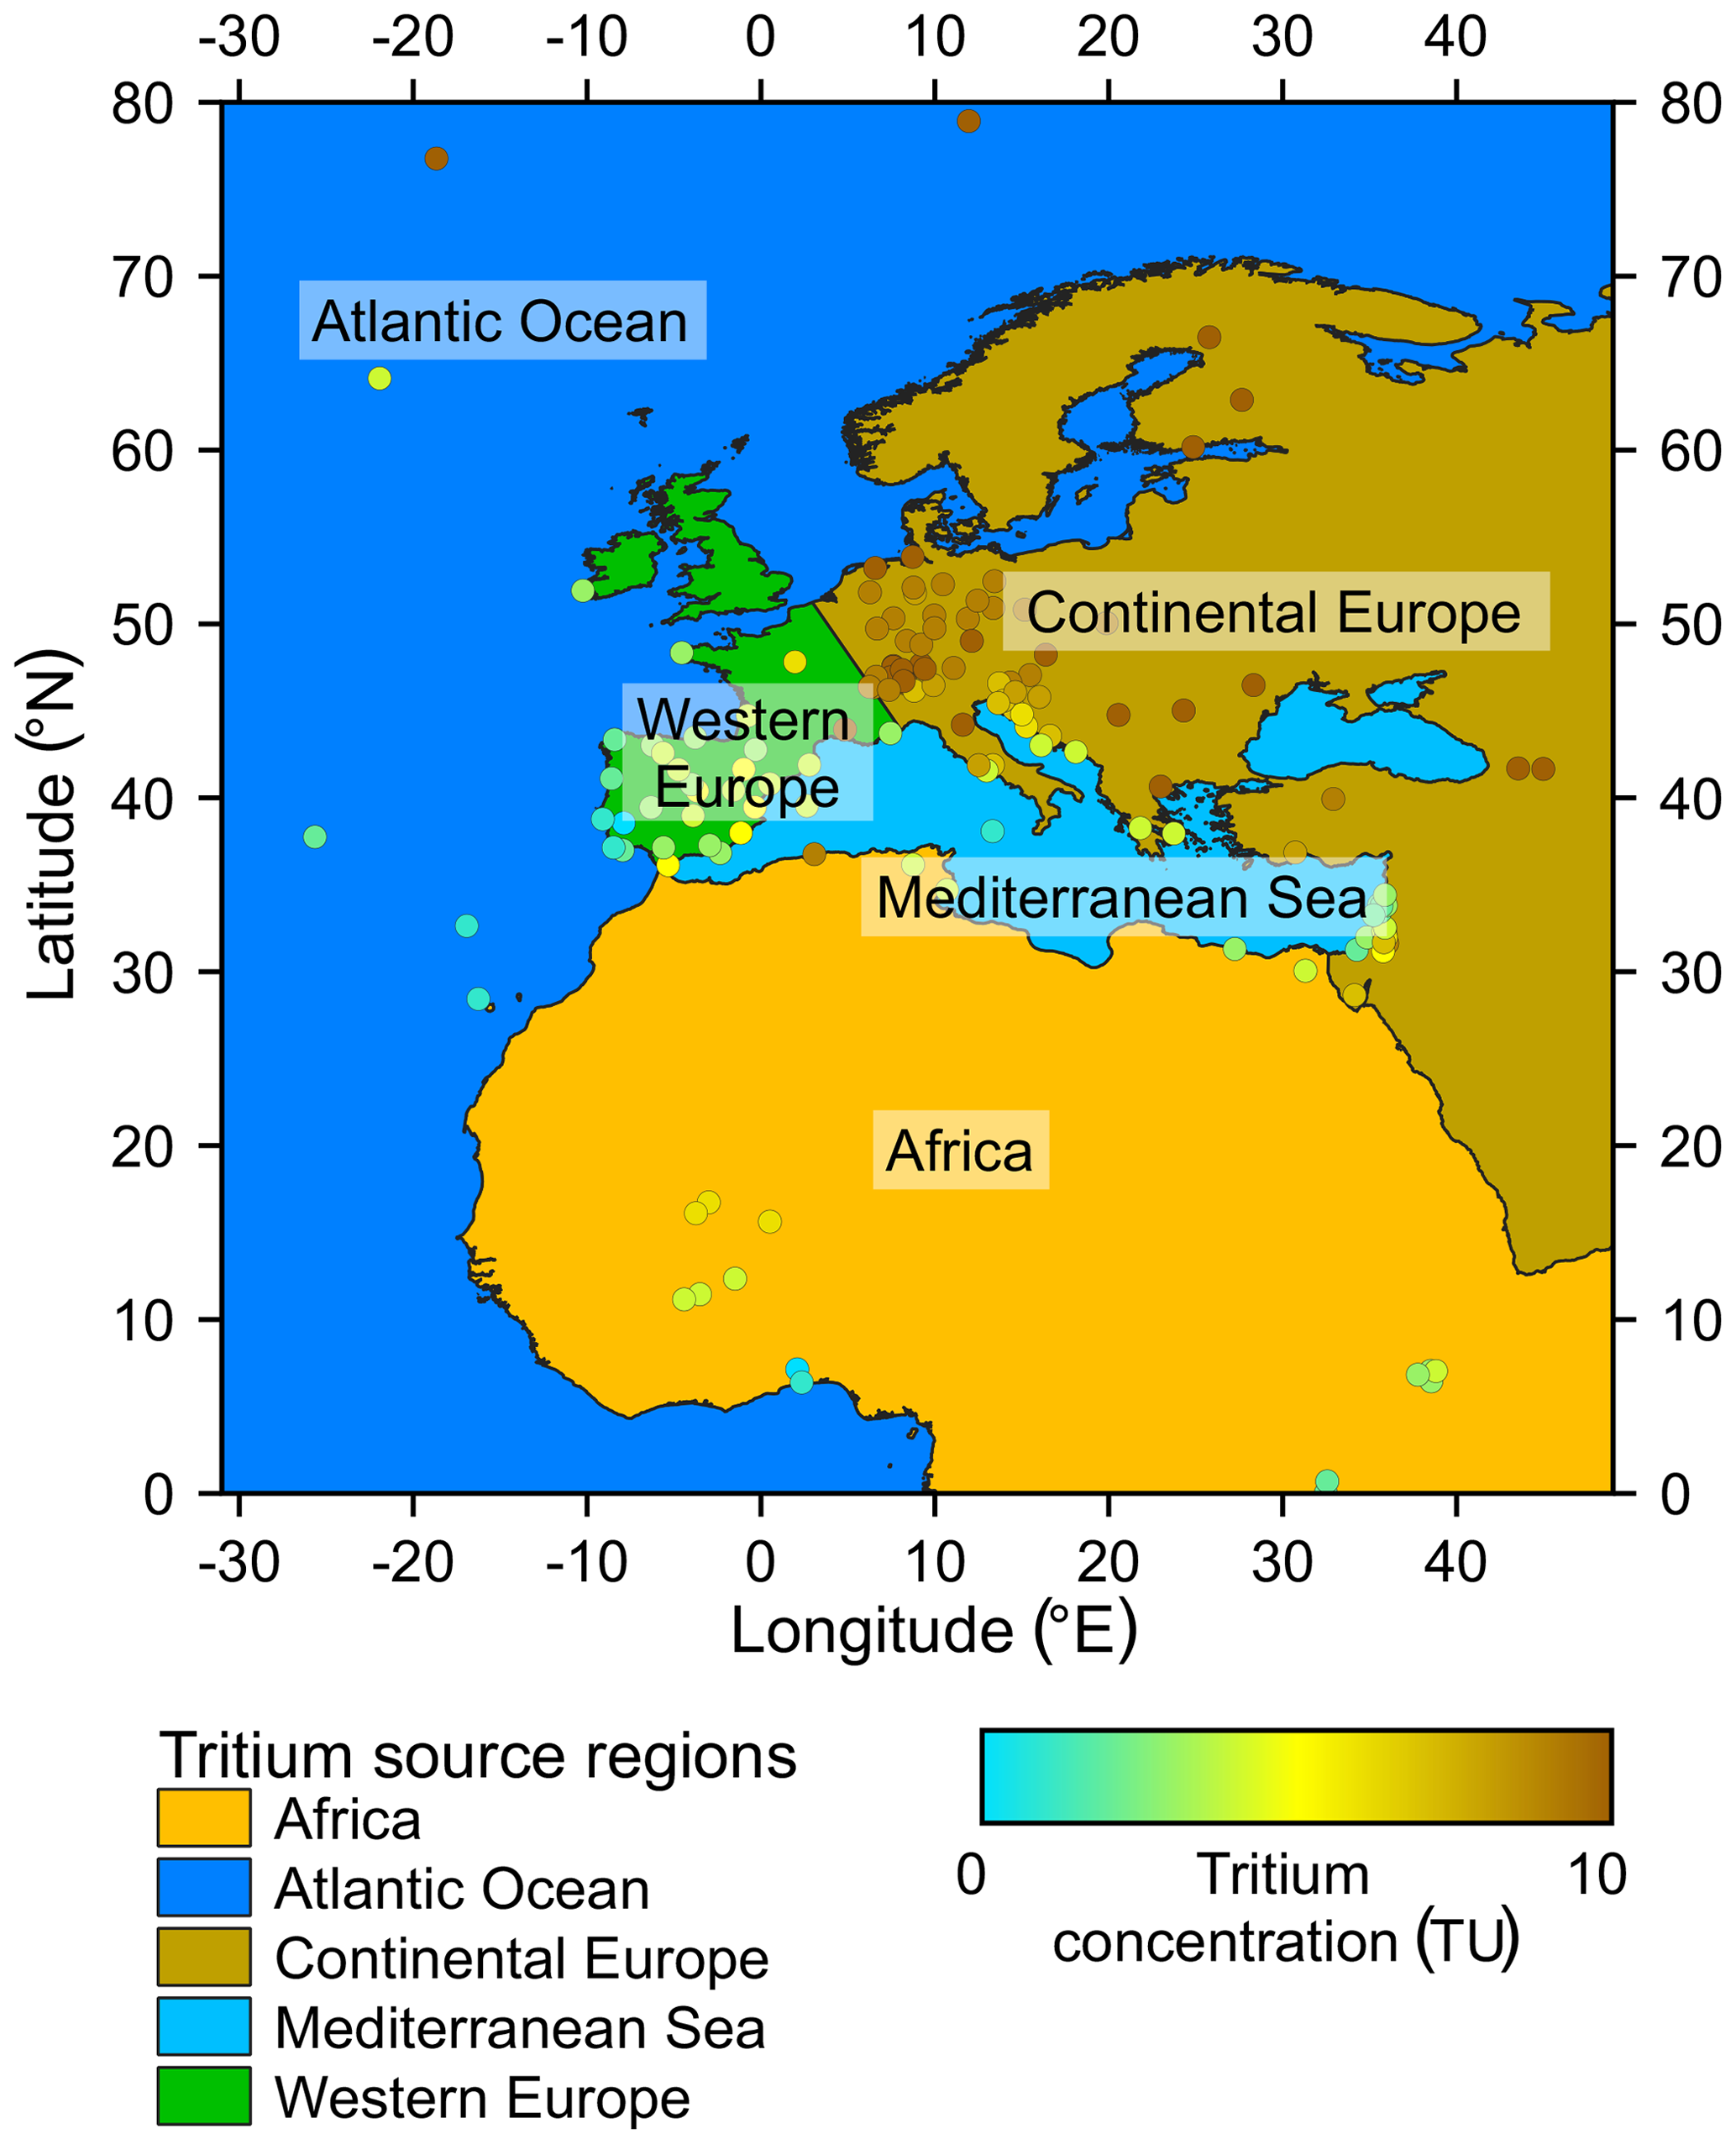
Figure 2Map of the GNIP stations that provide tritium concentration in precipitation and of the derived tritium source regions. GNIP stations are color coded by the mean of the annual averages of the tritium concentration over the period from 2000 to 2016 (the data coverage of individual stations varies). For more details on the differentiation of the five tritium source regions, readers are referred to the text.
In this simplified model of distinct tritium source areas, the final tritium value of a precipitation event was expected to depend on the amount of moisture that originates from a certain moisture region. This leads to the equation of a linear mixing model:
where TUevent is the tritium concentration of the rain event, TUn is the tritium concentration of one of the five source regions, and ws n is the relative moisture contribution of the source regions to the precipitation event. The tritium concentration of 46 precipitation events was measured, and the relative moisture contribution of the five source areas was calculated from the trajectory analyses. For further calculations, it was assumed that TUn values of the source areas were constant over time and were greater than zero. Potential seasonal trends in tritium values will be discussed later. This leads to 46 equations with five unknowns each. The solution to this overdetermined system of equations can be approximated using a least squares approach, in which the sum of all squared deviations of the predicted to measured values is minimized.
Results of the laboratory analyses of event water samples can be found in Table 1 and are also archived in the World Data Center PANGAEA1. Tritium values range between 1.62 and 10.07 TU with a mean value of 4.52 TU. A seasonal distribution with a spring to early summer maximum can be observed.
Table 1Precipitation amount and tritium concentration values for all of the measured precipitation event samples. The letters following the tritium concentration refer to the discussion of outlier values in Sect. 4.3.

The relative contribution of moisture to the 46 precipitation samples that originated from the five tritium source regions was calculated following Eq. (1) and is displayed in Fig. 3. The average moisture contribution of each region is shown in Table 2. Most of the moisture at the sampling site (around 60 %) has its origin in the Mediterranean Sea. Western Europe and the Atlantic Ocean are the other two major contributors with around a 10 %–15 % moisture contribution, respectively. Continental Europe and Africa show only minor contributions with values from 10 % (mean) to 0 % (median). Relative contributions for some of these regions are not normally distributed, which results in the deviation of the mean from median values. This is especially the case for the African and continental European regions, where the dataset is skewed because they do not contribute any moisture for most events. The mean and median moisture contribution of the constructed tritium source regions does not vary considerably with the chosen trajectory backward runtimes (Table 2) of 3, 5, 7, and 10 d.
Table 2Results for the relative moisture contribution and the estimation of tritium in source regions (as defined in Fig. 2) as calculated by Eq. (1) for different trajectory backward runtimes.

* For negative values, see results and discussion.
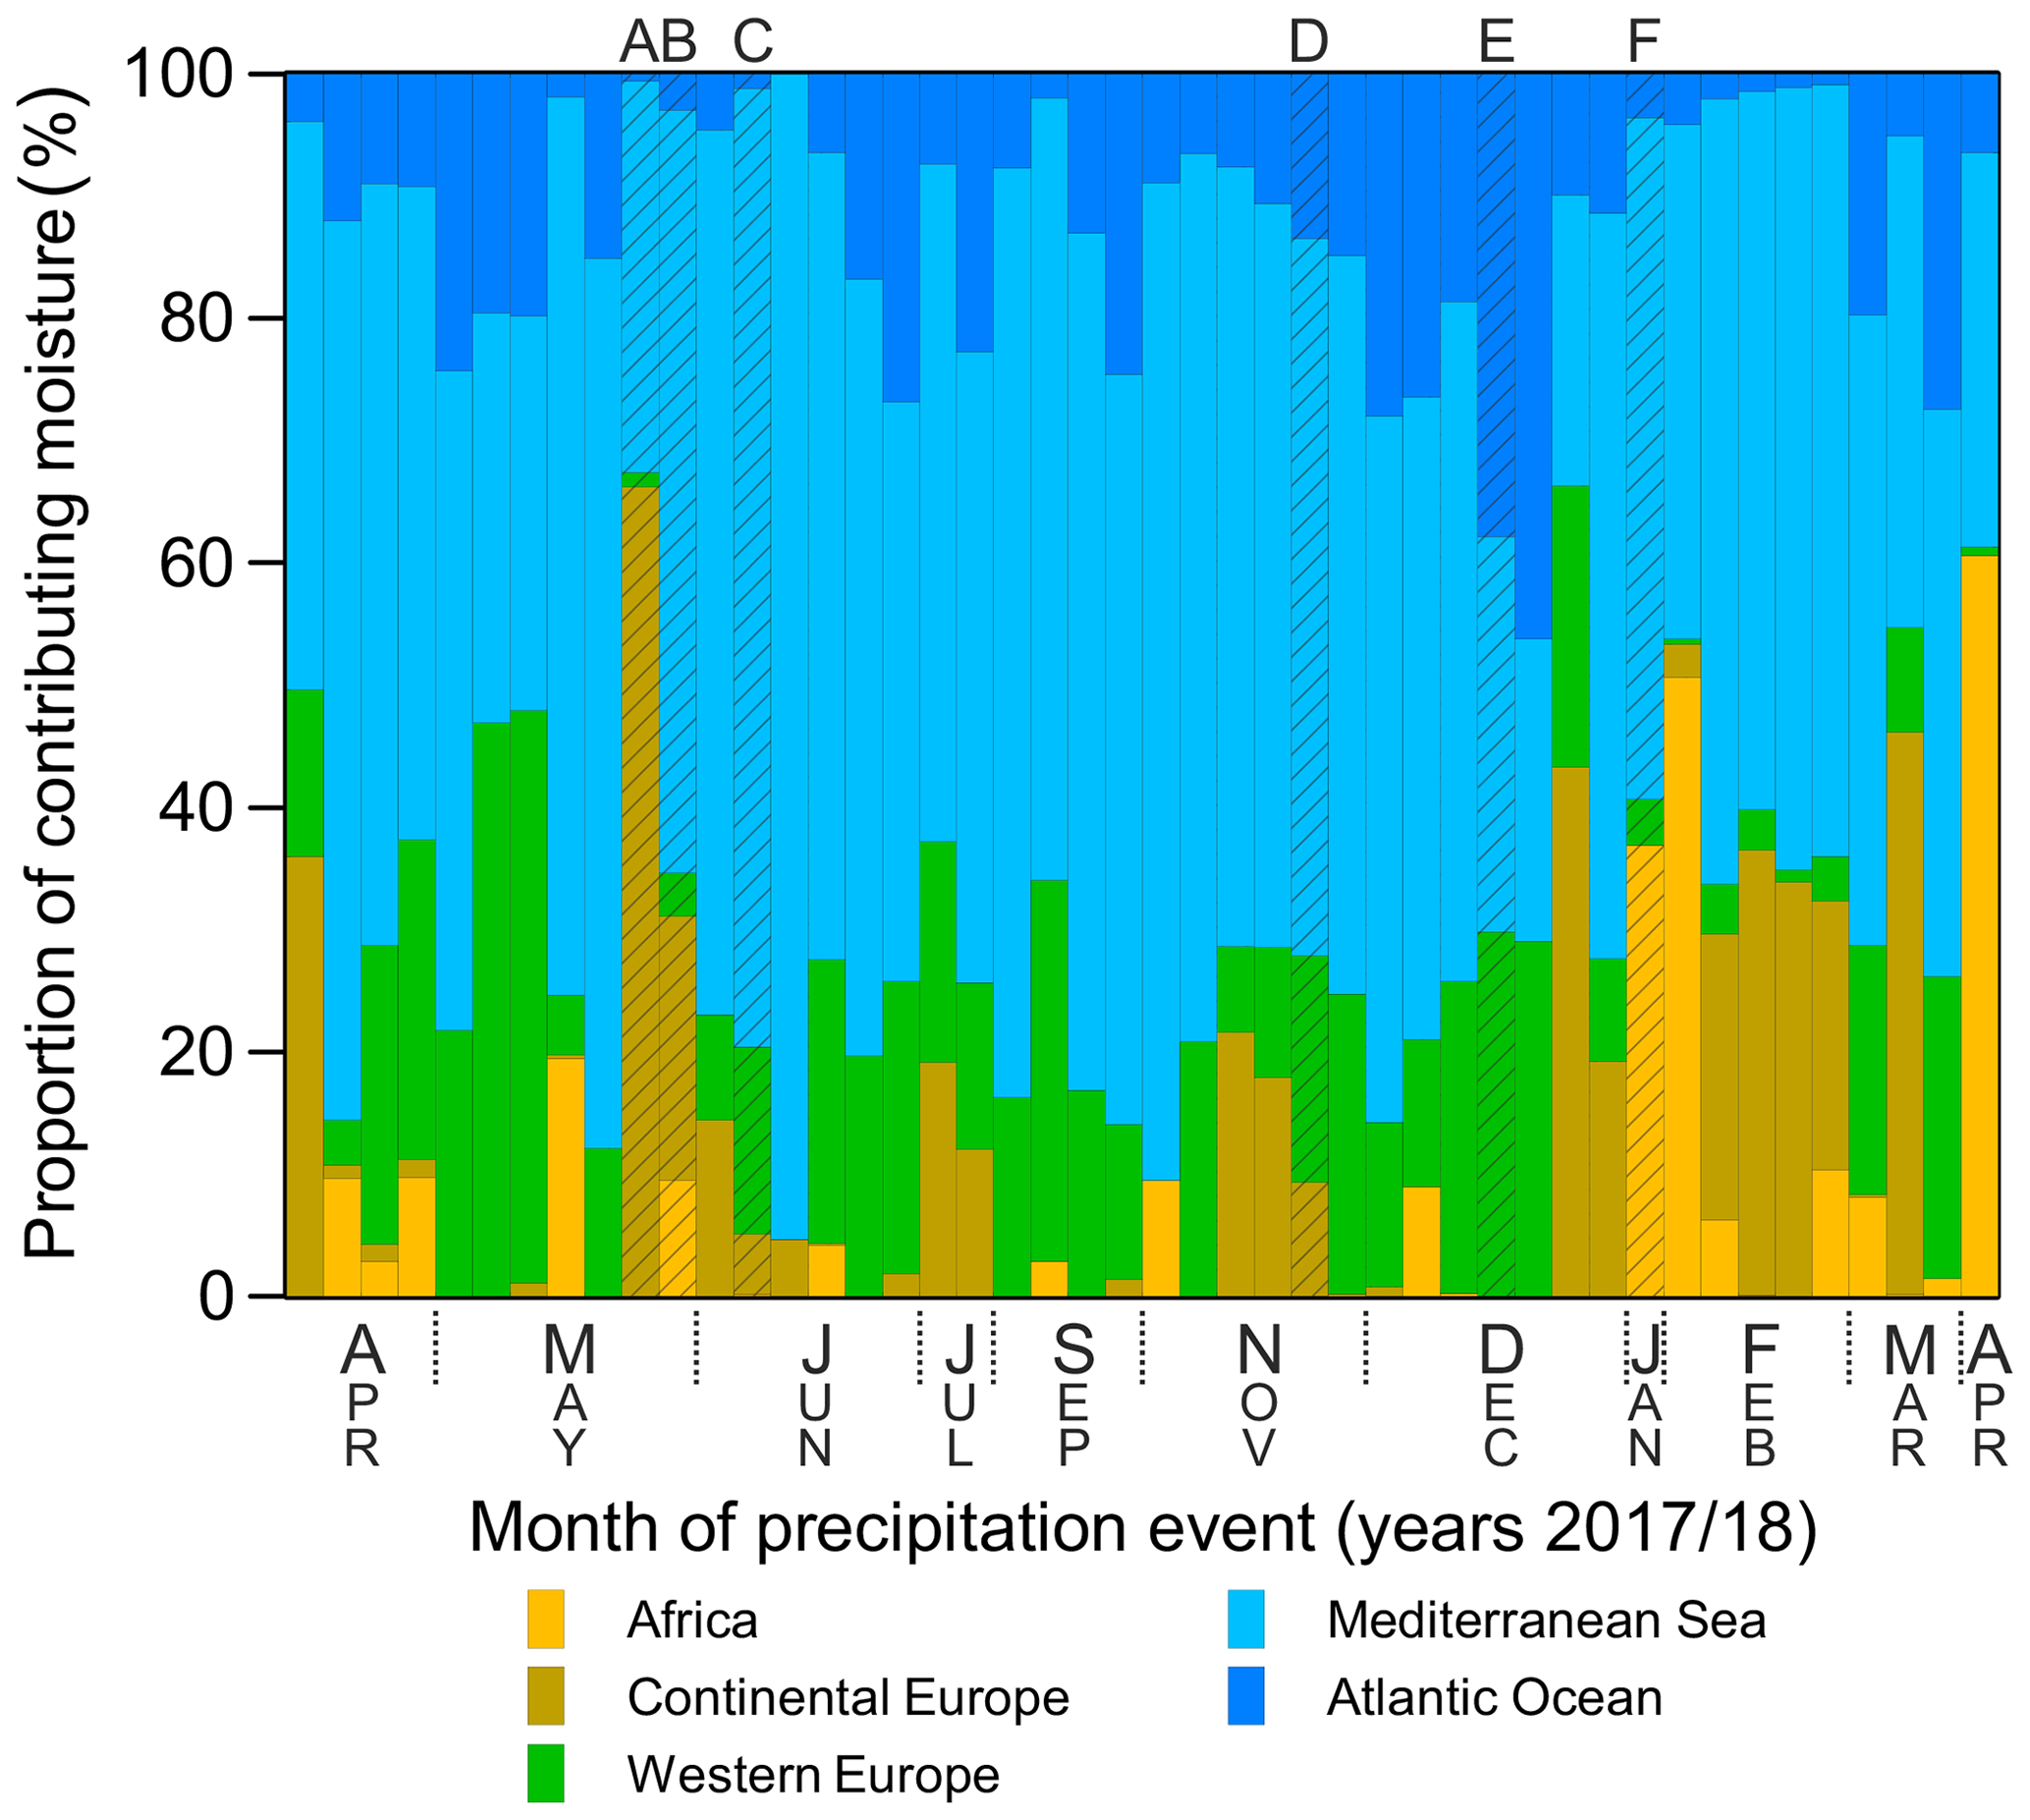
Figure 3Relative moisture contribution of each tritium source region to individual precipitation events (depicted as vertical bars) based on 10 d trajectories. Events are listed in chronological order, with their month on the x axis. The letters on top of the graph correspond to outlier events as detailed in Fig. 7 and in the discussion.
The results of the tritium model in source regions (Table 2) calculated using Eq. (1) show the highest tritium concentrations in continental Europe with around 8.8 TU followed by western Europe with 7.3 TU. The negative value for the Atlantic Ocean is a result of the computation algorithm and indicates that a general trend towards minor tritium concentrations is the best fit to the measurements. Dismissing the negative values of the modeled tritium concentration for the Atlantic Ocean, the range of tritium values introduced by different trajectory runtimes is mostly less than 1 TU. For western Europe, the 10 d trajectories show a notably higher tritium concentration of 7.3 TU.
4.1 Basic trends in tritium concentrations
The measured tritium values in precipitation at Corte are well within the range of observed tritium variances measured by European GNIP stations. A Shapiro–Wilk test reveals that the tritium concentrations of precipitation events are normally distributed (p=0.0053), and a Q–Q plot shows a higher occurrence of high-concentration outliers. These four events with the highest tritium concentration will be discussed later. The mean tritium value of 4.52 TU measured at Corte over the sampling period compares well to the annual averages of GNIP stations in western Europe and on the shores of the Mediterranean Sea (Fig. 2), such as the nearby stations in Girona (4.55 TU), Palma de Mallorca (4.62 TU), Monaco (3.76 TU), and Ninfa (4.69 TU). These observations indicate that measurements of tritium in precipitation over the course of 1 year produce a distribution of concentration data that statistically represent averaged values for spatial comparison.
Concerning seasonality, one can usually expect a spring to early summer maximum of tritium concentrations in precipitation due to increased moisture exchange from the stratosphere to the troposphere (“tropopause leak”; Martell, 1959; Storebø, 1960). The observed seasonal distribution of tritium concentrations roughly follows this trend (Fig. 4). While the highest values were found from April to June, the remainder of the year exhibited depleted tritium concentrations. Outlier events, such as in November, do not fit the general concept. However, they rarely occurred and only contributed small rain amounts. They will be discussed separately in Sect. 4.3.
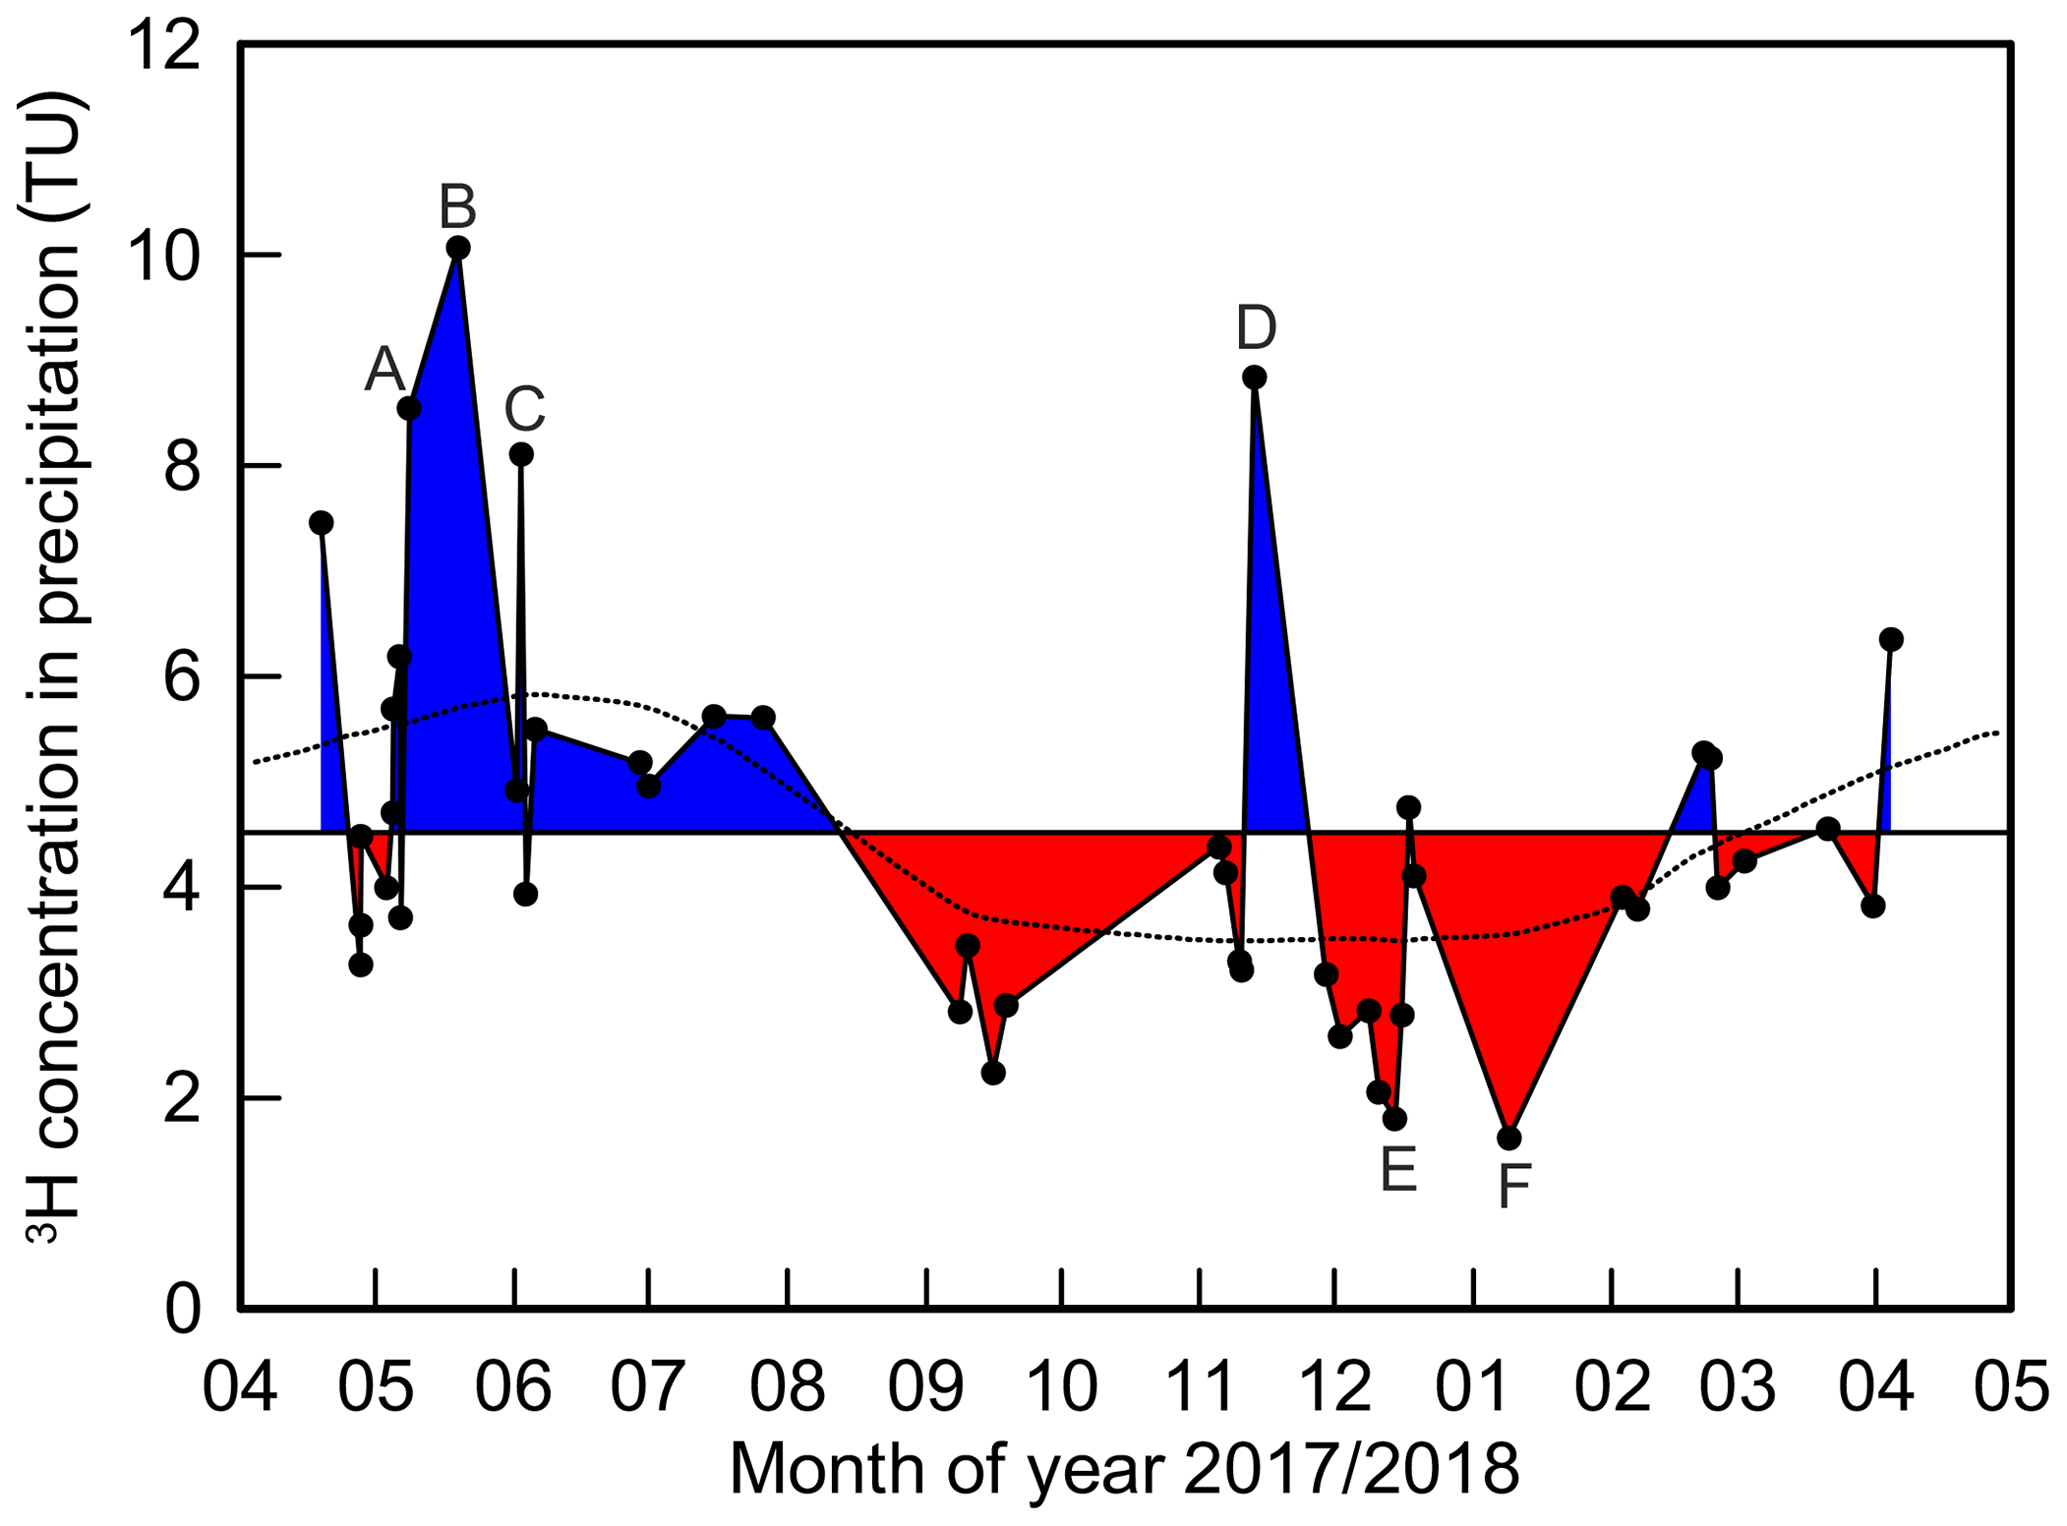
Figure 4Time series of the measured tritium concentration of precipitation events. The horizontal line is the mean of all measured tritium concentrations. Blue areas are above and red areas are below the mean concentration. The dotted line is a LOESS regression of the measured values.
4.2 Comparison of tritium and trajectory-derived parameters
The contribution of moisture from the five defined source regions (Fig. 3) confirms some of the initial hypotheses about atmospheric dynamics that probably influence tritium concentrations. The surrounding Mediterranean Sea is the main moisture contributor for the station at Corte. Moisture from western Europe contributes less than the Mediterranean Sea. Nonetheless, its contribution is more frequent than that from continental Europe, as a result of the prevailing pressure systems that induce western winds. The Atlantic Ocean plays a subordinate role. This is most probably due to the long travel path of air to the measurement site and rainout on land barriers, such as western Europe. The continental regions of Africa and continental Europe hardly contribute moisture due to their low moisture capacity when compared with open water bodies. In contrast to tritium concentrations, an obvious seasonal change in moisture sources could not be detected. Such variances were difficult to reveal, because our results rely on calculations of air trajectories of individual events.
In order to advance the knowledge of the tritium distribution, tritium event concentrations are compared to different parameters derived from trajectory calculations in the following paragraphs.
The classification of the working area into five tritium source regions was made by considering the theoretical processes that are thought to shape the tritium distribution in the atmosphere, as detailed in Sect. 1. Thus, oceanic environments were expected to exhibit very low tritium values in water vapor due to equilibration with ocean water. Over the continental regions of the study area, namely continental Europe and Africa, the stratospheric source of tritium was expected to lead to an increase in tritium concentrations due to less moisture convection and equilibration with other water compartments, such as oceanic moisture. A comparison of the relative moisture contribution of these five source regions with the tritium concentration at the measurement site shows low correlations. While linear regressions of the moisture contribution against the tritium units (TU) of Africa, the Mediterranean Sea, and western Europe exhibit coefficients of determination (r2) of less than 0.06, the Atlantic Ocean shows a negative correlation with an r2 of 0.11–0.15, depending on the trajectory runtime. This is in line with the expectation of lower tritium values in precipitation if substantial parts of the precipitated water originated from evaporated, low tritium ocean water. Moisture contribution from continental Europe shows a slight positive correlation with the tritium concentration (). These two regions seem to have the most distinctive influence on precipitation at the measurement site when they contribute moisture to traversing air masses.
The least squares regression of the water contribution and tritium measurements from Eq. (1) produces estimates of the tritium concentration in these source regions (Table 2). The general trend of expected values is well represented with high values for continental Europe, where the dilution of elevated, stratospheric tritium concentrations with oceanic moisture is inhibited (“continental effect”; Weiss et al., 1979). The calculated value of 7.8–8.8 TU is within the range of most GNIP stations in central Europe. Western Europe shows values of 4.2–7.3 TU, whereas the upper value of 7.3 TU was only found for calculations from 10 d trajectories. This concentration is more than expected from GNIP station values in this region. As western Europe is positioned between the Atlantic and the Mediterranean, it was expected to be more influenced by oceanic moisture and, thus, should have lower tritium concentrations, as shown by trajectory runtimes from 3 to 7 d (Table 2). This is also reflected by the precipitation of the corresponding GNIP stations. One explanation for some higher tritium values in moisture in this region could be the anthropogenic influences of tritium-enriched water vapor as a result of nuclear power plant releases. However, these spatially restricted events were not expected to influence the water vapor of multiple precipitation events after transport of several hundred kilometers. Further discussion on the influence of nuclear facilities can be found at the end of Sect. 4.3.1. The modeled range of values for Africa of 4.6–5.5 TU fits well with the observed tritium concentrations in precipitation of the sparsely distributed north African GNIP stations (Fig. 2). Due to the “latitude effect”, in which lower latitudes are accompanied by lower tritium concentrations, an even smaller amount of tritium was expected to be typical for precipitation from Africa. One possible scenario for a tritium content as high as 5.5 TU could be the low water vapor content in the dry desert air. As the downward winds above the Sahara Desert only contain minimal amounts of water vapor, even minor contributions of stratospheric tritium could significantly increase the tritium concentration in air moisture. However, as Africa only contributes very small absolute amounts of moisture to the measured precipitation, its relatively high tritium value should not be overrated. Model estimates for contributions from the Atlantic Ocean produce a maximum concentration of 1.4 TU (for 5 d trajectories) but also negative tritium concentrations. This shows the tendency of the model to assign amounts of tritium that are as small as possible to the oceanic origin and, therefore, serves as an indicator of minor tritium contributions. Surface water of the open North Atlantic Ocean is expected to have recent tritium values of around 0.5–1.5 TU (Oms, 2018), where the natural background concentration should be between 0.2 TU (pre-bomb concentration; Dreisigacker and Roether, 1978) and 1 TU (Begemann and Libby, 1957). This is due to the increased vertical exchange of moisture over the ocean, where stratospheric moisture with a high tritium content is diluted by oceanic water vapor. Our model results match these expected low concentrations of tritium in the resulting precipitation of water vapor of oceanic origin. The dilution of anthropogenic and natural inputs result in a tritium concentration of < 2 TU for Mediterranean Sea surface water (Ayache et al., 2015; Roether et al., 2013). Therefore, the modeled values of 4.1–4.5 TU for the Mediterranean region are higher than expected from our initial theoretical considerations. This is probably a consequence of this model's calculation procedure where the Mediterranean as the region with the highest moisture contribution (around 60 % on average, Table 2) receives values close to the average of all tritium measurements of 4.5 TU.
In summary, the above shows that the assumed tritium concentration tendencies of certain areas are reasonably well represented when calculated from single precipitation events. This is especially the case for areas contributing distinct tritium signals.
To assess the accuracy of the chosen model representation, the modeled tritium values of the source regions can be used to calculate estimates of the measured tritium concentration at Corte (Fig. 5). The trend through the estimate–measurement comparison deviates from the 1:1 line with a slope of only 0.21–0.27, depending on the trajectory runtime. This shows that this simple five-region model can only reproduce around a quarter of the variability of real tritium measurements. One limitation of the calculations of the regionalized tritium model is the assumption that tritium values for selected regions of origin remain constant over time. This is not expected to be the case, due to the seasonality of the tropopause leak that controls the input of tritium from the stratosphere.
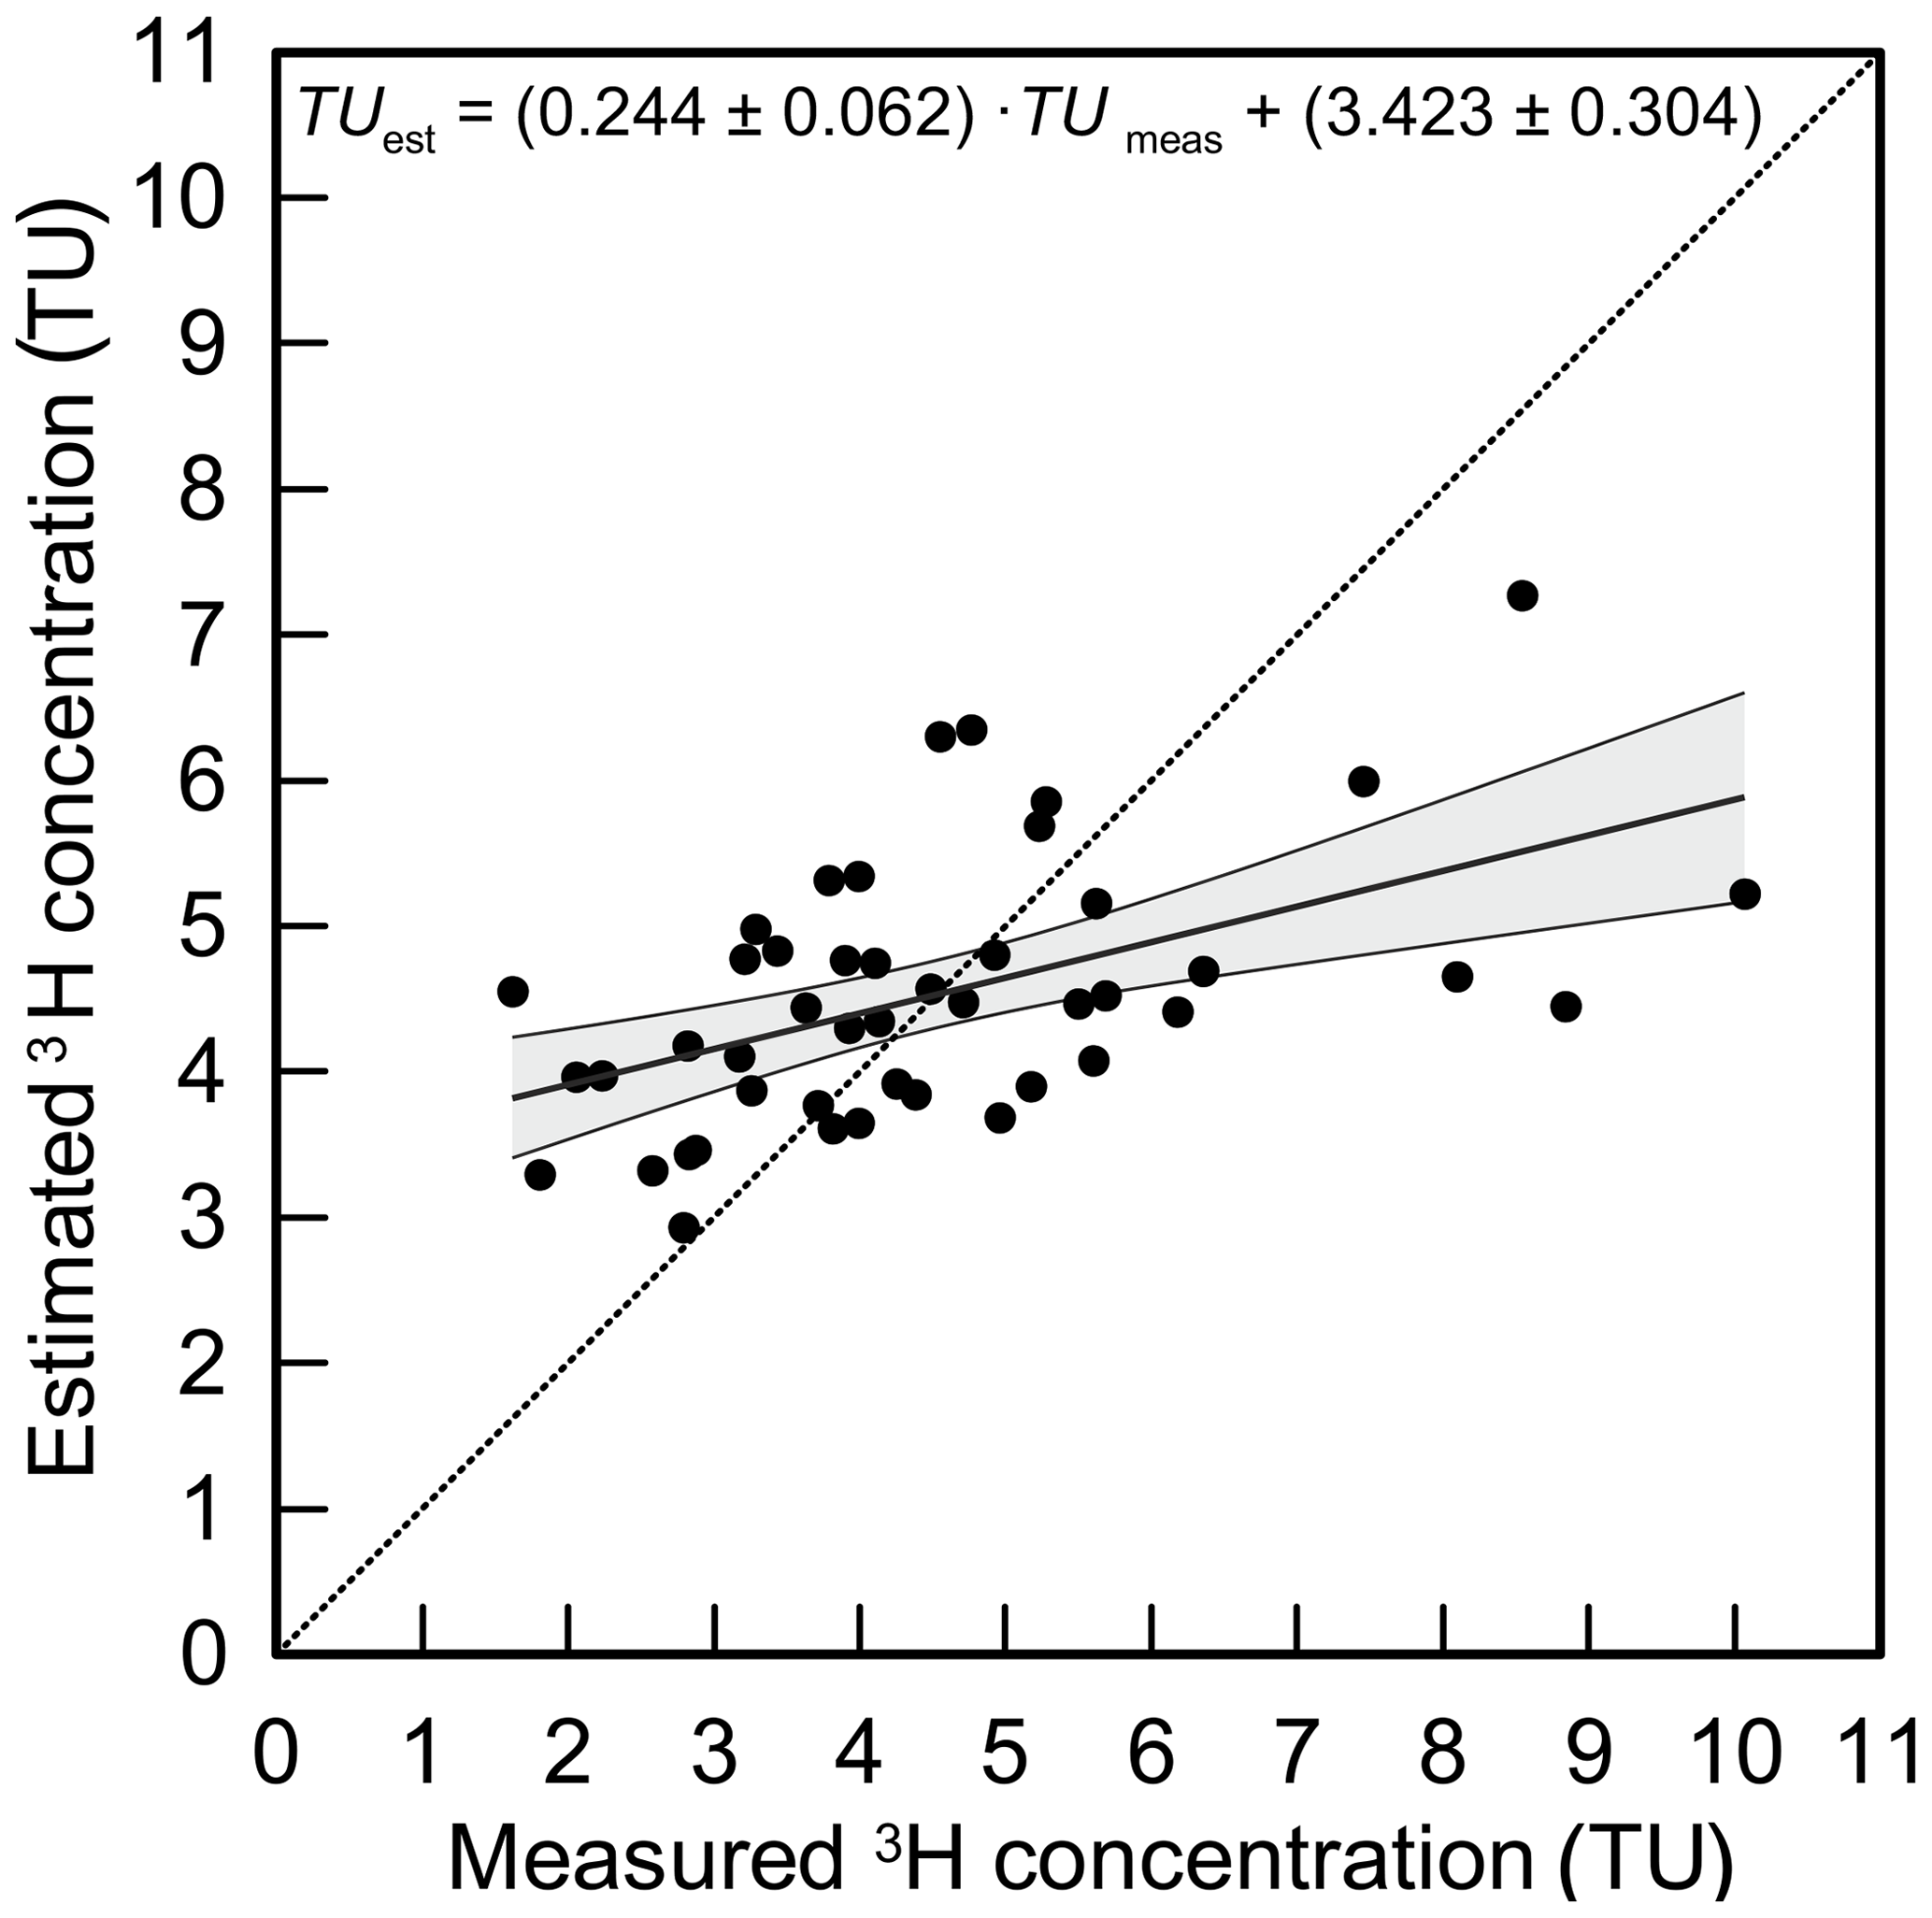
Figure 5Comparison between the calculated tritium concentrations after Eq. (1) and the measured tritium concentrations based on 10 d trajectories. The dotted line is the 1:1 line; the solid line is the linear regression through the data points with the gray band showing the 95 % confidence interval.
Compared with the long residence time of tritium in the stratosphere of several years, tritium is removed from the troposphere through rainout in a much shorter time (Cauquoin et al., 2016). In order to assess the dynamics of this tropospheric tritium removal, the altitude evolution of trajectories had to be summarized. For each measured precipitation event a moisture-contribution-weighted median altitude was calculated and compared to the measured tritium concentration (Fig. 6). The median is expected to be a more robust representation of a central tendency compared with the mean, because the altitude exhibits a non-normal distribution and frequent outliers. The altitude values of trajectory points were weighted by their moisture contribution values (ws) in order to better represent the average altitude of the moisture origin. The quality of the fit between these altitude values and their corresponding tritium concentrations (Table 3) was expected to yield information about the dependency of tritium values on the air mass altitude history.
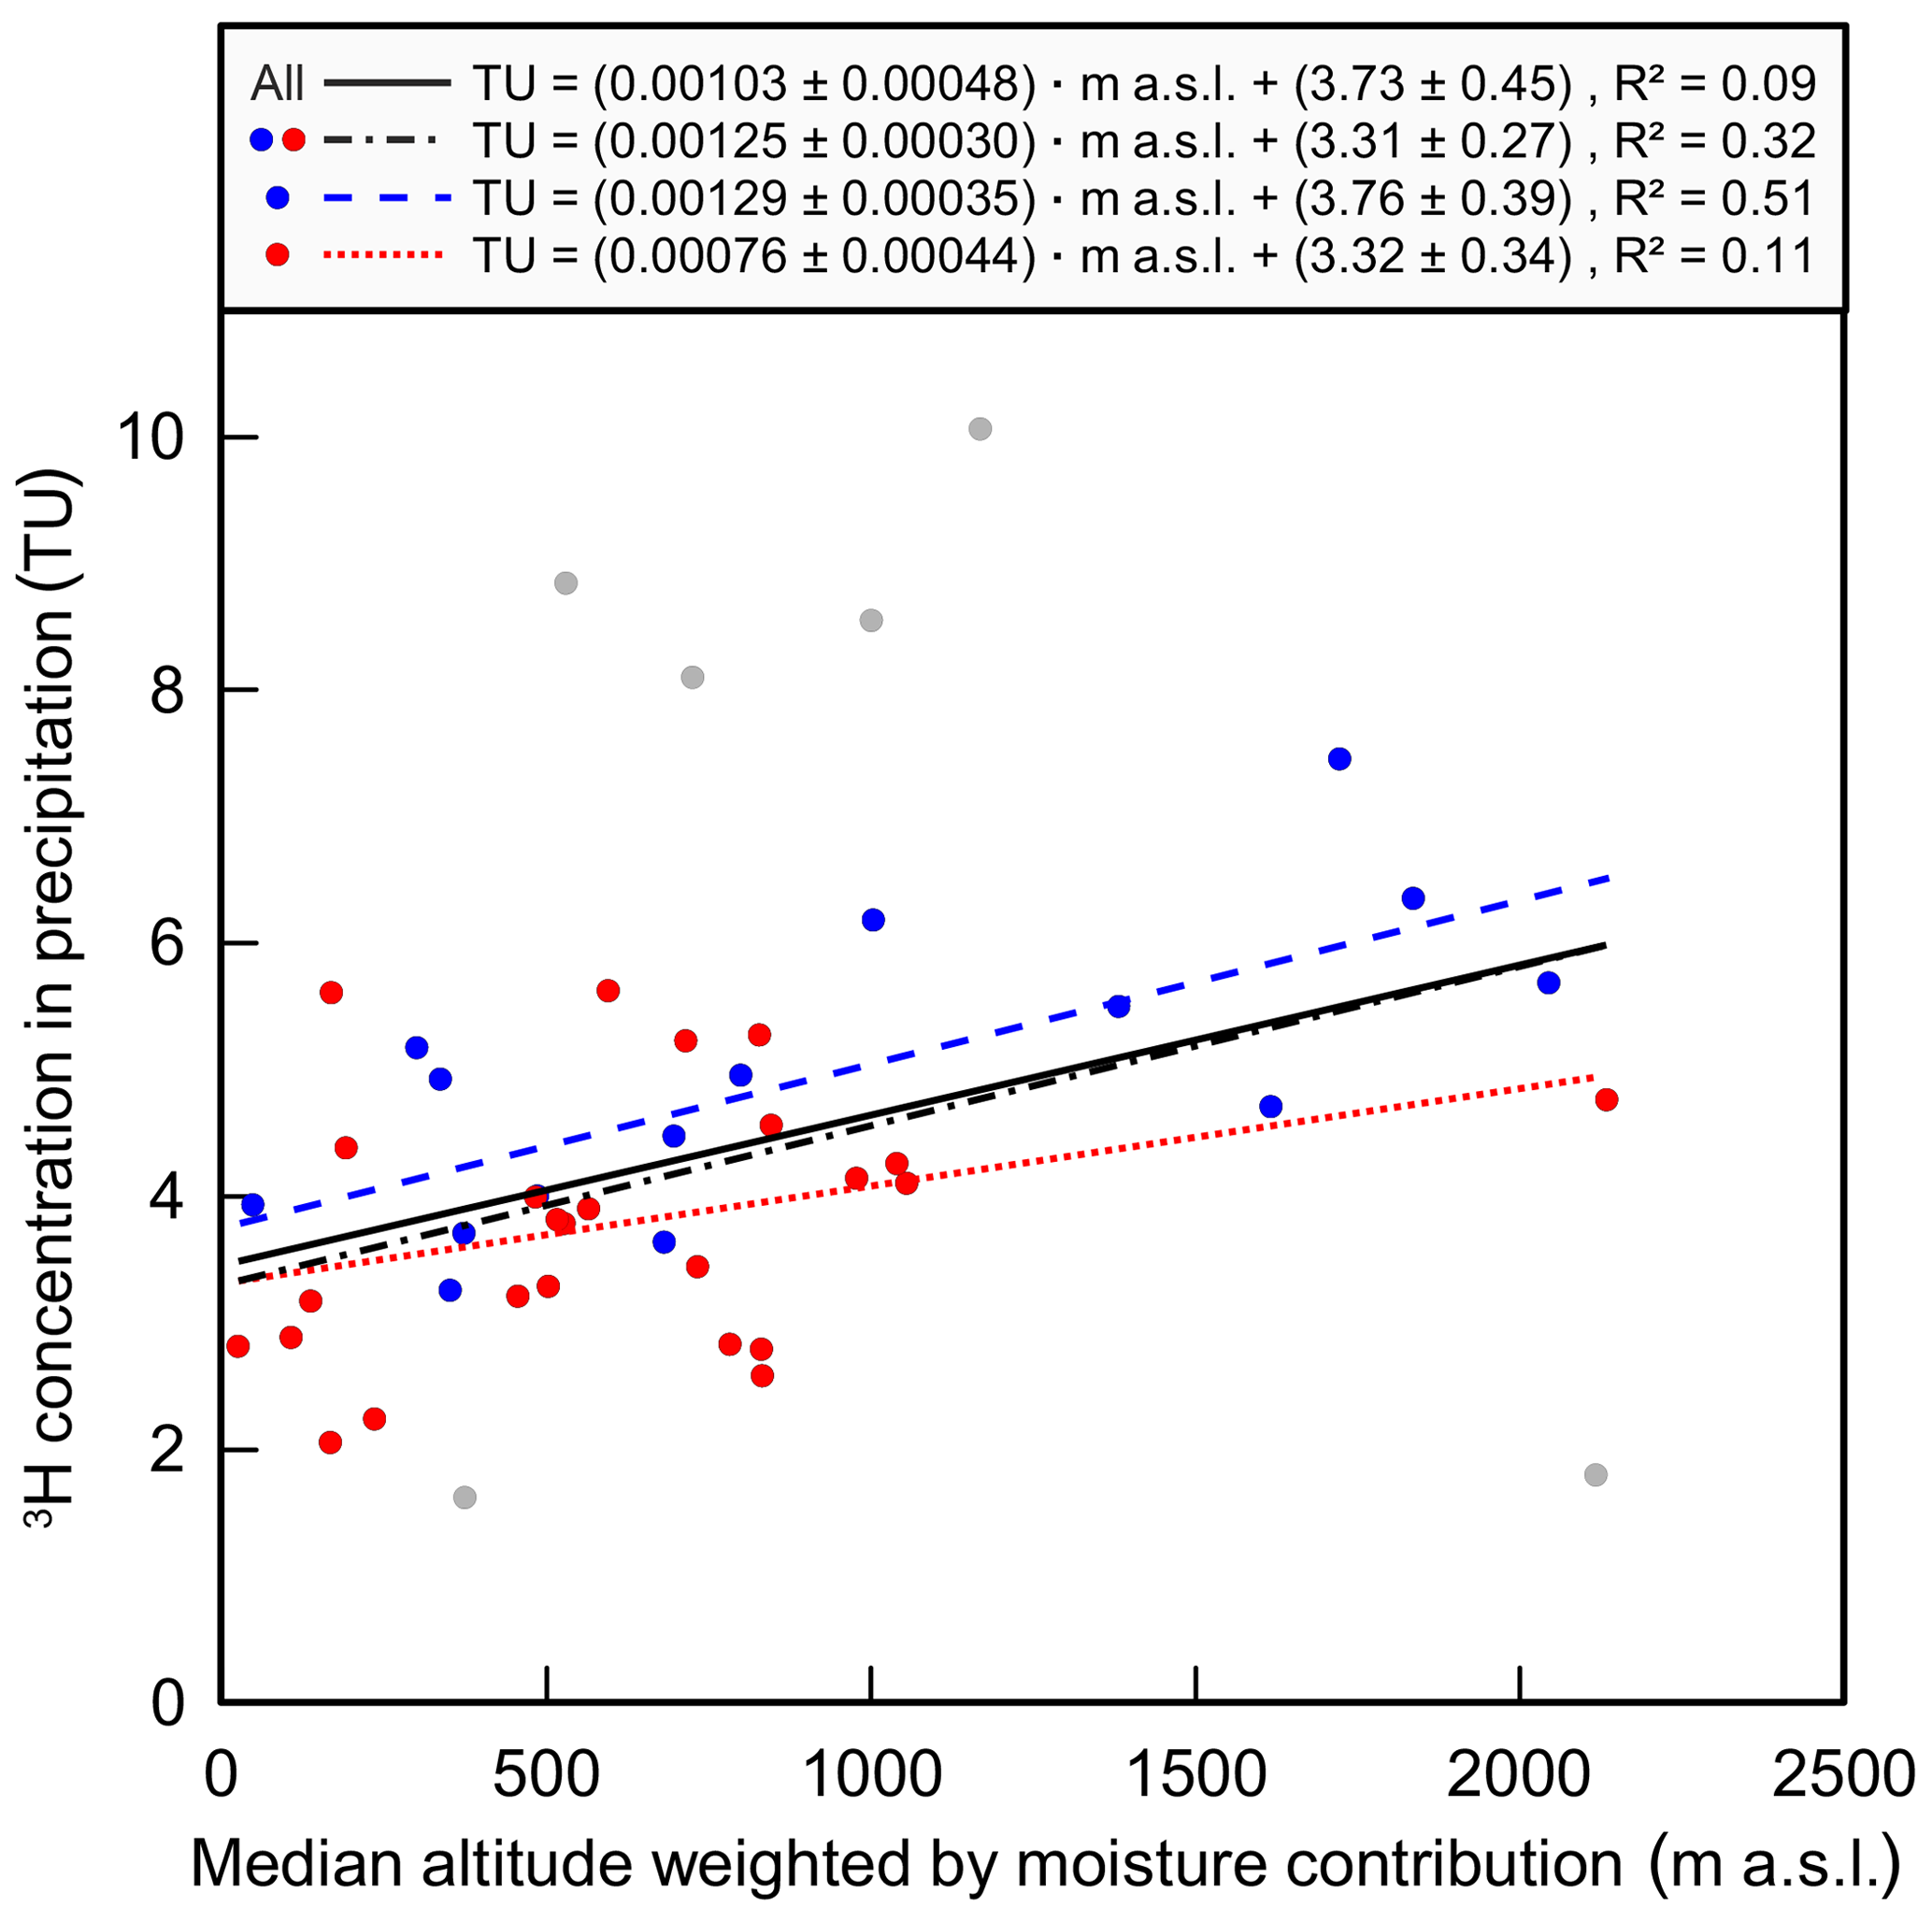
Figure 6The tritium concentration of precipitation events plotted against the median of all event-trajectory points weighted by their moisture contribution based on 10 d trajectories. The solid line shows a regression through all data points. The dot-dashed line is the regression through colored data points only, which excludes outliers above 8 TU and below 2 TU. The dashed line is the regression through the blue data points that correspond to events from April to June. The dotted line is the regression through red points from the rest of the year.
Table 3Coefficients of determination for the correlation of the measured tritium concentration against the moisture-source-weighted median altitude (Fig. 6) for different trajectory runtimes.
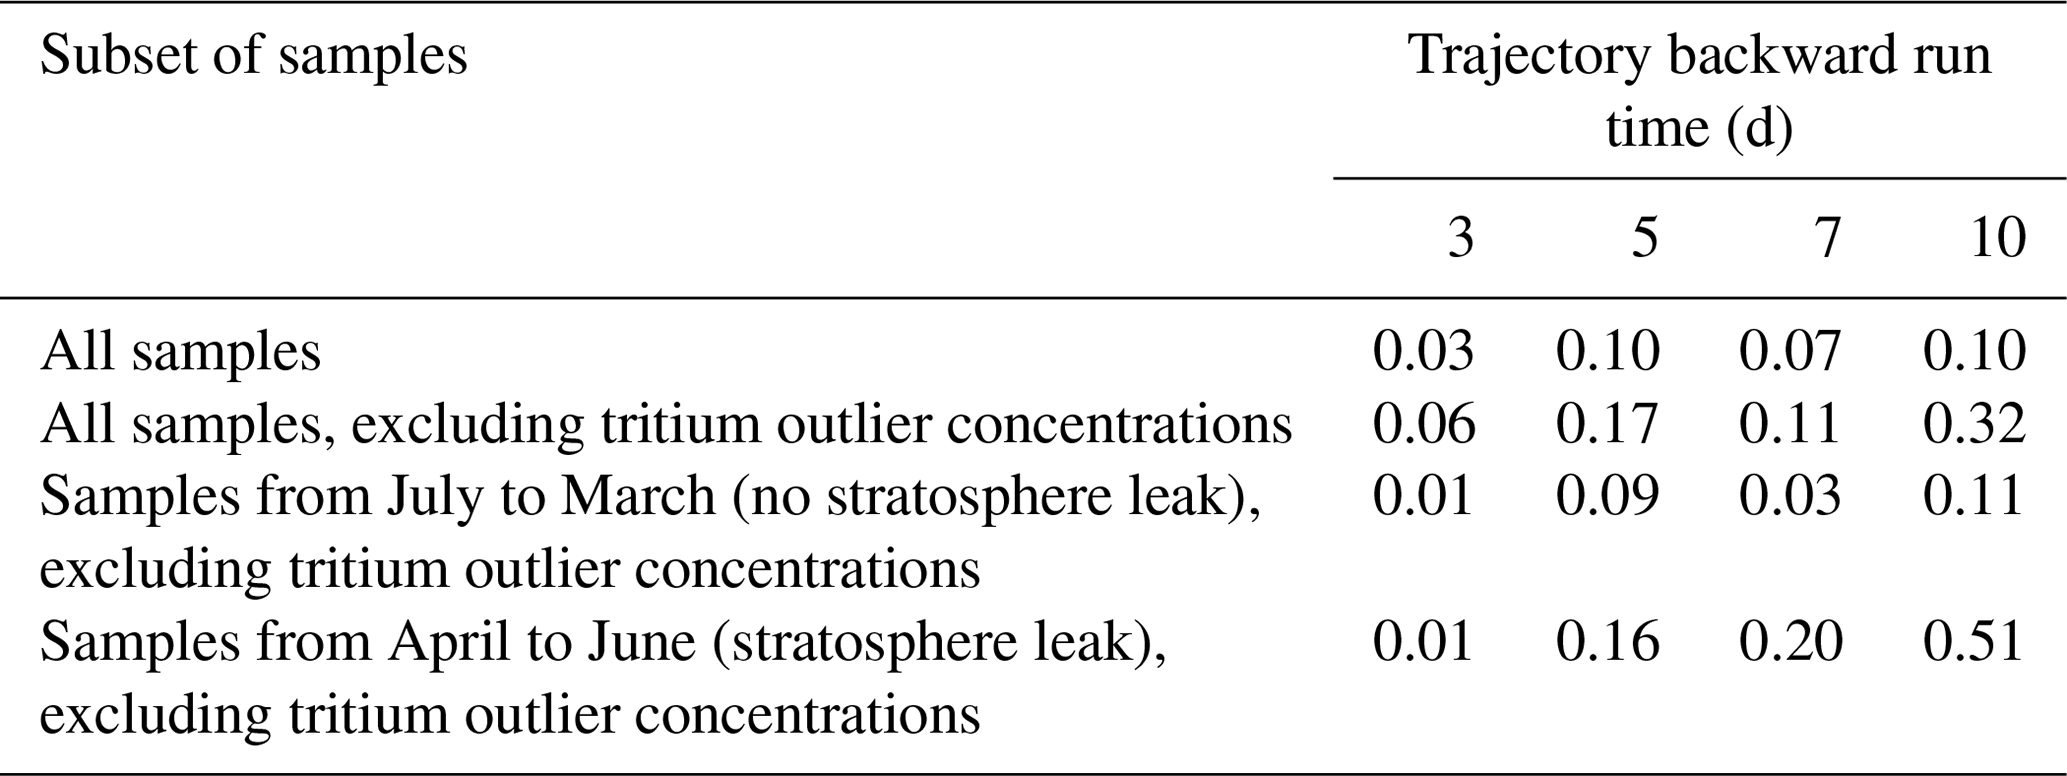
The above comparison shows a positive correlation of the altitude of the moisture origin and the tritium concentration for the complete set of measurements, although with a low r2 value of 0.03–0.10 (Fig. 6, solid line). If selected extreme outlier values above 8 TU and below 2 TU are excluded, the r2 increases to between 0.06 and 0.32 (dot-dashed line). In this study less than 15 % of events are described as outliers, and they do not seem to have a strong influence on the slope and intercept of the regression (Fig. 6), which remain almost the same. Additionally, a seasonal difference in the altitude dependence could be observed. Tritium measurements during the tropopause leak period from April to June exhibited a stronger correlation with trajectory altitude (). During the rest of the year, the slope of the tritium–altitude correlation was smaller and the r2 was only between 0.01 and 0.11. These observations are in line with measured vertical profiles, where tritium concentrations in tropospheric water vapor generally increased with altitude, especially during spring and summer (Ehhalt, 1971; Bradley and Stout, 1970). Interestingly, the coefficients of determination improved considerably with trajectory runtime (Table 3). This could suggest that longer trajectory runtimes might better represent the tritium contribution to a precipitation event. Initially, the reverse behavior would be expected, due to increased uncertainty and the higher variability of integrated altitude signals of longer trajectories. As the moisture contribution percentages of the tritium source regions and their calculated tritium values do not really change with different trajectory runtimes (Table 2), tritium concentrations are apparently at least partly uncoupled from moisture uptake.
Overall, the correlation with altitude is better than with any of the other regressors (source regions) discussed above. This general trend seems to imply that high-altitude, high-tritium moisture influences precipitation events, but tracking these processes with back-trajectory models proves to be challenging. However, the events of extreme tritium concentrations that deviate from the trend hint at further influences that also have to be taken into account.
In short, the moisture source altitude dependence of tritium concentrations in precipitation is observed to be strongest during times when the vertical input from the stratosphere is increased. Additional influences that are not connected to the moisture content and origin seem to also play a role, especially during these times.
4.3 Tritium outlier events
Six measured precipitation events exhibited notably higher or lower tritium concentrations. All events that have more than 8 TU or less than 2 TU are discussed separately here. Their corresponding trajectories and the moisture origins are shown on maps and altitude profiles in Fig. 7. Additionally, they are marked in Figs. 3, 4, and Table 1
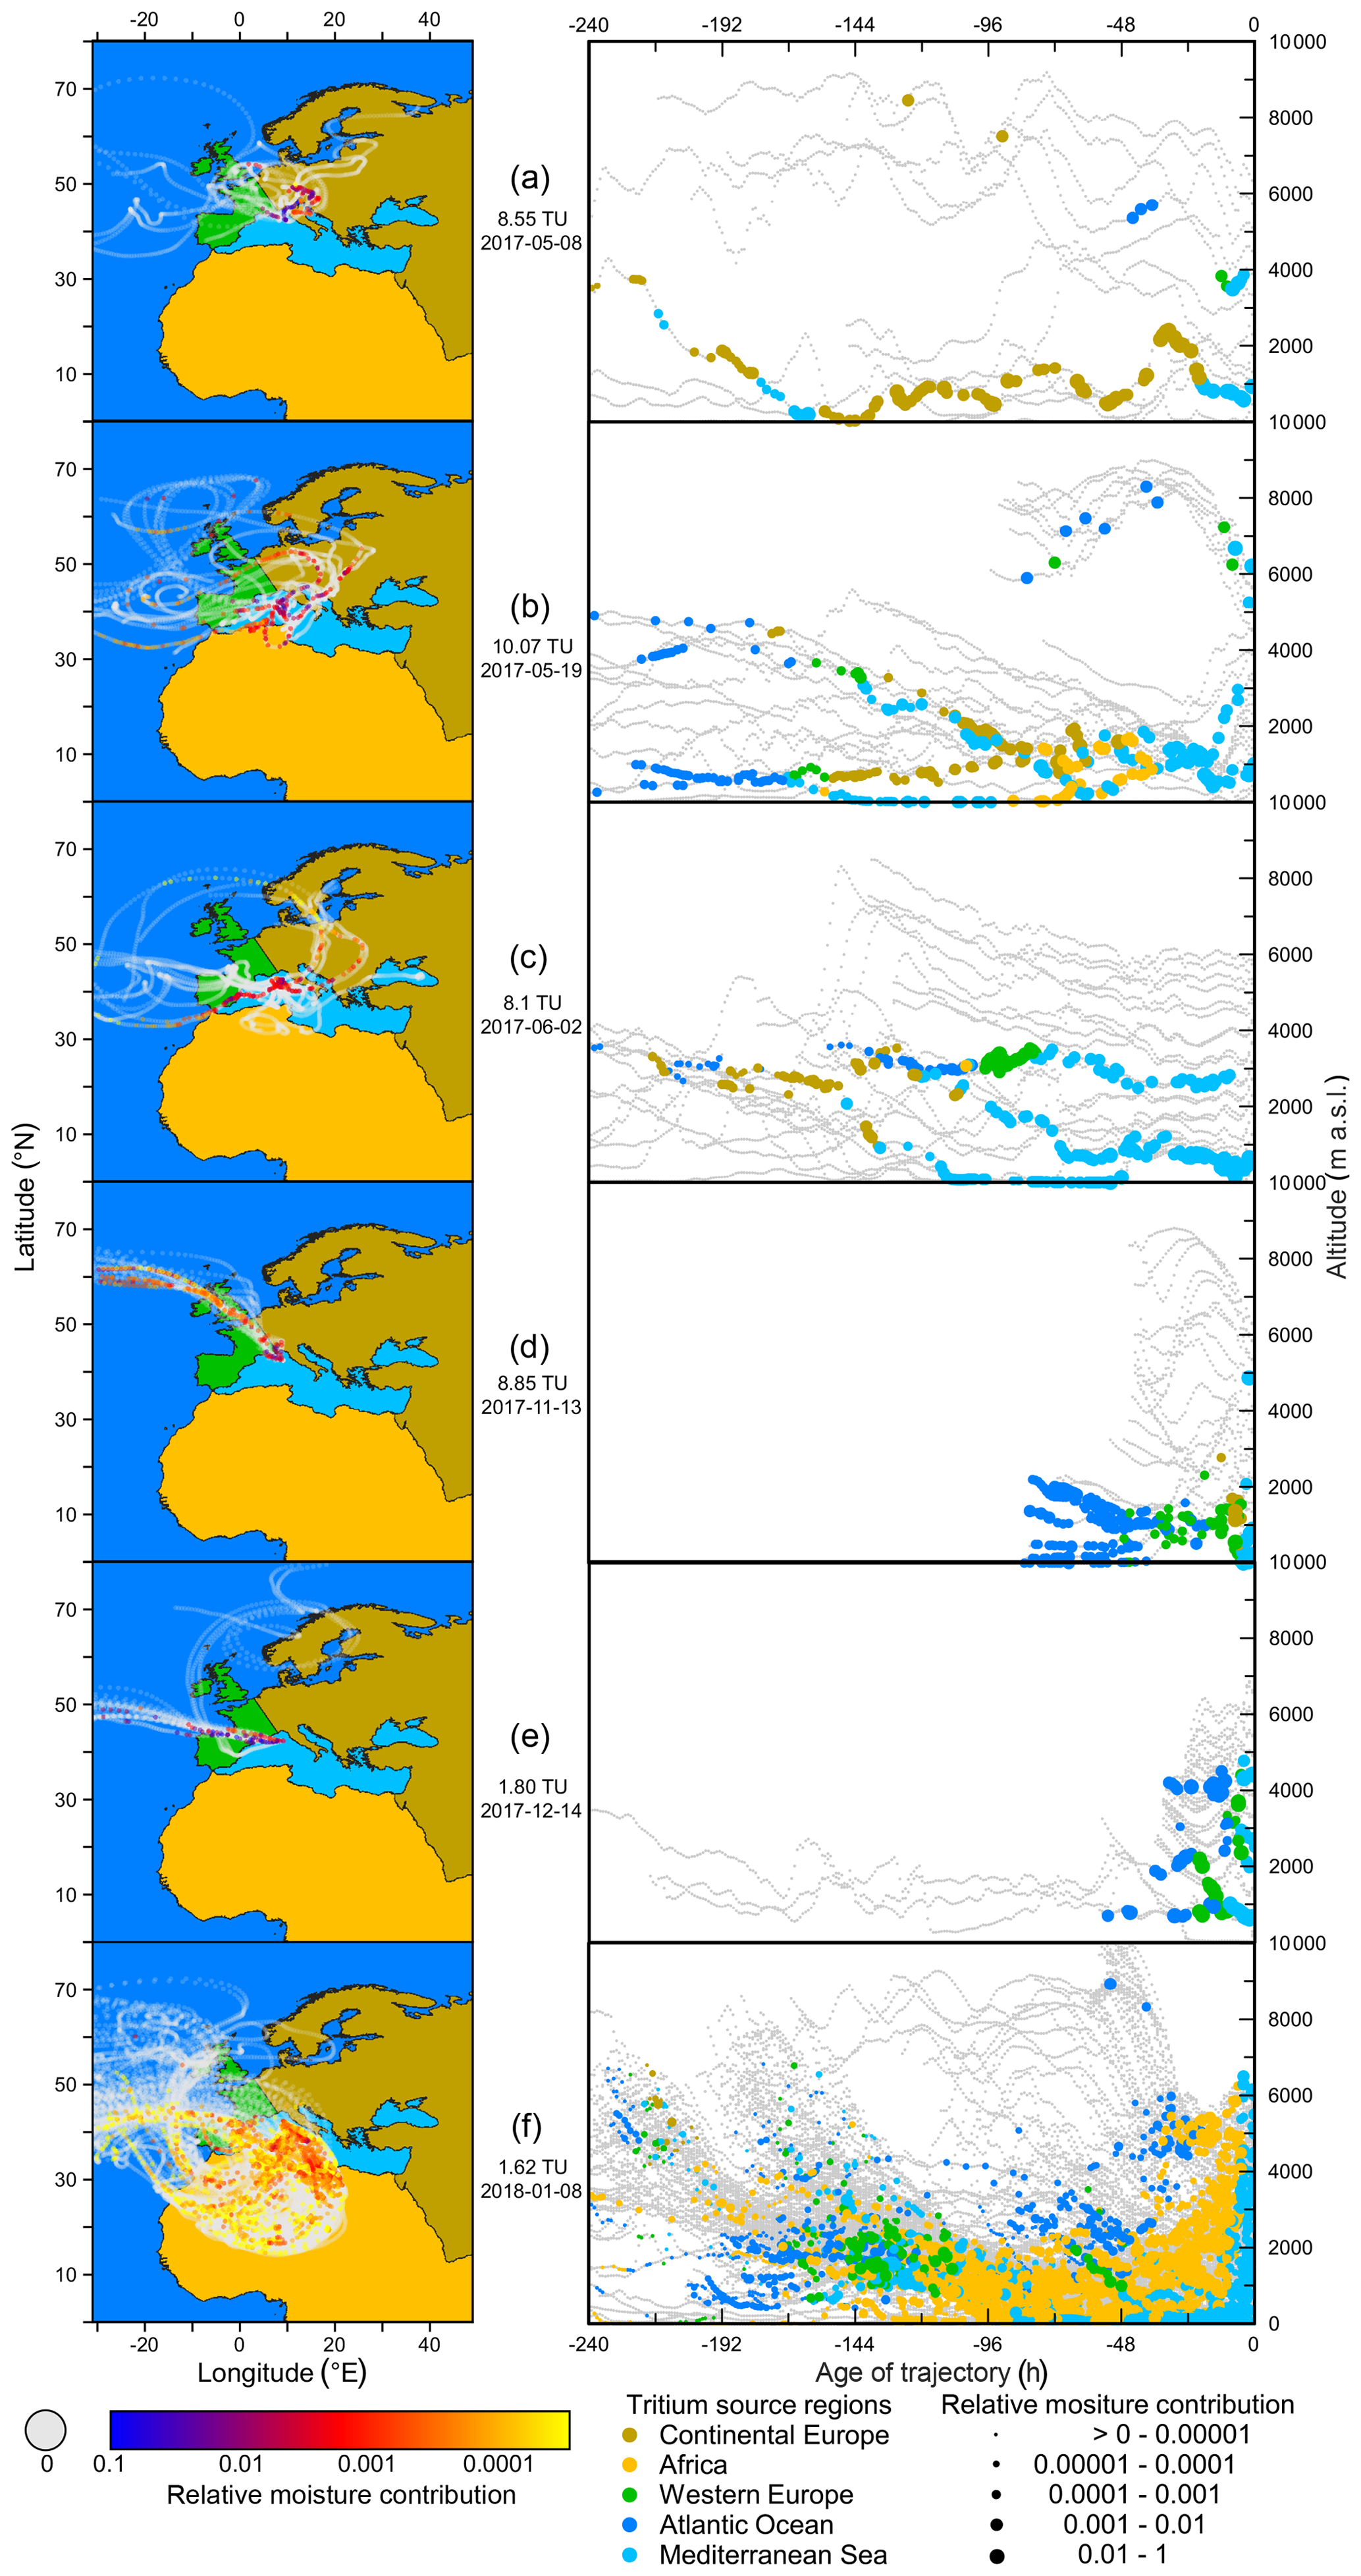
Figure 7Maps and vertical cross sections of air mass trajectories for outlier events based on 10 d trajectories. For the definition of extreme events, the reader is referred to Sect. 4.3. Map background colors and cross section trajectory point colors refer to the assumed tritium source regions (cf. Fig. 2). Colors of map trajectory points and the size of cross section trajectory points correspond to the relative moisture contribution to the precipitation event (cf. Fig. 1).
4.3.1 High-tritium extreme events
With respect to seasonal dynamics, events A–C fall into the period of the tropopause leak. Therefore, elevated tritium concentrations in precipitation are not unexpected. However, the altitude distribution of their trajectories is in contrast with the generally observed trend of increasing tritium concentration with increasing moisture contribution from high tropospheric altitudes. Events A and B both show similar air mass movements. Event A consists almost exclusively of moisture from continental Europe, whereas event B must also have received moisture from Mediterranean Sea sources. For both events, the majority of moisture uptake happens at lower altitudes of below ∼2000 m a.s.l. Although a correlation of altitude with increased tritium concentration could be generally detected, especially in spring and summer (Fig. 6), the highest tritium values were measured for events with a low-altitude air mass history. This indicates that either the leakage of stratospheric tritium into the troposphere is too variable to always result in a vertical tritium gradient in the troposphere, or other sources of tritium influence low-altitude moisture trajectories. The significant uptake of low-altitude moisture from continental Europe points to recycled precipitation and continental waters as a further tritium source. Thus, the elevated tritium concentration of precipitation over continental Europe (Fig. 2) can be transferred to the next precipitation event elsewhere by reevaporation and transport.
Event C draws its moisture from trajectories at multiple altitudes, from ground level up to around 3500 m a.s.l. Most of the moisture entered the air mass above the Mediterranean Sea, where low tritium concentrations are expected. A possible explanation for the measured high tritium value of 8.10 TU could be tritium entrainment in high-altitude air (>3000 m a.s.l.), especially in the early parts of some trajectories that collect moisture above continental Europe. Even minor amounts of moisture from high altitudes could significantly increase the tritium concentrations in precipitation (Aggarwal et al., 2016).
Event D shows a tritium concentration of 8.85 TU. In contrast to events A–C, event D did not occur during the tropopause leak in spring to early summer, when tritium concentrations in precipitation are expected to be elevated. This general seasonal trend could be observed in our data, with the exception of event D in November (Fig. 4). The trajectories show rapidly traveling air masses that reach the working area boundary within less than 4 d. Most of the moisture enters the air parcel above the Mediterranean Sea (Fig. 3), while secondary moisture uptake occurs above the Atlantic Ocean and western Europe. From these observations and the rather low altitude of trajectory points (< 2000 m a.s.l.), only minor amounts of tritium would be expected in the resulting precipitation. This discrepancy can possibly be explained by the addition of tritium from anthropogenic sources. The observed trajectory path leads oceanic air masses over Britain and France, where anthropogenic sources of tritium are present. There is debate regarding the influence that such sources of tritium have on their environment. In the areas closely surrounding nuclear facilities (up to several kilometers) vapor release was shown to enrich atmospheric tritium concentrations (e.g., Mihok et al., 2016; Chae et al., 2011). The shape and distance of these plumes can vary greatly depending on the type of nuclear facility and the atmospheric conditions (CNSC, 2009). With the help of atmospheric dispersion models, plumes were shown to influence tritium concentrations up to 100 km from the release point (Castro et al., 2017). However, greater distances of 200 km or more have yet to be assessed (Connan et al., 2017). In addition to vapor releases, river waters are influenced by liquid discharge from nuclear facilities (e.g., Ciffroy et al., 2006; Jean-Baptiste et al., 2018). Elevated tritium concentrations in river water that discharges into the sea are diluted but can affect tritium concentrations in coastal surface waters. Increased tritium concentrations are found for instance in the English Channel (Masson et al., 2005), the Bay of Biscay (Oms, 2018), the Celtic Sea (Oms, 2018), and near the mouth of the Rhône (Jean-Baptiste et al., 2018). The exchange of atmospheric moisture with these water bodies that have elevated tritium concentrations can also increase tritium concentrations in water vapor (Connan et al., 2017; Momoshima et al., 1987). Although it seems unlikely that elevated tritium concentrations in a single precipitation event can be traced back to anthropogenic tritium release over western Europe, the general concept of anthropogenic influence on the atmosphere is in line with the findings of Lewis et al. (1987), who report elevated tritium concentrations from longer air mass trajectories that originated from western Europe.
4.3.2 Low tritium extreme events
Both low tritium events occurred in winter when low tritium concentrations are expected due to the stable separation of the stratosphere and atmosphere.
The straight and rapidly moving trajectory of event E hints at low amounts of moisture exchange in western Europe and over the Mediterranean. The relative moisture contribution inferred from Fig. 3 shows the substantial contribution of Atlantic sources that are expected to contain tritium concentrations significantly below 1 TU, and the low altitude of the air parcel above the Atlantic Ocean can explain the matching equilibration with Atlantic moisture. This event seems to be a prime example of parameters that prevent a buildup of tritium in the moisture released in a precipitation event.
Event F has calculated trajectories for all 24 h of the day on which the event took place, because the exact time of precipitation was not logged. Therefore, the exact determination of the moisture origin was not possible. However, as most of the trajectories originate from the Atlantic Ocean, this seems to be a more robust indicator of the low tritium concentration than the supposedly major moisture uptake above the normally relatively dry North Africa. This example underlines the importance of an accurate time frame for this type of analysis.
In order to assess moisture sources for precipitation events, air mass back-trajectories were calculated and the locations of moisture uptake were derived. The Mediterranean Sea and western Europe were found to be the prime moisture contributors to measured precipitation events. In conjunction with the measurement of the tritium concentrations of these precipitation events and the assumption of regionally similar tritium source values, this allowed for the identification of regions with a notable influence on the tritium content. Air masses carrying moisture from continental Europe and the Atlantic Ocean produced distinct high and low tritium concentrations, respectively. A simple model calculated the average of tritium concentrations for each of the source regions. Its results are mostly in line with the values expected from generalized tritium distribution processes and measured values at long-term GNIP stations. Although a forward run of the model could only describe around a quarter of the variability of tritium concentrations, this shows that event-based data can reasonably reproduce spatial tritium distribution, especially for regions that have distinct source signature. This verifies tritium as a good moisture source tracer for lateral origin. The most probable source of error for the model are seasonal variations in the stratosphere–troposphere exchange that are not included in the calculations. With an increased number of event samples, a simple workaround could be the division of the model into two separate calculations: with and without influence of the tropopause leak.
An obvious seasonal cycle in tritium concentrations could be observed and is in line with the expectations of stratosphere–troposphere exchange. As the input of stratospheric tritium could be detected in precipitation, the question arose regarding whether the altitude history of air masses that contributed to an event was correlated with its tritium content. The average moisture source altitude was the best predictor of all tested parameters. Spring and summer events under the influence of the tropopause leak exhibited good agreement with moisture source altitude, especially if extreme events were evaluated separately. This strengthens the general concept of the altitude dependence of tritium concentrations, not only in ambient water vapor but also in the resulting precipitation. Additional information from different trajectory runtimes hint at tritium influences that are decoupled from moisture dynamics. Finally, a closer inspection of outlier events revealed possible recycled continental moisture as an important source of tritium to precipitation.
The importance of further research into tritium dynamics in the atmosphere is highlighted by the large variance of tritium concentrations in precipitation when comparing successive events. Considering the supposedly sound knowledge of the seasonal tritium distribution, extreme events such as those shown in this study can occur all year round. Such events remain mostly hidden when only using the monthly integrated GNIP sampling scheme. Additionally, assessing the contribution of anthropogenic tritium point sources over long distances remains an important issue with respect to tritium concentrations in precipitation events.
Sample data can be accessed on the PANGAEA online data repository (https://doi.org/10.1594/PANGAEA.911474; Juhlke et al., 2020). Third party data used in this study include data from the IAEA/WMO GNIP program and the Copernicus Climate Change Service (C3S). See the Reference section of this paper for the full citation.
TRJ carried out field sampling with the help of the acknowledged colleagues, undertook all calculations, and prepared the paper with contributions from all co-authors. JS is responsible for the laboratory analyses and considerable improvements to the paper. KT set up the model domain, prepared and converted the ERA5 data to run the HYSPLIT model, and provided supported with respect to atmospheric subjects. FH, EG, and SS helped with field logistics and improved the paper. JACB improved the paper. RvG helped with field sampling, improved the paper, and supervised the project.
The authors declare that they have no conflict of interest.
The authors would like to thank Martin Häusser, Isabel Knerr, and the whole CorsicArchive team for sampling and field support. We also wish to thank the laboratory team of the Noble Gas Laboratory from the IUP Bremen. Additionally, we thank the two anonymous reviewers for their helpful comments.
This research has been supported by the Deutsche Forschungsgemeinschaft (grant nos. GE 2338/1-1, TR1201/2-1, and BE1780/45-1).
This paper was edited by Heini Wernli and reviewed by two anonymous referees.
Aggarwal, P. K., Romatschke, U., Araguas-Araguas, L., Belachew, D., Longstaffe, F. J., Berg, P., Schumacher, C., and Funk, A.: Proportions of convective and stratiform precipitation revealed in water isotope ratios, Nat. Geosci., 9, 624–629, https://doi.org/10.1038/ngeo2739, 2016.
Allison, G. B. and Holmes, J. W.: The environmental tritium concentration of underground water and its hydrological interpretation, J. Hydrol., 19, 131–143, https://doi.org/10.1016/0022-1694(73)90075-9, 1973.
Allison, G. B. and Hughes, M. W.: The use of environmental tritium to estimate recharge to a South-Australian aquifer, J. Hydrol., 26, 245–254, https://doi.org/10.1016/0022-1694(75)90006-2, 1975.
Ayache, M., Dutay, J.-C., Jean-Baptiste, P., Beranger, K., Arsouze, T., Beuvier, J., Palmieri, J., Le-vu, B., and Roether, W.: Modelling of the anthropogenic tritium transient and its decay product helium-3 in the Mediterranean Sea using a high-resolution regional model, Ocean Sci., 11, 323–342, https://doi.org/10.5194/os-11-323-2015, 2015.
Begemann, F. and Libby, W. F.: Continental water balance, ground water inventory and storage times, surface ocean mixing rates and world-wide water circulation patterns from cosmic-ray and bomb tritium, Geochim. Cosmochim. Ac., 12, 277–296, https://doi.org/10.1016/0016-7037(57)90040-6, 1957.
Bradley, W. E. and Stout, G. E.: The vertical distribution of tritium in water vapor in the lower troposphere, Tellus, 22, 699–706, https://doi.org/10.1111/j.2153-3490.1970.tb00538.x, 1970.
Burlando, M., Antonelli, M., and Ratto, C. F.: Mesoscale wind climate analysis: identification of anemological regions and wind regimes, Int. J. Climatol., 28, 629–641, https://doi.org/10.1002/joc.1561, 2008.
Castro, P., Velarde, M., Ardao, J., Perlado, J. M., and Sedano, L.: Consequences of Different Meteorological Scenarios in the Environmental Impact Assessment of Tritium Release, Fusion Sci. Technol., 60, 1284–1287, https://doi.org/10.13182/fst11-a12665, 2017.
Cauquoin, A., Jean-Baptiste, P., Risi, C., Fourre, E., Stenni, B., and Landais, A.: The global distribution of natural tritium in precipitation simulated with an Atmospheric General Circulation Model and comparison with observations, Earth Planet. Sc. Lett., 427, 160–170, https://doi.org/10.1016/j.epsl.2015.06.043, 2015.
Cauquoin, A., Jean-Baptiste, P., Risi, C., Fourré, É., and Landais, A.: Modeling the global bomb tritium transient signal with the AGCM LMDZ-iso: A method to evaluate aspects of the hydrological cycle, J. Geophys. Res.-Atmos., 121, 12612–612629, https://doi.org/10.1002/2016jd025484, 2016.
Chae, J. S., Lee, S. K., Kim, Y., Lee, J. M., Cho, H. J., Cho, Y. W., and Yun, J. Y.: Distribution of tritium in water vapour and precipitation around Wolsung nuclear power plant, Radiat. Prot. Dosim., 146, 330–333, https://doi.org/10.1093/rpd/ncr182, 2011.
Ciffroy, P., Siclet, F., Damois, C., and Luck, M.: A dynamic model for assessing radiological consequences of tritium routinely released in rivers. Application to the Loire River, J. Environ. Radioactiv., 90, 110–139, https://doi.org/10.1016/j.jenvrad.2006.06.012, 2006.
Clarke, W. B., Jenkins, W. J., and Top, Z.: Determination of tritium by mass spectrometric measurement of 3He, Int. J. Appl. Radiat. Is., 27, 515–522, https://doi.org/10.1016/0020-708x(76)90082-x, 1976.
CNSC: Investigation of the Environmental Fate of Tritium in the Atmosphere, Tritium Studies Project. CNSC, Ottawa, Canada, available at: https://nuclearsafety.gc.ca/eng/resources/health/health-studies/tritium/environmental_fate_of_tritium_in_the_atmosphere.cfm (last access: 13 March 2020), 104 pp., ISBN 978-1-100-13928-9, 2009.
Connan, O., Hebert, D., Solier, L., Maro, D., Pellerin, G., Voiseux, C., Lamotte, M., and Laguionie, P.: Atmospheric tritium concentrations under influence of AREVA NC La Hague reprocessing plant (France) and background levels, J. Environ. Radioact., 177, 184–193, https://doi.org/10.1016/j.jenvrad.2017.06.015, 2017.
Copernicus Climate Change Service (C3S): ERA5: Fifth generation of ECMWF atmospheric reanalyses of the global climate, Copernicus Climate Change Service Climate Data Store (CDS), available at: https://cds.climate.copernicus.eu/cdsapp#!/home (last access: 6 February 2019), 2017.
Craig, H. and Lal, D.: The Production Rate of Natural Tritium, Tellus, 13, 85–105, https://doi.org/10.1111/j.2153-3490.1961.tb00068.x, 1961.
Dreisigacker, E. and Roether, W.: Tritium and90Sr in North Atlantic surface water, Earth Planet. Sc. Lett., 38, 301–312, https://doi.org/10.1016/0012-821x(78)90104-8, 1978.
Dünkeloh, A. and Jacobeit, J.: Circulation dynamics of Mediterranean precipitation variability 1948–98, Int. J. Climatol., 23, 1843–1866, https://doi.org/10.1002/joc.973, 2003.
Eastoe, C. J., Watts, C. J., Ploughe, M., and Wright, W. E.: Future use of tritium in mapping pre-bomb groundwater volumes, Ground Water, 50, 87–93, https://doi.org/10.1111/j.1745-6584.2011.00806.x, 2012.
Ehhalt, D. H.: Vertical profiles and transport of HTO in the troposphere, J. Geophys. Res., 76, 7351–7367, https://doi.org/10.1029/JC076i030p07351, 1971.
Ehhalt, D. H., Rohrer, F., Schauffler, S., and Pollock, W.: Tritiated water vapor in the stratosphere: Vertical profiles and residence time, J. Geophys. Res.-Atmos., 107, 4757–4771, https://doi.org/10.1029/2001jd001343, 2002.
Fine, R. A., Reid, J. L., and Östlund, H. G.: Circulation of Tritium in the Pacific Ocean, J. Phys. Oceanogr., 11, 3–14, https://doi.org/10.1175/1520-0485(1981)011<0003:cotitp>2.0.co;2, 1981.
Flato, G., Marotzke, J., Abiodun, B., Braconnot, P., Chou, S. C., Collins, W., Cox, P., Driouech, F., Emori, S., Eyring, V., Forest, C., Gleckler, P., Guilyardi, E., Jakob, C., Kattsov, V., Reason, C., and Rummukaine, M.: Evaluation of Climate Models, in: Climate Change 2013: The Physical Science Basis, Contribution of Working Group I to the Fifth Assess-ment Report of the Intergovernmental Panel on Climate Change, edited by: Stocker, T. F., Qin, D., Plattner, G.-K., Tignor, M., Allen, S. K., Boschung, J., Nauels, A., Xia, Y., Bex, V., and Midgle, P. M., Cambridge University Press, Cambridge, UK and New York, USA, 2013.
IAEA/WMO: Global Network of Isotopes in Precipitation, The GNIP Database, available at: https://nucleus.iaea.org/wiser (last access: 12 March 2020), 2019.
Jean-Baptiste, P., Fontugne, M., Fourre, E., Marang, L., Antonelli, C., Charmasson, S., and Siclet, F.: Tritium and radiocarbon levels in the Rhone river delta and along the French Mediterranean coastline, J. Environ. Radioact., 187, 53–64, https://doi.org/10.1016/j.jenvrad.2018.01.031, 2018.
Jenkins, W. J. and Rhines, P. B.: Tritium in the Deep North-Atlantic Ocean, Nature, 286, 877–880, https://doi.org/10.1038/286877a0, 1980.
Jordan, C. E., Dibb, J. E., and Finkel, R. C.: 10Be∕7Be tracer of atmospheric transport and stratosphere-troposphere exchange, J. Geophys. Res., 108, 4234–4247, https://doi.org/10.1029/2002jd002395, 2003.
Juhlke, T. R., Meier, C., van Geldern, R., Vanselow, K. A., Wernicke, J., Baidulloeva, J., Barth, J. A. C., and Weise, S. M.: Assessing moisture sources of precipitation in the Western Pamir Mountains (Tajikistan, Central Asia) using deuterium excess, Tellus B, 71, 1–16, https://doi.org/10.1080/16000889.2019.1601987, 2019.
Juhlke, T. R., Sültenfuß, J., Trachte, K., Huneau, F., Garel, E., Santoni, S., Barth, J. A. C., and van Geldern, R.: Tritium concentrations in Mediterranean precipitation event samples from the island of Corsica (France), PANGAEA, https://doi.org/10.1594/PANGAEA.911474, 2020.
Lewis, R. R., Fröhlich, K., and Hebert, D.: Contribution to the Tritium Continental Effect, Isotopenpraxis Isotopes in Environmental and Health Studies, 23, 266–268, https://doi.org/10.1080/10256018708623808, 1987.
Libby, W. F.: Moratorium tritium geophysics, J. Geophys. Res., 68, 4485–4494, https://doi.org/10.1029/jz068i015p04485 1963.
Lucas, L. L. and Unterweger, M. P.: Comprehensive Review and Critical Evaluation of the Half-Life of Tritium, J. Res. Natl. Inst. Stan., 105, 541–549, https://doi.org/10.6028/jres.105.043, 2000.
Martell, E. A.: Atmospheric Aspects of Strontium-90 Fallout: Fallout evidence indicates short stratospheric holdup time for middle-latitude atomic tests, Science, 129, 1197–1206, https://doi.org/10.1126/science.129.3357.1197, 1959.
Masson, M., Siclet, F., Fournier, M., Maigret, A., Gontier, G., and Bois, P. B. d.: Tritium along the French coast of the English Channel, Radioprotection, 40, S621–S627, https://doi.org/10.1051/radiopro:2005s1-091, 2005.
Mihok, S., Wilk, M., Lapp, A., St-Amant, N., Kwamena, N. A., and Clark, I. D.: Tritium dynamics in soils and plants grown under three irrigation regimes at a tritium processing facility in Canada, J. Environ. Radioact., 153, 176–187, https://doi.org/10.1016/j.jenvrad.2015.12.025, 2016.
Momoshima, N., Okai, T., Inoue, M., and Takashima, Y.: Tritium monitoring around a nuclear power station in normal operation, Int. J. Radiat. Appl. Instrum. Part A, 38, 263–267, https://doi.org/10.1016/0883-2889(87)90036-0, 1987.
Mook, W. G., Gat, J. R., and Meijer, H. A. J.: Environmental isotopes in the hydrological cycle: principles and applications, v. II: Atmospheric water, International Hydrological Programme (IHP-V), Technical Documents in Hydrology, edited by: IAEA, IAEA/UNESCO, 113 pp., 2001.
Oms, P.-E.: Tritium in oceans: a compilation, PANGAEA, date of access, https://doi.org/10.1594/PANGAEA.892125, 2018.
Palcsu, L., Morgenstern, U., Sultenfuss, J., Koltai, G., Laszlo, E., Temovski, M., Major, Z., Nagy, J. T., Papp, L., Varlam, C., Faurescu, I., Turi, M., Rinyu, L., Czuppon, G., Bottyan, E., and Jull, A. J. T.: Modulation of Cosmogenic Tritium in Meteoric Precipitation by the 11-year Cycle of Solar Magnetic Field Activity, Sci. Rep.-UK, 8, 12813, https://doi.org/10.1038/s41598-018-31208-9, 2018.
Pfahl, S. and Wernli, H.: Air parcel trajectory analysis of stable isotopes in water vapor in the eastern Mediterranean, J. Geophys. Res.-Atmos., 113, D20104, https://doi.org/10.1029/2008jd009839, 2008.
Pfahl, S. and Wernli, H.: Lagrangian simulations of stable isotopes in water vapor: An evaluation of nonequilibrium fractionation in the Craig-Gordon model, J. Geophys. Res.-Atmos., 114, D20108, https://doi.org/10.1029/2009jd012054, 2009.
Roether, W.: Estimating the tritium input to groundwater from wine samples: Groundwater and direct run-off contribution to Central European surface waters, Symposium on isotopes in hydrology, Vienna, Austria, 1967.
Roether, W., Jean-Baptiste, P., Fourré, E., and Sültenfuß, J.: The transient distributions of nuclear weapon-generated tritium and its decay product 3 He in the Mediterranean Sea, 1952–2011, and their oceanographic potential, Ocean Sci., 9, 837–854, https://doi.org/10.5194/os-9-837-2013, 2013.
Rolph, G., Stein, A., and Stunder, B.: Real-time Environmental Applications and Display sYstem: READY, Environ. Modell. Softw., 95, 210–228, https://doi.org/10.1016/j.envsoft.2017.06.025, 2017.
Schell, W. R., Sauzay, G., and Payne, B. R.: Tritium injection and concentration distribution in the atmosphere, J. Geophys. Res., 75, 2251–2266, https://doi.org/10.1029/JC075i012p02251, 1970.
Schell, W. R., Sauzay, G., and Payne, B. R.: World distribution of environmental tritium, Symposium on physical behaviour of radioactive contaminants in the atmosphere, Vienna, Austria, 375–396, 1974.
Seinfeld, J. H., Bretherton, C., Carslaw, K. S., Coe, H., DeMott, P. J., Dunlea, E. J., Feingold, G., Ghan, S., Guenther, A. B., Kahn, R., Kraucunas, I., Kreidenweis, S. M., Molina, M. J., Nenes, A., Penner, J. E., Prather, K. A., Ramanathan, V., Ramaswamy, V., Rasch, P. J., Ravishankara, A. R., Rosenfeld, D., Stephens, G., and Wood, R.: Improving our fundamental understanding of the role of aerosol-cloud interactions in the climate system, P. Natl. Acad. Sci. USA, 113, 5781–5790, https://doi.org/10.1073/pnas.1514043113, 2016.
Sodemann, H., Schwierz, C., and Wernli, H.: Interannual variability of Greenland winter precipitation sources: Lagrangian moisture diagnostic and North Atlantic Oscillation influence, J. Geophys. Res.-Atmos., 113, D03107, https://doi.org/10.1029/2007jd008503, 2008.
Stein, A. F., Draxler, R. R., Rolph, G. D., Stunder, B. J. B., Cohen, M. D., and Ngan, F.: NOAA's HYSPLIT Atmospheric Transport and Dispersion Modeling System, B. Am. Meteorol. Soc., 96, 2059–2077, https://doi.org/10.1175/bams-d-14-00110.1, 2015.
Storebø, P. B.: The Exchange of Air between Stratosphere and Troposphere, J. Meteorol., 17, 547–554, https://doi.org/10.1175/1520-0469(1960)017<0547:teoabs>2.0.co;2, 1960.
Sültenfuß, J., Roether, W., and Rhein, M.: The Bremen mass spectrometric facility for the measurement of helium isotopes, neon, and tritium in water, Isotopes Environ. Health Stud., 45, 83–95, https://doi.org/10.1080/10256010902871929, 2009.
Teixeira, J., Stevens, B., Bretherton, C. S., Cederwall, R., Doyle, J. D., Golaz, J. C., Holtslag, A. A. M., Klein, S. A., Lundquist, J. K., Randall, D. A., Siebesma, A. P., and Soares, P. M. M.: Parameterization of the Atmospheric Boundary Layer: A View from Just Above the Inversion, B. Am. Meteorol. Soc., 89, 453–458, https://doi.org/10.1175/bams-89-4-453, 2008.
Thiébault S. and Moatti J.-P. (Eds.): The Mediterranean region under climate change: a scientific update, Marseille, France, IRD, AllEnvi, 2016.
Visser, A., Thaw, M., and Esser, B.: Analysis of air mass trajectories to explain observed variability of tritium in precipitation at the Southern Sierra Critical Zone Observatory, California, USA, J. Environ. Radioact., 181, 42–51, https://doi.org/10.1016/j.jenvrad.2017.10.008, 2018.
Vogel, J. C., Thilo, L., and Van Dijken, M.: Determination of groundwater recharge with tritium, J. Hydrol., 23, 131–140, https://doi.org/10.1016/0022-1694(74)90027-4, 1974.
Von Buttlar, H. and Wendt, I.: Ground-water studies in New Mexico using tritium as a tracer, EOS T. Am. Geophys. Un., 39, 660–668, https://doi.org/10.1029/TR039i004p00660, 1958.
Weiss, W., Bullacher, J., and Roether, W.: Evidence of pulsed discharges of tritium from nuclear energy installations in Central European precipitation, Behaviour of Tritium in the Environment, San Francisco, USA, 17–30, 1979.
https://doi.org/10.1594/PANGAEA.911474; Juhlke et al. (2020).