the Creative Commons Attribution 4.0 License.
the Creative Commons Attribution 4.0 License.
 | 03 Mar 2020
Wintertime new particle formation and its contribution to cloud condensation nuclei in the Northeastern United States
Arshad Arjunan Nair
James J. Schwab
James P. Sherman
Yanda Zhang
Atmospheric particles can act as cloud condensation nuclei (CCN) and modify cloud properties and precipitation and thus indirectly impact the hydrological cycle and climate. New particle formation (NPF or nucleation), frequently observed at locations around the globe, is an important source of ultrafine particles and CCN in the atmosphere. In this study, wintertime NPF over the Northeastern United States (NEUS) is simulated with WRF-Chem coupled with a size-resolved (sectional) advanced particle microphysics (APM) model. Model-simulated variations in particle number concentrations during a 2-month period (November–December 2013) are in agreement with corresponding measurements taken at Pinnacle State Park (PSP), New York, and Appalachian State University (APP), North Carolina. We show that, even during wintertime, regional nucleation occurs and contributes significantly to ultrafine-particle and CCN number concentrations over the NEUS. The model shows that, due to low biogenic emissions during this period, wintertime regional nucleation is solely controlled by inorganic species and the newly developed ternary ion-mediated nucleation scheme is able to capture the variations in observed particle number concentrations (ranging from ∼200 to 20 000 cm−3) at both PSP and APP. Total particle and CCN number concentrations dramatically increase following NPF events and have the highest values over the Ohio Valley region, where elevated [SO2] is sustained by power plants. Secondary particles dominate particle number abundance over the NEUS, and their fraction increases with altitude from ≳85 % near the surface to ≳95 % in the upper troposphere. The secondary fraction of CCN also increases with altitude, from 20 %–50 % in the lower boundary layer to 50 %–60 % in the middle troposphere to 70 %–85 % in the upper troposphere.
- Article
(19096 KB) - Full-text XML
- BibTeX
- EndNote


Particle number concentration is a key parameter important for the health impacts and the climate impacts of atmospheric aerosols. High number concentrations of ultrafine particles may lead to adverse health effects (Knibbs et al., 2011; Han et al., 2016). Variations in the number concentration of cloud condensation nuclei (CCN) influence cloud properties and precipitation and thus indirectly affect the hydrological cycle and climate (e.g., Twomey, 1977; Charlson et al., 1992). Aerosol particles appear in the troposphere due to either in situ new particle formation (NPF, i.e, formation of secondary particles (SP) via nucleation) or direct emissions (i.e., primary particles, PP). Though NPF has little effect on the total particle mass in the immediate vicinity of the nucleation itself, it is highly relevant to aerosol health and climate effects as SP can dominate the ultrafine particles and those particles that can act as CCN (Spracklen et al., 2008; Pierce and Adams, 2009; Yu and Luo, 2009). Aerosol number concentrations exhibit significant spatial and temporal variability due to the nonlinear dependence of NPF rates on atmospheric conditions and concentrations of gaseous precursors, both of which are subject to changes as a result of climate changes and emission regulatory actions.
Laboratory experiments and theoretical studies indicate that sulfuric acid, ammonia, amines, ions, and certain organic compounds can all contribute to NPF (see recent review paper by Lee et al., 2019). However, the actual contribution of various nucleation pathways and key controlling parameters in the real atmosphere remains elusive, especially with regard to the relative importance of inorganic versus organic nucleation (e.g., Yu et al., 2015). Inorganic and organic nucleation precursors have quite different sources, and their emission strengths depend on different factors, with important implications for spatial distributions of NPF and CCN and their short-term (diurnal, seasonal) and long-term (preindustry, present, and future climate and emissions) variations. Both inorganic and organic nucleation schemes are subject to uncertainties, and it is important to evaluate their ability to capture particle formation and variations in number concentration in the atmosphere. Yu et al. (2015) showed that both inorganic nucleation and organic-mediated nucleation can explain NPF observed in a spring month at several forest sites in North America but organic-mediated nucleation overpredicted NPF in the summer. This summertime overprediction of the organic-mediated nucleation is reduced when a temperature-dependence correction is applied (Yu et al., 2017).
The main objective of the present study is to investigate the new-particle-formation process and its contribution to particle number concentration and CCN in the wintertime in the Northeastern United States (NEUS). Wintertime biogenic emissions are likely very low in the NEUS, and thus the contribution of biogenic organic species to NPF is expected to be negligible, enabling us to unequivocally evaluate the performance of the inorganic nucleation scheme. In addition to delineating the underlying processes controlling particle number concentrations in the atmosphere, an improved understanding of major sources and concentrations of CCN in wintertime is also important for better forecasting wintertime precipitation, such as snowstorms, in the NEUS (Gaudet et al., 2019).
2.1 Model
We employ WRF-Chem (version 3.7.1), a regional multiscale meteorology model coupled with online chemistry (Grell et al., 2005). The model configurations include the Morrison 2-mom microphysics (Morrison et al., 2009), RRTMG longwave and shortwave radiation (Clough et al., 2005), Noah land surface, Grell-3 cumulus (Grell and Freitas, 2014), and YSU PBL (Hong et al., 2006) schemes. We use the CB05 scheme (Yarwood et al., 2005) for gas-phase chemistry, SORGAM with aqueous reactions (Schell et al., 2001) for secondary-organic-aerosol chemistry and aqueous-phase chemistry, and ISORROPIA II (Fountoukis and Nenes, 2007) for aerosol thermodynamic equilibrium. The initial and boundary conditions for meteorology are generated from the National Centers for Environmental Prediction (NCEP) final analysis data (FNL) with a resolution of and time intervals at 6 h. The anthropogenic emissions are based on the Environmental Protection Agency (EPA) National Emissions Inventory (NEI) 2011, and the biogenic emissions are calculated using the model of emissions of gases and aerosols from nature (MEGAN; Guenther et al., 2006). Annual scaling factors for NOx, SO2, NH3, and CO derived from EPA's Air Pollutant Emissions Trends Data from 1990 to 2016 are used here to scale the emissions of corresponding species from the baseline year of 2011 to the simulation year. We also considered seasonal variation in NH3 emission due to agricultural activity in the model.
For particle microphysics, we use a size-resolved (sectional) advanced particle microphysics (APM) model (Yu and Luo, 2009) that was previously integrated into WRF-Chem v3.1.1 (Luo and Yu, 2011). For this study, we have updated APM and integrated it into WRF-Chem v3.7.1. Major changes to APM include the following: (1) the employment of 15 bins to represent black-carbon (BC) and another 15 bins to represent primary-organic-carbon (POC) particles in the size range of 3 nm to 2 µm (instead of two log-normal modes in the previous version); (2) consideration of the successive oxidation aging of secondary organic gases (SOGs) and the explicit kinetic condensation of low volatile SOG onto particles following the scheme of Yu (2011); and (3) fully coupled APM aerosols with WRF-Chem radiation code and cloud microphysics, with aerosol optical properties and aerosol activation calculated from size-resolved APM aerosols using optical properties lookup tables (Yu et al., 2012) and the activation scheme of Abdul-Razzak and Ghan (2002). The cloud droplet number predicted by APM directly impacts the spectral shape parameter and slope parameter for cloud droplets in the Morrison 2-mom microphysics scheme and then impacts the cloud droplet effective radius and the autoconversion of cloud water to rainwater and ultimately affects the rainwater mass content and raindrop number concentration.
We have carried out WRF-Chem–APM simulations for the period of 25 October–31 December 2013 at a 27 km × 27 km horizontal resolution. The domain covered the main continental United States, extending approximately from latitudes 21 to 54∘ N and from longitudes 62 to 132∘ W, with 180 grid nodes in the east–west direction and 126 in the north–south direction. The model has 30 vertical layers from the surface to 5 hPa, with finer resolution near the surface (6 layers within ∼1 km of the surface). The simulations were restarted on 1 November, 16 November, 1 December, and 16 December 2013 with continuous chemistry fields from previous runs. The present analysis focuses on the NEUS during November and December of 2013. Simulated 3-D fields of meteorological, chemical, and aerosol variables were output every 3 h for each grid box and every 15 min at the measurement sites described below.
2.2 Measurement site description
2.2.1 Pinnacle State Park (PSP), Addison, New York (NY)
The PSP site is located in Addison, NY, a village in southwestern NY. Its coordinates are 42.09∘ N and 77.21∘ W, and it is about 504 m above sea level (m a.s.l.; Schwab et al., 2009). The area surrounding PSP contains a variety of vegetation, including a golf course to the northwest, forestland consisting of deciduous and coniferous trees, pastures and fields, and a 0.2 km2 (50 acre) pond to the site's south (Schwab et al., 2009). The two nearest population centers to PSP are Addison and Corning. The village of Addison is about 4 km to the northwest of PSP, and it has a population of approximately 1800 people. The city of Corning is about 15 km to the northeast of PSP, and it has a population of approximately 11 000 people. Parameters measured include particle number concentration with a TSI model 3783 CPC, SO2 with a Thermo model 43i, temperature, relative humidity, wind speed and direction, solar radiation, and precipitation with calibrated meteorological sensors. These data are collected as minute averages. Gaseous NH3 is collected as part of the Ammonia Monitoring Network (AMoN) as passive 2-week samples from the nearby Connecticut Hill site (NADP, 2018).
2.2.2 Appalachian State University (APP), Boone, North Carolina (NC)
The APP site is located at 1076 m a.s.l. on a hill overlooking the campus of Appalachian State University (Boone, NC) in the heart of the Southern Appalachian Mountains (36.2∘ N, 81.7∘ W; Sherman et al., 2015). The APP site is surrounded by forests in all directions and is not located near any major highways or major industry. The Charlotte metropolitan area (population 2.5 million) is located approximately 160 km SE of APP and the Piedmont Triad metropolitan area (population 1.6 million) is located 200–230 km ESE of APP. Aerosol optical and microphysical properties are measured by the NOAA Earth System Research Laboratory (ESRL; Sherman et al., 2015). Particle number concentrations measured with a TSI model 3010 CPC are used in the present study.
WRF-Chem–APM-simulated wintertime NPF over the NEUS for the 2-month period (November–December 2013) is examined. The nucleation rate is calculated with a recently developed H2SO4–H2O–NH3 ternary ion-mediated nucleation (TIMN) scheme (Yu et al., 2018), which is supported by the detailed CLOUD (Cosmics Leaving OUtdoor Droplets) measurements (Kirkby et al., 2011; Kürten et al., 2016). According to the TIMN scheme, H2SO4 and NH3 are key nucleation precursors and other parameters such as temperature, relative humidity, ionization rate, and surface area of pre-existing particles also influence nucleation rates. In the presence of ionization, ternary ion nucleation is favored over neutral ternary nucleation because charged clusters have a lower nucleation barrier (Yu et al., 2018). The main sources of ions in winter in the boundary layer include galactic cosmic rays and radioactive materials from soils. H2SO4, well recognized to be critical for NPF in the atmosphere, is the oxidation product of SO2. Figure 1 shows the modeled horizontal spatial distribution for the lower boundary layer (first three model layers, ∼0–400 m above the surface) over the NEUS during November–December 2013 of the concentrations of major aerosol precursors (a) SO2 and (b) H2SO4, (c) NH3, (d) nucleation rate (J), (e) number concentration of condensation nuclei >10 nm (CN10), and (f) number concentration of CCN at supersaturation 0.4 % (CCN0.4). Typical wintertime modeled concentrations of aerosol precursors in the lower boundary layer over the NEUS are [SO2] ∼0.3–2 ppbv, [H2SO4] ∼0.03–0.2 pptv, and [NH3] ∼ 0.1–5 ppbv. The modeled spatial distribution of the aerosol precursors is colocated with their source regions: SO2 distribution is in line with the NEI and indicative of coal-fired power plants in the region, especially over the Ohio Valley. NH3 hotspots are over emission regions of agricultural land use and concentrated animal feeding operations. Calculated monthly mean nucleation rates in the lower boundary layer range typically from ∼0.1 to ∼2 cm3 s−1 over the NEUS domain, and spatial distributions are strongly correlated with concentration of aerosol precursors, with negligible nucleation over the oceanic area off the east coast. The number concentrations of CN10 and CCN0.4, calculated from the simulated particle number size distributions, are ∼2000–7000 and ∼100–1000 cm−3, respectively. Both CN10 and CCN0.4 have their highest values over the Ohio Valley region.

Figure 1Horizontal spatial distribution of WRF-Chem–APM-simulated average wintertime (November–December 2013) (a) [SO2], (b) [H2SO4], (c) [NH3], (d) nucleation rate (J), (e) number concentration of condensation nuclei >10 nm (CN10), and (f) cloud condensation nuclei at supersaturation 0.4 % (CCN0.4) in the lower boundary layer (∼0–400 m above surface, first three model layers) over the Northeastern United States (NEUS). Measurement sites Appalachian State University (A), North Carolina, and Pinnacle State Park (P), New York, are marked on the maps.
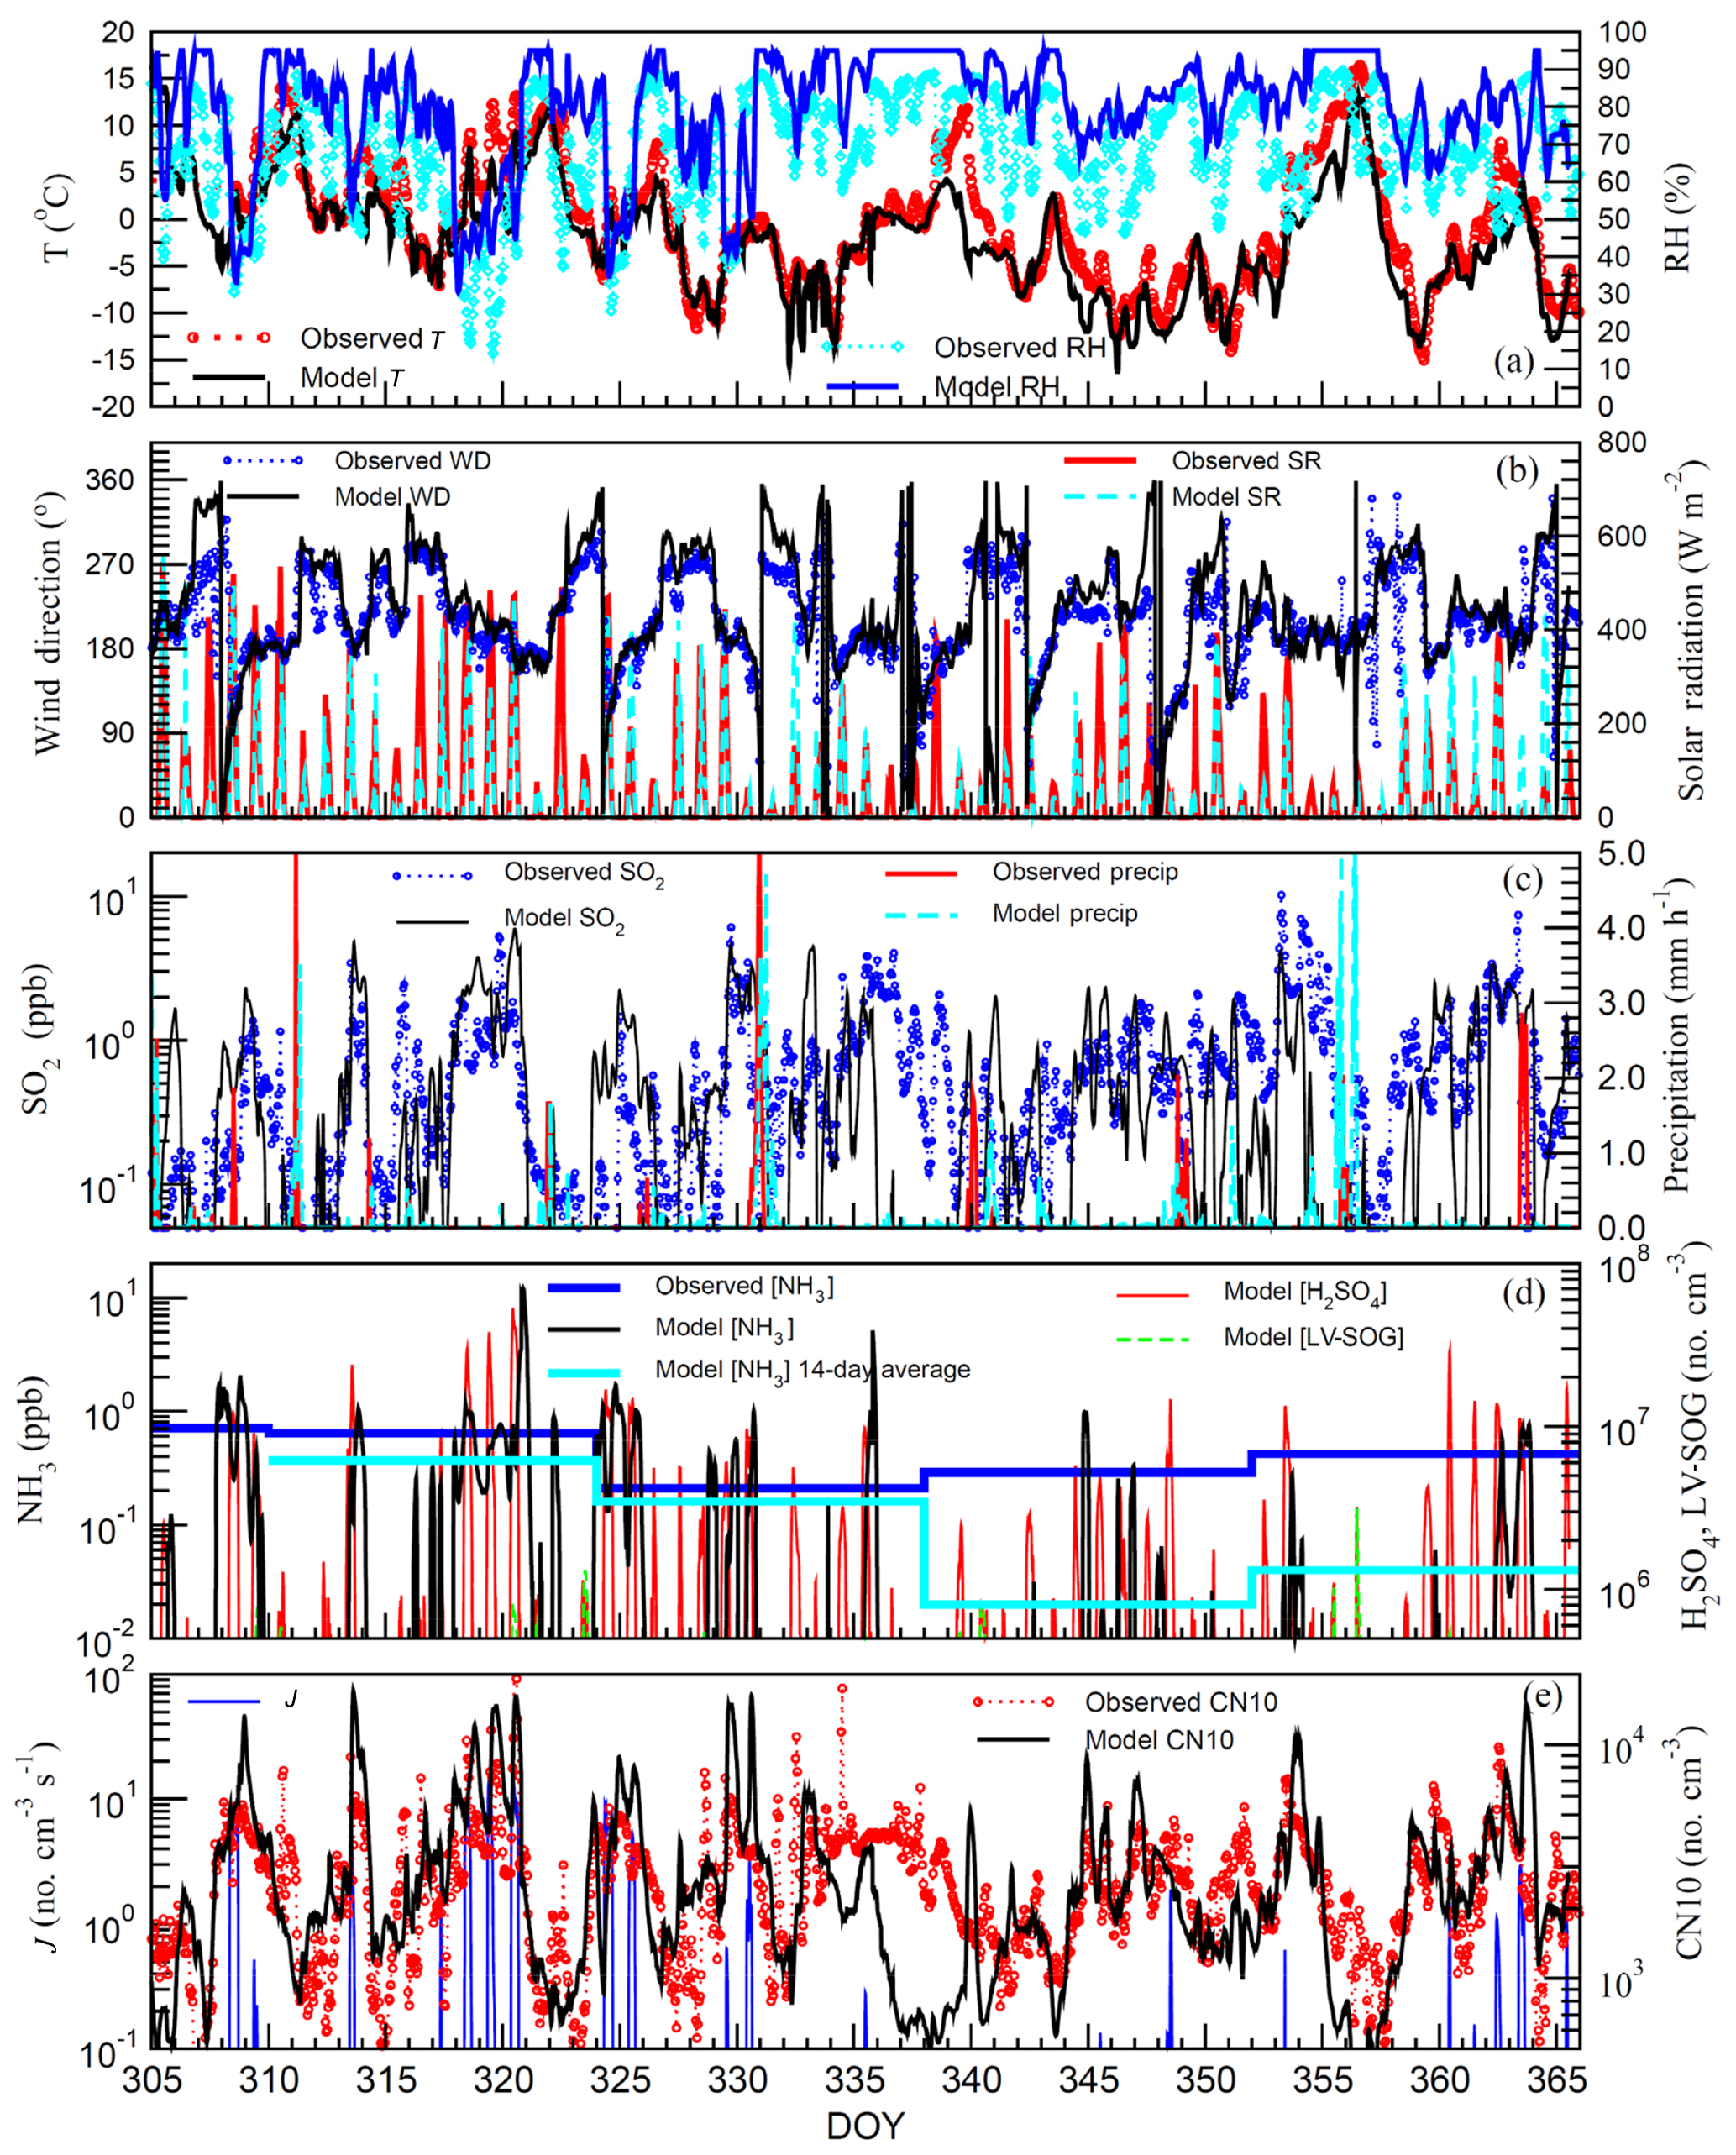
Figure 2Modeled diurnal variability of wintertime (November–December 2013) (a) temperature (T) and relative humidity (RH), (b) wind direction (WD) and solar radiation (SR), (c) [SO2] and precipitation, (d) [NH3], [H2SO4], and concentration of low volatile secondary organic gas (LV-SOG), and (e) nucleation rate (J) and CN10 at the Pinnacle State Park (PSP) site compared with in situ measurements. The x axis is the day of year (DOY).
To develop further confidence in WRF-Chem–APM simulations, diurnal variations in these aerosol precursors, as well as meteorological factors, are compared with available in situ measurements for this 2-month period at the PSP site in Fig. 2. The meteorological parameters compared are temperature (T) at 2 m above the surface, relative humidity (RH), wind direction, solar radiation, and precipitation, in Fig. 2a–c. Overall, WRF-Chem–APM simulates the diurnal variations in T and RH in good agreement with measurements (Fig. 3a), with a Pearson correlation coefficient (r) of 0.93 for hourly T and 0.74 for hourly RH. The model also captures major changes in wind direction (Fig. 2b), solar radiation (Fig. 2b), and occurrence of precipitation (Fig. 2c). The model slightly overpredicted RH and T. It should be noted that RH measurements were taken at 2 m above the surface, while modeled RH is the average of model surface layer (∼0–100 m). The differences and deviations during some days can also be associated with model uncertainties and subgrid variations within the 27 km × 27 km grid box. In situ measurements of [SO2] and [NH3] from the PSP site are used to examine their simulated values. Absolute values of [SO2] and their day-to-day variations (from below 0.1 to above 1 ppbv) are overall consistent with observations (Fig. 2c), with r of 0.48 and mean bias error (MBE) of −12 %. The daily variation in [NH3] (Fig. 2d) is more dramatic than that in [SO2], with the maximum value reaching ∼10 ppbv on Day 320 and the minimum value approaching zero on many days. In WRF-Chem, NH3 partitioning is calculated with ISORROPIA II (Fountoukis and Nenes, 2007) and assumes equilibrium between gaseous and particulate phases. In addition to emission, deposition, and transport, [NH3] is also controlled by particle compositions and temperature. The best available [NH3] data for the site during this period are from AMoN, which provides 2-week averages (blue line). The average values of modeled [NH3] during the same 2-week periods are also shown in Fig. 2d (cyan line). The modeled values are close to AMoN measurements in November but are much lower than the observed values in December, indicating average model–observation consistency with lower bias in model simulations. Measurements of [NH3] at a high temporal resolution are apparently needed to more rigorously evaluate the model performance.

Figure 3For the (a) PSP and (b) APP sites in the NEUS: modeled wintertime (November–December 2013) evolution of particle number size distributions (PNSDs; a1, b1) and time series (a2, b2) of CN10 (red line), CN10 due to primary particles (CN10_PP; dashed magenta line), CCN0.4 (blue line), and CCN0.4 due to primary particles (CCN0.4_PP; dashed cyan line). In panels (a2) and (b2), CN10 values from observations (black circles) are also shown for comparison. The model results are for the model surface layer (∼0–100 m above surface). Selected 4 d period from 15–18 November 2013 with nucleation events and nonevents is marked with a black rectangle.
Based on MEGAN, biogenic emissions during this wintertime period are low, leading to negligible modeled isoprene and monoterpene (not shown) and [LV-SOG] (Fig. 2d; generally <106 cm−3). In contrast, the peak [H2SO4] can reach above 107 cm−3. As a result of production solely by photochemistry and its short lifetime associated with condensation on pre-existing particles, [H2SO4] shows strong diurnal variation. [H2SO4] above cm−3 is a necessary condition for substantial nucleation (with nucleation rate J>0.1 cm−3 s−1) to occur (Fig. 2e). On Days 319 and 320 (15–16 November), peak [H2SO4] was above 3×107 cm−3 and the maximum nucleation rate reached up to 10 cm−3 s−1. It should be noted that the model-predicted [H2SO4] is higher than those concentrations observed with a chemical ionization mass spectrometer (CIMS) during the winter in Kent, Ohio (Erupe et al., 2010; Yu et al., 2014), also located in the NEUS where wintertime nucleation was observed to occur on ∼17 % of days (Kanawade et al., 2012). The possible reasons for the difference of model-predicted and CIMS-observed [H2SO4] remain to be investigated. One possible explanation is that sulfuric acid molecules are bonded with base molecules (e.g., ammonia and amines), leading to the well-recognized 1–2-orders-of-magnitude-lower concentrations of sulfuric acid monomers measured with a CIMS than the total sulfate values measured with a Monitor for AeRosols and GAses in ambient air (MARGA) and the theoretical values calculated from the vapor pressure of sulfuric acid (Neitola et al., 2015).
In addition to [H2SO4], which also depends on the surface area of pre-existing particles (and hence RH), [NH3] and T are two other important parameters controlling the variations in nucleation rates. Lower T is known to favor nucleation according to laboratory measurements (e.g., Tiszenkel et al., 2019) and theoretical calculation (e.g., Yu et al., 2018). It should be noted that ionization rates assumed in the model, while also important for NPF under the conditions, do not have many temporal and horizontal variations. The variations in J lead to large changes in CN10, from several hundreds to above tens of thousands per cubic centimeter, which is in good agreement with observations (Fig. 2e) and is analyzed in more detail in Fig. 3.
Figure 3 presents simulated surface-level (model first layer) particle number size distributions (PNSDs), CN10, and CCN0.4 during the 2-month period for two sites in the NEUS where CN10 in situ measurements are available: (a) PSP and (b) APP. The evolution of PNSD shows clearly the occurrence of strong nucleation and growth events on some days leading to significant increases in CN10 and CCN0.4. During the winter months, photochemistry is relatively weak and MEGAN biogenic emissions are small. Nevertheless, our model simulations show that nucleated particles of a few nanometers, through H2SO4 condensation and equilibrium uptake of HNO3, NH3, and H2O, are able to grow to 10–30 nm on most of the nucleation event days and even to 60–100 nm particles that can act as CCN on some of these days. The model captures quite well the absolute values of CN10 (∼200–20 000 cm−3) as well as their daily variability at both sites, with MBE =9 %, 6 % and r=0.70, 0.55 for the PSP and APP sites, respectively. The PNSDs and CN10 time series indicate that, at both sites, CN10 is dramatically elevated (by a factor of up to ∼10) in the aftermath of nucleation events. CN10 associated with primary particles (CN10_PP, mainly black carbon and primary organic carbon, with coating of secondary species) remains fairly constant (∼100 cm−3) during nucleation events. Based on the model simulation, the mean CN10 (CN10_PP) during the 2-month period is 2989 (106) cm−3 for the PSP site and 3180 (88) cm−3 for the APP site, showing that the secondary particles (CN10 – CN10_PP) account for >95 % of total CN10. The concentration of CCN0.4 in the surface layer at the two sites has large variations, ranging from several tens to several thousand per cubic centimeter, elevated substantially during nucleation event days. CCN0.4 associated with primary particles (CCN0.4_PP) is only slightly lower than CN10_PP, indicating most primary particles in the region are good CCNs during the winter. Based on the model simulations, the coating of secondary species on primary particles increases both the size and hygroscopicity of primary particles. On average for the 2-month period, primary and secondary particles each contribute to about 50 % of CCN0.4 near the surface at the two sites.
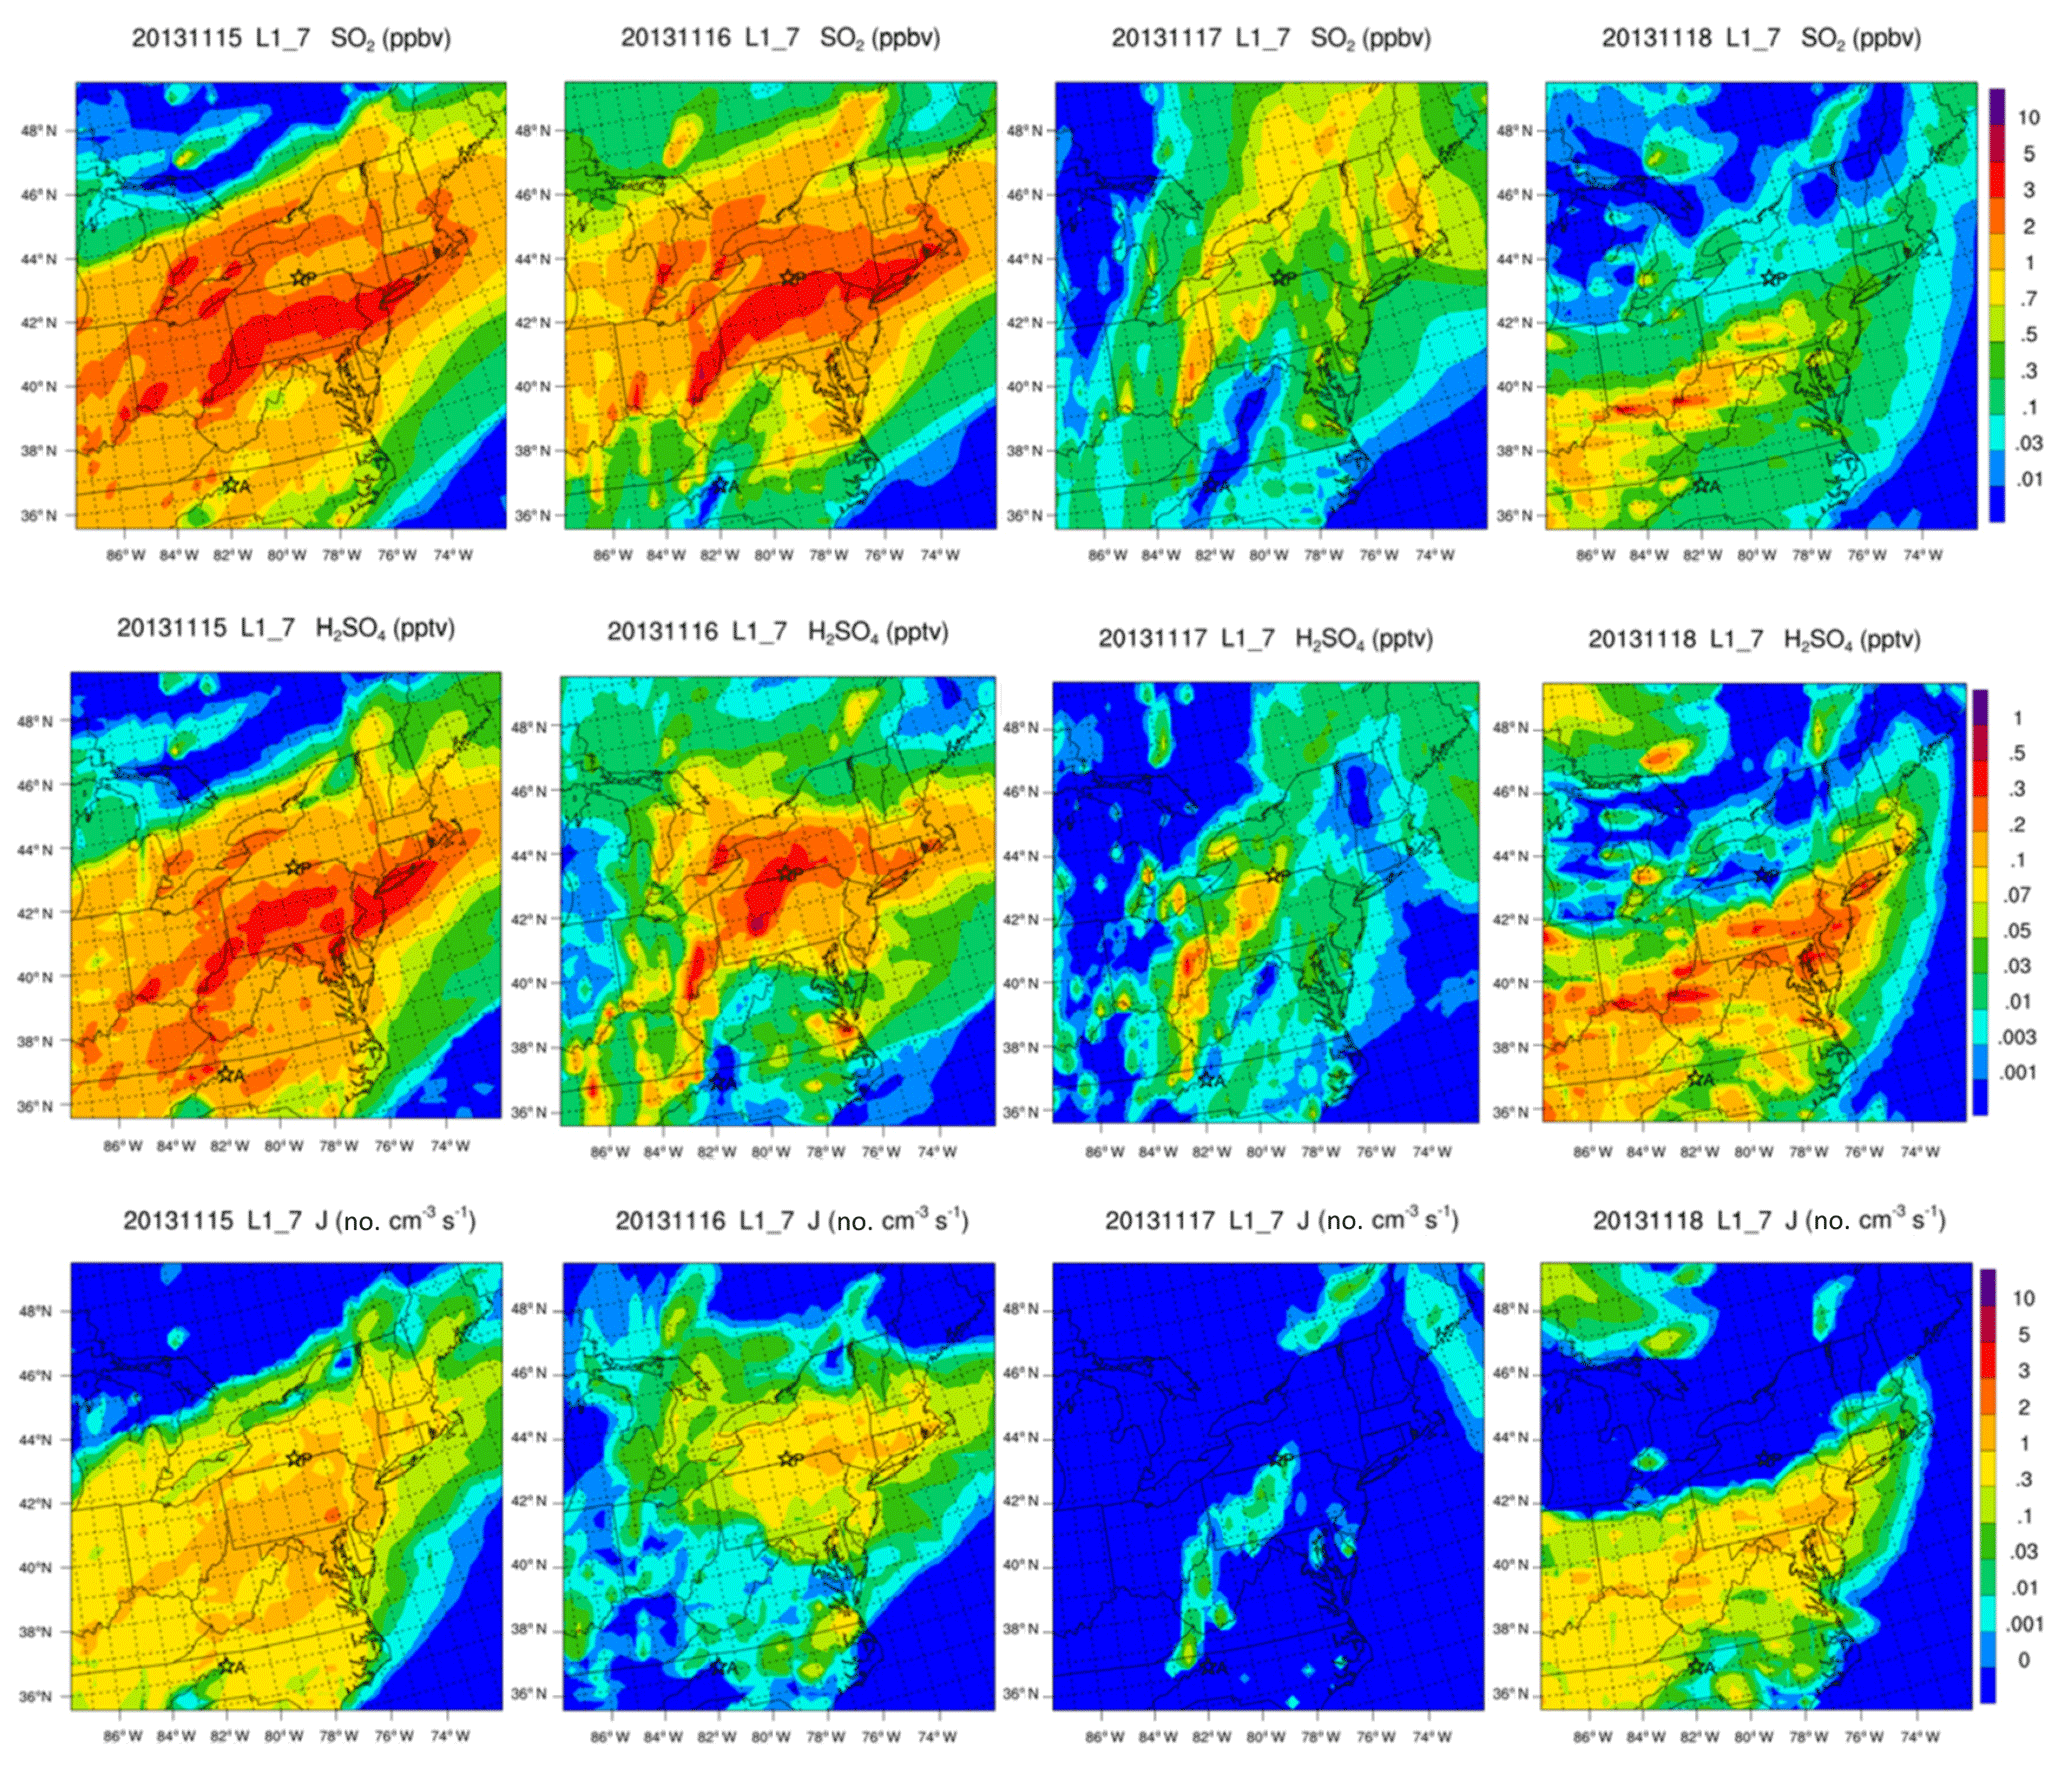
Figure 4For each day of the 4 d period from (left to right) 15–18 November 2013, (top to bottom) modeled horizontal spatial distribution of [SO2], [H2SO4], and nucleation rate (J) over the NEUS, with the measurement sites Pinnacle State Park (P) and APP (A) marked on the maps.
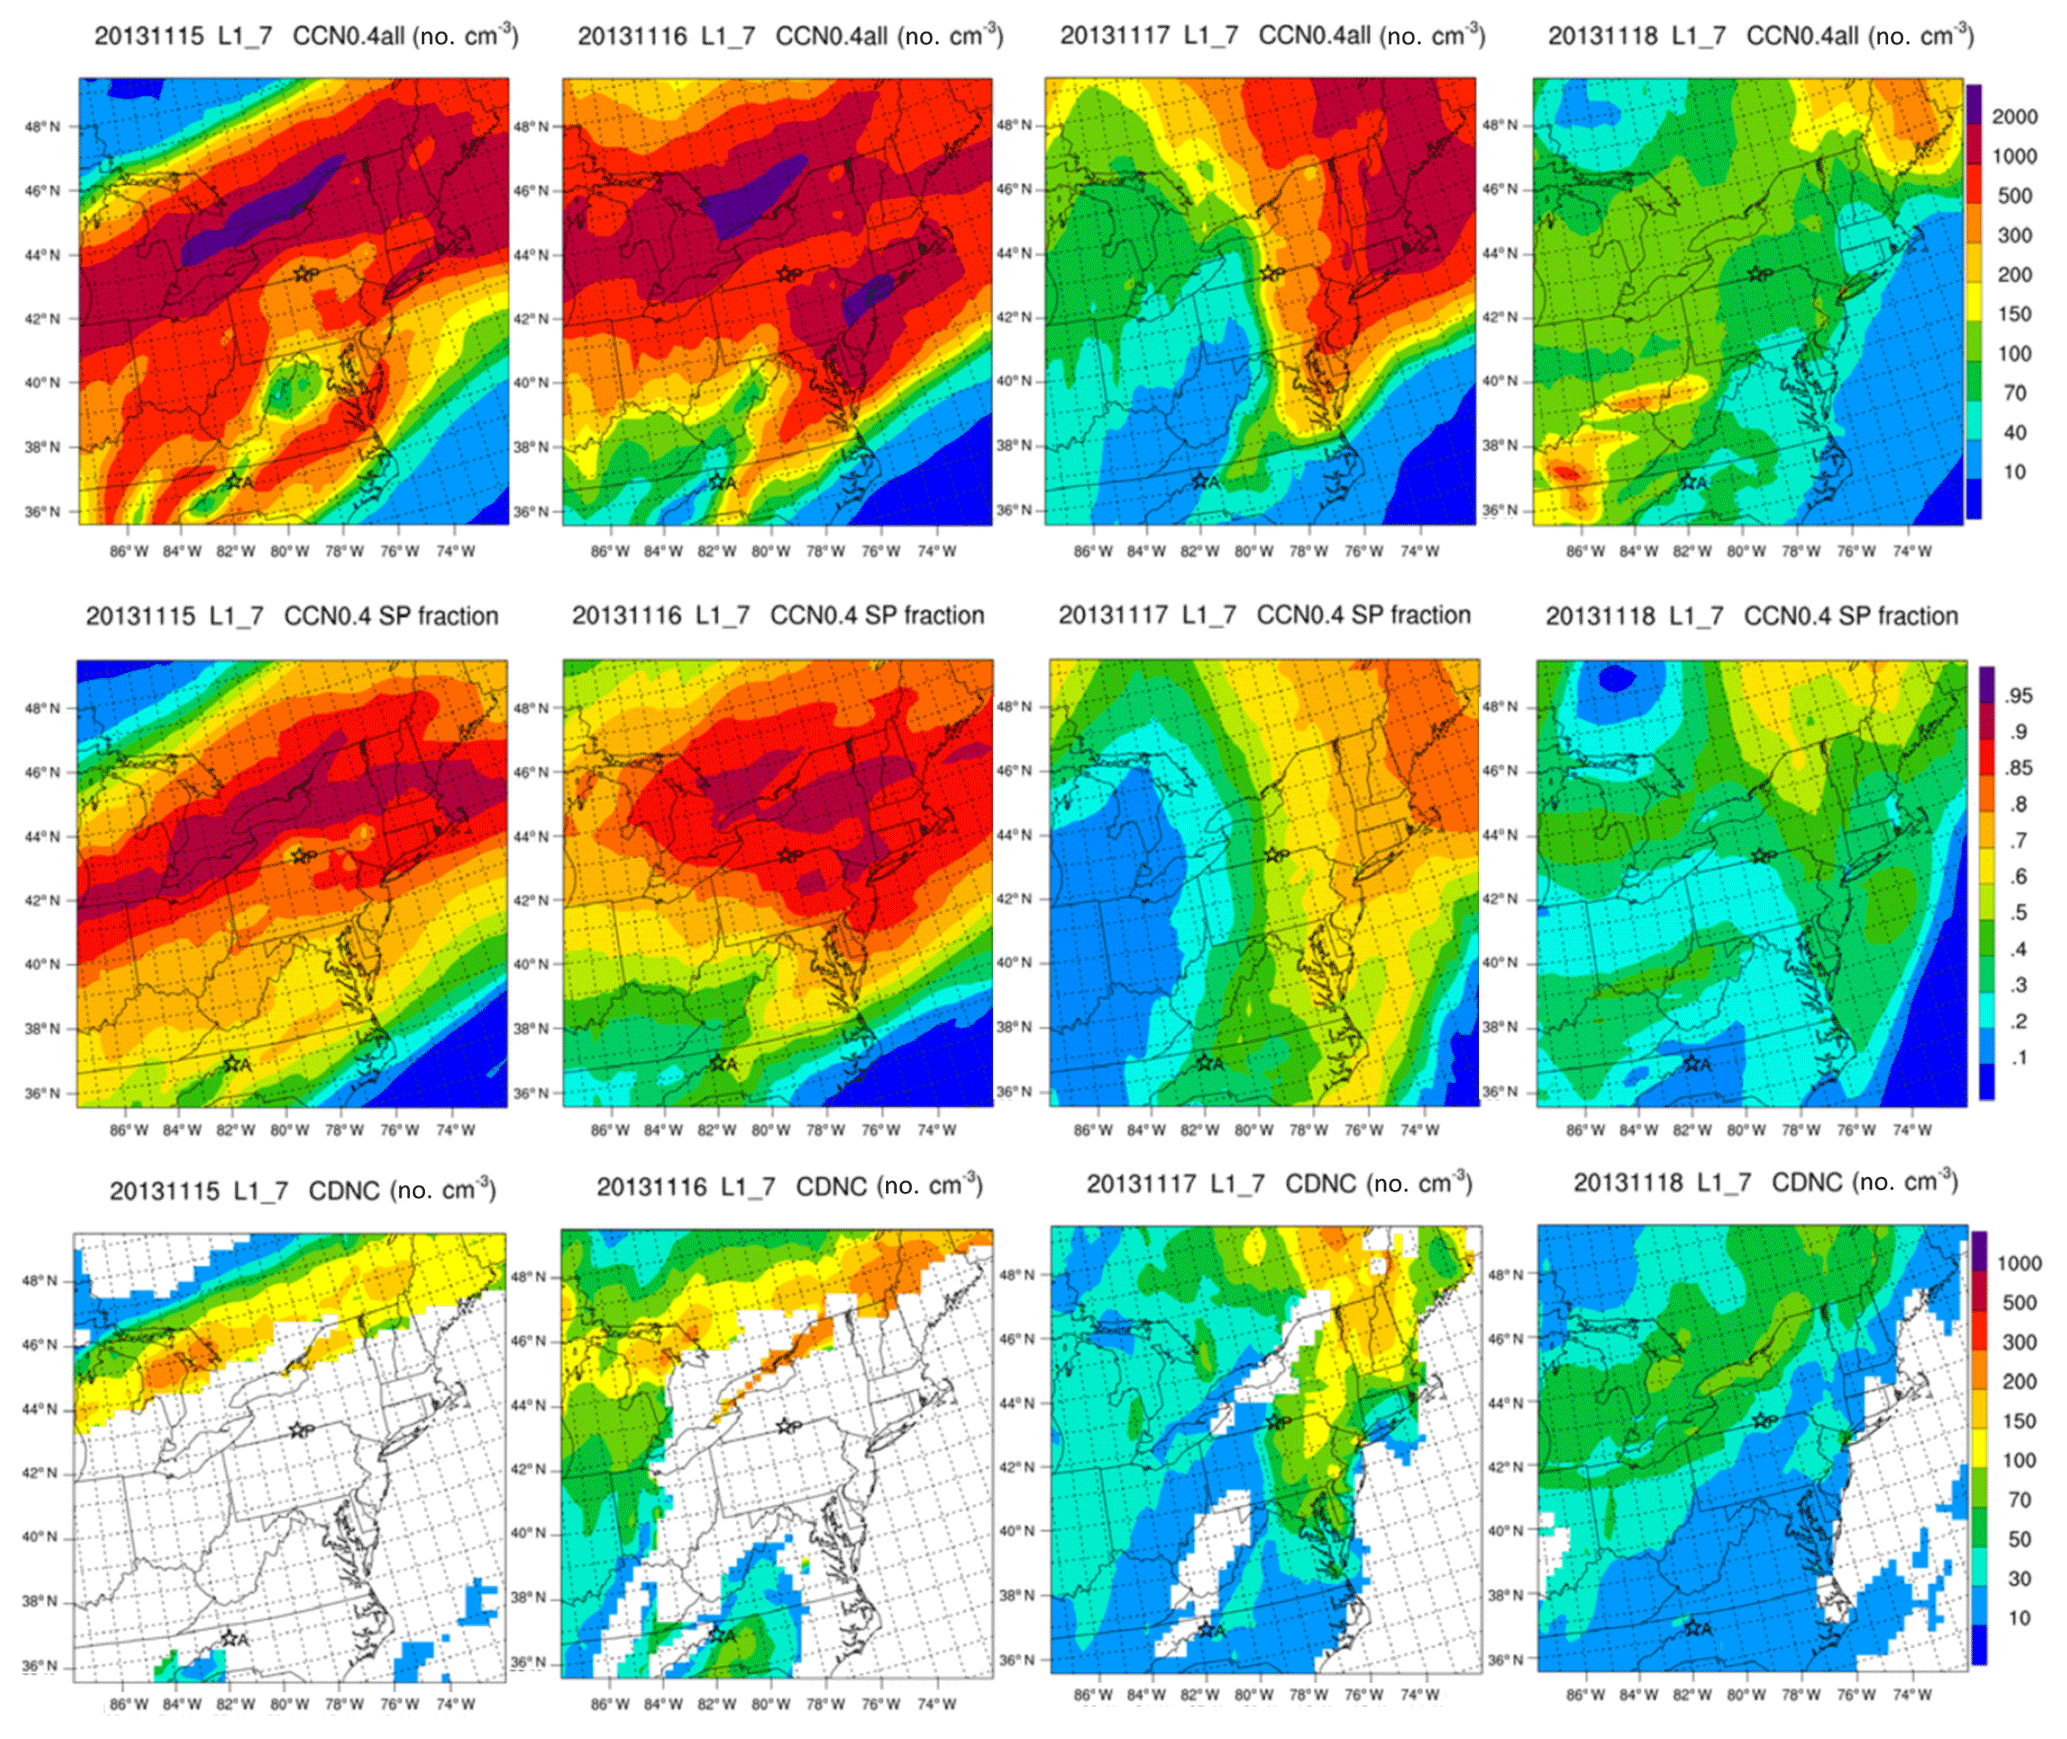
Figure 5For each day of the 4 d period from (left to right) 15–18 November 2013, (top) CCN0.4, (middle) its secondary particle fraction (CCN0.4 SP), and (bottom) CDNC-modeled horizontal spatial distribution over the NEUS, with the measurement sites Pinnacle State Park (P) and APP (A) marked on the maps.
For a detailed examination of the contribution of nucleation to CCN0.4 at the regional scale, a 4 d period (15–18 November 2013, marked with a black rectangle in Fig. 3) is selected so as to have all permutations of nucleation events and nonevents at the two sites (PSP and APP). The day 15 November (Day 319) has nucleation events at both sites; 16 November has nucleation events only at PSP; 17 November has nucleation nonevents at both sites, and 18 November has nucleation events only at APP. Figure 4 shows, for the NEUS, containing the PSP and APP sites, the modeled horizontal spatial distribution of [SO2], [H2SO4], and nucleation rate (J) averaged within the boundary layer (first seven model layers above the surface). [SO2] is controlled by emission, transport, chemistry, and deposition. Large daily variation in [SO2] in the NEUS and the important role of SO2 emission from the Ohio Valley region can be clearly seen in Fig. 4. The dependence of the nucleation rate on [H2SO4], which is determined by the SO2 oxidation production rate and condensation sink, is clear over the NEUS. Consistent with the nucleation events and nonevents observed at the PSP and APP sites during the 4 d period as shown in Fig. 3, Fig. 4 shows that the nucleation is generally at the regional scale with spatial distribution similar to that of [H2SO4]. These regional wintertime nucleation events contribute significantly to CCN0.4 in the NEUS as evidenced in the day-to-day spatial variations in CCN0.4 given in Fig. 5 (upper panels). Regions of high CCN0.4, generally dominated by secondary particles (Fig. 5, middle panels), correspond well with areas of high nucleation (Fig. 4, lower panels). More than ∼80 % of CCN0.4 is of secondary origin in regions with CCN0.4 above ∼1000 cm−3. Figure 5 (lower panels) also gives daily mean cloud droplet number concentration (CDNC) in the boundary layer (liquid-water-content-weighted average) during the period. Clouds formed in regions of higher CCN0.4 have larger CDNCs, and secondary particles contribute to CDNCs in these regions, highlighting the need for proper representation of secondary particle formation and growth in regional models.
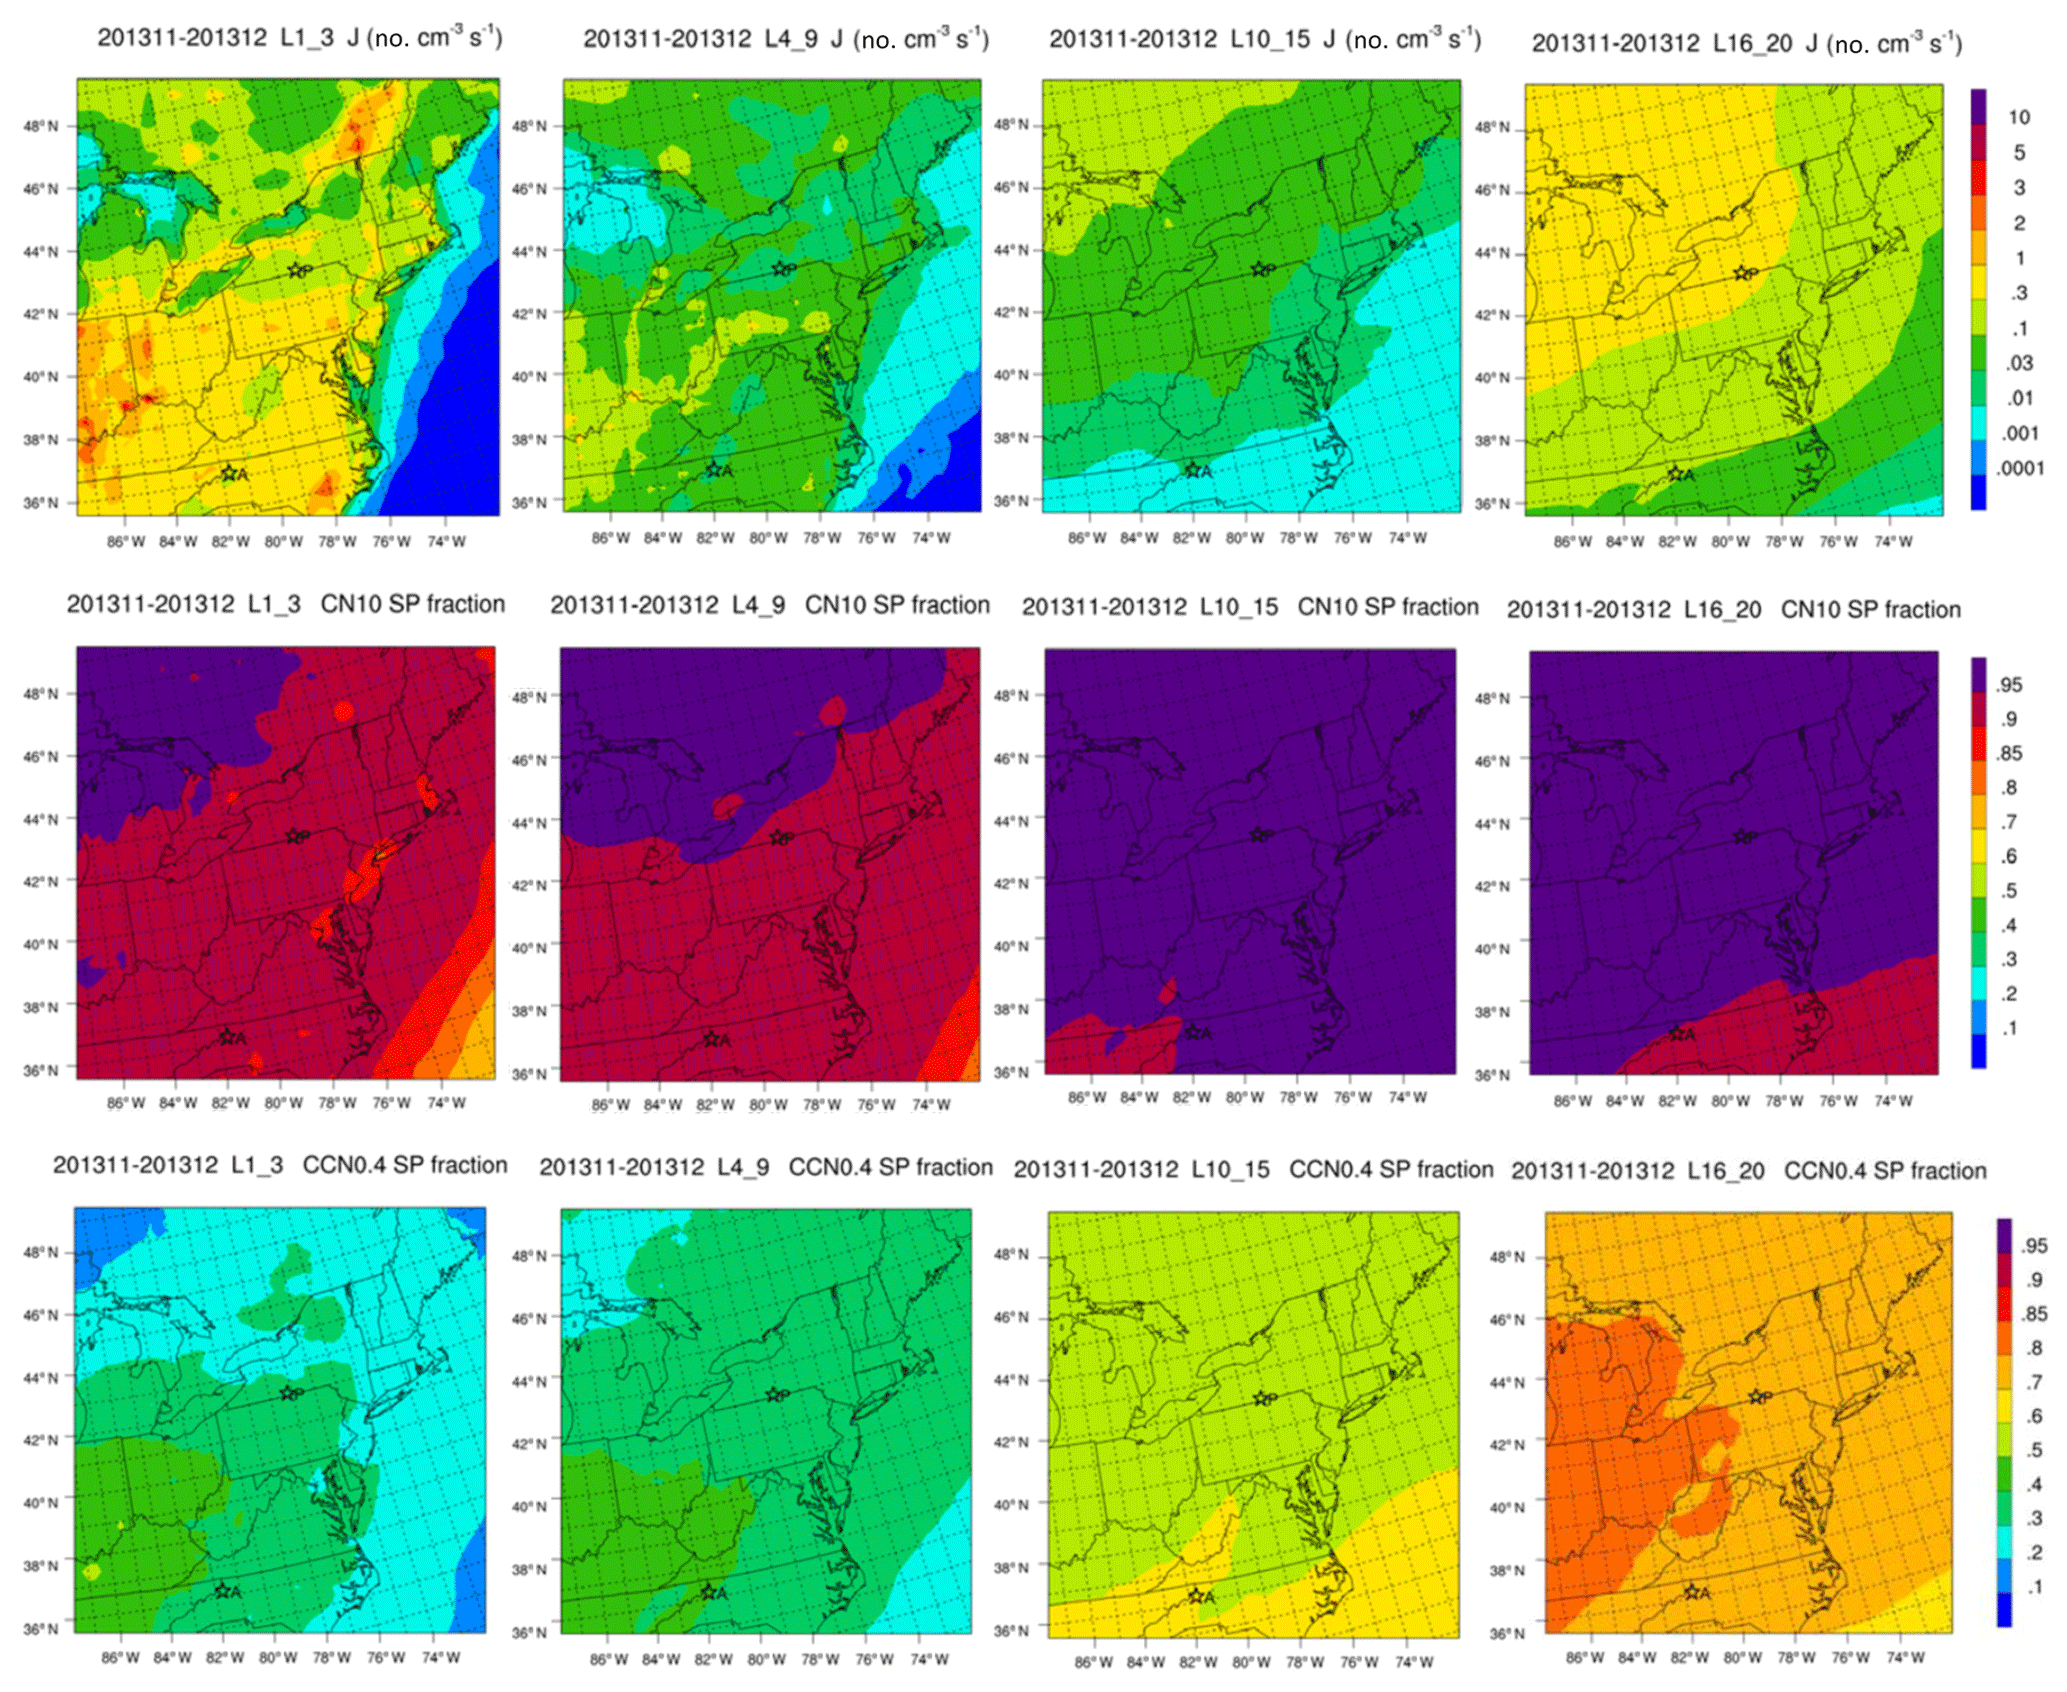
Figure 6Modeled average wintertime (November–December 2013) (top) nucleation rate (J), (middle) CN10 SP fraction, and (bottom) CCN0.4 SP fraction for (left to right) the surface layer, lower, middle, and upper troposphere.
So far, our analysis focuses on aerosol and precursors near the surface or in the boundary layer. To examine the vertical variations, Fig. 6 shows the 2-month (November–December 2013) mean nucleation rates and consequent contribution to CN10 (SP fraction, fCN10_SP) and CCN0.4 (SP fraction, fCCN_SP) in the lower boundary layer (below ∼960 mbar), lower troposphere (∼960–800 mbar), middle troposphere (∼800–470 mbar), and upper troposphere (∼470–250 mbar), over the NEUS. The model simulations indicate substantial nucleation at all altitudes although nucleation rates are higher in the lower boundary layer and upper troposphere. Horizontal distributions of nucleation rates in the lower boundary layer and lower troposphere differ significantly from those in the middle and upper troposphere, indicating quite different sources of air mass and that the influence of local emissions is limited to the lower troposphere. Secondary particles dominate CN10 at all altitudes over the NEUS and fCN10_SP increases with altitude from ≳85 % in the lower boundary layer to ≳95 % in the upper troposphere. In the lower boundary layer, secondary particles formed via nucleation contribute to the CCN0.4 number concentration from about 20 %–30 % over the New England region to ∼40 %–50 % over the Ohio Valley region. Similar to that of CN10, the SP fraction of CCN0.4 increases with altitude, reaching 50 %–60 % in the middle troposphere and 70 %–85 % in the upper troposphere.
New particle formation (NPF) has been well recognized as an important source of ultrafine particles which can lead to adverse health impacts and CCN, which affects cloud, precipitation, and climate. In this study, wintertime particle formation over the Northeastern United States (NEUS) and its contribution to particle number concentrations and CCN are investigated. Wintertime NPF in the NEUS is expected to be dominated by inorganic species as a result of very low biogenic emissions. Based on WRF-Chem–APM simulations for a 2-month period (November–December 2013) and comparisons with measurements, we show that substantial regional-scale NPF occurs in the winter over the NEUS despite weaker photochemistry and low MEGAN biogenic emissions. The recently developed physics-based H2SO4–H2O–NH3 ternary ion-mediated nucleation scheme appears to be able to capture the absolute values of particle number concentrations as well as their daily variations observed at two sites in the NEUS. The freshly nucleated nanometer particles can grow to 10–30 nm on most nucleation event days and to CCN sizes on some of these days. CN10 and CCN0.4 are dramatically elevated in the aftermath of nucleation events. Calculated monthly mean nucleation rates in the boundary layer over the NEUS range from ∼0.1 to ∼2 cm3s−1, and spatial distributions are strongly correlated with concentrations of aerosol precursors. The monthly mean number concentrations of CN10 and CCN0.4 are around 2000–7000 and 100–1000 cm−3, respectively. Both CN10 and CCN0.4 have their highest values over the Ohio Valley region, a key source region of anthropogenic SO2. The model simulations indicate substantial nucleation occurs at all altitudes although nucleation rates are higher in the lower boundary layer and upper troposphere. Secondary particles dominate CN10 at all altitudes over the NEUS, and their fraction increases with altitude from ≳85 % near the surface to ≳95 % in the upper troposphere. The fraction of CCN0.4 due to secondary particles also increases with altitude, from 20 %–50 % in the lower boundary layer to 50 %–60 % in the middle troposphere and 70 %–85 % in the upper troposphere.
The model output and observational data used for comparison are available on request from the authors. Figures are generated using the NCAR command language (https://doi.org/10.5065/D6WD3XH5; UCAR/NCAR/CISL/TDD, 2019). Ammonia Monitoring Network (AMoN) data used for comparison are from the National Atmospheric Deposition Program (NRSP3, http://nadp.slh.wisc.edu/data/AMoN/; National Atmospheric Deposition Program, 2017).
FY, GL, and YZ developed the project idea. GL and FY updated the model and carried out the numerical simulations. FY and AAN wrote the paper, with contributions from GL and JJS. JJS and JPS contributed observational data used in the comparison.
The authors declare that they have no conflict of interest.
This research has been supported by NYSERDA (grant no. 100416) and the US National Science Foundation (grant nos. OISE-1545917 and AGS-1550816).
This paper was edited by Veli-Matti Kerminen and reviewed by two anonymous referees.
Abdul-Razzak, H. and Ghan, S. J., A parameterization of aerosol activation, 3, Sectional representation, J. Geophys. Res., 107, 4026, https://doi.org/10.1029/2001JD000483, 2002.
Charlson, R. J., Schwartz, S. E., Hales, J. M., Cess, R. D., Coakley Jr., J. A., Hansen, J. E., and Hofmann, D. J.: Climate forcing by anthropogenic aerosols, Science, 255, 423–430, 1992.
Clough, S. A., Shephard, M. W., Mlawer, E. J., Delamere, J. S., Iacono, M. J., Cady-Pereira, K., Boukabara, S., and Brown, P. D.: Atmospheric radiative transfer modeling: A summary of the AER codes, J. Quant. Spectrosc. Ra., 91, 233–244, https://doi.org/10.1016/j.jqsrt.2004.05.058, 2005.
Erupe, M. E., Benson, D. R., Li, J., Young, L.-H., Verheggen, B., Al-Refai, M., Tahboub, O., Cunningham, V., Frimpong, F., Viggiano, A. A., and Lee, S.-H.: Correlation of aerosol nucleation rate with sulfuric acid and ammonia in Kent Ohio: an atmospheric observation, J. Geophys. Res., 115, D23216, https://doi.org/10.1029/2010JD013942, 2010.
Fountoukis, C. and Nenes, A.: ISORROPIA II: a computationally efficient thermodynamic equilibrium model for K+–Ca2+–Mg2+––Na+–––Cl−–H2O aerosols, Atmos. Chem. Phys., 7, 4639–4659, https://doi.org/10.5194/acp-7-4639-2007, 2007.
Gaudet, L. C., Sulia, K. J., Yu, F., and Luo, G.: Sensitivity of Lake-Effect Cloud Microphysical Processes to Ice Crystal Habit and Nucleation during OWLeS IOP4, J. Climate, 76, 3411–3434, https://doi.org/10.1175/JAS-D-19-0004.1, 2019.
Grell, G. A. and Freitas, S. R.: A scale and aerosol aware stochastic convective parameterization for weather and air quality modeling, Atmos. Chem. Phys., 14, 5233–5250, https://doi.org/10.5194/acp-14-5233-2014, 2014.
Grell, G. A., Peckham, S. E., McKeen, S., Schmitz, R., Frost, G., Skamarock, W. C., and Eder, B.: Fully coupled “online” chem-istry within the WRF model, Atmos. Environ., 39, 6957–6975, 2005.
Guenther, A., Karl, T., Harley, P., Wiedinmyer, C., Palmer, P. I., and Geron, C.: Estimates of global terrestrial isoprene emissions using MEGAN (Model of Emissions of Gases and Aerosols from Nature), Atmos. Chem. Phys., 6, 3181–3210, https://doi.org/10.5194/acp-6-3181-2006, 2006.
Han, Y., Zhu, T., Guan, T., Zhu, Y., Liu, J., Ji, Y., Gao, S., Wang, F., Lu, H., and Huang, W.: Association between size-segregated particles in ambient air and acute respiratory inflammation, Sci. Total Environ., 565, 412–419, 2016.
Hong, S.-Y., Noh, Y., and Dudhia, J.: A new vertical diffusion package with an explicittreatment of entrainment processes, Mon. Weather Rev. 134, 2318–2341, 2006.
Kanawade, V. P., Benson, D. R., and Lee, S.-H.: Statistical analysis of 4-year observations of aerosol sizes in a semi-rural continental environment, Atmos. Environ., 59, 30–38, 2012.
Kirkby, J., Curtius, J., Almeida, J., Dunne, E., Duplissy, J., Ehrhart, S., Franchin, A., Gagné, S., Ickes, L., Kürten, A., Kupc, A., Metzger, A., Riccobono, F., Rondo, L., Schobesberger, S., Tsagkogeorgas, G., Wimmer, D., Amorim, A., Bianchi, F., Breitenlechner, M., David, A., Dommen, J., Downard, A., Ehn, M., Flagan, R.C., Haider, S., Hansel, A., Hauser, D., Jud, W., Junninen, H., Kreissl, F., Kvashin, A., Laaksonen, A., Lehtipalo, K., Lima, J., Lovejoy, E. R., Makhmutov, V., Mathot, S., Mikkilä, J., Minginette, P., Mogo, S., Nieminen, T., Onnela, A., Pereira, P., Petäjä, T., Schnitzhofer, R., Seinfeld, J. H., Sipilä, M., Stozhkov, Y., Stratmann, F., Tomé, A., Vanhanen, J., Viisanen, Y., Vrtala, A., Wagner, P. E., Walther, H., Weingartner, E., Wex, H., Winkler, P. M., Carslaw, K. S., Worsnop, D. R., Baltensperger, U., and Kulmala, M.: Role of sulphuric acid, ammonia and galactic cosmic rays in atmospheric aerosol nucleation, Nature, 476, 429–433, 2011.
Knibbs, L. D., Cole-Hunter, T., and Morawska, L.: A review of commuter exposure toultrafine particles and its health effects, Atmos. Environ., 45, 2611–2622, https://doi.org/10.1016/j.atmosenv.2011.02.065, 2011.
Kürten, A., Bergen, A., Heinritzi, M., Leiminger, M., Lorenz, V., Piel, F., Simon, M., Sitals, R., Wagner, A. C., and Curtius, J.: Observation of new particle formation and measurement of sulfuric acid, ammonia, amines and highly oxidized organic molecules at a rural site in central Germany, Atmos. Chem. Phys., 16, 12793–12813, https://doi.org/10.5194/acp-16-12793-2016, 2016.
Lee, S.-H., Gordon, H., Yu, H., Lehtipalo, K., Haley, R., Li, Y., and Zhang, R.: New particle formation in the atmosphere: From molecular clusters to global climate, J. Geophys. Res., 124, 7098–7146, https://doi.org/10.1029/2018JD029356, 2019.
Luo, G. and Yu, F.: Simulation of particle formation and number concentration over the Eastern United States with the WRF-Chem + APM model, Atmos. Chem. Phys., 11, 11521–11533, https://doi.org/10.5194/acp-11-11521-2011, 2011.
Morrison, H., Thompson, G., and Tatarskii, V.: Impact of cloudmicrophysics on the development of trailing stratiform precipitation in asimulated squall line: Comparison of one- and two-moment schemes, Mon. Weather Rev., 137, 991–1007, https://doi.org/10.1175/2008MWR2556.1, 2009.
NADP: National Atmospheric Deposition Program 2017 Annual Summary, Wisconsin State Laboratory of Hygiene, University of Wisconsin-Madison, WI, USA, available at: http://nadp.slh.wisc.edu/lib/dataReports.aspx (last access: 29 February 2020), 2018.
National Atmospheric Deposition Program (NRSP3): Ammonia Monitoring Network (AMoN) data, NADP Program Office, Illinois State Water Survey, University of Illinois, Champaign, IL 61820, available at: http://nadp.slh.wisc.edu/data/AMoN/ (last access: 29 February 2020), 2017.
Neitola, K., Brus, D., Makkonen, U., Sipilä, M., Mauldin III, R. L., Sarnela, N., Jokinen, T., Lihavainen, H., and Kulmala, M.: Total sulfate vs. sulfuric acid monomer concenterations in nucleation studies, Atmos. Chem. Phys., 15, 3429–3443, https://doi.org/10.5194/acp-15-3429-2015, 2015.
Pierce, J. R. and Adams, P. J.: Uncertainty in global CCN concentrations from uncertain aerosol nucleation and primary emission rates, Atmos. Chem. Phys., 9, 1339–1356, https://doi.org/10.5194/acp-9-1339-2009, 2009.
Schell B., Ackermann, I. J., Hass, H., Binkowski, F. S., and Ebel, A.: Modeling the formation of secondary organic aerosol within a comprehensive air quality model system, J. Geophys. Res., 106, 28275–28293, 2001.
Schwab, J. J., Spicer, J. B., and Demerjian, K. L.: Ozone, Trace Gas, and Particulate Matter Measurements at a Rural Site in Southwestern New York State: 1995–2005, J. Air Waste Manage. Assoc., 59, 293–309, https://doi.org/10.3155/1047-3289.59.3.293, 2009.
Sherman, J. P., Sheridan, P. J., Ogren, J. A., Andrews, E., Hageman, D., Schmeisser, L., Jefferson, A., and Sharma, S.: A multi-year study of lower tropospheric aerosol variability and systematic relationships from four North American regions, Atmos. Chem. Phys., 15, 12487–12517, https://doi.org/10.5194/acp-15-12487-2015, 2015.
Spracklen, D., Carslaw, K., Kulmala, M., Kerminen, V.-M., Si-hto, S.-L., Riipinen, I., Merikanto, J., Mann, G., Chipperfield, M., Wiedensohler, A., Birmili, W., and Lihavainen, H.: Contribution of particle formation to global cloud condensa-tion nuclei concentrations, Geophys. Res. Lett., 35, L06808, https://doi.org/10.1029/2007GL033038, 2008.
Tiszenkel, L., Stangl, C., Krasnomowitz, J., Ouyang, Q., Yu, H., Apsokardu, M. J., Johnston, M. V., and Lee, S.-H.: Temperature effects on sulfuric acid aerosol nucleation and growth: initial results from the TANGENT study, Atmos. Chem. Phys., 19, 8915–8929, https://doi.org/10.5194/acp-19-8915-2019, 2019.
Twomey, S.: The Influence of Pollution on the Shortwave Albedo of Clouds, J. Atmos. Sci., 34, 1149–1152, https://doi.org/10.1175/1520-0469(1977)034<1149:TIOPOT>2.0.CO;2, 1977.
UCAR/NCAR/CISL/TDD: NCAR Command Language (Version 6.6.2) [Software], Boulder, Colorado, https://doi.org/10.5065/D6WD3XH5, 2019.
Yarwood, G., Rao, S., Yocke, M., and Whitten, G. Z.: Updates to the Carbon Bond Mechanism: CB05. US EPA Final Report, 161 pp., available at: http://www.camx.com/publ/pdfs/CB05_Final_Report_120805.pdf (last access: 29 February 2020), 2005.
Yu, F.: A secondary organic aerosol formation model considering successive oxidation aging and kinetic condensation of organic compounds: global scale implications, Atmos. Chem. Phys., 11, 1083–1099, https://doi.org/10.5194/acp-11-1083-2011, 2011.
Yu, F. and Luo, G.: Simulation of particle size distribution with a global aerosol model: contribution of nucleation to aerosol and CCN number concentrations, Atmos. Chem. Phys., 9, 7691–7710, https://doi.org/10.5194/acp-9-7691-2009, 2009.
Yu, F., Luo, G., and Ma, X.: Regional and global modeling of aerosol optical properties with a size, composition, and mixing state resolved particle microphysics model, Atmos. Chem. Phys., 12, 5719–5736, https://doi.org/10.5194/acp-12-5719-2012, 2012.
Yu, F., Luo, G., Pryor, S. C., Pillai, P. R., Lee, S. H., Ortega, J., Schwab, J. J., Hallar, A. G., Leaitch, W. R., Aneja, V. P., Smith, J. N., Walker, J. T., Hogrefe, O., and Demerjian, K. L.: Spring and summer contrast in new particle formation over nine forest areas in North America, Atmos. Chem. Phys., 15, 13993–14003, https://doi.org/10.5194/acp-15-13993-2015, 2015.
Yu, F., Luo, G., Nadykto, A. B., and Herb, J.: Impact of temperature dependence on the possible contribution of organics to new particle formation in the atmosphere, Atmos. Chem. Phys., 17, 4997–5005, https://doi.org/10.5194/acp-17-4997-2017, 2017.
Yu, F., Nadykto, A. B., Herb, J., Luo, G., Nazarenko, K. M., and Uvarova, L. A.: ternary ion-mediated nucleation (TIMN): kinetic-based model and comparison with CLOUD measurements, Atmos. Chem. Phys., 18, 17451–17474, https://doi.org/10.5194/acp-18-17451-2018, 2018.
Yu, H., Haller, A. G., You, Y., Sedlacek, A., Springston, S., Kanawade, V. P., Lee, Y.-N., Wang, J., Kuang, C., McGraw, R. L., McCubbin, I., Mikkala, J., and Lee, S.-H.: Sub-3 nm particles observed at the coastal and continental sites in the United States, J. Geophys. Res., 119, 860–879, https://doi.org/10.1002/2013JD020841, 2014.