the Creative Commons Attribution 4.0 License.
the Creative Commons Attribution 4.0 License.
 | 02 Mar 2020
Trends and source apportionment of aerosols in Europe during 1980–2018
Yang Yang
Sijia Lou
Hailong Wang
Pinya Wang
Hong Liao
Aerosols have significantly affected health, environment, and climate in Europe. Aerosol concentrations have been declining since the 1980s in Europe, mainly owing to a reduction of local aerosol and precursor emissions. Emissions from other source regions of the world, which have been changing rapidly as well, may also perturb the historical and future trends of aerosols and change their radiative impact in Europe. This study examines trends of aerosols in Europe during 1980–2018 and quantifies contributions from 16 source regions using the Community Atmosphere Model version 5 with Explicit Aerosol Source Tagging (CAM5-EAST). The simulated near-surface total mass concentration of sulfate, black carbon, and primary organic carbon had a 62 % decrease during 1980–2018. The majority of which was contributed to reductions of local emissions in Europe, and 8 %–9 % was induced by a decrease in emissions from Russia–Belarus–Ukraine. With the decreases in the fractional contribution of local emissions, aerosols transported from other source regions are increasingly important for air quality in Europe. During 1980–2018, the decrease in sulfate loading led to a warming effect of 2.0 W m−2 in Europe, with 12 % coming from changes in non-European sources, especially from North America and Russia–Belarus–Ukraine. According to the Shared Socioeconomic Pathways (SSP) scenarios, contributions to the sulfate radiative forcing over Europe from both local European emissions and non-European emissions should decrease at a comparable rate in the next 3 decades, suggesting that future changes in non-European emissions are as important as European emissions for causing possible regional climate change associated with aerosols in Europe.
- Article
(7660 KB) - Full-text XML
-
Supplement
(1446 KB) - BibTeX
- EndNote


Aerosols are the main air pollutants that contribute to excess morbidity and premature mortality by damaging cardiovascular and respiratory systems (Lelieveld et al., 2019). They also have adverse effects on atmospheric visibility for road and air traffic (Vautard et al., 2009). During the 1952 London Great Smog, air pollution associated with extremely high level of aerosols caused thousands of premature deaths (Bell and Davis, 2001), which resulted in a number of air quality legislative changes for reducing air pollution in Europe (Brimblecombe, 2006).
Besides the health and environment effects, aerosols can significantly impact regional and global climate by perturbing the Earth's radiation fluxes and influencing cloud microphysics (Boucher et al., 2013). Globally, anthropogenic aerosols exert a net cooling effect in the Earth system and have dampened the warming driven by greenhouse gases since the preindustrial era. Due to a strong surface albedo feedback over polar regions, the per unit aerosol emission from western Europe was reported to have a greater cooling effect than any other major source regions of the globe (Persad and Caldeira, 2018), revealing the importance of understanding aerosol variations in Europe.
Significant reductions in near-surface aerosol concentrations and aerosol optical depth (AOD) have been observed in Europe during the last few decades from long-term station measurements and satellite retrievals (de Meij et al., 2012; Tørseth et al., 2012). The decrease in aerosols has been considered as a cause of the increase in surface solar radiation over Europe since the 1980s (Wild, 2009), as well as a contributor to the eastern European warming (Vautard et al., 2009), Arctic amplification (Acosta Navarro et al., 2016), and increased atmospheric visibility over Europe (Stjern et al., 2011) during the past 3 decades.
The decrease in aerosols over Europe was mainly attributed to continuous reductions in local European anthropogenic emissions of aerosols and precursor gases since the 1980s (Smith et al., 2011), which are a result of legislation for improving air quality. In addition to local emissions, aerosol levels can also be affected by aerosol transport at continental scales (Zhang et al., 2017; Yang et al., 2018a). Aerosol emissions in major economic regions of the world have been changing rapidly during the past few decades owing to economic development and environmental measures. North America has started reducing emissions since the 1980s, and emissions in Russia also showed decreasing trends after the dissolution of the Soviet Union (Smith et al., 2011). In the meantime, aerosol emissions from East Asia and South Asia have largely increased due to economic growth, although emissions in China have been undergoing a remarkable reduction in recent years as a result of strict air quality regulations (Streets et al., 2000; Li et al., 2017). It is important to understand the relative roles of local emissions and regional transport in affecting long-term variations in aerosols in Europe from both air quality and climate perspectives.
Source apportionment is useful for quantifying contributions to aerosols from specific source regions and/or sectors and is beneficial to the emission control strategies. The traditional method of examining the source–receptor relationship in aerosol models is to zero out or perturb a certain percent of emissions from a given source region or sector in parallel sensitivity simulations along with a baseline simulation, and it has been used in many studies to examine source contributions of particulate matter (PM) in Europe from different sectors (e.g., Sartelet et al., 2012; Tagaris et al., 2015; Aksoyoglu et al., 2016). Recently, source region contributions to European CO and O3 levels, as well as global and regional aerosol radiative forcing, were examined under the Hemispheric Transport of Air Pollution model experiment phase 2 (HTAP2) protocol, in which sensitivity simulations were conducted with reductions in anthropogenic emissions from different source regions by 20 % (Stjern et al., 2016; Jonson et al., 2018). This method suffers from a large computational cost for the excessive model simulations when estimating contributions from a large number of sources, and contributions from all sources do not sum up to 100 % of the total concentration in the default simulation (Koo et al., 2009; Wang et al., 2014).
The explicit aerosol tagging method, which simultaneously tracks contributions from many different sources, is a useful tool for assessing the source–receptor relationship of aerosols. This method has previously been adopted in regional air quality models such as CAMx (the Comprehensive Air quality Model with Extensions) and CMAQ (the Community Multiscale Air Quality model). Using regional air quality models with aerosol tagging, contributions from different source sectors and local/regional sources to European PM and its health impact were studied (Brandt et al., 2013; Skyllakou et al., 2014; Karamchandani et al., 2017). However, due to the limitation in domain size of regional air quality models, contributions of intercontinental transport from sources outside the domain are difficult to account for.
Anthropogenic emissions of aerosols and their precursor gases from different economic regions of the world have changed substantially during the past few decades. Very few studies have examined the source apportionment of aerosols in Europe coming from sources all over the changing world. In this study, source attributions of concentrations, column burden, optical depth of aerosols in four major areas of Europe from 16 source regions of the globe over 1980–2018 are quantified. This is facilitated by the explicit aerosol source tagging technique that was recently implemented in a global aerosol–climate model (CAM5-EAST; Community Atmosphere Model version 5 with Explicit Aerosol Source Tagging). This technique has lately been used to examine the source attribution of aerosol trends in China and the United States during 1980–2014 (Yang et al., 2018a, b). The source apportionment analysis is extended to the year 2018 using the Shared Socioeconomic Pathways (SSPs) scenario, with a focus on Europe here.
The CAM5-EAST model, along with the aerosol source tagging technique, and aerosol emissions are described in Sect. 2. Section 3 evaluates the model performance in simulating aerosols in Europe. Section 4 shows the analysis of source–receptor relationships of aerosols in Europe on a climatological average. Source contributions to long-term variations in European aerosols and their direct radiative forcing (DRF) during 1980–2018, as well as future forcing prediction, are provided in Sect. 5. Section 6 summarizes these results and conclusions.
2.1 Model description and experimental setup
The global aerosol–climate model CAM5 (Community Atmosphere Model version 5), which was developed as the atmospheric component of CESM (the Community Earth System Model; Hurrell et al., 2013), is applied to simulate aerosols at a spatial resolution of 1.9∘ latitude × 2.5∘ longitude, and 30 vertical layers from the surface to 3.6 hPa. Aerosol species, including sulfate, black carbon (BC), primary organic aerosol (POA), second organic aerosol (SOA), mineral dust, and sea salt, can be simulated in a modal aerosol module of CAM5. The three-mode aerosol module (MAM3) configuration is chosen with consideration for the computational efficiency of long-term simulation. Details of the MAM3 aerosol representation in CAM5 are described in Liu et al. (2012). On top of the default CAM5, some aerosol-related scheme modifications are utilized to improve the model performance for aerosol convective transport and wet deposition (Wang et al., 2013).
A 40-year (1979–2018), historical Atmospheric Model Intercomparison Project (AMIP)-type simulation has been performed, following CMIP6 (the Coupled Model Intercomparison Project Phase 6) configurations and forcing conditions. Time-varying sea surface temperatures, sea ice concentrations, solar insolation, greenhouse gas concentrations, and aerosol emissions are prescribed in the simulation. To better reproduce large-scale circulation patterns for aerosol transport in the model, wind fields are nudged with the MERRA-2 (Modern-Era Retrospective analysis for Research and Applications, Version 2) reanalysis (Gelaro et al., 2017).
Aerosol DRF is defined in this study as the difference in clear-sky radiative fluxes at the top of the atmosphere between two diagnostic calculations in the radiative transfer scheme, with and without specific aerosol species accounted for, respectively. Historical variations in sulfate DRF due to anthropogenic emissions from Europe and outside Europe are quantified in this study. Rather than sulfate, DRF of other aerosol species is not calculated in this study due to the computational limitation considering multiple source regions. However, because sulfate dominates the decrease in total combustion AOD in Europe, shown below, the sulfate DRF is calculated to roughly represent the DRF caused by the total combustion AOD change. Future DRF of sulfate aerosols over Europe is also estimated by scaling the historical mean (1980–2018) sulfate DRF by the ratio of SSPs future SO2 emissions (Riahi et al., 2017) to historical emissions and assuming a linear response of DRF to AOD and regional emissions. This DRF prediction method has been used to estimate the East Asian contribution to sulfate DRF in the United States in the 2030s (Yang et al., 2018a).
2.2 Aerosol source tagging technique
The Explicit Aerosol Source Tagging (EAST) technique, which was recently implemented in CAM5 (Wang et al., 2014; Yang et al., 2017a, b), is used to examine the long-term source apportionment of aerosols in Europe. Unlike the traditional back-trajectory and emission perturbation methods, EAST has the identical physical, chemical, and dynamical processes considered independently for aerosol species (defined as new tracers) emitted from each of the tagged source regions and/or sectors in the simulation. Sulfate, BC, POA, and SOA from predefined sources can be explicitly tracked, from emission to deposition, in one CAM5-EAST simulation. Due to the computational constraint and potentially large model bias from the simplified SOA treatment (Yang et al., 2018a), we focus on sulfate, BC, and POA in this study but quantify the potential impact of SOA on the aerosol variation.
The global aerosol and precursor emissions are decomposed into 16 source regions defined in the HTAP2 protocol, including Europe (EUR), North America (NAM), Central America (CAM), South America (SAM), northern Africa (NAF), southern Africa (SAF), the Middle East (MDE), southeast Asia (SEA), central Asia (CAS), South Asia (SAS), East Asia (EAS), Russia–Belarus–Ukraine (RBU), Pacific–Australia–New Zealand (PAN), the Arctic (ARC), Antarctic (ANT), and non-Arctic/Antarctic ocean (OCN) (Fig. 1). Note that sources from marine and volcanic eruptions are included in OCN. The focused receptor region in this study is Europe, which is further divided into northwestern Europe (NWE or NW Europe), southwestern Europe (SWE or SW Europe), eastern Europe (EAE or E Europe), and Greece–Turkey–Cyprus (GTC) based on the finer source region selection in HTAP2.

Figure 1Source regions that are selected for the Explicit Aerosol Source Tagging (EAST) in this study, including Europe (EUR), North America (NAM), Central America (CAM), South America (SAM), northern Africa (NAF), southern Africa (SAF), the Middle East (MDE), southeast Asia (SEA), central Asia (CAS), South Asia (SAS), East Asia (EAS), Russia–Belarus–Ukraine (RBU), Pacific–Australia–New Zealand (PAN), the Arctic (ARC), Antarctic (ANT), and non-Arctic/Antarctic ocean (OCN). The embedded panel (at bottom left) is Europe, as the receptor region, which is further divided to northwestern Europe (NWE), southwestern Europe (SWE), eastern Europe (EAE), and Greece–Turkey–Cyprus (GTC).
2.3 Aerosol and precursor emissions
Following the CMIP6-AMIP protocol, historical anthropogenic (Hoesly et al., 2018) and biomass burning (van Marle et al., 2017) emissions of aerosol and precursor gases are used for 1979–2014. For the remaining 4 years (2015–2018), emissions are interpolated from the SSP2-4.5 forcing scenario, in which aerosol pathways are not as extreme as other SSPs and have been used in many model intercomparison projects for CMIP6 (O'Neill et al., 2016). Figure S1 in the Supplement shows the spatial distribution and time series of anthropogenic emissions of SO2 (precursor gas of sulfate aerosol), BC, and POA from Europe for 1980–2018. High emissions are located over E Europe and NW Europe, from which the emissions of SO2, BC, and POA were reduced by 84 %–93 %, 43 %–62 %, and 28 %–36 %, respectively, in 2014–2018 relative to 1980–1984. Although SW Europe had a relatively low total amount of emissions compared to E Europe and NW Europe, it had significant reductions in SO2 and BC emissions, 91 % and 55 %, respectively. Over the GTC region, SO2 and BC emissions were increased by 49 % and 48 %, respectively. Considering the subregions as a whole, SO2, BC, and POA emissions from Europe have decreased by 12.57 Tg yr−1 (83 %), 0.22 Tg yr−1 (46 %), and 0.30 Tg yr−1 (24 %) in 2014–2018 compared to 1980–1984 (Table 1). Historical changes in emissions from other source regions can be found in Hoesly et al. (2018) and Yang et al. (2018b).
Table 1Annual emission (in teragrams per year), concentration (in micrograms per cubic meter), column burden (in milligrams per square meter), AOD (scaled up by a factor of 100), and DRF (in watts per square meter) of sulfate, BC, POA, SBP (sulfate-BC-POA), and SBP-SOA (sulfate-BC-POA-SOA) in Europe averaged over 1980–1984 and 2014–2018, as well as the differences between 1980–1984 and 2014–2018. Differences in percentage relative to mean values in 1980–1984 are presented in parentheses.

EMEP (European Monitoring and Evaluation Programme, http://www.emep.int, last access: 27 February 2020) networks provide daily near-surface aerosol concentrations in Europe. The annual mean of daily observations is used to evaluate the model performance in this study. Compared to the observational data from EMEP networks during 2010–2014, CAM5-EAST can reproduce well the spatial distribution and magnitude of aerosol components with normalized mean biases (NMBs) of −14 % to −23 % and correlation coefficients (R) in a range of 0.43–0.62 for sulfate, BC, and organic carbon (OC; derived from POA and SOA from the model results) (Fig. 2).

Figure 2Spatial distribution of simulated (contour) and observed (color-filled circles) annual mean near-surface (a) sulfate, (b) BC, and (c) OC – derived as (POA + SOA)/1.4 in model – concentrations (in micrograms per cubic meter) for 2010–2014. Observations are from EMEP (European Monitoring and Evaluation Programme) networks. Normalized mean bias, , and correlation coefficient (R) between observed and simulated concentrations are noted at the top of each panel.
Figure 3 shows the time series of annual mean near-surface sulfate, BC, and OC concentrations averaged over EMEP sites in Europe and the corresponding model values during 1993–2018. Variations in near-surface sulfate concentrations are consistent between the model and observations, with R values higher than 0.9. The observed variations in BC and OC concentrations in Europe are represented in the simulation, with R values of 0.52 and 0.65, respectively. However, the observed high values of BC and OC concentrations are not captured by the model, probably because very few data were available before 2010, and, therefore, any difference between model and observation cannot be smoothed out through the spatial average. This is also indicated by the large spatial variation in BC and OC concentrations before 2010. Nevertheless, the modeled concentrations are still within the range of observations. Note that the number of sites used for the spatial average in Fig. 3 is different from year to year, and thus the variation or trend here does not represent that over a subregion or the entire Europe.
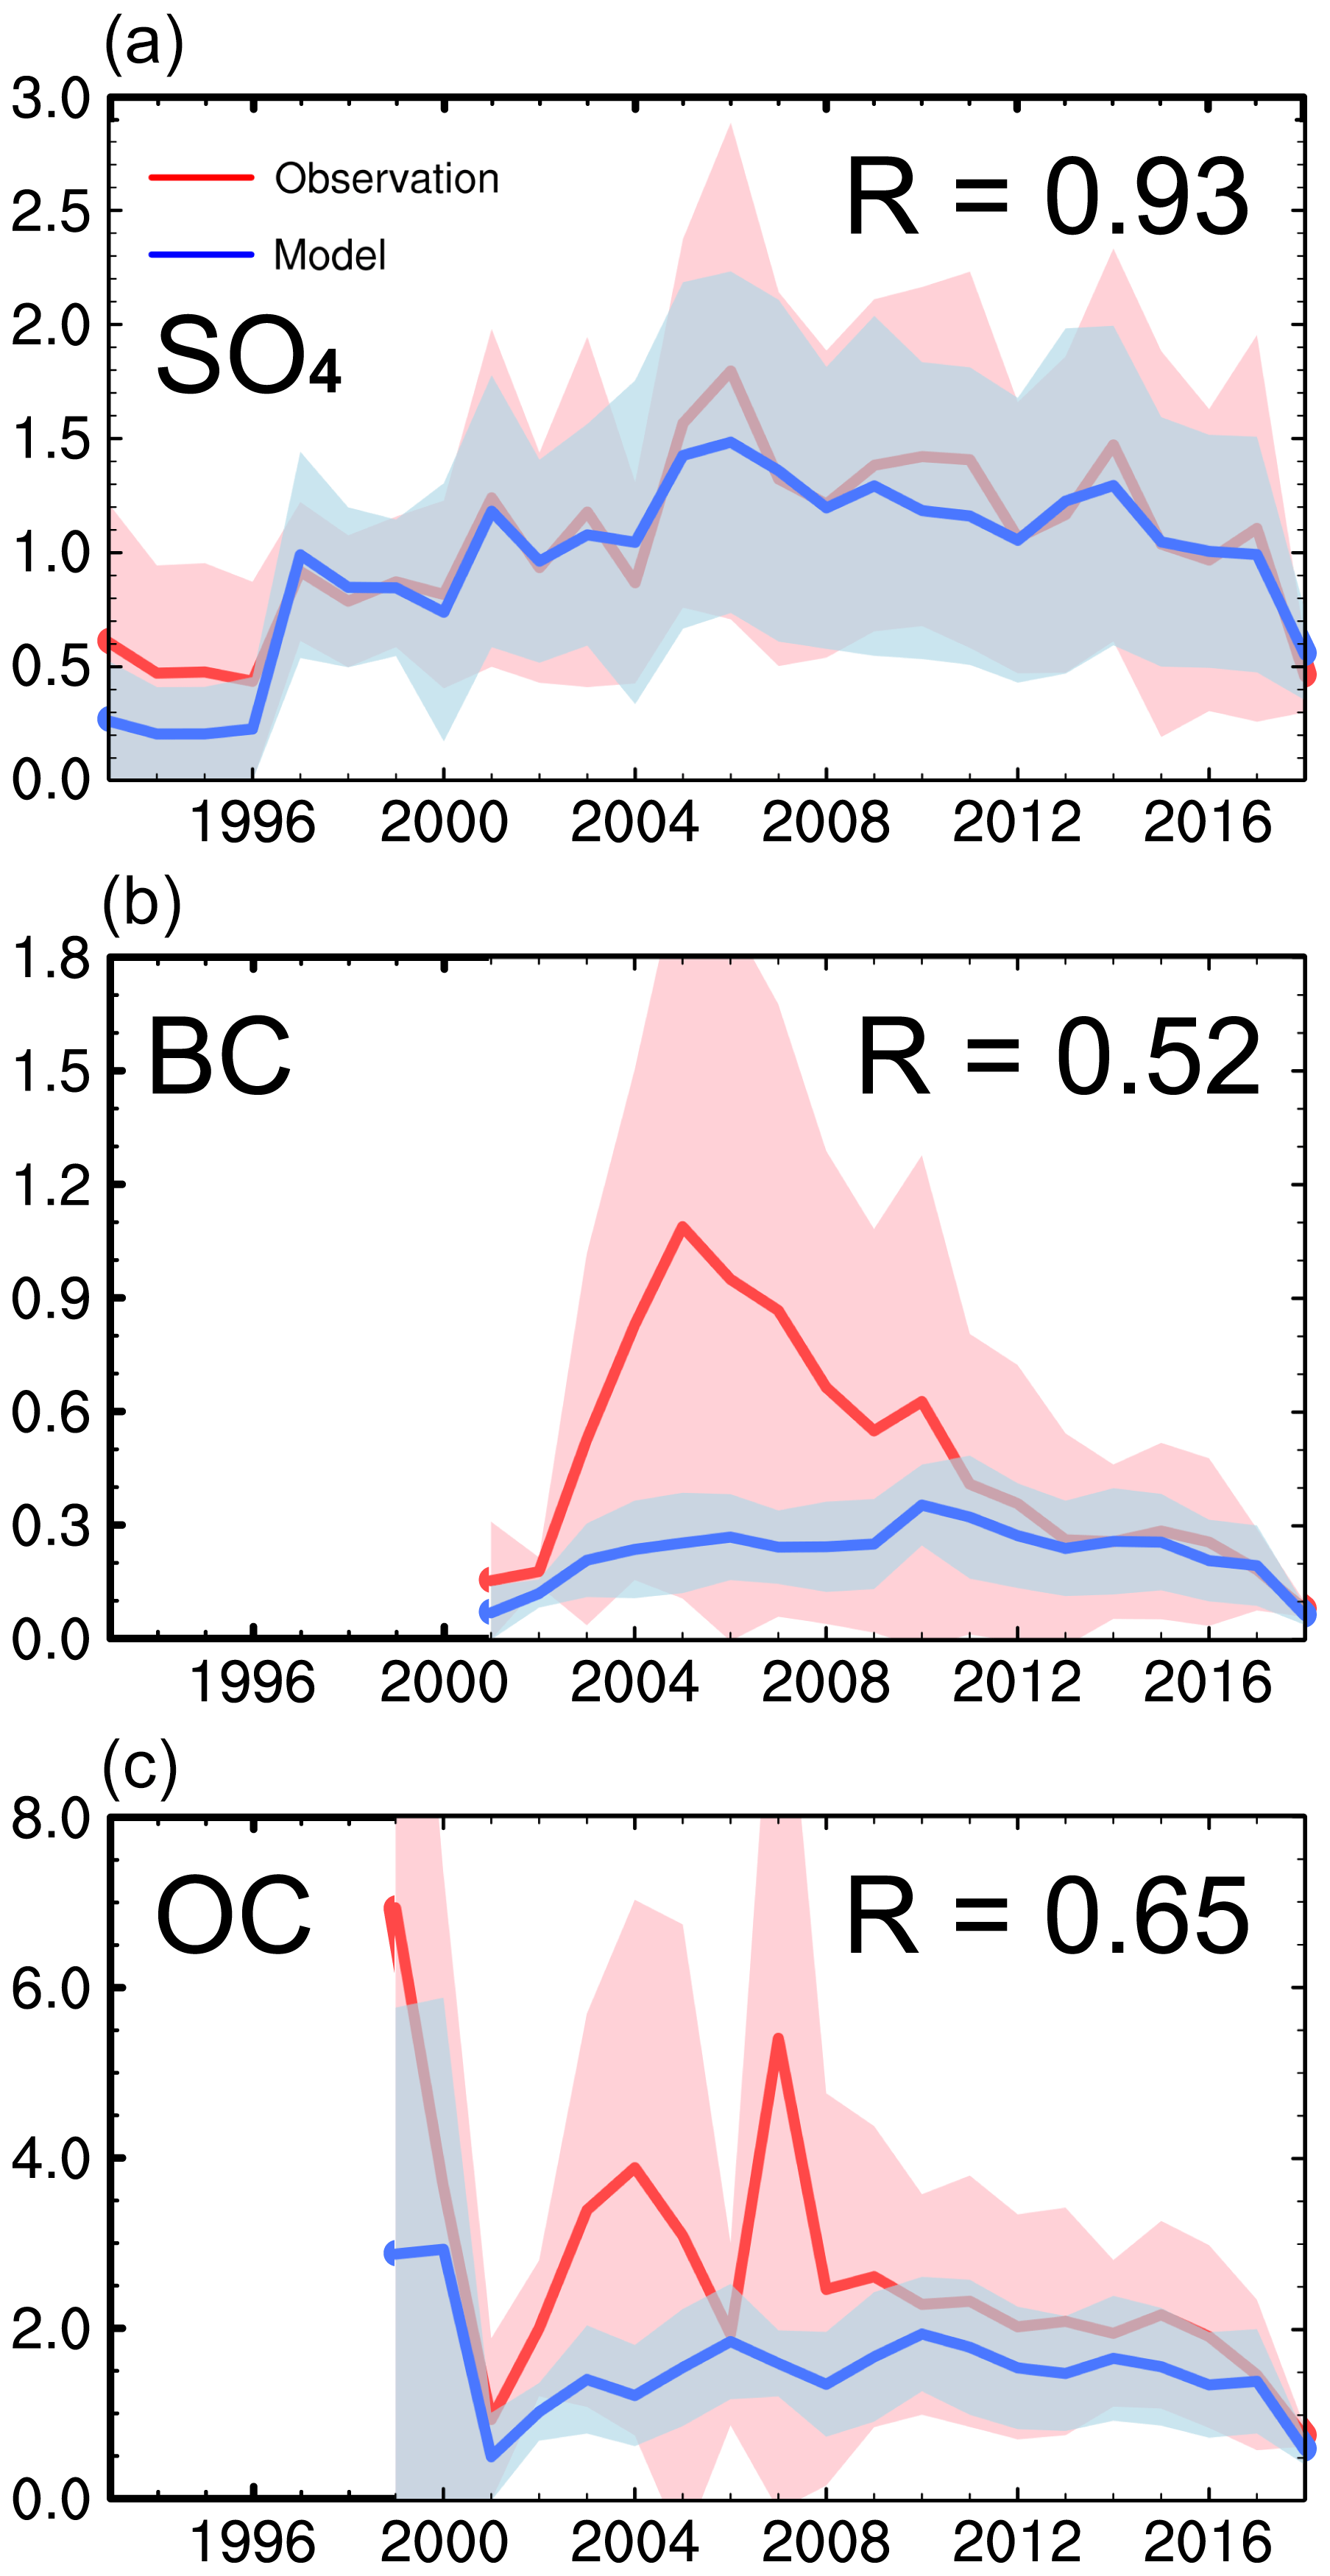
Figure 3Time series (1993–2018) of spatial and annual mean near-surface (a) sulfate, (b) BC, and (c) OC concentrations (in micrograms per cubic meter) in Europe from model simulation (blue lines) and observations (red lines). Model results are plotted only when EMEP observational data are available. Shaded areas represent 1σ spatial standard deviation of annual mean concentrations for each year. Temporal correlation coefficients (R) between observed and simulated spatially averaged concentrations are noted in the top-right corner of each panel.
The modeled AOD is evaluated against the AERONET (Aerosol Robotic Network; https://aeronet.gsfc.nasa.gov, last access: 27 February 2020) data in Fig. 8. Both the modeled and observed AOD show decreasing trends during 2001–2018. The model underestimates AOD in all four subregions of Europe, probably due to the lack of nitrate aerosol. The variations in AOD in western Europe (combined NW and SW Europe) are well predicted, with R values of about 0.75, but the model barely reproduces the AOD variations in E Europe and the GTC region (R<0.5). The difference in the interannual variation in AOD between the model simulation and observation can be caused by many factors such as aerosol emissions, aerosol parameterizations in the model, the aerosol mixing state, inaccurate meteorological fields from reanalysis data, and biases in measurements. However, identifying the contribution of each factor to the difference is beyond the scope of this paper.
Based on the tagging technique in CAM5-EAST, near-surface concentrations of total sulfate-BC-POA can be attributed to emissions within and outside Europe, as shown in Fig. 4a and b, and the relative contributions in percentage are given in Fig. 4c and d. Averaged over 2010–2018, due to the relatively high local emissions, annual mean sulfate-BC-POA concentrations contributed to by European emissions show peak values of 4 µg m−3 in E Europe. The slight increase in SO2 emission from the GTC region (Fig. S1), which is opposite to the decreases in the other three subregions of Europe, also leads to high concentrations in GTC, with 2–4 µg m−3 contributed by European emissions. Due to the atmospheric transport from surrounding regions including northern Africa, the Middle East, and Russia–Belarus–Ukraine, non-European emissions account for 0.5–1 µg m−3 over SW Europe, E Europe, and the GTC area. Overall, local European emissions are the dominant sources of sulfate-BC-POA near-surface concentrations in Europe, with contributions larger than 80 % (60 %) in central areas (most of Europe). Non-European emissions are responsible for 30 %–50 % of the near-surface concentrations near the coastal areas and boundaries of the Europe that are easily influenced by aerosol regional transport.
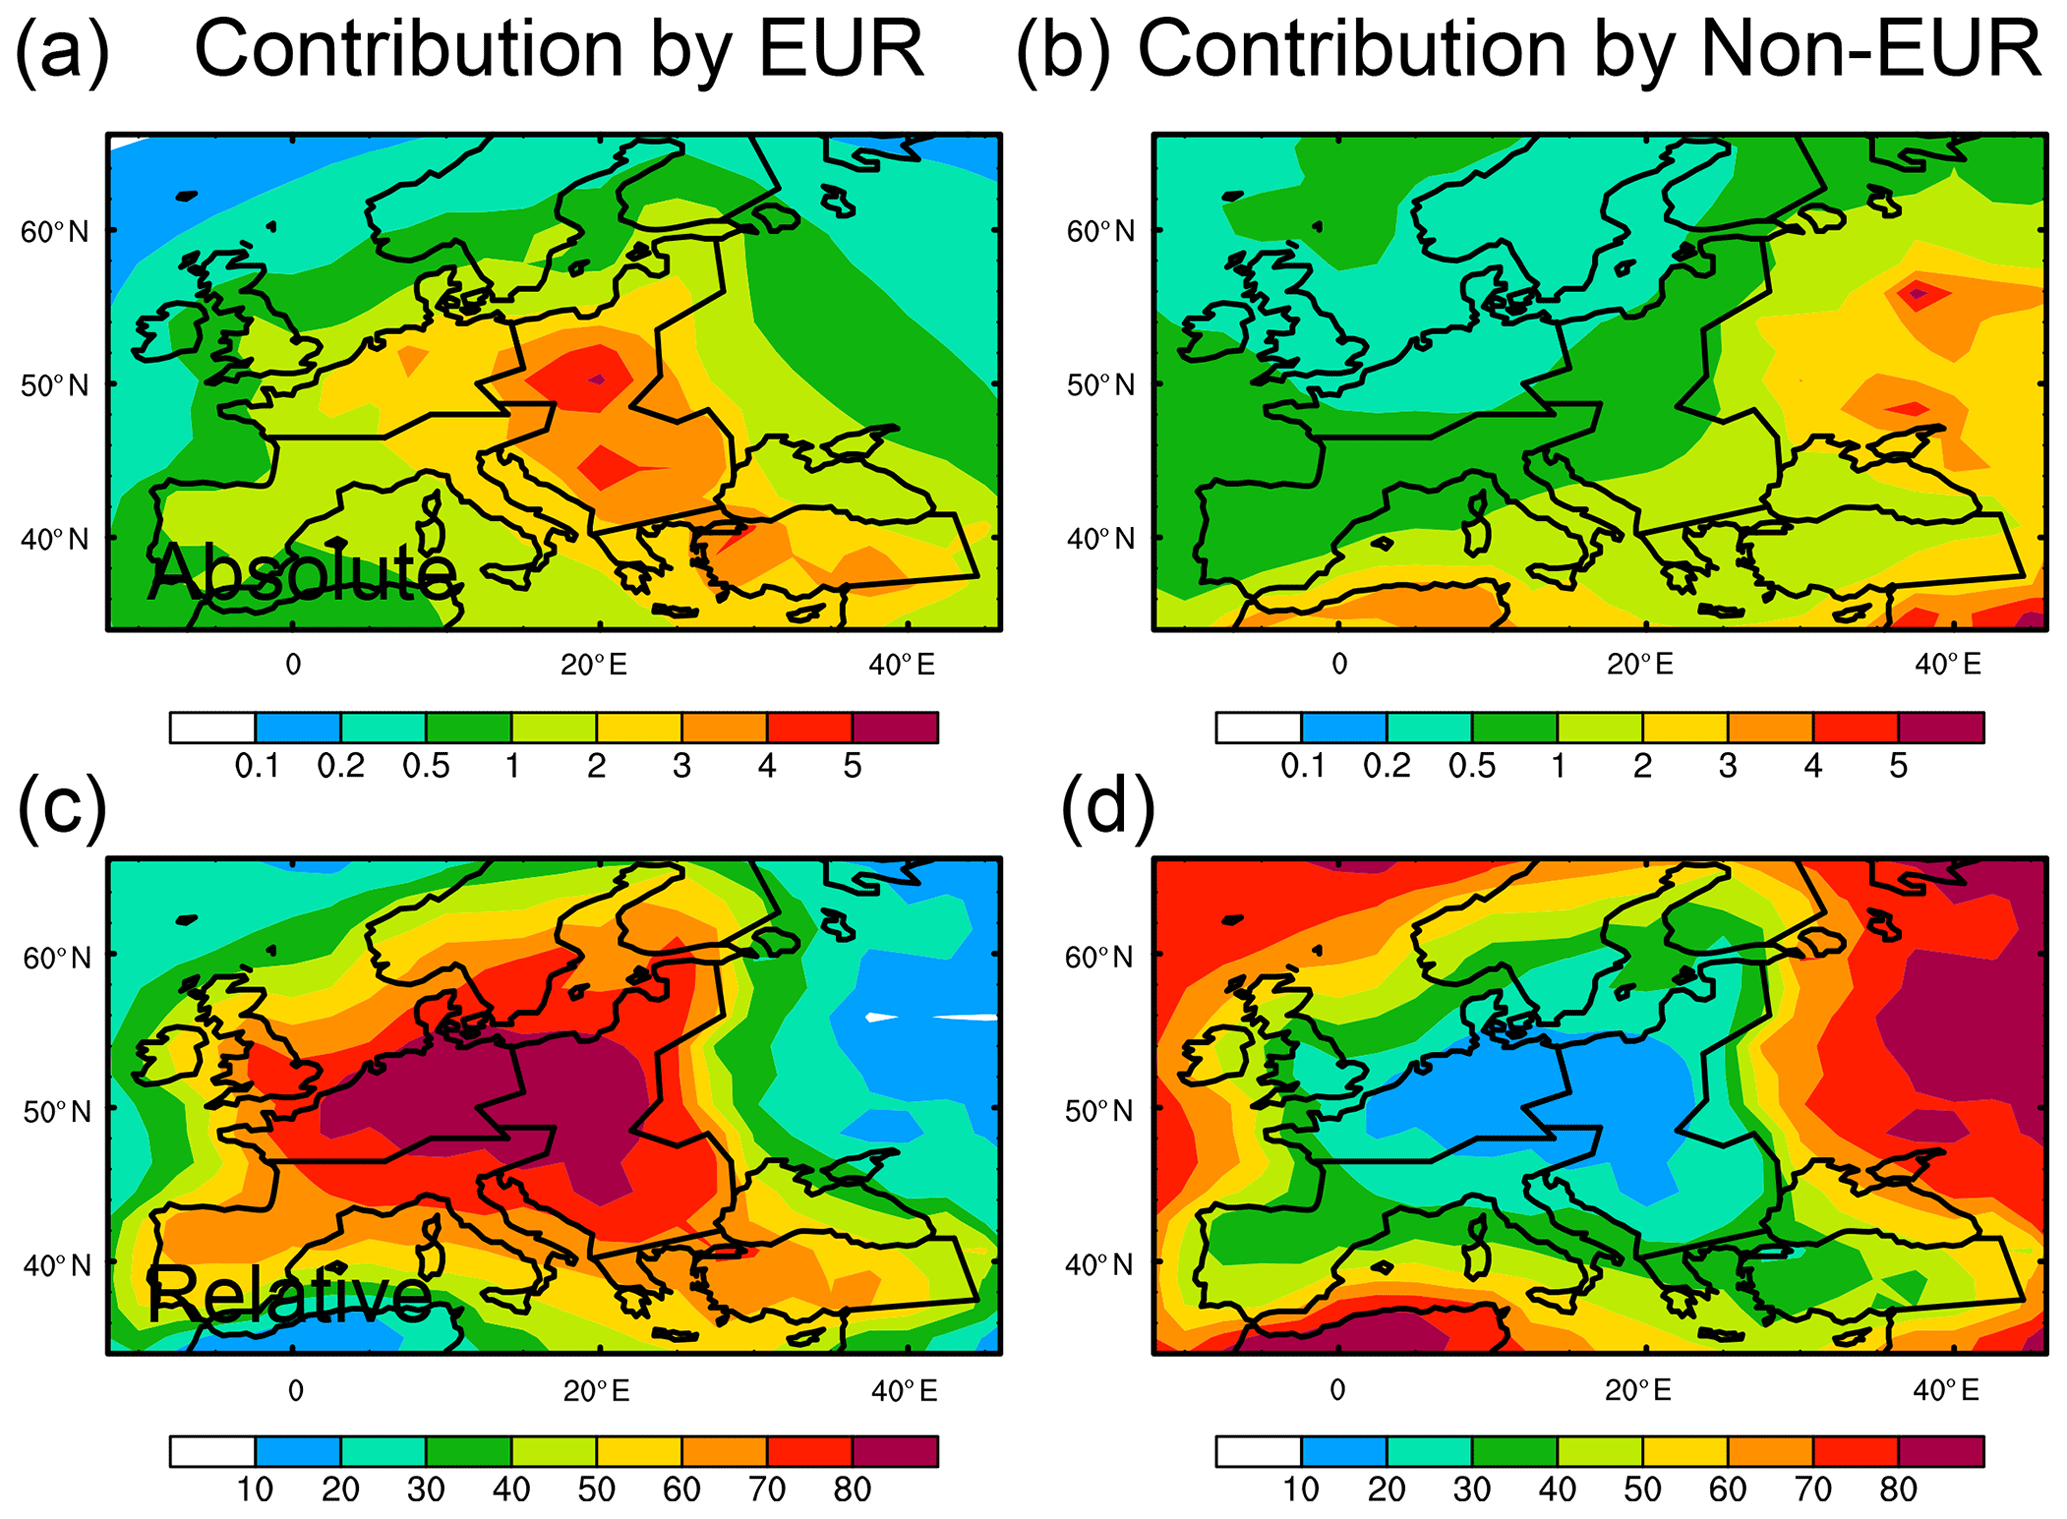
Figure 4(a, b) Absolute (in micrograms per cubic) and (c, d) relative contributions (in percent) to annual mean near-surface concentrations of sulfate-BC-POA from local European emissions (EUR) and emissions outside the Europe (Non-EUR), respectively, averaged over 2010–2018.
Figure 5 illustrates the source contributions in percentage of emissions from different regions of the globe to near-surface aerosol concentrations and column burdens over the four subregions of Europe averaged over 2010–2018. Different aerosols have fairly different local/remote source attributions depending on the local to remote emission ratio and transport efficiency. European emissions explain 54 %–68 % of near-surface sulfate concentrations over the four subregions of Europe, with the largest local contribution in E Europe due to the relatively high emission rate. The emissions from Europe dominate BC and POA concentrations in Europe, with contributions in the range of 78 %–95 % and 58 %–78 %, respectively. The impact of local emissions on near-surface sulfate concentration is smaller than BC and POA. This is partially due to its less-efficient gas scavenging than the particles and the additional SO2-to-sulfate conversion process that increases the atmospheric residence time of sulfur. On the other hand, the higher initial injection height of SO2 emissions from some sources (e.g., industrial sector and power plants) facilitates the lifting of SO2 and sulfate aerosol into the free atmosphere and, therefore, favors long-range transport (Yang et al., 2019). The efficient reduction of local SO2 emissions in Europe also caused lower influences of local emissions on sulfate concentrations in recent years.
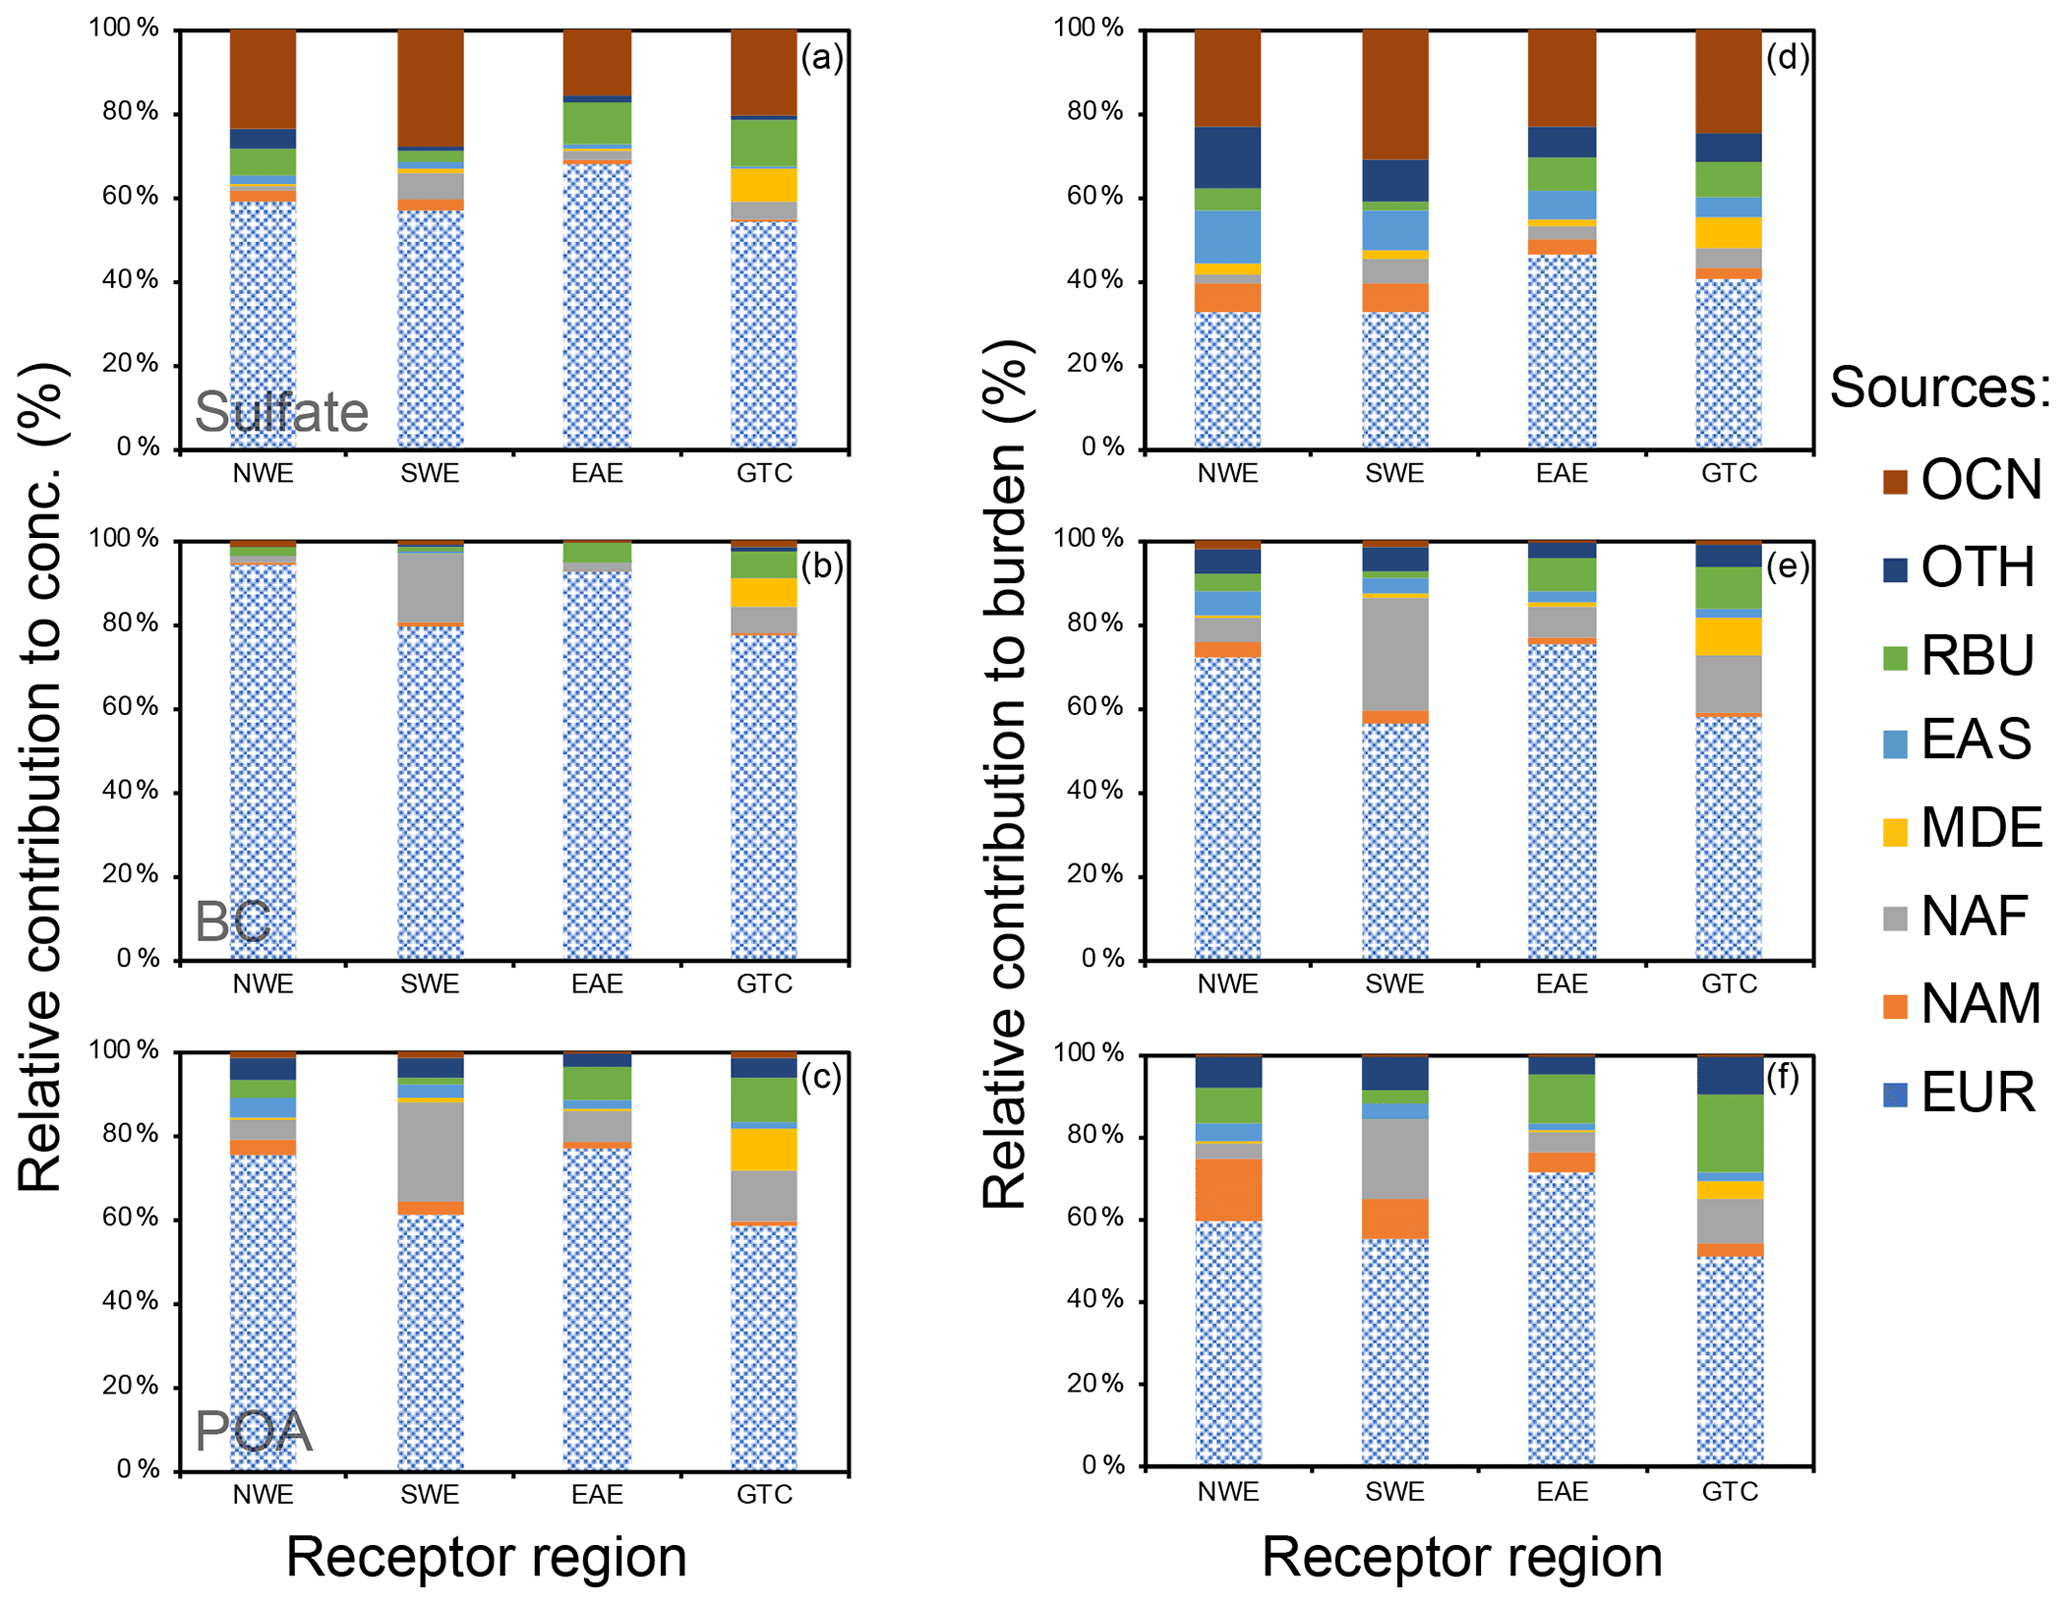
Figure 5Relative contributions (in percent) by emissions from major tagged source regions including Europe (EUR), North America (NAM), northern Africa (NAF), the Middle East (MDE), East Asia (EAS), Russia–Belarus–Ukraine (RBU), non-Arctic/Antarctic ocean (OCN), and other (OTH) regions to near-surface concentrations (a, b, c) and column burdens (d, e, f) of sulfate, BC, and POA (from top to bottom) in the four subregions of Europe, averaged over 2010–2018. Patterned areas represent local EUR contributions.
Anthropogenic emissions over oceans (e.g., international shipping) and natural emissions of oceanic dimethyl sulfide (DMS) and volcanic activities together account for 16 %–28 % of near-surface sulfate concentrations in the four subregions of Europe. About 10 % of sulfate and 5 %–10 % of BC and POA in E Europe and GTC come from Russia–Belarus–Ukraine emissions. Northern Africa contributes to 7 % of sulfate, 17 % of BC, and 24 % of POA over SW Europe. The contribution of emissions from the Middle East to aerosol concentrations in GTC are between 5 % and 10 %.
The transboundary and intercontinental transports of aerosols occur most frequently in the free troposphere rather than near the surface (Figs. S2 and S3). This also leads to larger relative contributions from non-European sources to aerosol column burdens than to the near-surface concentrations (Fig. 5). The European emissions only contribute 32 %–47 % of column burden of sulfate, 57 %–75 % of BC, and 51 %–71 % of POA over the four subregions of Europe. Over NW Europe and SW Europe, about 10 %–15 % of the sulfate burden is from East Asia and Russia–Belarus–Ukraine, respectively. Sources in northern Africa are responsible for 27 % and 14 % of BC and 19 % and 11 % of POA burden over SW Europe and GTC, respectively. Emissions from North America account for 15 % and 10 % of POA burden over NW Europe and SW Europe, respectively. Emissions from Russia–Belarus–Ukraine explain 12 % and 19 % of POA burden over E Europe and GTC, respectively. Since near-surface aerosol concentrations directly affect air quality and column burden is more relevant to radiative impact, the differences in relative contributions between near-surface concentrations and column burden highlight the possible roles of nonlocal emissions in either air quality or energy balance over Europe.
Source contributions to aerosols in Europe vary with season due to the seasonality of emissions and meteorology. In general, local sources have the largest contributions to both near-surface concentration and column burden of European aerosols in winter and the smallest contributions in summer (averaged over 2010–2018; outer rings in Fig. 6). With the contributions normalized by the ratio of the seasonal anthropogenic emission to the annual mean for each source, the impact of the seasonal variation in emissions on the source contributions can be removed (inner rings in Fig. 6) (Yang et al., 2019). Without the influence of emission seasonality, local source contributions decrease in winter and increase in summer, indicating that it was the higher local anthropogenic emissions that result in the larger local source contributions to wintertime aerosols in Europe relative to other seasons. Sulfur sources over oceans account for one-fourth to one-third of the European sulfate concentration and burden in spring likely due to the strong westerlies in this season that transport aerosols from the North Atlantic Ocean to the Europe. Source contributions from Russia–Belarus–Ukraine and North America to BC and POA in Europe show strong seasonal variabilities, which can be explained by the changes in biomass burning emissions considering their large seasonal variability.

Figure 6Relative contributions (in percent) by emissions from major tagged source regions to near-surface concentrations (conc.) and column burdens of December–January–February (DJF), March–April–May (MAM), June–July–August (JJA), and September–October–November (SON) mean sulfate, BC, and POA over Europe; averaged over 2010–2018. Outer rings represent the modeled values, and the relative contributions in inner rings are calculated based on absolute values normalized by the ratio of seasonal emission to annual mean. Values larger than 5 % are marked.
Total sulfate-BC-POA concentrations decreased during 1980–2018 over all of the four subregions of Europe (Fig. 7) since near-surface aerosol concentrations in Europe are dominated by its local emissions and the European anthropogenic emissions have significantly decreased during this time period. Averaged over the entirety of Europe, near-surface concentrations of sulfate, BC, and POA decreased by 70 %, 43 %, and 23 %, respectively, between 1980–1984 and 2014–2018, which is consistent with the decreases in local emissions (Table 1). The total sulfate-BC-POA concentrations decreased by 62 %. With SOA included, this value does not have a substantial change (from 62 % to 59 %), and the decreasing trends in the four subregions of the Europe are not largely affected either. The column burden of sulfate, BC, POA, and the sum of these three decreased by 60 %, 28 %, 4 %, and 55 %, respectively, which are less than the decreases in corresponding near-surface concentrations. It is because nonlocal emissions have larger influences at high altitudes than at the surface, which partly dampened the contribution of near-surface aerosol decrease (induced by reductions in emissions) to the column integration.
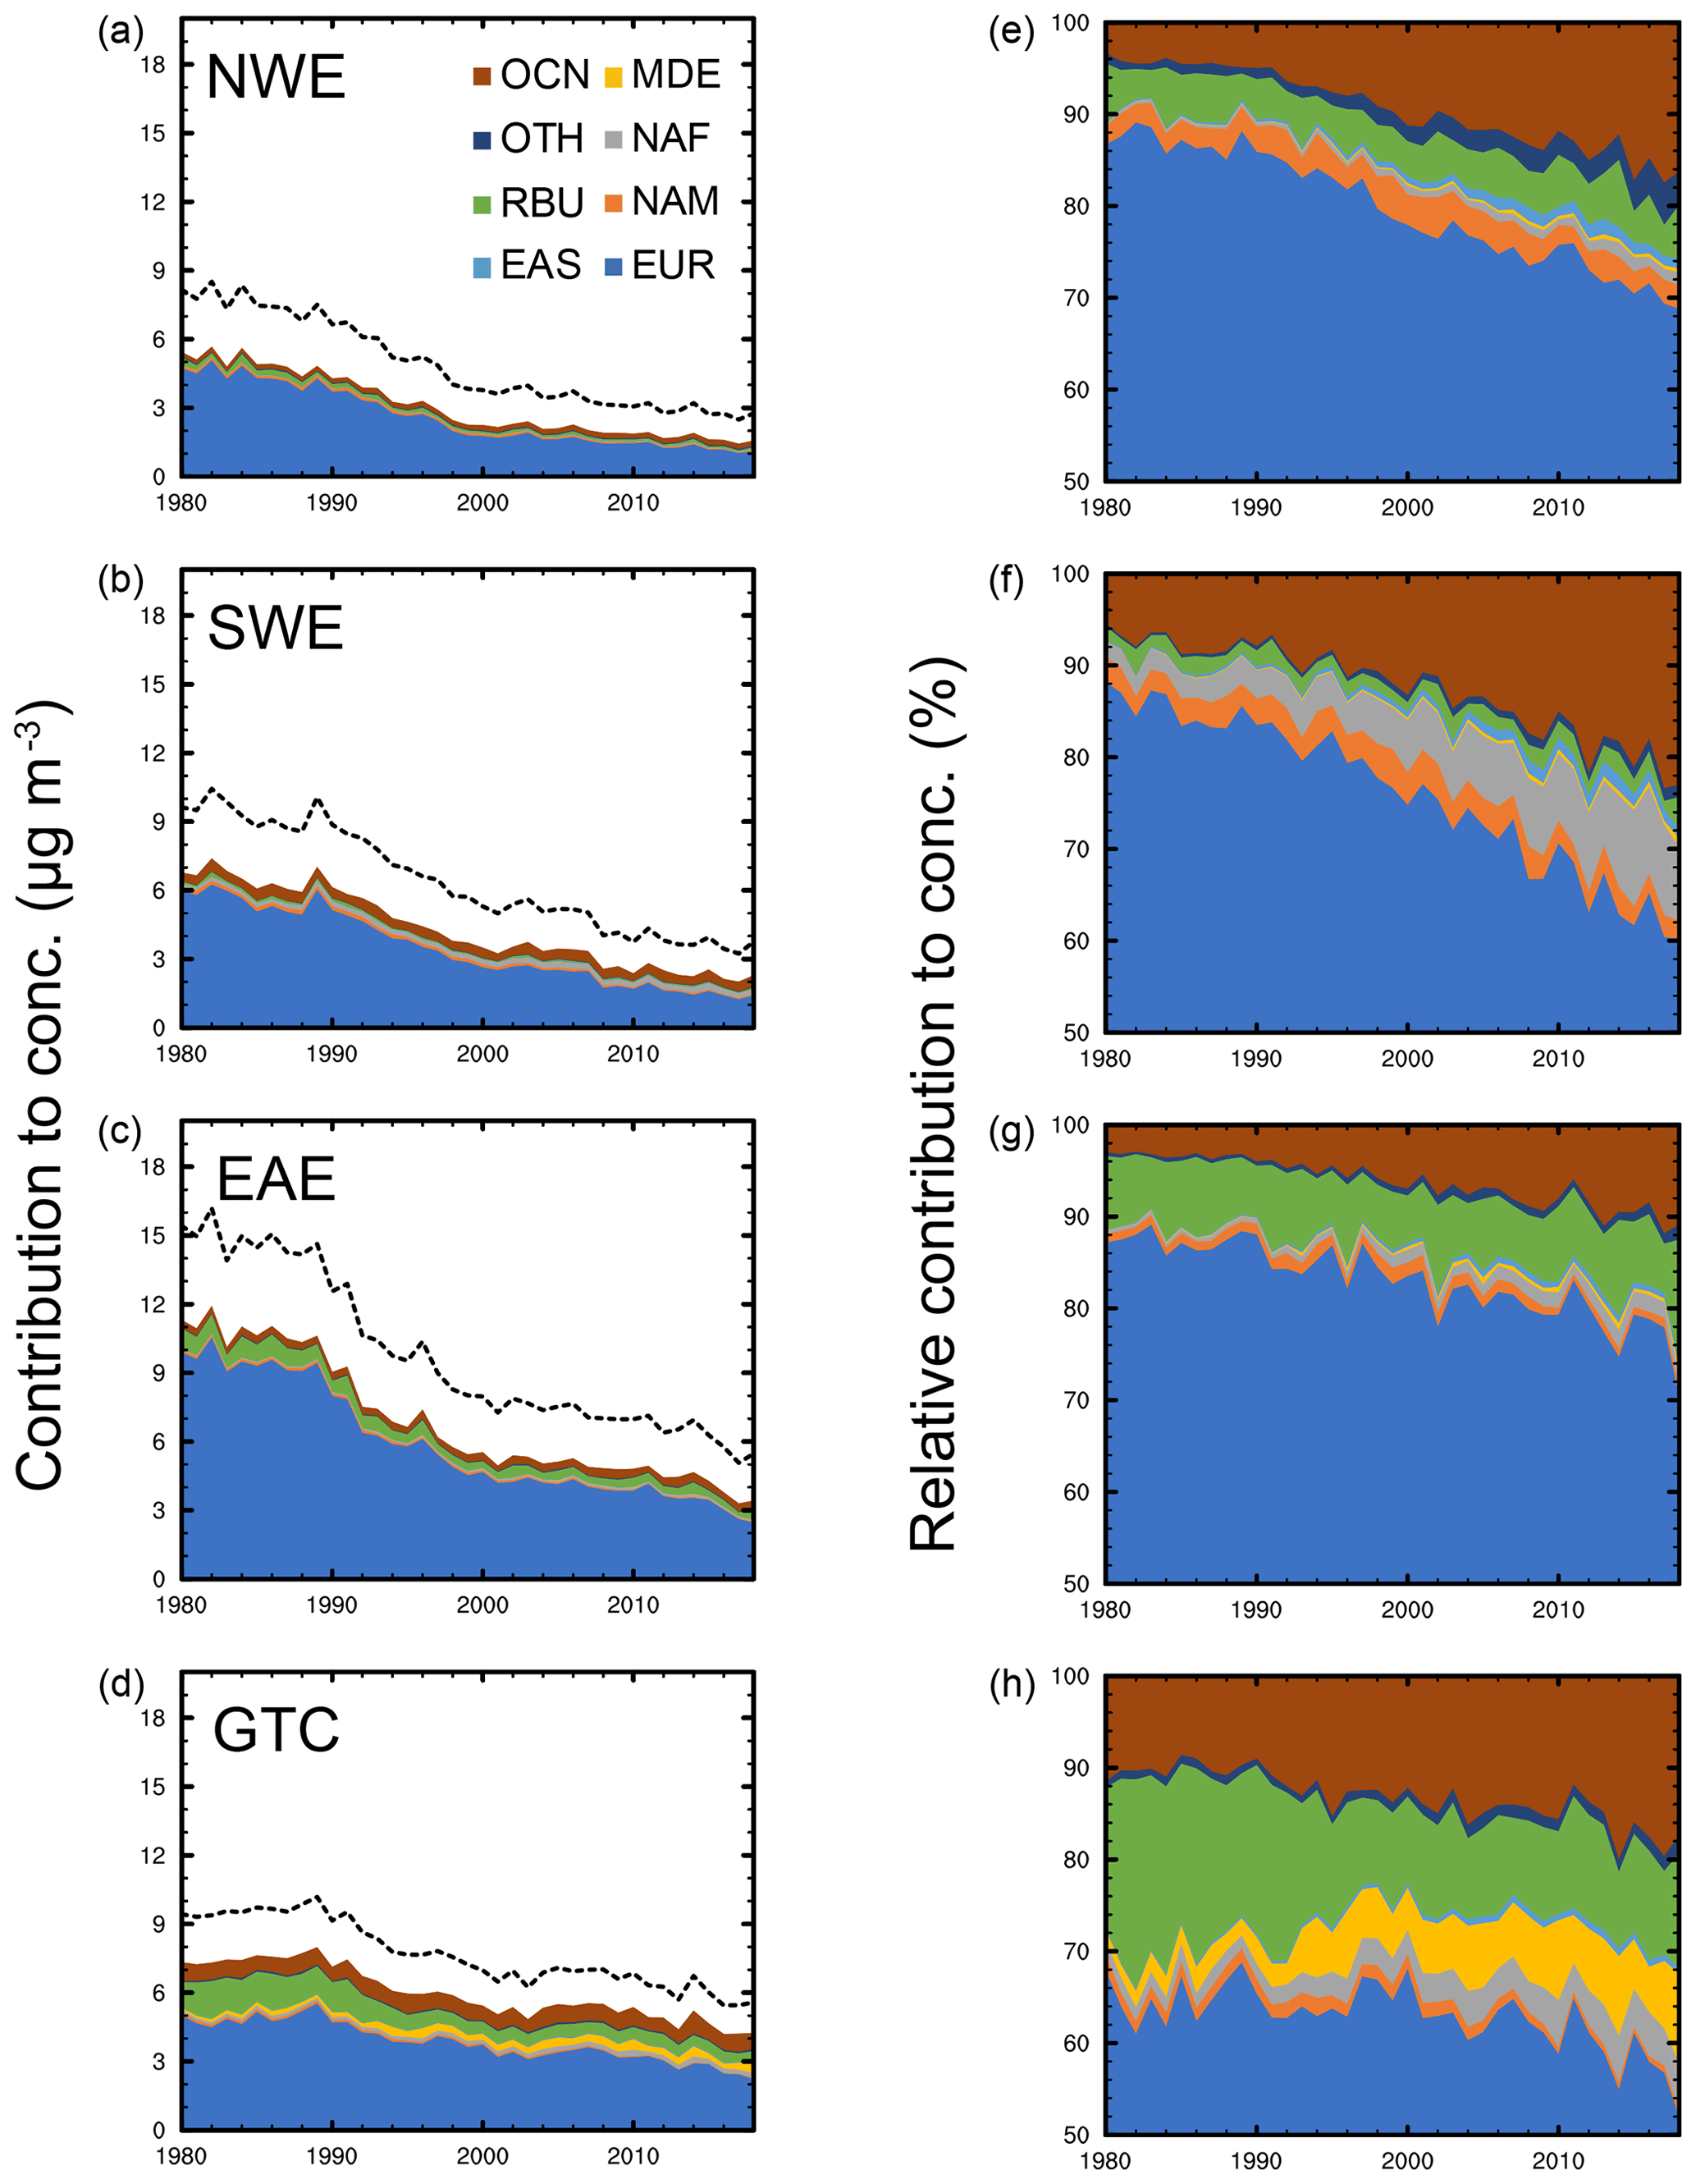
Figure 7Time series (1980–2018) of absolute (a, b, c, and d; in micrograms per cubic meter) and relative (e, f, g, and h; in percent) contributions of emissions from major source regions to the simulated annual mean near-surface sulfate-BC-POA concentrations averaged over the four subregions of Europe. Dashed lines in panels (a–d) represent simulated aerosol concentrations including SOA.
The decrease in local European emissions explains 93 % of the reduced concentration and 91 % of the reduced burden in Europe between the first and last 5-year period of 1980–2018, while 8 %–9 % is contributed by the reduction in emissions from Russia–Belarus–Ukraine (Table 2). The decrease in emissions from North America also explains 10 % of the reduced column burden of sulfate-BC-POA in Europe from 1980–1984 to 2014–2018. Along with the decreases in local emission contributions to near-surface sulfate-BC-POA concentrations in Europe, the fraction of non-European emission contributions increased from 10 %–30 % to 30 %–50 % during 1980–2018 (Fig. 7), indicating that aerosols from foreign emissions have become increasingly important to air quality in Europe through long-range transport. Regulations for further improvement of air quality in Europe in the near future need to take changes in non-European emissions into account.
Table 2Relative contributions (in percent) of emissions from major source regions to the changes in near-surface concentrations, column burden, AOD, and DRF in Europe between 1980–1984 and 2014–2018.

Similar to the declining trend in column burden, simulated total AOD also decreased from 0.12–0.16 to 0.06–0.08 in NW Europe and SW Europe and from 0.19–0.21 to 0.09–0.13 in E Europe and the GTC region during the past 4 decades (Fig. 8). Sulfate AOD accounts for the largest portion of total combustion AOD (sum of sulfate, BC, POA, and SOA) over the four subregions of Europe. The combustion AOD has decreased by 0.065 from 1980–1984 to 2014–2018 (Table 1), with 0.059 (91 %) contributed by the decrease in sulfate AOD. Therefore, we focus on sulfate aerosol when examining the decadal changes in AOD and DRF in Europe below.
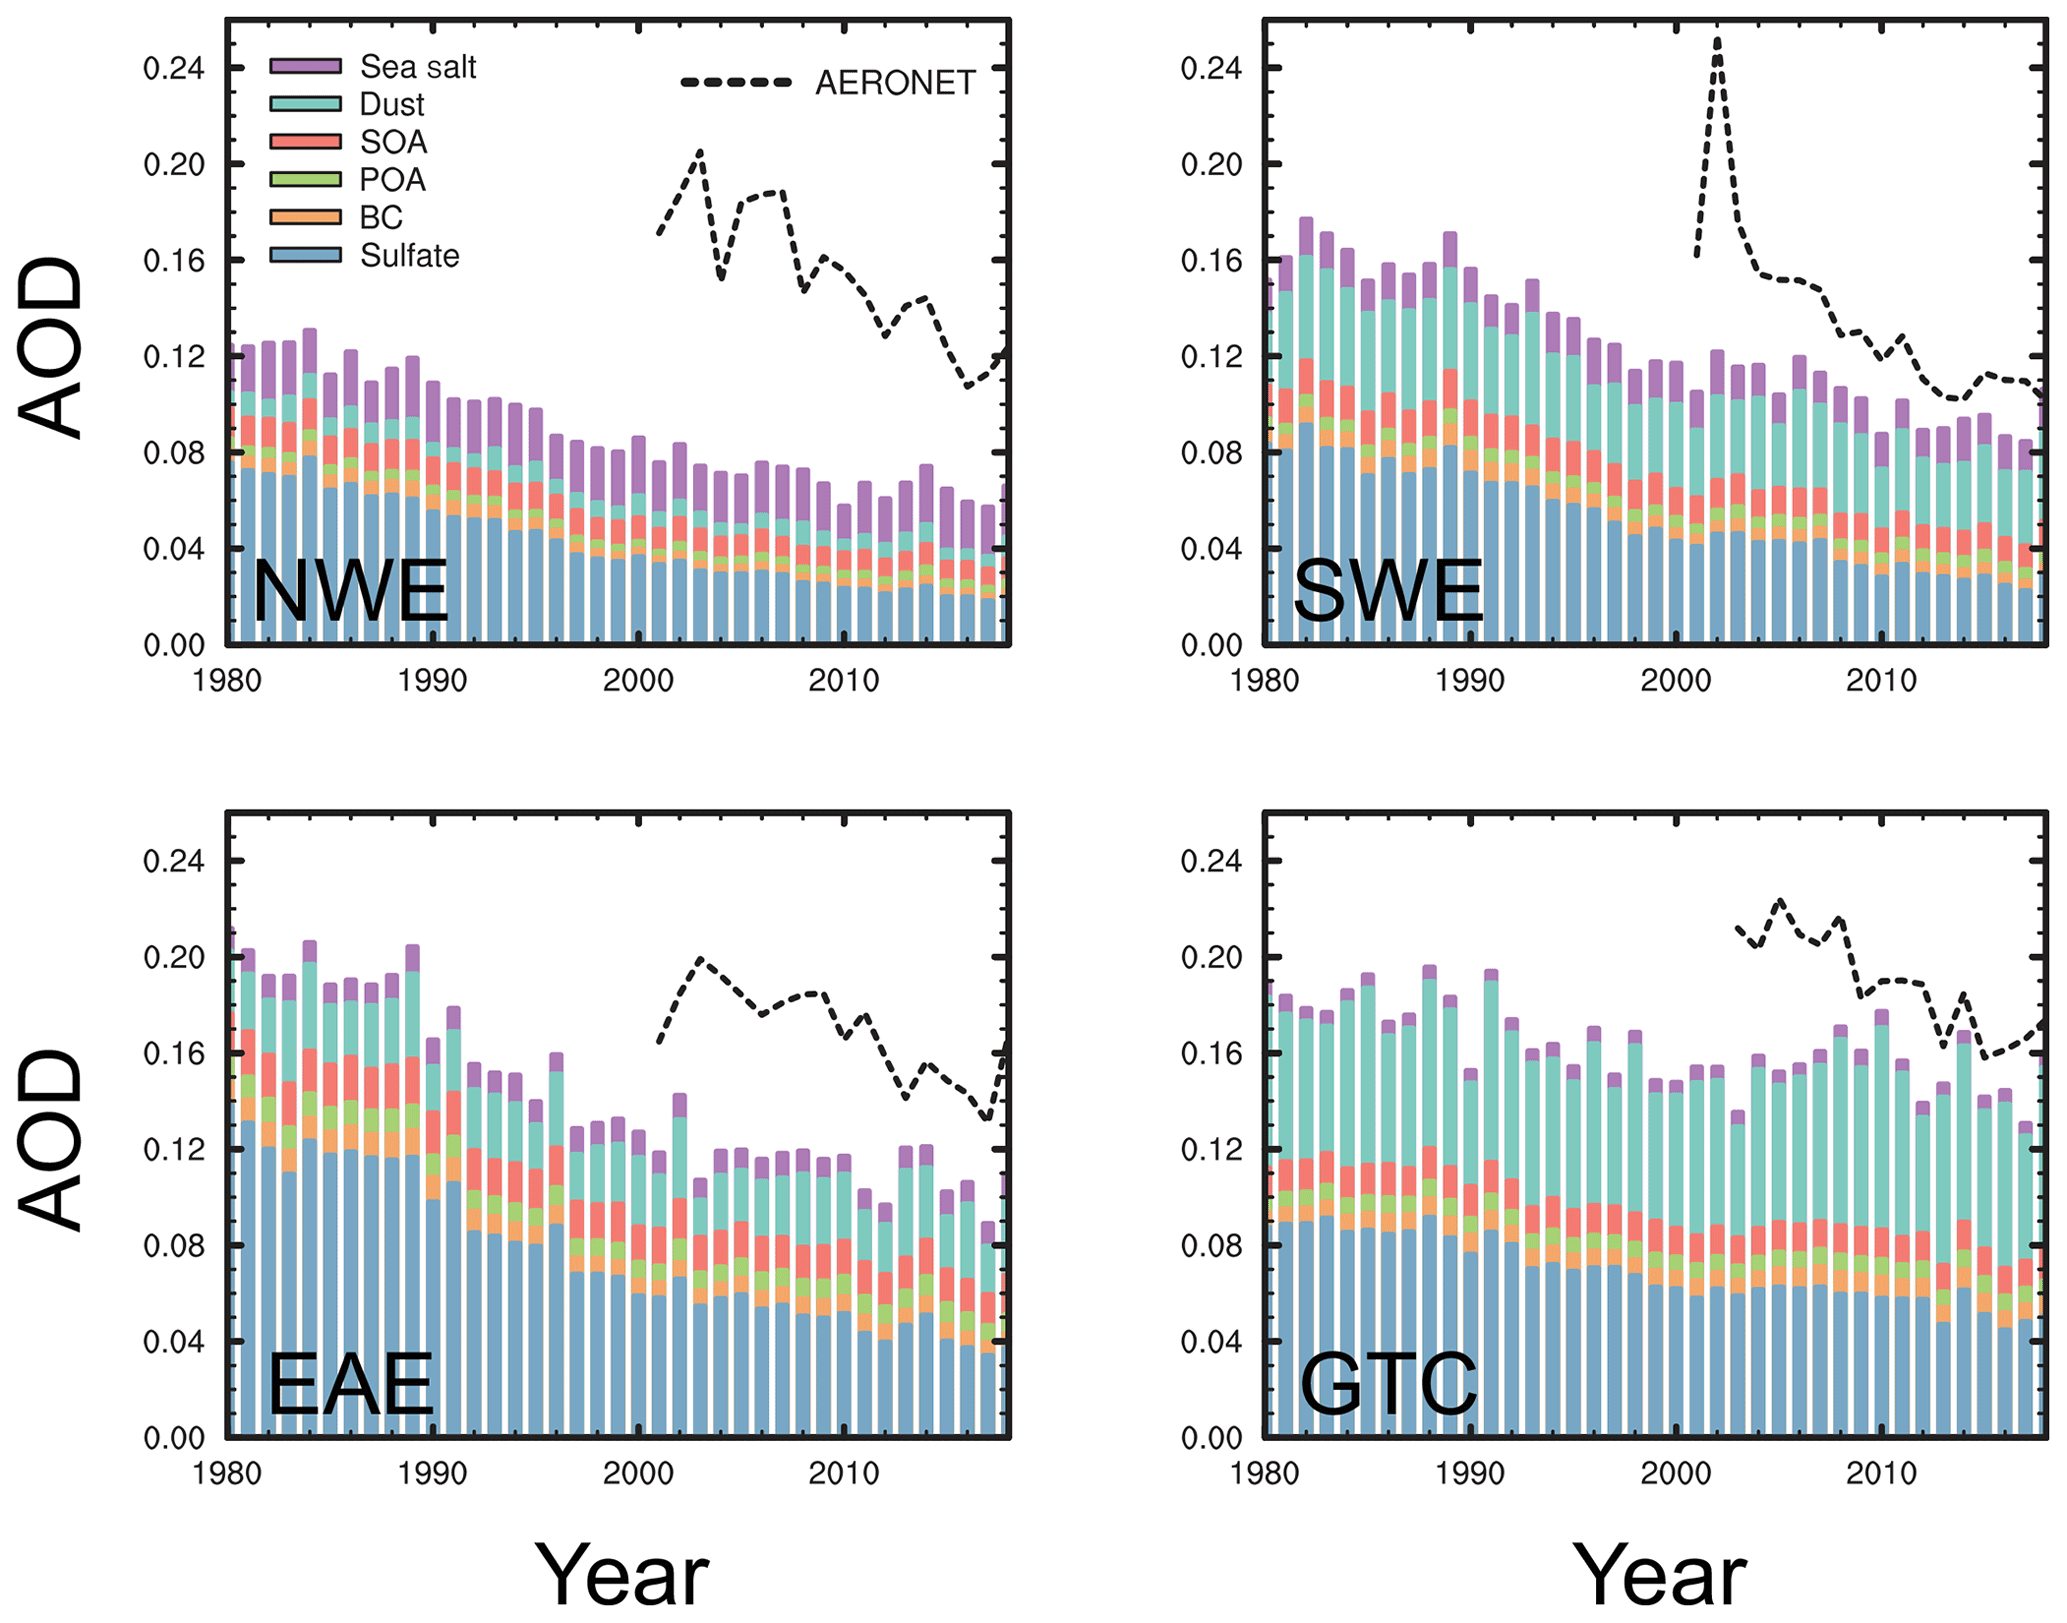
Figure 8Time series (1980–2018) of simulated annual mean AOD for sulfate, BC, POA, SOA, dust, and sea salt averaged over the four subregions of Europe. Dashed lines represent AOD from AERONET measurements.
The decreased sulfate AOD can also be decomposed into different contributions from individual source regions in CAM5-EAST. Local European emissions contribute to 89 % of the decrease, followed by 9 % and 7 % attributed to changes in emissions from Russia–Belarus–Ukraine and North America, respectively, with the residual offset by other source regions (Table 2). Over the last 4 decades, model-simulated sulfate AOD decreased at rates of 0.017, 0.017, 0.026, and 0.012 per decade, respectively, over NW Europe, SW Europe, E Europe, and GTC. Decreases in local European SO2 emissions result in 78 % of the sulfate AOD decreases over GTC and about 90 % over the other three subregions (Fig. 9). For the remote sources, emission changes in North America explain 5 %–10 % of the European sulfate AOD decrease, while Russia–Belarus–Ukraine sources contribute 29 % of the sulfate AOD decrease over GTC and 6 %–8 % over NW Europe and E Europe, indicating a possible warming enhancement effect of changes in emissions from North America and Russia–Belarus–Ukraine.
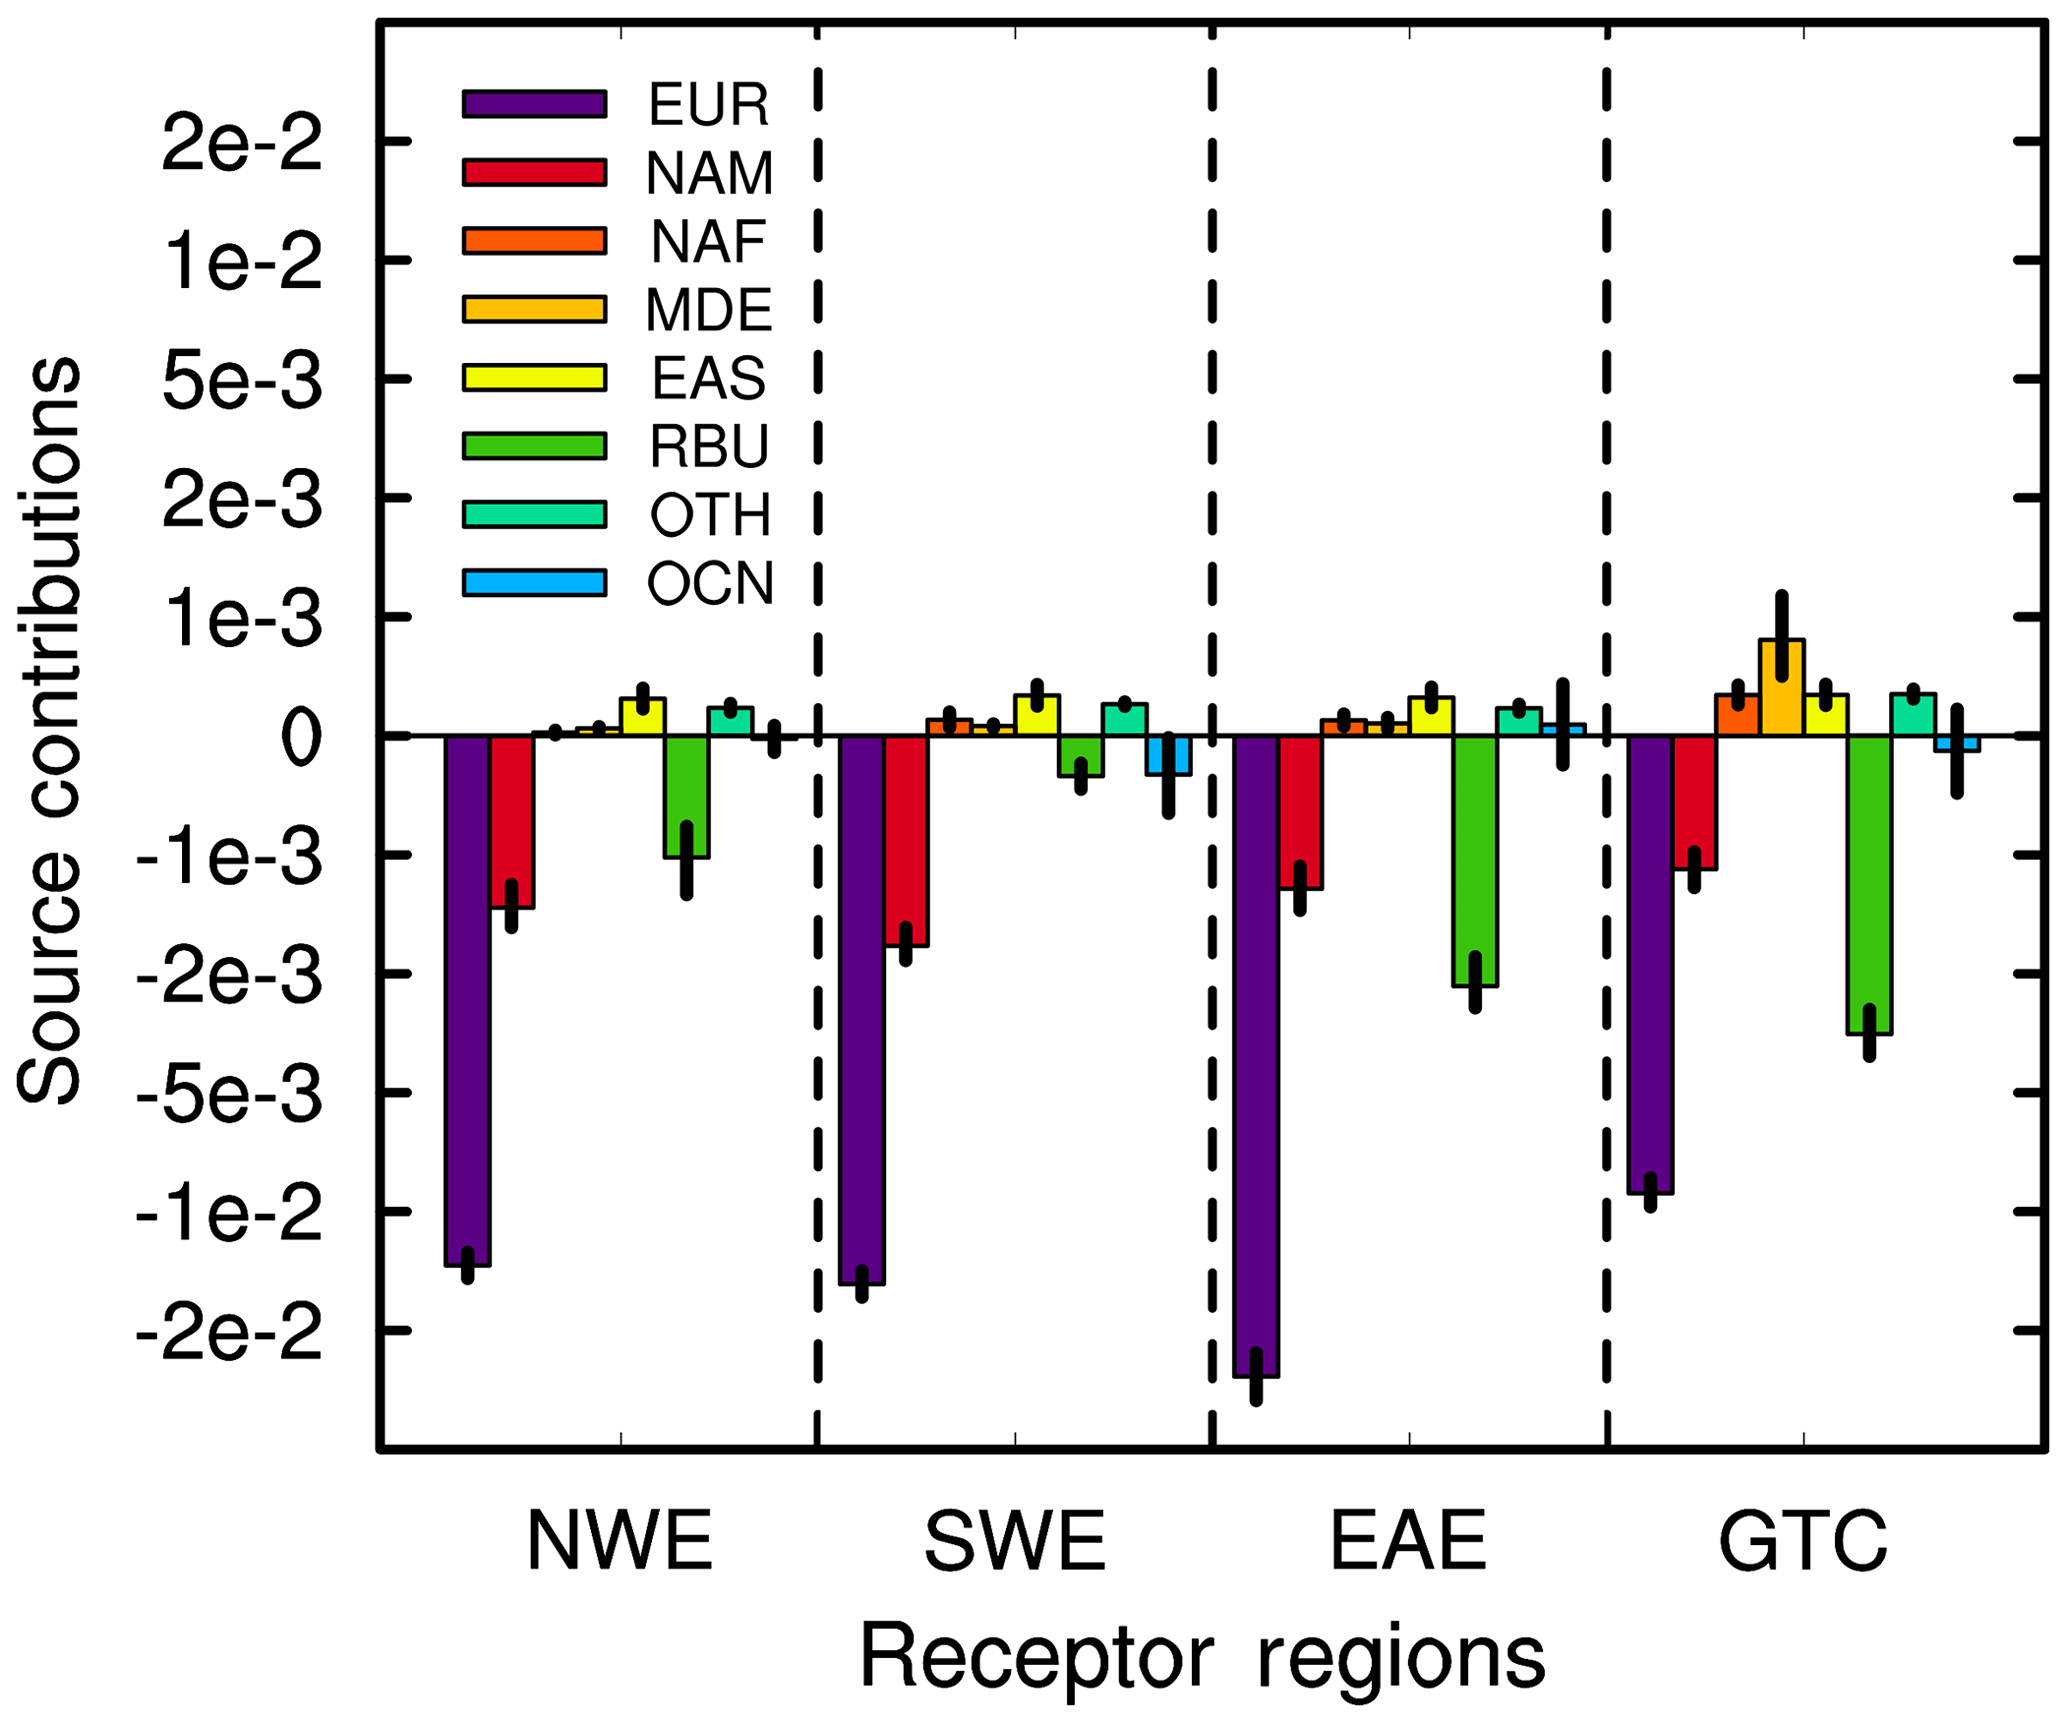
Figure 9Absolute contributions (per decade) of the emissions from major source regions to the trends of sulfate AOD over the four subregions of Europe. Error bars represent 95 % confidence intervals of the linear regression.
Averaged over 1980–2018, sulfate imposed a cooling effect over Europe, with the maximum negative DRF at the top of the atmosphere (TOA) exceeding −3 W m−2 in E Europe (Fig. 10). Compared to 1980–1984, the magnitude of sulfate DRF decreased in 2014–2018, leading to a 1–3 W m−2 warming mainly in E Europe. The warming effect mostly came from a local SO2 emission reduction, while non-European emission changes only contributed less than 0.4 W m−2 over most regions of the Europe. Considering Europe as a whole, the decrease in sulfate DRF caused a warming effect of 2.0 W m−2, with 88 % and 12 % coming from reductions in local European emissions and changes in non-European emissions, respectively (Tables 1 and 2).
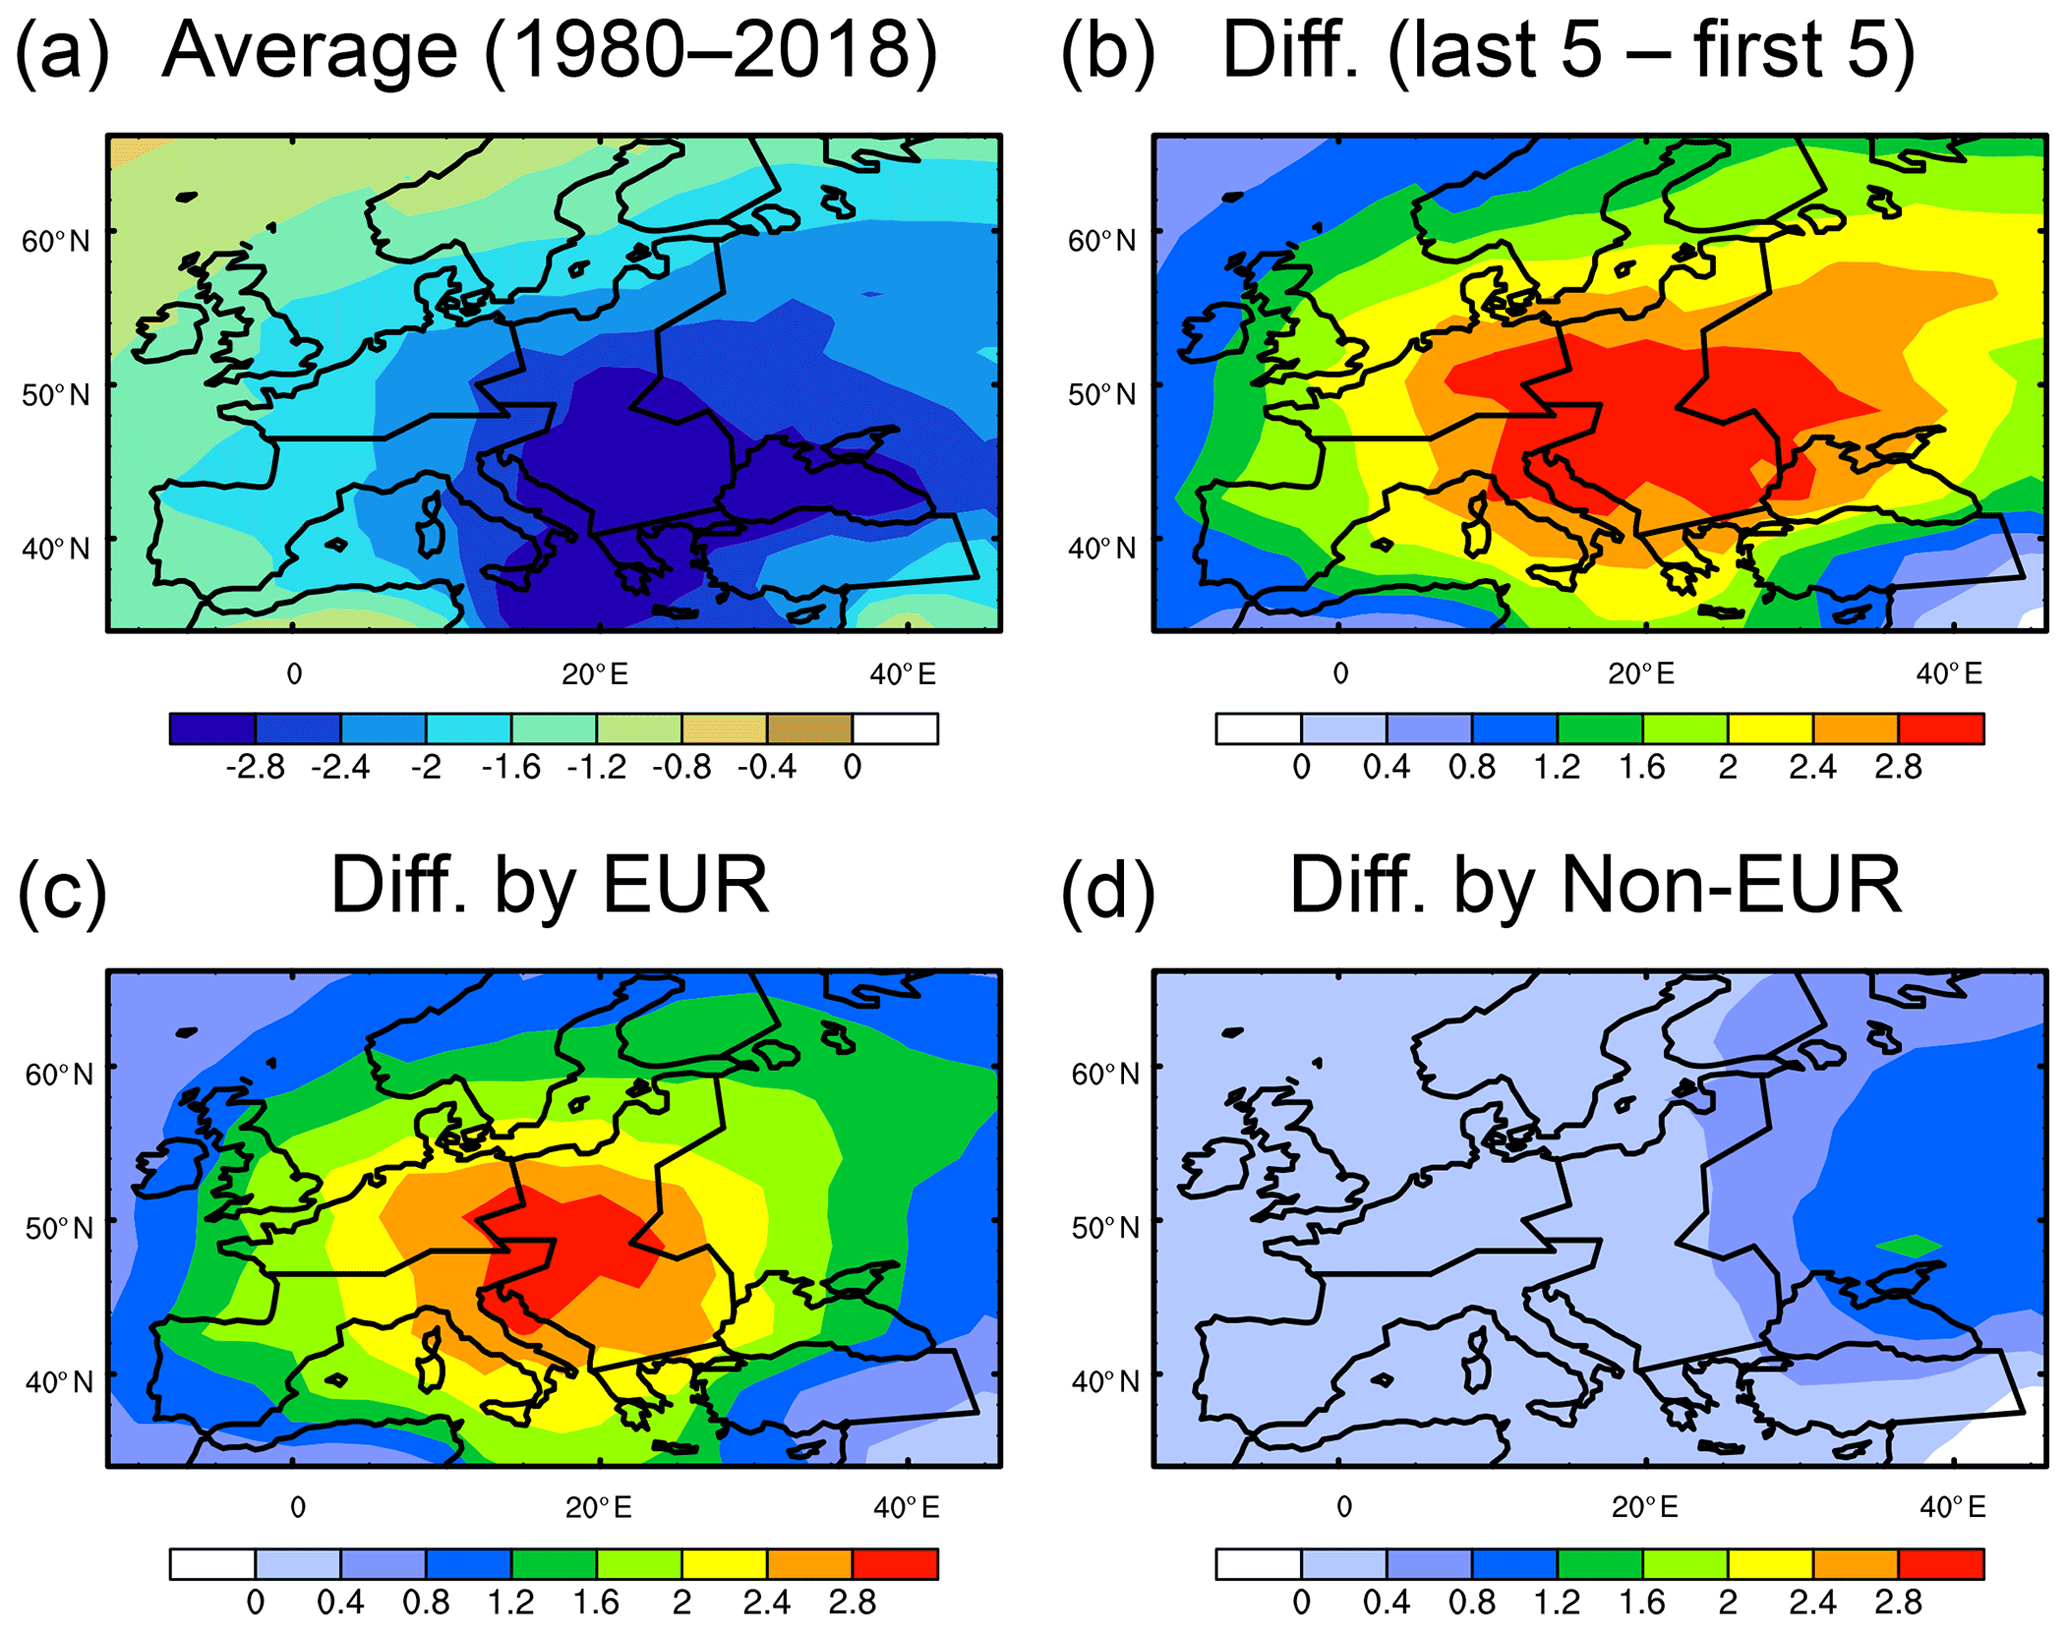
Figure 10(a) Simulated annual mean DRF (in watts per square meter) of sulfate averaged over 1980–2018 and (b) the difference in sulfate DRF between 1980–1984 and 2014–2018. The contributions of European and non-European emissions to the difference are given in (c) and (d), respectively.
Future changes in sulfate DRF associated with European and non-European emissions based on eight SSP scenarios are also estimated and shown in Fig. 11, and Fig. S4 gives an estimate for each SSP scenario. Sulfate DRF contributed by both European and non-European emissions would decrease in the near future but has large variabilities between different SSPs. The sulfate DRF (cooling) over Europe contributed from local European emissions shows a decrease from −0.48 W m−2 in the year 2015 to −0.18 (−0.08 to −0.33) W m−2 in the year 2030 and −0.14 (−0.05 to −0.29) W m−2 in the year 2050. Unlike their contributions to the historical (1980–2018) change, non-European emissions have an increasingly significant impact on the future sulfate DRF changes in Europe. The contributions of non-European emissions decrease from −0.68 W m−2 in the year 2015 to −0.39 (−0.13 to −0.64) W m−2 in the year 2030 and −0.26 (−0.08 to −0.63) W m−2 in the year 2050, with changes of a magnitude similar to that of local European emissions. It suggests that future changes in non-European emissions are as important as European emissions to radiative balance and associated regional climate change in Europe.
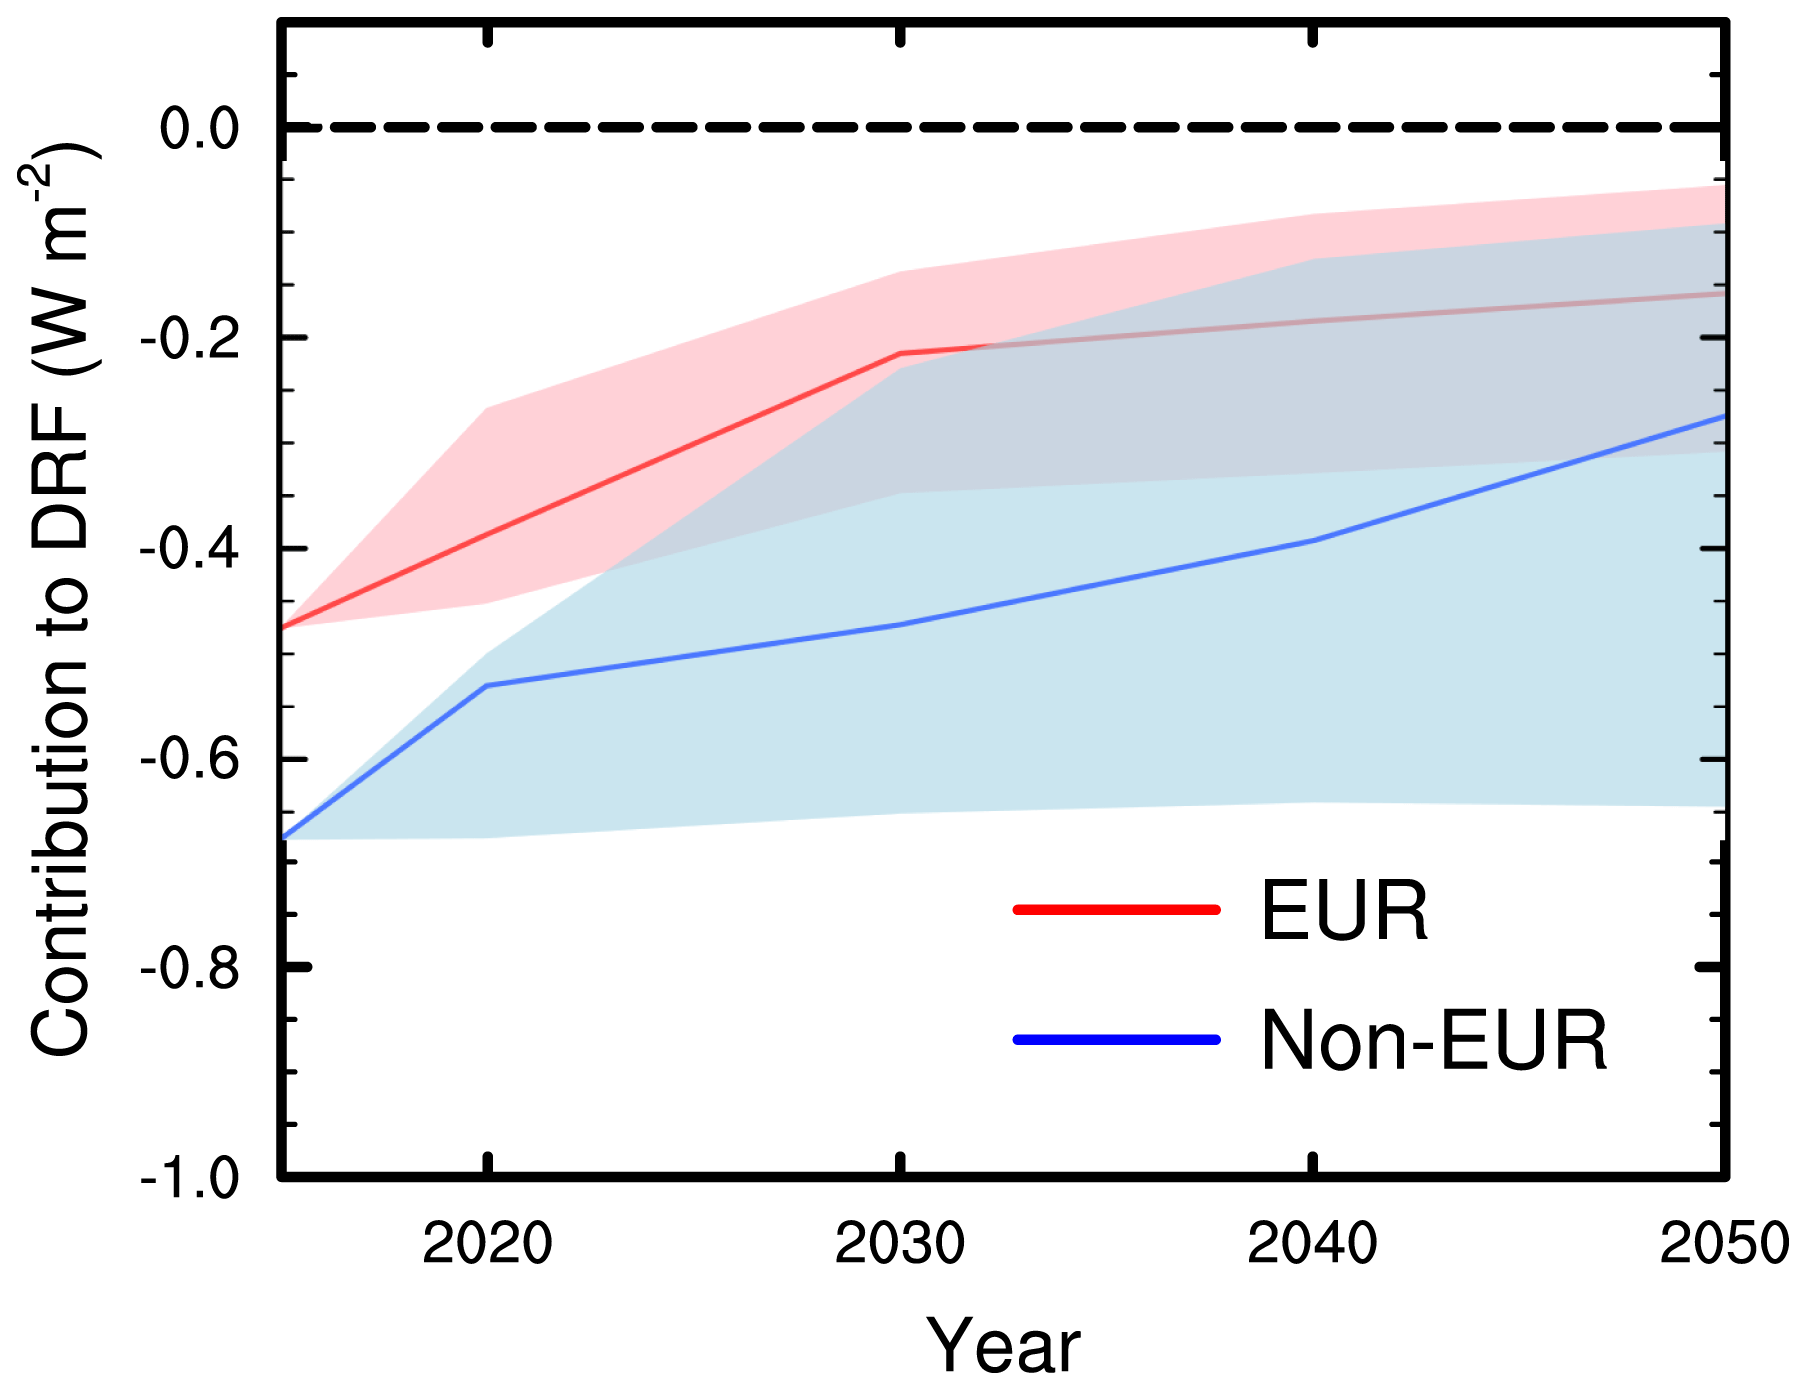
Figure 11Time series (2015–2050) of estimated annual mean sulfate DRF over Europe contributed by European and non-European emissions. Lines and areas represent median values and minimum-to-maximum ranges of the estimated sulfate DRF from eight SSP scenarios, including SSP1-1.9, SSP1-2.6, SSP2-4.5, SSP3-7.0, SSP4-3.4, SSP4-6.0, SSP5-3.4, and SSP5-8.5. Future DRF of sulfate aerosol over Europe is estimated by scaling historical mean (1980–2018) sulfate DRF using the ratio of SSPs future SO2 emissions to historical emissions and assuming a linear response of DRF to regional emissions.
Using a global aerosol–climate model with an explicit aerosol source tagging technique (CAM5-EAST), we examine the long-term trends and source apportionment of aerosols in Europe for 1980–2018 from 16 source regions covering the globe in this study. CAM5-EAST can capture well the spatial distribution and temporal variation in aerosol species in Europe during this time period.
Averaged over 2010–2018, European emissions account for 54 %–68 %, 78 %–95 %, and 58 %–78 % of near-surface sulfate, BC, and POA concentrations over Europe, respectively. Russia–Belarus–Ukraine emissions explain 10 % of sulfate in E Europe and GTC. Northern Africa contributes to 17 % of BC and 24 % of POA over SW Europe. Anthropogenic emissions over oceans (e.g., from international shipping) and natural emissions from marine and volcanic activities together account for 16 %–28 % of sulfate near-surface concentrations in Europe. European emissions only account for 32 %–47 %, 57 %–75 %, and 51 %–71 % of column burden of sulfate, BC, and POA, respectively, in Europe, with the rest contributed by emissions from East Asia, Russia–Belarus–Ukraine, northern Africa and North America. Source contributions of aerosols in Europe vary with seasons, driven by the seasonality of emissions and meteorology.
Compared to 1980–1984, simulated total sulfate-BC-POA near-surface concentration and column burden for 2014–2018 had a decrease of 62 % and 55 %, respectively, the majority of which was contributed to by reductions in local European emissions. The decrease in emissions from Russia–Belarus–Ukraine contributed 8 %–9 % of the near-surface concentration decrease, while the decrease in emissions from North America accounted for 10 % of the reduced column burden. With the large decrease in local emission contributions, aerosols from foreign sources became increasingly important to air quality in Europe. The decrease in sulfate led to a 2.0 W m−2 warming in Europe, with 12 % coming from changes in non-European emissions, especially in North America and Russia–Belarus–Ukraine. Based on the SSP scenarios and the assumed relationship between DRF and emissions, we estimated that sulfate DRF over Europe that was contributed from European emissions and non-European emissions should decrease at a comparable rate in the near future. This suggests that future changes in non-European emissions are as important as European emissions in affecting regional climate change associated with aerosols in Europe. It should also be noted that the model currently does not have the ability to simulate nitrate and ammonium aerosols, and, therefore, the conclusions may not hold with all aerosols.
TheCAM5-EAST model code and results can be made available through the National Energy Research Scientific Computing Center (NERSC) servers upon request.
The supplement related to this article is available online at: https://doi.org/10.5194/acp-20-2579-2020-supplement.
YY, SL, and HW designed the research; YY performed the model simulations; YY and SL analyzed the data. All the authors discussed the results and wrote the paper.
The authors declare that they have no conflict of interest.
This research was support by the National Natural Science Foundation of China under grant 41975159, the U.S. Department of Energy (DOE), Office of Science, Biological and Environmental Research as part of the Earth and Environmental System Modeling program, Jiangsu Specially Appointed Professor Project, and the Startup Fund for Talent at NUIST under grant 2019r047. The Pacific Northwest National Laboratory is operated for the DOE by Battelle Memorial Institute under contract DE-AC05-76RLO1830. The National Energy Research Scientific Computing Center (NERSC) provided computational support.
This research has been supported by the National Natural Science Foundation of China (grant no. 41975159).
This paper was edited by Qiang Zhang and reviewed by three anonymous referees.
Acosta Navarro, J. C., Varma, V., Riipinen, I., Seland, Ø., Kirkevåg, A., Struthers, Iversen, H., T., Hansson, H.-C., and Ekman, A. M. L.: Amplification of Arctic warming by past air pollution reductions in Europe, Nat. Geosci., 9, 277–281, https://doi.org/10.1038/ngeo2673, 2016.
Aksoyoglu, S., Baltensperger, U., and Prévôt, A. S. H.: Contribution of ship emissions to the concentration and deposition of air pollutants in Europe, Atmos. Chem. Phys., 16, 1895–1906, https://doi.org/10.5194/acp-16-1895-2016, 2016.
Bell, M. L. and Davis, D. L.: Reassessment of the Lethal London Fog of 1952: Novel Indicators of Acute and Chronic Consequences of Acute Exposure to Air Pollution, Environ. Health Perspect., 109, 389–394, https://doi.org/10.1289/ehp.01109s3389, 2001.
Boucher, O., Randall, D., Artaxo, P., Bretherton, C., Feingold, G., Forster, P., Kerminen, V. M., Kondo, Y., Liao, H., Lohmann, U., Rasch, P., Satheesh, S. K., Sherwood, S., Stevens, B., and Zhang, X. Y.: Clouds and Aerosols, in: Climate Change 2013: The Physical Science Basis, Contribution of Working Group I to the Fifth Assessment Report of the Intergovernmental Panel on Climate Change, edited by: Stocker, T. F., Qin, D., Plattner, G.- K., Tignor, M., Allen, S. K., Boschung, J., Nauels, A., Xia, Y., Bex, V., and Midgley, P. M., Cambridge University Press, Cambridge, United Kingdom and New York, NY, USA, 571–658, 2013.
Brandt, J., Silver, J. D., Christensen, J. H., Andersen, M. S., Bønløkke, J. H., Sigsgaard, T., Geels, C., Gross, A., Hansen, A. B., Hansen, K. M., Hedegaard, G. B., Kaas, E., and Frohn, L. M.: Contribution from the ten major emission sectors in Europe and Denmark to the health-cost externalities of air pollution using the EVA model system – an integrated modelling approach, Atmos. Chem. Phys., 13, 7725–7746, https://doi.org/10.5194/acp-13-7725-2013, 2013.
Brimblecombe, P.: The Clean Air Act after 50 Years, Weather, 61, 311–314, https://doi.org/10.1256/wea.127.06, 2006.
de Meij, A., Pozzer, A., and Lelieveld, J.: Trend analysis in aerosol optical depths and pollutant emission estimates between 2000 and 2009, Atmos. Environ., 51, 75–85, https://doi.org/10.1016/j.atmosenv.2012.01.059, 2012.
Gelaro, R., McCarty, W., Suárez, M. J., Todling, R., Molod, A., Takacs, L., Randles, C. A., Darmenov, A., Bosilovich, M. G., Reichle, R., Wargan, K., Coy, L., Cullather, R., Draper, C., Akella, S., Buchard, V., Conaty, A., da Silva, A. M., Gu, W., Kim, G.-K., Koster, R., Lucchesi, R., Merkova, D., Nielsen, J. E., Partyka, G., Pawson, S., Putman, W., Rienecker, M., Schubert, S. D., Sienkiewicz, M., and Zhao, B.: The Modern-Era Retrospective Analysis for Research and Applications, Version 2 (MERRA-2), J. Climate, 30, 5419–5454, https://doi.org/10.1175/JCLI-D-16-0758.1, 2017.
Hoesly, R. M., Smith, S. J., Feng, L., Klimont, Z., Janssens-Maenhout, G., Pitkanen, T., Seibert, J. J., Vu, L., Andres, R. J., Bolt, R. M., Bond, T. C., Dawidowski, L., Kholod, N., Kurokawa, J.-I., Li, M., Liu, L., Lu, Z., Moura, M. C. P., O'Rourke, P. R., and Zhang, Q.: Historical (1750–2014) anthropogenic emissions of reactive gases and aerosols from the Community Emissions Data System (CEDS), Geosci. Model Dev., 11, 369–408, https://doi.org/10.5194/gmd-11-369-2018, 2018.
Hurrell, J. W., Holland, M. M., Gent, P. R., Ghan, S., Kay, J. E., Kushner, P. J., Lamarque, J. F., Large, W. G., Lawrence, D., Lind- say, K., Lipscomb, W. H., Long, M. C., Mahowald, N., Marsh, D. R., Neale, R. B., Rasch, P., Vavrus, S., Vertenstein, M., Bader, D., Collins, W. D., Hack, J. J., Kiehl, J., and Marshall, S.: The Community Earth System Model A Framework for Collaborative Research, B. Am. Meteorol. Soc., 94, 1339–1360, https://doi.org/10.1175/BAMS-D-12-00121.1, 2013.
Jonson, J. E., Schulz, M., Emmons, L., Flemming, J., Henze, D., Sudo, K., Tronstad Lund, M., Lin, M., Benedictow, A., Koffi, B., Dentener, F., Keating, T., Kivi, R., and Davila, Y.: The effects of intercontinental emission sources on European air pollution levels, Atmos. Chem. Phys., 18, 13655–13672, https://doi.org/10.5194/acp-18-13655-2018, 2018.
Karamchandani, P., Long, Y., Pirovano, G., Balzarini, A., and Yarwood, G.: Source-sector contributions to European ozone and fine PM in 2010 using AQMEII modeling data, Atmos. Chem. Phys., 17, 5643–5664, https://doi.org/10.5194/acp-17-5643-2017, 2017.
Koo, B., Wilson, G. M., Morris, R. E., Dunker, A. M., and Yarwood, G.: Comparison of source apportionment and sensitivity analysis in a particulate matter air quality model, Environ. Sci. Technol., 43, 6669–6675, https://doi.org/10.1021/es9008129, 2009.
Lelieveld, J., Klingmüller, K., Pozzer, A., Burnett, R. T., Haines, A., and Ramanathan, V.: Effects of fossil fuel and total anthropogenic emission removal on public health and climate, P. Natl. Acad. Sci. USA, 116, 7192–7197, https://doi.org/10.1073/pnas.1819989116, 2019.
Li, C., McLinden, C., Fioletov, V., Krotkov, N., Carn, S., Joiner, J., Streets, D., He, H., Ren, X., Li, Z., and Dickerson, R. R.: India Is Overtaking China as the World's Largest Emitter of Anthropogenic Sulfur Dioxide, Sci. Rep., 7, 14304, https://doi.org/10.1038/s41598-017-14639-8, 2017.
Liu, X., Easter, R. C., Ghan, S. J., Zaveri, R., Rasch, P., Shi, X., Lamarque, J.-F., Gettelman, A., Morrison, H., Vitt, F., Conley, A., Park, S., Neale, R., Hannay, C., Ekman, A. M. L., Hess, P., Mahowald, N., Collins, W., Iacono, M. J., Bretherton, C. S., Flanner, M. G., and Mitchell, D.: Toward a minimal representation of aerosols in climate models: description and evaluation in the Community Atmosphere Model CAM5, Geosci. Model Dev., 5, 709–739, https://doi.org/10.5194/gmd-5-709-2012, 2012.
O'Neill, B. C., Tebaldi, C., van Vuuren, D. P., Eyring, V., Friedlingstein, P., Hurtt, G., Knutti, R., Kriegler, E., Lamarque, J.-F., Lowe, J., Meehl, G. A., Moss, R., Riahi, K., and Sanderson, B. M.: The Scenario Model Intercomparison Project (ScenarioMIP) for CMIP6, Geosci. Model Dev., 9, 3461–3482, https://doi.org/10.5194/gmd-9-3461-2016, 2016.
Persad, G. G. and Caldeira, K.: Divergent global-temperature effects from identical aerosols emitted in different regions, Nat. Commun., 9, 3289, https://doi.org/10.1038/s41467-018-05838-6, 2018.
Riahi, K., van Vuuren, D. P., Kriegler, E., Edmonds, J., O'Neill, B. C., Fujimori, S., Bauer, N., Calvin, K., Dellink, R., Fricko, O., Lutz, W., Popp, A., Crespo Cuaresma, J., KC, S., Leimbach, M., Jiang, L., Kram, T., Rao, S., Emmerling, J., Ebi, K., Hasegawa, T., Havlik, P., Humpenöder, F., Aleluia Da Silva, L., Smith, S., Stehfest, E., Bosetti, V., Eom, J., Gernaat, D., Ma-sui, T., Rogelj, J., Strefler, J., Drouet, L., Krey, V., Luderer, G., Harmsen, M., Takahashi, K., Baumstark, L., Doelman, J., Kainuma, M., Klimont, Z., Marangoni, G., Lotze-Campen, H., Obersteiner, M., Tabeau, A., and Tavoni, M.: The Shared Socioeconomic Pathways and their energy, land use, and greenhouse gas emissions implications: An Overview, Global Environ. Chang., 42, 153–168, https://doi.org/10.1016/j.gloenvcha.2016.05.009, 2017.
Sartelet, K. N., Couvidat, F., Seigneur, C., and Roustan, Y.: Impact of biogenic emissions on air quality over Europe and North America, Atmos. Environ., 53, 131–141, https://doi.org/10.1016/j.atmosenv.2011.10.046, 2012.
Skyllakou, K., Murphy, B. N., Megaritis, A. G., Fountoukis, C., and Pandis, S. N.: Contributions of local and regional sources to fine PM in the megacity of Paris, Atmos. Chem. Phys., 14, 2343–2352, https://doi.org/10.5194/acp-14-2343-2014, 2014.
Smith, S. J., van Aardenne, J., Klimont, Z., Andres, R. J., Volke, A., and Delgado Arias, S.: Anthropogenic sulfur dioxide emissions: 1850–2005, Atmos. Chem. Phys., 11, 1101–1116, https://doi.org/10.5194/acp-11-1101-2011, 2011.
Stjern, C. W., Stohl, A., and Kristjaìnsson, J. E.: Have aerosols affected trends in visibility and precipitation in Europe?, J. Geophys. Res., 116, D02212, https://doi.org/10.1029/2010JD014603, 2011.
Stjern, C. W., Samset, B. H., Myhre, G., Bian, H., Chin, M., Davila, Y., Dentener, F., Emmons, L., Flemming, J., Haslerud, A. S., Henze, D., Jonson, J. E., Kucsera, T., Lund, M. T., Schulz, M., Sudo, K., Takemura, T., and Tilmes, S.: Global and regional radiative forcing from 20 % reductions in BC, OC and SO4 – an HTAP2 multi-model study, Atmos. Chem. Phys., 16, 13579–13599, https://doi.org/10.5194/acp-16-13579-2016, 2016.
Streets, D. G., Tsai, N. Y., Akimoto, H., and Oka, K.: Sulfur dioxide emissions in Asia in the period 1985–1997, Atmos. Environ., 34, 4413–4424, https://doi.org/10.1016/S1352-2310(00)00187-4, 2000.
Tagaris, E., Sotiropoulou, R., Gounaris, N., Andronopoulos, S., and Vlachogiannis, D.: Effect of the Standard Nomenclature for Air Pollution (SNAP) categories on air quality over Europe, Atmosphere, 6, 1119, https://doi.org/10.3390/atmos6081119, 2015.
Tørseth, K., Aas, W., Breivik, K., Fjæraa, A. M., Fiebig, M., Hjellbrekke, A. G., Lund Myhre, C., Solberg, S., and Yttri, K. E.: Introduction to the European Monitoring and Evaluation Programme (EMEP) and observed atmospheric composition change during 1972–2009, Atmos. Chem. Phys., 12, 5447–5481, https://doi.org/10.5194/acp-12-5447-2012, 2012.
van Marle, M. J. E., Kloster, S., Magi, B. I., Marlon, J. R., Daniau, A.-L., Field, R. D., Arneth, A., Forrest, M., Hantson, S., Kehrwald, N. M., Knorr, W., Lasslop, G., Li, F., Mangeon, S., Yue, C., Kaiser, J. W., and van der Werf, G. R.: Historic global biomass burning emissions for CMIP6 (BB4CMIP) based on merging satellite observations with proxies and fire models (1750–2015), Geosci. Model Dev., 10, 3329–3357, https://doi.org/10.5194/gmd-10-3329-2017, 2017.
Vautard, R., Yiou, P., and Oldenborgh, G.: Decline of fog, mist and haze in Europe over the past 30 years, Nat. Geosci., 2, 115–119, https://doi.org/10.1038/ngeo414, 2009.
Wang, H., Easter, R. C., Rasch, P. J., Wang, M., Liu, X., Ghan, S. J., Qian, Y., Yoon, J.-H., Ma, P.-L., and Vinoj, V.: Sensitivity of remote aerosol distributions to representation of cloud-aerosol interactions in a global climate model, Geosci. Model Dev., 6, 765–782, https://doi.org/10.5194/gmd-6-765-2013, 2013.
Wang, H., Rasch, P. J., Easter, R. C., Singh, B., Zhang, R., Ma, P.-L., Qian, Y., Ghan, S. J., and Beagley, N.: Using an explicit emission tagging method in global modeling of source-receptor relationships for black carbon in the Arctic: Variations, sources, and transport pathways, J. Geophys. Res.-Atmos., 119, 12888–12909, https://doi.org/10.1002/2014JD022297, 2014.
Wild, M.: Global dimming and brightening: A review, J. Geophys. Res., 114, D00D16, https://doi.org/10.1029/2008JD011470, 2009.
Yang, Y., Wang, H., Smith, S. J., Ma, P.-L., and Rasch, P. J.: Source attribution of black carbon and its direct radiative forcing in China, Atmos. Chem. Phys., 17, 4319–4336, https://doi.org/10.5194/acp-17-4319-2017, 2017a.
Yang, Y., Wang, H., Smith, S. J., Easter, R., Ma, P.-L., Qian, Y., Yu, H., Li, C., and Rasch, P. J.: Global source attribution of sulfate concentration and direct and indirect radiative forcing, Atmos. Chem. Phys., 17, 8903–8922, https://doi.org/10.5194/acp-17-8903-2017, 2017b.
Yang, Y., Wang, H., Smith, S. J., Zhang, R., Lou, S., Yu, H., Li, C., and Rasch, P. J.: Source apportionments of aerosols and their direct radiative forcing and long-term trends over continental United States, Earth's Future, 6, 793–808, https://doi.org/10.1029/2018EF000859, 2018a.
Yang, Y., Wang, H., Smith, S. J., Zhang, R., Lou, S., Qian, Y., Ma, P.-L., and Rasch, P. J.: Recent intensification of winter haze in China linked to foreign emissions and meteorology, Sci. Rep., 8, 2107, https://doi.org/10.1038/s41598-018-20437-7, 2018b.
Yang, Y., Smith, S. J., Wang, H., Lou, S., and Rasch, P. J.: Impact of anthropogenic emission injection height uncertainty on global sulfur dioxide and aerosol distribution, J. Geophys. Res.-Atmos., 124, 4812–4826. https://doi.org/10.1029/2018JD030001, 2019.
Zhang, Q., Jiang, X., Tong, D., Davis, S. J., Zhao, H., Geng, G., Feng, T., Zheng, B., Lu, Z., Streets, D. G., Ni, R., Brauer, M., van Donkelaar, A., Martin, R. V., Huo, H., Liu, Z., Pan, D., Kan, H., Yan, Y., Lin, J., He, K., and Guan, D.: Transboundary health impacts of transported global air pollution and international trade, Nature, 543, 705–709, https://doi.org/10.1038/nature21712, 2017.