the Creative Commons Attribution 4.0 License.
the Creative Commons Attribution 4.0 License.
 | 28 Feb 2020
Relative effects of open biomass burning and open crop straw burning on haze formation over central and eastern China: modeling study driven by constrained emissions
Khalid Mehmood
Yujie Wu
Liqiang Wang
Pengfei Li
Xue Chen
Zhen Li
Yibo Zhang
Mengying Li
Weiping Liu
Yuesi Wang
Zirui Liu
Yannian Zhu
Daniel Rosenfeld
John H. Seinfeld
Open biomass burning (OBB) has a high potential to trigger local and regional severe haze with elevated fine particulate matter (PM2.5) concentrations and could thus deteriorate ambient air quality and threaten human health. Open crop straw burning (OCSB), as a critical part of OBB, emits abundant gaseous and particulate pollutants, especially in fields with intensive agriculture, such as in central and eastern China (CEC). This region includes nine provinces, i.e., Hubei, Anhui, Henan, Hunan, Jiangxi, Shandong, Jiangsu, Shanghai, and Fujian. The first four ones are located inland, while the others are on the eastern coast. However, uncertainties in current OCSB and other types of OBB emissions in chemical transport models (CTMs) lead to inaccuracies in evaluating their impacts on haze formations. Satellite retrievals provide an alternative that can be used to simultaneously quantify emissions of OCSB and other types of OBB, such as the Fire INventory from NCAR version 1.5 (FINNv1.5), which, nevertheless, generally underestimates their magnitudes due to unresolved small fires. In this study, we selected June 2014 as our study period, which exhibited a complete evolution process of OBB (from 1 to 19 June) over CEC. During this period, OBB was dominated by OCSB in terms of the number of fire hotspots and associated emissions (74 %–94 %), most of which were located at Henan and Anhui (> 60 %) with intensive enhancements from 5 to 14 June (> 80 %). OCSB generally exhibits a spatiotemporal correlation with regional haze over the central part of CEC (Henan, Anhui, Hubei, and Hunan), while other types of OBB emissions had influences on Jiangxi, Zhejiang, and Fujian. Based on these analyses, we establish a constraining method that integrates ground-level PM2.5 measurements with a state-of-art fully coupled regional meteorological and chemical transport model (the two-way coupled WRF-CMAQ) in order to derive optimal OBB emissions based on FINNv1.5. It is demonstrated that these emissions allow the model to reproduce meteorological and chemical fields over CEC during the study period, whereas the original FINNv1.5 underestimated OBB emissions by 2–7 times, depending on specific spatiotemporal scales. The results show that OBB had substantial impacts on surface PM2.5 concentrations over CEC. Most of the OBB contributions were dominated by OCSB, especially in Henan, Anhui, Hubei, and Hunan, while other types of OBB emissions also exerted an influence in Jiangxi, Zhejiang, and Fujian. With the concentration-weighted trajectory (CWT) method, potential OCSB sources leading to severe haze in Henan, Anhui, Hubei, and Hunan were pinpointed. The results show that the OCSB emissions in Henan and Anhui can cause haze not only locally but also regionally through regional transport. Combining with meteorological analyses, we can find that surface weather patterns played a cardinal role in reshaping spatial and temporal characteristics of PM2.5 concentrations. Stationary high-pressure systems over CEC enhanced local PM2.5 concentrations in Henan and Anhui. Then, with the evolution of meteorological patterns, Hubei and Hunan in the low-pressure system were impacted by areas (i.e., Henan and Anhui) enveloped in the high-pressure system. These results suggest that policymakers should strictly undertake interprovincial joint enforcement actions to prohibit irregular OBB, especially OCSB over CEC. Constrained OBB emissions can, to a large extent, supplement estimations derived from satellite retrievals as well as reduce overestimates of bottom-up methods.
- Article
(24554 KB) - Full-text XML
-
Supplement
(499 KB) - BibTeX
- EndNote


Open biomass burning (OBB) has adverse impacts on ambient air quality and human health, owing to the fact that OBB generally emits abundant gaseous and particulate pollutants in a short period of time, particularly carbonaceous aerosols (e.g., black carbon (BC) and organic carbon (OC); Li et al., 2010; Rose et al., 2010; Cheng et al., 2013, 2014; Ding et al., 2013; Saleh et al., 2014; Washenfelder et al., 2015; Vakkari et al., 2018; Bikkina et al., 2019). It has been estimated that OBB contributes approximately 65 % to global annual average primary OC emissions (Bond et al., 2013) and more than 40 % to fine particulate matter (PM2.5) concentrations in specific cases of regional haze (Zhang and Cao, 2015; Long et al., 2016; Gao et al., 2016; Sun et al., 2016; H. Li et al., 2017). In China, estimated growth rates of BC, OC, and primary PM2.5 emitted by OBB from 2002 to 2016 were 180 %, 191 %, and 192 %, respectively (Mehmood et al., 2018), suggesting an urgent need to control OBB emissions.
Open crop straw burning (OCSB), as a crucial part of OBB, generally occurs on a large spatial scale during the harvest seasons in regions with intensive agricultural activities, because it is still the most effective, efficient, and economical measure to dispose of open crop straw (Li et al., 2007; Qin and Xie, 2011; Zhang et al., 2017, 2018, 2019; Xu et al., 2019). Previous studies showed that emissions from OCSB accounted for more than 80 % of those from OBB over China during the past decade. More importantly, emissions increased steadily during the past decade, thereby directly causing or substantially exacerbating regional haze (Wu et al., 2018).
China is experiencing frequent and severe regional haze, partly resulting from substantial and extensive OBB (Huang et al., 2014; Andersson et al., 2015; T. Zhang et al., 2015; B. Zhang et al., 2015; Hong et al., 2016; Chen et al., 2017; An et al., 2019). Open crop straw burning in China accounted for around 20 % of global production and rose with an average annual rate of 4 % during the past decade (Bi et al., 2010; Hong et al., 2016). Specifically, central and eastern China (CEC), as a cardinal granary in the world, was associated with large quantities of crop planting and thus played a crucial role in intensive OCSB, which has been suspected of causing rapid increases in PM2.5 concentrations in this region during the harvest seasons (Yamaji et al., 2010; H. Wang et al., 2015; L. Zhang et al., 2016; Ding et al., 2016; S. Liu et al., 2018; Wang et al., 2018; Yu et al., 2019). Therefore, it is necessary to understand the effects of OBB and OCSB on haze formation over CEC in order to provide effective regulations on mitigating OBB activities.
Current studies using chemical transport models (CTMs) indicate, however, that high uncertainties exist in accurately quantifying impacts of OBB on a regional scale. First is the challenge of representing the magnitude and spatiotemporal distribution of OBB and OCSB emissions, despite newly developed OBB emission inventories during the past decade (Streets et al., 2003; Liu et al., 2015; X. Y. Zhang and Cao, 2015; B. Zhang et al., 2015; Li et al., 2016; Qiu et al., 2016; Zhou et al., 2017; Zhao et al., 2017; H. Liu et al., 2018; M. Liu et al., 2018; X. Zhang et al., 2019; Dai et al., 2019). Traditional bottom-up statistical methods cannot capture rapid outbreaks of OBB and OCSB, and they fail to produce reliable emission amounts and distributions. Moreover, few studies have applied CTMs to evaluate these bottom-up emissions. Also, satellite-based top-down emission inventories cannot generally resolve small fire hotspots (usually around large ones) and can underestimate OBB and OCSB emissions by 2–20 times (Wiedinmyer et al., 2011; Randerson et al., 2012; Uranishi et al., 2019). Several studies have attempted to improve the performance of CTMs by increasing OBB or OCSB emissions with a uniform proportion regardless of specific spatial and temporal scales (Chuang et al., 2015; Pimonsree et al., 2018; Uranishi et al., 2019). Recent studies used observed and simulated constraints to optimize OBB emissions (Hooghiemstra et al., 2012; Konovalov et al., 2014; Yang and Zhao, 2019). Nevertheless, this method still did not represent the spatiotemporal heterogeneity of uncertainties in OBB emissions and has yet to be applied in CEC. Therefore, combining sufficient observed and simulated results, as well as satellite-based fire information, could provide the prospective alternative to optimize OBB emissions. To support related policymaking more effectively, potential major OBB emission sources and corresponding meteorological drivers also need to be identified.
Instantaneous emissions from OBB and OCSB are also poorly co-constrained because of the difficulty of distinguishing them with high spatial and temporal resolutions (Yan et al., 2006; Tsao et al., 2012; Lei et al., 2013; Zhang et al., 2013; Cheng et al., 2013, 2017; Monks et al., 2015; Laing et al., 2016; Wu et al., 2018; Hamilton et al., 2018; Lee et al., 2018; Li et al., 2019; Uranishi et al., 2019; Yang and Zhao, 2019). Consequently, most of the previous studies focused only on individual biomass (e.g., corn, wheat, and rice) or total OBB. Hence, few findings could isolate spatial and temporal influences of OCSB from those of OBB in China, especially over CEC (Li et al., 2007; Cao et al., 2008; Fu et al., 2012; Cheng et al., 2014; Huang et al., 2014; Long et al., 2016; Zhang et al., 2019). Satellite observations by NASA's moderate resolution imaging spectroradiometer (MODIS) or visible infrared imaging radiometer suite (VIIRS) offer an attractive alternative by providing fire information (e.g., burned areas, fire locations) that is able to distinguish OCSB from total OBB. Further, these observations can serve as a computational basis to yield products for their respective emissions, such as the Fire INventory from NCAR version 1.5 (FINNv1.5) (Wiedinmyer et al., 2011).
Comprehensive quantitative analyses of relative effects of OBB and OCSB on haze formation are of critical significance for CEC. In this study, we focus on June 2014, when abundant PM2.5 with exceptionally high concentrations (e.g., the hourly peak surface PM2.5 concentration > 200 µg m−3) enveloped the CEC, potentially due to effects of intense OBB and OCSB emissions during that harvest season. To understand the evolution of regional haze over CEC, we analyzed spatial and temporal characteristics in the OBB and OCSB emissions in FINNv1.5, ground-measured PM2.5 concentrations, and satellite-based aerosol optical depths (AODs). We have established a constraining method that integrates abundant ground-level PM2.5 measurements with a state-of-art fully coupled regional meteorological and chemical transport model (i.e., the two-way coupled WRF-CMAQ) in order to derive optimal OBB emissions based on the original FINNv1.5 emissions. With these constrained emissions, the model reproduced spatiotemporal variations in chemical and meteorological fields. Further, we applied the model to simultaneously quantify the relative contributions of OCSB and OBB emissions to surface PM2.5 concentrations. The backward trajectory (HYSPLIT) and concentration-weighted trajectory (CWT) methods were integrated to pinpoint potential major OCSB sources. Corresponding meteorological patterns, which formed this regional haze event, were also analyzed. Finally, we compare the constrained OBB emissions as well as their associated effects with previous studies.
2.1 The two-way coupled WRF-CMAQ model
We utilize the two-way coupled Weather Research and Forecasting (WRF) model and the Community Multiscale Air Quality (CMAQ) model (i.e., the two-way coupled WRF-CMAQ model, hereinafter referred to as the WRF-CMAQ model) (Wong et al., 2012; Yu et al., 2014a) to simulate meteorological and chemical fields over CEC (Yu et al., 2018). This fully coupled model represents a significant advancement over the offline WRF-CMAQ system (Byun and Schere, 2006), since the former expands to encompass aerosol–radiation interactions to which OBB and OCSB should be closely related (Wang et al., 2014; Huang et al., 2016; Baró et al., 2017; M. Li et al., 2017; Singh et al., 2018; Malavelle et al., 2019). Moreover, the newly developed coupler helps to improve the consistency between WRF and CMAQ in regard to meteorological characteristics (Wong et al., 2012).
The WRF-CMAQ model was configured with the CB05 and AERO6 schemes for gas and aerosol chemistry simulations, respectively (Yarwood et al., 2005; Carlton et al., 2010); thus, primary emissions (e.g., primary OC, BC, and dust) and secondary pollutants (e.g., secondary sulfate, nitrate, ammonium, and organic aerosols) are both considered. Aerosols are described by three modes (Aitken, accumulation, and coarse modes) with a lognormal distribution (Seinfeld and Pandis, 2016). Additionally, the ISORROPIA II model was applied to perform thermodynamic equilibrium calculations for K+–Ca2+–Mg2+––Na+–––Cl−–H2O aerosol systems among gas, liquid, and particulate phases (Fountoukis and Nenes, 2007). In terms of meteorology simulations, we selected the two-moment Morrison cloud microphysics scheme (Morrison and Gettelman, 2008), the Kain–Fritsch cumulus cloud parameterization scheme (KF2) (Kain, 2004), the Rapid Radiative Transfer Model for General Circulation Models (RRTMG) (Clough et al., 2005), the Pleim–Xiu land surface scheme (PX) (Xiu and Pleim, 2001), and the asymmetric convective model (ACM2) (Pleim, 2007a, b) for the cloud physics, radiative transfer, land surface energy balance, and planetary boundary layer simulations, respectively.
Meteorological initial and lateral boundary conditions were derived from the ERA-Interim reanalysis dataset operated by the European Centre for Medium-Range Weather Forecasts (ECMWF) with spatial resolution of and temporal resolution of 6 h (https://www.ecmwf.int/en/forecasts/datasets/browse-reanalysis-datasets, last access: 2 August 2019). The CMAQ default initial and boundary chemical conditions were used. A spin-up period of 7 d was used to minimize the influence of initial chemical conditions (Liu et al., 2010; M. Liu et al., 2018; Wang et al., 2012). To eliminate numerical artifacts that commonly occur in WRF external boundary relaxation zones, we trimmed off seven grid cells on each edge of the domain (Wong et al., 2012; Yu et al., 2012). In addition, meteorological fields were reinitialized by reanalysis data every 48 h in order to constrain corresponding simulated results (Lo et al., 2008; Zhao et al., 2010; Y. Zhang et al., 2016).
In this study, the Multi-resolution Emission Inventory for China version 1.2 (MEICv1.2) (http://www.meicmodel.org, last access: 2 August 2019), mainly implemented by Tsinghua University, was used for anthropogenic emissions (M. Li et al., 2017). This inventory comprises five anthropogenic sectors (i.e., industry, power plants, residential, transport, and agriculture) for PM2.5 and its major precursors (e.g., CO, SO2, NOx, primary PM2.5). It also builds a framework to speciate nonmethane volatile organic compounds (NMVOCs) in accordance with the CB05 mechanism. Anthropogenic emissions outside China were derived from the Hemispheric Transport of Air Pollution version 2 (HTAPv2) (Janssens-Maenhout et al., 2015; M. Li et al., 2017), which includes two additional sectors (i.e., aircraft and ships). These two additional sectors were then aggregated to the transport sector so as to remain compatible with MEICv1.2 in regard to anthropogenic sectors. Unlike offline anthropogenic emissions, natural sources for biogenic and dust emissions were calculated online using the Biogenic Emission Inventory System version 3.14 (BEISv3.14) (Carlton and Baker, 2011) and a windblown dust scheme embedded in CMAQ (Choi and Fernando, 2008), respectively.
To examine OBB and OCSB impacts over CEC, we conducted the simulations in a domain covering most of China with a 12 km horizontal resolution (Fig. 1). There were 31 sigma pressure layers ranging from the surface to the top pressure of 100 hPa, 20 of which were located below around 3 km to achieve finer meteorological and chemical characterization within the planetary boundary layer. It should be noted that CEC in this study comprises 10 provinces, including Anhui (AH), Hubei (HB), Henan (HEN), Hunan (HUN), Shandong (SD), Zhejiang (ZJ), Jiangsu (JS), Shanghai (SH), Fujian (FJ), and Jiangxi (JX), which are underlined with thick black outlines in Fig. 1.

Figure 1Model domain and geographical areas of CEC. Thick black lines outline boundaries of 10 provinces belonging to CEC, including Anhui (AH), Hubei (HB), Henan (HEN), Hunan (HUN), Shandong (SD), Zhejiang (ZJ), Jiangsu (JS), Shanghai (SH), Fujian (FJ) and Jiangxi (JX). The maps were created by NCAR Command Language (NCL) (http://www.ncl.ucar.edu/, last access: 18 December 2019).
To comprehensively validate the model performance, we evaluated the spatial distributions of model-derived AODs, besides primary chemical and meteorological factors. Theoretically, not only particles but also gases have the ability to attenuate the intensity of light. AODs, generally severing as the feature of optical extinctions, should be the combined function of scattering and absorption. However, owing to the insignificant magnitude of gases, we focused only on particles to estimate the model-derived AODs as the following equations (Malm et al., 1994; Binkowski and Roselle, 2003; Song et al., 2008; Park et al., 2011; Jeon et al., 2016):
where i denotes the vertical layer number and Zi refers to the corresponding layer thickness. The OM, FS, CM, and LAC are the mass concentrations of organic species, fine soil, coarse particles, and black carbon, respectively, and uniformly configured with units of milligram per cubic meter (mg m−3). Their respective scattering and absorbing coefficients (i.e., 0.003, 0.004, 0.001, 0.0006, and 0.001) were recorded (m2 mg−1). The f(RH) represents the aerosol growth factor that was estimated based on the relative humidity. All relevant parameters were extracted from the model results.
2.2 OBB and OCSB emissions
In this study, we used FINNv1.5 to characterize spatiotemporal features of OCSB and other types of OBB emissions. FINNv1.5 provides a unique chance to characterize spatial and temporal estimations of trace gas and particle emissions from seven types of OBB, including savannas, grasslands, woody savannas, shrublands, tropical forests, temperate forests, boreal forests, and croplands (Wiedinmyer et al., 2011). Its distinctive advantages include global coverage, high temporal and spatial resolutions (daily and 1 km), and adequate land use types, mainly due to the utilization of MODIS NRT (near-real-time) active fire products (MCD14DL; https://firms.modaps.eosdis.nasa.gov, last access: 5 August 2019), which are processed with the standard MOD14/MYD14 fire and thermal anomalies. Nevertheless, several critical weaknesses originating from satellite retrievals are present, leading to OBB emissions that are largely underestimated (Chuang et al., 2015; Pimonsree et al., 2018; Uranishi et al., 2019). Some previous studies indicated that the actual total amount of primary PM2.5 emissions over Northeast China was nearly 20 times higher than that estimated by FINNv1.5 (Uranishi et al., 2019). Additionally, the lack of local emission information (e.g., local biomass loading data, emission factors) could introduce extra uncertainties. Therefore, FINNv1.5 utilized in this study should require further adjustments to achieve more accurate estimates of OBB and OCSB emissions.
It is important to represent injection heights of OBB in CTMs, which could significantly affect regional transport. Previous studies demonstrated that different injection heights could lead to distinct PM2.5 responses (Freitas et al., 2006; Leung et al., 2007) and pressure-weighted injections within the troposphere is a reliable alternative (Hyer et al., 2007). In this study, we determined heights of the hourly top (Ptop) and bottom (Pbottom) of the OBB plume using a quick-plume-rise model (Eqs. 4 and 5). This process was calculated based on the buoyant efficiency (B) available from the corresponding hourly and size class tables (Tables S1 and S2 in the Supplement) (Tai et al., 2008; Fu et al., 2012a) as follows:
where Ptopmax and Pbottommax are parameters that define the potential maximum plume heights for Ptop and Pbottom, respectively.
2.3 Analysis of backward trajectories and concentration-weighted trajectories
The HYbrid Single-Particle Lagrangian Integrated Trajectory version 4 (HYSPLIT4) model developed by the National Oceanic and Atmospheric Administration Air Resources Laboratory (NOAA ARL) was employed to predict regional transport pathways arriving at receptor cities of interest (Stein et al., 2015). HYSPLIT4 was driven by the final global meteorology analysis data obtained from the National Centers for Environmental Prediction's Global Data Assimilation System (https://ready.arl.noaa.gov/archives.php, last access: 5 August 2019) with a latitude–longitude grid, and it was run four times per day at different starting times (i.e., 00:00, 06:00, 12:00, and 18:00 LT) with the starting height of 100 m above ground level. In this study, the 48 h backward trajectories of air masses were used for further analyses. More details about the HYSPLIT4 model can be found at https://www.arl.noaa.gov/documents/reports/hysplit_user_guide.pdf (last access: 2 August 2019).
We adopted the concentration-weighted trajectory (CWT) method to pinpoint potential major OBB sources affecting regional surface PM2.5 concentrations during the study period based on the HYSPLIT analysis and surface PM2.5 observations (Wang et al., 2009; Yu et al., 2014b; P. Li et al., 2015). The CWT method collected all concentrations of trajectories in an individual grid (Cl) to calculate the corresponding average CWT value (Cij) for each grid cell (i,j) by the following Eq. (6) (Hsu et al., 2003):
where l and M denote the index and the total number of trajectories, respectively, and Tijl represents the residence time for the trajectory l spent in the grid (i,j). The relatively higher CWT values imply high potential contributions to elevated PM2.5 values at the receptor site. Thus, the weighted concentration fields can be utilized to determine the relative significance of potential sources for regional haze in CEC.
2.4 Observational data
Hourly mass concentrations of surface PM2.5 and other chemical species (i.e., CO, NO2, SO2, O3, and PM10) were continuously measured by the Ministry of Ecological Environment of China (http://www.cnemc.cn/, last access: 2 August 2019), including 340 monitoring sites in 65 cities during the study period over CEC. The PM2.5 compositions were obtained from the Campaign on Atmospheric Aerosol Research network of China (CARE-China) in 2011, which was mainly supported by the Chinese Academy of Sciences. The CARE-China network, as the first comprehensive measurement platform for atmospheric aerosols across China (Xin et al., 2015; S. Liu et al., 2018), includes 40 ground sites, including 20 urban sites, 12 background sites, and 8 rural/suburban sites, and it measured most of the PM2.5 compositions (S. Liu et al., 2018). Table S3 displays detailed information on the five sites utilized in this study, which are located in Hunan, Anhui, Jiangxi, Shandong, and Jiangsu. Note that, owing to their key features, when including the discontinuous samples (i.e., from 2 to 4, from 9 to 11, and from 16 to 18 June) as well as the 48 h temporal resolution, the samples are not able to support the time series analysis but can be used for the period evaluations.
These monitoring data were used as follows. (1) According to the evolution of surface PM2.5 concentrations and their composition over CEC, we characterized changes in spatial and temporal patterns of regional haze induced by OBB. (2) We compared simulated chemical and meteorological fields with surface observations to evaluate model performance. (3) The PM2.5 concentrations were used to estimate potential sources by the CWT method. (4) Daily-mean values of AOD at 550 nm retrieved from the satellite platform were examined during the target period to highlight significant spatial and temporal variabilities in regional haze over CEC. Here, the episode-averaged AOD products from MODIS (MOD08_D3) at 550 nm were utilized (https://giovanni.sci.gsfc.nasa.gov/giovanni/, last access: 5 August 2019).
To present OBB and OCSB emissions, daily fire products generated by MODIS (MCD14DL) and corresponding emissions were collected to exhibit explicit spatial and temporal evolutions of OBB. Along with the HYSPLIT4 and CWT methods, the integrated analyses of surface weather patterns from the Korea Meteorological Administration were conducted to illustrate meteorological fields triggering the regional haze over CEC.
3.1 OBB and OCSB information in FINNv1.5
We collected monthly OCSB and other types of OBB information estimated by FINNv1.5 over CEC throughout 2014. From the perspective of the monthly variation in numbers of fire hotspots (Fig. 2), total OBB exhibited a notable seasonal pattern with one distinct peak in summer, especially in June (19 % of the yearly total value). We further examined each type of OBB classified by seven land use categories (i.e., croplands, grassland/savanna, woody savanna/shrublands, tropical forest, temperate forest, boreal forest, and temperate evergreen forest) and found that the relative contribution of OCSB ranged from 13 % to 86 % and also peaked in June of 2014. This presented a highly consistent trend with that of OBB, indicating that OCSB might be the leading contributor of OBB sources over CEC. Therefore, to simultaneously investigate OCSB and other types of OBB effects over CEC, June 2014 should be the best target period on which to focus.

Figure 2Monthly variations in the number of OBB fire hotspots in FINNv1.5 over CEC (right axis) in 2014 and relative contributions of seven types of OBB classified by corresponding land use types (left axis).
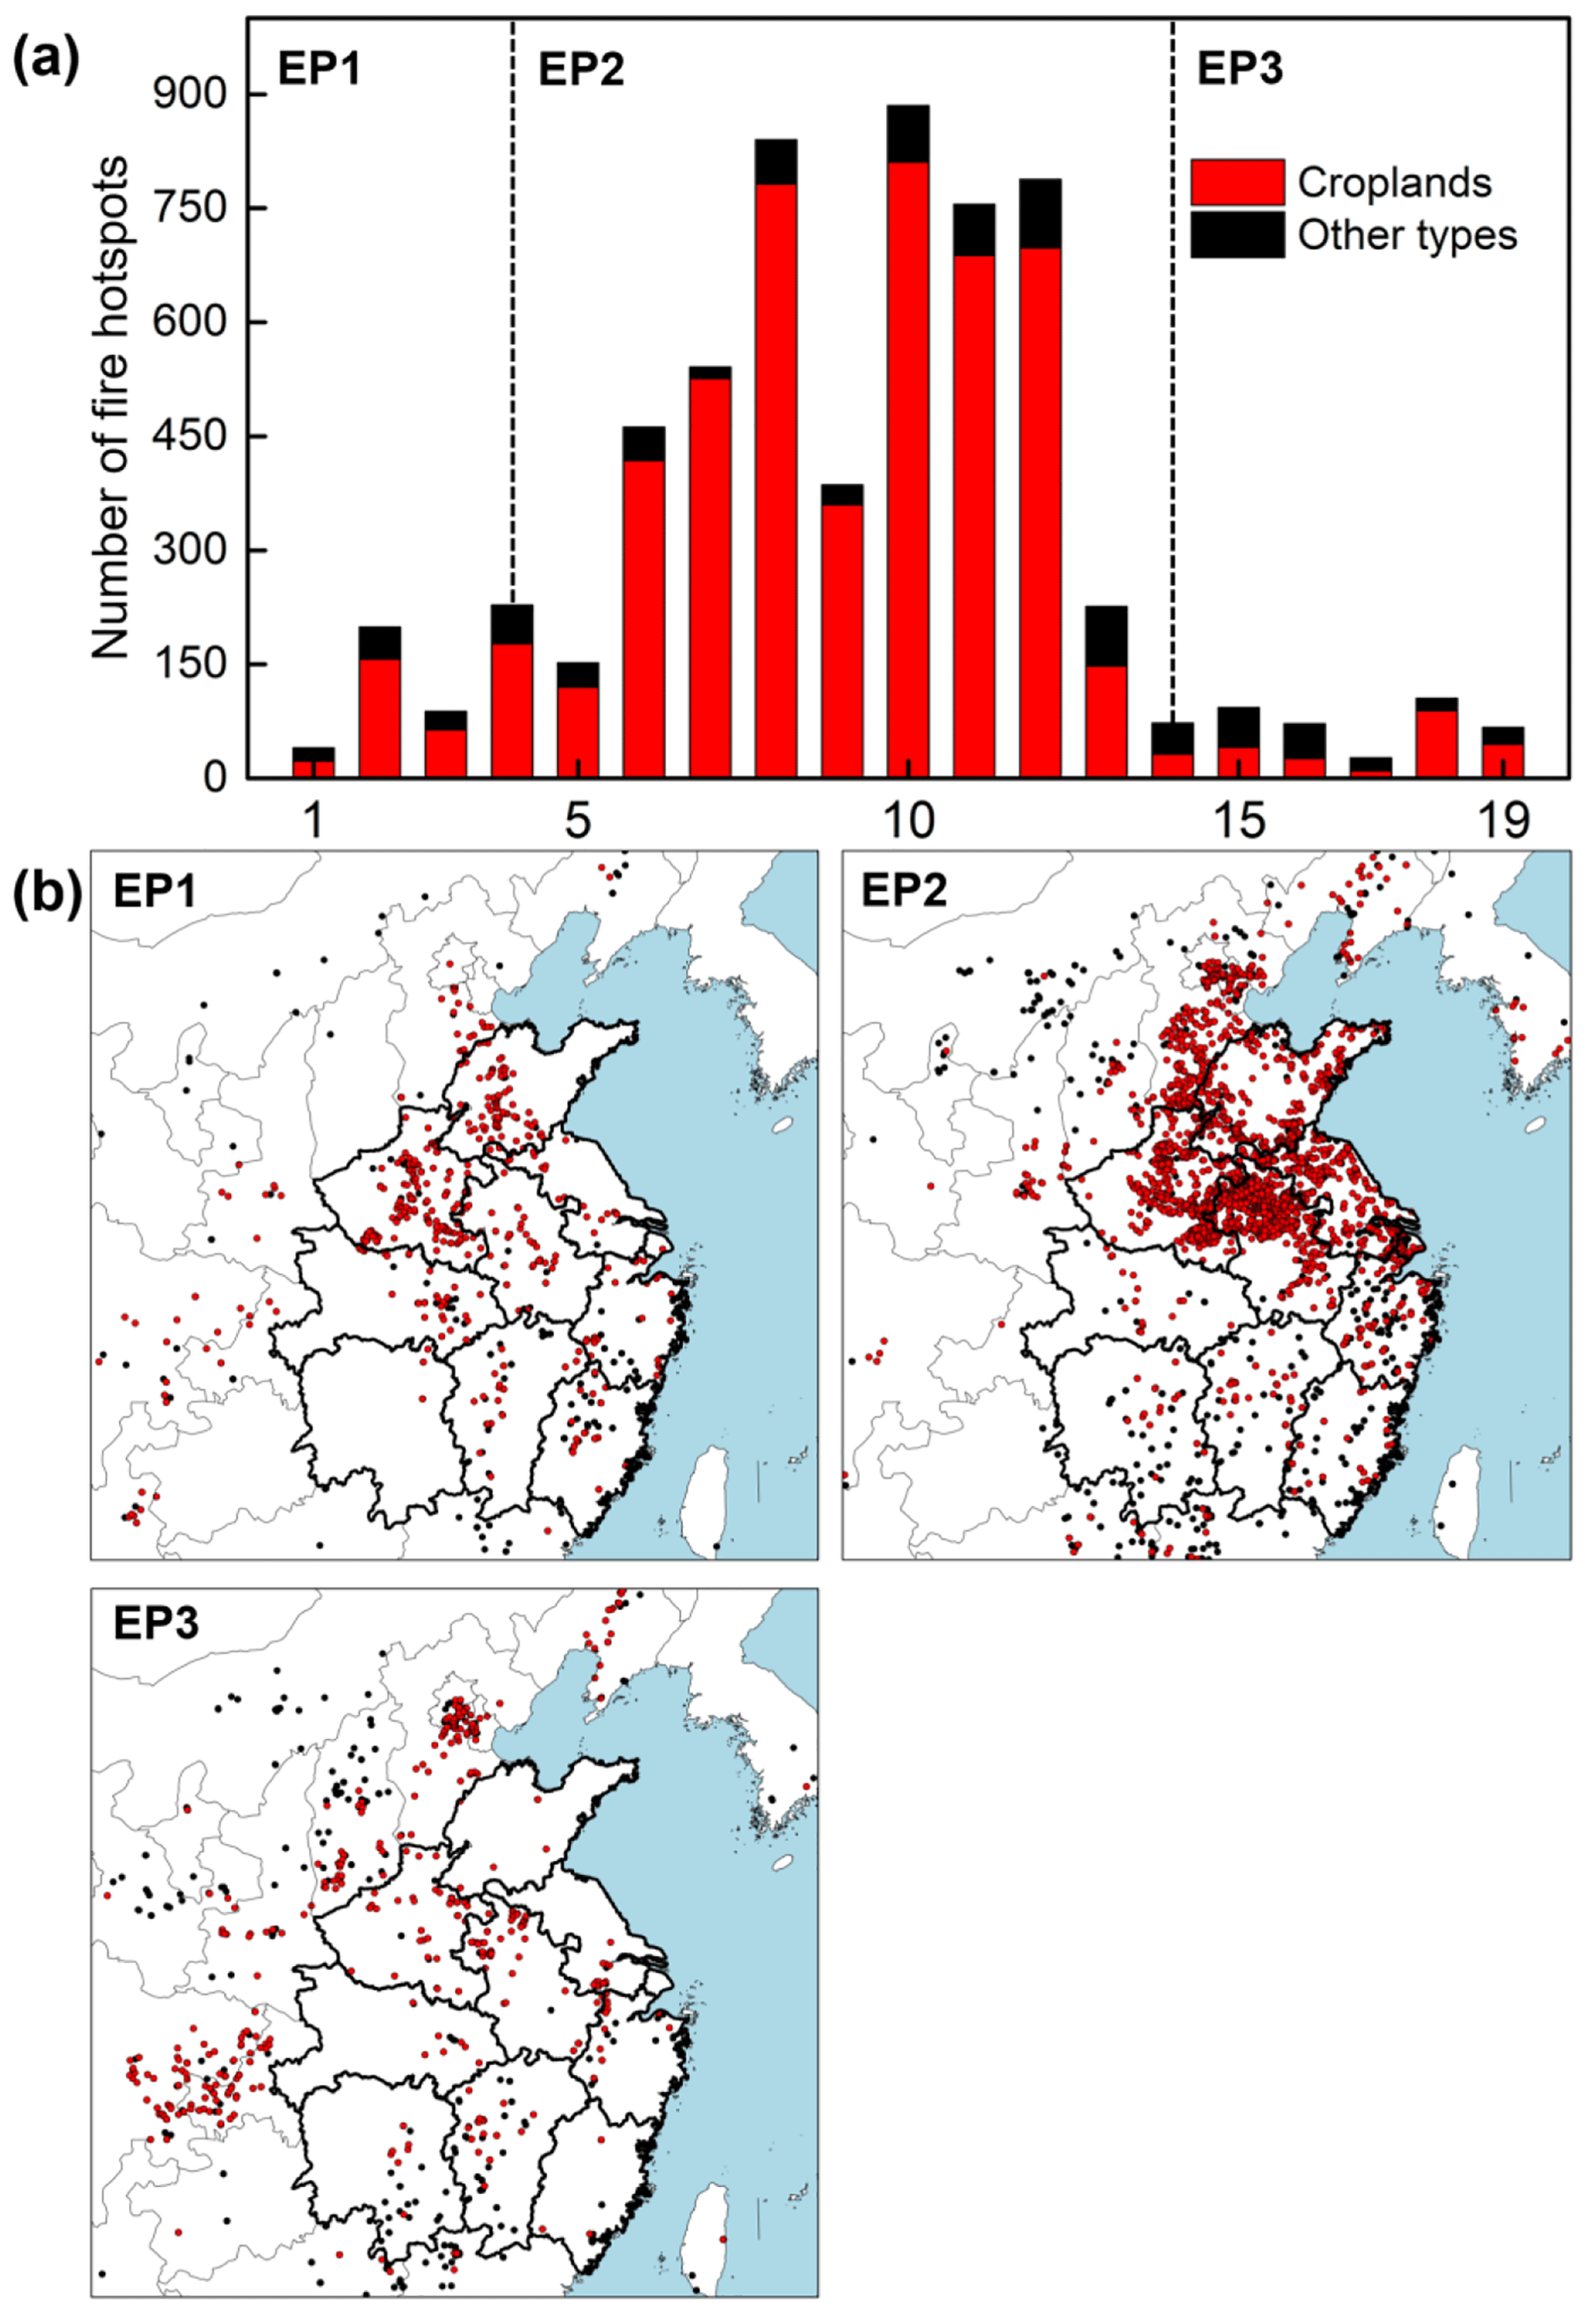
Figure 3(a) Temporal and (b) spatial variations in the number of fire hotspots for OCSB and other types of OBB during EP1, EP2, and EP3, which represent three successive episodes in turn, namely from 1–4, 5–14, and 15–19 June, respectively. The maps were created by NCAR Command Language (NCL) (http://www.ncl.ucar.edu/, last access: 18 December 2019).
Figure 3 shows a remarkable variation in spatiotemporal distributions of daily OCSB and other types of OBB fire hotspots over CEC from 1–19 June, exhibiting a complete OBB evolutionary process. An OBB outbreak event occurred from 5–14 June with the maximum number of fire hotspots (more than 800). By contrast, there existed much fewer fire hotspots in the other periods. This period can, in turn, be divided into the following three episodes: EP1 (from 1–4 June), EP2 (from 5–14 June), and EP3 (from 15–19 June), which represented the pre-OBB, OBB, and post-OBB stages, respectively. It should be noted that OCSB makes uniformly much larger relative contributions to total OBB than other types in terms of the number of fire hotspots for the study period with more than 80 % during EP2.
During EP1 and EP3, limited OBB fire hotspots were sparsely distributed over CEC, as shown in Fig. 3. For the period of the OBB outbreak (EP2), most of the OCSB fire hotspots were concentrated in Henan (32 %) and Anhui (41 %), where local OCSB emissions might play a key role in shaping spatiotemporal distributions of PM2.5 concentrations. Owing to regional transport, surrounding areas, such as Hubei, Hunan, and Jiangxi, might be significantly influenced by OCSB, depending on meteorological conditions. The activity levels of other types of OBB during EP2 also increased by 250 % compared to normal, particularly in Anhui, Zhejiang, and Jiangxi, although it was still significantly lower than those of OCSB, as indicated in Fig. 3.
Table S4 summarizes original provincial emissions of gaseous and particulate species for OCSB and total OBB during the study period based on the FINNv1.5 emission estimations. Most (85 %) OBB emissions occurred during EP2. As expected, OCSB dominated OBB emissions (74 %–94 %) by producing 3040, 17, 10781, 367, and 399 Mmol of NMVOCs, SO2, CO, NH3, and NOx, respectively, and 1877, 8977, 15 778, 19 097 t of elemental carbon (EC), OC, primary PM2.5, and PM10, respectively. During EP2, Henan and Anhui were the top two contributors over CEC and accounted for 66 %–76 % of OBB emissions. Specifically, from the perspective of total OBB emissions in Henan and Anhui, OCSB emissions in these two provinces contributed 94 % of NMVOCs, 72 % of SO2, 87 % of CO, 88 % of NH3, 90 % of NOx, 89 % of EC, 76 % of OC, 74 % of PM2.5 and 75 % of PM10, respectively. Other types of OBB emissions occurred mainly in Anhui (29 %), Zhejiang (28 %), and Jiangxi (14 %). Nevertheless, OBB emissions associated mainly with OCSB estimated in the original FINNv1.5 were projected to be substantially underestimated due to a variety of satellite-based limitations, such as unresolved small and ephemeral agricultural fires, occlusion effects of prevalent cloud cover, or discontinuous time spans (Streets et al., 2003; Wiedinmyer et al., 2011; Randerson et al., 2012; Zhou et al., 2018; Uranishi et al., 2019).
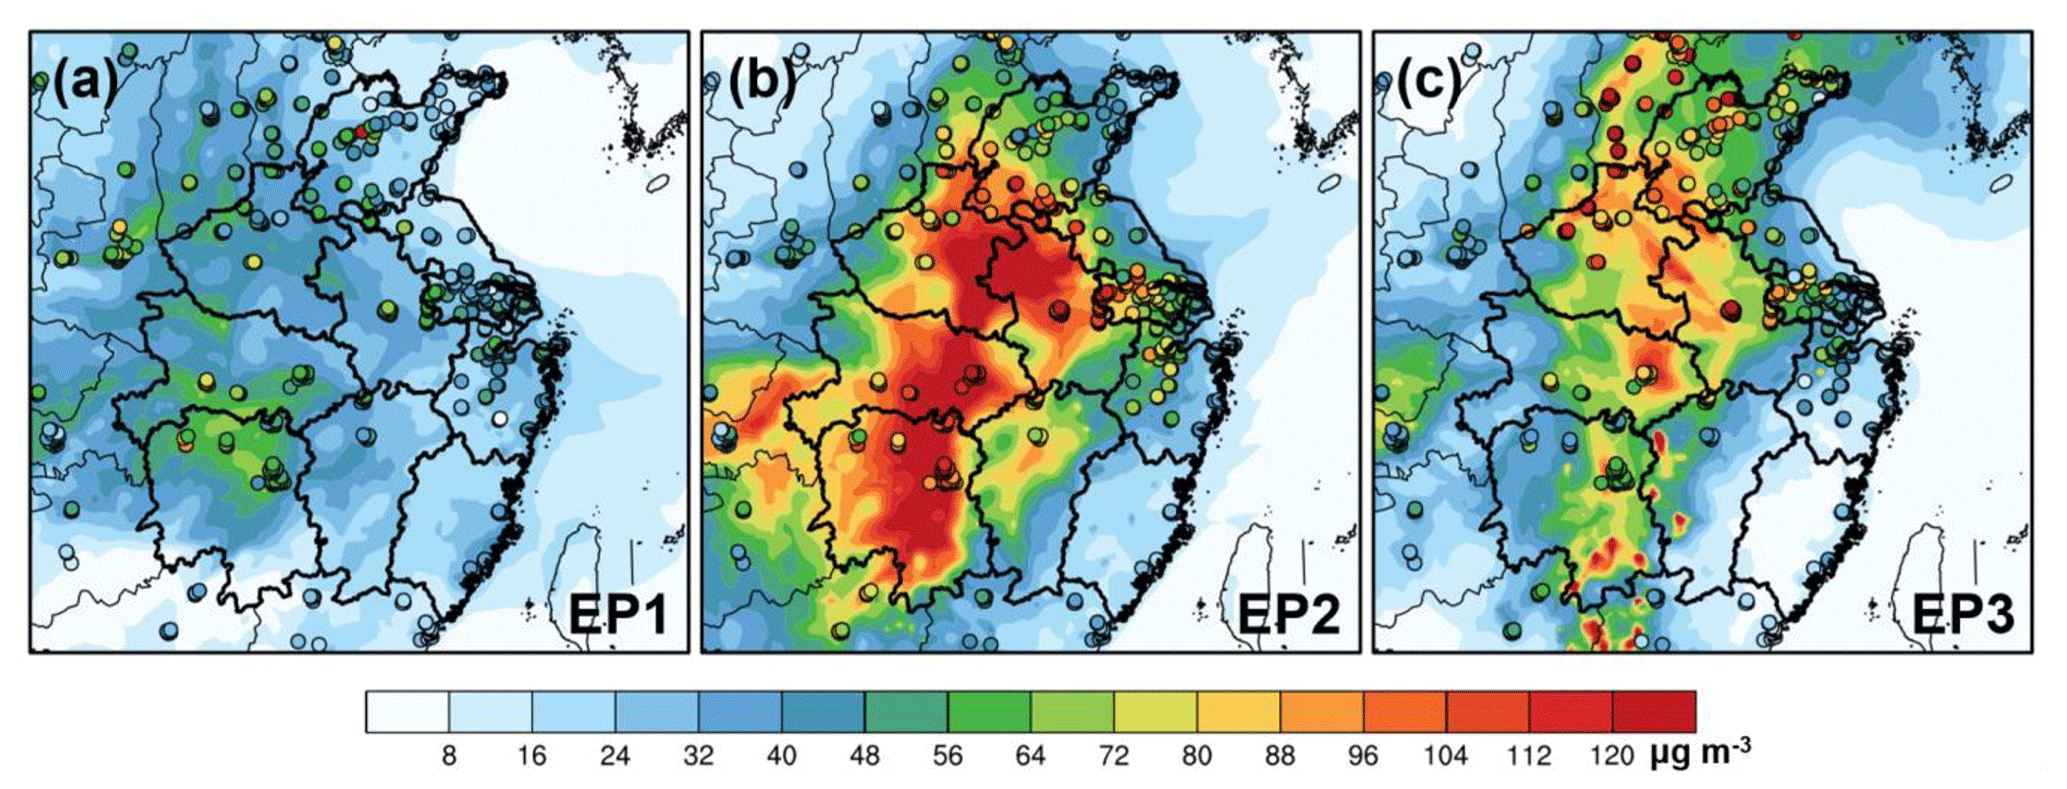
Figure 4Spatial distributions of simulated and observed episode-averaged PM2.5 concentrations over CEC during (a) EP1, (b) EP2, and (c) EP3. Colored circles denote locations of ground measurement sites and corresponding values. The maps were created by NCAR Command Language (NCL) (http://www.ncl.ucar.edu/, last access: 18 December 2019).
3.2 Characteristics of observed regional haze pollution
Both ground-level and spaceborne observations were used to diagnose this OBB event and its associated regional haze (Figs. 4, 5, and 6). Figure 4 shows the magnitudes and spatial distributions of observed episode-averaged PM2.5 concentrations over CEC for EP1, EP2, and EP3. Before the OBB outbreak (EP1), there were no extreme PM2.5 concentrations, all of which were generally lower than 75 µg m−3. For EP2, elevated PM2.5 concentrations (> 115 µg m−3) were observed in Henan and Anhui. Apparently, this was highly consistent with spatiotemporal distributions of OCSB (Fig. 3), which was thus anticipated to cause potential prominent impacts on local haze formation. On the other hand, regional haze also occurred in Hubei and Hunan, where no extensive high-intensity OCSB emissions were observed during the study period (Fig. 3). Thus, not only OCSB emissions but also regional transport played a key role in regional haze. It should be noted that limited emissions from other types of OBB also have a certain impact. With the sudden decline in OBB and PM2.5 concentrations over CEC during EP3, however, moderate regional haze (PM2.5 concentrations > 75 µg m−3) lingered in Henan and Anhui. In addition to anthropogenic contributions, this phenomenon is probably a result of unfavorable meteorological conditions, which trapped previously generated emissions during EP2.
Figure 5 shows spatial distributions of episode-averaged AOD observed by MODIS (MOD08_D3) at 550 nm during EP2. It is in good agreement with spatial distributions of surface averaged PM2.5 concentrations. For instance, much higher AOD values were mostly detected in Henan, Anhui, Hubei, and Hunan, associated with relatively high surface-observed PM2.5 concentrations and substantial OCSB emissions, as shown in Figs. 3 and 4. In addition, the satellite-based product detected that spatial distributions of high AOD values covered wider areas than the surface measurements, such as in Jiangxi, Zhejiang, and Fujian. This was possibly due to the fact that PM suspended in the upper troposphere was more easily transported than that on the ground. This phenomenon further illustrates that OBB dominated by OCSB is not only a significant local source but also an important regional source.
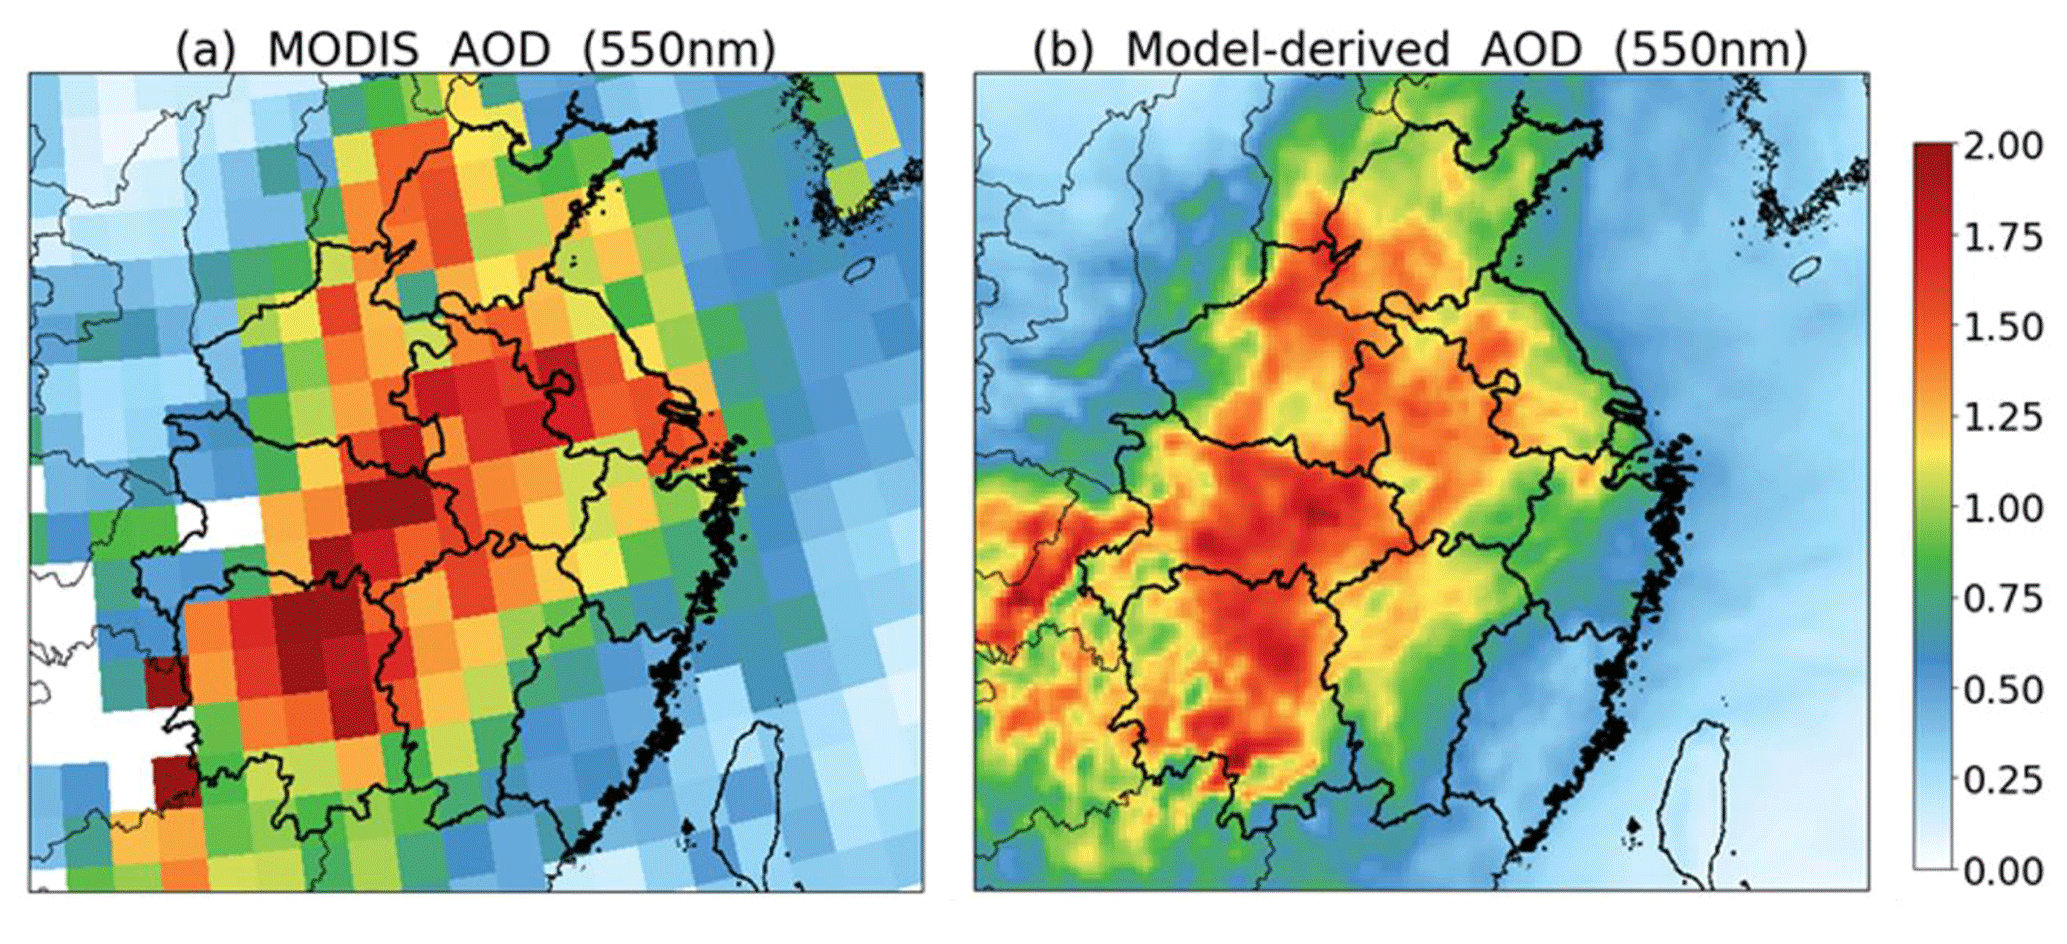
Figure 5Spatial distributions of (a) satellite-based and (b) model-derived AODs in the OPT case over CEC for EP2. The maps were created by NCAR Command Language (NCL) (http://www.ncl.ucar.edu/, last access: 22 December 2019).
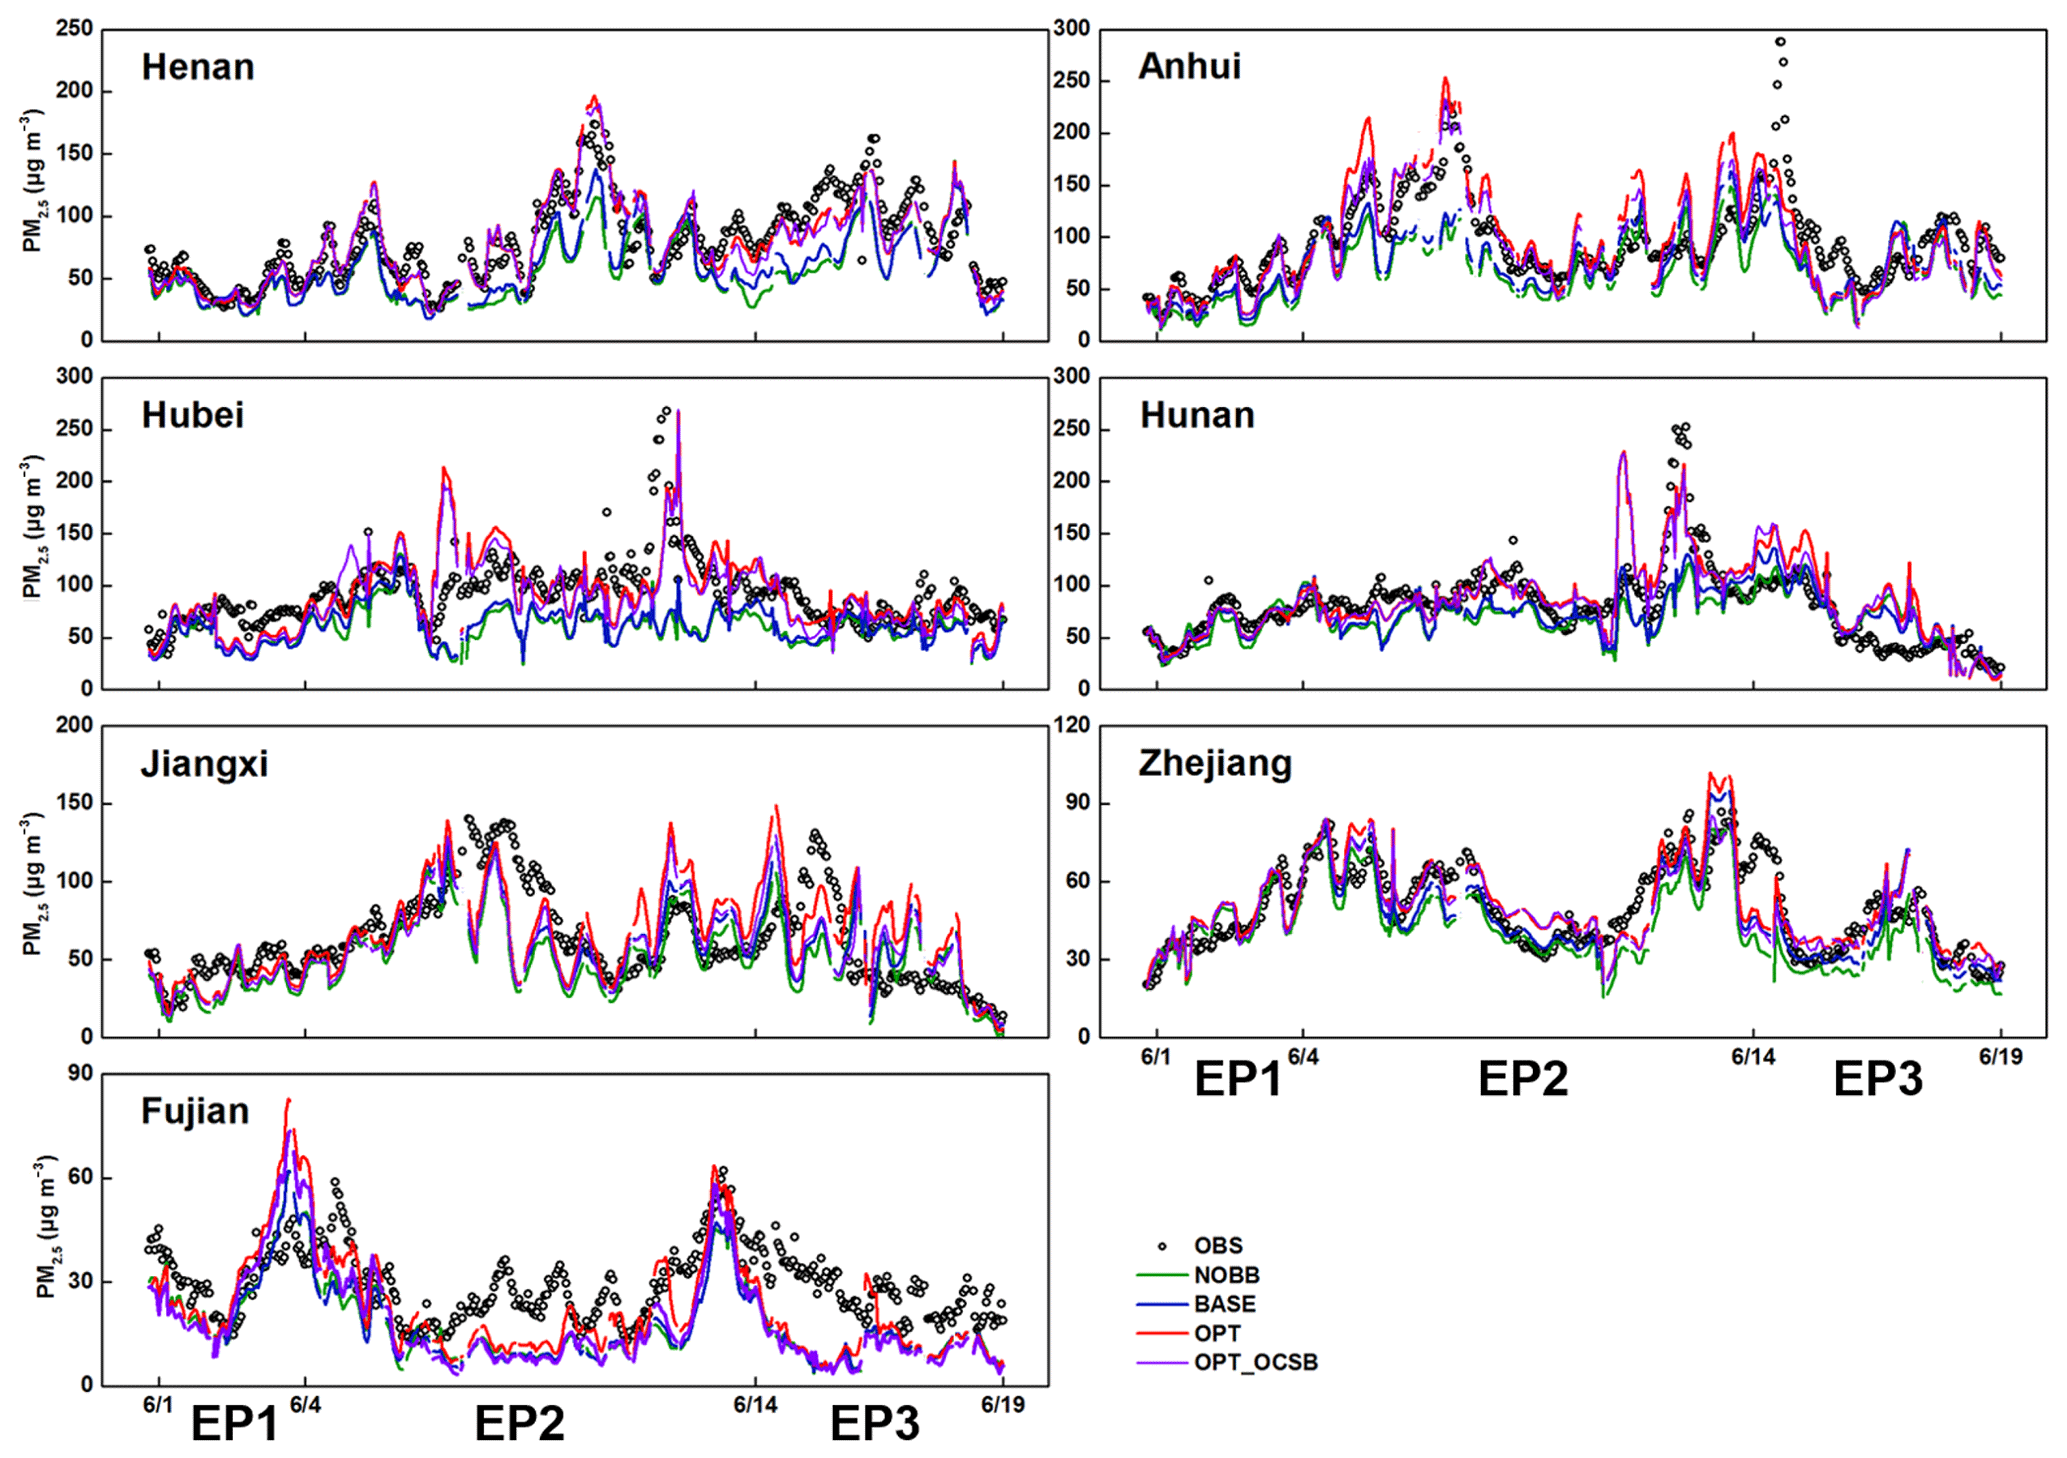
Figure 6Provincial average temporal variations in ground observed and simulated hourly PM2.5 concentrations in Henan, Anhui, Hubei, Hunan, Jiangxi, Zhejiang, and Fujian. The averaged concentrations for each province were calculated with values at the monitoring stations from both observations and different model simulations (OBS: observations; NOBB: the simulations with only anthropogenic and biogenic emissions; BASE: the simulations with not only anthropogenic and biogenic emissions but also original OBB emissions in FINNv1.5; OPT: the simulations with not only anthropogenic and biogenic emissions but also constrained OBB emissions; OPT_OCSB: the simulations with not only anthropogenic and biogenic emissions but also constrained OCSB emissions).
Collectively, seven provinces (i.e., Henan, Anhui, Hubei, Hunan, Jiangxi, Zhejiang, and Fujian) are the focal areas affected by OBB. To further understand the evolution of regional haze characteristics, we focus on these seven provinces to analyze time series of provincial hourly PM2.5 concentrations during the study period (Fig. 6). Correspondingly, the observed trends were also divided into three distinct stages on the basis of PM2.5 concentrations. For EP1, hourly PM2.5 concentrations over CEC were relatively low and almost never exceeded 75 µg m−3. Specifically, the average values in these seven provinces during this episode were 50, 59, 71, 65, 44, 46, and 41 µg m−3, depicting a period with a relatively clean air environment. For EP2 with the OBB outbreak mainly associated with OCSB, PM2.5 concentrations increased significantly in most of these provinces, and the mean PM2.5 concentrations in these seven provinces reached values of 135, 175, 182, 147, 129, 72, and 37 µg m−3. This indicates the extensive haze in Henan, Anhui, Hubei, and Henan. For Jiangxi and Zhejiang during EP2, no severe haze was detected despite large increases in PM2.5 concentrations relative to those in EP1. Thereafter, PM2.5 concentrations in most parts of CEC declined rapidly and gradually stabilized in a lower range during EP3. Overall, the spatiotemporal evolution trends of regional haze characteristics were highly related to those of OBB emissions as analyzed above, signifying the dominant role of OBB emissions. As shown in these results, two important issues can be identified. (1) The temporal variations in PM2.5 concentrations in Hubei were highly similar to those in Hunan during the target period, especially in EP2, revealing that coincident unfavorable meteorological fields might facilitate severe haze there. (2) Relative to the evolution of regional haze in Henan, there was a distinct time lag (24–48 h) for those in Hubei and Hunan. This indicates that OBB emissions mainly associated with OCSB in Henan as well as subsequent regional transport might also be responsible for severe haze in Hubei and Hunan.
Besides the analysis of PM2.5 concentrations at the provincial levels, the major PM2.5 compositions (i.e., K+, , , OC, and ) at the individual sites (Table S5) were also illustrated. We found that there were steady increases in most of the chemical compositions during EP2 at the Changsha and Yucheng sites, which were located in Hunan and adjacent to Anhui, respectively. Such spatiotemporal patterns were highly correlated with those of OBB and PM2.5 concentrations. and OC, as the dominating species, were projected to be responsible for such increases during EP2. For example, the former rose by 13.4 µg m−3 (65.2 %) and 17.6 µg m−3 (134.5 %) in Changsha and Yucheng, respectively. Moreover, we should pay special attention to K+, which was usually treated as the tracer for OBB (Duan et al., 2004). As expected, with the OBB outbreaks in EP2, the K+ concentrations dramatically increased at those two sits (25.2 %–153.7 %), indicating the critical role of OBB in Hunan and Anhui. A similar phenomenon also appeared in Qianyanzhou, where the observed K+ concentrations increased from 0.09 to 0.56 µg m−3 (534.2 %). Note that most of the other observed composition in Qianyanzhou and Wuxi remained in a relatively low range.
In conclusion, from the point of view of the highly correlated relationship between regional haze and OBB activities, we can infer that OBB mainly associated with OCSB might dominate spatial and temporal variations in relatively high PM2.5 concentrations over CEC, especially in Henan, Anhui, Hubei, and Henan. Besides, meteorological fields should also play a critical role in shaping spatiotemporal variations in the regional haze, whereas other types of OBB emissions might be responsible for local haze in Zhejiang and Jiangxi. Therefore, relative contributions of OCSB and other types of OBB, as well as relevant meteorological fields, to regional haze formation at different regional scales are not consistent and should be accurately examined.
3.3 Constrained optimal OBB emissions
Given the large uncertainties in the OBB emissions estimated by the original FINNv1.5, it is necessary to refine these emissions in order to allow the WRF-CMAQ model to reproduce the magnitudes and spatiotemporal distributions of regional haze induced by this OBB event. Also, it is a prerequisite for accurate estimations of OCSB and other types of OBB contributions. In the present study, all available observations from 340 ground-monitoring sites and the WRF-CMAQ model simulations were used in co-constraining OCSB and other types of OBB emissions from FINNv1.5. This constraining method comprised two steps. (i) To characterize the nonlinearity between emissions and PM2.5 concentrations, we examined model responses to variable OBB emission perturbations, which means amplifying OBB emissions using coefficients arranged in an arithmetic sequence (Xiao et al., 2010; Digar and Cohan, 2010; Tang et al., 2011), the first term of which equals one, consistent with the constant difference of terms. (ii) Subsequently, simulated PM2.5 concentrations were then compared with available observations. Hence, with variable emission perturbations, this evaluation process would be repeated, and simulated results could gradually approach observations. During the evaluation processes, the normalized mean bias (NMB) was selected as the major indicator to characterize the discrepancy (Yu et al., 2006).
The constraining method took consideration of the spatiotemporal heterogeneity of uncertainties in OBB emissions to derive the optimal adjustment coefficients for OBB emissions more accurately. According to the variations in the OBB activity level, as shown in Fig. 3 and Table S4, the entire study period was divided into three periods, as noted above, i.e., the pre-OBB (EP1), OBB (EP2), and post-OBB (EP3) stages. Nevertheless, in terms of regional haze, only EP1 was treated as the normal situation under the consideration that PM2.5 concentrations during EP3 would be inevitably impacted by residual emissions produced by the OBB event during EP2. To eliminate potential uncertainties in other emission sources (i.e., anthropogenic and biogenic emissions), we evaluated the model capability under normal situations (no OBB event); that is, the model was driven by original OBB emissions as well as anthropogenic and biogenic emissions (referred to as the BASE case). Figure 6 illustrates the simulated provincial-average PM2.5 concentrations in the BASE case during the study period for Henan, Anhui, Hubei, Hunan, Jiangxi, Zhejiang, and Fujian. The results show that the observations during the study period were uniformly underestimated. However, the NMBs were within a reasonable range (> −25 %) during EP1 but presented much lower values (> 40 %) during the other periods. Thus, this demonstrates that original OBB emissions as well as other sources can allow the model to capture spatiotemporal variations in PM2.5 concentrations for normal situations without significant impacts by OBB in most of the provinces, as recorded by previous studies (Hu et al., 2015; Liu et al., 2016; Qiao et al., 2019), whereas the model failed to reproduce the rapid outbreak of PM2.5 concentrations for this OBB event, especially during EP2 in Henan and Anhui. This result shows the need to derive optimal OBB emissions using this constraining method. On the other hand, for EP1, we also need to overcome slight underestimations of simulated PM2.5 concentrations in order to improve model performance and subsequent estimates of OBB contributions.
Based on the comprehensive analyses for OBB emissions and their associated regional pollution, our goal here is to extend this constraining method to specific spatiotemporal scales. The three study stages (EP1–EP3) should be discriminated due to their distinct OBB emissions; namely, different coefficients should be adopted to adjust OBB emissions for each individual study period. As discussed in Sect. 3.1 and 3.2, Henan and Anhui were the major contributions to local OBB emissions (> 80 %) during the entire study period and would affect other provinces through regional transport. Hence three areas (Henan, Anhui, and other provinces over CEC) were separately adjusted as shown in Fig. 7. To do so, we need to employ this constraining method in the following ways: (i) We first derived respective optimal OBB emissions in Henan and Anhui for EP1 and then for EP2. Note that the optimal adjustment coefficient for EP1 would also be appropriate for EP3 due to the fact that both of them represent the normal situation with respect to the OBB emissions. (ii) On the basis of those results, the next step was to derive corresponding optimal OBB emissions for other provinces.
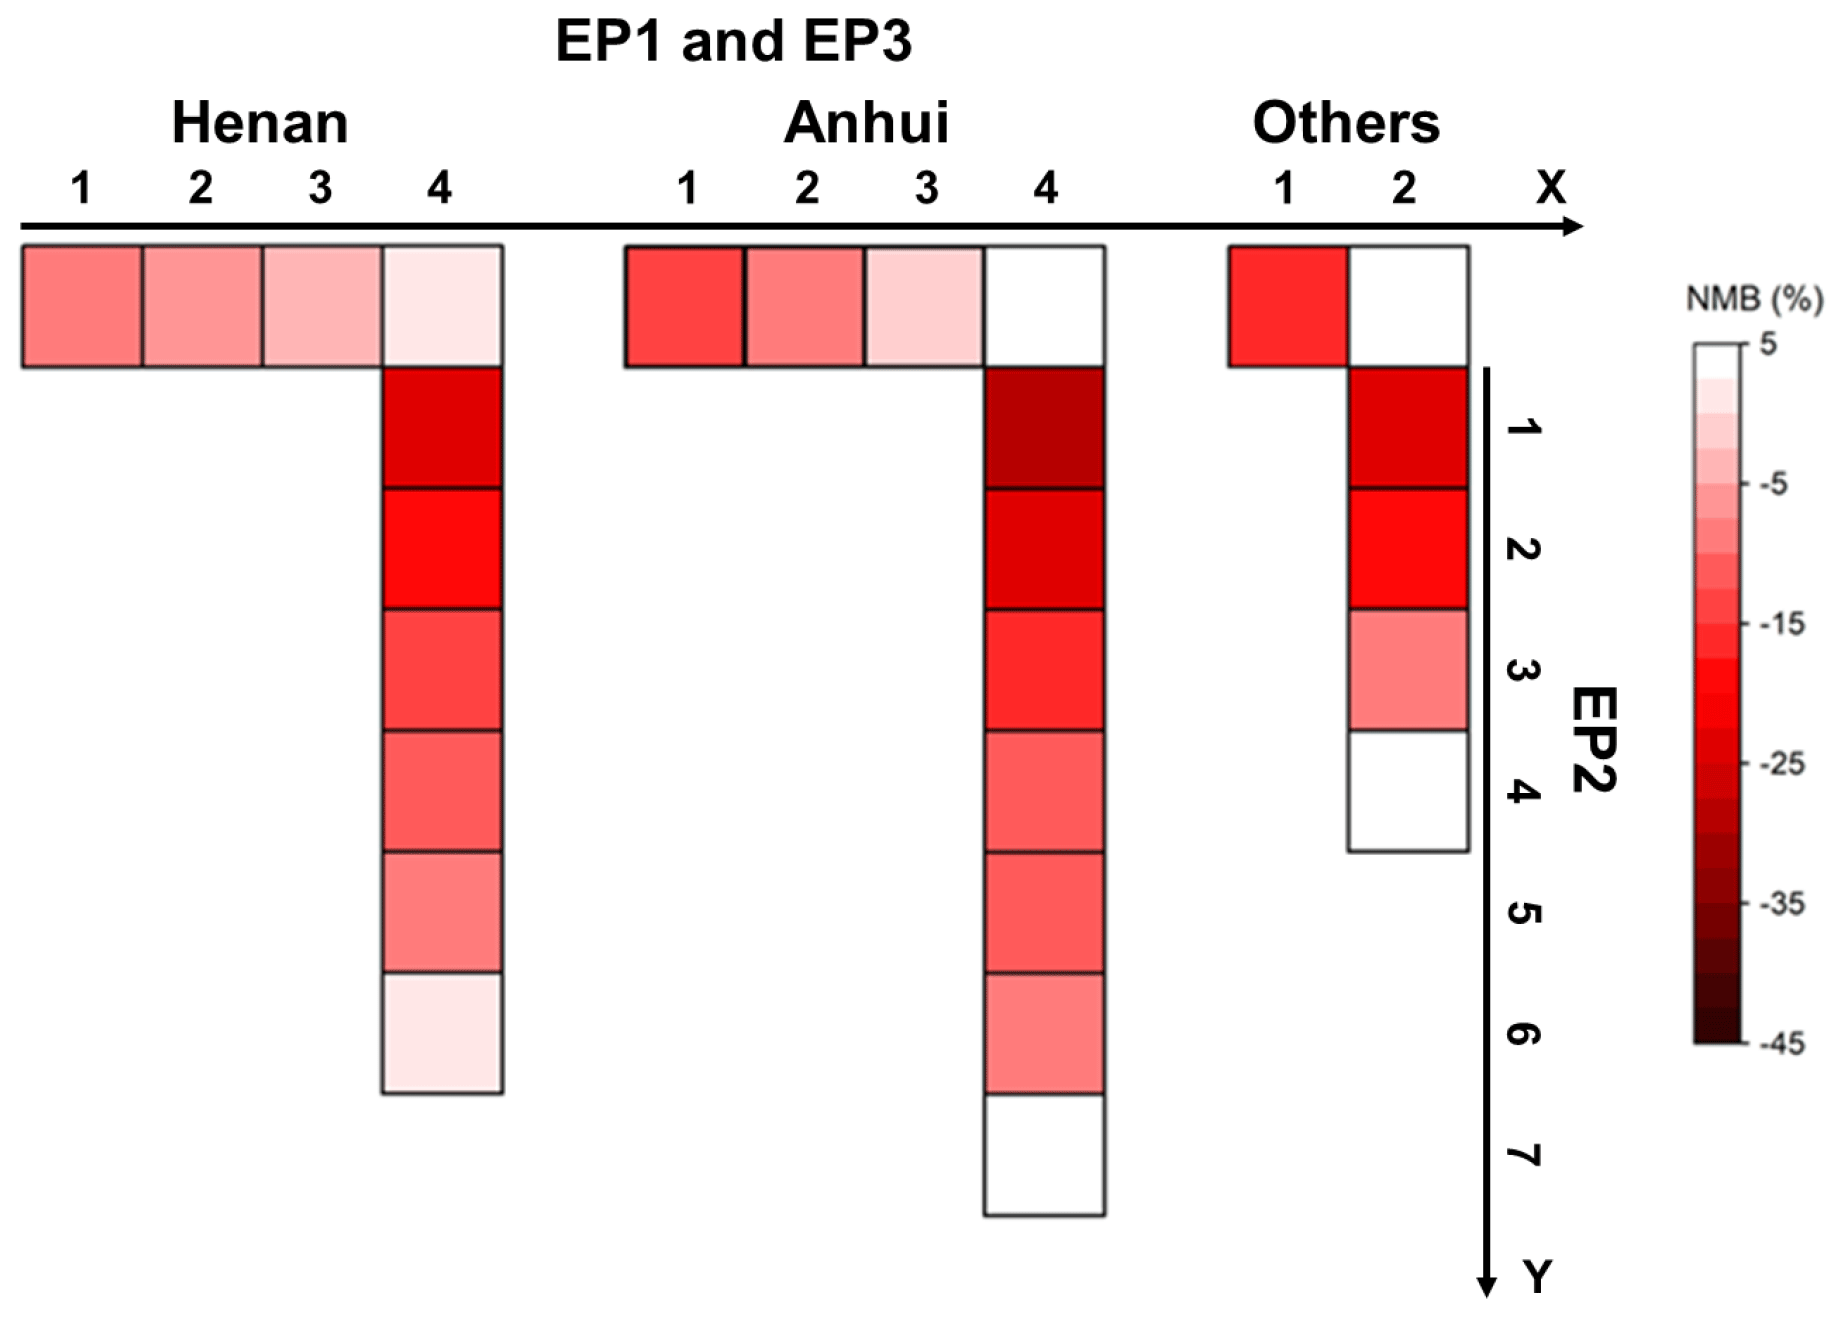
Figure 7Model responses to dynamic emission perturbations. Colored cells represent NMBs between observed and simulated PM2.5 concentrations in different model sensitivity tests for Henan, Anhui, and other provinces over CEC. Coefficients on the x axis refer to the adjustment coefficients for OBB emissions in EP1 and EP3, while coefficients on the y axis denote the ones for EP2.
Figure 7 exhibits colored cells to represent NMBs between observed and simulated PM2.5 concentrations that characterize model responses to variable OBB emission perturbations in Henan, Anhui, and other provinces over CEC. The numbers on the x and y axes refer to the adjustment coefficients for OBB emissions for EP1 and EP2, respectively. With variable OBB emission perturbations, simulated results gradually approached observed values. For Henan and Anhui, OBB emissions with relatively low adjustment coefficients (1–5) do not allow the model to capture observed high PM2.5 concentrations during EP2, while those with higher adjustment factors (> 4) would cause the model to significantly overestimate observed values during EP1. This highlights the substantial underestimation of original OBB emissions in FINNv1.5, especially during the OBB outbreak period (i.e., EP2). By comparison, relatively low coefficients should be adopted to adjust OBB emissions in other provinces. These results point to the importance of variable emission perturbations by considering the spatiotemporal heterogeneity in optimizing OBB emissions. Specifically, we determine that optimal coefficients for OBB emissions for Henan, Anhui, and other provinces are 6, 7, and 4 for EP2, respectively, and 4, 4, and 2 for both EP1 and EP3, respectively. Correspondingly, all of the NMB values reached the minimum and were controlled within ±5 %. In summary, we employ the aforementioned optimal coefficients to adjust OBB emissions at specific spatiotemporal scales. Table 1 summarizes the spatiotemporal emission amounts for all the species (NMVOCs, SO2, CO, NH3, NOx, EC, OC, PM2.5, PM10) for each province over CEC for each stage of the study period (EP1–EP3). Corresponding maps of PM2.5 emissions for OCSB and other types of OBB presented similar spatial distributions to those of fire hotspots as shown in Fig. 8. By taking PM2.5 emitted from OCSB as an example, emission intensities in some pixels were found to exceed a value of 100 t during the study period, and most cases were found in the areas surrounding the common border of Henan and Anhui. For other provinces, PM2.5 emission intensity only ranged from 1 to 20 t per pixel. Other species from OCSB emissions presented similar spatial distributions. On the other hand, all species for other types of OBB consistently showed sparse spatial distributions and limited emissions. In summary, optimal OBB emissions were derived by the constraining method, which integrated observations and model results based on FINNv1.5. Note that this constraint was established based on specific spatial scales separately (i.e., Henan, Anhui, and other provinces over CEC).
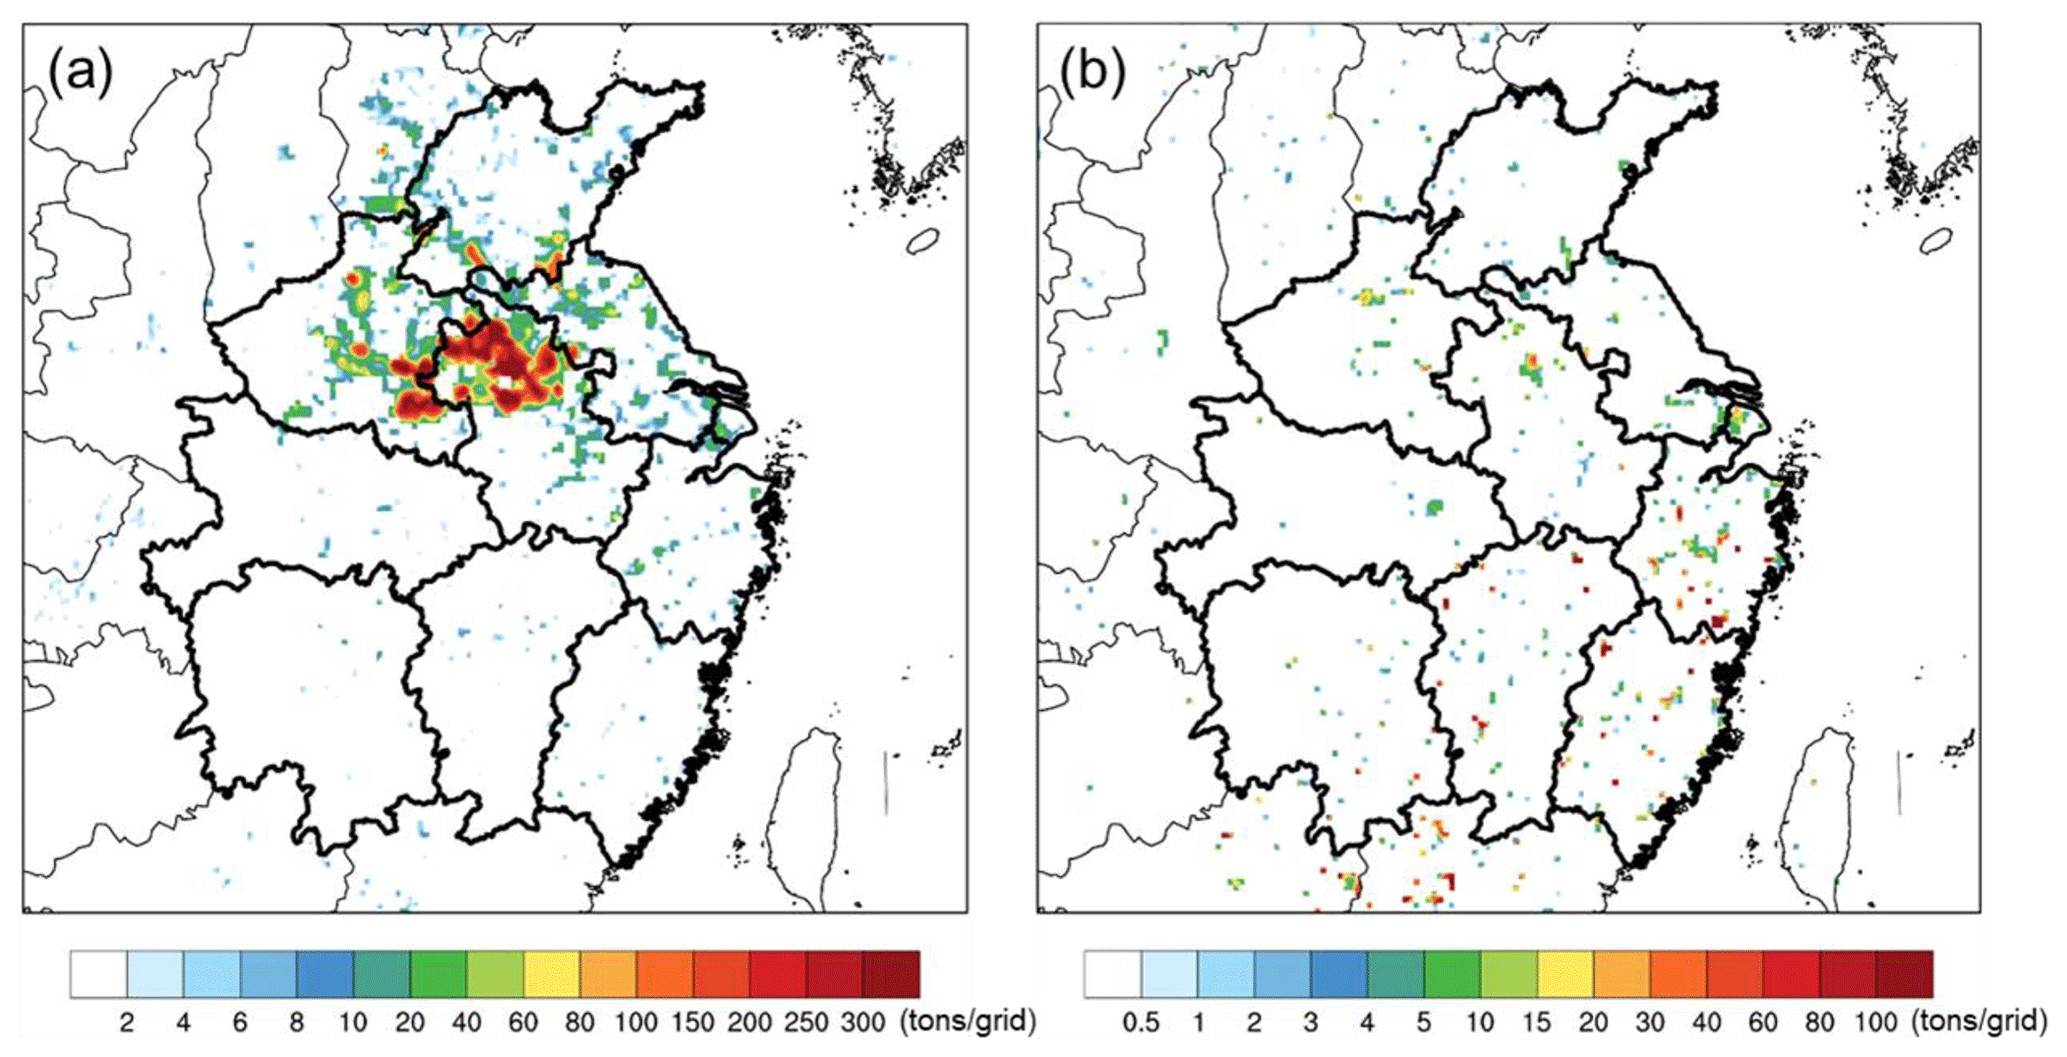
Figure 8Spatial distributions of constrained PM2.5 emissions from (a) OCSB and (b) other types of OBB for the study period. The maps were created by NCAR Command Language (NCL) (http://www.ncl.ucar.edu/, last access: 18 December 2019).
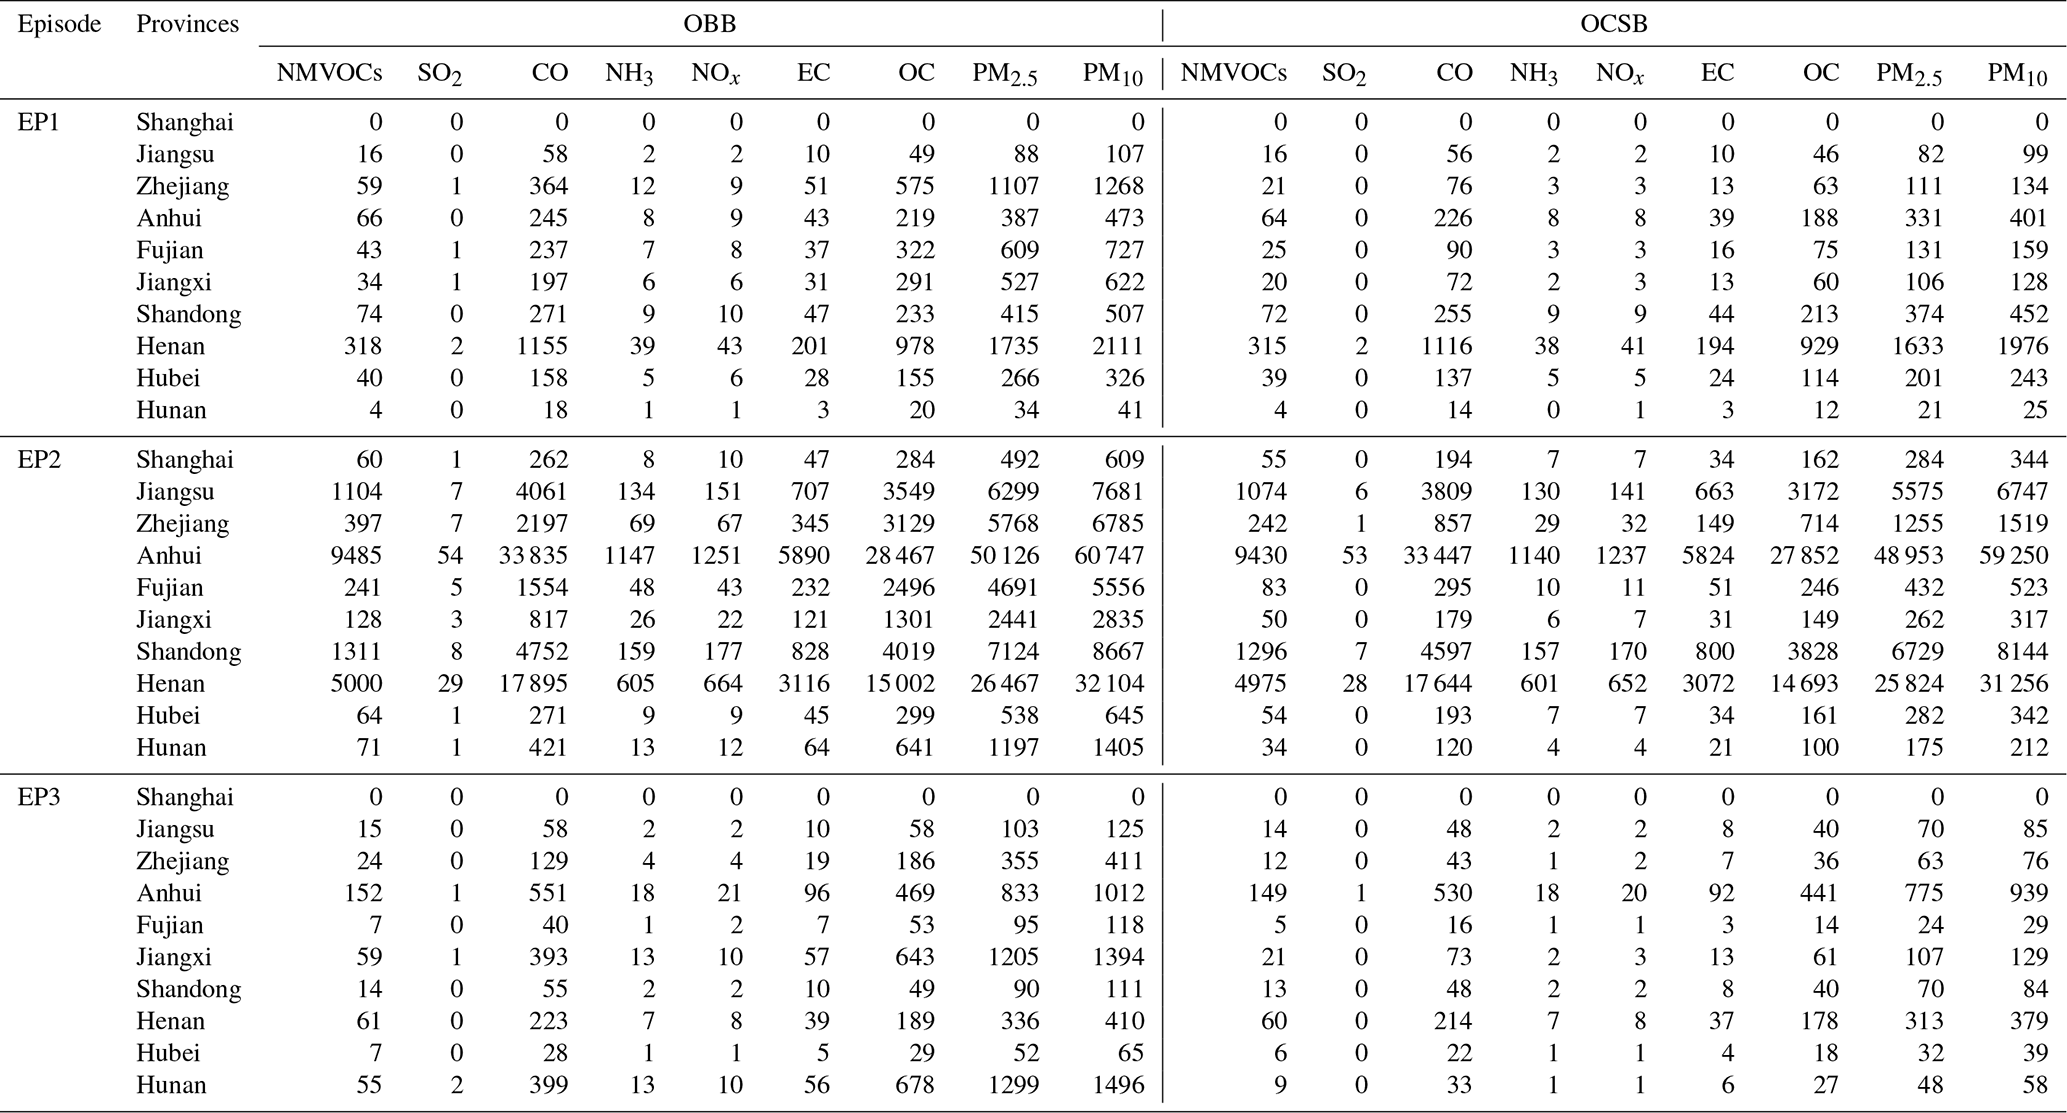
Table 1The constrained OBB and OCSB emissions for EP1, EP2, and EP3 for each province over CEC (units: million moles for NMVOCs, SO2, CO, NH3, and NOx and tonnes for EC, OC, primary PM2.5, and PM10).
3.4 Model evaluation
Accurate simulations of meteorological and chemical fields were a prerequisite for precise estimations of OBB contributions to the haze formation. Few previous OBB emissions established by bottom-up or top-down methods were evaluated directly. Here we assessed the optimal OBB emissions with the WRF-CMAQ model. This case is abbreviated as the OPT case hereinafter. The simulated chemical species (i.e., PM2.5, O3, SO2, CO, and NO2) and meteorological parameters (i.e., 10 m wind speed and direction, 2 m temperature, and planetary boundary layer height, PBLH) from the model were both taken into consideration by comparing with ground-based observations.
Figure 4 illustrates the spatial distributions of observed and simulated hourly PM2.5 concentrations in the OPT case for the entire CEC in EP1, EP2, and EP3. As discussed in Sect. 3.3, the OBB emissions from FINNv1.5 can drive the model to achieve reasonable results for typical situations, such as EP1, which, however, remained as slight underestimations of observations. It is important to note that the simulated PM2.5 concentrations in the BASE case were significantly lower than observations at most of the monitoring sites during EP2, especially in Henan, Anhui, Hubei, and Hunan as noted above. This implies that the original OBB emissions from FINNv1.5 substantially underestimate the emissions during the period of the OBB outbreak (i.e., EP2). Compared to the BASE case, the model results in the OPT case were able to reproduce more accurately the magnitudes and spatial patterns of observed PM2.5 concentrations. Specifically, the model with the optimal OBB emissions not only captures extremely high observations (> 115 µg m−3) in Henan, Anhui, Hubei, and Hunan for the OBB event during EP2 but also succeeds in reproducing relatively lower values in other provinces. For EP1 and EP3, simulated results in the OPT case increased to some extent as expected and became closer to observations by comparison. Besides, compared with the satellite retrievals, the model-derived AODs in the OPT case during EP2 presented the extremely similar spatial patterns over CEC (Fig. 5). They could especially reproduce the relatively high measurements over Henan, Anhui, Hubei, and Hunan. Nevertheless, we recognized the general underestimations of model-derived AODs, in particular over the areas with the extreme PM2.5 concentrations, which might be duo to the uncertainties in the numerical predictions of the plume rise of OBB (Tai et al., 2008; Fu et al., 2012a). Another explanation may be contamination of the observed AODs due to opaque clouds, as described by several studies (Huang et al., 2012; Aouizerats et al., 2015). These results establish reliable model performance.
To further evaluate the model performance, we examined the model capabilities at the provincial scale. Figure 6 displays the comparisons of observed and simulated hourly PM2.5 concentrations for the OPT case in Henan, Anhui, Hubei, Hunan, Jiangxi, Zhejiang, and Fujian. Besides the NMB, the correlation coefficient (R) was also used to evaluate the simulated results. Generally, the WRF-CMAQ model with the optimal OBB emissions can reasonably capture the temporal evolution of surface PM2.5 concentrations for these seven provinces. With the abundant observations as the constraint, the NMB values in these seven provinces were 1.1 %, 3.3 %, 0.2 %, 1.3 %, 1.4 %, 6.2 %, and 22.8 %, with R values of 0.90, 0.80, 0.53, 0.74, 0.56, 0.80, and 0.64. These results provide direct support for the reliable capability of the optimal OBB emissions, reproducing the steep rising curves of observed PM2.5 concentrations in Henan, Anhui, Hubei, and Hunan during EP2 when OBB might trigger regional haze over the central part of CEC, as shown in Figs. 4 and 6.
The first two peaks of observed PM2.5 during the study period occurred in Anhui and Henan. Observed PM2.5 concentrations in Anhui and Henan gradually increased from 42 µg m−3 on 1 June to 226 µg m−3 on 7 June and from 75 µg m−3 on 7 June to 226 µg m−3 on 10 June, respectively. Correspondingly, the model in Anhui and Henan captures this general temporal pattern, especially the maximum with NMB values of 9 % and 12 %, respectively. In contrast, regional transport might play a critical role in dominating two sudden outbreaks of observed PM2.5 concentrations in Hubei and Hunan with relatively high values of 335 and 252 µg m−3 on 12 June, respectively. The simulations to a large extent capture these two abrupt peaks, even though they consistently underestimate the maxima with the NMB values ranging from 20 % to −15 %. Note that a distinct 12 h time lag exists between the observed and simulated peaks of PM2.5 concentrations in Hubei, which is associated with possible uncertainties in meteorological simulations.
Besides, we also evaluated the simulated PM2.5 composition (K+, , , OC, and ) (Table S5). Compared to the BASE case, the simulated results in the OPT case at the Changsha, Hefei, and Yucheng sites were raised to various degrees and improved in general. Specifically, the NMB values of the simulated and were reduced from – 47.5 % to −14.1 % and from −30.4 % to −0.9 %, respectively, marking the reliable role of the constraining method to a large extent. The simulated OC concentrations presented similar growth trends but remained inadequate (−48.7 % to −6.6 %), indicating the missing mechanisms and insufficient simulations of secondary organic aerosols in the AERO6 scheme. On the contrary, the OPT case was prone to underestimate K+ (−79.1 % to −20.0 %) and failed to capture the spatiotemporal changes in (−69.3 % to 391.0 %). This might be associated with the large uncertainties in the chemical speciation in the original OBB emissions. However, it should be noted that the OPT case can effectively stabilize the model performance in reproducing (∼24.7 %) when their values were larger than 10 µg m−3. In addition, the constrained OBB emissions also improved the model performance at the Qianyanzhou site, while the Wuxi site seemed to be irrelevant to the OBB case. Hence, the constraining method enables the model to optimize the simulated PM2.5 composition over CEC to some extent.
For other chemical species and main meteorological parameters, Tables S6 and S7 indicate that the WRF-CMAQ model with the optimal OBB emissions also reproduces reasonable results, with most R values greater than 0.7 and NMB values within ±30 %. Specifically, compared to the BASE case, the NMB and R values for some species (i.e., CO, PM10, and PM2.5), largely contributed by OBB emissions in the OPT case, were also considerably improved, reaching a level of ±25 %.
3.5 Relative contributions of OCSB and OBB to regional haze formation
We designed three model simulations to simultaneously isolate OCSB and OBB contributions to PM2.5 concentrations over CEC, i.e., the first with only anthropogenic and biogenic emissions (referred to as the NOBB case), the second with not only anthropogenic and biogenic emissions but also constrained OCSB emissions (referred to as the OPT_OCSB case), and the last with not only anthropogenic and biogenic emissions but also total constrained OBB emissions (namely the OPT case). In this study, OCSB and OBB contributions were quantified by differences between simulated PM2.5 concentrations in different cases in terms of absolute mass concentrations and relative contributions:
where NOBBmass, OPT_OCSBmass, and OPTmass represent simulated PM2.5 concentrations in the BASE, OPT_OCSB, and OPT cases, respectively. OCSBmass (OBBmass) and OCSBcontribution (OBBcontribution) denote contributions from OCSB (OBB) in regard to absolute PM2.5 mass concentrations and relative contributions, respectively.
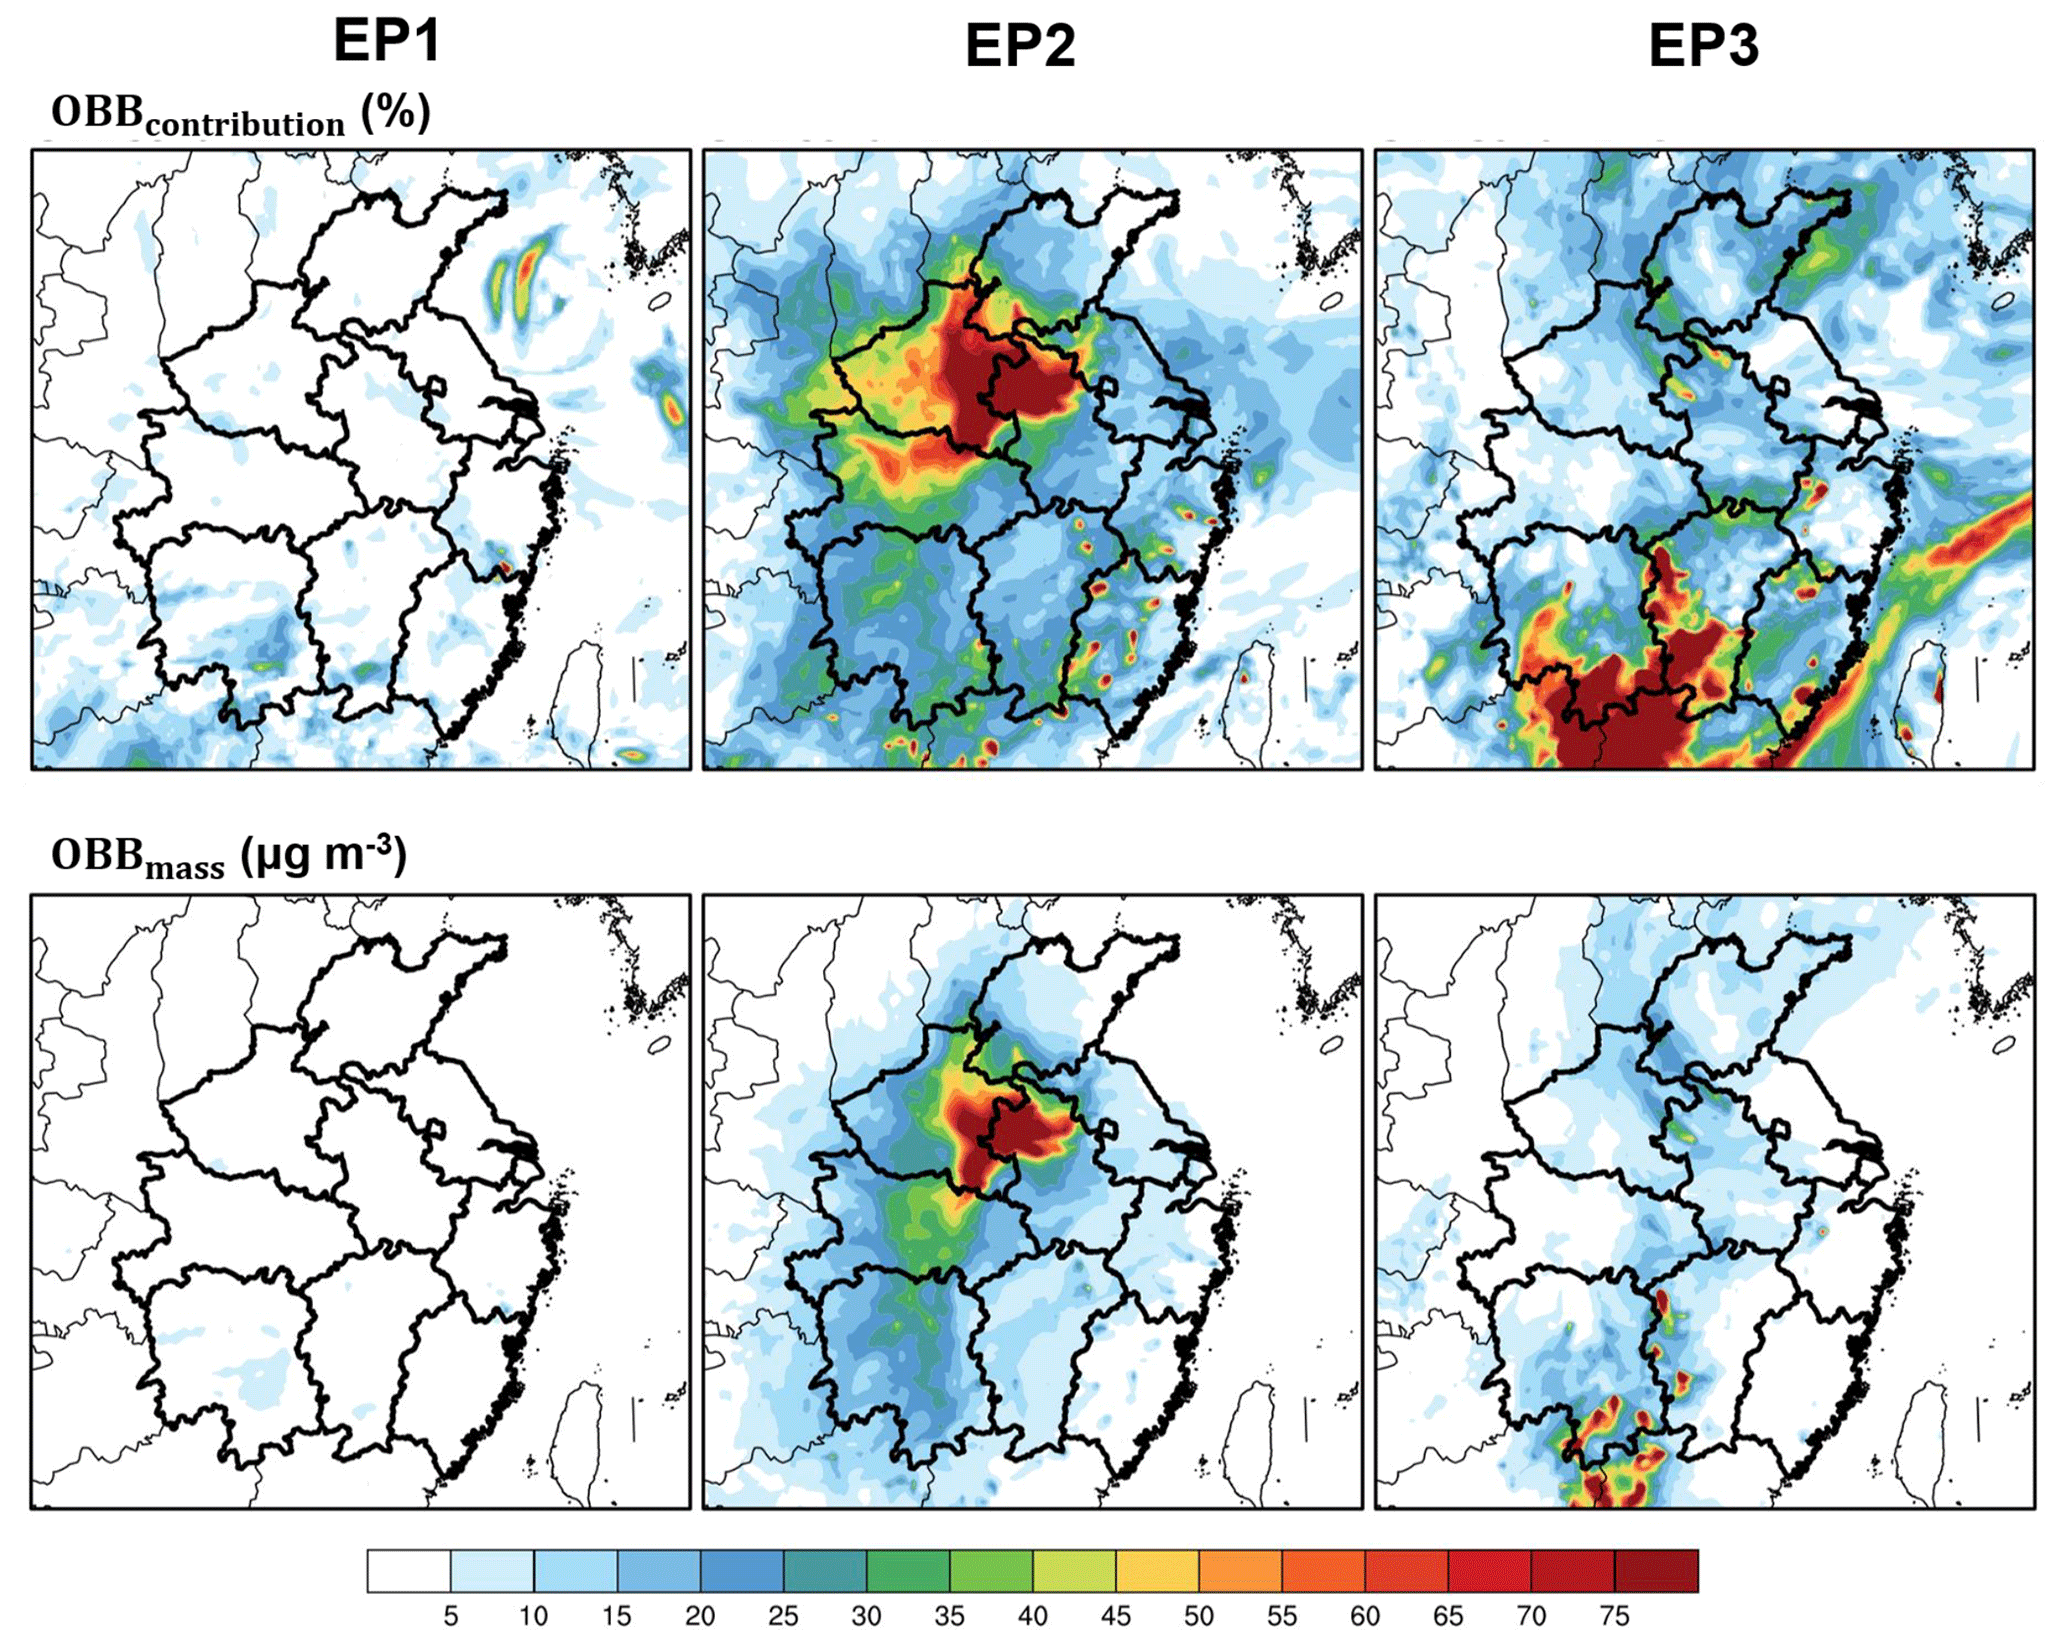
Figure 9Spatial distributions of OBBmass and OBBcontribution during EP1, EP2, and EP3. The maps were created by NCAR Command Language (NCL) (http://www.ncl.ucar.edu/, last access: 19 December 2019).
Figure 9 shows spatiotemporal distributions of OBBmass and OBBcontribution during EP1, EP2, and EP3. For CEC, OBB during EP2 had much more significant impacts than those during EP1 and EP3 on regional PM2.5 concentrations. In particular, OBB contributed up to more than 75 % (> 75 µg m−3) to surface PM2.5 concentrations over the border of Henan and Anhui during EP2. These spatial distributions were exactly consistent with those of OBB emissions and the regional haze, implying the key role of OBB emissions in triggering the regional haze formation. In contrast, PM2.5 concentrations also increased substantially by 14–74 µg m−3 (16 %–78 %) in Hubei and Hunan, where no apparent OBB emissions were detected. This phenomenon should be attributed to regional transport of air pollution. It is worth noting that there were substantial declines in OBB emissions and PM2.5 concentrations with significant decreases in OBB contributions consistently occurring over CEC during EP3. This indicates that stringent controls on the OBB emissions are still conspicuously beneficial for regional air quality. On the other hand, massive OCSB pollutants mainly emitted in Henan and Anhui were not transported to the eastern coastal zones of CEC during EP3. In addition, local OBB would not lead to regional haze in the southern edge of CEC despite its large contributions (> 75 %). As shown in Fig. 10, OCSB contributions show largely similar spatiotemporal distributions to those of OBB, indicating that OCSB generally played a key role in reshaping PM2.5 concentrations over CEC. During the OCSB outbreak period, its relative contributions were significantly higher than those in other periods. However, OCSB contributions were located at some typical areas, namely the common border between Henan and Anhui (> 75 µg m−3, 75 %) and central narrow zones between Hubei and Hunan (> 35 µg m−3, 39 %). For other provinces, its relative contributions were within a narrow range of approximately 20 %. Figure 11 highlights that fairly large proportions (more than 80 %) of OBB contributions came from OCSB over most parts of CEC, indicating that OCSB should play a dominant role in reshaping spatial and temporal distributions of regional PM2.5 concentrations over most parts of CEC during the study period, especially for EP2. In contrast, other types of OBB barely influenced the haze formation in Jiangxi, Fujian, and Zhejiang (< 10 µg m−3).
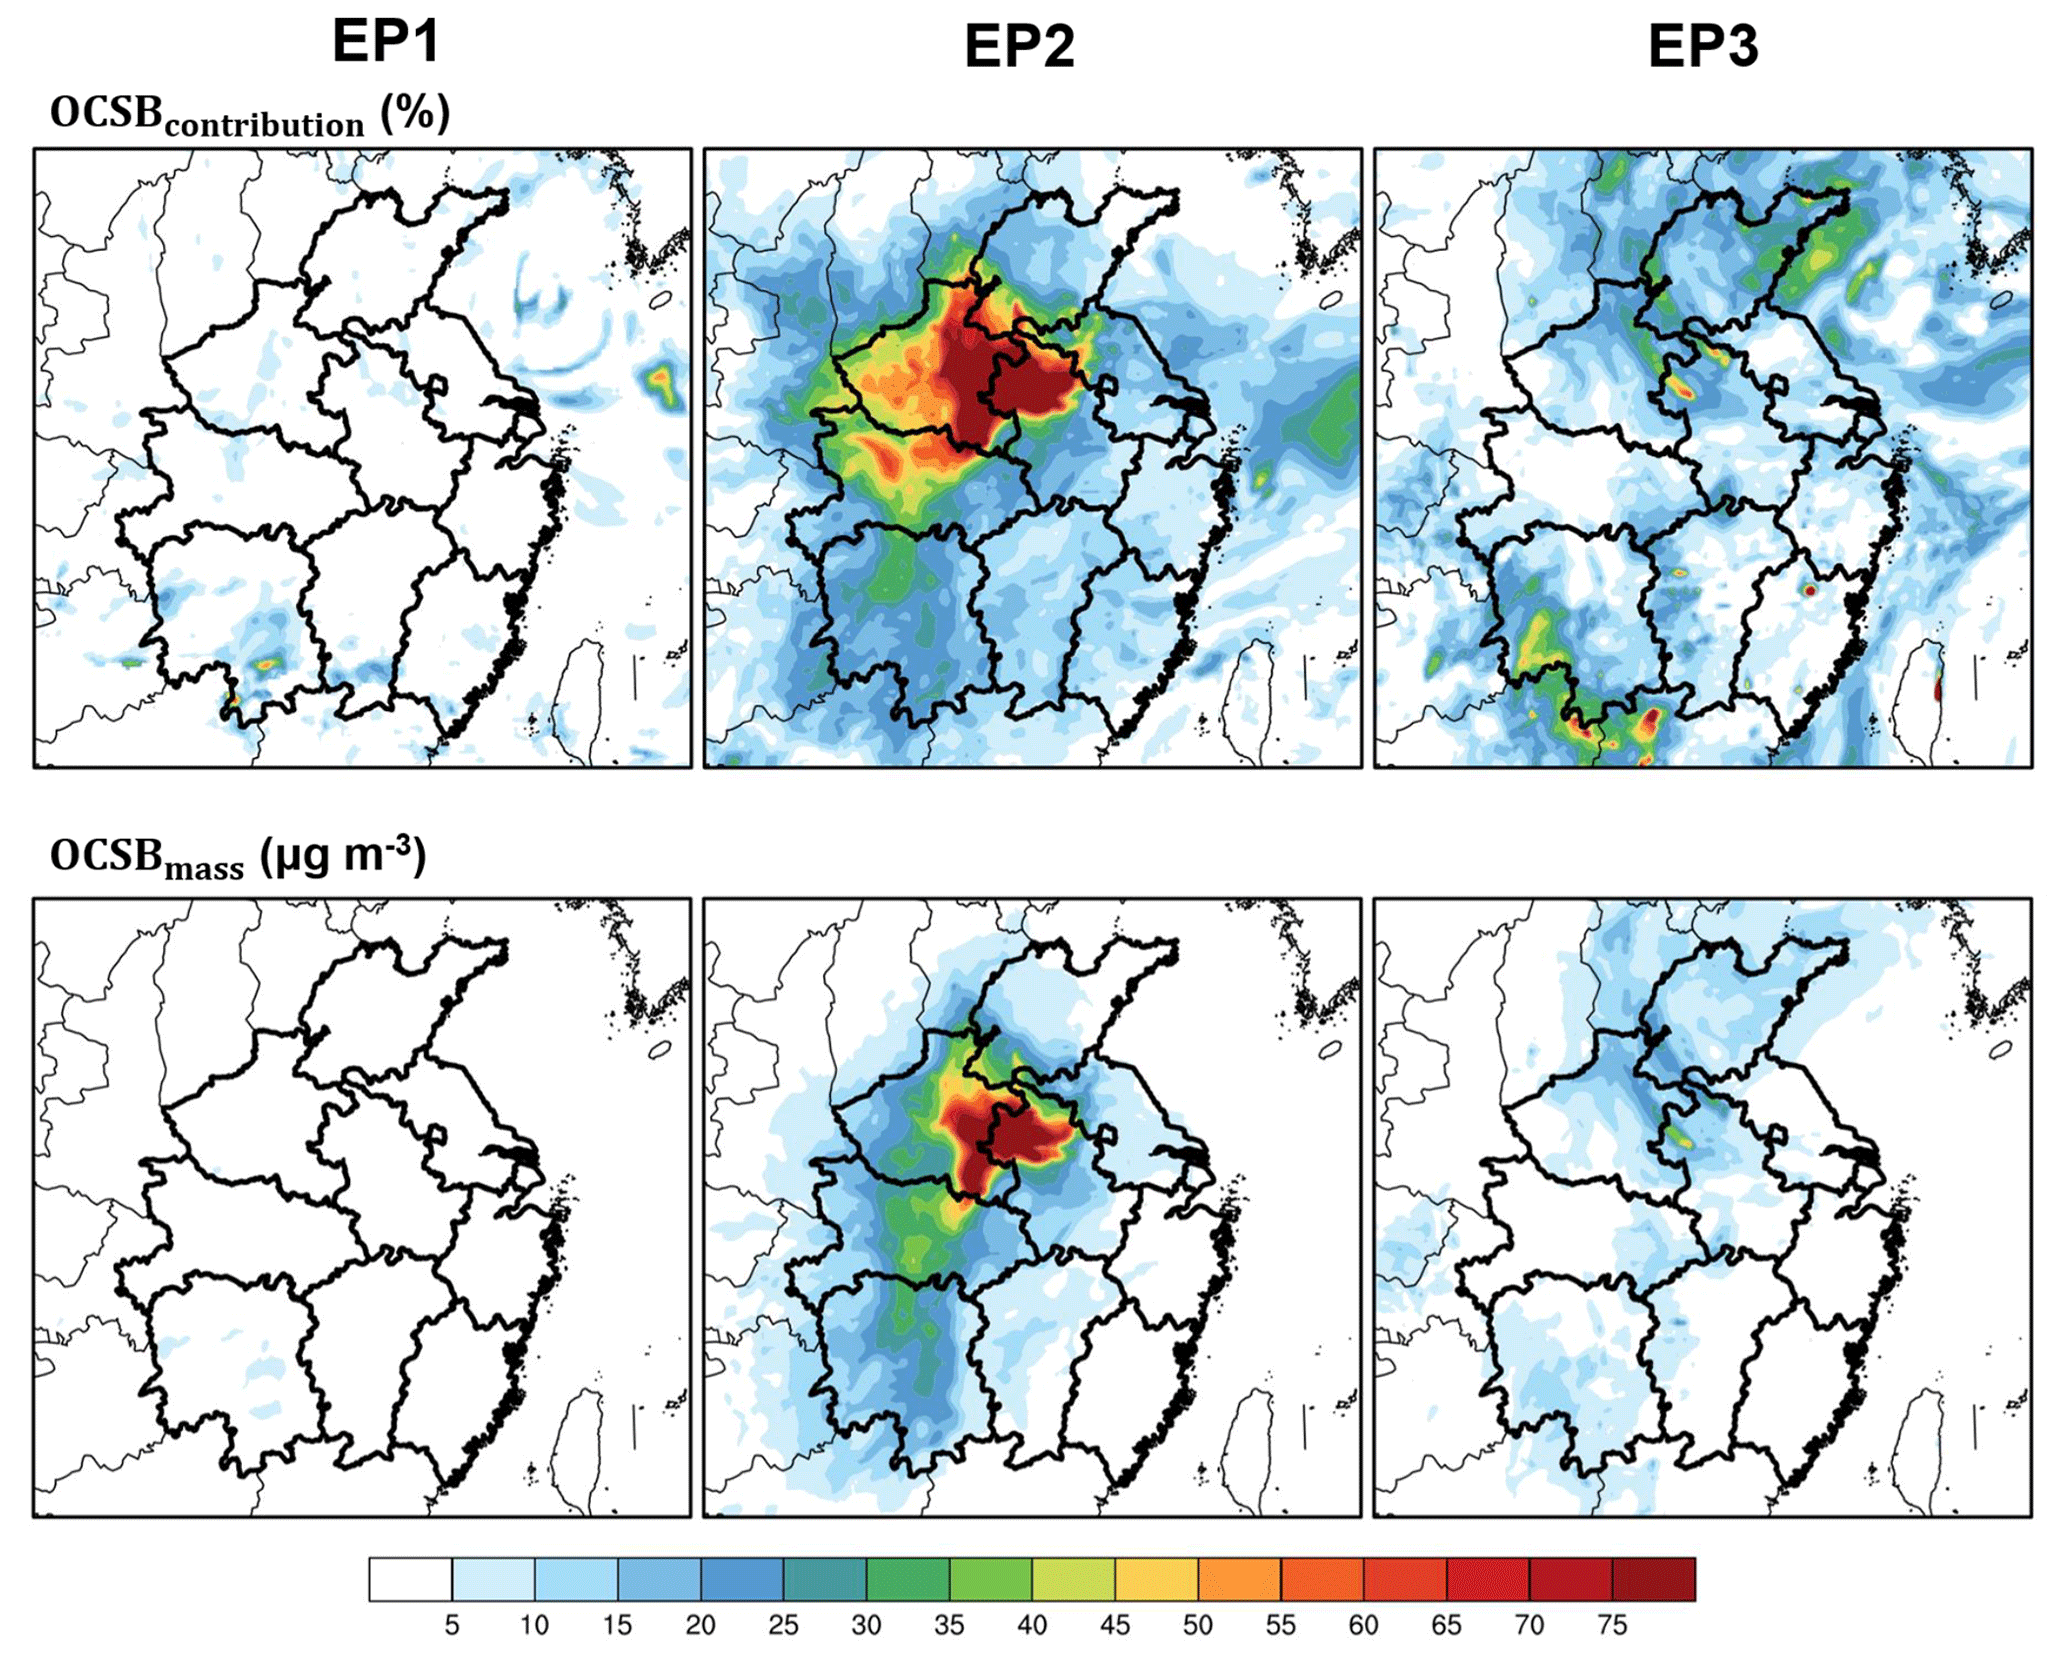
Figure 10The same as Fig. 9 but for OCSBmass and OCSBcontribution. The maps were created by NCAR Command Language (NCL) (http://www.ncl.ucar.edu/, last access: 19 December 2019).
To further understand OCSB and OBB effects on regional haze formation over CEC, time series of OBB and OCSB contributions to hourly PM2.5 concentrations for seven provinces over CEC during the study period are examined in Fig. 6. Overall, OBB emissions had significant contributions to hourly PM2.5 concentrations in Henan (44.14 %, 23.82 µg m−3), Anhui (46.19 %, 36.24 µg m−3), Hubei (56.89 %, 37.69 µg m−3), Zhejiang (25.89 %, 17.79 µg m−3), and Fujian (28.97 %, 7.31 µg m−3) but lower impacts on those in Hunan (21.51 %, 13.86 µg m−3) and Jiangxi (14.07 %, 7.11 µg m−3). It should be noted that most of the OBB (> 89 %) contributions uniformly resulted from OCSB emissions. For the OBB outbreak period, significant OBB contributions were found in Henan (60.47 %), Anhui (57.73 %), Hubei (42.91 %), and Hunan (29.14 %), whereas those in other provinces were in a small range (±15 %), and OCSB emissions always contributed to the most (more than 90 %). Note that the variations in OPT_OCSBmass in Henan and Anhui kept generally synchronized with those in local abundant OCSB emissions and haze. In contrast, the peak values of OPT_OCSBmass in Hubei and Hunan, where no extensive fire hotspots were detected, showed apparent temporal asynchronous signals (24–48 h) relative to those in Henan. This means OCSB was not only one of the significant local pollution sources but also a considerable regional source over CEC. On the other hand, other types of OBB emissions had an impact on local PM2.5 concentrations in Jiangxi (9.04 %), Fujian (11.82 %), and Zhejiang (10.08 %) but nominal effects (< 5 %) on the other provinces.

Figure 11The same as Fig. 10 but for the differences between OBBmass (OCSBmass) and OBBcontribution (OCSBcontribution). The maps were created by NCAR Command Language (NCL) (http://www.ncl.ucar.edu/, last access: 22 December 2019).
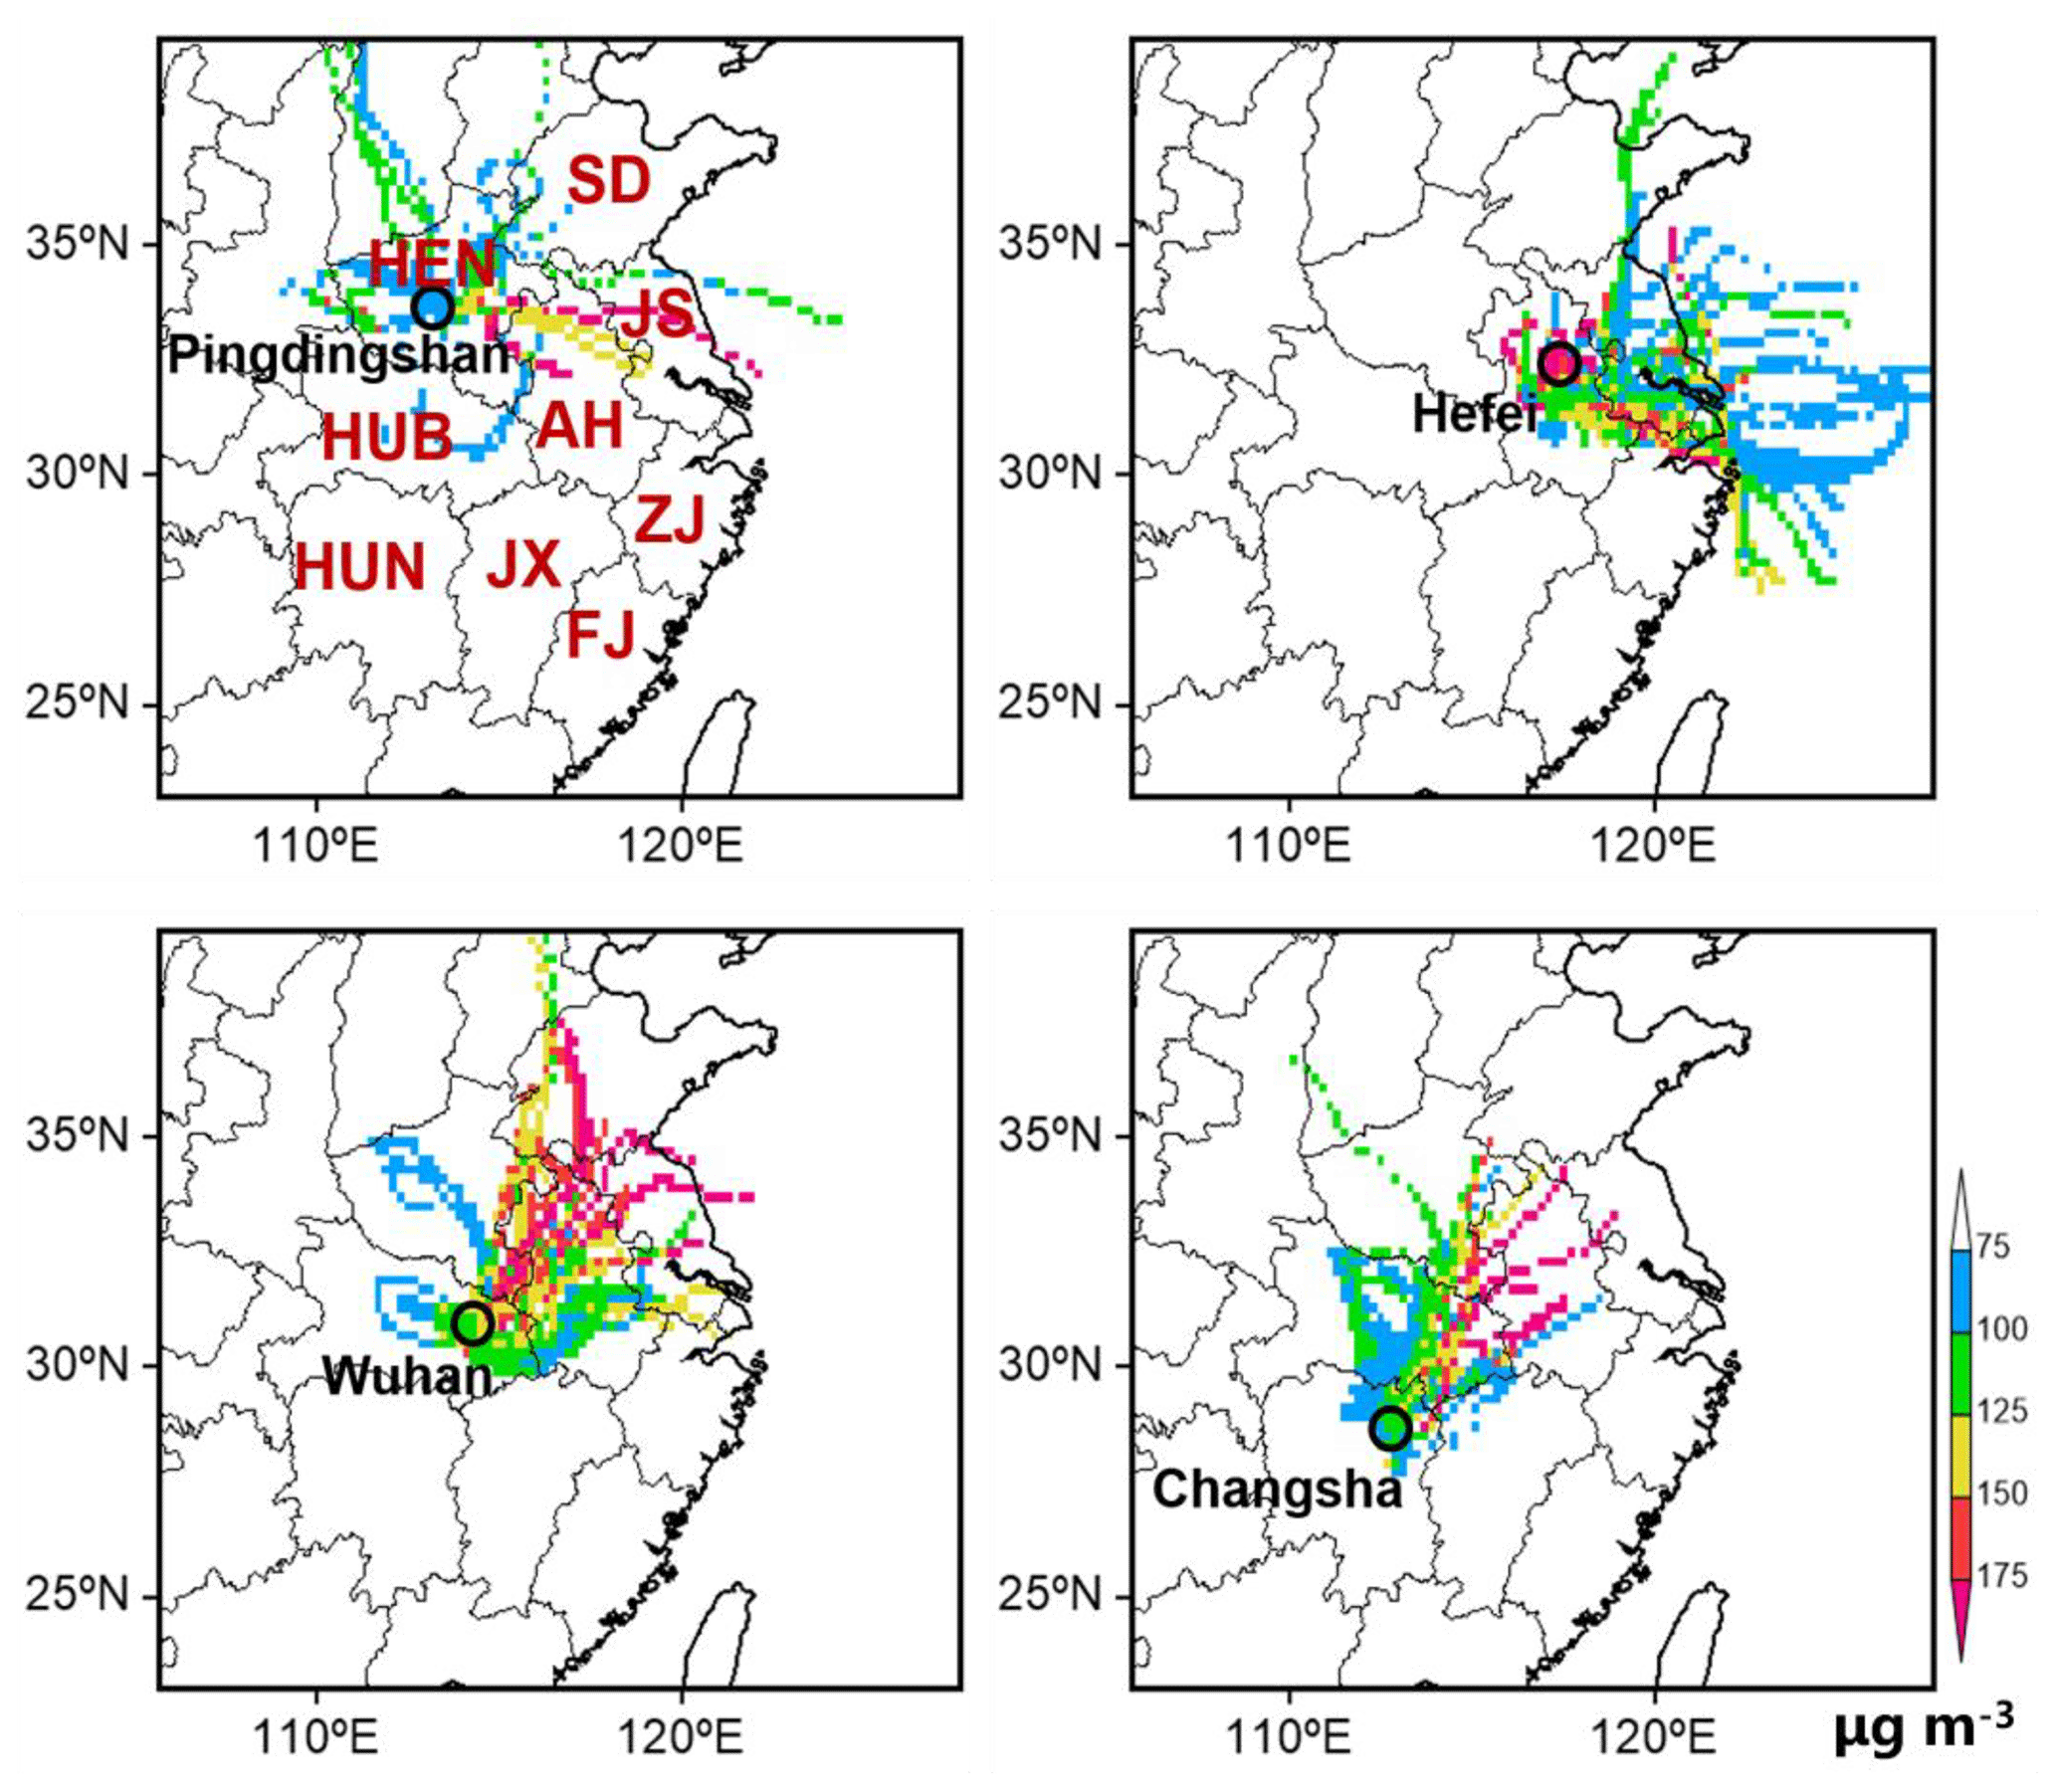
Figure 12CWT maps during EP2 at four representative cities (Pingdingshan, Hefei, Wuhan, and Changsha) that represent Henan, Anhui, Hubei, and Hunan, respectively. The maps were created by NCAR Command Language (NCL) (http://www.ncl.ucar.edu/, last access: 22 December 2019).
3.6 Potential OCSB emission sources and associated meteorological causes
OCSB emissions can have significant impacts on local and regional haze in Henan, Anhui, Hubei, and Hunan. There is thus a need to explore associated potential sources and meteorological conditions. First, we utilized the CWT method to investigate potential OCSB emission sources triggering regional severe haze. To pinpoint potential emission sources for OCSB, Pingdingshan, Hefei, Wuhan, and Changsha were selected as receptor sites to represent Henan, Anhui, Hubei, and Hunan, respectively. Figure 12 presents spatial distributions of the CWT values calculated based on the hybrid receptor model (Fig. S1 in the Supplement) and observed PM2.5 concentrations for these cities. It should be noted that only sources with relatively high CWT values (> 150 µgm−3) were used as potential major sources leading to regional severe haze. For Henan and Anhui, most of the potential major sources concentrated in local areas with large amounts of OCSB emissions during EP2, thereby suggesting the dominant role of local OCSB emissions. For Hubei and Hunan, however, potential major sources were also located in common areas in Henan and Anhui, especially over the border between them, thus clearly demonstrating that local haze in Hubei and Hunan was caused by regional transport of emissions from Henan and Anhui. In summary, OCSB emissions in Henan and Anhui should be mainly responsible for regional haze over CEC during EP2.
Atmospheric pollution processes, especially wind fields, are closely related to synoptic weather patterns. A high-pressure system is usually considered to be the governing synoptic pattern contributing to accumulation of air pollutants, whereas the differences between high- and low-pressure systems are thought to be the major cause of transport on the regional scale. Figure 13 uses surface pressure maps from 8–11 June to explore the relationships among synoptic pressure patterns, OBB emissions, and haze formation over CEC. On 8 June, concurrent with the OCSB outbreak, an extensive high-pressure system enveloped CEC, forming a stationary condition and facilitating rapid accumulations of PM2.5 in Henan and Anhui. Thereafter, it gradually turned into the low-pressure system on 9 June located at Jiangxi, receiving pollutants originating from Henan and Anhui by the differential field between the high- and low-pressure systems. This differential field also established positive dispersion conditions for Anhui, although OCSB emissions were still occurring there. Thereafter the stationary high-pressure system made a brief stay in Henan and Anhui on 10 June, being prone to accumulate elevated PM2.5 concentration; then a narrow low-pressure corridor squeezed by two high-pressure zones went through Henan, Hubei, and Hunan, thus facilitating regional transport of severe haze.

Figure 13Surface weather maps for 8, 9, 10, and 11 June over CEC. Surface weather patterns were obtained from the Korea Meteorological Administration (http://www.kma.go.kr/eng/weather/images/analysischart.jsp, last access: 25 December 2019)
3.7 Comparison to previous studies
Numerous emission data on OBB have been established for CEC. These results, generally estimated based on statistics or satellite retrievals, have not generally been constrained by model or observations. Here we compare our constrained results with five representative emission datasets including GFASv1.0 (Kaiser et al., 2012), GFEDv4.1s (van der Werf et al., 2017), FINNv1.5 (Wiedinmyer et al., 2011), Qiu et al. (2016), and Zhou et al. (2017), as shown in Fig. 14. The first four inventories belong to satellite-based products, while the last one is derived with the traditional bottom-up method. Theoretically, there are two additional issues we need to note: (i) GFEDv4.1 incorporates small fires through the MODIS active fire detection product (Randerson et al., 2012); (ii) Qiu et al. (2016) is unable to discriminate small fires, but it can also detect more fire hotspots than GFASv1.0 and FINNv1.5 with the benefit of the extra MODIS burned area product (MCD64Al).
Figure 14 shows that the constrained OBB emissions in this study were generally higher than satellite-based estimates but lower than the bottom-up statistics (i.e., Zhou et al., 2017). For example, the constrained CO emissions over CEC were 5.2, 3.4, and 5.7 times larger than those in GFASv1.0, GFEDv4.1s, and FINNv1.5, respectively. By comparison, the constrained SO2 and NOx emissions were also closer to those of GFEDv4.1s. This indicates that small fires were projected to be central to OBB emissions since this OBB event was dominated by OCSB as mentioned, which always come from individual farmers with limited burned areas. In turn, for NMVOCs, EC, OC, PM2.5, and PM10, our estimates were much higher than those from GFEDv4.1s but closer to those derived from Qiu et al. (2016) and Zhou et al. (2017) with the difference ranging from −10 % to 73 %. Thus, relative to substantial underestimations in GFEDv4.1s despite additional small fires, such large increases in Qiu et al. (2016), which also acted as satellite-based estimates, should be attributed to extra detected fire hotspots. An emphasis should be given to Zhou et al. (2017), especially for higher SO2, CO, NOx, and NH3 emissions (> 4 times), inevitably leading to unreasonable overestimations of PM2.5 concentrations. On the other hand, the model involves various uncertainties due to inherent statistical parameters and has common disadvantages in allocating seemingly sufficient emission amounts into high spatiotemporal cases.
In summary, the constrained OBB emissions in this study not only supplement satellite-based estimates but also, to a large extent, avoid overestimations due to inherent uncertainties originating from bottom-up statistics.

In contrast to numerous OBB emission inventories for CEC, few studies focus on extreme OBB events over CEC to investigate OBB contributions to surface PM2.5. Cheng et al. (2014) applied numerical models with satellite-based OBB emissions and found obvious OBB effects (i.e., 23 %–48 %, 18–65 µg m−3) on surface PM2.5 in several cities over CEC (i.e., Ningbo, Shanghai, Nanjing, Hangzhou, and Suzhou) in June 2011. During the same period, Wu et al. (2017) utilized similar methods and found similar results in Nanjing (50 %). As expected, each of the two studies with raw satellite-based OBB substantially underestimated surface PM2.5 concentrations (−7 % to −38 %), especially in areas with intensive OBB activities at several times with peak concentrations (< −200 %). This would thus lead to relatively low estimates of OBB effects compared with our results. A recent study (Yang and Zhao, 2019) adopted the constraining method, i.e., similar to that in this study, to optimize OBB emissions for June 2012 but ignored the spatiotemporal heterogeneity of their adjustments, resulting in much more significant estimates of OBB effects (50 %–70 %) than before, while slightly lower than those in our study. This implies that more detailed constrained methods, such as province-specific and even grid-specific adjustments, should be helpful to establish reliable OBB emissions with high spatial and temporal resolutions over CEC.
OBB, especially OCSB, has long been suspected of being the source of rapid deterioration of regional air quality over CEC during the harvest seasons. Up to now, satellite-based FINNv1.5 provides a unique opportunity to constrain variations in OBB and OCSB emissions with a high spatiotemporal resolution, despite substantial underestimations mainly resulting from unresolved agricultural small fires surrounding large fire hotspots. Here, we selected June 2014 as the study period, which includes a complete spatiotemporal evolution process (i.e., from 1–19 June) of OBB and regional haze over CEC. We combined ground-based PM2.5 measurements and model predictions with FINNv1.5 to constrain OBB emissions in terms of spatiotemporal variations. It is demonstrated that the constrained optimal emissions can allow the WRF-CMAQ model to reproduce spatiotemporal chemical fields induced by OBB more reasonably. By comparison, the optimal OBB emissions can, to a large extent, not only supplement insufficient estimations derived from satellite retrievals but also reduce overestimates of bottom-up methods. These model results were thus used to simultaneously isolate OBB and OCSB impacts on spatial and temporal evolutions of PM2.5 concentrations. Further, we employed the CWT method as well as analysis of surface pressure maps to explore potential major OBB sources and corresponding meteorological contributions. These results can provide an effective and efficient reference for policymakers to improve environmental control strategies. The results are summarized as follows:
-
OCSB dominated OBB emissions during the study period by accounting for 74 %–94 %, with 81 %–88 % of OBB emissions occurring during EP2 (from 5–14 June). OBB mainly associated with OCSB emissions presented significant spatial and temporal inhomogeneities, mainly (> 60 %) concentrating in Henan and Anhui during EP2. Meanwhile, a strong spatiotemporal correlation with local haze occurred in Henan and Anhui, indicating its critical role in affecting local PM2.5 concentrations. In addition, they might also trigger regional haze in Hubei and Hunan through regional transport. By comparison, most of the other types of OBB emission (> 71 %) were located in Anhui, Zhejiang, and Jiangxi.
-
The optimal adjustment coefficients for OBB emissions over CEC during the study period were not constant but varied depending on their spatial and temporal evolutions. Original FINNv1.5 roughly underestimated OBB emissions by a factor of 5–7 during EP2, but only a factor of 2–4 during EP1 and EP3. Specifically, with respect to Henan, Anhui, and other provinces over CEC, the optimal adjustment factors of OBB emissions were 6, 7, and 5 for EP2, respectively, whereas they were 4, 4, and 2 for EP1 and EP3, respectively.
-
With constrained optimal OBB emissions, the WRF-CMAQ model could reproduce chemical and meteorological fields reasonably during the study period from regional to provincial scales. Specifically, the model captured the rapid outbreak of PM2.5 concentrations in Henan, Anhui, Hubei, and Henan. The correlation coefficients (R) between simulated and measured PM2.5 concentrations succeeded 0.6, and most of the corresponding NMB values were within 10 % over CEC.
-
OBB played a key role in reshaping spatial and temporal distributions of regional PM2.5 concentrations over CEC during the study period, and contributed up to more than 89 % by OCSB, especially in Henan, Anhui, Hubei, and Hunan during EP2. By comparison, other types of OBB also, to a certain extent, influenced the haze formation in Jiangxi, Fujian, and Zhejiang.
-
OCSB was not only a critical local source but also had substantial impacts on regional haze. Potential major OCSB emission sources leading to severe haze in Henan, Anhui, Hubei, and Hunan during EP2 were mostly located in Henan and Anhui, especially their borders. This finding highlights that effective and efficient OCSB control strategies were not implemented in these regions. Conversely, other types of OBBs only exhibited their impacts on local haze in Anhui, Zhejiang, and Jiangxi.
-
Stationary high-pressure systems led to relatively stable conditions in Henan and Anhui and thus played a cardinal role in enhancing local PM2.5 concentrations during EP2. Moreover, the transitions between the high- and low-pressure systems drive regional transport, directly facilitating accumulation of pollutants from Henan and Anhui to Hubei, Hunan, and Jiangxi. Therefore, interprovincial joint enforcement actions in terms of OBB prohibitions should be strictly undertaken.
To optimize the OBB emissions, previous attempts always focused on the primary emissions but neglected aerosol–radiation interactions (Uranishi et al., 2019; Yang and Zhao, 2019). Theoretically, with the aid of the systematic considerations of aerosol–radiation interactions in the two-way coupled WRF-CMAQ model, this study was projected to achieve more reliable results. A lot of previous studies have applied the same or similar model to explore the impacts of aerosol–radiation interactions. However, it has been found that this process generally enhanced surface PM2.5 concentrations by 8 %–12 % over CEC (Wang et al., 2014; L. Wang et al., 2015; X. Y. Zhang et al., 2015, 2018; Jung et al., 2019). Compared to the significant underestimations of the OBB emissions (5–7 times) and the resultant PM2.5 pollution (> 50 %) during EP2, the impacts of aerosol–radiation interactions become irrelevant here. More importantly, the associated process analysis has no benefit for addressing the main task of this study. Looking forward, it is necessary to advance the scientific understandings of the role of the constrained OBB-induced aerosol–radiation interactions in disturbing the local weather systems as well as surface PM2.5 pollution. Considering the distinct topic, we should combine sufficiently specific observations to give impetus to comprehensive process analysis, which will be the topic of a separate study.
It is challenging to detect small fires that are far from fire hotspots. Thus, one should take more satellite-based fire products into consideration. Besides, geostationary satellites might be the prospective means to overcome the limitation of time spans of polar-orbiting satellites. In addition, precise simulations of smoke plume and related chemical reactions are both challenging for regional and global models. The constraining method combining model results and available observations could be an effective way to reduce large uncertainties in the OBB emission inventories. Furthermore, uniform optimal factors for all species of OBB emissions are used in this study. It is necessary to conduct species-specific adjustments in order to accurately investigate OBB effects. Similarly, province-specific and even grid-specific adjustments should also be further explored. Therefore, to improve the model capability in quantifying OBB and OCSB effects on regional air quality, more comprehensive experiments, field measurements, and modeling efforts are called for.
The MODIS data can be freely accessed at https://earthdata.nasa.gov/ (last access: 5 August 2019). GFASv1.0 data are available from http://apps.ecmwf.int/datasets/data/cams-gfas/ (last access: 5 August 2019). GFED4s data can be downloaded from https://daac.ornl.gov/VEGETATION/guides/fire_emissions_ v4.html (last access: 5 August 2019). FINNv1.5 data can be found at http://bai.acom.ucar.edu/Data/fire/ (last access: 5 August 2019).
The supplement related to this article is available online at: https://doi.org/10.5194/acp-20-2419-2020-supplement.
SY and PL designed this study; SY, PL, KM, YW, LW, and JHS carried out analyses, interpreted data, and wrote the article. XC, ZL, YZ, ML, WL, YZ, and DR contributed to the discussion.
The authors declare that they have no conflict of interest.
This study is supported by the Department of Science and Technology of China (nos. 2016YFC0202702, 2018YFC0213506, and 2018YFC0213503), the National Research Program for Key Issues in Air Pollution Control in China (no. DQGG0107), and the National Natural Science Foundation of China (nos. 21577126 and 41561144004). Pengfei Li is supported by the Initiation Fund for Introducing Talents of Hebei Agricultural University (412201904). We acknowledge the great support of SCAS-CERN, Institute of Atmospheric Physics, Chinese Academy of Sciences (CAS), for providing the CARE-China data for analysis.
This study is supported by the Department of Science and Technology of China (grant nos. 2016YFC0202702, 2018YFC0213506, and 2018YFC0213503), the National Research Program for Key Issues in Air Pollution Control in China (grant no. DQGG0107), the National Natural Science Foundation of China (grant nos. 21577126 and 41561144004), the Initiation Fund for Introducing Talents of Hebei Agricultural University (grant no. 412201904), the SCAS-CERN, the Institute of Atmospheric Physics, and the Chinese Academy of Sciences (CAS).
This paper was edited by Jianzhong Ma and reviewed by two anonymous referees.
An, Z., Huang, R.-J., Zhang, R., Tie, X., Li, G., Cao, J., Zhou, W., Shi, Z., Han, Y., Gu, Z., and Ji, Y.: Severe haze in Northern China: A synergy of anthropogenic emissions and atmospheric processes, P. Natl. Acad. Sci. USA, 116, 8657–8666, 2019.
Andersson, A., Deng, J., Du, K., Zheng, M., Yan, C., Sköld, M., and Gustafsson, O.: Regionally-varying combustion sources of the January 2013 severe haze events over eastern China, Environ. Sci. Technol., 49, 2038–2043, 2015.
Aouizerats, B., van der Werf, G. R., Balasubramanian, R., and Betha, R.: Importance of transboundary transport of biomass burning emissions to regional air quality in Southeast Asia during a high fire event, Atmos. Chem. Phys., 15, 363–373, https://doi.org/10.5194/acp-15-363-2015, 2015.
Baró, R., Lorente-Plazas, R., Montávez, J. P., and Jiménez-Guerrero, P.: Biomass burning aerosol impact on surface winds during the 2010 Russian heat wave, Geophys. Res. Lett., 44, 1088–1094, 2017.
Bikkina, S., Andersson, A., Kirillova, E. N., Holmstrand, H., Tiwari, S., Srivastava, A. K., Bisht, D. S., and Gustafsson, Ö.: Air quality in megacity Delhi affected by countryside biomass burning, Nat. Sustain., 2, 200–205, 2019.
Binkowski, F. S. and Roselle, S. J.: Models-3 Community Multiscale Air Quality (CMAQ) model aerosol component 1, Model description, J. Geophys. Res.-Atmos., 108, 335–346, 2003.
Bond, T. C., Doherty, S. J., Fahey, D. W., Forster, P. M., Berntsen, T., DeAngelo, B. J., Flanner, M. G., Ghan, S., Kärcher, B., Koch, D., Kinne, S., Kondo, Y., Quinn, P. K., Sarofim, M. C., Schultz, M. G., Schulz, M., Venkataraman, C., Zhang, H., Zhang, S., Bellouin, N., Guttikunda, S. K., Hopke, P. K., Jacobson, M. Z., Kaiser, J. W., Klimont, Z., Lohmann, U., Schwarz, J. P., Shindell, D., Storelvmo, T., Warren, S. G., and Zender, C. S.: Bounding the role of black carbon in the climate system: A scientific assessment, J. Geophys. Res.-Atmos., 118, 5380–5552, 2013.
Byun, D. and Schere, K. L.: Review of the governing equations, computational algorithms, and other components of the Models-3 Community Multiscale Air Quality (CMAQ) modeling system, Appl. Mech. Rev., 59, 51–77, 2006.
Cao, G., Zhang, X., Wang, Y., and Zheng, F.: Estimation of emissions from field burning of crop straw in China, Chinese Sci. Bull., 53, 784–790, 2008.
Carlton, A. G. and Baker, K. R.: Photochemical modeling of the Ozark isoprene volcano: MEGAN, BEIS, and their impacts on air quality predictions, Environ. Sci. Technol., 45, 4438–4445, 2011.
Carlton, A. G., Bhave, P. V, Napelenok, S. L., Edney, E. O., Sarwar, G., Pinder, R. W., Pouliot, G. A., and Houyoux, M.: Model representation of secondary organic aerosol in CMAQv4. 7, Environ. Sci. Technol., 44, 8553–8560, 2010.
Chen, J., Li, C., Ristovski, Z., Milic, A., Gu, Y., Islam, M.S., Wang, S., Hao, J., Zhang, H., He, C., Guo, H., Fu, H.,Miljevic, B., Morawska, L., Thai, P., Lam, Y. F., Pereira,G., Ding, A., Huang, X., and Dumka, U. C.: A review of biomass burning: Emissions and impacts on air quality, health and climate in China, Sci. Total Environ., 579, 1000–1034, 2017.
Cheng, Y., Engling, G., He, K.-B., Duan, F.-K., Ma, Y.-L., Du, Z.-Y., Liu, J.-M., Zheng, M., and Weber, R. J.: Biomass burning contribution to Beijing aerosol, Atmos. Chem. Phys., 13, 7765–7781, https://doi.org/10.5194/acp-13-7765-2013, 2013.
Cheng, Z., Wang, S., Fu, X., Watson, J. G., Jiang, J., Fu, Q., Chen, C., Xu, B., Yu, J., Chow, J. C., and Hao, J.: Impact of biomass burning on haze pollution in the Yangtze River delta, China: a case study in summer 2011, Atmos. Chem. Phys., 14, 4573–4585, https://doi.org/10.5194/acp-14-4573-2014, 2014.
Choi, Y.-J. and Fernando, H. J. S.: Implementation of a windblown dust parameterization into MODELS-3/CMAQ: Application to episodic PM events in the US/Mexico border, Atmos. Environ., 42, 6039–6046, 2008.
Chuang, M.-T., Fu, J. S., Lin, N.-H., Lee, C.-T., Gao, Y., Wang, S.-H., Sheu, G.-R., Hsiao, T.-C., Wang, J.-L., Yen, M.-C., Lin, T. H., Thongboonchoo, N., and Chen, W. C: Simulating the transport and chemical evolution of biomass burning pollutants originating from Southeast Asia during 7-SEAS/2010 Dongsha experiment, Atmos. Environ., 112, 294–305, 2015.
Clough, S. A., Shephard, M. W., Mlawer, E. J., Delamere, J. S., Iacono, M. J., Cady-Pereira, K., Boukabara, S., and Brown, P. D.: Atmospheric radiative transfer modeling: a summary of the AER codes, J. Quant. Spectrosc. Ra., 91, 233–244, 2005.
Dai, Q., Bi, X., Song, W., Li, T., Liu, B., Ding, J., Xu, J., Song, C., Yang, N., Schulze, B. C., Zhang, Y., Feng, Y., and Hopke, P. K.: Residential coal combustion as a source of primary sulfate in Xi'an, China, Atmos. Environ., 196, 66–76, 2019.
Digar, A. and Cohan, D. S.: Efficient characterization of pollutant-emission response under parametric uncertainty, Environ. Sci. Technol., 44, 6724–6730, 2010.
Ding, A. J., Huang, X., Nie, W., Sun, J. N., Kerminen, V. M., Petäjä,T., Su, H., Cheng, Y. F., Yang, X. Q., Wang, M. H., Chi, X. G., Wang, J. P., Virkkula, A., Guo, W. D., Yuan, J., Wang, S. Y., Zhang, R. J., Wu, Y. F., Song, Y., Zhu, T., Zilitinkevich, S., Kulmala, M., and Fu, C. B.: Black carbon enhances haze pollution in megacities in China, Geophys. Res. Lett., 43, 2873–2879 , https://doi.org/10.1002/2016GL067745, 2016.
Duan, F., Liu, X., Yu, T., and Cachier, H.: Identification and estimate of biomass burning contribution to the urban aerosol organic carbon concentrations in Beijing, Atmos. Environ., 38, 1275–1282, 2004.
Fountoukis, C. and Nenes, A.: ISORROPIA II: a computationally efficient thermodynamic equilibrium model for K+– – – – Na+– – – Cl−– H2O aerosols, Atmos. Chem. Phys., 7, 4639–4659, https://doi.org/10.5194/acp-7-4639-2007, 2007.
Freitas, S. R., Longo, K. M., and Andreae, M. O.: Impact of including the plume rise of vegetation fires in numerical simulations of associated atmospheric pollutants, Geophys. Res. Lett., 33, L17808, https://doi.org/10.1029/2006GL026608, 2006.
Fu, J. S., Hsu, N. C., Gao, Y., Huang, K., Li, C., Lin, N.-H., and Tsay, S.-C.: Evaluating the influences of biomass burning during 2006 BASE-ASIA: a regional chemical transport modeling, Atmos. Chem. Phys., 12, 3837–3855, https://doi.org/10.5194/acp-12-3837-2012, 2012a.
Fu, P. Q., Kawamura, K., Chen, J., Li, J., Sun, Y. L., Liu, Y., Tachibana, E., Aggarwal, S. G., Okuzawa, K., Tanimoto, H., Kanaya, Y., and Wang, Z. F.: Diurnal variations of organic molecular tracers and stable carbon isotopic composition in atmospheric aerosols over Mt. Tai in the North China Plain: an influence of biomass burning, Atmos. Chem. Phys., 12, 8359–8375, https://doi.org/10.5194/acp-12-8359-2012, 2012b.
Gao, M., Carmichael, G. R., Wang, Y., Saide, P. E., Yu, M., Xin, J., Liu, Z., and Wang, Z.: Modeling study of the 2010 regional haze event in the North China Plain, Atmos. Chem. Phys., 16, 1673–1691, https://doi.org/10.5194/acp-16-1673-2016, 2016.
Hamilton, D. S., Hantson, S., Scott, C. E., Kaplan, J. O., Pringle, K. J., Nieradzik, L. P., Rap, A., Folberth, G. A., Spracklen, D. V., and Carslaw, K. S.: Reassessment of pre-industrial fire emissions strongly affects anthropogenic aerosol forcing, Nat. Commun., 9, 3182, https://doi.org/10.1038/s41467-018-05592-9, 2018.
Hong, J., Ren, L., Hong, J., and Xu, C.: Environmental impact assessment of corn straw utilization in China, J. Clean. Prod., 112, 1700–1708, 2016.
Hooghiemstra, P. B., Krol, M. C., Van Leeuwen, T. T., Van Der Werf, G. R., Novelli, P. C., Deeter, M. N., Aben, I., and Röckmann, T.: Interannual variability of carbon monoxide emission estimates over South America from 2006 to 2010, J. Geophys. Res.-Atmos., 117, D15308, https://doi.org/10.1029/2012JD017758, 2012.
Hsu, Y.-K., Holsen, T. M., and Hopke, P. K.: Comparison of hybrid receptor models to locate PCB sources in Chicago, Atmos. Environ., 37, 545–562, 2003.
Hu, J., Wu, L., Zheng, B., Zhang, Q., He, K., Chang, Q., Li, X., Yang, F., Ying, Q., and Zhang, H.: Source contributions and regional transport of primary particulate matter in China, Environ. Pollut., 207, 31–42, 2015.
Huang, J., Hsu, N. C., Tsay, S.-C., Holben, B. N., Welton, E. J., Smirnov, A., Jeong, M.-J., Hansell, R. A., Berkoff, T. A., Liu, Z., Campbell, G.-R., Liew, S. C., and Barnes, J. E.: Evaluations of cirrus contamination and screening in ground aerosol observations using collocated lidar systems, J. Geophys. Res.-Atmos., 117, D15204, https://doi.org/10.1029/2012JD017757, 2012.
Huang, R.-J., Zhang, Y., Bozzetti, C., Ho, K.-F., Cao, J.-J., Han, Y., Daellenbach, K. R., Slowik, J. G., Platt, S. M., Canonaco, F., Zotter, P., Wolf, R., Pieber, S. M., Bruns, E. A., Crippa, M.,Ciarelli, G., Piazzalunga, A., Schwikowski, M., Abbaszade, G.,Schnelle-Kreis, J., Zimmermann, R., An, Z., Szidat, S., Baltensperger, U., Haddad, I. E., and Prévôt, A. S. H.: High secondary aerosol contribution to particulate pollution during haze events in China, Nature, 514, 218–222, 2014.
Huang, X., Ding, A., Liu, L., Liu, Q., Ding, K., Niu, X., Nie, W., Xu, Z., Chi, X., Wang, M., Sun, J., Guo, W., and Fu, C.: Effects of aerosol–radiation interaction on precipitation during biomass-burning season in East China, Atmos. Chem. Phys., 16, 10063–10082, https://doi.org/10.5194/acp-16-10063-2016, 2016.
Hyer, E. J., Allen, D. J., and Kasischke, E. S.: Examining injection properties of boreal forest fires using surface and satellite measurements of CO transport, J. Geophys. Res.-Atmos., 112, D18307, https://doi.org/10.1029/2006JD008232, 2007.
Janssens-Maenhout, G., Crippa, M., Guizzardi, D., Dentener, F., Muntean, M., Pouliot, G., Keating, T., Zhang, Q., Kurokawa, J., Wankmüller, R., Denier van der Gon, H., Kuenen, J. J. P., Klimont, Z., Frost, G., Darras, S., Koffi, B., and Li, M.: HTAP_v2.2: a mosaic of regional and global emission grid maps for 2008 and 2010 to study hemispheric transport of air pollution, Atmos. Chem. Phys., 15, 11411–11432, https://doi.org/10.5194/acp-15-11411-2015, 2015.
Jeon, W., Choi, Y., Percell, P., Souri, A. H., Song, C.-K., Kim, S.-T., and Kim, J.: Computationally efficient air quality forecasting tool: implementation of STOPS v1.5 model into CMAQ v5.0.2 for a prediction of Asian dust, Geosci. Model Dev., 9, 3671–3684, https://doi.org/10.5194/gmd-9-3671-2016, 2016.
Jung, J., Souri, A. H., Wong, D. C., Lee, S., Jeon, W., Kim, J., and Choi, Y.: The Impact of the Direct Effect of Aerosols on Meteorology and Air Quality Using Aerosol Optical Depth Assimilation During the KORUS-AQ Campaign, J. Geophys. Res.-Atmos., 124, 8303–8319, 2019.
Kain, J. S.: The Kain–Fritsch convective parameterization: an update, J. Appl. Meteorol., 43, 170–181, 2004.
Kaiser, J. W., Heil, A., Andreae, M. O., Benedetti, A., Chubarova, N., Jones, L., Morcrette, J. J., Razinger, M., Schultz, M. G., Suttie, M., and van der Werf, G. R.: Biomass burning emissions estimated with a global fire assimilation system based on observed fire radiative power, 9, 527–554, https://doi.org/10.5194/bg-9-527-2012, 2012.
Konovalov, I. B., Berezin, E. V., Ciais, P., Broquet, G., Beekmann, M., Hadji-Lazaro, J., Clerbaux, C., Andreae, M. O., Kaiser, J. W., and Schulze, E.-D.: Constraining CO2 emissions from open biomass burning by satellite observations of co-emitted species: a method and its application to wildfires in Siberia, Atmos. Chem. Phys., 14, 10383–10410, https://doi.org/10.5194/acp-14-10383-2014, 2014.
Laing, J. R., Jaffe, D. A., and Hee, J. R.: Physical and optical properties of aged biomass burning aerosol from wildfires in Siberia and the Western USA at the Mt. Bachelor Observatory, Atmos. Chem. Phys., 16, 15185–15197, https://doi.org/10.5194/acp-16-15185-2016, 2016.
Lee, H.-H., Iraqui, O., Gu, Y., Yim, S. H.-L., Chulakadabba, A., Tonks, A. Y.-M., Yang, Z., and Wang, C.: Impacts of air pollutants from fire and non-fire emissions on the regional air quality in Southeast Asia, Atmos. Chem. Phys., 18, 6141–6156, https://doi.org/10.5194/acp-18-6141-2018, 2018.
Lei, W., Li, G., and Molina, L. T.: Modeling the impacts of biomass burning on air quality in and around Mexico City, Atmos. Chem. Phys., 13, 2299–2319, https://doi.org/10.5194/acp-13-2299-2013, 2013.
Leung, F.-Y. T., Logan, J. A., Park, R., Hyer, E., Kasischke, E., Streets, D., and Yurganov, L.: Impacts of enhanced biomass burning in the boreal forests in 1998 on tropospheric chemistry and the sensitivity of model results to the injection height of emissions, J. Geophys. Res.-Atmos., 112, D10313, https://doi.org/10.1029/2006JD008132, 2007.
Li, H., Zhang, Q., Zhang, Q., Chen, C., Wang, L., Wei, Z., Zhou, S., Parworth, C., Zheng, B., Canonaco, F., Prévôt, A. S. H., Chen, P., Zhang, H., Wallington, T. J., and He, K.: Wintertime aerosol chemistry and haze evolution in an extremely polluted city of the North China Plain: significant contribution from coal and biomass combustion, Atmos. Chem. Phys., 17, 4751–4768, https://doi.org/10.5194/acp-17-4751-2017, 2017.
Li, J., Li, Y., Bo, Y., and Xie, S.: High-resolution historical emission inventories of crop residue burning in fields in China for the period 1990–2013, Atmos. Environ., 138, 152–161, 2016.
Li, M., Zhang, Q., Kurokawa, J.-I., Woo, J.-H., He, K., Lu, Z., Ohara, T., Song, Y., Streets, D. G., Carmichael, G. R., Cheng, Y., Hong, C., Huo, H., Jiang, X., Kang, S., Liu, F., Su, H., and Zheng, B.: MIX: a mosaic Asian anthropogenic emission inventory under the international collaboration framework of the MICS-Asia and HTAP, Atmos. Chem. Phys., 17, 935–963, https://doi.org/10.5194/acp-17-935-2017, 2017.
Li, P., Yan, R., Yu, S., Wang, S., Liu, W., and Bao, H.: Reinstate regional transport of PM2.5 as a major cause of severe haze in Beijing, P. Natl. Acad. Sci. USA, 112, E2739–E2740, 2015.
Li, W. J., Shao, L. Y., and Buseck, P. R.: Haze types in Beijing and the influence of agricultural biomass burning, Atmos. Chem. Phys., 10, 8119–8130, https://doi.org/10.5194/acp-10-8119-2010, 2010.
Li, X., Wang, S., Duan, L., Hao, J., Li, C., Chen, Y., and Yang, L.: Particulate and trace gas emissions from open burning of wheat straw and corn stover in China, Environ. Sci. Technol., 41, 6052–6058, 2007.
Li, X., Han, J., Hopke, P. K., Hu, J., Shu, Q., Chang, Q., and Ying, Q.: Quantifying primary and secondary humic-like substances in urban aerosol based on emission source characterization and a source-oriented air quality model, Atmos. Chem. Phys., 19, 2327–2341, https://doi.org/10.5194/acp-19-2327-2019, 2019.
Liu, H., Wu, B., Liu, S., Shao, P., Liu, X., Zhu, C., Wang, Y., Wu, Y., Xue, Y., Gao, J., Hao, Y., and Tian, H.: A regional high-resolution emission inventory of primary air pollutants in 2012 for Beijing and the surrounding five provinces of North China, Atmos. Environ., 181, 20–33, 2018.
Liu, J., Mauzerall, D. L., Chen, Q., Zhang, Q., Song, Y., Peng, W., Klimont, Z., Qiu, X., Zhang, S., Hu, M., Lin, W., Smith, K. R., and Zhu, T: Air pollutant emissions from Chinese households: A major and underappreciated ambient pollution source, P. Natl. Acad. Sci. USA, 113, 7756–7761, 2016.
Liu, M., Song, Y., Yao, H., Kang, Y., Li, M., Huang, X., and Hu, M.: Estimating emissions from agricultural fires in the North China Plain based on MODIS fire radiative power, Atmos. Environ., 112, 326–334, 2015.
Liu, M., Lin, J., Wang, Y., Sun, Y., Zheng, B., Shao, J., Chen, L., Zheng, Y., Chen, J., Fu, T.-M., Yan, Y., Zhang, Q., and Wu, Z.: Spatiotemporal variability of NO2 and PM2.5 over Eastern China: observational and model analyses with a novel statistical method, Atmos. Chem. Phys., 18, 12933–12952, https://doi.org/10.5194/acp-18-12933-2018, 2018.
Liu, S., Hua, S., Wang, K., Qiu, P., Liu, H., Wu, B., Shao, P., Liu, X., Wu, Y., and Xue, Y.: Spatial-temporal variation characteristics of air pollution in Henan of China: Localized emission inventory, WRF/Chem simulations and potential source contribution analysis, Sci. Total Environ., 624, 396–406, 2018.
Liu, X.-H., Zhang, Y., Cheng, S.-H., Xing, J., Zhang, Q., Streets, D. G., Jang, C., Wang, W.-X., and Hao, J.-M.: Understanding of regional air pollution over China using CMAQ, Part I, performance evaluation and seasonal variation, Atmos. Environ., 44, 2415–2426, 2010.
Liu, Z., Gao, W., Yu, Y., Hu, B., Xin, J., Sun, Y., Wang, L., Wang, G., Bi, X., Zhang, G., Xu, H., Cong, Z., He, J., Xu, J., and Wang, Y.: Characteristics of PM2.5 mass concentrations and chemical species in urban and background areas of China: emerging results from the CARE-China network, Atmos. Chem. Phys., 18, 8849–8871, https://doi.org/10.5194/acp-18-8849-2018, 2018.
Lo, J. C.-F., Yang, Z.-L., and Pielke Sr., R. A.: Assessment of three dynamical climate downscaling methods using the Weather Research and Forecasting (WRF) model, J. Geophys. Res.-Atmos., 113, D09112, https://doi.org/10.1029/2007JD009216, 2008.
Long, X., Tie, X., Cao, J., Huang, R., Feng, T., Li, N., Zhao, S., Tian, J., Li, G., and Zhang, Q.: Impact of crop field burning and mountains on heavy haze in the North China Plain: a case study, Atmos. Chem. Phys., 16, 9675–9691, https://doi.org/10.5194/acp-16-9675-2016, 2016.
Malavelle, F. F., Haywood, J. M., Mercado, L. M., Folberth, G. A., Bellouin, N., Sitch, S., and Artaxo, P.: Studying the impact of biomass burning aerosol radiative and climate effects on the Amazon rainforest productivity with an Earth system model, Atmos. Chem. Phys., 19, 1301–1326, https://doi.org/10.5194/acp-19-1301-2019, 2019.
Malm, W. C., Sisler, J. F., Huffman, D., Eldred, R. A., and Cahill, T. A.: Spatial and seasonal trends in particle concentration and optical extinction in the United States, J. Geophys. Res.-Atmos., 99, 1347–1370, 1994.
Mehmood, K., Chang, S., Yu, S., Wang, L., Li, P., Li, Z., Liu, W., Rosenfeld, D., and Seinfeld, J. H.: Spatial and temporal distributions of air pollutant emissions from open crop straw and biomass burnings in China from 2002 to 2016, Environ. Chem. Lett., 16, 301–309, 2018.
Monks, S. A., Arnold, S. R., Emmons, L. K., Law, K. S., Turquety, S., Duncan, B. N., Flemming, J., Huijnen, V., Tilmes, S., Langner, J., Mao, J., Long, Y., Thomas, J. L., Steenrod, S. D., Raut, J. C., Wilson, C., Chipperfield, M. P., Diskin, G. S., Weinheimer, A., Schlager, H., and Ancellet, G.: Multi-model study of chemical and physical controls on transport of anthropogenic and biomass burning pollution to the Arctic, Atmos. Chem. Phys., 15, 3575–3603, https://doi.org/10.5194/acp-15-3575-2015, 2015.
Morrison, H. and Gettelman, A.: A new two-moment bulk stratiform cloud microphysics scheme in the Community Atmosphere Model, version 3 (CAM3), Part I: Description and numerical tests, J. Clim., 21, 3642–3659, 2008.
Park, R. S., Song, C. H., Han, K. M., Park, M. E., Lee, S.-S., Kim, S.-B., and Shimizu, A.: A study on the aerosol optical properties over East Asia using a combination of CMAQ-simulated aerosol optical properties and remote-sensing data via a data assimilation technique, Atmos. Chem. Phys., 11, 12275–12296, https://doi.org/10.5194/acp-11-12275-2011, 2011.
Pimonsree, S., Vongruang, P., and Sumitsawan, S.: Modified biomass burning emission in modeling system with fire radiative power: Simulation of particulate matter in Mainland Southeast Asia during smog episode, Atmos. Pollut. Res., 9, 133–145, 2018.
Pleim, J. E.: A combined local and nonlocal closure model for the atmospheric boundary layer, Part I: Model description and testing, J. Appl. Meteorol. Climatol., 46, 1383–1395, 2007a.
Pleim, J. E.: A combined local and nonlocal closure model for the atmospheric boundary layer, Part II: Application and evaluation in a mesoscale meteorological model, J. Appl. Meteorol. Climatol., 46, 1396–1409, 2007b.
Qiao, X., Guo, H., Tang, Y., Wang, P., Deng, W., Zhao, X., Hu, J., Ying, Q., and Zhang, H.: Local and regional contributions to fine particulate matter in the 18 cities of Sichuan Basin, southwestern China, Atmos. Chem. Phys., 19, 5791–5803, https://doi.org/10.5194/acp-19-5791-2019, 2019.
Qin, Y. and Xie, S. D.: Historical estimation of carbonaceous aerosol emissions from biomass open burning in China for the period 1990–2005, Environ. Pollut., 159, 3316–3323, 2011.
Qiu, X., Duan, L., Chai, F., Wang, S., Yu, Q., and Wang, S.: Deriving high-resolution emission inventory of open biomass burning in China based on satellite observations, Environ. Sci. Technol., 50, 11779–11786, 2016.
Randerson, J. T., Chen, Y., Van Der Werf, G. R., Rogers, B. M., and Morton, D. C.: Global burned area and biomass burning emissions from small fires, J. Geophys. Res.-Biogeo., 117, G04012, https://doi.org/10.1029/2012JG002128, 2012.
Rose, D., Nowak, A., Achtert, P., Wiedensohler, A., Hu, M., Shao, M., Zhang, Y., Andreae, M. O., and Pöschl, U.: Cloud condensation nuclei in polluted air and biomass burning smoke near the mega-city Guangzhou, China – Part 1: Size-resolved measurements and implications for the modeling of aerosol particle hygroscopicity and CCN activity, Atmos. Chem. Phys., 10, 3365–3383, https://doi.org/10.5194/acp-10-3365-2010, 2010.
Saleh, R., Robinson, E. S., Tkacik, D. S., Ahern, A. T., Liu, S.,Aiken, A. C., Sullivan, R. C., Presto, A. A., Dubey, M. K., Yokel-son, R. J., Donahue, N. M., and Robinson, A. L.: Brownness of organics in aerosols from biomass burning linked to their black carbon content, Nat. Geosci., 7, 647–650, 2014.
Seinfeld, J. H. and Pandis, S. N.: Atmospheric chemistry and physics: from air pollution to climate change, John Wiley & Sons, 1–1326, 2016.
Singh, N., Banerjee, T., Raju, M. P., Deboudt, K., Sorek-Hamer, M., Singh, R. S., and Mall, R. K.: Aerosol chemistry, transport, and climatic implications during extreme biomass burning emissions over the Indo-Gangetic Plain, Atmos. Chem. Phys., 18, 14197–14215, https://doi.org/10.5194/acp-18-14197-2018, 2018.
Song, C. H., Park, M. E., Lee, K. H., Ahn, H. J., Lee, Y., Kim, J. Y., Han, K. M., Kim, J., Ghim, Y. S., and Kim, Y. J.: An investigation into seasonal and regional aerosol characteristics in East Asia using model-predicted and remotely-sensed aerosol properties, Atmos. Chem. Phys., 8, 6627–6654, https://doi.org/10.5194/acp-8-6627-2008, 2008.
Stein, A. F., Draxler, R. R., Rolph, G. D., Stunder, B. J. B., Cohen, M. D., and Ngan, F.: NOAA's HYSPLIT atmospheric transport and dispersion modeling system, B. Am. Meteorol. Soc., 96, 2059–2077, 2015.
Streets, D. G., Yarber, K. F., Woo, J.-H., and Carmichael, G. R.: Biomass burning in Asia: Annual and seasonal estimates and atmospheric emissions, Global Biogeochem. Cy., 17, 1099, https://doi.org/10.1029/2003GB002040, 2003.
Sun, Y., Jiang, Q., Xu, Y., Ma, Y., Zhang, Y., Liu, X., Li, W., Wang, F., Li, J., Wang, P., and Li, Z.: Aerosol characterization over the North China Plain: Haze life cycle and biomass burning impacts in summer, J. Geophys. Res.-Atmos., 121, 2508–2521, 2016.
Tai, E., Jimenez, M., Nopmongcol, O., Wilson, G., Mansell, G., Koo, B., and Yarwood, G.: Boundary conditions and fire emissions modeling, Prep. Texas Comm. Environ. Qual. Sept., available at: https://www.tceq.texas.gov/assets/public/implementation/air/am/contracts/reports/pm/5820784005FY0810-20080831-environ-bcic_final_report.pdf (last access: 26 February 2020), 2008.
Tang, X., Zhu, J., Wang, Z. F., and Gbaguidi, A.: Improvement of ozone forecast over Beijing based on ensemble Kalman filter with simultaneous adjustment of initial conditions and emissions, Atmos. Chem. Phys., 11, 12901–12916, https://doi.org/10.5194/acp-11-12901-2011, 2011.
Tsao, C. C., Campbell, J. E., Mena-Carrasco, M., Spak, S. N., Carmichael, G. R., and Chen, Y.: Increased estimates of air-pollution emissions from Brazilian sugar-cane ethanol, Nat. Clim. Change, 2, 53–57, 2012.
Uranishi, K., Ikemori, F., Shimadera, H., Kondo, A., and Sugata, S.: Impact of field biomass burning on local pollution and long-range transport of PM2.5 in Northeast Asia, Environ. Pollut., 244, 414–422, 2019.
Vakkari, V., Beukes, J. P., Dal Maso, M., Aurela, M., Josipovic, M., and van Zyl, P. G.: Major secondary aerosol formation in southern African open biomass burning plumes, Nat. Geosci., 11, 580–583, 2018.
Wang, H., Shi, G. Y., Zhang, X. Y., Gong, S. L., Tan, S. C., Chen, B., Che, H. Z., and Li, T.: Mesoscale modelling study of the interactions between aerosols and PBL meteorology during a haze episode in China Jing–Jin–Ji and its near surrounding region – Part 2: Aerosols' radiative feedback effects, Atmos. Chem. Phys., 15, 3277–3287, https://doi.org/10.5194/acp-15-3277-2015, 2015.
Wang, J., Wang, S., Jiang, J., Ding, A., Zheng, M., Zhao, B., Wong, D. C., Zhou, W., Zheng, G., Wang, L., Pleim, J. E., and Hao, J.: Impact of aerosol–meteorology interactions on fine particle pollution during China's severe haze episode in January 2013, Environ. Res. Lett., 9, 94002, https://doi.org/10.1088/1748-9326/9/9/094002, 2014.
Wang, L., Xu, J., Yang, J., Zhao, X., Wei, W., Cheng, D., Pan, X., and Su, J.: Understanding haze pollution over the southern Hebei area of China using the CMAQ model, Atmos. Environ., 56, 69–79, 2012.
Wang, M., Cao, C., Li, G., and Singh, R. P.: Analysis of a severe prolonged regional haze episode in the Yangtze River Delta, China, Atmos. Environ., 102, 112–121, 2015.
Wang, P., Ying, Q., Zhang, H., Hu, J., Lin, Y., and Mao, H.: Source apportionment of secondary organic aerosol in China using a regional source-oriented chemical transport model and two emission inventories, Environ. Pollut., 237, 756–766, 2018.
Wang, Y. Q., Zhang, X. Y., and Draxler, R. R.: TrajStat: GIS-based software that uses various trajectory statistical analysis methods to identify potential sources from long-term air pollution measurement data, Environ. Model. Softw., 24, 938–939, 2009.
Washenfelder, R. A., Attwood, A. R., Brock, C. A., Guo, H., Xu, L., Weber, R. J., Ng, N. L., Allen, H. M., Ayres, B. R., Baumann, K., Cohen, R. C., Draper, D. C., Duffey, K. C.,Edgerton, E., Fry, J. L., Hu, W. W., Jimenez, J. L., Palm, B. B., Romer, P., Stone, E. A., Wooldridge, P. J., and Brown, S. S: Biomass burning dominates brown carbon absorption in the rural southeastern United States, Geophys. Res. Lett., 42, 653–664, 2015.
van der Werf, G. R., Randerson, J. T., Giglio, L., van Leeuwen, T. T., Chen, Y., Rogers, B. M., Mu, M., van Marle, M. J. E., Morton, D. C., Collatz, G. J., Yokelson, R. J., and Kasibhatla, P. S.: Global fire emissions estimates during 1997–2016, Earth Syst. Sci. Data, 9, 697–720, https://doi.org/10.5194/essd-9-697-2017, 2017.
Wiedinmyer, C., Akagi, S. K., Yokelson, R. J., Emmons, L. K., Al-Saadi, J. A., Orlando, J. J., and Soja, A. J.: The Fire INventory from NCAR (FINN): a high resolution global model to estimate the emissions from open burning, Geosci. Model Dev., 4, 625–641, https://doi.org/10.5194/gmd-4-625-2011, 2011.
Wong, D. C., Pleim, J., Mathur, R., Binkowski, F., Otte, T., Gilliam, R., Pouliot, G., Xiu, A., Young, J. O., and Kang, D.: WRF-CMAQ two-way coupled system with aerosol feedback: software development and preliminary results, Geosci. Model Dev., 5, 299–312, https://doi.org/10.5194/gmd-5-299-2012, 2012.
Wu, J., Kong, S., Wu, F., Cheng, Y., Zheng, S., Yan, Q., Zheng, H., Yang, G., Zheng, M., Liu, D., Zhao, D., and Qi, S.: Estimating the open biomass burning emissions in central and eastern China from 2003 to 2015 based on satellite observation, Atmos. Chem. Phys., 18, 11623–11646, https://doi.org/10.5194/acp-18-11623-2018, 2018.
Wu, Y., Han, Y., Voulgarakis, A., Wang, T., Li, M., Wang, Y., Xie, M., Zhuang, B., and Li, S.: An agricultural biomass burning episode in eastern China: Transport, optical properties, and impacts on regional air quality, J. Geophys. Res.-Atmos., 122, 2304–2324, 2017.
Xiao, X., Cohan, D. S., Byun, D. W., and Ngan, F.: Highly nonlinear ozone formation in the Houston region and implications for emission controls, J. Geophys. Res.-Atmos., 115, D23309, https://doi.org/10.1029/2010JD014435, 2010.
Xin, J., Wang, Y., Pan, Y., Ji, D., Liu, Z., Wen, T., Wang, Y., Li, X., Sun, Y., Sun, J., Wang, P., Wang, G., Wang, X., Cong,Z., Song, T., Hu, B., Wang, L., Tang, G., Gao, W., Guo, Y.,Miao, H., Tian, S., and Wang, L.: The campaign on atmospheric aerosol research network of China: CARE-China, B. Am. Meteorol. Soc., 96, 1137–1155, 2015.
Xiu, A. and Pleim, J. E.: Development of a land surface model. Part I: Application in a mesoscale meteorological model, J. Appl. Meteorol., 40, 192–209, 2001.
Xu, Y., Huang, Z., Jia, G., Fan, M., Cheng, L., Chen, L., Shao, M., and Zheng, J.: Regional discrepancies in spatiotemporal variations and driving forces of open crop residue burning emissions in China, Sci. Total Environ., 671, 536–547, 2019.
Yamaji, K., Li, J., Uno, I., Kanaya, Y., Irie, H., Takigawa, M., Komazaki, Y., Pochanart, P., Liu, Y., Tanimoto, H., Ohara, T., Yan, X., Wang, Z., and Akimoto, H.: Impact of open crop residual burning on air quality over Central Eastern China during the Mount Tai Experiment 2006 (MTX2006), Atmos. Chem. Phys., 10, 7353–7368, https://doi.org/10.5194/acp-10-7353-2010, 2010.
Yan, X., Ohara, T., and Akimoto, H.: Bottom-up estimate of biomass burning in mainland China, Atmos. Environ., 40, 5262–5273, 2006.
Yang, Y. and Zhao, Y.: Quantification and evaluation of atmospheric pollutant emissions from open biomass burning with multiple methods: a case study for the Yangtze River Delta region, China, Atmos. Chem. Phys., 19, 327–348, https://doi.org/10.5194/acp-19-327-2019, 2019.
Yarwood, G., Rao, S., Yocke, M., and Whitten, G. Z.: Updates to the carbon bond chemical mechanism: CB05, Final Rep. to US EPA, RT-0400675, 8, available at: http://www.camx.com/publ/pdfs/CB05_Final_Report_120805.pdf (last access: 18 December 2019), 2005.
Yu, M., Yuan, X., He, Q., Yu, Y., Cao, K., Yang, Y., and Zhang, W.: Temporal-spatial analysis of crop residue burning in China and its impact on aerosol pollution, Environ. Pollut., 245, 616–626, 2019.
Yu, S., Eder, B., Dennis, R., Chu, S.-H., and Schwartz, S. E.: New unbiased symmetric metrics for evaluation of air quality models, Atmos. Sci. Lett., 7, 26–34, 2006.
Yu, S., Mathur, R., Pleim, J., Pouliot, G., Wong, D., Eder, B., Schere, K., Gilliam, R., and Rao, S. T.: Comparative evaluation of the impact of WRF/NMM and WRF/ARW meteorology on CMAQ simulations for PM2.5 and its related precursors during the 2006 TexAQS/GoMACCS study, Atmos. Chem. Phys., 12, 4091–4106, https://doi.org/10.5194/acp-12-4091-2012, 2012.
Yu, S., Mathur, R., Pleim, J., Wong, D., Gilliam, R., Alapaty, K., Zhao, C., and Liu, X.: Aerosol indirect effect on the grid-scale clouds in the two-way coupled WRF–CMAQ: model description, development, evaluation and regional analysis, Atmos. Chem. Phys., 14, 11247–11285, https://doi.org/10.5194/acp-14-11247-2014, 2014a.
Yu, S., Zhang, Q., Yan, R., Wang, S., Li, P., Chen, B., Liu, W., and Zhang, X.: Origin of air pollution during a weekly heavy haze episode in Hangzhou, China, Environ. Chem. Lett., 12, 543–550, 2014b.
Yu, S., Li, P., Wang, L., Wu, Y., Wang, S., Liu, K., Zhu, T., Zhang, Y., Hu, M., Zeng, L., Zhang, X., Cao, J., Alapaty, K., Wong, D. C., Pleim, J., Mathur, R., Rosenfeld, D., and Seinfeld, J. H.: Mitigation of severe urban haze pollution by a precision air pollution control approach, Sci. Rep., 8, 8151, https://doi.org/10.1038/s41598-018-26344-1, 2018.
Yuyun, B., Yajing, W., and Chunyu, G.: Straw Resource Quantity and its Regional Distribution in China [J], J. Agr. Mech. Res., 3, 1–7, 2010.
Zhang, B., Wang, Y., and Hao, J.: Simulating aerosol–radiation–cloud feedbacks on meteorology and air quality over eastern China under severe haze conditionsin winter, Atmos. Chem. Phys., 15, 2387–2404, https://doi.org/10.5194/acp-15-2387-2015, 2015.
Zhang, H. F., Hu, J., Qi, Y. X., Li, C. L., Chen, J. M., Wang, X. M., He, J. W., Wang, S. X., Hao, J. M., Zhang, L. L., Zhang, L. J., Zhang, Y. X., Li, R. K., Wang, S. L., and Chai, F. H.: Emission characterization, environmental impact, and control measure of PM2.5 emitted from agricultural crop residue burning in China, J. Clean. Prod., 149, 629–635, 2017.
Zhang, L., Liu, Y., and Hao, L.: Contributions of open crop straw burning emissions to PM2.5 concentrations in China, Environ. Res. Lett., 11, 14014, https://doi.org/10.1088/1748-9326/11/1/014014, 2016.
Zhang, T., Wooster, M. J., Green, D. C., and Main, B.: New field-based agricultural biomass burning trace gas, PM2.5, and black carbon emission ratios and factors measured in situ at crop residue fires in Eastern China, Atmos. Environ., 121, 22–34, 2015.
Zhang, X., Zhang, Q., Hong, C., Zheng, Y., Geng, G., Tong, D., Zhang, Y., and Zhang, X.: Enhancement of PM2.5 Concentrations by Aerosol-Meteorology Interactions Over China, J. Geophys. Res.-Atmos., 123, 1179–1194, 2018.
Zhang, X., Lu, Y., Wang, Q., and Qian, X.: A high-resolution inventory of air pollutant emissions from crop residue burning in China, Atmos. Environ., 231, 207–214, 2019.
Zhang, X. Y., Wang, J. Z., Wang, Y. Q., Liu, H. L., Sun, J. Y., and Zhang, Y. M.: Changes in chemical components of aerosol particles in different haze regions in China from 2006 to 2013 and contribution of meteorological factors, Atmos. Chem. Phys., 15, 12935–12952, https://doi.org/10.5194/acp-15-12935-2015, 2015.
Zhang, Y.-L. and Cao, F.: Is it time to tackle PM2.5 air pollutions in China from biomass-burning emissions?, Environ. Pollut., 202, 217–219, 2015.
Zhang, Y., Shao, M., Lin, Y., Luan, S., Mao, N., Chen, W., and Wang, M.: Emission inventory of carbonaceous pollutants from biomass burning in the Pearl River Delta Region, China, Atmos. Environ., 76, 189–199, 2013.
Zhang, Y., Zhang, X., Wang, K., Zhang, Q., Duan, F., and He, K.: Application of WRF/Chem over East Asia: Part II. Model improvement and sensitivity simulations, Atmos. Environ., 124, 301–320, 2016.
Zhao, C., Liu, X., Leung, L. R., Johnson, B., McFarlane, S. A., Gustafson Jr., W. I., Fast, J. D., and Easter, R.: The spatial distribution of mineral dust and its shortwave radiative forcing over North Africa: modeling sensitivities to dust emissions and aerosol size treatments, Atmos. Chem. Phys., 10, 8821–8838, https://doi.org/10.5194/acp-10-8821-2010, 2010.
Zhao, Y., Mao, P., Zhou, Y., Yang, Y., Zhang, J., Wang, S., Dong, Y., Xie, F., Yu, Y., and Li, W.: Improved provincial emission inventory and speciation profiles of anthropogenic non-methane volatile organic compounds: a case study for Jiangsu, China, Atmos. Chem. Phys., 17, 7733–7756, https://doi.org/10.5194/acp-17-7733-2017, 2017.
Zhou, Y., Xing, X., Lang, J., Chen, D., Cheng, S., Wei, L., Wei, X., and Liu, C.: A comprehensive biomass burning emission inventory with high spatial and temporal resolution in China, Atmos. Chem. Phys., 17, 2839–2864, https://doi.org/10.5194/acp-17-2839-2017, 2017.
Zhou, Y., Han, Z., Liu, R., Zhu, B., Li, J., and Zhang, R.: A modeling study of the impact of crop residue burning on PM2.5 concentration in Beijing and Tianjin during a severe autumn haze event, Aerosol Air Qual. Res., 18, 1558–1572, 2018.
Zhuang, Y., Li, R., Yang, H., Chen, D., Chen, Z., Gao, B., and He, B.: Understanding temporal and spatial distribution of crop residue burning in China from 2003 to 2017 Using MODIS Data, Remote Sens., 10, 390, https://doi.org/10.3390/rs10030390, 2018.