the Creative Commons Attribution 4.0 License.
the Creative Commons Attribution 4.0 License.
 | 04 Dec 2020
Discrepancies between MICS-Asia III simulation and observation for surface ozone in the marine atmosphere over the northwestern Pacific Asian Rim region
Hajime Akimoto
Tatsuya Nagashima
Natsumi Kawano
Li Jie
Joshua S. Fu
Zifa Wang
In order to identify the causes of overestimate of the surface-level O3 mixing ratio simulated by three regional chemical-transport models, NAQPMS v.3 (abbreviated as NAQM in this paper), CMAQ v.5.0.2, and CMAQ v.4.7.1, compared to the EANET observational data at a marine remote site at Oki in July 2010, analyses of hourly O3 mixing ratios and net ozone production were made in the context of MICS-Asia III. In addition to Oki, model-simulated and observational data for two other EANET marine sites, Hedo and Ogasawara, were also examined. Three factors, i.e., long-range transport from the continent, in situ photochemical formation, and dry deposition of O3 on seawater, have been identified as contributing to the overestimate by these regional models at Oki. The calculated O3 mixing ratios during long-range transport from the continent were much higher for all three models than those of the observation. In situ photochemical formation, demonstrated by a distinct diurnal variation which was not discerned in the observational data, was seen in the simulated data of all three models and ascribed to the virtual transport of NOx from the southern urban areas of the main island of Japan. The overestimate of the O3 mixing ratio in the background oceanic air mass has been discussed referring to dry deposition velocity (Vd) of O3 over oceanic water. Sensitivity analysis of the dry deposition velocity to the concentration of O3 was made for Oki in July. An increase in Vd from 0.0005 to 0.001 cm s−1 used in the standard runs for CMAQ by a factor of 10 decreases the O3 mixing ratio by more than 20 ppbv on an event basis in certain periods of time and by ca. 4.9 ppbv as a monthly mean in July. The dry deposition velocity of O3 in Bohai Bay and the Yellow Sea has been assumed to be comparable to that of the open ocean in all three models, which could have resulted in the overestimate of O3 mixing ratios in this area and also in the long-range transport of O3 from the continent to Oki. A higher value of dry deposition velocity in this marine area is expected considering the higher content of organics in the surface sea layer brought by rivers and atmospheric wet deposition. Empirical measurements of the mixing ratios and dry deposition flux of O3 in this area are highly recommended, since they would affect the simulated mixing ratios in the downwind region in the Pacific Rim region.
- Article
(2709 KB) - Full-text XML
-
Supplement
(1454 KB) - BibTeX
- EndNote


Surface ozone simulation by regional chemical transport models (CTMs) has become widely used and is thought to be well developed considering its long history since the 1980s (e.g., De Wispelaer, 1981) and a well-established underlying fundamental science of tropospheric gas-phase photochemistry (e.g., Akimoto, 2016). Nevertheless, a recent model intercomparison study, MICS-Asia III, has revealed large variability in the simulated spatial distribution of surface ozone (O3) mixing ratios in the East Asian region among models and between models and observations (Li et al., 2019). Since regional CTMs are commonly used for proposing mitigation policies on how to reduce the emissions of NOx and NMVOC for controlling photochemical ozone pollution, there is an urgent need to provide useful information on advancing the current understandings of discrepancies among the models and between modeled and observed mixing ratios of O3.
We realize that model intercomparison studies of ozone simulation for air quality are at the stage of identifying the causes of discrepancies and depicting the problems that are used to improve models rather than simply demonstrating the statistical performance of the models and showing the degree of agreement between the simulated ensemble mean and observations. Our previous paper in this special issue (Akimoto et al., 2019) noted a disagreement between the observed mixing ratios of surface O3 in the megacities of Beijing and Tokyo and at a remote oceanic site at Oki and those simulated by three selected regional models, namely WRF-CMAQ, v.5.02 and v.4.7.1, and WRF-NAQPMS v.3. As for the urban areas of megacities, we found that the degree of agreement of the simulated levels of O3 and NO with the observations were strongly coupled, and we discussed the importance of making comparisons of simulated mixing ratios of precursors (NOx and NMVOC) together with O3 itself. Specifically, we proposed to confirm the potential importance of the heterogeneous “renoxification” reaction of HNO3 to regenerate NOx on the aerosol surface by comprehensive field observations of NOy. We also identified that the difference in the vertical transport scheme affected the simulated results of O3 significantly.
As for the marine remote site of Oki, an island in the western part of the Sea of Japan, an overestimate of O3 by ca. 20 ppbv compared to observations in July 2010 has been noted for all three selected models. However, the causes of the disagreement between the models and observations were not discussed in the previous paper (Akimoto et al., 2019). Oki is one of the baseline sites for O3 observations, and the O3 level there reflects the amount of transboundary long-range transport of O3 from the Asian continent to the Pacific Rim region. It is also a reference “background” site for air quality in Japan. Therefore, a better matching between observational data and model simulation is desired, and elucidation of the causes of the overestimates by the models is worth pursuing.
So far, validations of surface O3 in the oceanic area by regional CTMs have rarely been performed. This is because regional CTMs have been applied mainly to the air quality in urban polluted areas with the aim of controlling precursor emissions. However, in the East Asian Pacific Rim region, the continental outflow over the ocean is transported to the downwind land area; thus, a discussion of transboundary pollution is necessarily needed to validate over the oceanic area. In the marine region the dry deposition of O3 on the oceanic water is one of the important parameters which would affect the mixing ratios of O3 in the marine boundary layer. An intensive evaluation of ozone deposition simulations using regional models in East Asia has been reported by Park et al. (2014), but the detailed analysis has been made mostly on land areas, and the discussion in marine regions is limited.
On the other hand, since the oceans cover two-thirds of the earth's surface, the air–sea exchange plays an important role in the tropospheric ozone budget, and substantial discussions on the impact of dry deposition of O3 over oceanic water have been conducted by global CTMs (e.g., Ganzeveld et al., 2009; Young et al., 2013; Hardacre et al., 2015; Luhar et al., 2018). According to the recent estimate, the dry deposition of O3 is found to be 98±30 Tg yr−1 for the ocean, about 13 % of the global deposition of 723±87 yr−1 (Luhar et al., 2018), in contrast to the previous estimate of the total global dry deposition of 1094±264 Tg yr−1 (Young et al., 2013), of which about 35 % is to the ocean (Ganzeveld et al., 2009; Hardacre et al., 2015). Hardacre et al. (2015) observed that ozone dry deposition to the water surface has the largest uncertainty compared to other surface types in models.
In the model intercomparison study of MICS-Asia III, substantial overestimate of the mixing ratio of O3 at Oki was revealed only in summer to early autumn (June to September), in contrast to the reasonably good agreement in other seasons (see Fig. S1 in the Supplement). In order to elucidate the discrepancy, an analysis of the simulated results has been made in this study for July, the month with the highest overestimate. The same three models, CMAQ v.5.0.2 and v.4.7.1 and NAQM v.3, as in our previous study (Akimoto et al., 2019) have been used due to the availability of hourly data and process analysis data. In addition to Oki, comparisons at two other oceanic sites over the northwestern Pacific Asian Rim region, Hedo and Ogasawara, which are even more remote than Oki, have been performed. Among the selected three observational sites, Ogasawara was categorized as a “true oceanic site” in the northwestern Pacific (Schultz et al., 2017), Oki is a marine site affected more often by the continental outflow even in the summer, and Hedo is characterized as being between the two sites.
The selected three models are the same as those in our previous paper, i.e., WRF-CMAQ v.5.0.2, v.4.7.1, and WRF-NAQPMS v.3 (abbreviated as NAQM hereafter in this paper). Model calculations by CMAQ v.5.0.2, v.4.7.1, and NAQM were conducted at the University of Tennessee (USA), National Institute for Environmental Studies (Japan), and Institute of Atmospheric Physics (China), respectively. Basic features and the simulated domain of these regional models have been given in previous papers in this special issue (Akimoto et al., 2019; Li et al., 2019). Briefly, the employed horizontal resolution was 45 km for all the models. The models employed the common meteorological fields from WRF simulations and common emissions of MIX () for 2010 (Li et al., 2017), both developed in the MICS-Asia III project. A detailed description of the WRF simulation can be found in Li et al. (2019) and Kong et al. (2020). It was nudged toward the final analysis dataset from the National Centers for Environmental Prediction and National Center for Atmospheric Research (NCEP/NCAR). Dry deposition schemes by Wesely (1989) and M3DRY (Pleim et al., 2001) were used in NAQM and CMAQ, respectively. The initial and boundary conditions were supplied by global models, CHASER for CMAQ v.4.7.1 and NAQM and GEOS-Chem for CMAQ v.5.0.2. The two global models used Wesely (1989) as a dry deposition scheme.
Figure 1 shows three observational sites of EANET (Acid Deposition Monitoring Network in East Asia) at Oki (36.3∘ N, 133.2∘ E; 90 m a.s.l.), Hedo (26.9∘ N, 128.2∘ E; 60 m a.s.l.), and Ogasawara (27.1∘ N, 142.2∘ E; 212 m a.s.l.) (EANET, 2020) which were selected for the comparison of observational data with model simulation. The Oki station is on the northern cliff of Dogo of the Oki islands, the Hedo station is at Cape Hedo located at the northern tip of Okinawa's main island, and the Ogasawara station is on the hill of Chichi of the Ogasawara islands. Measurements of O3 were made by using UV absorption instruments (Horiba APOA-360, -370). The observational data used for the three sites were the 1 h averaged values in July 2010, provided by the EANET Network Center, Asia Center for Air Pollution Research (ACAP, 2020). Figure 1 also shows the monthly averaged wind field in July.
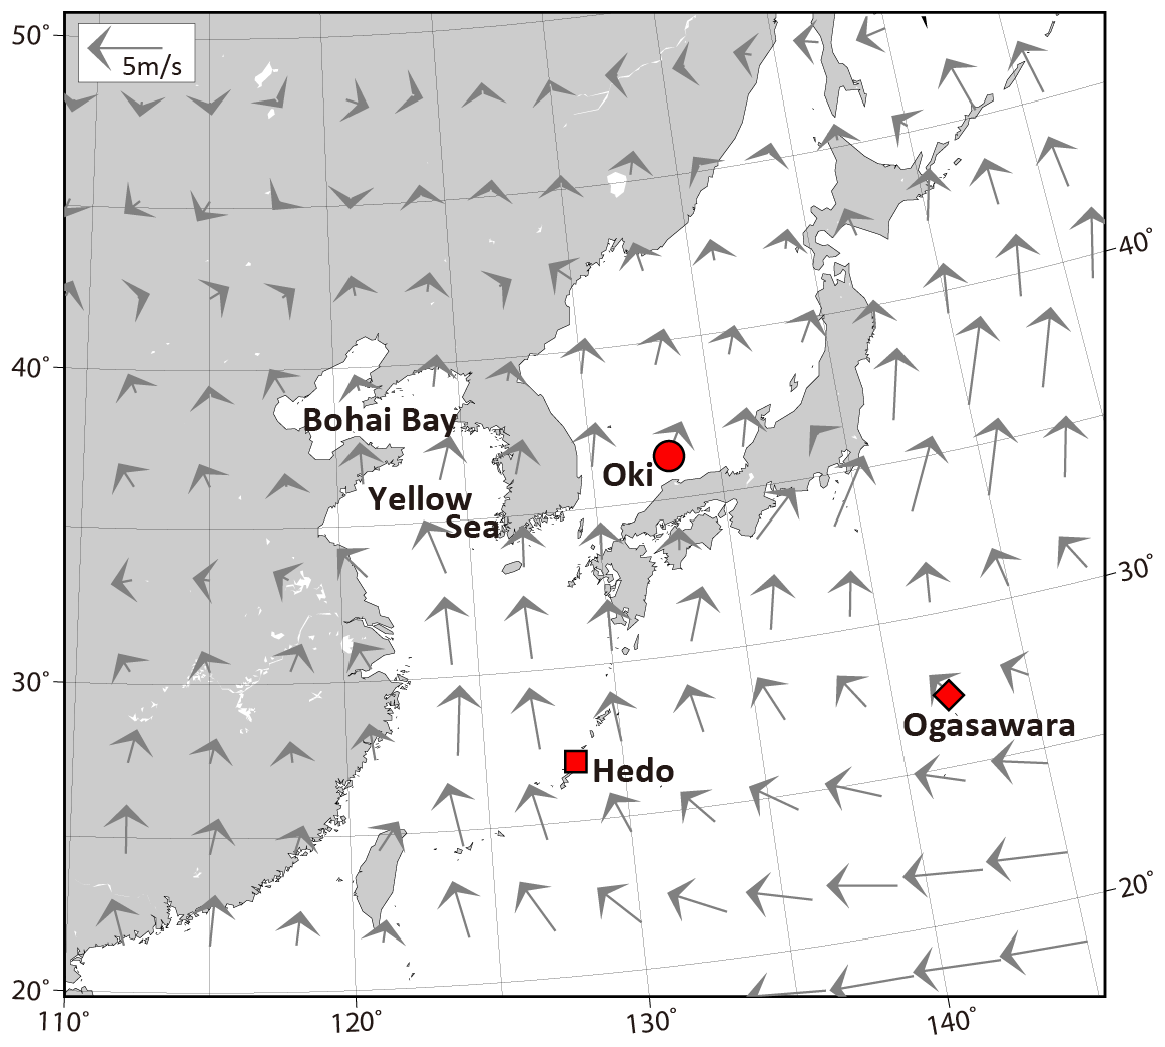
Figure 1Locations of EANET observation sites at Oki (circle), Hedo (rectangle) and Ogasawara (diamond). Vectors show monthly mean surface wind velocity in July.
3.1 Comparison of O3 at Oki, Hedo, and Ogasawara
Figure 2a–c depict the comparison of the monthly mean diurnal variation of surface O3 mixing ratios in July 2010 between the model simulations and observations at Oki, Hedo, and Ogasawara, respectively. The data shown in Fig. 2a at Oki are the same as those presented in our previous paper (Akimoto et al., 2019) and indicate that the O3 mixing ratios simulated by all three models fall within the range of ∼10 ppbv at the 52–71 ppbv level, as compared to the observational value of 34–43 ppbv. Thus, all three models overestimated the O3 mixing ratio by nearly 20–30 ppbv. A monthly averaged diurnal amplitude of 17 and 15 ppbv with a daytime maximum and a nighttime minimum can be noted for CMAQ 5.0.2 and NAQM, which is substantially larger than the variability of 7 and 9 ppbv for the simulation by CMAQ 4.7.1 and the observation, respectively.
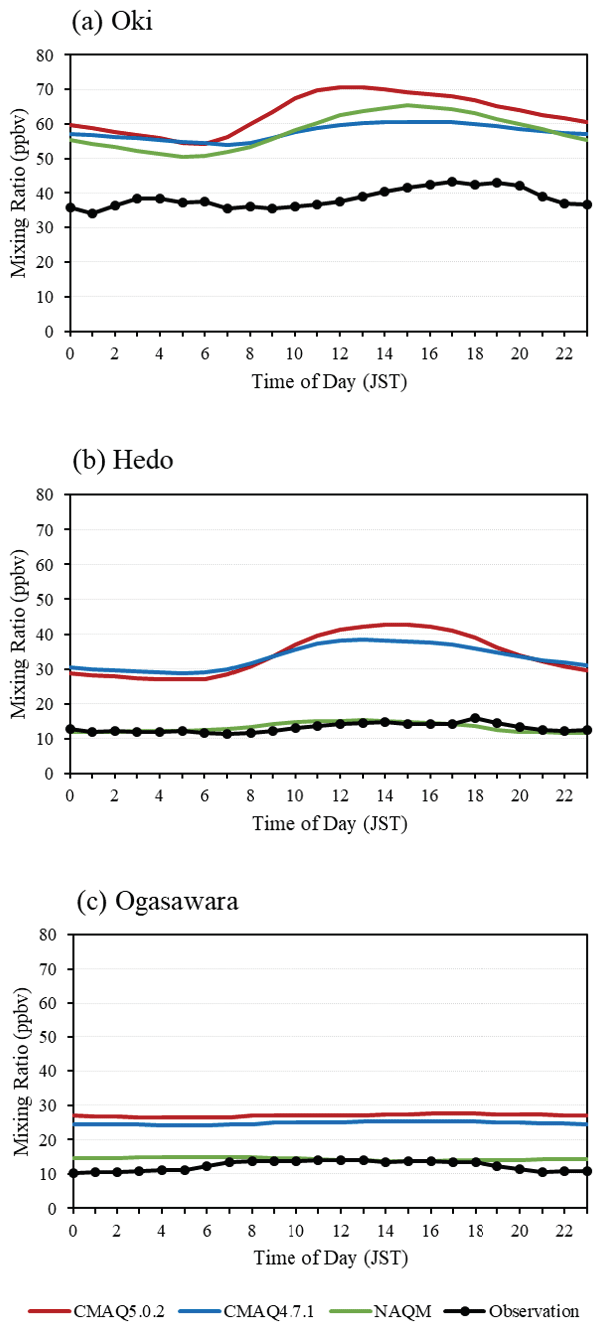
Figure 2Comparison of monthly averaged diurnal variation of O3 at (a) Oki, (b) Hedo, and (c) Ogasawara in July 2010 between observation and model simulation by CMAQ v.5.0.2 and 4.7.1 and NAQM v.3.
In contrast to Oki, the monthly averaged observational mixing ratios of O3 at Hedo and Ogasawara are approximately in the same ranges, 12–16 and 10–14 ppbv, respectively, with a slight diurnal variation of ca. 4 ppbv. The monthly averaged mixing ratios of O3 at 10–15 ppbv in July are typical in the marine boundary layer at these remote islands (Pochanart et al., 2002), which are basically under the influence of the Pacific oceanic air mass as shown by the wind field in Fig. 1. The model simulation of NAQM reproduced well the monthly averaged O3 levels at these sites with a slight diurnal variation (ca. 4 and 1 ppbv at Hedo and Ogasawara, respectively). Meanwhile, CMAQ 5.0.2 and 4.7.1 agree well with each other but overestimate the observed monthly averaged O3 mixing ratios by nearly 23–27 ppbv at Hedo and 11–14 ppbv at Ogasawara. These models show a diurnal variation of 9–16 ppbv at Hedo, which is much larger than the observation. The diurnal variation revealed by these models at Ogasawara is less than 1 ppbv, agreeing well with NAQM.
In order to clarify the causes of the discrepancies, comparisons of the mixing ratios of O3 on an hourly basis were made at Oki, Hedo, and Ogasawara (Fig. 3a–c). In the observational data at Oki shown in Fig. 3a, minimum mixing ratios of ca. 20 ppbv are often seen within a short time duration of a few hours, which represents the O3 level in the marine air mass brought by the southerly wind of the summer monsoon from the surrounding oceanic area near Japan, as revealed by Akimoto et al. (1996). The observational data also show that the O3 mixing ratio at Oki often reaches the level of ca. 60 ppbv, and the highest O3 level of ca. 80 pbv was observed on 6–8 July. This event is thought to be caused by the long-range transport from the continent (Akimoto et al., 1996). The model simulations captured this event, but the estimated peak height of O3 on 6–7 July is much higher, more than 130 ppbv by CMAQ 5.0.2 and ca. 100 ppbv by NAQM and CMAQ 4.7.1.
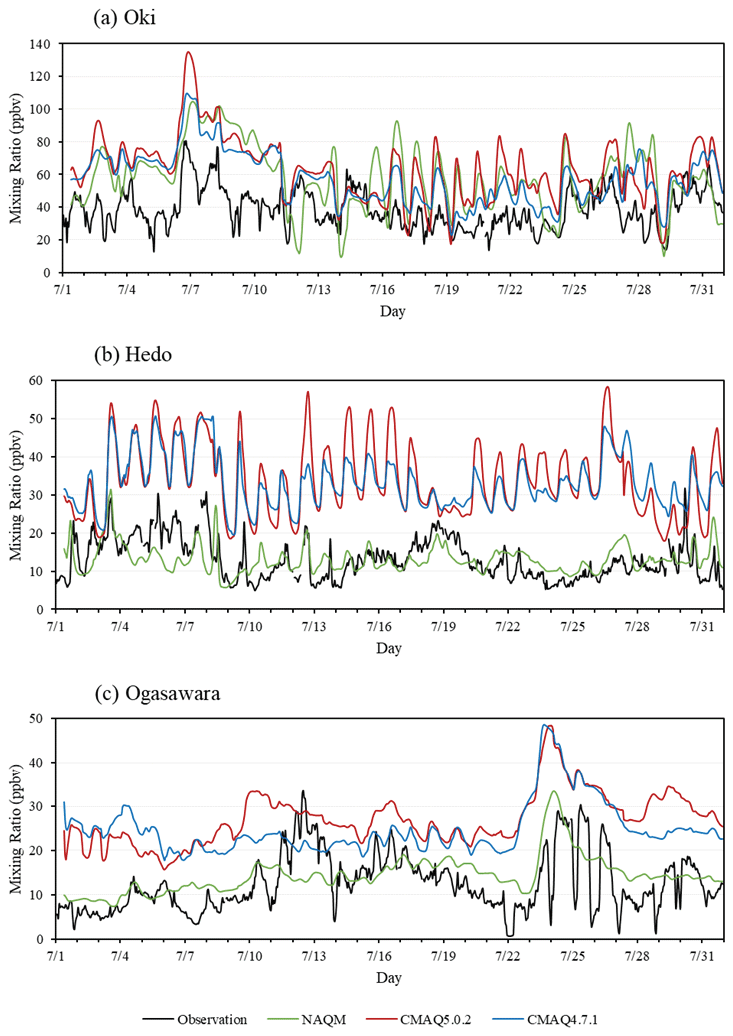
Figure 3Comparison of diurnal variation of surface O3 mixing ratios at (a) Oki, (b) Hedo, and (c) Ogasawara in July 2010 between observation and model simulation by CMAQ v.5.0.2 and v. 4.7.1 and NAQM v.3. Note that the vertical scale is different for Oki and Hedo/Ogasawara.
As seen in Fig. 3a, a distinct diurnal variation with a daytime maximum and a nighttime minimum can be discerned during 16–20 July in the simulations by NAQM and CMAQ 5.0.2. The diurnal variation is less profound in the CMAQ 4.7.1 simulation and is not discernible in the observational data. This feature apparent in the model simulations is thought to be the result of in situ photochemical O3 production during daytime, caused by overestimated NOx mixing ratios by the models, as will be discussed later in Sect. 3.3.
At Hedo on Okinawa, the observation shows that the minimum (baseline) mixing ratio of O3 in the maritime air mass in this region is 5–10 ppbv in July (Fig. 3b). The figure also shows that the observational O3 level frequently reaches 20–30 ppbv. NAQM reproduced well the background marine O3 levels of ca. 10 ppbv and the higher O3 levels of 20–30 ppbv. In contrast, a strong diurnal variation is apparent in the CMAQ 5.0.2 simulation with an amplitude of more than 20 ppbv and also in the CMAQ 4.7.1 simulation with a slightly lower amplitude. Furthermore, the maritime background O3 level simulated by these models is ca. 20 ppbv, nearly 10 ppbv higher than the observation. These values of the diurnal variation and background level clearly bring an overestimate of monthly mean O3 levels by more than 20 ppbv (Fig. 2b).
At Ogasawara, a more remote site in the northwestern Pacific about 1000 km south of Tokyo, the observational O3 mixing ratios in the oceanic air are 2–8 ppbv (Fig. 3c). However, even at Ogasawara in summer, higher O3 mixing ratios of up to 30 ppbv have been observed. The less than 10 ppbv baseline level of O3 in the remote oceanic air in this region is well reproduced by NAQM, but CMAQ 5.0.2 and 4.7.2 give more than 10 ppbv higher values than the observation. All three models captured well the observed O3 peak on 23–24 July, which can be ascribed to long-range transport from Japan, as will be discussed in Sect. 3.2 below. NAQM reproduced well the observed maximum O3 mixing ratio of ca. 30 ppbv as well as the transport amplitude of ∼ 25 ppbv. CMAQs gave the similar amount of O3 increase due to the transport, ∼ 25 ppbv, but overestimated the peak values due to the overestimate of the baseline mixing ratios. A certain feature of diurnal change peaking at daytime can be seen in both observation and model simulations for several days in Fig. 3c. Although Ogasawara is generally thought to be a real background site based on its remote location over the open Pacific Ocean, the monitoring station is actually surrounded by trees, and the data may be affected by local emissions of biogenic VOCs and soil NOx, which may possibly cause some photochemical activity to form in situ O3 under certain meteorological conditions. Overall, the NAQM-simulated values of monthly mean mixing ratios match the observations, and the CMAQ 5.0.2 and 4.7.1 simulations give ca. 15 ppbv higher O3 values at Ogasawara in July (Fig. 2c).
From these results, we consider that at least three factors, long-range transport, in situ photochemical O3 formation, and background mixing ratio of oceanic O3, would be related to the overestimate of surface O3 at Oki in July by the selected three models.
3.2 Long-range transport of O3
At least two high O3 events, one at Oki between 6 and 8 July and the other at Ogasawara on 23 and 24 July, are thought to be caused by long-range transport of O3. In order to confirm the characteristics of these events, the spatial distribution of surface O3 in East Asia obtained by NAQM, CMAQ 5.0.2 and 4.7.1 at 18:00 JST (Japan Standard Time) on 6 July and at 19:00 JST on 23 July are shown in the left and right figures in Fig. 4a–c, respectively. Figure 4a–c (left-hand side) show the event when the plume of continental outflow is transported to the Yellow Sea, South Korea and Japan covering the Oki site. In this event, the simulated surface O3 mixing ratios by NAQM, CMAQ 5.0.2 and 4.7.1 are 104, 135 and 110 ppbv, respectively, which are substantially higher than the observational value of 80 ppbv. An overestimate of the O3 level in the upwind area of Beijing produced by CMAQ 5.0.2 and 4.7.1 has been identified in our previous paper (Akimoto et al., 2019), which may have contributed to some extent to the overestimate of O3 by these models during this event. The reduction of overestimate over the continent would remove the substantial part of the overestimate of O3 on these days, although the sensitivity analysis has not been made in the present study. On the other hand, NAQM reproduced reasonably well the O3 levels in the urban areas of Beijing in July (Akimoto et al., 2019). Nevertheless, the simulated level of O3 by NAQM during the event is ca. 20 ppbv higher than that of the observation, which implies that an additional factor contributes to the overestimate of O3 in the long-range-transported air mass.
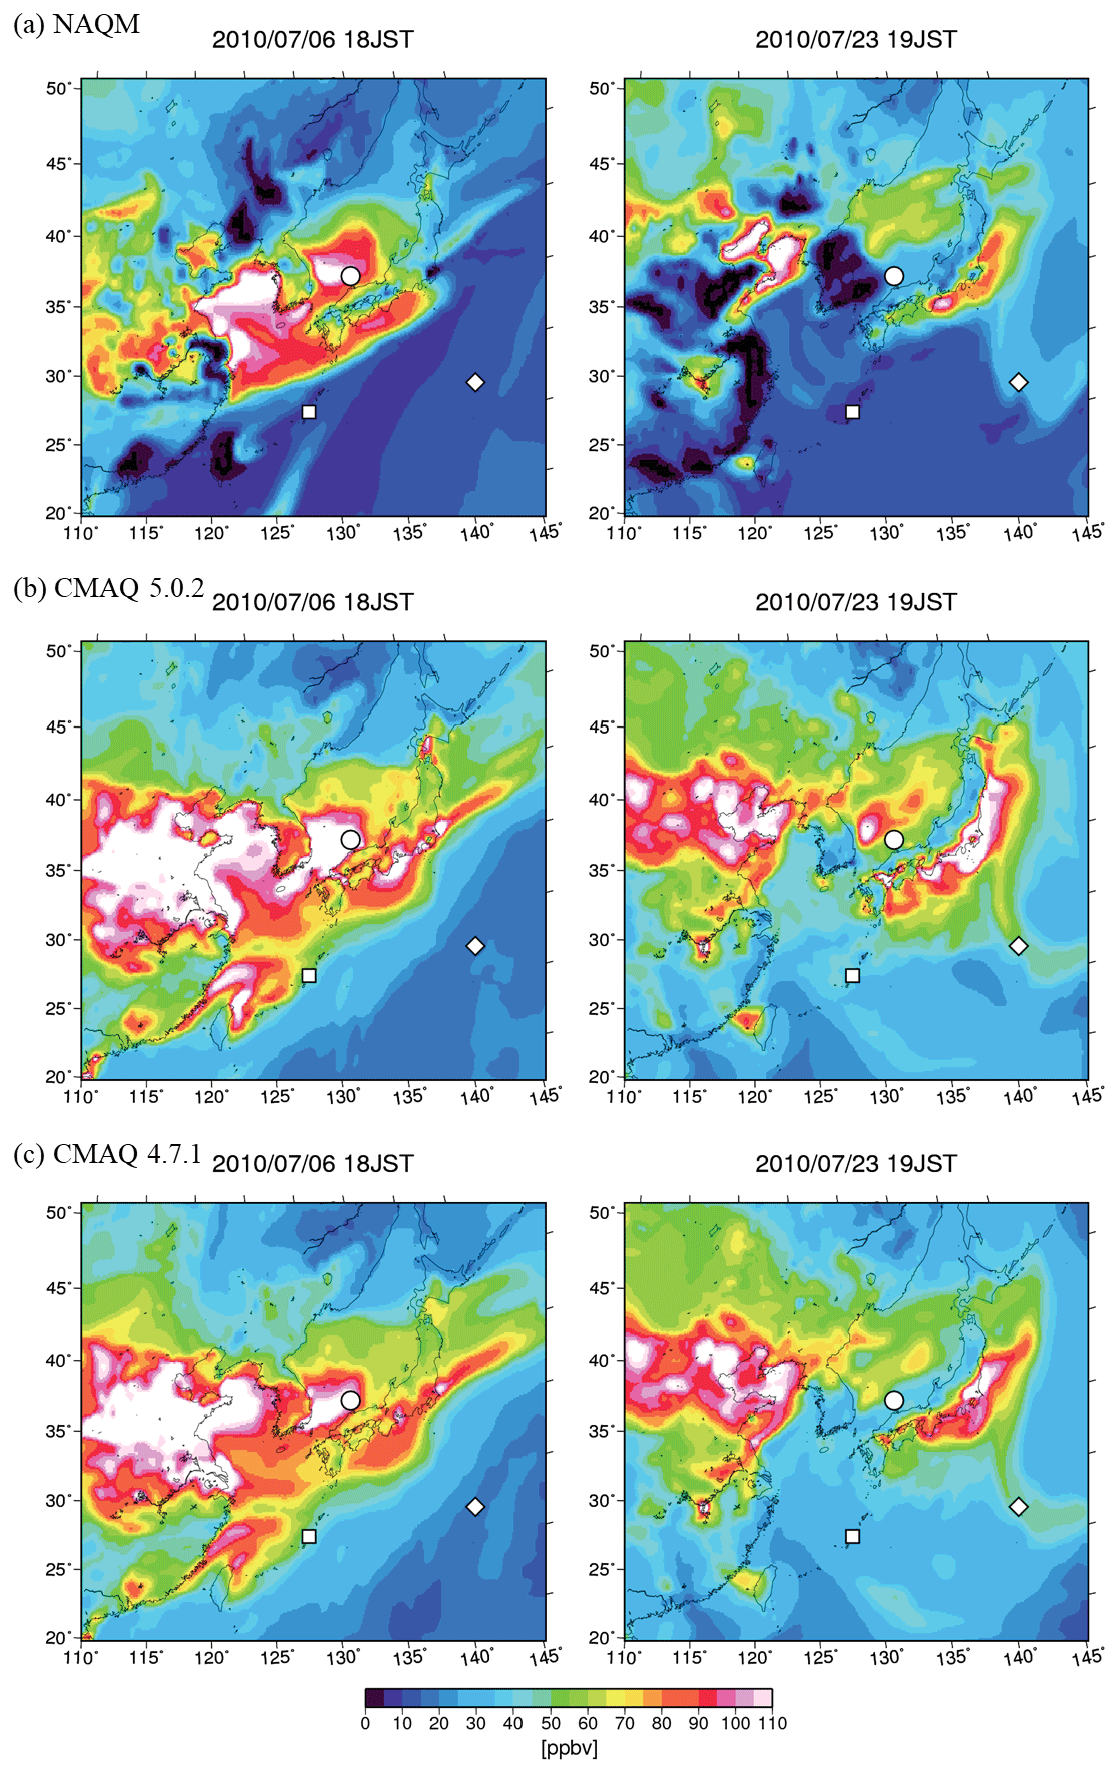
Figure 4Spatial distribution of surface O3 over northeastern Asia at 18:00 JST on 6 July (left) and 19:00 JST on 23 July (right) 2010 simulated by (a) NAQMS, (b) CMAQ 5.0.2, and (c) CMAQ 4.7.1. Markers denote the locations of observation sites.
This additional factor of the overestimate of surface O3 in the long-range-transported O3 from the continent commonly affecting the results of all three selected models could be the result of the overestimate of surface O3 over the Bohai Sea, the Yellow Sea, and the southern part of the Sea of Japan caused by the underestimate of dry deposition velocity of O3 over the seawater in these areas, which will be discussed later in detail in Sect. 3.4.
The right-hand figures in Fig. 4a–c show the long-range transport of O3 over Japan to the Ogasawara islands on 23 July. Under certain meteorological conditions, a high level of O3 over Japan is transported southward toward the Pacific Ocean. The simulated increment of transported O3 to Ogasawara by all three models reproduces the observed value of ∼25 ppbv reasonably well, and the long-range transport of O3 from Japan in this region is not overestimated in either of the models.
3.3 In situ photochemical formation of O3
An apparent diurnal variation of O3 with a daytime maximum and a nighttime minimum has been noted in the simulated results at Oki in Fig. 3a for all three models, particularly during 16–23 July, which is not discerned distinctly in the observational data. Such a diurnal variation in the simulated results strongly suggests that an in situ photochemical buildup of O3 occurs in the model simulations. In order to assess the extent of the photochemical buildup and net chemical production of O3 at the remote marine site of Oki, Fig. 5a and b compare the model-simulated mixing ratio of NO2 and NO with those of NO2* and NO observed using a chemiluminescent analyzer with a molybdenum (Mo) catalyzer. Since the Mo catalyzer reduces not only NO2, but also gaseous HNO3 and particulate NO to NO, in an unstoichiometric way, the quantity of NO2∗ rather than NO2 is reported in the EANET protocol. Since the contribution of HNO3 to NO2∗ is significant at remote sites, it is not possible to assess the exact ratio of NO2 ∕ NO2∗, and thus NO2∗ should be used only as a rule of thumb for the upper limit of NO2.
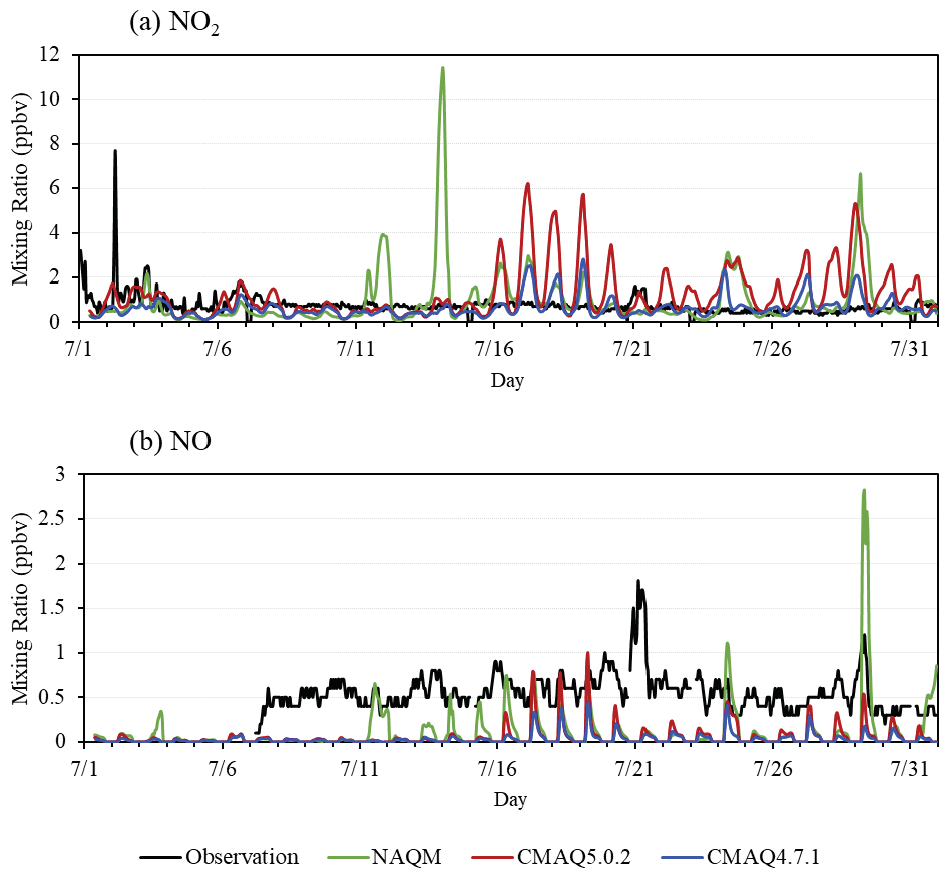
Figure 5(a) Mixing ratios of NO2* by observation, NO2 by NAQM, CMAQ v.5.0.2, and CMAQ v. 4.7.1 at Oki in July 2010. (b) Same as (a) but for NO. The sharp peak of NO2 on 2 July would be an artifact or influence of accidental local pollution (see text). The observed concentration of NO in the first week of July is in general under the detection limit and deleted from the figure.
As can be seen in these figures, all the simulated data show significant levels of NO2 of over 2 ppbv in the period from 16 to 21 July, which is substantially higher than the observed NO2∗, which is typically lower than 2 ppbv. It should be noted that the temporal variation of NO2 in the simulations by CMAQ 5.0.2 and 4.7.1 is similar, but the absolute mixing ratio simulated by CMAQ 5.0.2 is substantially higher than that simulated by CMAQ 4.7.1. Meanwhile, the temporal pattern of the NO2 mixing ratios simulated by NAQM is quite different from those simulated by CMAQs, and a significantly high level of NO2 of up to 11 ppbv can be seen on 13 July.
It should be pointed out that Oki station is a remote site and that the emission of NOx within the model grid covering Oki is very low, which gives a low simulated mixing ratio of NO2 of less than 1 ppbv in the early half of the month by all the models. Since all three models use the same emission data supplied by the MICS-Asia III project (Li et al., 2017), the high NO2 over 5 ppbv in Fig. 5a typically seen in the latter half of the month is thought to be transported from urban/industrial sources nearby. A possible source is Matsue and surrounding cities in mainland Japan which are located less than 100 km south of the Oki site. Model simulations of wrong meteorology may transport much of the NOx from this area, which does not happen in reality. The different temporal pattern of NOx between the NAQM and CMAQ simulations is thought to result from the difference in the coupling of transport and chemistry in these models. A high NO2 ∕ NO ratio seen in the model simulation is consistent with the presumption that the virtual source area of NOx is not close to the site on the island. Similar figures to Fig. 5a–b for Hedo and Okinawa are given in Figs. S5-1 and S5-2 (in the Supplement), respectively. Although Hedo is a remote island site, the area surrounding the station consists of sugar cane field soils emitting substantial NO (Matsumoto et al., 2001), which would give a 0.5 pptv level of NO in observational data for certain days. The MIX emission inventory used for the modeling considers agricultural sources of NOx unspecific to crop species. Diurnal variation of NO2 with a smaller amplitude ( ppbv) than Oki is seen at Hedo for CMAQ 5.0.2 and 4.7.1 but not for NAQM. At Ogasawara none of the models shows NO2 peaks of more than 0.5 ppbv.
In addition to photochemical processes, physical processes of O3 composed of vertical transport from the layer above the marine boundary layer (MBL) coupled with horizontal transport could produce diurnal variation of O3 observed at Oki and Hedo. Figure 6a–c depict the hourly net chemical production (chemical production + chemical loss) and physical transport (vertical transport + horizontal transport) of O3 at Oki calculated by NAQM, CMAQ 5.0.2, and CMAQ 4.7.1. Similar figures for Hedo are shown in Fig. S6-1. At Oki substantial photochemical O3 production was simulated by the models up to 10–15 ppbv h−1 during the period of 16–23 July. On the other hand, physical transport processes contributed negatively (5–15 ppb h−1) during the period. In order to confirm the possibility of the contribution of upper-layer O3, the vertical profile of O3 simulated by CMAQ 4.7.1 during the month of July is shown in Fig. S6-2. As revealed in Fig. S6-2, O3 in the lower troposphere is typically as low as 20–40 ppbv during the period of 16–23 July, when Oki is apparently covered by Pacific high pressure containing the clean marine air. In contrast, the long-range transport brought high O3 (80–100 ppb) in the lower free troposphere and near-surface layer on 7–10 July (cf. Fig. 3a).
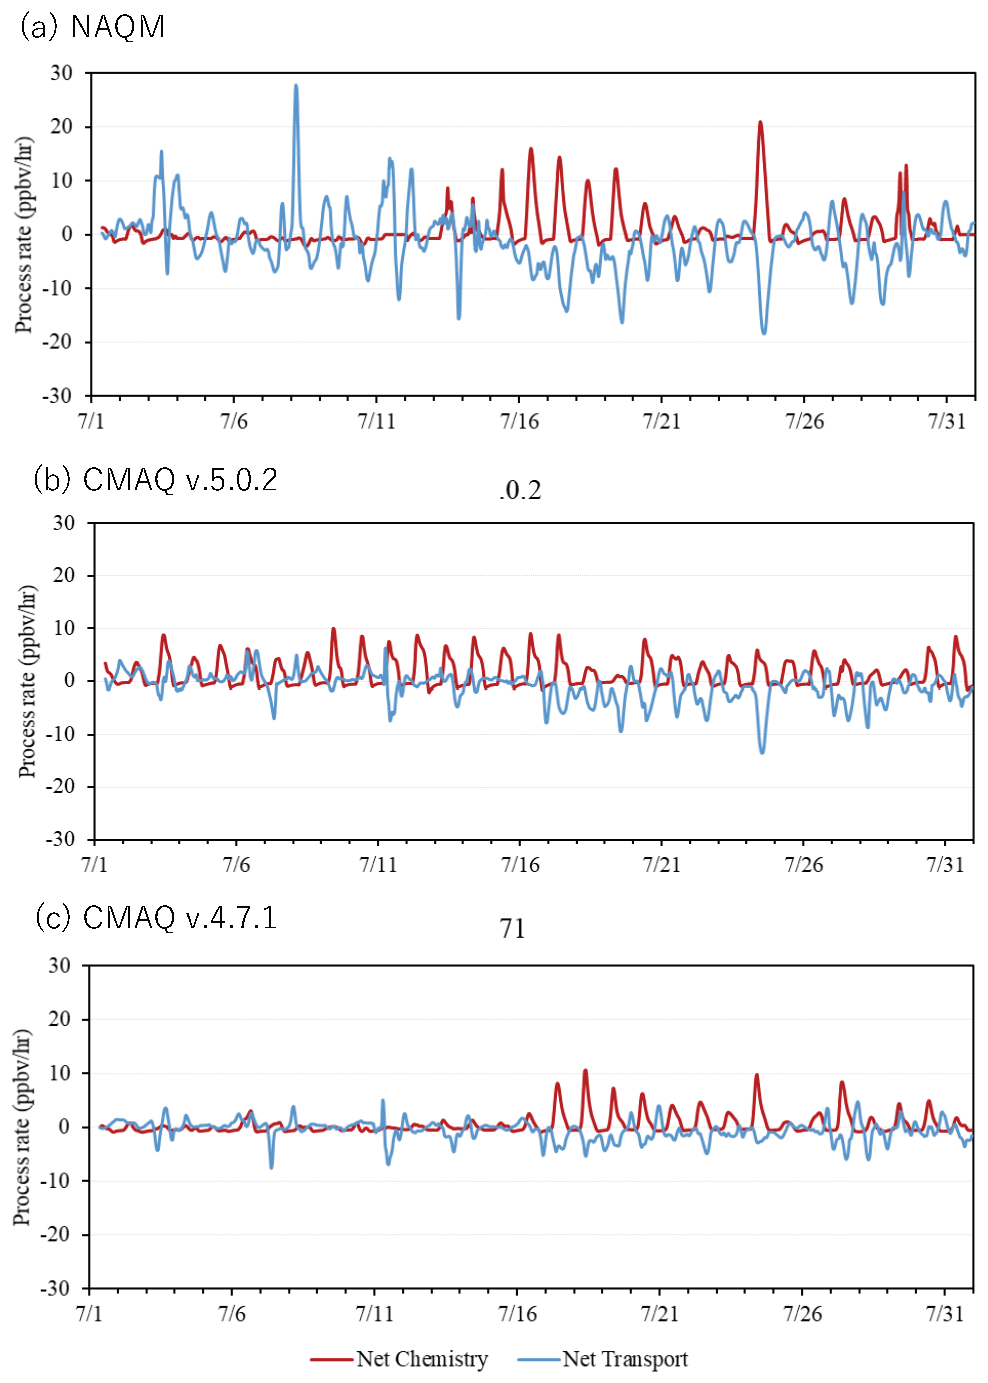
Figure 6Model-calculated net chemical production and net transport of O3 at Oki in July 2010 by (a) NAQM, (b) CMAQ5.0.1, and (c) CMAQ 4.7.1.
Thus, virtually simulated relatively high NOx is thought to bring the in situ photochemical ozone production in the CTMs, which contributes to the overestimate of the monthly averaged mixing ratio of O3 at Oki by all three models. An analysis reveals that the situation is similar at Hedo. Photochemical O3 production of up to 8–10 ppbv h−1 has been simulated by CMAQ 5.0.2 and 4.7.1, as shown in Fig. S6-1. Although Hedo is a remote island site, the local emission of NO from sugar cane field soils emits substantial NO as noted before, which results in some daytime O3 peaks in the observational data as shown in Fig. 3b. The substantial overestimate of the photochemical O3 formation at Hedo produced by CMAQ 5.0.2 and 4.7.1 as revealed by the distinct diurnal variation of O3 in Fig. 3b may also be due to the virtual transport of NOx from urban areas in the southerly part of Okinawa, as in the case of Oki. The overestimate of the in situ photochemical buildup of O3 seems to have resulted from an overestimate of more than ca. 10 ppbv in the monthly mean mixing ratios by these models in addition to the overestimate of the background levels.
At Ogasawara, no such photochemical buildup of O3 of more than 1 ppb h−1 can be seen by any of the models. The overestimate of ca. 10 ppbv monthly mean O3 by the CMAQ models (Fig. 2c) is apparently due to the overestimate of background O3 in a clean marine air mass.
3.4 Dry deposition of O3 on seawater
Figure 7a–c compare the spatial distribution of monthly mean surface ozone mixing ratios in July 2010 in the coastal and oceanic areas of East Asia calculated by NAQM, CMAQ 5.0.2, and 4.7.1, respectively. A large variability in the O3 mixing ratio among the models can be seen in heavily polluted land areas, and possible causes of the difference in the megacities of Beijing and Tokyo have been discussed in our previous paper (Akimoto et al., 2019). In addition to the land area, a difference of surface O3 mixing ratios in the oceanic area among the three models can be seen in the figures. The surface O3 simulated by NAQM in the open oceanic area south of Japan is 10–15 ppbv, which is substantially lower than the 25–30 ppbv produced by CMAQ 5.0.2 and 4.7.1. These values correspond well to the calculated monthly mean O3 mixing ratios at the “true oceanic site” Ogasawara, shown in Fig. 2c. Figure 7 also shows that Cape Hedo in Okinawa is at the edge of the Pacific marine air mass, where the coastal air mass could be affected by the continental outflow. The O3 mixing ratio near this site simulated by CMAQ 5.0.2 and 4.7.1 is 30–40 ppbv as compared to ca. 10–20 ppbv calculated by NAQM, which agrees well with the observational value at Hedo (Fig. 2b). Thus, the overestimates of surface ozone at the oceanic sites of Hedo and Ogasawara produced by the CMAQ models shown in Fig. 7 are ascribed to an overestimate of O3 in the vast area of the open Pacific Ocean.
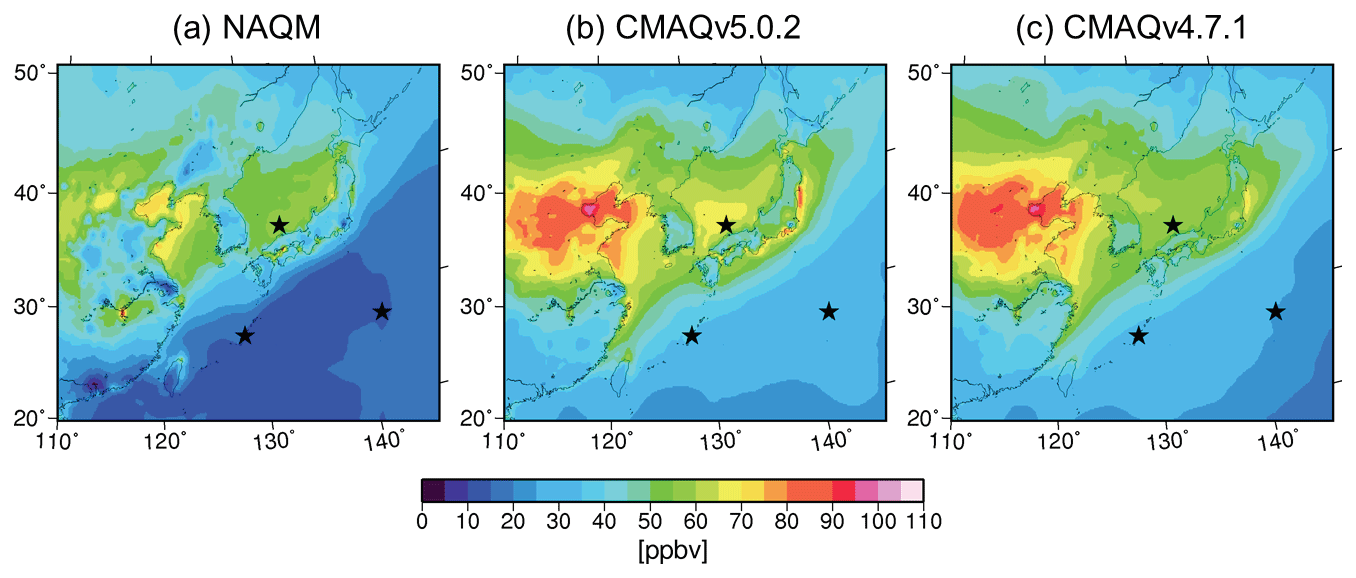
Figure 7Comparison of the spatial distribution of surface O3 mixing ratios in East Asia in July simulated by (a) NAQM, (b) CMAQ 5.0.2, and (c) 4.7.1.
We speculate that the cause of this overestimate is possibly an underestimate of dry deposition velocity of O3 on seawater made by these models. Ganzeveld et al. (2009) reported that large uncertainties exist in the magnitude of the air–sea exchange of ozone, with the deposition velocity (Vd) ranging from 0.01 to 0.15 cm s−1 for oceanic water and from 0.01 to 0.1 cm s−1 for freshwater. Typically applied values for Vd over the ocean in global models are in the range of ∼ 0.013 to 0.05 cm s−1 (Ganzeveld and Lelieveld, 1995). Oh et al. (2008) studied the effect of dry deposition on the concentration of O3 over the ocean in the northwestern Gulf of Mexico using a regional model. They reported monthly averaged Vd of 0.0026 and 0.0056 cm s−1 based on the original and modified Model3/CMAQ models, respectively, and a modified module including iodide reaction showed a significant increase in Vd to 0.0160 cm s−1.
Although direct measurements of the ozone deposition flux over the ocean are limited, Helmig et al. (2012) conducted a ship-based eddy covariance ozone flux measurement on five cruises covering the Gulf of Mexico, the South and North Atlantic, the Southern Ocean and the eastern Pacific along Chile. The median Vd for four cruises falls within the range of 0.01–0.02 cm s−1 in the off-coast ocean area, while the median Vd measured in the coastal zone fell within the range of 0.24±0.02 cm s−1 (Helmig et al., 2012). A value of Vd, 0.055 cm s−1, over the North Pacific has been reported by the aircraft observation (Lenschow et al., 1982). Thus, dry deposition velocities used in models and obtained in observation over the ocean range between ca. 0.02 and 0.2 cm s−1 in about a factor of 100.
In order to discuss the effect of dry deposition of O3 over the seawater, the spatial distribution of monthly averaged Vd in the continental rim region of the northwestern Pacific Ocean simulated by NAQM and CMAQ 5.0.2 and 4.7.1 is compared in Fig. 8a–c, respectively. The simulated Vd of O3 has been calculated by
where is the downward deposition flux of O3 (ppbv s cm−1) and [O3] is the monthly mean surface O3 mixing ratio (ppbv). Figure 8 shows that the Vd over the northwestern Pacific Ocean south of Japan is typically 0.0015–0.002 cm s−1 in the NAQM simulation and 0.0005–0.001 cm s−1 in the CMAQ 5.0.2 and 4.7.1 simulations. Thus, even though the values used by NAQM are about twice as large as those used by CMAQs, they are at the lower end of values ever used in the modeling studies mentioned above. Meanwhile, the dry deposition velocity of O3 in the global models used in MICS-Asia III is based on Wesley (1989), and the value of ∼0.045 cm s−1 has been adopted over the Pacific Ocean, which accords with the values used in some other global models (Ganzeveld and Lelieveld, 1995; Ganzeveld et al., 2009).

Figure 8Comparison of the spatial distribution of dry deposition velocity of O3 in East Asia simulated by (a) NAQM, (b) CMAQ 5.0.2, and (c) 4.7.1.
The sensitivity of dry deposition velocity on the ocean to the simulated concentration of O3 at the marine sites has been evaluated in the simulation with the varied Vd by factors of ×1 (standard), ×2, ×10 and (essentially zero) by using CMAQ v5.0.2 with a different model domain setting which includes the area surrounding Japan's main islands and with a horizontal resolution of 15 km. Figure 9 depicts the difference of hourly O3 mixing ratios between the standard runs and those with increased and decreased Vd at Oki in July. As shown in Fig. 9, O3 mixing ratios with the increased Vd by factors of ×2 and ×10 give ∼5 and ∼ 20–30 ppbv lower O3, and with nearly zero Vd they give ∼10 ppbv higher O3 as compared to the standard runs at Oki in a certain period of time. Thus, it can be shown that the sensitivity of dry deposition velocity to the O3 concentration is substantial on an event base. However, on a monthly averaged basis, the differences between the standard run and the runs with Vd by factors of , ×2, and ×10 are 1.3, −1.0, and −4.9 ppb in July. Since the employment of Vd=0.01 cm s−1, a factor of 10 larger Vd of the present study for CMAQs would be quite plausible considering the range of Vd used in previous studies; at least about half of the 10 ppbv overestimate of background O3 for the Pacific Ocean may be corrected. However, another question would arise from the present sensitivity analysis: why can NAQM reproduce well the background oceanic O3 even though it employed such a low Vd of 0.0015–0.002 cm s−1? It could be speculated that the O3 mixing ratios in background oceanic air may also be affected by some other factor than the dry deposition velocity, e.g., non-episodic broad spread of continental outflow over this area of the ocean.
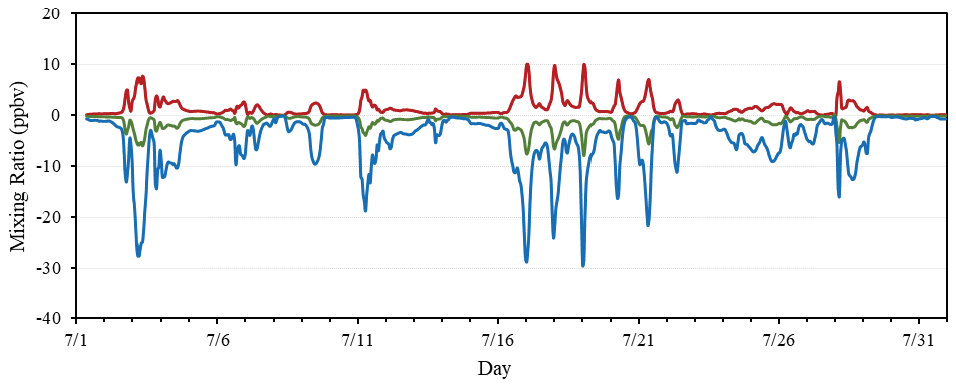
Figure 9The difference of O3 mixing ratios between the standard Vd run and runs with (red), ×2 (green) and ×10 (blue) at Oki in July 2010 by CMAQ.
It can be noted that the mixing ratios of O3 in Bohai Bay and the Yellow Sea shown in Fig. 7a–c are relatively high for all three models as compared to the surrounding land area. This may be caused by the use of a much smaller deposition velocity of O3 over the ocean closer to the continent. While iodine has been estimated to be most important in increasing the dry deposition velocity of O3 over the ocean, dissolved organic carbon is also thought to contribute significantly to this process (Ganzeveld et al., 2009; Sarwar et al., 2015). Coleman et al. (2010) also showed that in addition to iodide the inclusion of dissolved organic compounds (DOCs) described better the daytime deposition observation in coastal water of the North Atlantic. Thus, the dry deposition velocity of O3 in Bohai Bay and the Yellow Sea is expected to be much higher than that in the open Pacific Ocean. However, as shown in Fig. 8, the dry deposition velocity in this area employed by all three models is even smaller than that in the open Pacific Ocean. This is unreasonable considering the discussion by Ganzeveld et al. (2009), which has been supported by the findings of Helmig et al. (2012). Particularly, the even lower deposition velocity in this area assumed by NAQM compared to that in the open Pacific may have contributed substantially to the overestimate of O3 at Oki by this model. The overestimate of the O3 mixing ratio in Bohai Bay and the Yellow Sea would contribute to the overestimate of O3 at Oki and to the evaluation of transboundary long-range transport of O3 to Korea and Japan. Since the model is highly sensitive to water surface resistance, it is important to empirically obtain the values of dry deposition flux of O3 and its precursors over Bohai Bay and the Yellow Sea.
In addition to the dry deposition on seawater, photochemical gas-phase halogen chemistry mainly by bromine and iodine has been suggested to decrease surface O3 in the marine boundary layer in the Northern Hemisphere (Sarwar et al., 2015). Nagao et al. (1999) reported the 10 %–15 % loss of surface O3 in May–October based on the observation at Ogasawara throughout a year, which they ascribed to the bromine released by heterogeneous reaction of sea salt. Read et al. (2008) reported 8 months of spectroscopic measurements of BrO and IO at the Cape Verde Observatory in the tropical eastern North Atlantic and evaluated the annual average daily ozone loss of 3.2±1.1 ppbv d−1, which amounts to 50 % greater than that simulated by a global chemistry model excluding halogen chemistry. Mahajan et al. (2010) also estimated that the calculated O3 depletion in the marine boundary layer at the Cape Verde islands increases to ∼ 4.5 ppbv d−1 by including the halogen chemistry compared to ∼ 2.5 ppbv d−1 due to HOx chemistry and deposition to the ocean surface.
Since the present versions of CMAQ and NAQM do not include gas-phase chemistry of halogens, the monthly averaged O3 mixing ratios simulated by these models as shown in Fig. 2 would decrease a couple of ppbv according to the above studies (Nagao et al., 1999; Read et al., 2008; Mahajan et al., 2010).
The present and previous (Akimoto et al., 2019) papers aimed to elucidate the causes of discrepancies of surface-level ozone at remote marine sites and central megacity sites in East Asia, respectively, among models and between models and observation. Based on the findings in these analyses, a couple of future research recommendations are proposed here in order to solve the issues encountered in model intercomparison studies on surface-level ozone.
-
Measurement of the mixing ratios and dry deposition flux of O3 over Bohai Bay and the Yellow Sea
Surface-level ozone mixing ratios in the marine region of East Asia have been found to be sensitive to the dry deposition velocity of O3 over seawater. Although the dry deposition velocity over Bohai Bay and the Yellow Sea is expected to be much larger than that over the open ocean in the northwestern Pacific due to the enriched organic compounds brought by rivers and atmospheric wet deposition, no such measurements have been conducted to our knowledge. Since the dry deposition velocity of O3 over Bohai Bay and the Yellow Sea may affect the evaluation of transboundary transport of O3 to the downwind region, measurement of the mixing ratios and Vd of O3 in this marine area is highly recommended.
-
Simultaneous comprehensive measurement of NOy focusing on gaseous HNO3 in urban areas
In order to perform reliable model simulation of surface-level ozone in urban areas for the purpose of proposing an ozone control policy, it is important to verify whether NOy chemistry is properly incorporated. In particular, model validation for HNO3 is important, since the mixing ratio of gaseous HNO3 is estimated to be comparable to NOx. However, due to technical difficulty, direct measurement of gaseous HNO3 together with other NOy has rarely been conducted. A field campaign in urban areas for simultaneous measurement of NOy including direct measurement of gaseous HNO3 (e.g., by chemical ionization mass spectrometry) is highly recommended, focusing on the quantification of the potential importance of the heterogeneous “renoxification” reaction of HNO3 to regenerate NOx on the aerosol surface.
These activities are recommended to be jointly co-organized by field experimentalists and modelers.
Simulations by the regional chemical transport models, NAQM, CMAQ v.5.0.2 and CMAQ v.4.7.1, in the context of MICS Asia III overestimated the observed surface-level ozone at Oki in July 2010 by 20–30 ppbv. In order to identify the causes of this overestimate, analyses were performed not only for Oki, but for two other EANET marine sites, Hedo and Ogasawara as well. At Hedo and Ogasawara, NAQM reproduced reasonably well the observational values of monthly mean diurnal mixing ratios of O3, while the two CMAQ models overestimated the observation by 23–27 and 11–14 ppbv, respectively.
Three factors have been identified as the possible cause of overestimates made by the model simulations at Oki: (i) long-range transport of O3 from the continent, (ii) in situ photochemical formation of O3, and (iii) dry deposition of O3 on seawater. An overestimate of transported O3 from the continent can be identified at Oki in July for all three models. The overestimate for the CMAQ models may partly be ascribed to an overestimate of the O3 mixing ratio in the source region of China. An overestimate of long-range-transported O3 was also seen in NAQM which reproduced the mixing ratio in Beijing reasonably well. The cause of overestimate of long-range-transported O3 by NAQM may partly be ascribed to the possible overestimate of the marine boundary layer O3 in Bohai Bay and the Yellow Sea due to the too small deposition velocity of O3 over the seawater assumed in the models.
The overestimate of the monthly averaged mixing ratio of O3 at Oki has been ascribed partly to the in situ photochemical formation, which was demonstrated by the distinct diurnal variation of O3 produced by all three models but not discernible in the observational data. Such an in situ formation of O3 was found to be caused by the virtual transport of NOx in the model simulation from the urban areas of mainland Japan to Oki.
At the Hedo and Ogasawara sites, an overestimate of O3 in the oceanic air mass was found in CMAQ 5.0.2 and 4.7.1, while a reasonably good agreement with observational data was obtained by NAQM. The overestimate by the CMAQ models was discussed in relation to the dry deposition velocity of O3 on seawater. It has been identified that O3 mixing ratios over Bohai Bay and the Yellow Sea are higher than those over the surrounding land surface for all three models, which was ascribed to the employment of too small a dry deposition velocity on seawater in this area in spite of higher contents of organics due to the deposition from the atmosphere and rivers.
The EANET observational dataset used in this study is available at http://www.acap.asia (ACAP, 2020).
The supplement related to this article is available online at: https://doi.org/10.5194/acp-20-15003-2020-supplement.
HA analyzed the data and wrote the first draft of the paper. TN, JL, and JSF provided the model simulation data for their own models and conducted discussions for the paper. NK conducted the model simulation of sensitivity analysis of dry deposition. ZW contributed to the availability of modeling data as a coordinator of MICS-Asia III.
The authors declare that they have no conflict of interest.
This article is part of the special issue “Regional assessment of air pollution and climate change over East and Southeast Asia: results from MICS-Asia Phase III”. It is not associated with a conference.
We would like to thank Edit Nagy-Tanaka at NIES for English language editing.
This research has been supported by the Ministry of the Environment, Japan (Environment Research and Technology Development Fund (grant no. S12-1)) and the Natural Science Foundation of China (grant no. 41620104008).
This paper was edited by Qiang Zhang and reviewed by three anonymous referees.
ACAP: Monitoring data, available at: http://www.acap.asia, last access 10 January 2020.
Akimoto, H.: Atmospheric Reaction Chemistry, Springer Japan, Tokyo, 2016.
Akimoto, H., Mukai, H., Nishikawa, M., Murano, K., Hatakeyama, S. Liu, C.-M., Buhr, M. Hsu, K. J., Jaffe, D. A., Zhang, L., Honrath, R., Merrill, J. T., and Newell, R. J.: Long-range transport of ozone in the East Asian Pacific rim region, J. Geophys. Res., 101, 1999–2010, 1996.
Akimoto, H., Nagashima, T., Li, J., Fu, J. S., Ji, D., Tan, J., and Wang, Z.: Comparison of surface ozone simulation among selected regional models in MICS-Asia III – effects of chemistry and vertical transport for the causes of difference, Atmos. Chem. Phys., 19, 603–615, https://doi.org/10.5194/acp-19-603-2019, 2019.
Coleman, L., Varghese, S., Jennings, S. G., and O'Dowd, C. D.: Regional-scale ozone deposition to north-east Atlantic waters, Adv. Meteorol., 243701, 16 pp., https://doi.org/10.1155/2010/243701, 2010.
De Wispelaer, C. (Ed.): Air Pollution Modeling and its Application I, Plenum Press, New York, 1981.
EANET: EANET site information, available at: http://www.eanet.asia/about/site-information/, last access: 23 January 2020.
Ganzeveld, I., Helmig, D., Fairall, C. W., Hare, J., and Pozzer, A.: Atmosphere-ocean ozone exchange: A global modeling study of biogeochemical, atmospheric, and waterside turbulence dependencies, Global Biogeochem. Cy., 23, GB4021, https://doi.org/10.1029/2008GB003301, 2009.
Ganzeveld, L. and Lelieveld, J.: Dry deposition parameterization in a chemistry general circulation model and its influence on the distribution of reactive trace species, J. Geophys. Res., 100, 20999–21012, https://doi.org/10.1029/95JD02266, 1995.
Hardacre, C., Wild, O., and Emberson, L.: An evaluation of ozone dry deposition in global scale chemistry climate models, Atmos. Chem. Phys., 15, 6419–6436, https://doi.org/10.5194/acp-15-6419-2015, 2015.
Helmig, D., Lang, E. K., Bariteau, L., Boylan, P., Fairall, C. W., Ganzeveld, L., Hare, J. E., Hueber, J., and Pallandt, M.: Atmosphere-ocean ozone fluxes during the TexAQS 2006, STRATUS 2006, GOMECC 2007, GasEx 2008, and AMMA 2008 cruises, J. Geophys. Res., 117, D04305, https://doi.org/10.1029/2011JD015955, 2012.
Kong, L., Tang, X., Zhu, J., Wang, Z., Fu, J. S., Wang, X., Itahashi, S., Yamaji, K., Nagashima, T., Lee, H.-J., Kim, C.-H., Lin, C.-Y., Chen, L., Zhang, M., Tao, Z., Li, J., Kajino, M., Liao, H., Wang, Z., Sudo, K., Wang, Y., Pan, Y., Tang, G., Li, M., Wu, Q., Ge, B., and Carmichael, G. R.: Evaluation and uncertainty investigation of the NO2, CO and NH3 modeling over China under the framework of MICS-Asia III, Atmos. Chem. Phys., 20, 181–202, https://doi.org/10.5194/acp-20-181-2020, 2020.
Lenschow, D. H., Pearson Jr., R., and Stankov, B. B.: Measurements of Ozone Vertical Flux to Ocean and Forest, J. Geophys. Res., 87, 8833–8837, 1982.
Li, J., Nagashima, T., Kong, L., Ge, B., Yamaji, K., Fu, J. S., Wang, X., Fan, Q., Itahashi, S., Lee, H.-J., Kim, C.-H., Lin, C.-Y., Zhang, M., Tao, Z., Kajino, M., Liao, H., Li, M., Woo, J.-H., Kurokawa, J., Wang, Z., Wu, Q., Akimoto, H., Carmichael, G. R., and Wang, Z.: Model evaluation and intercomparison of surface-level ozone and relevant species in East Asia in the context of MICS-Asia Phase III – Part 1: Overview, Atmos. Chem. Phys., 19, 12993–13015, https://doi.org/10.5194/acp-19-12993-2019, 2019.
Li, M., Zhang, Q., Kurokawa, J.-I., Woo, J.-H., He, K., Lu, Z., Ohara, T., Song, Y., Streets, D. G., Carmichael, G. R., Cheng, Y., Hong, C., Huo, H., Jiang, X., Kang, S., Liu, F., Su, H., and Zheng, B.: MIX: a mosaic Asian anthropogenic emission inventory under the international collaboration framework of the MICS-Asia and HTAP, Atmos. Chem. Phys., 17, 935–963, https://doi.org/10.5194/acp-17-935-2017, 2017.
Luhar, A. K., Woodhouse, M. T., and Galbally, I. E.: A revised global ozone dry deposition estimate based on a new two-layer parameterisation for air–sea exchange and the multi-year MACC composition reanalysis, Atmos. Chem. Phys., 18, 4329–4348, https://doi.org/10.5194/acp-18-4329-2018, 2018.
Mahajan, A. S., Plane, J. M. C., Oetjen, H., Mendes, L., Saunders, R. W., Saiz-Lopez, A., Jones, C. E., Carpenter, L. J., and McFiggans, G. B.: Measurement and modelling of tropospheric reactive halogen species over the tropical Atlantic Ocean, Atmos. Chem. Phys., 10, 4611–4624, https://doi.org/10.5194/acp-10-4611-2010, 2010.
Matsumoto, J., Hirokawa, J., Akimoto, H., and Kajii, Y.: Direct measurement of NO2 in the marine atmosphere by laser-induced fluorescence technique, Atmos. Environ., 35, 2803–2814, 2001.
Nagao, I., Matsumoto, K., and Tanaka, H.: Sunrise ozone destruction found in the sub-tropical marine boundary layer, Geophys. Res. Lett., 26, 3377–3380, 1999.
Oh, I.-B., Byun, D. W., Kim, H.-C., Kim, S., and Cameron, B.: Modeling the effect of iodide distribution on ozone deposition to seawater surface, Atmos. Environ., 42, 4453–4466, 2008.
Park, R. J., Hong, S. K., Kwon, H.-A., Kim, S., Guenther, A., Woo, J.-H., and Loughner, C. P.: An evaluation of ozone dry deposition simulations in East Asia, Atmos. Chem. Phys., 14, 7929–7940, https://doi.org/10.5194/acp-14-7929-2014, 2014.
Pleim, J. E., Xiu, A., Finkelstein, P. L., and Otte, T. L.: A coupled land-surface and dry deposition model and comparison to field measurements of surface heat, moisture, and ozone fluxes, Water Air Soil Pollut., 1, 243–252, 2001.
Pochanart, P., Akimoto, H., Kinjo, Y., and Tanimoto, H.: Surface ozone at four remote island sites and the preliminary assessment of the exceedances of its critical level in Japan, Atmos. Environ., 36, 4235–4250, 2002.
Read, K. A., Mahajan, A. S., Carpenter, L. J., Evans, M. J., Faria, B. V. E., Heard, D. E., Hopkins, J. R., Lee, J. D., Moller, S. J., Lewis, A. C., Mendes, L., McQuaid, J. B., Oetjen, H., Saiz-Lopez, A., Pilling, M. J., and Plane, J. M. C.: Extensive halogen-mediated ozone destruction over the tropical Atlantic Ocean, Nature, 453, 1232–1235, 2008.
Sarwar, G., Gantt, B., Schwede, D., Foley, K., Mathur, R., and Saiz-Lopez, A.: Impact of enhanced ozone deposition and halogen chemistry on tropospheric ozone over the Northern Hemisphere, Environ. Sci. Technol., 49, 9203–9211, 2015.
Schultz, M. G., Schröder, S., Lyapina, O., et al.: Tropospheric Ozone Assessment Report: Database and metrics data of global surface ozone observations, Elem. Sci. Anth., 5, 58, https://doi.org/10.1525/elementa.244, 2017.
Wesely, M. L.: Parameterization of surface resistances to gaseous dry deposition in regional-scale numerical models, Atmos. Environ., 23, 1293–1304, 1989.
Young, P. J., Archibald, A. T., Bowman, K. W., Lamarque, J.-F., Naik, V., Stevenson, D. S., Tilmes, S., Voulgarakis, A., Wild, O., Bergmann, D., Cameron-Smith, P., Cionni, I., Collins, W. J., Dalsøren, S. B., Doherty, R. M., Eyring, V., Faluvegi, G., Horowitz, L. W., Josse, B., Lee, Y. H., MacKenzie, I. A., Nagashima, T., Plummer, D. A., Righi, M., Rumbold, S. T., Skeie, R. B., Shindell, D. T., Strode, S. A., Sudo, K., Szopa, S., and Zeng, G.: Pre-industrial to end 21st century projections of tropospheric ozone from the Atmospheric Chemistry and Climate Model Intercomparison Project (ACCMIP), Atmos. Chem. Phys., 13, 2063–2090, https://doi.org/10.5194/acp-13-2063-2013, 2013.