the Creative Commons Attribution 4.0 License.
the Creative Commons Attribution 4.0 License.
 | 07 Feb 2020
Effect of changing NOx lifetime on the seasonality and long-term trends of satellite-observed tropospheric NO2 columns over China
Daniel J. Jacob
Rachel F. Silvern
Shixian Zhai
Mengyao Liu
Jintai Lin
Qiang Zhang
Satellite observations of tropospheric NO2 columns are extensively used to infer trends in anthropogenic emissions of nitrogen oxides (), but this may be complicated by trends in NOx lifetime. Here we use 2004–2018 observations from the Ozone Monitoring Instrument (OMI) satellite-based instrument (QA4ECV and POMINO v2 retrievals) to examine the seasonality and trends of tropospheric NO2 columns over central–eastern China, and we interpret the results with the GEOS-Chem chemical transport model. The observations show a factor of 3 increase in NO2 columns from summer to winter, which we explain in GEOS-Chem as reflecting a longer NOx lifetime in winter than in summer (21 h versus 5.9 h in 2017). The 2005–2018 summer trends of OMI NO2 closely follow the trends in the Multi-resolution Emission Inventory for China (MEIC), with a rise over the 2005–2011 period and a 25 % decrease since. We find in GEOS-Chem no significant trend of the NOx lifetime in summer, supporting the emission trend reported by the MEIC. The winter trend of OMI NO2 is steeper than in summer over the entire period, which we attribute to a decrease in NOx lifetime at lower NOx emissions. Half of the NOx sink in winter is from N2O5 hydrolysis, which counterintuitively becomes more efficient as NOx emissions decrease due to less titration of ozone at night. The formation of organic nitrates also becomes an increasing sink of NOx as NOx emissions decrease but emissions of volatile organic compounds (VOCs) do not.
- Article
(2061 KB) - Full-text XML
-
Supplement
(1138 KB) - BibTeX
- EndNote


Emissions of nitrogen oxides () from fossil fuel combustion in China have been changing fast in the past few decades due to rapid economic expansion on the one hand and strengthening environmental regulations on the other hand. Growing fossil fuel use with weak pollution controls resulted in an almost threefold increase in China's NOx emissions between 1990 and 2010, according to bottom-up inventories based on activity data and emission factors (Granier et al., 2011; Q. Zhang et al., 2012). Since then, China has adopted strong measures to decrease air pollution by setting stringent emissions standards, capping coal use, increasing vehicle fuel efficiency, closing outdated facilities, and growing renewable energy use (Liu et al., 2016; Zheng et al., 2018). Bottom-up inventories estimate that China's NOx emissions decreased by 20 % between 2011 and 2017, despite continuing economic expansion (Sun et al., 2018; Zheng et al., 2018). There is a strong need to evaluate these emission inventories and their trends for air quality management.
Satellite-based observations of tropospheric NO2 columns by solar backscatter have been used extensively as a proxy for NOx emissions and their trends (Martin, 2008; Streets et al., 2013). These observations have been qualitatively consistent with the trends in Chinese NOx emission inventories, showing an increasing trend of NO2 columns over China between 1994 and 2011, with a sharp reversal in eastern China since 2011 (Richter et al., 2005; van der A et al., 2006, 2008; Lin et al., 2010; Krotkov et al., 2016; Schneider et al., 2015; Duncan et al., 2016; Cui et al., 2016; Georgoulias et al., 2019; Wang et al., 2019). However, the trends in the NO2 columns are steeper than in the emission inventories (Zhang et al., 2007; Q. Zhang et al., 2012; Stavrakou et al., 2008; Hilboll et al., 2013; Liu et al., 2017; Zheng et al., 2018). For example, Zhang et al. (2007) found that NO2 columns over China increased twofold from 1996 to 2004, while their emission inventory reported a 60 % increase. For 2010–2015, the Multi-resolution Emission Inventory for China (MEIC) estimates a 14 % decrease in NOx emissions, but NO2 columns from the Ozone Monitoring Instrument (OMI) satellite instrument indicate a 22 % decrease (Zheng et al., 2018).
Differences in the trends between NO2 columns and NOx emission inventories could reflect errors in the inventories (Saikawa et al., 2017) and satellite retrievals (Lin et al., 2014; Lorente et al., 2017) but also trends in the lifetime of NOx against atmospheric oxidation. This lifetime is of the order of hours and may change with the chemical environment, including the NOx concentration itself (Stavrakou et al., 2008; Lamsal et al., 2011; Valin et al., 2011; Lu and Streets, 2012; Duncan et al., 2013; Gu et al., 2016; Cooper et al., 2017; Laughner and Cohen, 2019). NOx is oxidized to nitric acid (HNO3) and organic nitrates (RONO2), including peroxyacyl nitrates (RC(O)OONO2). There is also a minor sink from NO2 dry deposition (L. Zhang et al., 2012). Oxidation in the daytime is driven by photochemically produced hydrogen oxide () radicals:
where α in Reaction (R2) is the branching ratio for organic nitrate formation. NOx and HOx concentrations are tightly interlinked (Kleinman, 1994; Laughner and Cohen, 2019). When NOx levels are sufficiently low (so-called NOx-limited conditions), an increase in NOx drives an increase in HOx, particularly OH through the reaction. When NOx levels are high (so-called NOx-saturated conditions), Reaction (R1) becomes the dominant HOx sink, and an increase in NOx causes a decrease in HOx.
At night, the chemical loss of NOx proceeds through a series of steps in Reactions (R4)–(R10) beginning with the oxidation of NO and NO2 by ozone to form the nitrate radical (NO3) and dinitrogen pentoxide (N2O5). N2O5 and NO3 react in aerosols to produce HNO3, and NO3 additionally reacts with volatile organic compounds (VOCs) to form either HNO3 or RONO2.
A change in NOx emissions can change the nighttime levels of ozone, and Reaction (R6) is quadratic in NOx concentrations, leading to nonlinearity between NOx emissions and NO2 concentrations. In addition, aerosol concentrations in China have decreased by about 30 % since 2013 (Lin et al., 2018; Zheng et al., 2018; Zhai et al., 2019; Ma et al., 2019), which would decrease the rate of nighttime NOx loss (Reactions R7–R9). A decrease in aerosol concentrations will also slow the NOx loss by the hydrolysis of NO2 in aerosols.
Here we present trends in tropospheric NO2 columns over China from 2004 to 2018 observed by the OMI satellite instrument, showing a peak in 2011. We use the GEOS-Chem chemical transport model applied to the MEIC (Zheng et al., 2018) to investigate how changes in NOx lifetimes have affected the relationship between tropospheric NO2 columns and NOx emissions and whether this can reconcile the differences in trends between the two quantities. The results have important implications for the use of satellite NO2 retrievals to infer trends in NOx emissions.
2.1 OMI NO2 column retrievals
We use 2004–2018 tropospheric NO2 column data retrieved from the OMI instrument aboard the NASA Aura satellite. Aura is in sun-synchronous polar orbit with a daytime Equator crossing at 13:45 local solar time (LST). OMI measures backscattered solar radiation from the Earth in the ultraviolet and visible wavelength range (270–504 nm). It has a swath width of 2600 km and a ground pixel size of 13 km × 24 km at nadir (Levelt et al., 2006, 2018). Several OMI pixels are affected by the so-called row anomaly, possibly from an obstruction in their field of view (Dobber et al., 2008). Pixels not affected by the row anomaly have no significant calibration drift over the length of the record (Boersma et al., 2018).
We use tropospheric NO2 columns from two retrievals: the European Quality Assurance for Essential Climate Variables (QA4ECV) project's NO2 ECV precursor product (Boersma et al., 2018) and the Peking University POMINO product version 2 (Lin et al., 2015; Liu et al., 2019). NO2 tropospheric column retrieval in the ECV product involves (1) a spectral fit of the backscattered solar radiation in the 405–465 nm window to obtain the total NO2 slant column (SC), (2) the removal of the stratospheric component by data assimilation with the TM5-MP chemical transport model, and (3) the conversion of the tropospheric SC to a tropospheric vertical column (VC) with an air mass factor (AMF = SC ∕ VC) that depends on viewing geometry, surface albedo, retrieved cloud properties, and the NO2 vertical profile (taken from the TM5-MP model).
The POMINO v2 product starts with the tropospheric NO2 slant columns from the ECV retrieval but uses different methods and data sources for the AMF calculation. The main difference is the treatment of aerosols. ECV assumes that aerosol effects are implicitly accounted for in the independent retrieval of cloud pressure and cloud fraction, which are prerequisites for NO2 retrievals. POMINO explicitly accounts for aerosols in the radiative transfer calculations, with aerosol optical properties and vertical profiles from the GEOS-Chem model corrected with satellite observations from the MODIS and CALIOP instruments. In polluted areas (aerosol optical depth greater than 0.5), the choice of aerosol correction method can affect the AMF by 45 % (Lorente et al., 2017), and the sign of the correction depends on the vertical distribution of aerosols relative to NO2 (Palmer et al., 2001; Martin et al., 2003; Liu et al., 2019). POMINO also includes the angular dependence of surface reflectance, an online radiative transfer calculation, and consistency in retrievals of cloud properties and NO2 (Lin et al., 2015; Liu et al., 2019).
We create monthly mean gridded (0.5∘ latitude × 0.625∘ longitude) datasets of ECV and POMINO NO2 columns over China for June–July–August (JJA) 2005–2018 and December–January–February (DJF) 2004–2018. We exclude pixels with snow-covered surfaces and a cloud fraction greater than 30 %. We use cloud fraction data from the corresponding retrievals. We include only cross-track viewing positions of 5 through 22 to exclude data affected by the row anomaly (Boersma et al., 2018) and swath edges. For comparison with GEOS-Chem, the POMINO and ECV NO2 columns are recalculated with modified air mass factors using the pixel-specific GEOS-Chem NO2 vertical profiles (Palmer et al., 2001).
2.2 Ground-based observations
We use hourly measurements of NO2 and O3 concentrations from the network of ∼ 1000 sites operated by the China Ministry of Ecology and Environment (MEE) since 2013 (http://beijingair.sinaapp.com, last access: 10 March 2019). We correct the known interference of organic nitrates and HNO3 in the NO2 measurements by using the GEOS-Chem-simulated concentrations for those species following Lamsal et al. (2008) and then grid ( grid) and seasonally average the data, discarding sites with less than 50 % coverage in a season. The correction for HNO3 and organic nitrates decreases the reported seasonal mean NO2 concentrations over eastern China by 25 % in summer and 6 % in winter.
2.3 GEOS-Chem model
We use the GEOS-Chem chemical transport model version 12.1.0 (https://doi.org/10.5281/zenodo.1553349) driven by assimilated meteorological fields from the NASA Global Modeling and Assimilation Office's Modern-Era Retrospective analysis for Research and Applications Version 2 (MERRA-2; Gelaro et al., 2017). GEOS-Chem simulates the chemistry of major gas- and aerosol-phase species in the troposphere (Pye et al., 2009; Kim et al., 2015; Travis et al., 2016; Fisher et al., 2016; Sherwen et al., 2016). We use the GEOS-Chem Classic nested-grid configuration over East Asia (11∘ S–55∘ N, 60–150∘ E) at resolution (Wang et al., 2004; Chen et al., 2009), with lateral chemical boundary conditions from a global simulation. Anthropogenic emissions over China are from the MEIC updated annually for 2000–2017 (http://www.meicmodel.org/, last access: 30 June 2018; Zheng et al., 2018). The MEIC includes monthly emission profiles for each sector (Li et al., 2017a) and hourly profiles developed at Tsinghua University. We vertically resolve emissions from point sources (power plants and industries) following profiles used in the LOTOS-EUROS model (Manders et al., 2017) and speciate anthropogenic NOx emissions as NO (90 %), NO2 (9.2 %), and HONO (0.8 %) following Menut et al. (2013). GEOS-Chem includes additional NOx emissions from soil and fertilizer use (Hudman et al., 2012), lightning (Murray et al., 2012), shipping (Vinken et al., 2011; Holmes et al., 2014), and aircraft (Stettler et al., 2011). Vertical mixing in the planetary boundary layer is simulated using a nonlocal mixing scheme (Lin and McElroy, 2010).
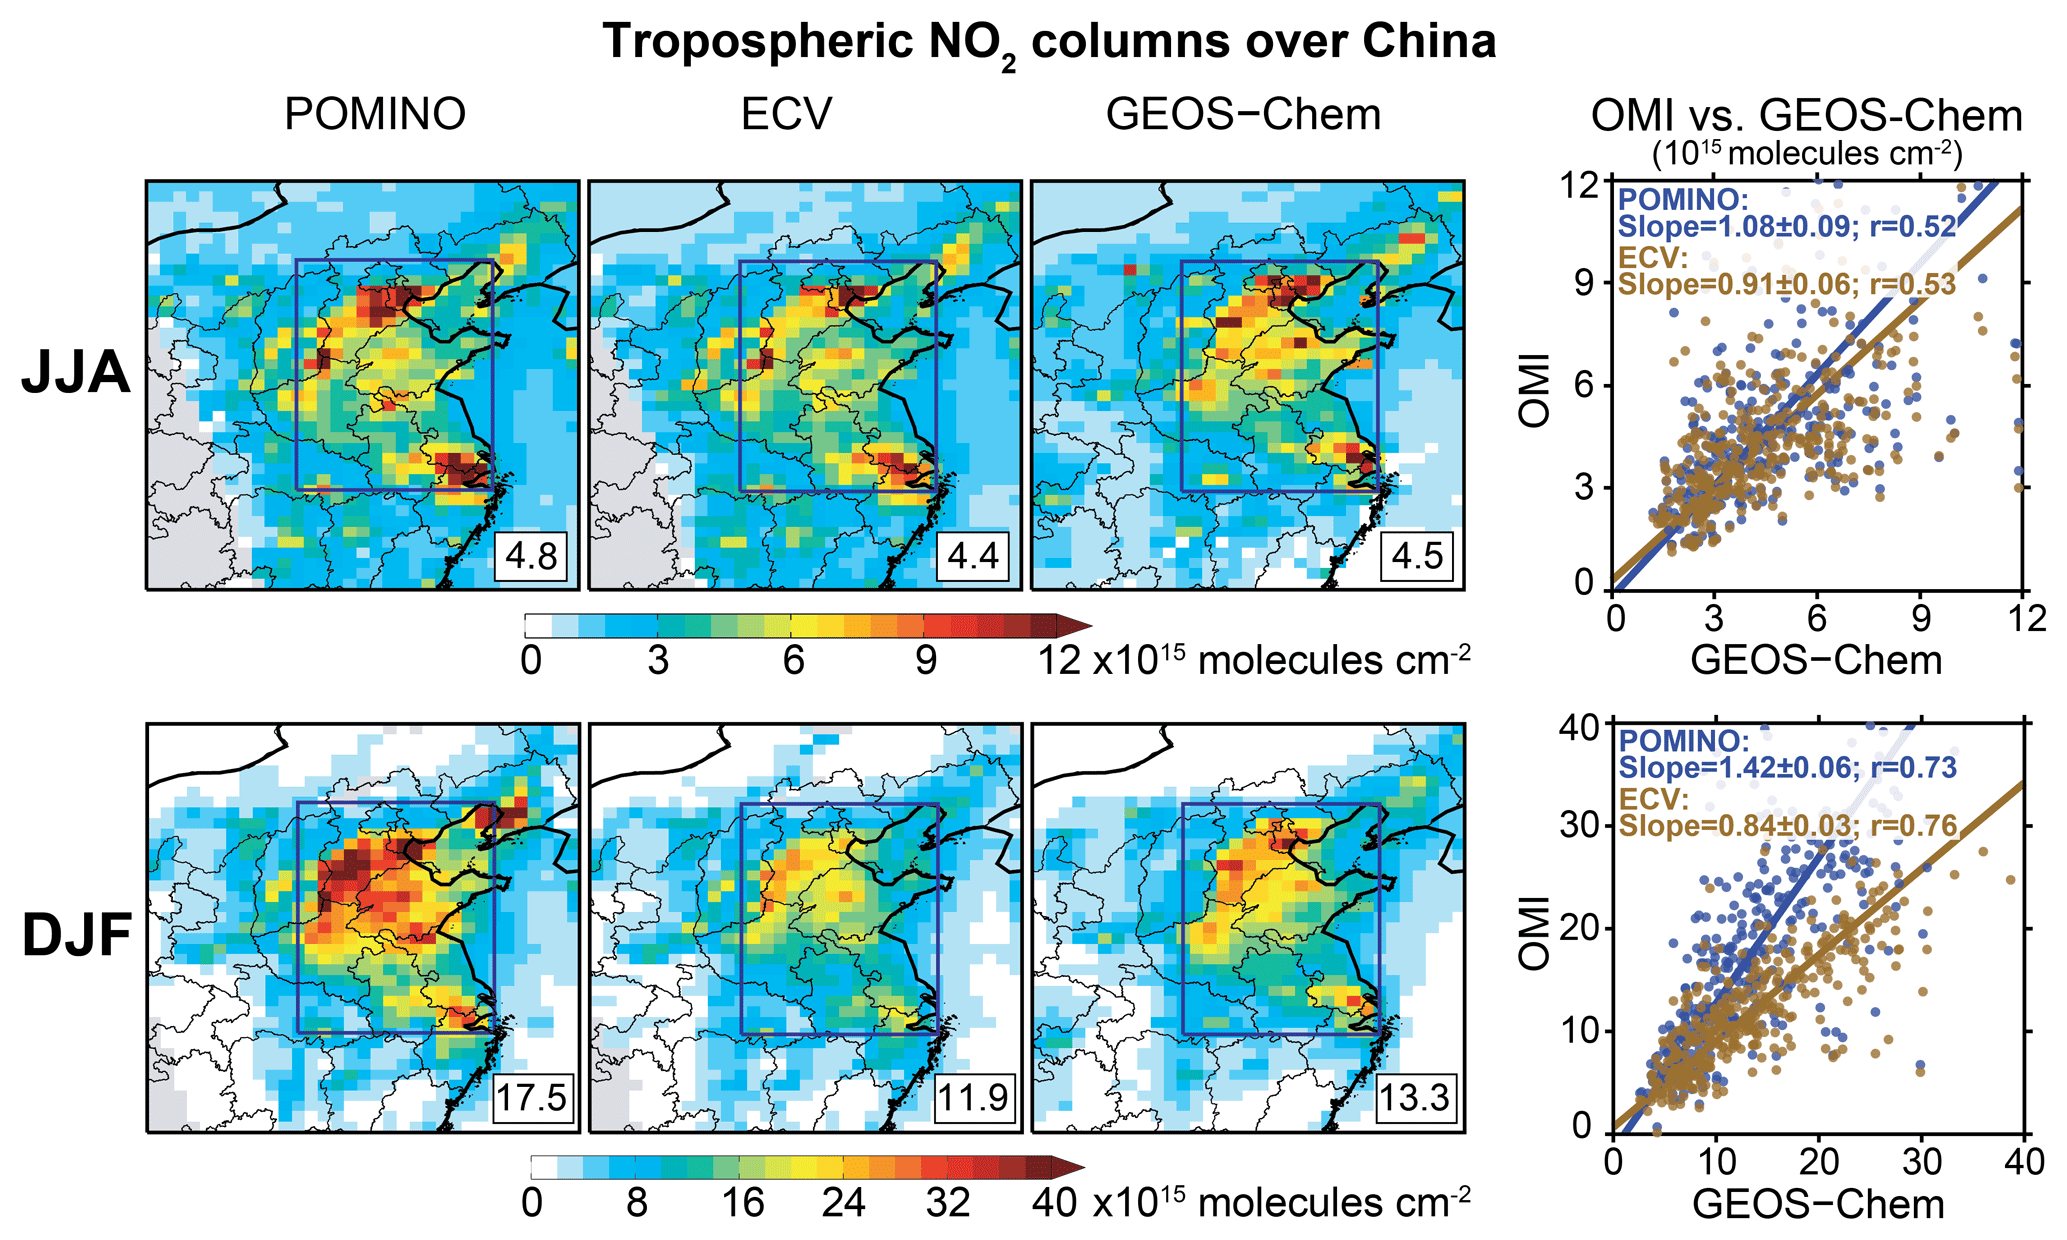
Figure 1Tropospheric NO2 columns over China. Values are 3-month means for June–July–August (JJA) 2017 and December–January–February (DJF) 2016/17 on the GEOS-Chem grid. OMI retrievals from POMINO (Liu et al., 2019) and ECV (Boersma et al., 2018) are compared with the GEOS-Chem model. The JJA and DJF panels have different color scales. Locations where none of the OMI data met our selection criteria are in grey. The mean NO2 columns over central–eastern China (blue rectangle) are given in the inset (1015 molecules cm−2, e.g., 4.8×10¹⁵ molecules cm−2 for the top left panel). The scatterplots show the spatial correlations between the OMI retrievals and GEOS-Chem on the grid for central–eastern China, along with the Pearson's correlation coefficient (r), reduced-major-axis linear regressions, and regression slopes. Error standard deviations on the slopes were derived by the bootstrap method.
We modified the standard GEOS-Chem version 12.1.0 chemistry to update the reactive uptake coefficients (γ) of N2O5, NO3, and NO2 on aerosols (Jacob, 2000) based on recent comparison of GEOS-Chem to observations from the Wintertime Investigation of Transport, Emissions, and Reactivity (WINTER) aircraft campaign over the eastern United States (Jaeglé et al., 2018; Shah et al., 2018). is computed following Bertram and Thornton (2009) for sulfate–nitrate–ammonium aerosols and is taken to be (RH < 50 %) or (RH ≥ 50 %) for organic aerosols. N2O5 hydrolysis produces HNO3 and ClNO2 on sea salt aerosols with a 1 : 1 branching ratio (Reaction R8) and only HNO3 on other aerosol types (Reaction R7). Uniform values of and are used for all aerosol types and all RH conditions. is taken to be following Jacob (2000). for the hydrolysis Reaction (R11) is decreased from (Jacob, 2000) to on the basis of laboratory measurements (Bröske et al., 2003; Stemmler et al., 2007; Tan et al., 2016). This decrease in yields a 24 h mean wintertime HONO∕NO2 molar concentration ratio of 0.035 over eastern China in GEOS-Chem, consistent with the observed range of 0.015–0.071 (Hendrick et al., 2014; Spataro et al., 2013; Wang et al., 2017, 2013). The GEOS-Chem HONO∕NO2 ratio is likely low because of unknown sources of HONO, particularly during the day (Kleffmann, 2007; Spataro and Ianniello, 2014). For the WINTER campaign, Jaeglé et al. (2018) used a of but assumed that the reaction produces only HONO. Using this for eastern China would lead to a significant overestimate of the observed HONO∕NO2 ratio.
We evaluate the model with the spatial and seasonal distributions of OMI NO2 observations for 2016/17 DJF and 2017 JJA (the latest year with MEIC data) and use these two periods to analyze the seasonality of NOx lifetime and loss pathways in the model. To calculate the emission-driven changes in NOx lifetimes, we conduct a sensitivity simulation in which we set anthropogenic emissions over China to 2012 levels but use the 2016/17 meteorology and NOx emissions from soils, lightning, ships, and aircraft. Chinese NOx emissions decreased by 25 % from 2012 to 2017 according to the MEIC (Fig. S1 in the Supplement). For comparison with OMI observations, we sample the model at 13:00–14:00 LST and exclude model columns with surface snow cover or with a model cloud fraction greater than 30 %. We focus on the large polluted region of central–eastern China (30–41∘ N, 112–122∘ E; rectangles in Fig. 1), where we may expect tropospheric NO2 columns to be most sensitive to Chinese NOx emissions and where the relatively narrow latitude range leads to consistent seasonal variations. This region accounted for 50 % of anthropogenic Chinese NOx emissions in 2017 according to the MEIC.
3.1 Seasonal variation of NO2 columns and NOx lifetimes
Figure 1 shows the NO2 columns from the POMINO and ECV retrievals, as well as from the GEOS-Chem model, for JJA 2017 and DJF 2016/17. In central–eastern China, we find that in both seasons over 70 % of the GEOS-Chem tropospheric NO2 column as would be observed by OMI is in the boundary layer below 2 km of altitude. Thus, we expect the NO2 column to reflect mostly the local NOx emissions rather than the free tropospheric background (Silvern et al., 2019). In summer, average GEOS-Chem NO2 columns over central–eastern China are within 10 % of the POMINO and ECV NO2 columns. There is scatter in the spatial relationship (r≈ 0.5) that could be due to a combination of model and retrieval errors. In winter, however, POMINO is 42 % higher than GEOS-Chem, while ECV is 16 % lower. The difference in aerosol correction between POMINO and ECV is largest in winter due to high aerosol concentrations and high solar zenith angles. In ECV, polluted scenes with high aerosol optical depths (and likely high NO2) can be misclassified as cloudy and excluded from the seasonal mean, which leads to a negative sampling bias (Lin et al., 2014, 2015; Liu et al., 2019). On the other hand, retrieving NO2 columns under high aerosol conditions can be uncertain because of the strong sensitivity to the vertical distribution of NO2 relative to that of aerosols, although this is less of a problem in POMINO as it uses the CALIOP-observed aerosol vertical profiles (Lin et al., 2014, 2015; Liu et al., 2019).
Liu et al. (2019) compared the ECV and POMINO retrievals to ground-based multi-axis differential optical absorption spectroscopy (MAX-DOAS) NO2 column observations on 49 d in three Chinese cities. POMINO was on average closer to the MAX-DOAS NO2 than ECV (−3 % vs. −22 % bias) and on hazy days (+4 % versus −26 % bias), but on clear (cloud fraction = 0) days ECV performed better (−6 % bias) than POMINO (+30 % bias). These biases were slightly larger in fall and winter, although sampling in individual seasons was sparse. There is uncertainty in the comparison as the column observed by MAX-DOAS may not be representative of the satellite pixel, and the aerosol vertical profiles used in the satellite and MAX-DOAS retrievals may be inconsistent (Lin et al., 2014).
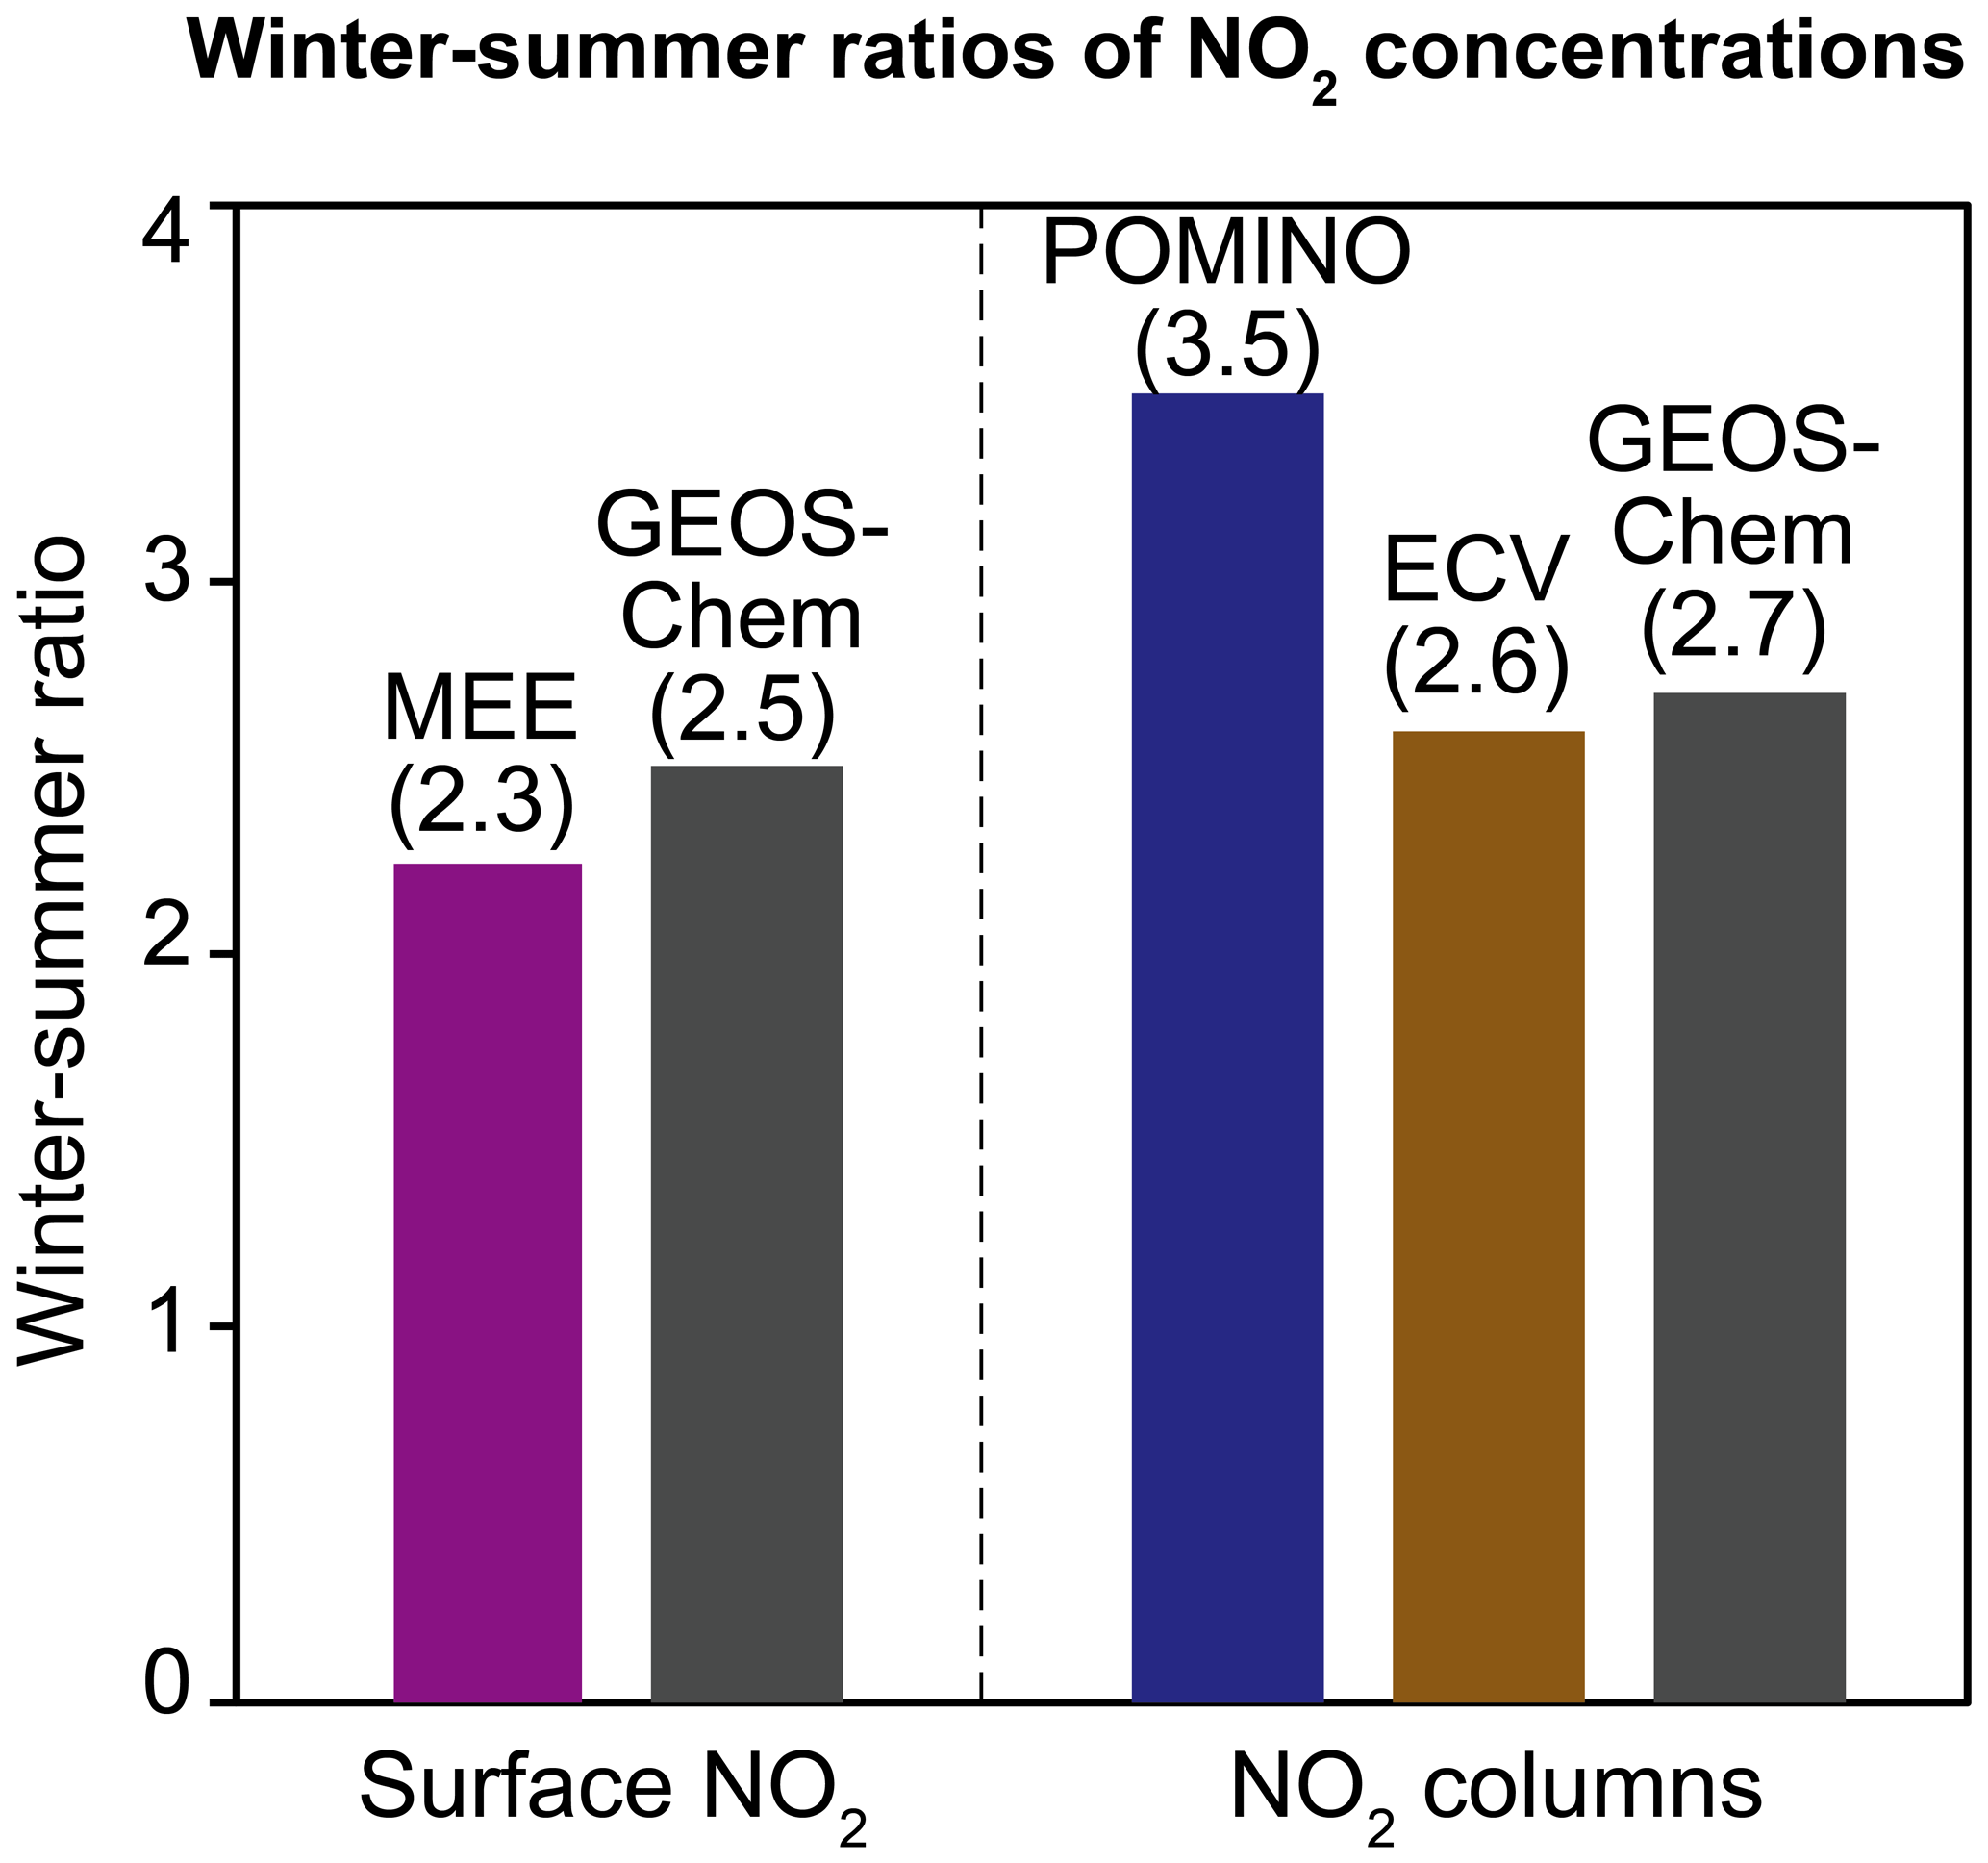
Figure 2Mean winter–summer ratios of NO2 concentrations over central–eastern China. The values are ratios of the seasonal mean NO2 surface concentrations observed at the ensemble of MEE sites in central–eastern China and of the mean POMINO and ECV tropospheric NO2 columns (recalculated using the GEOS-Chem NO2 profiles) at the MEE station locations. Central–eastern China is as defined by the rectangle in Fig. 1. GEOS-Chem values sampled at the measurement locations are also shown. Observations and model results are for JJA 2017 (summer) and DJF 2016/17 (winter).
Figure 2 compares the mean winter–summer ratios of NO2 columns from the ECV and POMINO retrievals over central–eastern China with GEOS-Chem and with the ratios of 24 h mean surface NO2 concentrations at the MEE sites. GEOS-Chem shows similar ratios for the afternoon NO2 columns and 24 h mean surface NO2, despite different averaging times. We find that the seasonal amplitude in the surface NO2 data is most consistent with the ECV NO2 columns, whereas the seasonal amplitude of POMINO NO2 is larger. The winter–summer ratios of NO2 columns are 2.6 in the ECV retrieval, 3.5 in POMINO, and 2.7 in GEOS-Chem. The winter–summer ratios of surface NO2 concentrations are 2.3 in the MEE data and 2.5 in GEOS-Chem. Anthropogenic NOx emissions in the MEIC show little seasonality, with a winter–summer ratio of only 1.15 (Li et al., 2017b). We find in GEOS-Chem that the seasonal variation in NO2 columns is mainly driven by the NOx lifetime in the boundary layer, which increases from 5.9 h in summer to 21 h in winter (24 h mean lifetimes for 2017; Fig. 3). We find little difference between the boundary layer and the tropospheric column NOx lifetimes (Fig. S2) since most of the column is in the boundary layer.
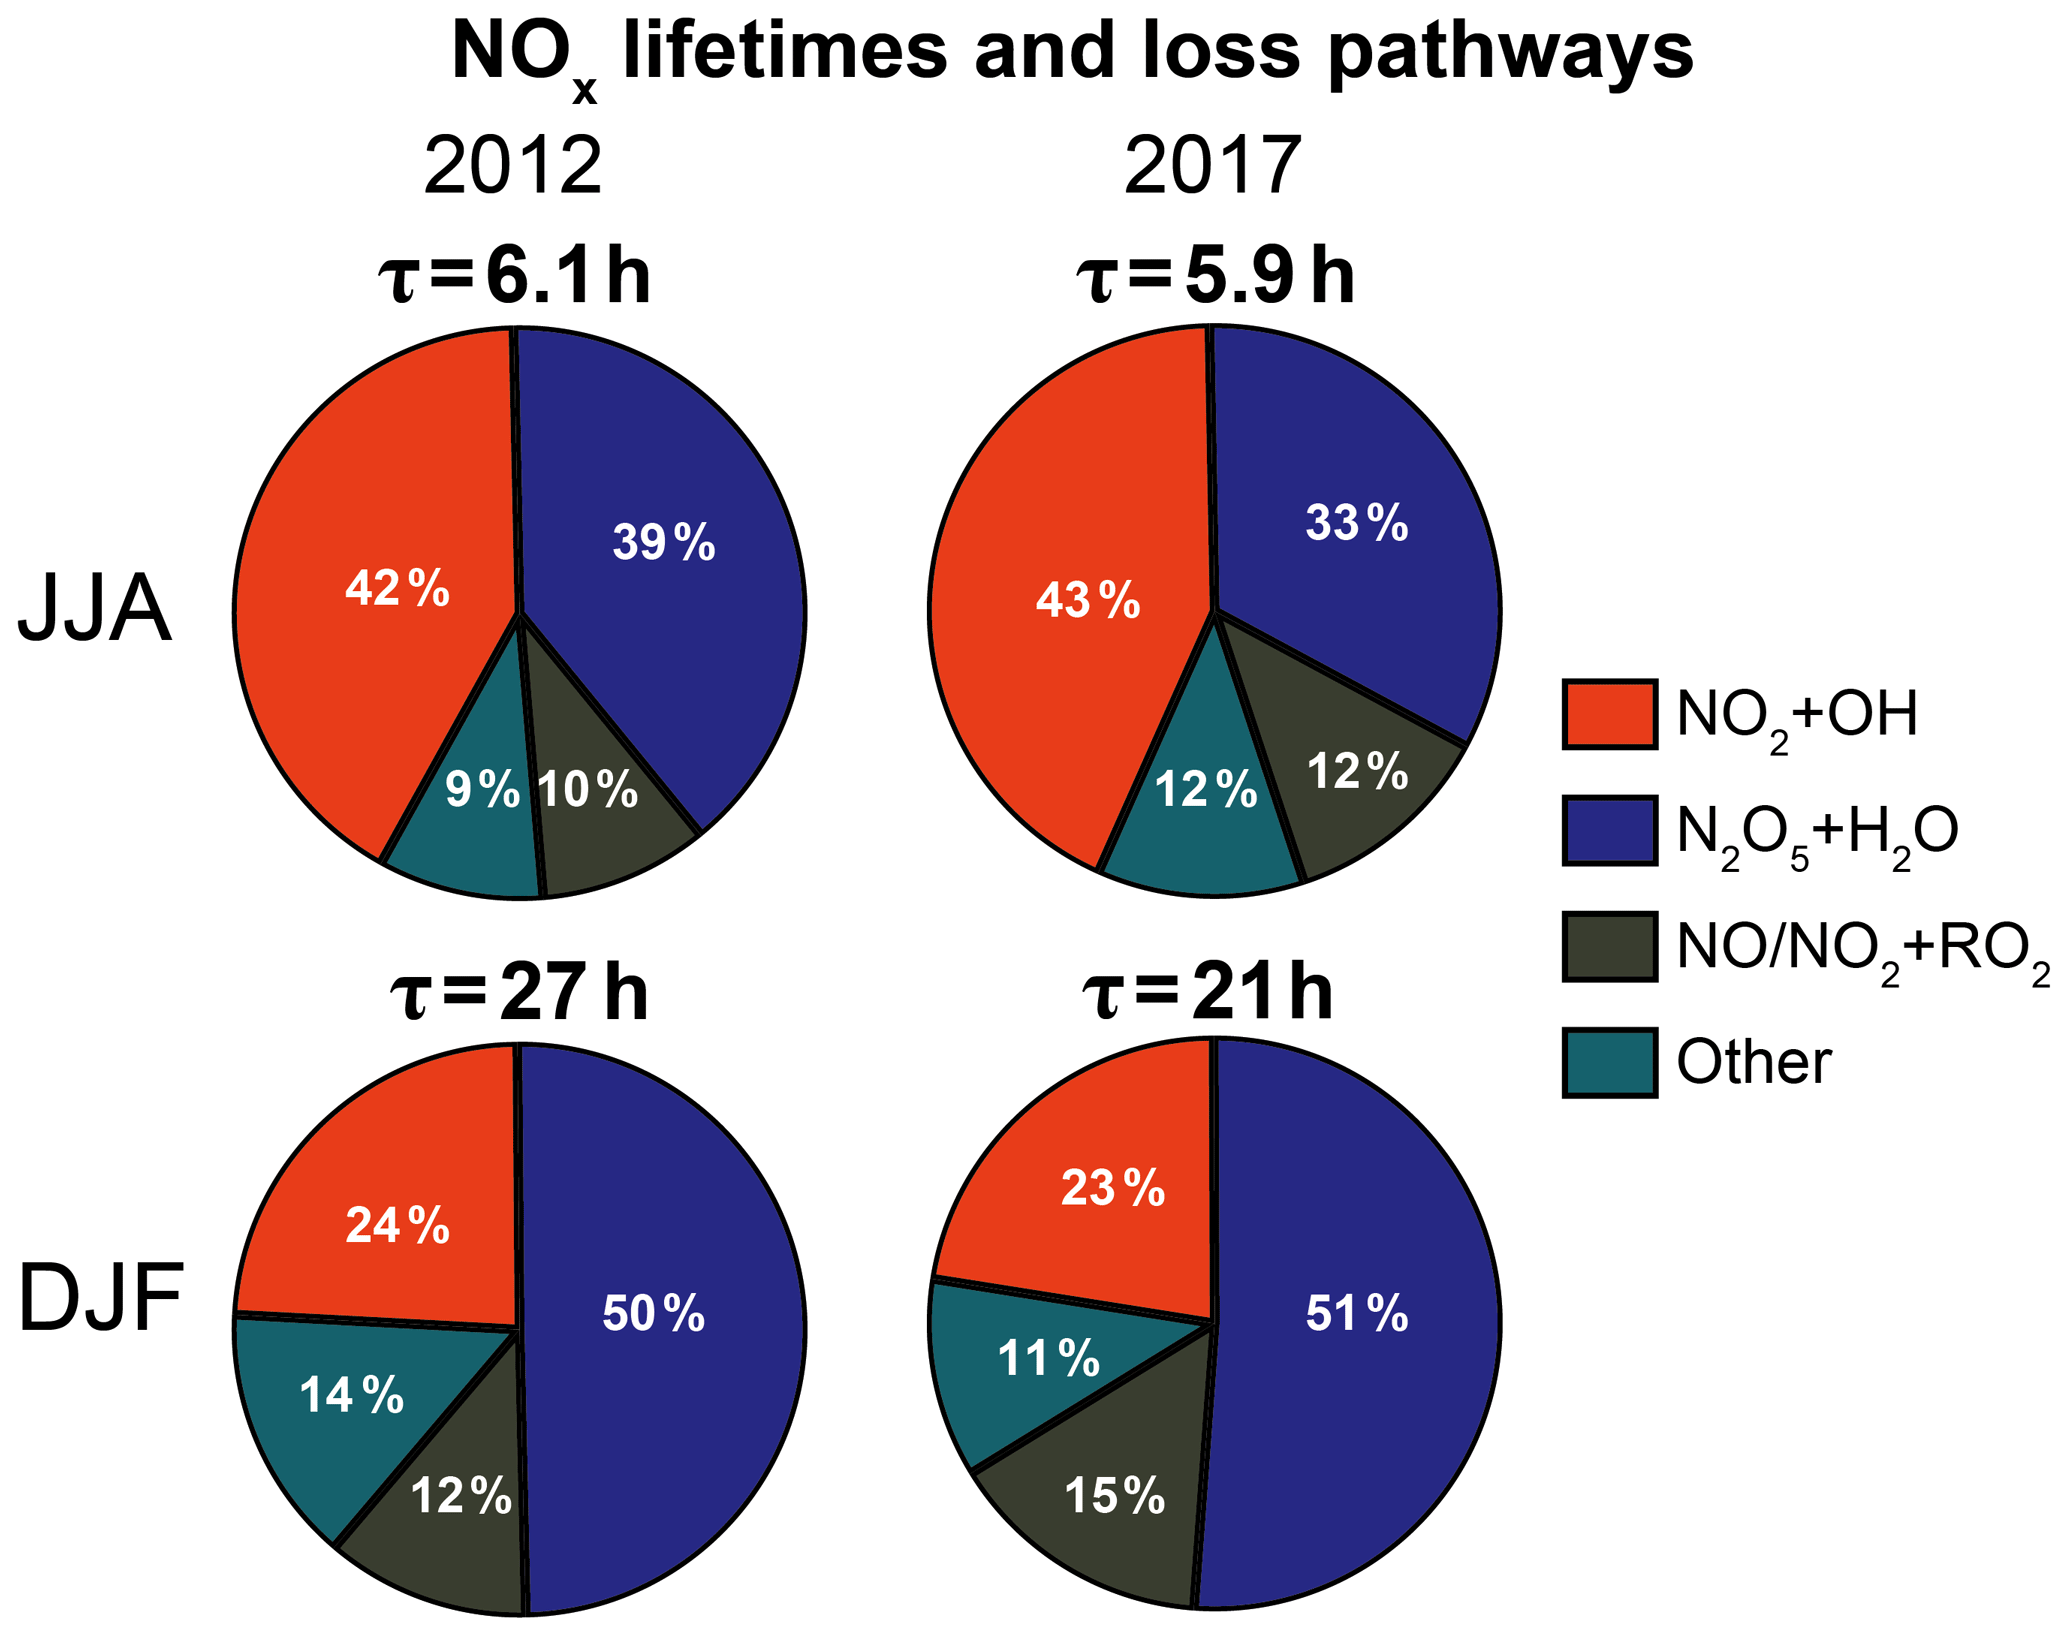
Figure 3NOx lifetime (τ) and loss pathways in the boundary layer over central–eastern China. The lifetimes are the GEOS-Chem averages for the bottom 0–2 km of the atmosphere over the domain delineated in Fig. 1, and the pie charts show the relative contributions of the different NOx sinks. For the lifetime calculation we define NOx as . Values are given for summer (JJA) and winter (DJF) 2012 and 2017. The sink from N2O5+H2O excludes the fraction that forms ClNO2. The sink from is the net flux, accounting for the partial recycling of the organic nitrates, and includes the contributions from peroxyacyl nitrates (PANs). The “other” sinks include NO3 + VOC reactions, NO2 and NO3 hydrolysis in aerosols, and NOx deposition.
In summer, NOx is lost mostly through oxidation by OH in daytime (43 %) and through N2O5 hydrolysis forming HNO3 at night (33 %). The daytime oxidation processes have a larger effect on the afternoon NO2 columns because of the short NOx lifetime, particularly in summer. In winter, the NOx lifetime is much longer because of the lower concentrations of OH and RO2 radicals. N2O5 hydrolysis accounts for 51 % of NOx loss in winter. Remarkably, the loss of NOx from N2O5 hydrolysis is a factor of 2 slower in winter than in summer, despite the longer nights and higher aerosol concentrations (Zhai et al., 2019), because of the low nighttime ozone concentrations. The overall NOx lifetime in winter and the contribution from N2O5 hydrolysis are similar to values inferred over the eastern US during the WINTER campaign (Jaeglé et al., 2018), despite a factor of ∼ 5 difference in aerosol concentrations between the two regions. Loss of NOx by N2O5 hydrolysis in China in winter is limited by the supply of ozone, not the supply of aerosol.
The modeled NOx lifetimes can be affected by uncertainties in the modeled aerosol surface area, , and the yield of ClNO2. We find that the GEOS-Chem aerosol concentrations at the surface are about 30 % higher than observations from the MEE network. On the other hand, GEOS-Chem's values are 25 % lower on average than the observation-based estimates from the WINTER campaign (Jaeglé et al., 2018; McDuffie et al., 2018b). We tested the sensitivity of the modeled NOx lifetime to the aerosol surface area and with a separate simulation and find that a 30 % change in either quantity changes the NOx loss by N2O5 hydrolysis by only 8 % in summer and less than 2 % in winter. We assume that the yield of ClNO2 from N2O5 hydrolysis for all aerosols other than sea salt is 0, which is lower than the average value of ∼ 0.3 estimated by field studies in China (McDuffie et al., 2018a; Tham et al., 2018). If we had assumed a higher ClNO2 yield in the model, the loss of NOx by N2O5 hydrolysis would be slower, particularly in winter when it is limited by ozone and the HNO3 and ClNO2 branches compete for the limited N2O5, and the daytime NOx loss would increase because of the additional daytime NO2 from ClNO2 photolysis. Sub-grid-scale variability in NOx and oxidant concentrations can also affect the modeled NOx lifetimes because of the nonlinearity of NOx chemistry. For example, NOx lifetime within a concentrated NOx plume at night can be long because of oxidant depletion, and assuming that the plume is instantaneously diluted within the model grid cell can result in a shorter NOx lifetime (Brown et al., 2012). However, studies that explicitly treat sub-grid-scale plumes suggest that this effect can be important locally near large sources but is small at the regional scale (Karamchandani et al., 2011).
Leue et al. (2001) previously estimated the NOx lifetime in the eastern US by using the offshore gradient of satellite-observed NO2 columns. We tried this approach and found that the offshore gradients of NO2 columns perpendicular to the east coast of China are consistent between the model and observations (Fig. S3). However, there is little seasonal difference in the gradients, suggesting that their magnitudes are determined by dilution more than chemical decay.
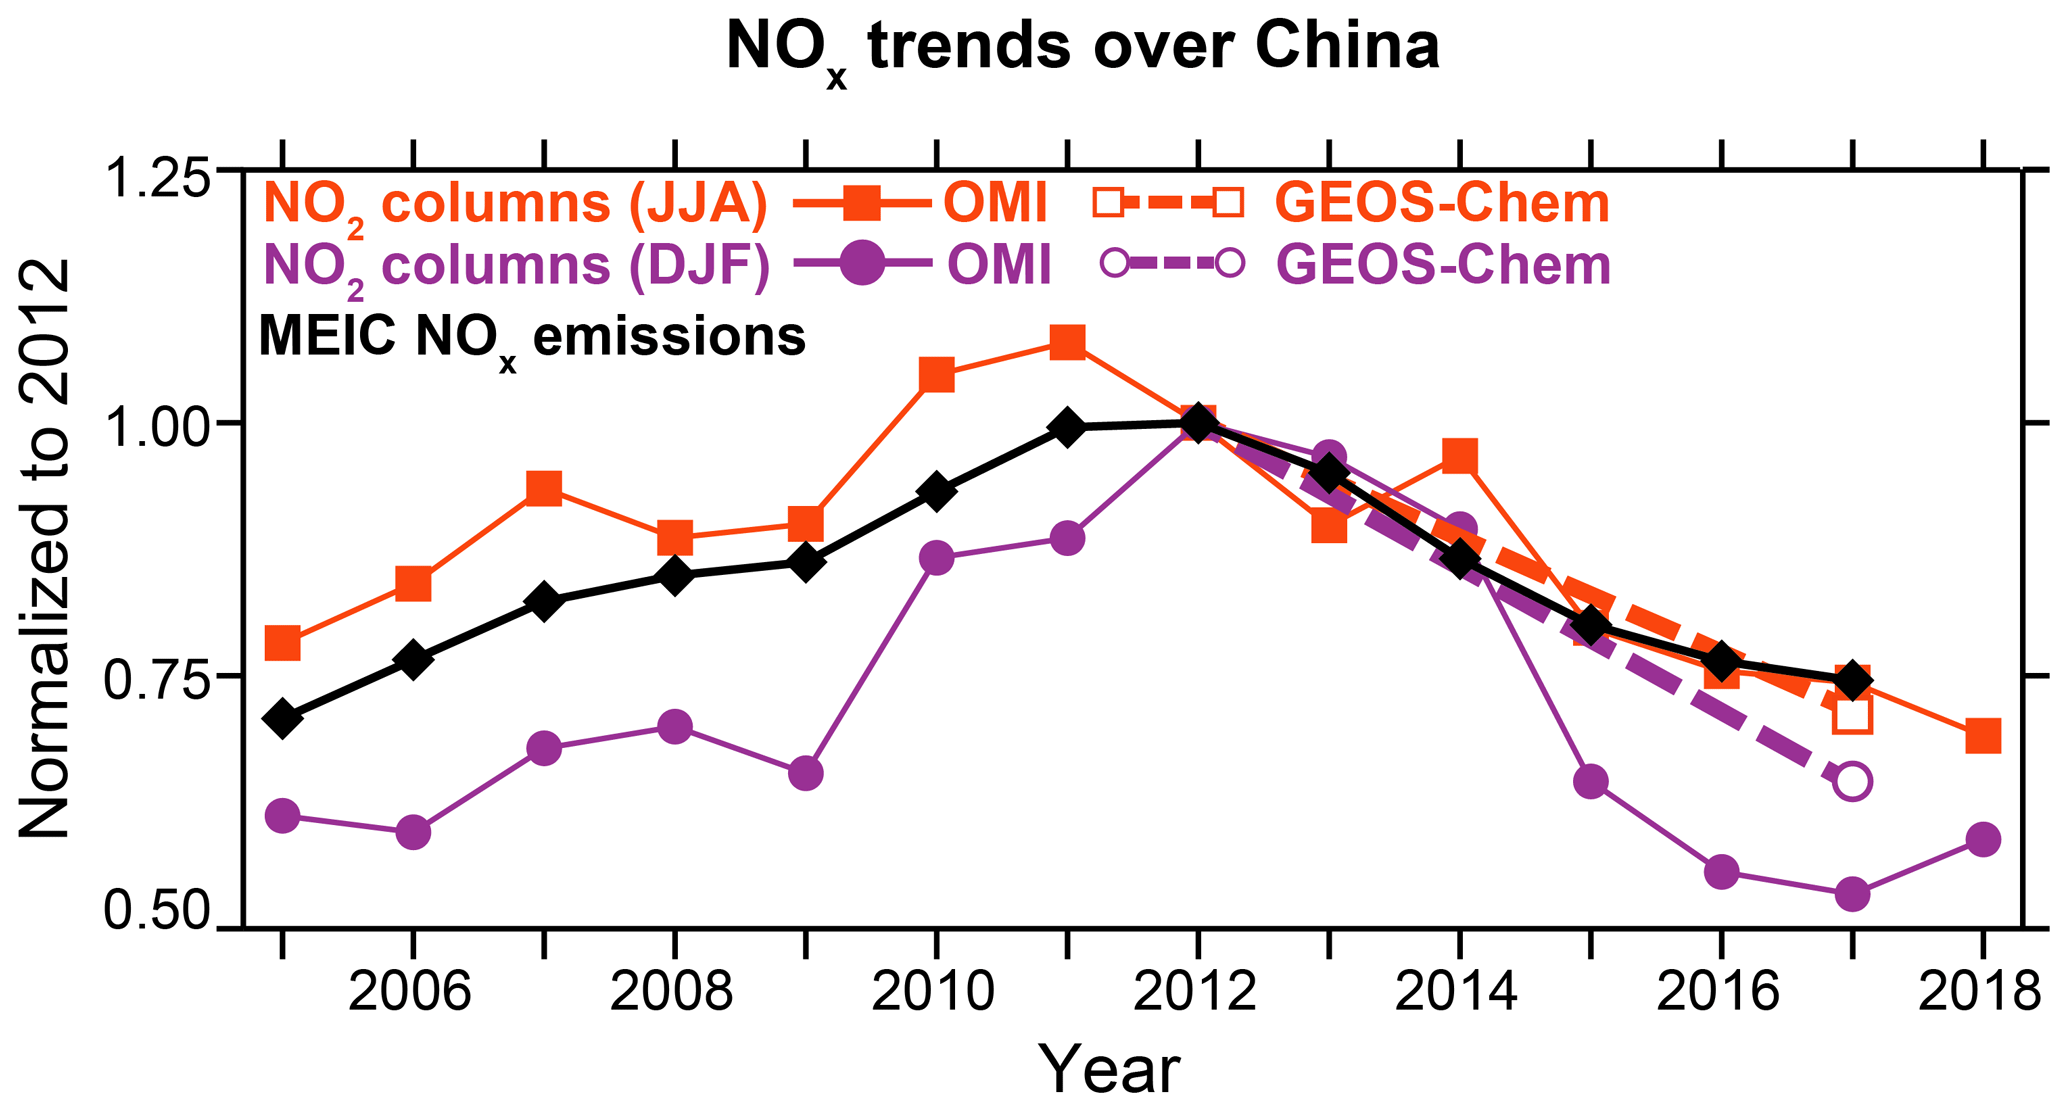
Figure 4Trends in NOx emissions and NO2 concentrations over central–eastern China. The figure shows the JJA and DJF relative trends in the OMI (ECV) tropospheric NO2 columns averaged over central–eastern China (domain delineated in Fig. 1) for the 2004–2018 duration of the OMI record and the corresponding trends in annual NOx emissions estimated by the MEIC. GEOS-Chem 2012–2017 trends in NO2 columns are also shown. All quantities are normalized to a value of 1 in 2012.
3.2 2004–2018 trends in NO2 columns and lifetimes
Figure 4 shows the trends in the summer and winter NO2 columns from the ECV retrieval, as well as in anthropogenic NOx emissions from the MEIC, over central–eastern China for the 2004–2018 extent of the OMI record. According to the MEIC, NOx emissions increased by 5 %–6 % a−1 in 2005–2011 and decreased at the same pace after 2011. OMI NO2 columns mirror the trajectory of the MEIC NOx emissions: rising between 2005 and 2011, reversing direction in 2011/12, and falling back to around 2005 levels by 2018. Zheng et al. (2018) also showed consistency in the trends of OMI NO2 columns and the MEIC NOx emissions but found that the NO2 trends at the MEE surface sites are flatter because the sites are urban and more sensitive to vehicular NOx emissions. The summer trends in OMI NO2 closely track the MEIC emissions, but the winter trends are steeper. The same summer–winter differences in NO2 column trends over China are seen in the POMINO retrieval (Fig. S4) and in retrievals from the Ozone Mapping Profiler Suite (OMPS) instrument (Lin et al., 2019). Previous studies also reported such a seasonal difference between summer and winter NO2 column trends (Uno et al., 2007; Zhang et al., 2007; Stavrakou et al., 2008; Gu et al., 2013).
The steeper slopes in winter could reflect a trend in NOx lifetime as NOx and other emissions change. A few modeling studies have previously explored this dependence for China. Uno et al. (2007) found no significant change in the annual mean NOx lifetime over 1996–2004. Stavrakou et al. (2008) found that the increase in NOx emissions over 1997–2006 drove a 25 % decrease in summer NOx lifetime due to higher OH from faster NO+HO2 reaction and a 10 % increase in winter NOx lifetime due to lower OH from faster NO2+OH reaction.
We examined the effect of 2012–2017 changes in MEIC emissions for NOx and other species on the lifetime of NOx simulated by GEOS-Chem (Fig. 3). During that period, NOx emissions in central–eastern China decreased by 25 %, and boundary layer aerosol concentrations in GEOS-Chem decreased by 20 %. Observed aerosol concentrations from the MEE network decreased by 30 % over the 2013–2017 period (Zhai et al., 2019). We find no significant change in the summer NOx lifetime between 2012 and 2017. The NOx lifetime during the day shortened slightly, as summertime OH concentrations increased by 6 % and RO2 concentrations increased by 13 %. However, the NOx lifetime during the night increased as aerosol concentrations dropped, canceling the overall effect.
In contrast, the winter NOx lifetime decreased by 22 % (from 27 to 21 h) between 2012 and 2017 (Fig. 3), driven mostly by faster loss by N2O5 hydrolysis in aerosols and also by faster loss from reactions with OH and RO2. The loss rate from is largely determined by the emission rate of VOCs, which changed by less than 3 % over 2012–2017 (Zheng et al., 2018), effectively decreasing the NOx lifetime as NOx emissions dropped. At lower NOx emissions, NOx loss by NO3+VOC reactions also increased relative to NOx loss by N2O5 hydrolysis because of an increase in the ratio of NO3 to N2O5 concentrations. However, the contribution of NO3+VOC reactions to the total NOx loss remained less than 5 % because of high NO2. The faster loss by N2O5 hydrolysis in 2017 relative to 2012 might seem counterintuitive since both aerosols and NOx dropped over the period. However, winter aerosol levels for converting N2O5 to HNO3 remain in excess even in 2017. Instead, we find that the driving factor behind the increase in N2O5 hydrolysis is a rise in nighttime ozone concentrations. At night, fast titration by NO (Reaction R4) is an important sink of ozone close to NOx sources. As NOx emissions decrease, less ozone is titrated, which then enables the formation of NO3 by Reaction (R5) and the subsequent formation of N2O5. The simulated NOx lifetime against loss by N2O5 hydrolysis decreases by 26 % from 54 h in the winter 2011/12 to 40 h in the winter 2016/17. Ground-based observations at the MEE sites show an increase in winter nighttime ozone, consistent with the model (Fig. 5).
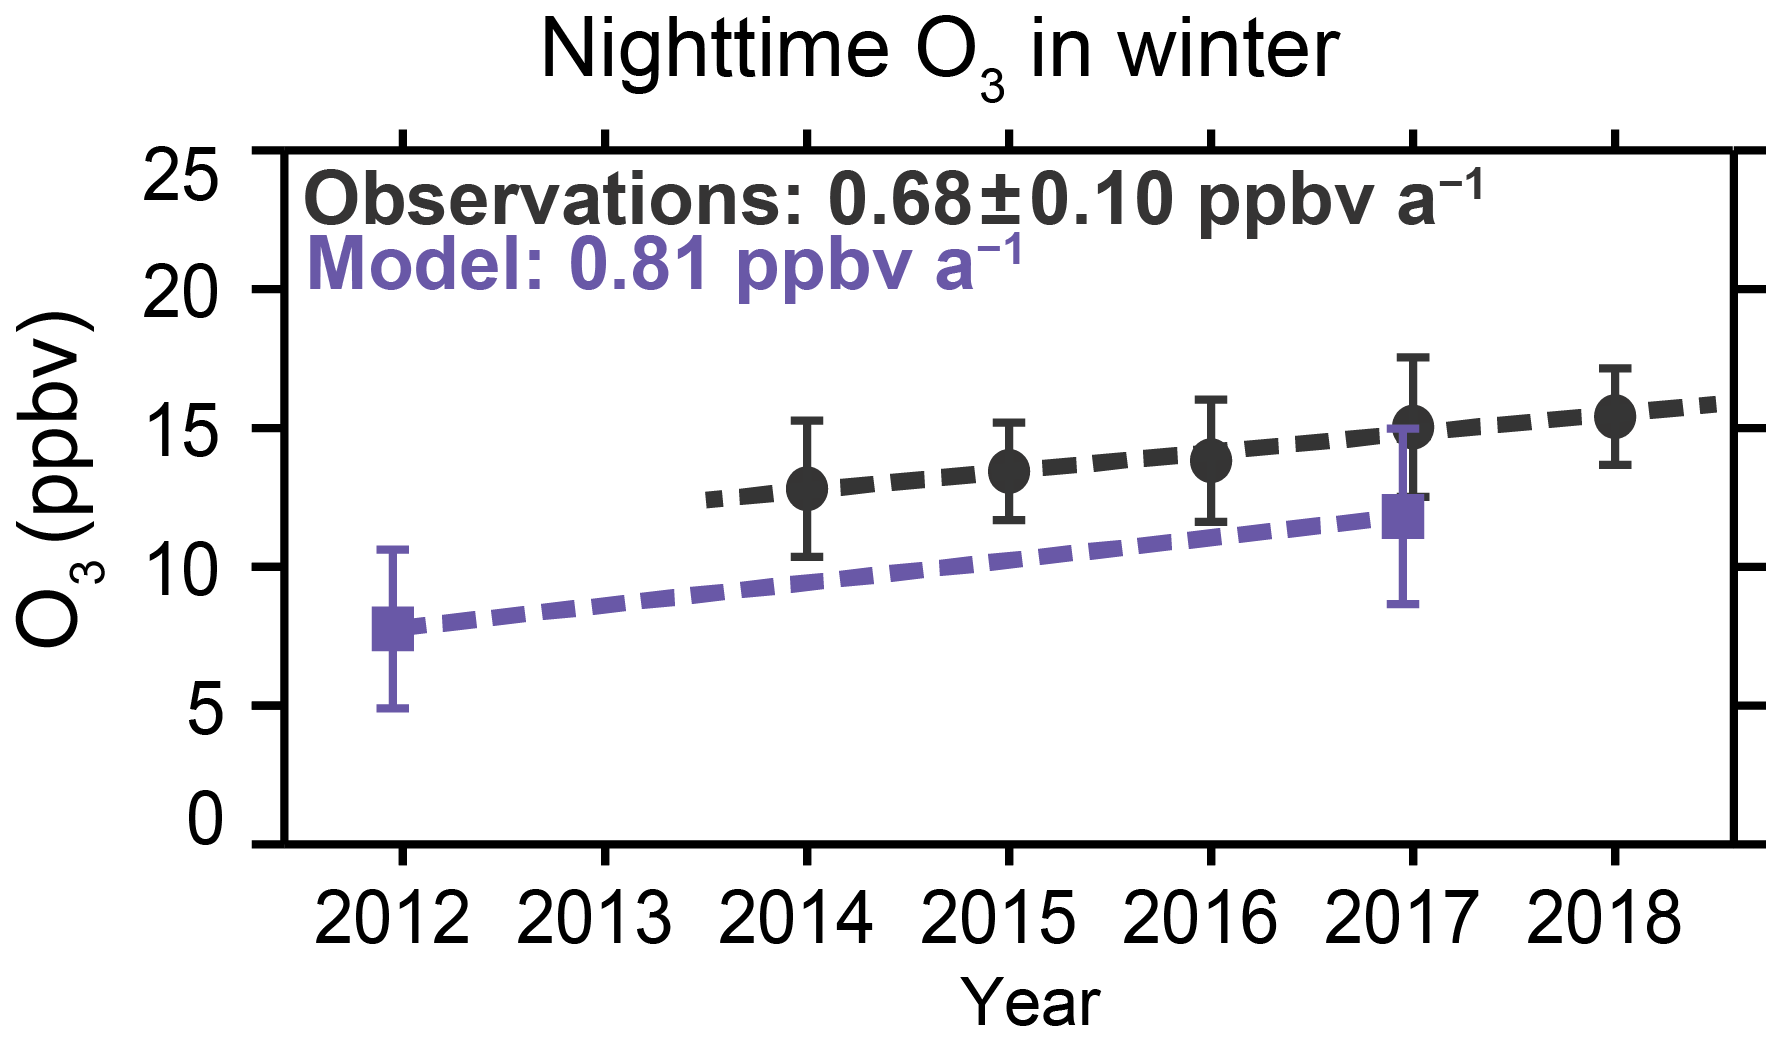
Figure 5Trend in nighttime surface ozone in China in winter. Values are DJF means over 21:00–05:00 local time for the network of sites in central–eastern China operated since 2013 by the China Ministry of Ecology and Environment (MEE). The sites are gridded on the GEOS-Chem grid. The symbols are averages for all grid cells containing sites, and the vertical bars are the standard deviation of the spatial distribution. Model values are similarly sampled and gridded over the ensemble of MEE sites operating since 2013. Trends are from an ordinary least-squares regression.
Figure 4 shows the implications of these changes in seasonal NOx lifetime for the 2012–2017 NO2 column trends simulated by GEOS-Chem. Neither the 24 h mean nor the daytime NOx lifetime changes significantly in summer, and therefore the NO2 columns track the MEIC emission trends, consistent with observations. In winter, the shortening of the NOx lifetime steepens the trends of NO2 columns relative to NOx emissions. Wintertime GEOS-Chem NO2 columns decrease by 35 % between 2011/12 and 2016/17, faster than the 25 % decrease in the MEIC NOx emissions. The NOx lifetime in winter is about 1 d, long enough for faster NOx loss at night to affect NO2 columns in the afternoon when the OMI makes its observations. Comparison to the observed wintertime trend suggests that the GEOS-Chem decrease in NOx lifetime over 2012–2017 may not be steep enough. There is substantial uncertainty in the factors controlling wintertime OH concentrations (Tan et al., 2018; Miao et al., 2018) and these might also affect the model trend. Meteorological variability can also cause interannual changes in wintertime NO2 of ∼ 20 % (Lin and McElroy, 2011), but the effect on longer-term trends will be smaller. GEOS-Chem trends for 2005–2012 should be symmetrical with those for 2012–2017, since NOx emissions in 2005 are similar to those in 2017 (Fig. 4).
The use of satellite-based NO2 column observations to evaluate trends in NOx emission inventories in China can be compared to similar work previously done for the US. Jiang et al. (2018) found that OMI NO2 columns over the US during 2009–2015 decreased slower than NOx emissions in the US Environmental Protection Agency (EPA) National Emissions Inventory (NEI), suggesting that NOx emission controls were not as effective as reported by the NEI. However, Silvern et al. (2019) explained this discrepancy with a large relative contribution of the free tropospheric background to the NO2 column over the US, weakening the relationship between NO2 columns and US anthropogenic NOx emissions. This is not a major concern over central–eastern China, where the contribution of the free troposphere above 2 km to the tropospheric NO2 column as sensed by the OMI is less than 30 %. Laughner and Cohen (2019) find an increase in summer NOx lifetime over 2010–2013 in OMI observations of isolated urban plumes over the US, reflecting NOx-limited conditions in which OH concentrations decrease as NOx decreases. This would dampen the response of NO2 columns to emission reductions. Such an effect is not apparent in central–eastern China, which is prevailingly in the so-called transition regime between NOx-saturated and NOx-limited conditions (Jin and Holloway, 2015; Li et al., 2019).
We examined the seasonality and trends of satellite-derived tropospheric NO2 columns over China and their relation to NOx emissions. Observations from the satellite-based OMI instrument show a factor of 3 increase in tropospheric NO2 columns from summer to winter, and we show that this can be explained by the seasonal variation in NOx lifetime against oxidation. NO2 columns for the 2004–2018 duration of the OMI record peak in 2011 and subsequently decrease, consistent with the Multi-resolution Emission Inventory for China (MEIC). The summer trends in OMI NO2 columns closely match the MEIC emission trends, but the winter trends are steeper than the MEIC. We attribute the steeper winter trends to a decrease in the NOx lifetime, mostly by faster N2O5 hydrolysis in aerosols, as NOx emissions decrease. Lower NOx emissions lead to an increase in nighttime ozone in winter, promoting N2O5 formation. Our analysis of the OMI NO2 column observations thus supports the magnitude and trends of NOx emissions in the MEIC, while emphasizing the need to account for changes in NOx lifetime when interpreting trends in satellite NO2 columns in terms of trends in NOx emissions.
The QA4ECV data are available at https://doi.org/10.21944/qa4ecv-no2-omi-v1.1 (last access: 15 January 2019; Boersma et al., 2019), POMINO v2 at https://www.amazon.com/clouddrive/share/zyC4mNEyRfRk0IX114sR51lWTMpcP1d4SwLVrW55iFG/folder/S7IR7WSLSPikdLT_jsNX8g (last access: 23 January 2019; ACM group, 2019), MEE surface data at http://beijingair.sinaapp.com (last access: 10 March 2019; China National Environmental Monitoring Center, 2019), and MEIC data at http://www.meicmodel.org (last access: 30 June 2018; MEIC team, 2018). To access the MEIC data, contact Qiang Zhang (qiangzhang@tsinghua.edu.cn). GEOS-Chem results are available on request from the corresponding author.
The supplement related to this article is available online at: https://doi.org/10.5194/acp-20-1483-2020-supplement.
VS and DJJ designed the study. VS performed the model simulations and data analysis. KL and SZ processed the ground-based observations. RFS contributed analysis software. ML and JL provided the POMINO data. QZ provided the MEIC data. VS and DJJ wrote the paper with contributions from all coauthors.
The authors declare that they have no conflict of interest.
The development of the POMINO product was funded by the National Natural Science Foundation of China (41775115). We acknowledge the QA4ECV project for the NO2 data.
This research has been supported by the National Aeronautics and Space Administration Earth Science Division (grant no. NNX17AI67G).
This paper was edited by Chul Han Song and reviewed by four anonymous referees.
ACM group: POMINO v2 NO2 Level-2 data, Peking University, available at: https://www.amazon.com/clouddrive/share/zyC4mNEyRfRk0IX114sR51lWTMpcP1d4SwLVrW55iFG/folder/S7IR7WSLSPikdLT_jsNX8g, last access: 23 January 2019.
Bertram, T. H. and Thornton, J. A.: Toward a general parameterization of N2O5 reactivity on aqueous particles: the competing effects of particle liquid water, nitrate and chloride, Atmos. Chem. Phys., 9, 8351–8363, https://doi.org/10.5194/acp-9-8351-2009, 2009.
Boersma, K. F., Eskes, H. J., Richter, A., De Smedt, I., Lorente, A., Beirle, S., van Geffen, J. H. G. M., Zara, M., Peters, E., Van Roozendael, M., Wagner, T., Maasakkers, J. D., van der A, R. J., Nightingale, J., De Rudder, A., Irie, H., Pinardi, G., Lambert, J.-C., and Compernolle, S. C.: Improving algorithms and uncertainty estimates for satellite NO2 retrievals: results from the quality assurance for the essential climate variables (QA4ECV) project, Atmos. Meas. Tech., 11, 6651–6678, https://doi.org/10.5194/amt-11-6651-2018, 2018.
Boersma, K. F., Eskes, H., Richter, A., De Smedt, I., Lorente, A., Beirle, S., Van Geffen, J., Peters, E., Van Roozendael, M., and Wagner, T.: QA4ECV NO2 tropospheric and stratospheric vertical column data from OMI (Version 1.1), Royal Netherlands Meteorological Institute (KNMI), https://doi.org/10.21944/qa4ecv-no2-omi-v1.1, 2019.
Bröske, R., Kleffmann, J., and Wiesen, P.: Heterogeneous conversion of NO2 on secondary organic aerosol surfaces: A possible source of nitrous acid (HONO) in the atmosphere?, Atmos. Chem. Phys., 3, 469–474, https://doi.org/10.5194/acp-3-469-2003, 2003.
Brown, S. S., Dubé, W. P., Karamchandani, P., Yarwood, G., Peischl, J., Ryerson, T. B., Neuman, J. A., Nowak, J. B., Holloway, J. S., Washenfelder, R. A., Brock, C. A., Frost, G. J., Trainer, M., Parrish, D. D., Fehsenfeld, F. C., and Ravishankara, A. R.: Effects of NOx control and plume mixing on nighttime chemical processing of plumes from coal-fired power plants, J. Geophys. Res., 117, D07304, https://doi.org/10.1029/2011JD016954, 2012.
Chen, D., Wang, Y., McElroy, M. B., He, K., Yantosca, R. M., and Le Sager, P.: Regional CO pollution and export in China simulated by the high-resolution nested-grid GEOS-Chem model, Atmos. Chem. Phys., 9, 3825–3839, https://doi.org/10.5194/acp-9-3825-2009, 2009.
China National Environmental Monitoring Center (CNEMC): China National Environmental Monitoring NO2 and ozone data archive, available at: http://beijingair.sinaapp.com, last access: 10 March, 2019.
Cooper, M., Martin, R. V., Padmanabhan, A., and Henze, D. K.: Comparing mass balance and adjoint methods for inverse modeling of nitrogen dioxide columns for global nitrogen oxide emissions, J. Geophys. Res.-Atmos., 122, 4718–4734, https://doi.org/10.1002/2016JD025985, 2017.
Cui, Y., Lin, J., Song, C., Liu, M., Yan, Y., Xu, Y., and Huang, B.: Rapid growth in nitrogen dioxide pollution over Western China, 2005–2013, Atmos. Chem. Phys., 16, 6207–6221, https://doi.org/10.5194/acp-16-6207-2016, 2016.
Dobber, M., Voors, R., Dirksen, R., Kleipool, Q., and Levelt, P.: The High-Resolution Solar Reference Spectrum between 250 and 550 nm and its Application to Measurements with the Ozone Monitoring Instrument, Sol. Phys., 249, 281–291, https://doi.org/10.1007/s11207-008-9187-7, 2008.
Duncan, B. N., Yoshida, Y., de Foy, B., Lamsal, L. N., Streets, D. G., Lu, Z., Pickering, K. E., and Krotkov, N. A.: The observed response of Ozone Monitoring Instrument (OMI) NO2 columns to NOx emission controls on power plants in the United States: 2005–2011, Atmos. Environ., 81, 102–111, https://doi.org/10.1016/j.atmosenv.2013.08.068, 2013.
Duncan, B. N., Lamsal, L. N., Thompson, A. M., Yoshida, Y., Lu, Z., Streets, D. G., Hurwitz, M. M., and Pickering, K. E.: A space-based, high-resolution view of notable changes in urban NOx pollution around the world (2005–2014), J. Geophys. Res.-Atmos., 121, 976–996, https://doi.org/10.1002/2015JD024121, 2016.
Fisher, J. A., Jacob, D. J., Travis, K. R., Kim, P. S., Marais, E. A., Chan Miller, C., Yu, K., Zhu, L., Yantosca, R. M., Sulprizio, M. P., Mao, J., Wennberg, P. O., Crounse, J. D., Teng, A. P., Nguyen, T. B., St. Clair, J. M., Cohen, R. C., Romer, P., Nault, B. A., Wooldridge, P. J., Jimenez, J. L., Campuzano-Jost, P., Day, D. A., Hu, W., Shepson, P. B., Xiong, F., Blake, D. R., Goldstein, A. H., Misztal, P. K., Hanisco, T. F., Wolfe, G. M., Ryerson, T. B., Wisthaler, A., and Mikoviny, T.: Organic nitrate chemistry and its implications for nitrogen budgets in an isoprene- and monoterpene-rich atmosphere: constraints from aircraft (SEAC4RS) and ground-based (SOAS) observations in the Southeast US, Atmos. Chem. Phys., 16, 5969–5991, https://doi.org/10.5194/acp-16-5969-2016, 2016.
Gelaro, R., McCarty, W., Suárez, M. J., Todling, R., Molod, A., Takacs, L., Randles, C. A., Darmenov, A., Bosilovich, M. G., Reichle, R., Wargan, K., Coy, L., Cullather, R., Draper, C., Akella, S., Buchard, V., Conaty, A., da Silva, A. M., Gu, W., Kim, G.-K., Koster, R., Lucchesi, R., Merkova, D., Nielsen, J. E., Partyka, G., Pawson, S., Putman, W., Rienecker, M., Schubert, S. D., Sienkiewicz, M., and Zhao, B.: The Modern-Era Retrospective Analysis for Research and Applications, Version 2 (MERRA-2), J. Climate, 30, 5419–5454, https://doi.org/10.1175/JCLI-D-16-0758.1, 2017.
Georgoulias, A. K., van der A, R. J., Stammes, P., Boersma, K. F., and Eskes, H. J.: Trends and trend reversal detection in 2 decades of tropospheric NO2 satellite observations, Atmos. Chem. Phys., 19, 6269–6294, https://doi.org/10.5194/acp-19-6269-2019, 2019.
Granier, C., Bessagnet, B., Bond, T., D'Angiola, A., Denier van der Gon, H., Frost, G. J., Heil, A., Kaiser, J. W., Kinne, S., Klimont, Z., Kloster, S., Lamarque, J.-F., Liousse, C., Masui, T., Meleux, F., Mieville, A., Ohara, T., Raut, J.-C., Riahi, K., Schultz, M. G., Smith, S. J., Thompson, A., van Aardenne, J., van der Werf, G. R., and van Vuuren, D. P.: Evolution of anthropogenic and biomass burning emissions of air pollutants at global and regional scales during the 1980–2010 period, Clim. Change, 109, 163, https://doi.org/10.1007/s10584-011-0154-1, 2011.
Gu, D., Wang, Y., Smeltzer, C., and Liu, Z.: Reduction in NOx Emission Trends over China: Regional and Seasonal Variations, Environ. Sci. Technol., 47, 12912–12919, https://doi.org/10.1021/es401727e, 2013.
Gu, D., Wang, Y., Yin, R., Zhang, Y., and Smeltzer, C.: Inverse modelling of NOx emissions over eastern China: uncertainties due to chemical non-linearity, Atmos. Meas. Tech., 9, 5193–5201, https://doi.org/10.5194/amt-9-5193-2016, 2016.
Hendrick, F., Müller, J.-F., Clémer, K., Wang, P., De Mazière, M., Fayt, C., Gielen, C., Hermans, C., Ma, J. Z., Pinardi, G., Stavrakou, T., Vlemmix, T., and Van Roozendael, M.: Four years of ground-based MAX-DOAS observations of HONO and NO2 in the Beijing area, Atmos. Chem. Phys., 14, 765–781, https://doi.org/10.5194/acp-14-765-2014, 2014.
Hilboll, A., Richter, A., and Burrows, J. P.: Long-term changes of tropospheric NO2 over megacities derived from multiple satellite instruments, Atmos. Chem. Phys., 13, 4145–4169, https://doi.org/10.5194/acp-13-4145-2013, 2013.
Holmes, C. D., Prather, M. J., and Vinken, G. C. M.: The climate impact of ship NOx emissions: an improved estimate accounting for plume chemistry, Atmos. Chem. Phys., 14, 6801–6812, https://doi.org/10.5194/acp-14-6801-2014, 2014.
Hudman, R. C., Moore, N. E., Mebust, A. K., Martin, R. V., Russell, A. R., Valin, L. C., and Cohen, R. C.: Steps towards a mechanistic model of global soil nitric oxide emissions: implementation and space based-constraints, Atmos. Chem. Phys., 12, 7779–7795, https://doi.org/10.5194/acp-12-7779-2012, 2012.
Jacob, D.: Heterogeneous chemistry and tropospheric ozone, Atmos. Environ., 34, 2131–2159, https://doi.org/10.1016/S1352-2310(99)00462-8, 2000.
Jaeglé, L., Shah, V., Thornton, J. A., Lopez-Hilfiker, F. D., Lee, B. H., McDuffie, E. E., Fibiger, D., Brown, S. S., Veres, P., Sparks, T. L., Ebben, C. J., Wooldridge, P. J., Kenagy, H. S., Cohen, R. C., Weinheimer, A. J., Campos, T. L., Montzka, D. D., Digangi, J. P., Wolfe, G. M., Hanisco, T., Schroder, J. C., Campuzano-Jost, P., Day, D. A., Jimenez, J. L., Sullivan, A. P., Guo, H., and Weber, R. J.: Nitrogen Oxides Emissions, Chemistry, Deposition, and Export Over the Northeast United States During the WINTER Aircraft Campaign, J. Geophys. Res.-Atmos., 123, 12368-12393, https://doi.org/10.1029/2018JD029133, 2018.
Jiang, Z., McDonald, B. C., Worden, H., Worden, J. R., Miyazaki, K., Qu, Z., Henze, D. K., Jones, D. B. A., Arellano, A. F., Fischer, E. V., Zhu, L., and Boersma, K. F.: Unexpected slowdown of US pollutant emission reduction in the past decade, P. Natl. Acad. Sci. USA, 115, 5099–5104, https://doi.org/10.1073/pnas.1801191115, 2018.
Jin, X. and Holloway, T.: Spatial and temporal variability of ozone sensitivity over China observed from the Ozone Monitoring Instrument, J. Geophys. Res.-Atmos., 120, 7229–7246, https://doi.org/10.1002/2015JD023250, 2015.
Karamchandani, P., Vijayaraghavan, K., and Yarwood, G.: Sub-Grid Scale Plume Modeling, Atmosphere, 2, 389–406, https://doi.org/10.3390/atmos2030389, 2011.
Kim, P. S., Jacob, D. J., Fisher, J. A., Travis, K., Yu, K., Zhu, L., Yantosca, R. M., Sulprizio, M. P., Jimenez, J. L., Campuzano-Jost, P., Froyd, K. D., Liao, J., Hair, J. W., Fenn, M. A., Butler, C. F., Wagner, N. L., Gordon, T. D., Welti, A., Wennberg, P. O., Crounse, J. D., St. Clair, J. M., Teng, A. P., Millet, D. B., Schwarz, J. P., Markovic, M. Z., and Perring, A. E.: Sources, seasonality, and trends of southeast US aerosol: an integrated analysis of surface, aircraft, and satellite observations with the GEOS-Chem chemical transport model, Atmos. Chem. Phys., 15, 10411–10433, https://doi.org/10.5194/acp-15-10411-2015, 2015.
Kleffmann, J.: Daytime Sources of Nitrous Acid (HONO) in the Atmospheric Boundary Layer, Chem. Phys. Chem., 8, 1137–1144, https://doi.org/10.1002/cphc.200700016, 2007.
Kleinman, L.: Low and high NOx tropospheric photochemistry, J. Geophys. Res.-Atmos., 99, 16831–16838, https://doi.org/10.1029/94JD01028, 1994.
Krotkov, N. A., McLinden, C. A., Li, C., Lamsal, L. N., Celarier, E. A., Marchenko, S. V., Swartz, W. H., Bucsela, E. J., Joiner, J., Duncan, B. N., Boersma, K. F., Veefkind, J. P., Levelt, P. F., Fioletov, V. E., Dickerson, R. R., He, H., Lu, Z., and Streets, D. G.: Aura OMI observations of regional SO2 and NO2 pollution changes from 2005 to 2015, Atmos. Chem. Phys., 16, 4605–4629, https://doi.org/10.5194/acp-16-4605-2016, 2016.
Lamsal, L. N., Martin, R. V., van Donkelaar, A., Steinbacher, M., Celarier, E. A., Bucsela, E., Dunlea, E. J., and Pinto, J. P.: Ground-level nitrogen dioxide concentrations inferred from the satellite-borne Ozone Monitoring Instrument, J. Geophys. Res.-Atmos., 113, D16308, https://doi.org/10.1029/2007JD009235, 2008.
Lamsal, L. N., Martin, R. V., Padmanabhan, A., van Donkelaar, A., Zhang, Q., Sioris, C. E., Chance, K., Kurosu, T. P., and Newchurch, M. J.: Application of satellite observations for timely updates to global anthropogenic NOx emission inventories, Geophys. Res. Lett., 38, L05810, https://doi.org/10.1029/2010GL046476, 2011.
Laughner, J. L. and Cohen, R. C.: Direct observation of changing NOx lifetime in North American cities, Science, 366, 723–727, https://doi.org/10.1126/science.aax6832, 2019.
Leue, C., Wenig, M., Wagner, T., Klimm, O., Platt, U., and Jähne, B.: Quantitative analysis of NOx emissions from Global Ozone Monitoring Experiment satellite image sequences, J. Geophys. Res.-Atmos., 106, 5493–5505, https://doi.org/10.1029/2000JD900572, 2001.
Levelt, P. F., Oord, G. H. J. van den, Dobber, M. R., Malkki, A., and, Stammes, P., Lundell, J. O. V., and Saari, H.: The ozone monitoring instrument, IEEE T. Geosci. Remote, 44, 1093–1101, https://doi.org/10.1109/TGRS.2006.872333, 2006.
Levelt, P. F., Joiner, J., Tamminen, J., Veefkind, J. P., Bhartia, P. K., Stein Zweers, D. C., Duncan, B. N., Streets, D. G., Eskes, H., van der A, R., McLinden, C., Fioletov, V., Carn, S., de Laat, J., DeLand, M., Marchenko, S., McPeters, R., Ziemke, J., Fu, D., Liu, X., Pickering, K., Apituley, A., González Abad, G., Arola, A., Boersma, F., Chan Miller, C., Chance, K., de Graaf, M., Hakkarainen, J., Hassinen, S., Ialongo, I., Kleipool, Q., Krotkov, N., Li, C., Lamsal, L., Newman, P., Nowlan, C., Suleiman, R., Tilstra, L. G., Torres, O., Wang, H., and Wargan, K.: The Ozone Monitoring Instrument: overview of 14 years in space, Atmos. Chem. Phys., 18, 5699–5745, https://doi.org/10.5194/acp-18-5699-2018, 2018.
Li, K., Jacob, D. J., Liao, H., Shen, L., Zhang, Q., and Bates, K. H.: Anthropogenic drivers of 2013–2017 trends in summer surface ozone in China, P. Natl. Acad. Sci. USA, 116, 422–427, https://doi.org/10.1073/pnas.1812168116, 2019.
Li, M., Liu, H., Geng, G., Hong, C., Liu, F., Song, Y., Tong, D., Zheng, B., Cui, H., Man, H., Zhang, Q., and He, K.: Anthropogenic emission inventories in China: a review, Natl. Sci. Rev., 4, 834–866, https://doi.org/10.1093/nsr/nwx150, 2017a.
Li, M., Zhang, Q., Kurokawa, J.-I., Woo, J.-H., He, K., Lu, Z., Ohara, T., Song, Y., Streets, D. G., Carmichael, G. R., Cheng, Y., Hong, C., Huo, H., Jiang, X., Kang, S., Liu, F., Su, H., and Zheng, B.: MIX: a mosaic Asian anthropogenic emission inventory under the international collaboration framework of the MICS-Asia and HTAP, Atmos. Chem. Phys., 17, 935–963, https://doi.org/10.5194/acp-17-935-2017, 2017b.
Lin, C. Q., Liu, G., Lau, A. K. H., Li, Y., Li, C. C., Fung, J. C. H., and Lao, X. Q.: High-resolution satellite remote sensing of provincial PM2.5 trends in China from 2001 to 2015, Atmos. Environ., 180, 110–116, https://doi.org/10.1016/j.atmosenv.2018.02.045, 2018.
Lin, J., Nielsen, C. P., Zhao, Y., Lei, Y., Liu, Y., and McElroy, M. B.: Recent Changes in Particulate Air Pollution over China Observed from Space and the Ground: Effectiveness of Emission Control, Environ. Sci. Technol., 44, 7771–7776, https://doi.org/10.1021/es101094t, 2010.
Lin, J.-T. and McElroy, M. B.: Impacts of boundary layer mixing on pollutant vertical profiles in the lower troposphere: Implications to satellite remote sensing, Atmos. Environ., 44, 1726–1739, https://doi.org/10.1016/j.atmosenv.2010.02.009, 2010.
Lin, J.-T. and McElroy, M. B.: Detection from space of a reduction in anthropogenic emissions of nitrogen oxides during the Chinese economic downturn, Atmos. Chem. Phys., 11, 8171–8188, https://doi.org/10.5194/acp-11-8171-2011, 2011.
Lin, J.-T., Martin, R. V., Boersma, K. F., Sneep, M., Stammes, P., Spurr, R., Wang, P., Van Roozendael, M., Clémer, K., and Irie, H.: Retrieving tropospheric nitrogen dioxide from the Ozone Monitoring Instrument: effects of aerosols, surface reflectance anisotropy, and vertical profile of nitrogen dioxide, Atmos. Chem. Phys., 14, 1441–1461, https://doi.org/10.5194/acp-14-1441-2014, 2014.
Lin, J.-T., Liu, M.-Y., Xin, J.-Y., Boersma, K. F., Spurr, R., Martin, R., and Zhang, Q.: Influence of aerosols and surface reflectance on satellite NO2 retrieval: seasonal and spatial characteristics and implications for NOx emission constraints, Atmos. Chem. Phys., 15, 11217–11241, https://doi.org/10.5194/acp-15-11217-2015, 2015.
Lin, N., Wang, Y., Zhang, Y., and Yang, K.: A large decline of tropospheric NO2 in China observed from space by SNPP OMPS, Sci. Total Environ, 675, 337–342, https://doi.org/10.1016/j.scitotenv.2019.04.090, 2019.
Liu, F., Zhang, Q., van der A, R. J., Zheng, B., Tong, D., Yan, L., Zheng, Y., and He, K.: Recent reduction in NOx emissions over China: synthesis of satellite observations and emission inventories, Environ. Res. Lett., 11, 114002, https://doi.org/10.1088/1748-9326/11/11/114002, 2016.
Liu, F., Beirle, S., Zhang, Q., van der A, R. J., Zheng, B., Tong, D., and He, K.: NOx emission trends over Chinese cities estimated from OMI observations during 2005 to 2015, Atmos. Chem. Phys., 17, 9261–9275, https://doi.org/10.5194/acp-17-9261-2017, 2017.
Liu, M., Lin, J., Boersma, K. F., Pinardi, G., Wang, Y., Chimot, J., Wagner, T., Xie, P., Eskes, H., Van Roozendael, M., Hendrick, F., Wang, P., Wang, T., Yan, Y., Chen, L., and Ni, R.: Improved aerosol correction for OMI tropospheric NO2 retrieval over East Asia: constraint from CALIOP aerosol vertical profile, Atmos. Meas. Tech., 12, 1–21, https://doi.org/10.5194/amt-12-1-2019, 2019.
Lorente, A., Folkert Boersma, K., Yu, H., Dörner, S., Hilboll, A., Richter, A., Liu, M., Lamsal, L. N., Barkley, M., De Smedt, I., Van Roozendael, M., Wang, Y., Wagner, T., Beirle, S., Lin, J.-T., Krotkov, N., Stammes, P., Wang, P., Eskes, H. J., and Krol, M.: Structural uncertainty in air mass factor calculation for NO2 and HCHO satellite retrievals, Atmos. Meas. Tech., 10, 759–782, https://doi.org/10.5194/amt-10-759-2017, 2017.
Lu, Z. and Streets, D. G.: Increase in NOx Emissions from Indian Thermal Power Plants during 1996–2010: Unit-Based Inventories and Multisatellite Observations, Environ. Sci. Technol., 46, 7463–7470, https://doi.org/10.1021/es300831w, 2012.
Ma, Z., Liu, R., Liu, Y., and Bi, J.: Effects of air pollution control policies on PM2.5 pollution improvement in China from 2005 to 2017: a satellite-based perspective, Atmos. Chem. Phys., 19, 6861–6877, https://doi.org/10.5194/acp-19-6861-2019, 2019.
Manders, A. M. M., Builtjes, P. J. H., Curier, L., Denier van der Gon, H. A. C., Hendriks, C., Jonkers, S., Kranenburg, R., Kuenen, J. J. P., Segers, A. J., Timmermans, R. M. A., Visschedijk, A. J. H., Wichink Kruit, R. J., van Pul, W. A. J., Sauter, F. J., van der Swaluw, E., Swart, D. P. J., Douros, J., Eskes, H., van Meijgaard, E., van Ulft, B., van Velthoven, P., Banzhaf, S., Mues, A. C., Stern, R., Fu, G., Lu, S., Heemink, A., van Velzen, N., and Schaap, M.: Curriculum vitae of the LOTOS–EUROS (v2.0) chemistry transport model, Geosci. Model Dev., 10, 4145–4173, https://doi.org/10.5194/gmd-10-4145-2017, 2017.
Martin, R. V.: Satellite remote sensing of surface air quality, Atmos. Environ., 42, 7823–7843, https://doi.org/10.1016/j.atmosenv.2008.07.018, 2008.
Martin, R. V., Jacob, D. J., Chance, K., Kurosu, T. P., Palmer, P. I., and Evans, M. J.: Global inventory of nitrogen oxide emissions constrained by space-based observations of NO2 columns, J. Geophys. Res.-Atmos., 108, 4537, https://doi.org/10.1029/2003JD003453, 2003.
McDuffie, E. E., Fibiger, D. L., Dubé, W. P., Lopez Hilfiker, F., Lee, B. H., Jaeglé, L., Guo, H., Weber, R. J., Reeves, J. M., Weinheimer, A. J., Schroder, J. C., Campuzano-Jost, P., Jimenez, J. L., Dibb, J. E., Veres, P., Ebben, C., Sparks, T. L., Wooldridge, P. J., Cohen, R. C., Campos, T., Hall, S. R., Ullmann, K., Roberts, J. M., Thornton, J. A., and Brown, S. S.: ClNO2 Yields From Aircraft Measurements During the 2015 WINTER Campaign and Critical Evaluation of the Current Parameterization, J. Geophys. Res.-Atmos., 123, 12994–13015, https://doi.org/10.1029/2018JD029358, 2018a.
McDuffie, E. E., Fibiger, D. L., Dubé, W. P., Lopez-Hilfiker, F., Lee, B. H., Thornton, J. A., Shah, V., Jaeglé, L., Guo, H., Weber, R. J., Michael Reeves, J., Weinheimer, A. J., Schroder, J. C., Campuzano-Jost, P., Jimenez, J. L., Dibb, J. E., Veres, P., Ebben, C., Sparks, T. L., Wooldridge, P. J., Cohen, R. C., Hornbrook, R. S., Apel, E. C., Campos, T., Hall, S. R., Ullmann, K., and Brown, S. S.: Heterogeneous N2O5 Uptake During Winter: Aircraft Measurements During the 2015 WINTER Campaign and Critical Evaluation of Current Parameterizations, J. Geophys. Res.-Atmos., 123, 4345–4372, https://doi.org/10.1002/2018JD028336, 2018b.
MEIC team: Multi-resolution Emissions Inventory for China, Tsinghua University, available at http://www.meicmodel.org, last access: 30 June, 2018.
Menut, L., Bessagnet, B., Khvorostyanov, D., Beekmann, M., Blond, N., Colette, A., Coll, I., Curci, G., Foret, G., Hodzic, A., Mailler, S., Meleux, F., Monge, J.-L., Pison, I., Siour, G., Turquety, S., Valari, M., Vautard, R., and Vivanco, M. G.: CHIMERE 2013: a model for regional atmospheric composition modelling, Geosci. Model Dev., 6, 981–1028, https://doi.org/10.5194/gmd-6-981-2013, 2013.
Miao, R., Chen, Q., Sun, Y. L., and Guo, J. P.: Seasonal Variations of Model Bias in Simulations of Major PM2.5 Chemical Components in China, AGU-CAS Joint Meeting, Xi'an China, 2018.
Murray, L. T., Jacob, D. J., Logan, J. A., Hudman, R. C., and Koshak, W. J.: Optimized regional and interannual variability of lightning in a global chemical transport model constrained by LIS/OTD satellite data, J. Geophys. Res.-Atmos., 117, D20307, https://doi.org/10.1029/2012JD017934, 2012.
Palmer, P. I., Jacob, D. J., Chance, K., Martin, R. V., Spurr, R. J. D., Kurosu, T. P., Bey, I., Yantosca, R., Fiore, A., and Li, Q.: Air mass factor formulation for spectroscopic measurements from satellites: Application to formaldehyde retrievals from the Global Ozone Monitoring Experiment, J. Geophys. Res.-Atmos., 106, 14539–14550, https://doi.org/10.1029/2000JD900772, 2001.
Pye, H. O. T., Liao, H., Wu, S., Mickley, L. J., Jacob, D. J., Henze, D. K., and Seinfeld, J. H.: Effect of changes in climate and emissions on future sulfate-nitrate-ammonium aerosol levels in the United States, J. Geophys. Res., 114, D01205, https://doi.org/10.1029/2008JD010701, 2009.
Richter, A., Burrows, J. P., Nüß, H., Granier, C., and Niemeier, U.: Increase in tropospheric nitrogen dioxide over China observed from space, Nature, 437, 129–132, 2005.
Saikawa, E., Kim, H., Zhong, M., Avramov, A., Zhao, Y., Janssens-Maenhout, G., Kurokawa, J.-I., Klimont, Z., Wagner, F., Naik, V., Horowitz, L. W., and Zhang, Q.: Comparison of emissions inventories of anthropogenic air pollutants and greenhouse gases in China, Atmos. Chem. Phys., 17, 6393–6421, https://doi.org/10.5194/acp-17-6393-2017, 2017.
Schneider, P., Lahoz, W. A., and van der A, R.: Recent satellite-based trends of tropospheric nitrogen dioxide over large urban agglomerations worldwide, Atmos. Chem. Phys., 15, 1205–1220, https://doi.org/10.5194/acp-15-1205-2015, 2015.
Shah, V., Jaeglé, L., Thornton, J. A., Lopez-Hilfiker, F. D., Lee, B. H., Schroder, J. C., Campuzano-Jost, P., Jimenez, J. L., Guo, H., Sullivan, A. P., Weber, R. J., Green, J. R., Fiddler, M. N., Bililign, S., Campos, T. L., Stell, M., Weinheimer, A. J., Montzka, D. D., and Brown, S. S.: Chemical feedbacks weaken the wintertime response of particulate sulfate and nitrate to emissions reductions over the eastern United States, P. Natl. Acad. Sci. USA, 115, 8110–8115, https://doi.org/10.1073/pnas.1803295115, 2018.
Sherwen, T., Schmidt, J. A., Evans, M. J., Carpenter, L. J., Großmann, K., Eastham, S. D., Jacob, D. J., Dix, B., Koenig, T. K., Sinreich, R., Ortega, I., Volkamer, R., Saiz-Lopez, A., Prados-Roman, C., Mahajan, A. S., and Ordóñez, C.: Global impacts of tropospheric halogens (Cl, Br, I) on oxidants and composition in GEOS-Chem, Atmos. Chem. Phys., 16, 12239–12271, https://doi.org/10.5194/acp-16-12239-2016, 2016.
Silvern, R. F., Jacob, D. J., Mickley, L. J., Sulprizio, M. P., Travis, K. R., Marais, E. A., Cohen, R. C., Laughner, J. L., Choi, S., Joiner, J., and Lamsal, L. N.: Using satellite observations of tropospheric NO2 columns to infer long-term trends in US NOx emissions: the importance of accounting for the free tropospheric NO2 background, Atmos. Chem. Phys., 19, 8863–8878, https://doi.org/10.5194/acp-19-8863-2019, 2019.
Spataro, F. and Ianniello, A.: Sources of atmospheric nitrous acid: State of the science, current research needs, and future prospects, J Air Waste Manage., 64, 1232–1250, https://doi.org/10.1080/10962247.2014.952846, 2014.
Spataro, F., Ianniello, A., Esposito, G., Allegrini, I., Zhu, T., and Hu, M.: Occurrence of atmospheric nitrous acid in the urban area of Beijing (China), Sci. Total Environ., 447, 210–224, https://doi.org/10.1016/j.scitotenv.2012.12.065, 2013.
Stavrakou, T., Müller, J.-F., Boersma, K. F., De Smedt, I., and van der A, R. J.: Assessing the distribution and growth rates of NOx emission sources by inverting a 10-year record of NO2 satellite columns, Geophys. Res. Lett., 35, L10801, https://doi.org/10.1029/2008GL033521, 2008.
Stemmler, K., Ndour, M., Elshorbany, Y., Kleffmann, J., D'Anna, B., George, C., Bohn, B., and Ammann, M.: Light induced conversion of nitrogen dioxide into nitrous acid on submicron humic acid aerosol, Atmos. Chem. Phys., 7, 4237–4248, https://doi.org/10.5194/acp-7-4237-2007, 2007.
Stettler, M. E. J., Eastham, S., and Barrett, S. R. H.: Air quality and public health impacts of UK airports. Part I: Emissions, Atmos. Environ., 45, 5415–5424, https://doi.org/10.1016/j.atmosenv.2011.07.012, 2011.
Streets, D. G., Canty, T., Carmichael, G. R., de Foy, B., Dickerson, R. R., Duncan, B. N., Edwards, D. P., Haynes, J. A., Henze, D. K., Houyoux, M. R., Jacob, D. J., Krotkov, N. A., Lamsal, L. N., Liu, Y., Lu, Z., Martin, R. V., Pfister, G. G., Pinder, R. W., Salawitch, R. J., and Wecht, K. J.: Emissions estimation from satellite retrievals: A review of current capability, Atmos. Environ., 77, 1011–1042, https://doi.org/10.1016/j.atmosenv.2013.05.051, 2013.
Sun, W., Shao, M., Granier, C., Liu, Y., Ye, C. S., and Zheng, J. Y.: Long-Term Trends of Anthropogenic SO2, NOx, CO, and NMVOCs Emissions in China, Earth's Future, 6, 1112–1133, https://doi.org/10.1029/2018EF000822, 2018.
Tan, F., Tong, S., Jing, B., Hou, S., Liu, Q., Li, K., Zhang, Y., and Ge, M.: Heterogeneous reactions of NO2 with CaCO3–(NH4)2SO4 mixtures at different relative humidities, Atmos. Chem. Phys., 16, 8081–8093, https://doi.org/10.5194/acp-16-8081-2016, 2016.
Tan, Z., Rohrer, F., Lu, K., Ma, X., Bohn, B., Broch, S., Dong, H., Fuchs, H., Gkatzelis, G. I., Hofzumahaus, A., Holland, F., Li, X., Liu, Y., Liu, Y., Novelli, A., Shao, M., Wang, H., Wu, Y., Zeng, L., Hu, M., Kiendler-Scharr, A., Wahner, A., and Zhang, Y.: Wintertime photochemistry in Beijing: observations of ROx radical concentrations in the North China Plain during the BEST-ONE campaign, Atmos. Chem. Phys., 18, 12391–12411, https://doi.org/10.5194/acp-18-12391-2018, 2018.
Tham, Y. J., Wang, Z., Li, Q., Wang, W., Wang, X., Lu, K., Ma, N., Yan, C., Kecorius, S., Wiedensohler, A., Zhang, Y., and Wang, T.: Heterogeneous N2O5 uptake coefficient and production yield of ClNO2 in polluted northern China: roles of aerosol water content and chemical composition, Atmos. Chem. Phys., 18, 13155–13171, https://doi.org/10.5194/acp-18-13155-2018, 2018.
Travis, K. R., Jacob, D. J., Fisher, J. A., Kim, P. S., Marais, E. A., Zhu, L., Yu, K., Miller, C. C., Yantosca, R. M., Sulprizio, M. P., Thompson, A. M., Wennberg, P. O., Crounse, J. D., St. Clair, J. M., Cohen, R. C., Laughner, J. L., Dibb, J. E., Hall, S. R., Ullmann, K., Wolfe, G. M., Pollack, I. B., Peischl, J., Neuman, J. A., and Zhou, X.: Why do models overestimate surface ozone in the Southeast United States?, Atmos. Chem. Phys., 16, 13561–13577, https://doi.org/10.5194/acp-16-13561-2016, 2016.
Uno, I., He, Y., Ohara, T., Yamaji, K., Kurokawa, J.-I., Katayama, M., Wang, Z., Noguchi, K., Hayashida, S., Richter, A., and Burrows, J. P.: Systematic analysis of interannual and seasonal variations of model-simulated tropospheric NO2 in Asia and comparison with GOME-satellite data, Atmos. Chem. Phys., 7, 1671–1681, https://doi.org/10.5194/acp-7-1671-2007, 2007.
Valin, L. C., Russell, A. R., Hudman, R. C., and Cohen, R. C.: Effects of model resolution on the interpretation of satellite NO2 observations, Atmos. Chem. Phys., 11, 11647–11655, https://doi.org/10.5194/acp-11-11647-2011, 2011.
van der A, R. J., Peters, D. H. M. U., Eskes, H., Boersma, K. F., Van Roozendael, M., De Smedt, I., and Kelder, H. M.: Detection of the trend and seasonal variation in tropospheric NO2 over China, J. Geophys. Res.-Atmos., 111, D12317, https://doi.org/10.1029/2005JD006594, 2006.
van der A, R. J., Eskes, H. J., Boersma, K. F., van Noije, T. P. C., Van Roozendael, M., De Smedt, I., Peters, D. H. M. U., and Meijer, E. W.: Trends, seasonal variability and dominant NOx source derived from a ten year record of NO2 measured from space, J. Geophys. Res.-Atmos., 113, D04302, https://doi.org/10.1029/2007JD009021, 2008.
Vinken, G. C. M., Boersma, K. F., Jacob, D. J., and Meijer, E. W.: Accounting for non-linear chemistry of ship plumes in the GEOS-Chem global chemistry transport model, Atmos. Chem. Phys., 11, 11707–11722, https://doi.org/10.5194/acp-11-11707-2011, 2011.
Wang, C., Wang, T., and Wang, P.: The Spatial–Temporal Variation of Tropospheric NO2 over China during 2005 to 2018, Atmosphere, 10, 444, https://doi.org/10.3390/atmos10080444, 2019.
Wang, J., Zhang, X., Guo, J., Wang, Z., and Zhang, M.: Observation of nitrous acid (HONO) in Beijing, China: Seasonal variation, nocturnal formation and daytime budget, Sci. Total Environ., 587–588, 350–359, https://doi.org/10.1016/j.scitotenv.2017.02.159, 2017.
Wang, S., Zhou, R., Zhao, H., Wang, Z., Chen, L., and Zhou, B.: Long-term observation of atmospheric nitrous acid (HONO) and its implication to local NO2 levels in Shanghai, China, Atmos. Environ., 77, 718–724, https://doi.org/10.1016/j.atmosenv.2013.05.071, 2013.
Wang, Y. X., McElroy, M. B., Jacob, D. J., and Yantosca, R. M.: A nested grid formulation for chemical transport over Asia: Applications to CO: Nested grid CO simulation over Asia, J. Geophys. Res.-Atmos., 109, D22307, https://doi.org/10.1029/2004JD005237, 2004.
Zhai, S., Jacob, D. J., Wang, X., Shen, L., Li, K., Zhang, Y., Gui, K., Zhao, T., and Liao, H.: Fine particulate matter (PM2.5) trends in China, 2013–2018: separating contributions from anthropogenic emissions and meteorology, Atmos. Chem. Phys., 19, 11031–11041, https://doi.org/10.5194/acp-19-11031-2019, 2019.
Zhang, L., Jacob, D. J., Knipping, E. M., Kumar, N., Munger, J. W., Carouge, C. C., van Donkelaar, A., Wang, Y. X., and Chen, D.: Nitrogen deposition to the United States: distribution, sources, and processes, Atmos. Chem. Phys., 12, 4539–4554, https://doi.org/10.5194/acp-12-4539-2012, 2012.
Zhang, Q., Streets, D. G., He, K., Wang, Y., Richter, A., Burrows, J. P., Uno, I., Jang, C. J., Chen, D., Yao, Z. and Lei, Y.: NOx emission trends for China, 1995–2004: The view from the ground and the view from space, J. Geophys. Res.-Atmos., 112, D22306, https://doi.org/10.1029/2007JD008684, 2007.
Zhang, Q., Geng, G., Wang, S., Richter, A., and He, K.: Satellite remote sensing of changes in NOx emissions over China during 1996–2010, Chinese Sci. Bull., 57, 2857–2864, https://doi.org/10.1007/s11434-012-5015-4, 2012.
Zheng, B., Tong, D., Li, M., Liu, F., Hong, C., Geng, G., Li, H., Li, X., Peng, L., Qi, J., Yan, L., Zhang, Y., Zhao, H., Zheng, Y., He, K., and Zhang, Q.: Trends in China's anthropogenic emissions since 2010 as the consequence of clean air actions, Atmos. Chem. Phys., 18, 14095–14111, https://doi.org/10.5194/acp-18-14095-2018, 2018.